Embed Size (px)
Citation preview
Sus tainable Energy Solu t ions
Nuclear Power in Canada:An
Examination of Risks,
Impacts and Sustainability
December 2006
Mark Winfield, PhDAlison Jamison
Rich WongPaulina Czajkowski
AcknowledgementsThe Pembina Institute wishes to thank the EJLB Foundation and the Oak Foundation
for their financial support of this project.
We are grateful to our external reviewers who provided extremely helpful and constructive comments throughout the development of this report.
We are also grateful to the staff of nuclear facilities and regulatory agencies who provided prompt responses to our many, and often very detailed questions.
Design and Layout by Green Living Communications
Cover photos: Rabbit Lake Uranium Mine: MiningWatch Canada; Bruce Nuclear Station: Bruce Power; Elliot Lake landscape: Jamie Kneen, MiningWatch Canada.
Publication Date: December 2006
Authors: Mark Winfield, with contributions by Alison Jamison, Rich Wong, and Paulina Czajkowski
ISBN 0-921719-87-6
About the Pembina Institute The Pembina Institute is an independent, not-for-profit environmental policy research and education
organization specializing in the fields of sustainable energy, community sustainability, climate change and corporate environmental management. Founded in 1985 in Drayton Valley Alberta, the Institute now has
offices in Calgary, Edmonton, Vancouver, Ottawa and Toronto.
For more information on the Institute’s work, please visit our website at www.pembina.org.
3Nuclear Power in Canada: An Examination of Risks, Impacts and Sustainability • The Pembina Institute
About the AuthorsMark Winfield, Ph.D., Director Environmental Governance, The Pembina Institute
Mark Winfield is Director of the Pembina Institute’s Environmental Governance Program. Prior to joining Pembina he was Director of Research with the Canadian Institute for Environmental Law
and Policy. Dr. Winfield holds a Ph.D. in Political Science from the University of Toronto, and has published reports and articles on a wide range of environmental policy issues. He is also associate faculty with the
University of Toronto’s Centre for the Environment.
Alison Jamison, P.Eng., Senior Project Manager, The Pembina InstituteAlison Jamison is a senior project manager with Pembina Corporate Consulting.
Her work involves providing the corporate and government sectors strategic advice and support in developing their sustainable business strategies, including integrating eco-efficiency concepts and tools into
core business practices. Key components of her work include technical support, project management, and facilitating both triple-bottom-line design of capital projects and systems thinking in decision-making. Alison also helps to identify and characterize sustainable business opportunities, including pre-feasibility
studies to assess the viability of potential projects. Alison’s background involves varied experience in process optimization and project management in the oil and gas and chemical sectors.
She has a B.Sc. in Chemical Engineering from the University of Alberta.
Rich Wong, Eco-Efficiency Analyst, The Pembina Institute Rich Wong is an eco-efficiency analyst with the Pembina Institute’s Corporate Consulting Services.
Rich has a B.Sc. in Chemical Engineering from McMaster University and brings four years of industrial process experience as well as modeling and programming experience on a variety of platforms. Rich has
researched different energy supply systems, supported the review of sustainability reporting, helped develop the Pembina Institute’s Life Cycle Value Assessment (LCVA) Clearinghouse, and evaluated the current state of the carbon offsets market in North America. He also has experience managing small- to medium-sized
projects and has experience applying life cycle assessment concepts to conventional power systems.
Paulina Czajkowski, B.A.Sc. Eco-Efficiency Analyst, The Pembina Institute (until December 2005). Paulina Czajkowski is a graduate of the University of Waterloo’s engineering program.
She has a diverse range of work experience spanning the public, private and non-profit NGO sectors, including research of life cycle impacts in the energy sector.

3Nuclear Power in Canada: An Examination of Risks, Impacts and Sustainability • The Pembina Institute
This study examines the environmental impacts of the use of nuclear energy for electricity generation in Canada through each of the four major stages of nuclear energy production: uranium mining and milling; uranium refining, conversion and fuel fabri-cation; nuclear power plant operation; and waste fuel management. It is intended to inform public debate over the future role of nuclear energy in Canada, and to facilitate comparisons of nuclear energy with other potential energy sources.
The study examines waste generation, atmospheric releases, impacts on water quality and water use, and landscape and ecosystem impacts of nuclear energy production. It also examines the occupational and community health impacts of nuclear power and key long-term challenges to its sustainability, includ-ing security and weapons proliferation risks. Specific environmental impacts are examined in the context of CANDU nuclear technology, the only reactor type cur-rently in use in Canada.*
The study findings likely underestimate the over-all impacts of the use of nuclear energy for electricity production in Canada. This is a result of significant gaps in the publicly available information on releases of pollutants and contaminants, as well as on the fate of certain waste streams related to the nuclear indus-try. In addition, the study relies on what are likely conservative estimates in a number of key areas, par-ticularly with respect to the generation of greenhouse gas (GHG) emissions.
Is nuclear power clean?
The study finds that nuclear power, like other non-renewable energy sources, is associated with severe environmental impacts. Each stage of the nuclear energy production process generates large amounts of uniquely difficult-to-manage wastes that will effec-tively require perpetual care, imposing costs and risks arising from current energy consumption onto future generations. The process also has severe impacts on surface water and groundwater water quality via a range of radioactive and hazardous pollutants, and results in releases to the atmosphere of a wide range
of criteria (i.e. smog and acid-rain causing), radioac-tive and hazardous pollutants and greenhouse gases. Effluent from uranium mines and mills was found by Health Canada and Environment Canada to be ‘toxic’ for the purposes of the Canadian Environmental Protection Act in 2004.
What is particularly noteworthy about the radio-active waste streams produced at every stage of the nuclear life cycle are the timeframes over which these materials will need to be managed. Secure contain-ment will be required for not hundreds, but hundreds of thousands of years – timeframes over which it is extremely difficult, if not virtually impossible, to pre-dict outcomes with any level of assurance. There are no approved long-term strategies for the management of these wastes in place. The federally mandated Nuclear Waste Management Organization expects it will take over 300 years to implement its proposed “phased adaptive management” approach to containing waste nuclear fuel. As well, the effectiveness and adequacy of tailings management facilities at mine sites in Canada has been subject to serious question. There is a long history of uranium mine tailings management facility failures in Canada and elsewhere in the world, result-ing in severe surface water and groundwater contami-nation.
Is nuclear power sustainable?
Nuclear energy is no more a renewable energy source than oil or gas. It relies on a finite and non-renew-able fuel supply – uranium. World uranium prices have increased more than sixfold since 2001. Current Canadian uranium reserves are estimated to be suf-ficient for 40 years at current levels of consump-tion (compared to estimated natural gas reserves of
Executive summary
*(Different types of reactors are associated with different impacts and risks. Light-water reactors, employing enriched uranium fuel, for example, are associated with the generation of lower volumes of waste fuel. However, the process of producing enriched uranium fuel for these types of reactors is associated with much higher emissions of greenhouse gases, particularly where gas diffusion based enrichment processes are employed, as well as higher atmospheric releases of uranium and the gen-eration of large volumes of depleted uranium (DU) wastes.)
4 The Pembina Institute • Nuclear Power in Canada: An Examination of Risks, Impacts and Sustainability 5Nuclear Power in Canada: An Examination of Risks, Impacts and Sustainability • The Pembina Institute
approximately 70 years). The exploitation of lower-grade uranium deposits in the future would increase the already substantial emissions (including green-house gas emissions) from uranium mining and mill-ing operations, as well as significantly expanding the enormous amounts of waste rock and tailings gener-ated by uranium mines and mills.
Efforts to increase the available fuel supply through the reprocessing of waste fuel or the use of fast breeder reactors are seen to present serious waste management, technological and weapons proliferation risks. Other suggested fuel sources, such as thorium or extraction of uranium from seawater, face major technological, environmental and economic hurdles.
Is nuclear power greenhouse gas ‘emissions free’?
The study finds that GHG emissions arise at each stage of the nuclear energy cycle, with power plant construction being the most significant source of releases. Further releases of GHGs occur as a result of the operation of equipment in the uranium min-ing process, the milling of uranium ore, mill tailings management activities, and refining and conversion operations. The generation of greenhouse gases from mining and milling operations would increase pro-portionally with the use of lower grade uranium ores, as larger amounts of ore would have to be extracted and processed to produce the same amount of ura-nium concentrate.
The road transportation of uranium between milling, refining and conversion facilities results in additional releases. As with criteria air pollutants, the management of waste nuclear fuel along with other radioactive wastes could involve significant transpor-tation activities, leading to further generation of GHG emissions.
In Canada, total GHG emissions associated with uranium mining, milling, refining, conversion and fuel fabrication are between 240,000 and 366,000 tonnes of CO2 per year. Total emissions associated with the sector, including the emissions associated with power plant construction, are in the range of 468,000 and 594,000 tonnes of CO2 per year, equiva-lent to the emissions of between 134,000 and 170,000 cars per year. Total annual GHG emissions that are primarily associated with domestic power produc-tion are estimated at between 267,000 and 289,000 tonnes of CO2 per year. This total is almost certainly an underestimate, due to a lack of complete informa-
tion. Other recent estimates suggest total GHG emis-sions associated with nuclear power in Canada are in the range of at least 840,000 tonnes per year.
These figures relate to the CANDU-type reactors used in Canada. The process of producing enriched uranium fuel for other types of reactors is associated with much higher emissions of greenhouse gases, par-ticularly where gas diffusion-based enrichment pro-cesses are employed.
Is Nuclear Power Reliable?
The Ontario CANDU reactor fleet has been subject to severe performance and maintenance problems. Over the past decade, some Ontario facilities have had aver-age operating capacities below 40 per cent rather than the expected 85–90 per cent range. Reactors expected to have operational lifetimes in the range of 40 years have turned out to require major refurbishments after approximately 25 years of service. Refurbishment projects themselves have run seriously over budget and behind schedule.
Heavy reliance on coal-fired electricity to backstop under-performing or offline nuclear units has been associated with major increases in releases of green-house gases and other air pollutants. The shutdown of eight reactors between 1995 and 2001under the 1997 Nuclear Asset Optimization Plan led to emis-sions of GHGs from the province’s coal-fired power plants increasing by a factor of 2.3, sulphur dioxide emissions by a factor of 2, and nitrogen oxide emis-sions by a factor of 1.7, significantly exacerbating the severe air quality problems regularly experienced in southern Ontario.
Is it a cost-effective solution?
Nuclear power generating facilities are subject to very high capital costs and long construction times rela-tive to other electricity supply options. In addition, in Ontario there is a history of serious delays and cost overruns on nuclear generating facility projects, accounting for $15 billion of the nearly $20 billion “stranded debt” left by Ontario Hydro.
Nuclear energy also brings with it a unique set of risks, largely arising from the very high costs and lev-els of uncertainty involved in handling, storing and managing waste fuel and other radioactive wastes. Implementation of the Nuclear Waste Management Organization’s proposed strategy for managing waste fuel from existing reactors is estimated to be likely to have a total cost in the range of $24 billion. This
Executive Summary
4 The Pembina Institute • Nuclear Power in Canada: An Examination of Risks, Impacts and Sustainability 5Nuclear Power in Canada: An Examination of Risks, Impacts and Sustainability • The Pembina Institute
would be in addition to the costs for the development and management of facilities for low and intermedi-ate level radioactive waste and for managing waste rock and tailings at uranium mine sites. The costs of decommissioning Ontario’s existing reactors have been estimated at $7.474 billion.
Even with extensive subsidies and financial guar-antees provided by governments, these costs, timelines and risks make it difficult for nuclear power projects to compete for private capital investments against potential investments that will bring much more rapid and secure returns.
Is it safe?
Much has changed in our understanding of radia-tion risks since the construction of Canada’s first commercial reactors in the early 1970s. For example, recent research on the effects of even very low levels of ionizing radiation suggests that no level is safe to health. The International Agency for Research on Cancer (IARC) lists a number of radionuclides as carcinogenic to humans, including isotopes produced in uranium mining and milling, fuel production and nuclear power plant operations.
Yet despite our improved understanding of these risks, Canadian standards and practices appear to have not kept pace with this changing knowledge. It has been suggested, for example, that existing standards in Canada for cancer risks arising from radiological hazards permit much higher levels of acceptable risk than is the case for chemical and other hazards. Cur-rent Canadian standards in some areas are substan-tially weaker than those in place in other comparable jurisdictions. The existing drinking water standard in Ontario for tritium (of which discharges from nuclear power plants are the primary source), for example, of 7,000 Bq/L is significantly weaker than the standards in the United States of 740 Bq/L and in the European Union of 100 Bq/L.
Workers in the mining and refining, conversion and fuel fabrication sub-sectors are also found to be routinely exposed to levels of radiation above those that would be considered acceptable to members of the general public. There is a history of significant occupational health effects, particularly elevated inci-dences of lung cancer, among uranium miners attrib-uted to radon exposure. Increased mortality among uranium miners is also attributed to exposure to silica, solvents, asbestos and radiation.
As well, substantial health risks have been identi-fied in relation to the consumption of certain types of
“country” food, particularly caribou, in the vicinity of uranium mine/mill operations as a result of contami-nation by radionuclides.
While nuclear generating facility operators argue that the levels of public exposure to radiation aris-ing from facility operations are trivial in comparison to other sources, recent studies suggest that health impacts of low-level radiation exposure may be more significant than previously thought, and that chil-dren and infants may be particularly at risk from such exposures.
Nuclear generating facilities are additionally sub-ject to uniquely severe accident and security risks. A serious accident or incident could result in the release of large amounts of radioactive material to the atmosphere, which could be distributed over a large area. By comparison, the impacts of major incidents or accidents at facilities employing other generating technologies would be short term and largely limited to the facility site itself. It has been estimated that the monetized value of the off-site environmental, health and economic impacts of a major accident at the Dar-lington generating facility east of the City of Toronto, for example, would exceed $1 trillion (1991 $Cdn).
Nuclear energy’s shared origins with nuclear weap-ons programs raises the potential for -- and reality of -- links between technologies and materials used for energy production and for nuclear weapons develop-ment. Concerns about these connections have grown in the past few years as a result of nuclear programs in North Korea, Iran, India and Pakistan. Any large-scale expansion of reliance on nuclear energy would carry significant risks of the proliferation of materials and technologies that could be applied to weapons devel-opment. India’s 1974 nuclear bomb test, a project developed in part using Canadian-supplied technol-ogy and uranium, demonstrated this problem clearly.
The big picture
Any life-cycle analysis of an energy source is likely to identify previously unrecognized or un-quantified impacts. However, the range and scale of impacts and risks associated with nuclear power production make it unique among energy sources.
While the greenhouse gas emissions associated with nuclear power are less than those that would be associated with conventional fossil fuel energy use, no other energy source combines the generation of a range of conventional pollutants and waste streams – including heavy metals, smog and acid rain precur-sors, and water contaminants – with the generation
Executive Summary
6 The Pembina Institute • Nuclear Power in Canada: An Examination of Risks, Impacts and Sustainability 7Nuclear Power in Canada: An Examination of Risks, Impacts and Sustainability • The Pembina Institute
of extremely large volumes of radioactive wastes that will require care and management over hundreds of thousands of years. The combination of these envi-ronmental challenges, along with security, accident and weapons proliferation risks that are simply not shared by any other energy source, place nuclear energy in a unique category relative to all other energy supply options. In essence, reliance on nuclear power as a response to climate change would involve trading one problem – greenhouse gas emissions – for which a wide range of other solutions exist, for a series of other complex and difficult problems for which solutions are generally more costly and difficult and for which the outcomes are much less certain.
In this context, proposals for the retention and expansion of the role of nuclear power must be approached with the greatest of caution. Such propos-als must be examined in the full light of their environ-mental, economic and security implications, not only for Canada, but the rest of the world as well. They must also be examined in the context of the full range of available alternatives. Such an examination is likely to conclude that better options are readily available. These options range from making the most efficient use possible of existing energy resources to expanding the role of low-impact renewable energy sources that offer far safer, cheaper, more reliable and more sus-tainable options for meeting society’s energy needs.
Nuclear energy production waste streams – a synopsis
Solid and Liquid WastesUranium mining and milling• An estimated 575,000 tonnes of tailings per year,
of which 90–100,000 tonnes can be attributed to uranium production for domestic energy purpos-es. Uranium mill tailings are acidic or potentially acid generating, and contain a range of long-lived radionuclides, heavy metals and other contami-nants. Tailings generation would increase propor-tionally with the use of lower grade uranium ores, as larger amounts of ore would have to be pro-cessed to produce the same amount of uranium concentrate.
• Up to 18 million tonnes of waste rock, which may also contain radionuclides, heavy metals, and be acid generating. Of this total, up to 2.9 million tonnes can be attributed to uranium mining for domestic energy purposes.
• It is estimated that there are more than 213 mil-lion tonnes of uranium mine tailings in storage facilities in Canada, and 109 million tonnes of waste rock.
Refining and conversion operations• It is estimated that nearly 1,000 tonnes of solid
wastes and 9,000 m3 of liquid wastes are pro-duced per year as a result of uranium refining, conversion and fuel production for domestic energy generation purposes. Information on the precise character and fate of these wastes could not be obtained.
Power Plant operation• Approximately 85,000 waste fuel bundles are
generated by Canadian nuclear reactors each year. As of 2003, 1.7 million bundles were in storage at reactor sites. It is estimated that these wastes will have to be secured for approximately one million years for safety, environmental and security rea-sons.
• Approximately 6,000 cubic metres of lower level radioactive wastes are generated each year in Ontario as a result of power plant operations, maintenance, and refurbishment.
• Power plant maintenance and refurbishment also result in the generation of substantial amounts of additional hazardous wastes, including heavy met-als and asbestos.
• Very large amounts of low-, intermediate- and high-level radioactive wastes will be produced as a result of the eventual decommissioning of refin-ing, conversion and fabrication facilities as well as power plants.
Water• Severe contamination of groundwater with radio-
nuclides, heavy metals, and other contaminants has occurred at tailings management facilities and waste rock storage areas.
• Uranium mining and milling facility surface water discharges have resulted in the contamination of the receiving environment with radionuclides and heavy metals. Effluent from historic and operating uranium mines and mills, particularly uranium discharges, have been determined to be toxic for the purposes of the Canadian Environmental Protection Act.
• Uranium mining operations are associated with the extensive removal of groundwater (in excess of 16 billion litres per year).
Executive Summary
6 The Pembina Institute • Nuclear Power in Canada: An Examination of Risks, Impacts and Sustainability 7Nuclear Power in Canada: An Examination of Risks, Impacts and Sustainability • The Pembina Institute
• Routine and accidental releases of radionuclides to surface waters occur in the course of power plant operations, with tritium oxide and carbon-14 being key radioactive pollutants of concern. Groundwater contamination with tritium has occurred at the Pickering generating facility in Ontario.
• Ontario’s nuclear power plants are found to be the leading source of discharges of hydrazine, an extremely hazardous pollutant, to surface waters in Canada. Nuclear generating facilities have also been sources of discharges of metals (copper, zinc, and chromium) and ammonia to surface waters.
• Nuclear power is a major consumer of water. Uranium mining operations involve extensive dewatering, in the range of at least 16–17 billion litres per year, with the implication of impacts on groundwater and surface water storage and flows.
• Generating facilities require large amounts of cooling water. The Darlington and Pickering facilities in Ontario are alone estimated to use approximately 8.9 trillion litres of water for cool-ing purposes per year — more than 19 times the annual water consumption of the City of Toronto. Adverse thermal impacts of cooling water dis-charges on fish populations in the vicinity of nuclear power plants have been observed.
Air• Atmospheric releases of a range of radionuclides
occur at all stages of nuclear power production. Atmospheric releases of radon gas result from mining and milling operations and from tail-ings management facilities. Windblown dust from mine sites and tailings management facili-ties (TMFs) contains a range of radionuclides. Atmospheric releases (principally uranium) also arise from refining and conversion activities.
• Routine and accidental releases of radiation and radionuclides occur from power plant operations, including tritium oxide, carbon-14, noble gases, iodine-131, radioactive particulate and elemental tritium.
• The incineration of low and intermediate-level radioactive wastes from power plant operations and maintenance in Ontario has resulted in further atmospheric releases of radionuclides, particularly tritium. A wide range of hazardous air pollutants have been released by the Bruce Western Waste Management facility. A new incin-erator installed in 2003, has reduced emissions of hazardous, but not of radiological, pollutants .
• Windblown dust from mine sites and TMFs con-tains a range of heavy metals. In addition, releases of a number of hazardous air pollutants, includ-ing dioxins and furans, hexachlorobenzene, heavy metals (principally lead) ammonia and hydrogen fluoride arise from uranium refining and conver-sion operations.
• Ontario nuclear power plants are the only National Pollutant Release Inventory reported source of releases of hydrazine to the air in Canada.
• Uranium mining and milling operations are found to be significant sources of releases of sul-phur dioxide (SO2), volatile organic compounds (VOCs) and nitrogen oxides (NOx). Releases of NOx, particulate matter (PM) and sulphuric acid arise from refining and conversion activities.
• The road transportation of uranium from mill sites in northern Saskatchewan to the Blind River refinery in Northern Ontario and then on to the Port Hope conversion facility in Southern Ontario produces additional releases of NOx and PM. Further transportation related releases of criteria air pollutants would arise from the long-term management of waste nuclear fuel and other radioactive wastes arising from facility operations, maintenance and decommissioning, particularly if the management strategies for these materials require the movement of wastes from reactor sites to centralized facilities.
Climate• Total greenhouse gas (GHG) emissions associated
with uranium mining, milling, refining, conver-sion and fuel fabrication in Canada are estimated at between 240,000 and 366,000 tonnes of CO2 per year.
• Total emissions associated with the sector, includ-ing the emissions associated with power plant construction, are in the range of 468,000 and 594,000 tonnes of CO2 per year, equivalent to the emissions of between 134,000 and 170,000 cars per year.
• Total annual GHG emissions associated with domestic power production alone are estimated at between 267,000 and 289,000 tonnes of CO2 per year. Other recent estimates suggest total GHG emissions associated with nuclear power in Canada are in the range of at least 840,000 tonnes per year.
Executive Summary

8 The Pembina Institute • Nuclear Power in Canada: An Examination of Risks, Impacts and Sustainability 9Nuclear Power in Canada: An Examination of Risks, Impacts and Sustainability • The Pembina Institute

8 The Pembina Institute • Nuclear Power in Canada: An Examination of Risks, Impacts and Sustainability 9Nuclear Power in Canada: An Examination of Risks, Impacts and Sustainability • The Pembina Institute
Executive summary . . . . . . . . . . . . . . . . . . . . . . . . . . . . . . . . . . . . . . . . . . . . . . . . . . . . . . . . . . . . . . . . . . . . . . . . . . . . . . . . . 3
1. Introduction . . . . . . . . . . . . . . . . . . . . . . . . . . . . . . . . . . . . . . . . . . . . . . . . . . . . . . . . . . . . . . . . . . . . . . . . . . . . . . . . . . 13
1.1. Project Overview and Rationale . . . . . . . . . . . . . . . . . . . . . . . . . . . . . . . . . . . . . . . . . . . . . . . . . . . . . . . . . . . . . . . . . . . . . 13
1.2. Project Methodology . . . . . . . . . . . . . . . . . . . . . . . . . . . . . . . . . . . . . . . . . . . . . . . . . . . . . . . . . . . . . . . . . . . . . . . . . . . . . 15
1.3. Impacts Considered . . . . . . . . . . . . . . . . . . . . . . . . . . . . . . . . . . . . . . . . . . . . . . . . . . . . . . . . . . . . . . . . . . . . . . . . . . . . . . 15
1.3.1. Radioactivity and Radionuclides . . . . . . . . . . . . . . . . . . . . . . . . . . . . . . . . . . . . . . . . . . . . . . . . . . . . . . . . . . . . . . . . 15
1.3.2. Generation of Low-, Intermediate- and High-level Radioactive Wastes . . . . . . . . . . . . . . . . . . . . . . . . . . . . . . . . . . . 17
1.3.3. Generation and Release of Hazardous Contaminants . . . . . . . . . . . . . . . . . . . . . . . . . . . . . . . . . . . . . . . . . . . . . . . . 17
1.3.4. Nutrients . . . . . . . . . . . . . . . . . . . . . . . . . . . . . . . . . . . . . . . . . . . . . . . . . . . . . . . . . . . . . . . . . . . . . . . . . . . . . . . . . . 17
1.3.5. Criteria Air Pollutants . . . . . . . . . . . . . . . . . . . . . . . . . . . . . . . . . . . . . . . . . . . . . . . . . . . . . . . . . . . . . . . . . . . . . . . . . 17
1.3.5.1. Volatile Organic Compounds (VOCs) . . . . . . . . . . . . . . . . . . . . . . . . . . . . . . . . . . . . . . . . . . . . . . . . . . . . . . . . 17
1.3.6. Greenhouse Gases . . . . . . . . . . . . . . . . . . . . . . . . . . . . . . . . . . . . . . . . . . . . . . . . . . . . . . . . . . . . . . . . . . . . . . . . . . . 17
1.3.7. Landscape and Water Impacts . . . . . . . . . . . . . . . . . . . . . . . . . . . . . . . . . . . . . . . . . . . . . . . . . . . . . . . . . . . . . . . . . . 17
1.3.8. Occupational and Community Health . . . . . . . . . . . . . . . . . . . . . . . . . . . . . . . . . . . . . . . . . . . . . . . . . . . . . . . . . . . . 19
1.4. Sustainability Challenges . . . . . . . . . . . . . . . . . . . . . . . . . . . . . . . . . . . . . . . . . . . . . . . . . . . . . . . . . . . . . . . . . . . . . . . . . . 20
2. Phase I: Uranium Mining and Milling . . . . . . . . . . . . . . . . . . . . . . . . . . . . . . . . . . . . . . . . . . . . . . . . . . . . . . . . . . . . . . . . 23
Summary of Key Findings . . . . . . . . . . . . . . . . . . . . . . . . . . . . . . . . . . . . . . . . . . . . . . . . . . . . . . . . . . . . . . . . . . . . . . . . . . . . 23
2.1. Introduction . . . . . . . . . . . . . . . . . . . . . . . . . . . . . . . . . . . . . . . . . . . . . . . . . . . . . . . . . . . . . . . . . . . . . . . . . . . . . . . . . . . . 25
2.2. Uranium and Milling Process: An Overview . . . . . . . . . . . . . . . . . . . . . . . . . . . . . . . . . . . . . . . . . . . . . . . . . . . . . . . . . . . . 26
2.3. Uranium Mining and Milling Impacts . . . . . . . . . . . . . . . . . . . . . . . . . . . . . . . . . . . . . . . . . . . . . . . . . . . . . . . . . . . . . . . . 26
2.3.1. Waste Generation . . . . . . . . . . . . . . . . . . . . . . . . . . . . . . . . . . . . . . . . . . . . . . . . . . . . . . . . . . . . . . . . . . . . . . . . . . . 26
2.3.1.1. Waste Rock . . . . . . . . . . . . . . . . . . . . . . . . . . . . . . . . . . . . . . . . . . . . . . . . . . . . . . . . . . . . . . . . . . . . . . . . . . . . 26
2.3.1.2. Tailings . . . . . . . . . . . . . . . . . . . . . . . . . . . . . . . . . . . . . . . . . . . . . . . . . . . . . . . . . . . . . . . . . . . . . . . . . . . . . . . 28
2.3.2. Atmospheric Releases . . . . . . . . . . . . . . . . . . . . . . . . . . . . . . . . . . . . . . . . . . . . . . . . . . . . . . . . . . . . . . . . . . . . . . . . 29
2.3.2.1. Radionuclides . . . . . . . . . . . . . . . . . . . . . . . . . . . . . . . . . . . . . . . . . . . . . . . . . . . . . . . . . . . . . . . . . . . . . . . . . . 29
2.3.2.2. Hazardous Air Pollutants . . . . . . . . . . . . . . . . . . . . . . . . . . . . . . . . . . . . . . . . . . . . . . . . . . . . . . . . . . . . . . . . . 30
2.3.2.3. Sulphur Dioxide, Nitrogen Oxides and Particulate Matter . . . . . . . . . . . . . . . . . . . . . . . . . . . . . . . . . . . . . . . . 30
2.3.2.4. Greenhouse Gas (GHG) Emissions . . . . . . . . . . . . . . . . . . . . . . . . . . . . . . . . . . . . . . . . . . . . . . . . . . . . . . . . . . 31
2.2.3. Water Impacts . . . . . . . . . . . . . . . . . . . . . . . . . . . . . . . . . . . . . . . . . . . . . . . . . . . . . . . . . . . . . . . . . . . . . . . . . . . . . . 32
2.2.3.1 Groundwater Contamination . . . . . . . . . . . . . . . . . . . . . . . . . . . . . . . . . . . . . . . . . . . . . . . . . . . . . . . . . . . . . . . 32
2.2.3.2. Discharges to Surface Water . . . . . . . . . . . . . . . . . . . . . . . . . . . . . . . . . . . . . . . . . . . . . . . . . . . . . . . . . . . . . . . 33
2.2.3.3. Disruption of surface water and groundwater flows . . . . . . . . . . . . . . . . . . . . . . . . . . . . . . . . . . . . . . . . . . . . . 36
2.3.4 Landscape Impacts . . . . . . . . . . . . . . . . . . . . . . . . . . . . . . . . . . . . . . . . . . . . . . . . . . . . . . . . . . . . . . . . . . . . . . . . . . . 37
2.3.5 Occupational and Community Health Impacts . . . . . . . . . . . . . . . . . . . . . . . . . . . . . . . . . . . . . . . . . . . . . . . . . . . . . 37
2.3.5.1. Occupational Health and Safety . . . . . . . . . . . . . . . . . . . . . . . . . . . . . . . . . . . . . . . . . . . . . . . . . . . . . . . . . . . 37
2.3.5.2. Community Health Impacts . . . . . . . . . . . . . . . . . . . . . . . . . . . . . . . . . . . . . . . . . . . . . . . . . . . . . . . . . . . . . . . 38
2.3.6. Mine Closure and Post Closure Care . . . . . . . . . . . . . . . . . . . . . . . . . . . . . . . . . . . . . . . . . . . . . . . . . . . . . . . . . . . . . 39
2.4. Conclusions . . . . . . . . . . . . . . . . . . . . . . . . . . . . . . . . . . . . . . . . . . . . . . . . . . . . . . . . . . . . . . . . . . . . . . . . . . . . . . . . . . . . 41
3. Phase II: Fuel Processing and Production . . . . . . . . . . . . . . . . . . . . . . . . . . . . . . . . . . . . . . . . . . . . . . . . . . . . . . . . . . . . . . 43
Summary of Findings . . . . . . . . . . . . . . . . . . . . . . . . . . . . . . . . . . . . . . . . . . . . . . . . . . . . . . . . . . . . . . . . . . . . . . . . . . . . . . . 43
3.1. Introduction . . . . . . . . . . . . . . . . . . . . . . . . . . . . . . . . . . . . . . . . . . . . . . . . . . . . . . . . . . . . . . . . . . . . . . . . . . . . . . . . . . . . 45
3.2. Fuel Processing and Production Overview . . . . . . . . . . . . . . . . . . . . . . . . . . . . . . . . . . . . . . . . . . . . . . . . . . . . . . . . . . . . . 45
3.3. Refining, Conversion and Fabrication Facility Impacts . . . . . . . . . . . . . . . . . . . . . . . . . . . . . . . . . . . . . . . . . . . . . . . . . . . 45
3.3.1. Waste Generation . . . . . . . . . . . . . . . . . . . . . . . . . . . . . . . . . . . . . . . . . . . . . . . . . . . . . . . . . . . . . . . . . . . . . . . . . . . 46
3.3.2. Atmospheric Releases . . . . . . . . . . . . . . . . . . . . . . . . . . . . . . . . . . . . . . . . . . . . . . . . . . . . . . . . . . . . . . . . . . . . . . . . 47
Contents
10 The Pembina Institute • Nuclear Power in Canada: An Examination of Risks, Impacts and Sustainability 11Nuclear Power in Canada: An Examination of Risks, Impacts and Sustainability • The Pembina Institute
3.3.2.1. Radionuclides . . . . . . . . . . . . . . . . . . . . . . . . . . . . . . . . . . . . . . . . . . . . . . . . . . . . . . . . . . . . . . . . . . . . . . . . . . 47
3.3.2.2. Hazardous Air Pollutants . . . . . . . . . . . . . . . . . . . . . . . . . . . . . . . . . . . . . . . . . . . . . . . . . . . . . . . . . . . . . . . . . 48
3.3.2.2.1. Persistent Organic Pollutants . . . . . . . . . . . . . . . . . . . . . . . . . . . . . . . . . . . . . . . . . . . . . . . . . . . . . . . . . . 48
3.3.2.2.2. Heavy Metals . . . . . . . . . . . . . . . . . . . . . . . . . . . . . . . . . . . . . . . . . . . . . . . . . . . . . . . . . . . . . . . . . . . . . . 48
3.3.2.2.3. Ammonia . . . . . . . . . . . . . . . . . . . . . . . . . . . . . . . . . . . . . . . . . . . . . . . . . . . . . . . . . . . . . . . . . . . . . . . . 49
3.3.2.2.4. Hydrogen Chloride and Hydrogen Fluoride . . . . . . . . . . . . . . . . . . . . . . . . . . . . . . . . . . . . . . . . . . . . . . . 49
3.3.3.3. Criteria Air Contaminants . . . . . . . . . . . . . . . . . . . . . . . . . . . . . . . . . . . . . . . . . . . . . . . . . . . . . . . . . . . . . . . . . 49
3.3.3.3.1. Nitrogen Oxides (NOx) . . . . . . . . . . . . . . . . . . . . . . . . . . . . . . . . . . . . . . . . . . . . . . . . . . . . . . . . . . . . . . . 49
3.3.3.3.2. Particulate Matter (PM) . . . . . . . . . . . . . . . . . . . . . . . . . . . . . . . . . . . . . . . . . . . . . . . . . . . . . . . . . . . . . . 50
3.3.3.3.3. Sulphuric Acid . . . . . . . . . . . . . . . . . . . . . . . . . . . . . . . . . . . . . . . . . . . . . . . . . . . . . . . . . . . . . . . . . . . . . 50
3.3.2.4. Greenhouse Gases . . . . . . . . . . . . . . . . . . . . . . . . . . . . . . . . . . . . . . . . . . . . . . . . . . . . . . . . . . . . . . . . . . . . . . . 50
3.3.2.6. Transportation-related Releases . . . . . . . . . . . . . . . . . . . . . . . . . . . . . . . . . . . . . . . . . . . . . . . . . . . . . . . . . . . . 50
3.3.3. Releases to Water . . . . . . . . . . . . . . . . . . . . . . . . . . . . . . . . . . . . . . . . . . . . . . . . . . . . . . . . . . . . . . . . . . . . . . . . . . . 51
3.3.3.1. Uranium Discharges . . . . . . . . . . . . . . . . . . . . . . . . . . . . . . . . . . . . . . . . . . . . . . . . . . . . . . . . . . . . . . . . . . . . . 51
3.3.3.2 Ammonia . . . . . . . . . . . . . . . . . . . . . . . . . . . . . . . . . . . . . . . . . . . . . . . . . . . . . . . . . . . . . . . . . . . . . . . . . . . . . . 51
3.3.3.3. Nitrate Ions . . . . . . . . . . . . . . . . . . . . . . . . . . . . . . . . . . . . . . . . . . . . . . . . . . . . . . . . . . . . . . . . . . . . . . . . . . . 51
3.3.3.4. Phosphorus . . . . . . . . . . . . . . . . . . . . . . . . . . . . . . . . . . . . . . . . . . . . . . . . . . . . . . . . . . . . . . . . . . . . . . . . . . . . 52
3.3.4. Landscape Impacts . . . . . . . . . . . . . . . . . . . . . . . . . . . . . . . . . . . . . . . . . . . . . . . . . . . . . . . . . . . . . . . . . . . . . . . . . . 52
3.3.5. Occupational and Community Health . . . . . . . . . . . . . . . . . . . . . . . . . . . . . . . . . . . . . . . . . . . . . . . . . . . . . . . . . . . . 52
3.3.5.1. Occupational Health . . . . . . . . . . . . . . . . . . . . . . . . . . . . . . . . . . . . . . . . . . . . . . . . . . . . . . . . . . . . . . . . . . . . 52
3.3.5.1.1. Radiation Exposure . . . . . . . . . . . . . . . . . . . . . . . . . . . . . . . . . . . . . . . . . . . . . . . . . . . . . . . . . . . . . . . . . . 52
3.3.5.1.2. Workplace Safety . . . . . . . . . . . . . . . . . . . . . . . . . . . . . . . . . . . . . . . . . . . . . . . . . . . . . . . . . . . . . . . . . . . 52
3.3.5.2. Community Health Impacts . . . . . . . . . . . . . . . . . . . . . . . . . . . . . . . . . . . . . . . . . . . . . . . . . . . . . . . . . . . . . . . 54
3.3.5.2.1. Radiation Doses . . . . . . . . . . . . . . . . . . . . . . . . . . . . . . . . . . . . . . . . . . . . . . . . . . . . . . . . . . . . . . . . . . . . 54
3.3.6 Facility Decommissioning . . . . . . . . . . . . . . . . . . . . . . . . . . . . . . . . . . . . . . . . . . . . . . . . . . . . . . . . . . . . . . . . . . . . . . 56
3.4. Conclusions . . . . . . . . . . . . . . . . . . . . . . . . . . . . . . . . . . . . . . . . . . . . . . . . . . . . . . . . . . . . . . . . . . . . . . . . . . . . . . . . . . . . 56
4. Phase III: Power Plant Operation . . . . . . . . . . . . . . . . . . . . . . . . . . . . . . . . . . . . . . . . . . . . . . . . . . . . . . . . . . . . . . . . . . . . 59
Summary of Findings . . . . . . . . . . . . . . . . . . . . . . . . . . . . . . . . . . . . . . . . . . . . . . . . . . . . . . . . . . . . . . . . . . . . . . . . . . . . . . . 59
4.1. Introduction . . . . . . . . . . . . . . . . . . . . . . . . . . . . . . . . . . . . . . . . . . . . . . . . . . . . . . . . . . . . . . . . . . . . . . . . . . . . . . . . . . . . 61
4.2. Overview of CANDU Nuclear Power Plant Operation . . . . . . . . . . . . . . . . . . . . . . . . . . . . . . . . . . . . . . . . . . . . . . . . . . . . 61
4.3. Impacts of CANDU facility operation . . . . . . . . . . . . . . . . . . . . . . . . . . . . . . . . . . . . . . . . . . . . . . . . . . . . . . . . . . . . . . . . . 61
4.3.1. Waste Generation . . . . . . . . . . . . . . . . . . . . . . . . . . . . . . . . . . . . . . . . . . . . . . . . . . . . . . . . . . . . . . . . . . . . . . . . . . . 62
4.3.1.1. Nuclear Fuel Waste . . . . . . . . . . . . . . . . . . . . . . . . . . . . . . . . . . . . . . . . . . . . . . . . . . . . . . . . . . . . . . . . . . . . . . 62
4.3.1.2. Low-level and Medium-level Radioactive Wastes . . . . . . . . . . . . . . . . . . . . . . . . . . . . . . . . . . . . . . . . . . . . . . . 62
4.3.1.3. Other Wastes . . . . . . . . . . . . . . . . . . . . . . . . . . . . . . . . . . . . . . . . . . . . . . . . . . . . . . . . . . . . . . . . . . . . . . . . . . . 63
4.3.1.3.1. Metals . . . . . . . . . . . . . . . . . . . . . . . . . . . . . . . . . . . . . . . . . . . . . . . . . . . . . . . . . . . . . . . . . . . . . . . . . . . . 63
4.3.1.3.2. Hazardous Wastes . . . . . . . . . . . . . . . . . . . . . . . . . . . . . . . . . . . . . . . . . . . . . . . . . . . . . . . . . . . . . . . . . . 65
4.3.2. Atmospheric Releases . . . . . . . . . . . . . . . . . . . . . . . . . . . . . . . . . . . . . . . . . . . . . . . . . . . . . . . . . . . . . . . . . . . . . . . . 66
4.3.2.1. Radionuclides . . . . . . . . . . . . . . . . . . . . . . . . . . . . . . . . . . . . . . . . . . . . . . . . . . . . . . . . . . . . . . . . . . . . . . . . . . 66
4.3.2.2. Heavy Metals . . . . . . . . . . . . . . . . . . . . . . . . . . . . . . . . . . . . . . . . . . . . . . . . . . . . . . . . . . . . . . . . . . . . . . . . . . . 69
4.3.2.3. Criteria Air Contaminants . . . . . . . . . . . . . . . . . . . . . . . . . . . . . . . . . . . . . . . . . . . . . . . . . . . . . . . . . . . . . . . . . 69
4.3.2.4. Ammonia and Hydrazine . . . . . . . . . . . . . . . . . . . . . . . . . . . . . . . . . . . . . . . . . . . . . . . . . . . . . . . . . . . . . . . . . 69
4.3.3. Water Impacts . . . . . . . . . . . . . . . . . . . . . . . . . . . . . . . . . . . . . . . . . . . . . . . . . . . . . . . . . . . . . . . . . . . . . . . . . . . . . . 70
4.3.3.1. Radioactive Releases of radioactive contaminants to water . . . . . . . . . . . . . . . . . . . . . . . . . . . . . . . . . . . . . . . 70
4.3.3.1.1. Releases to Surface Waters . . . . . . . . . . . . . . . . . . . . . . . . . . . . . . . . . . . . . . . . . . . . . . . . . . . . . . . . . . . . 70
4.3.3.1.2. Groundwater Contamination . . . . . . . . . . . . . . . . . . . . . . . . . . . . . . . . . . . . . . . . . . . . . . . . . . . . . . . . . . 71
4.3.3.1.3. Accidental Releases . . . . . . . . . . . . . . . . . . . . . . . . . . . . . . . . . . . . . . . . . . . . . . . . . . . . . . . . . . . . . . . . . . 71
4.3.3.2. Metals Discharges . . . . . . . . . . . . . . . . . . . . . . . . . . . . . . . . . . . . . . . . . . . . . . . . . . . . . . . . . . . . . . . . . . . . . . 72
4.3.3.3. Ammonia and Hydrazine Discharges . . . . . . . . . . . . . . . . . . . . . . . . . . . . . . . . . . . . . . . . . . . . . . . . . . . . . . . . 72
Contents
10 The Pembina Institute • Nuclear Power in Canada: An Examination of Risks, Impacts and Sustainability 11Nuclear Power in Canada: An Examination of Risks, Impacts and Sustainability • The Pembina Institute
Contents
4.3.3.4. Water use and thermal impacts . . . . . . . . . . . . . . . . . . . . . . . . . . . . . . . . . . . . . . . . . . . . . . . . . . . . . . . . . . . . 73
4.3.4. Landscape Impacts . . . . . . . . . . . . . . . . . . . . . . . . . . . . . . . . . . . . . . . . . . . . . . . . . . . . . . . . . . . . . . . . . . . . . . . . . . 73
4.3.5 Heavy Water Production and Use . . . . . . . . . . . . . . . . . . . . . . . . . . . . . . . . . . . . . . . . . . . . . . . . . . . . . . . . . . . . . . . . 73
4.3.6. Occupational and Community Health . . . . . . . . . . . . . . . . . . . . . . . . . . . . . . . . . . . . . . . . . . . . . . . . . . . . . . . . . . . 74
4.3.6.1. Occupational Health Impacts . . . . . . . . . . . . . . . . . . . . . . . . . . . . . . . . . . . . . . . . . . . . . . . . . . . . . . . . . . . . . . 74
4.3.6.1.1. Radiation Exposure . . . . . . . . . . . . . . . . . . . . . . . . . . . . . . . . . . . . . . . . . . . . . . . . . . . . . . . . . . . . . . . . . . 74
4.3.6.1.2. Workplace Safety . . . . . . . . . . . . . . . . . . . . . . . . . . . . . . . . . . . . . . . . . . . . . . . . . . . . . . . . . . . . . . . . . . . 74
4.3.6.2. Community Health Impacts . . . . . . . . . . . . . . . . . . . . . . . . . . . . . . . . . . . . . . . . . . . . . . . . . . . . . . . . . . . . . . . 74
4.3.6.2.1. Radiation . . . . . . . . . . . . . . . . . . . . . . . . . . . . . . . . . . . . . . . . . . . . . . . . . . . . . . . . . . . . . . . . . . . . . . . . . 74
4.3.7. Facility Decommissioning . . . . . . . . . . . . . . . . . . . . . . . . . . . . . . . . . . . . . . . . . . . . . . . . . . . . . . . . . . . . . . . . . . . . . 75
4.4. Facility Performance . . . . . . . . . . . . . . . . . . . . . . . . . . . . . . . . . . . . . . . . . . . . . . . . . . . . . . . . . . . . . . . . . . . . . . . . . . . . . . 75
4.5. Accidents, Catastrophic Failures and Liability . . . . . . . . . . . . . . . . . . . . . . . . . . . . . . . . . . . . . . . . . . . . . . . . . . . . . . . . . . 75
4.5.1. Accidents . . . . . . . . . . . . . . . . . . . . . . . . . . . . . . . . . . . . . . . . . . . . . . . . . . . . . . . . . . . . . . . . . . . . . . . . . . . . . . . . . . 75
4.5.2. Catastrophic Failures . . . . . . . . . . . . . . . . . . . . . . . . . . . . . . . . . . . . . . . . . . . . . . . . . . . . . . . . . . . . . . . . . . . . . . . . . 77
4.5.3. Accident Liability . . . . . . . . . . . . . . . . . . . . . . . . . . . . . . . . . . . . . . . . . . . . . . . . . . . . . . . . . . . . . . . . . . . . . . . . . . . . 77
4.6. Conclusions . . . . . . . . . . . . . . . . . . . . . . . . . . . . . . . . . . . . . . . . . . . . . . . . . . . . . . . . . . . . . . . . . . . . . . . . . . . . . . . . . . . . 78
5. Phase IV: Waste Fuel Management . . . . . . . . . . . . . . . . . . . . . . . . . . . . . . . . . . . . . . . . . . . . . . . . . . . . . . . . . . . . . . . . . . 79
Summary of Findings . . . . . . . . . . . . . . . . . . . . . . . . . . . . . . . . . . . . . . . . . . . . . . . . . . . . . . . . . . . . . . . . . . . . . . . . . . . . . . . 79
5.1. Introduction . . . . . . . . . . . . . . . . . . . . . . . . . . . . . . . . . . . . . . . . . . . . . . . . . . . . . . . . . . . . . . . . . . . . . . . . . . . . . . . . . . . . 81
5.2. What is Waste Nuclear Fuel? . . . . . . . . . . . . . . . . . . . . . . . . . . . . . . . . . . . . . . . . . . . . . . . . . . . . . . . . . . . . . . . . . . . . . . . 81
5.3. Current Management Practices . . . . . . . . . . . . . . . . . . . . . . . . . . . . . . . . . . . . . . . . . . . . . . . . . . . . . . . . . . . . . . . . . . . . . 83
5.4. Waste Fuel Management Initiatives . . . . . . . . . . . . . . . . . . . . . . . . . . . . . . . . . . . . . . . . . . . . . . . . . . . . . . . . . . . . . . . . . . 83
5.5. Impacts of Waste Fuel Management . . . . . . . . . . . . . . . . . . . . . . . . . . . . . . . . . . . . . . . . . . . . . . . . . . . . . . . . . . . . . . . . . 85
5.5.1. Waste Generation . . . . . . . . . . . . . . . . . . . . . . . . . . . . . . . . . . . . . . . . . . . . . . . . . . . . . . . . . . . . . . . . . . . . . . . . . . . 86
5.5.2. Atmospheric Impacts . . . . . . . . . . . . . . . . . . . . . . . . . . . . . . . . . . . . . . . . . . . . . . . . . . . . . . . . . . . . . . . . . . . . . . . . . 86
5.5.2.1. GHG, PM, and NOx Emissions . . . . . . . . . . . . . . . . . . . . . . . . . . . . . . . . . . . . . . . . . . . . . . . . . . . . . . . . . . 87
5.5.3. Water Impacts . . . . . . . . . . . . . . . . . . . . . . . . . . . . . . . . . . . . . . . . . . . . . . . . . . . . . . . . . . . . . . . . . . . . . . . . . . . . . . 87
5.5.4. Landscape Impacts . . . . . . . . . . . . . . . . . . . . . . . . . . . . . . . . . . . . . . . . . . . . . . . . . . . . . . . . . . . . . . . . . . . . . . . . . . 87
5.5.5. Occupational and Community Health Impacts . . . . . . . . . . . . . . . . . . . . . . . . . . . . . . . . . . . . . . . . . . . . . . . . . . . . 88
5.5.5.1. Occupational Health . . . . . . . . . . . . . . . . . . . . . . . . . . . . . . . . . . . . . . . . . . . . . . . . . . . . . . . . . . . . . . . . . 88
5.5.5.2. Accident Risks . . . . . . . . . . . . . . . . . . . . . . . . . . . . . . . . . . . . . . . . . . . . . . . . . . . . . . . . . . . . . . . . . . . . . . 88
5.6. Proliferation and Security Issues . . . . . . . . . . . . . . . . . . . . . . . . . . . . . . . . . . . . . . . . . . . . . . . . . . . . . . . . . . . . . . . . . . . . 88
5.7. Costs and Liabilities . . . . . . . . . . . . . . . . . . . . . . . . . . . . . . . . . . . . . . . . . . . . . . . . . . . . . . . . . . . . . . . . . . . . . . . . . . . . . . 89
5.8. Conclusions . . . . . . . . . . . . . . . . . . . . . . . . . . . . . . . . . . . . . . . . . . . . . . . . . . . . . . . . . . . . . . . . . . . . . . . . . . . . . . . . . . . . 90
6. Sustainability Challenges . . . . . . . . . . . . . . . . . . . . . . . . . . . . . . . . . . . . . . . . . . . . . . . . . . . . . . . . . . . . . . . . . . . . . . . . . . 91
Summary of Findings . . . . . . . . . . . . . . . . . . . . . . . . . . . . . . . . . . . . . . . . . . . . . . . . . . . . . . . . . . . . . . . . . . . . . . . . . . . . . . . 91
6.1. Introduction . . . . . . . . . . . . . . . . . . . . . . . . . . . . . . . . . . . . . . . . . . . . . . . . . . . . . . . . . . . . . . . . . . . . . . . . . . . . . . . . . . . . 93
6.2. Generating Facility Costs . . . . . . . . . . . . . . . . . . . . . . . . . . . . . . . . . . . . . . . . . . . . . . . . . . . . . . . . . . . . . . . . . . . . . . . . . . 93
6.2.1. Facility Construction . . . . . . . . . . . . . . . . . . . . . . . . . . . . . . . . . . . . . . . . . . . . . . . . . . . . . . . . . . . . . . . . . . . . . . . . . 93
6.3. Facility Performance and Maintenance . . . . . . . . . . . . . . . . . . . . . . . . . . . . . . . . . . . . . . . . . . . . . . . . . . . . . . . . . . . . . . . . 94
6.4. Fuel Supply and Costs . . . . . . . . . . . . . . . . . . . . . . . . . . . . . . . . . . . . . . . . . . . . . . . . . . . . . . . . . . . . . . . . . . . . . . . . . . . . 96
6.4.1. Uranium Costs . . . . . . . . . . . . . . . . . . . . . . . . . . . . . . . . . . . . . . . . . . . . . . . . . . . . . . . . . . . . . . . . . . . . . . . . . . . . . 96
6.4.2. Uranium Supply . . . . . . . . . . . . . . . . . . . . . . . . . . . . . . . . . . . . . . . . . . . . . . . . . . . . . . . . . . . . . . . . . . . . . . . . . . . . 97
6.5 Weapons Proliferation Risks . . . . . . . . . . . . . . . . . . . . . . . . . . . . . . . . . . . . . . . . . . . . . . . . . . . . . . . . . . . . . . . . . . . . . . . . 98
6.6. Unique Security Risks . . . . . . . . . . . . . . . . . . . . . . . . . . . . . . . . . . . . . . . . . . . . . . . . . . . . . . . . . . . . . . . . . . . . . . . . . . . . . 99
6.7. Conclusions . . . . . . . . . . . . . . . . . . . . . . . . . . . . . . . . . . . . . . . . . . . . . . . . . . . . . . . . . . . . . . . . . . . . . . . . . . . . . . . . . . . . 99
7. Summary and Conclusions . . . . . . . . . . . . . . . . . . . . . . . . . . . . . . . . . . . . . . . . . . . . . . . . . . . . . . . . . . . . . . . . . . . . . . . 103
7.1. Introduction . . . . . . . . . . . . . . . . . . . . . . . . . . . . . . . . . . . . . . . . . . . . . . . . . . . . . . . . . . . . . . . . . . . . . . . . . . . . . . . . . . . 103
7.2. Overview of Impacts . . . . . . . . . . . . . . . . . . . . . . . . . . . . . . . . . . . . . . . . . . . . . . . . . . . . . . . . . . . . . . . . . . . . . . . . . . . . . 103
12 The Pembina Institute • Nuclear Power in Canada: An Examination of Risks, Impacts and Sustainability 13Nuclear Power in Canada: An Examination of Risks, Impacts and Sustainability • The Pembina Institute
7.2.1. Waste Generation . . . . . . . . . . . . . . . . . . . . . . . . . . . . . . . . . . . . . . . . . . . . . . . . . . . . . . . . . . . . . . . . . . . . . . . . . . 103
7.2.2. Water Impacts . . . . . . . . . . . . . . . . . . . . . . . . . . . . . . . . . . . . . . . . . . . . . . . . . . . . . . . . . . . . . . . . . . . . . . . . . . . . . 107
7.2.2.1. Water Quality Impacts . . . . . . . . . . . . . . . . . . . . . . . . . . . . . . . . . . . . . . . . . . . . . . . . . . . . . . . . . . . . . . . . . . . 107
7.2.2.2. Water use . . . . . . . . . . . . . . . . . . . . . . . . . . . . . . . . . . . . . . . . . . . . . . . . . . . . . . . . . . . . . . . . . . . . . . . . . . . 108
7.2.3. Atmospheric Impacts . . . . . . . . . . . . . . . . . . . . . . . . . . . . . . . . . . . . . . . . . . . . . . . . . . . . . . . . . . . . . . . . . . . . . . . . 108
7.2.3.1. Radionuclides . . . . . . . . . . . . . . . . . . . . . . . . . . . . . . . . . . . . . . . . . . . . . . . . . . . . . . . . . . . . . . . . . . . . . . . . . 108
7.2.3.2. Hazardous air pollutants. . . . . . . . . . . . . . . . . . . . . . . . . . . . . . . . . . . . . . . . . . . . . . . . . . . . . . . . . . . . . . . . . 108
7.2.3.3. Criteria air pollutants . . . . . . . . . . . . . . . . . . . . . . . . . . . . . . . . . . . . . . . . . . . . . . . . . . . . . . . . . . . . . . . . . . . 108
7.2.3.4. Greenhouse gas emissions . . . . . . . . . . . . . . . . . . . . . . . . . . . . . . . . . . . . . . . . . . . . . . . . . . . . . . . . . . . . . . . 108
7.2.4. Landscape Impacts . . . . . . . . . . . . . . . . . . . . . . . . . . . . . . . . . . . . . . . . . . . . . . . . . . . . . . . . . . . . . . . . . . . . . . . . . 109
7.2.5. Occupational and Community Health . . . . . . . . . . . . . . . . . . . . . . . . . . . . . . . . . . . . . . . . . . . . . . . . . . . . . . . . . . 109
7.2.6. Data and Study limitations . . . . . . . . . . . . . . . . . . . . . . . . . . . . . . . . . . . . . . . . . . . . . . . . . . . . . . . . . . . . . . . . . . . 110
7.2.7. Impacts of Non-CANDU type nuclear reactors. . . . . . . . . . . . . . . . . . . . . . . . . . . . . . . . . . . . . . . . . . . . . . . . . . . . 110
7.3. Sustainability Challenges . . . . . . . . . . . . . . . . . . . . . . . . . . . . . . . . . . . . . . . . . . . . . . . . . . . . . . . . . . . . . . . . . . . . . . . . . . 110
7.3.1. Capital costs and construction times . . . . . . . . . . . . . . . . . . . . . . . . . . . . . . . . . . . . . . . . . . . . . . . . . . . . . . . . . . . . 110
7.3.2. Facility reliability . . . . . . . . . . . . . . . . . . . . . . . . . . . . . . . . . . . . . . . . . . . . . . . . . . . . . . . . . . . . . . . . . . . . . . . . . . . 110
7.3.3. Fuel supply and costs . . . . . . . . . . . . . . . . . . . . . . . . . . . . . . . . . . . . . . . . . . . . . . . . . . . . . . . . . . . . . . . . . . . . . . . . 111
7.3.4. Weapons proliferation . . . . . . . . . . . . . . . . . . . . . . . . . . . . . . . . . . . . . . . . . . . . . . . . . . . . . . . . . . . . . . . . . . . . . . 111
7.3.5. Security risks . . . . . . . . . . . . . . . . . . . . . . . . . . . . . . . . . . . . . . . . . . . . . . . . . . . . . . . . . . . . . . . . . . . . . . . . . . . . . . . 111
7.4. Conclusions . . . . . . . . . . . . . . . . . . . . . . . . . . . . . . . . . . . . . . . . . . . . . . . . . . . . . . . . . . . . . . . . . . . . . . . . . . . . . . . . . . . 111
Abbreviations . . . . . . . . . . . . . . . . . . . . . . . . . . . . . . . . . . . . . . . . . . . . . . . . . . . . . . . . . . . . . . . . . . . . . . . . . . . . . . . . . . . . . . . . . 113
Glossary . . . . . . . . . . . . . . . . . . . . . . . . . . . . . . . . . . . . . . . . . . . . . . . . . . . . . . . . . . . . . . . . . . . . . . . . . . . . . . . . . . . . . . . . . . . . . 113
Endnotes . . . . . . . . . . . . . . . . . . . . . . . . . . . . . . . . . . . . . . . . . . . . . . . . . . . . . . . . . . . . . . . . . . . . . . . . . . . . . . . . . . . . . . . . . . . . 115
Contents
12 The Pembina Institute • Nuclear Power in Canada: An Examination of Risks, Impacts and Sustainability 13Nuclear Power in Canada: An Examination of Risks, Impacts and Sustainability • The Pembina Institute
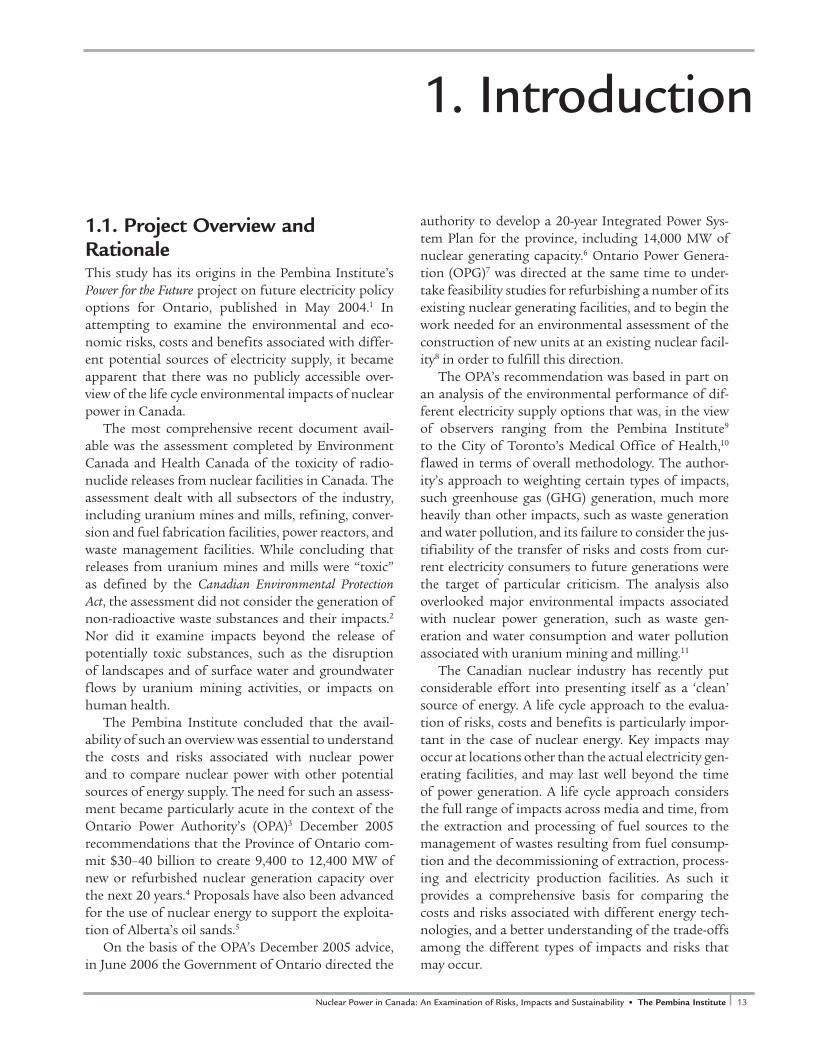
1.1. Project Overview and RationaleThis study has its origins in the Pembina Institute’s Power for the Future project on future electricity policy options for Ontario, published in May 2004.1 In attempting to examine the environmental and eco-nomic risks, costs and benefits associated with differ-ent potential sources of electricity supply, it became apparent that there was no publicly accessible over-view of the life cycle environmental impacts of nuclear power in Canada.
The most comprehensive recent document avail-able was the assessment completed by Environment Canada and Health Canada of the toxicity of radio-nuclide releases from nuclear facilities in Canada. The assessment dealt with all subsectors of the industry, including uranium mines and mills, refining, conver-sion and fuel fabrication facilities, power reactors, and waste management facilities. While concluding that releases from uranium mines and mills were “toxic” as defined by the Canadian Environmental Protection Act, the assessment did not consider the generation of non-radioactive waste substances and their impacts.2 Nor did it examine impacts beyond the release of potentially toxic substances, such as the disruption of landscapes and of surface water and groundwater flows by uranium mining activities, or impacts on human health.
The Pembina Institute concluded that the avail-ability of such an overview was essential to understand the costs and risks associated with nuclear power and to compare nuclear power with other potential sources of energy supply. The need for such an assess-ment became particularly acute in the context of the Ontario Power Authority’s (OPA)3 December 2005 recommendations that the Province of Ontario com-mit $30–40 billion to create 9,400 to 12,400 MW of new or refurbished nuclear generation capacity over the next 20 years.4 Proposals have also been advanced for the use of nuclear energy to support the exploita-tion of Alberta’s oil sands.5
On the basis of the OPA’s December 2005 advice, in June 2006 the Government of Ontario directed the
authority to develop a 20-year Integrated Power Sys-tem Plan for the province, including 14,000 MW of nuclear generating capacity.6 Ontario Power Genera-tion (OPG)7 was directed at the same time to under-take feasibility studies for refurbishing a number of its existing nuclear generating facilities, and to begin the work needed for an environmental assessment of the construction of new units at an existing nuclear facil-ity8 in order to fulfill this direction.
The OPA’s recommendation was based in part on an analysis of the environmental performance of dif-ferent electricity supply options that was, in the view of observers ranging from the Pembina Institute9 to the City of Toronto’s Medical Office of Health,10 flawed in terms of overall methodology. The author-ity’s approach to weighting certain types of impacts, such greenhouse gas (GHG) generation, much more heavily than other impacts, such as waste generation and water pollution, and its failure to consider the jus-tifiability of the transfer of risks and costs from cur-rent electricity consumers to future generations were the target of particular criticism. The analysis also overlooked major environmental impacts associated with nuclear power generation, such as waste gen-eration and water consumption and water pollution associated with uranium mining and milling.11
The Canadian nuclear industry has recently put considerable effort into presenting itself as a ‘clean’ source of energy. A life cycle approach to the evalua-tion of risks, costs and benefits is particularly impor-tant in the case of nuclear energy. Key impacts may occur at locations other than the actual electricity gen-erating facilities, and may last well beyond the time of power generation. A life cycle approach considers the full range of impacts across media and time, from the extraction and processing of fuel sources to the management of wastes resulting from fuel consump-tion and the decommissioning of extraction, process-ing and electricity production facilities. As such it provides a comprehensive basis for comparing the costs and risks associated with different energy tech-nologies, and a better understanding of the trade-offs among the different types of impacts and risks that may occur.
1. Introduction
14 The Pembina Institute • Nuclear Power in Canada: An Examination of Risks, Impacts and Sustainability 15Nuclear Power in Canada: An Examination of Risks, Impacts and Sustainability • The Pembina Institute
The goal of the project, in this context, is to provide a comprehensive overview description of the major environmental impacts and risks associated with each stage of nuclear energy production in Canada, from uranium mining through to waste fuel disposal. Eco-nomic, community and occupational health costs and risks are noted where information on such impacts was available. A full economic costing of nuclear energy is beyond the scope of the study, in part due to the non-accessibility of key economic information with respect to the nuclear sector.
A comparison of the impacts of nuclear energy with those of other energy sources is also beyond the
scope of the study. However, this study is intended to inform such comparisons in the future by providing as comprehensive as possible a picture of the risks and impacts associated with the use of nuclear energy for electricity generation in a Canadian context.
Implicit in this effort is an attempt to measure how much specific information on these issues is actually available in the public realm to support the comple-tion of such an assessment, particularly in compari-son to other energy sources. The identification of these information gaps is a significant sub-goal of the project.
Nuclear Power in CanadaAs of September 2006, there are five commercial nuclear power generating stations in Canada: three in Ontario (Pickering, Bruce and Darlington), one in Quebec (Gentilly-2) and one in New Brunswick (Point Lepreau). All Canadian commercial nuclear generating stations operate Canada Deuterium Uranium (CANDU) reactors. CANDU reactors use un-enriched uranium as fuel, and heavy water (deuterium) as a moderator.
The Pickering Nuclear Generation Station was Canada’s first large-scale nuclear power plant. The Pickering A station consists of four reactors that went into service in 1971–73. The Pickering B station consists of four reactors brought into service in 1983–86. At their peak, the Pickering A and B stations had a combined total capacity of 4,120 megawatts (MW).12 Two Pickering A units are now permanently out of service.
The Bruce Nuclear Generation Station is located in Tiverton, Ontario. The four Bruce A reactors went into service in 1977–79 and the four Bruce B units entered service in 1985–87. The Bruce Power Ltd. consortium currently operates the Bruce Station.13 The station has a capacity of 6,140 MW,14 although two units are currently undergoing refurbishment.
The Darlington Nuclear Generation Station consists of four reactors commissioned in 1990–1993. It has a total generating capacity of 3,524 MW.15
The Gentilly-2 Nuclear Generation Station is located near Bécancour in Quebec and is operated by Hydro-Québec. The station consists of a single reactor that was declared in-service in 1983. Gentilly-2 has a total generating capacity of 675 MW.16
The Point Lepreau Nuclear Generation Station is located on the north shore of the Bay of Fundy in New Brunswick. It was declared in-service in 1983. Point Lepreau has a generation capability of 635 MW.17
Introduction
14 The Pembina Institute • Nuclear Power in Canada: An Examination of Risks, Impacts and Sustainability 15Nuclear Power in Canada: An Examination of Risks, Impacts and Sustainability • The Pembina Institute
1.2. Project Methodology Nuclear energy differs from other energy sources in that many of its key impacts and risks can occur at loca-tions other than the actual generating facilities, and well beyond the time of power generation. For this rea-son, the study considers the impacts of nuclear power at each of the four major phases of its production:• Mining and milling of uranium ore into uranium
oxide (U3O8)• Refining U3O8 into uranium trioxide (UO3),
conversion to uranium dioxide (UO2), and fabri-cation into pellets and assembly of fuel bundles (fuel processing).
• Nuclear power plant operation, where the fuel bundles are used in CANDU reactors to produce heat to fuel electricity generation.
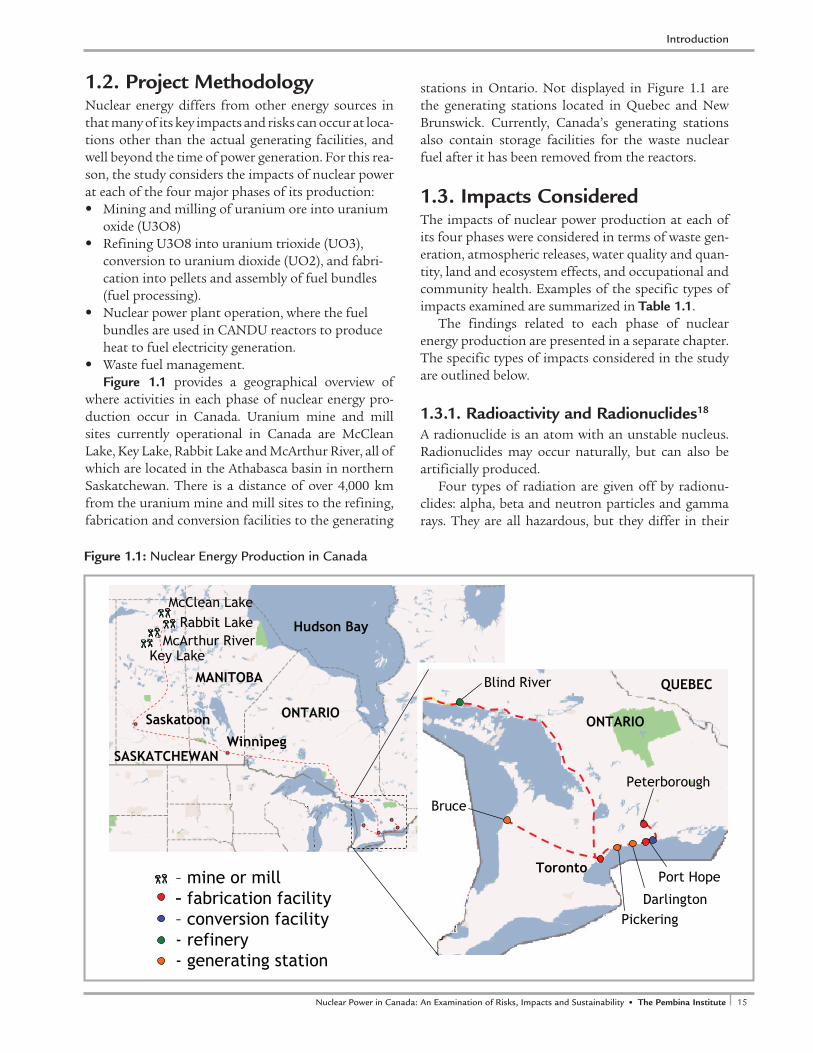
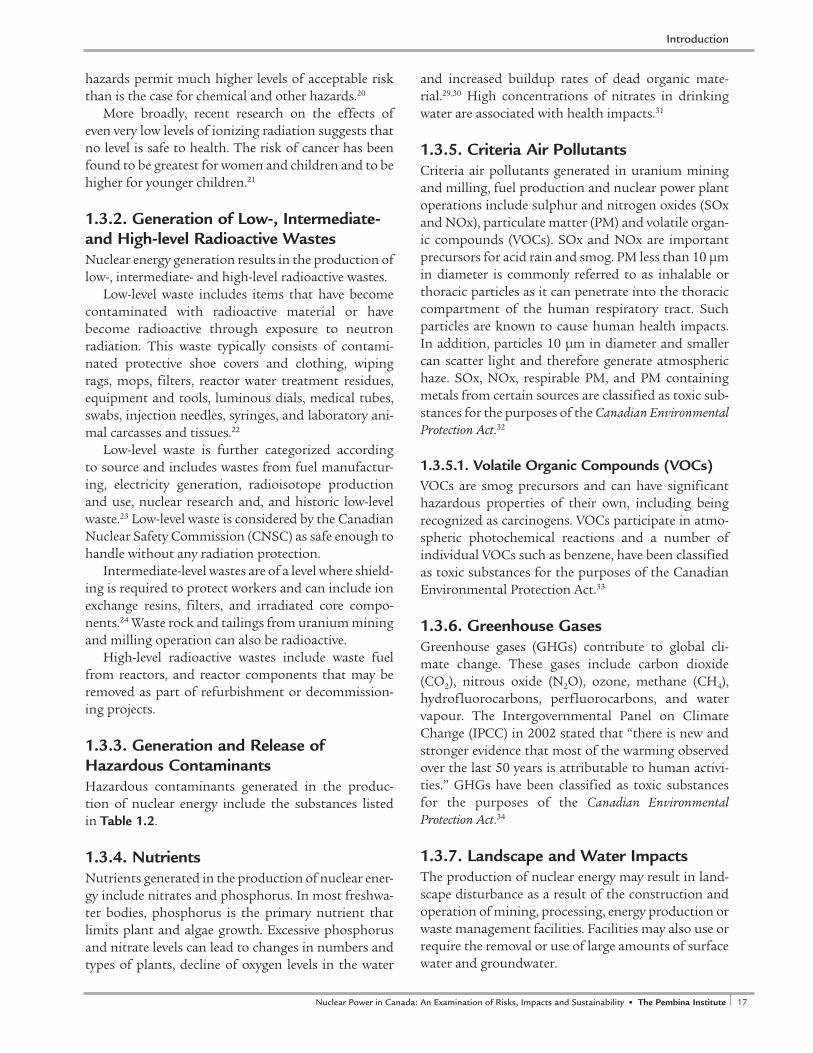
• Waste fuel management. Figure 1.1 provides a geographical overview of
where activities in each phase of nuclear energy pro-duction occur in Canada. Uranium mine and mill sites currently operational in Canada are McClean Lake, Key Lake, Rabbit Lake and McArthur River, all of which are located in the Athabasca basin in northern Saskatchewan. There is a distance of over 4,000 km from the uranium mine and mill sites to the refining, fabrication and conversion facilities to the generating
stations in Ontario. Not displayed in Figure 1.1 are the generating stations located in Quebec and New Brunswick. Currently, Canada’s generating stations also contain storage facilities for the waste nuclear fuel after it has been removed from the reactors.
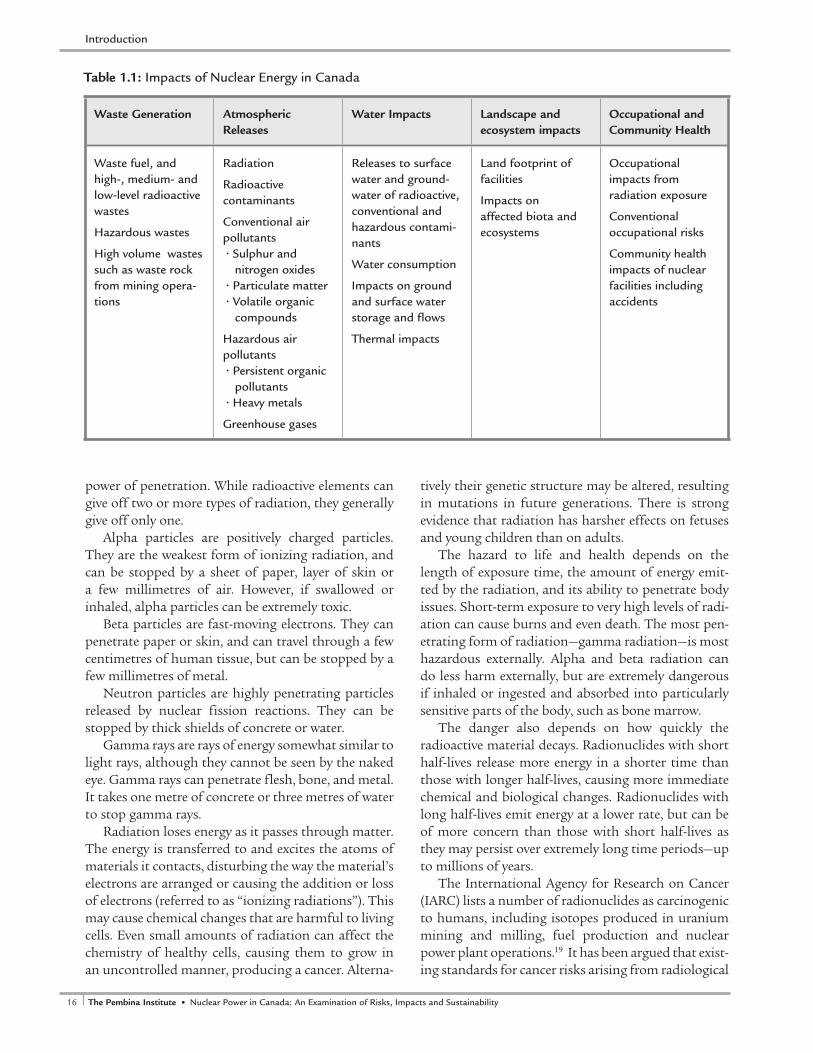
1.3. Impacts ConsideredThe impacts of nuclear power production at each of its four phases were considered in terms of waste gen-eration, atmospheric releases, water quality and quan-tity, land and ecosystem effects, and occupational and community health. Examples of the specific types of impacts examined are summarized in Table 1.1.
The findings related to each phase of nuclear energy production are presented in a separate chapter. The specific types of impacts considered in the study are outlined below.
1.3.1. Radioactivity and Radionuclides18
A radionuclide is an atom with an unstable nucleus. Radionuclides may occur naturally, but can also be artificially produced.
Four types of radiation are given off by radionu-clides: alpha, beta and neutron particles and gamma rays. They are all hazardous, but they differ in their
Introduction
Figure 1.1: Nuclear Energy Production in Canada
��������
��������� �������
��������
������������
������
����������
�����������
�������
�������
������� ���������������
����������������������
������������
���������� ������������� ��������������������� �������������������� ��������� ������������������
�������������������
�����
16 The Pembina Institute • Nuclear Power in Canada: An Examination of Risks, Impacts and Sustainability 17Nuclear Power in Canada: An Examination of Risks, Impacts and Sustainability • The Pembina Institute
Table 1.1: Impacts of Nuclear Energy in Canada
power of penetration. While radioactive elements can give off two or more types of radiation, they generally give off only one.
Alpha particles are positively charged particles. They are the weakest form of ionizing radiation, and can be stopped by a sheet of paper, layer of skin or a few millimetres of air. However, if swallowed or inhaled, alpha particles can be extremely toxic.
Beta particles are fast-moving electrons. They can penetrate paper or skin, and can travel through a few centimetres of human tissue, but can be stopped by a few millimetres of metal.
Neutron particles are highly penetrating particles released by nuclear fission reactions. They can be stopped by thick shields of concrete or water.
Gamma rays are rays of energy somewhat similar to light rays, although they cannot be seen by the naked eye. Gamma rays can penetrate flesh, bone, and metal. It takes one metre of concrete or three metres of water to stop gamma rays.
Radiation loses energy as it passes through matter. The energy is transferred to and excites the atoms of materials it contacts, disturbing the way the material’s electrons are arranged or causing the addition or loss of electrons (referred to as “ionizing radiations”). This may cause chemical changes that are harmful to living cells. Even small amounts of radiation can affect the chemistry of healthy cells, causing them to grow in an uncontrolled manner, producing a cancer. Alterna-
tively their genetic structure may be altered, resulting in mutations in future generations. There is strong evidence that radiation has harsher effects on fetuses and young children than on adults.
The hazard to life and health depends on the length of exposure time, the amount of energy emit-ted by the radiation, and its ability to penetrate body issues. Short-term exposure to very high levels of radi-ation can cause burns and even death. The most pen-etrating form of radiation—gamma radiation—is most hazardous externally. Alpha and beta radiation can do less harm externally, but are extremely dangerous if inhaled or ingested and absorbed into particularly sensitive parts of the body, such as bone marrow.
The danger also depends on how quickly the radioactive material decays. Radionuclides with short half-lives release more energy in a shorter time than those with longer half-lives, causing more immediate chemical and biological changes. Radionuclides with long half-lives emit energy at a lower rate, but can be of more concern than those with short half-lives as they may persist over extremely long time periods—up to millions of years.
The International Agency for Research on Cancer (IARC) lists a number of radionuclides as carcinogenic to humans, including isotopes produced in uranium mining and milling, fuel production and nuclear power plant operations.19 It has been argued that exist-ing standards for cancer risks arising from radiological
Waste Generation Atmospheric Releases
Water Impacts Landscape and ecosystem impacts
Occupational and Community Health
Waste fuel, and high-, medium- and low-level radioactive wastes
Hazardous wastes
High volume wastes such as waste rock from mining opera-tions
Radiation
Radioactive contaminants
Conventional air pollutants• Sulphur and
nitrogen oxides• Particulate matter• Volatile organic
compounds
Hazardous air pollutants• Persistent organic
pollutants• Heavy metals
Greenhouse gases
Releases to surface water and ground-water of radioactive, conventional and hazardous contami-nants
Water consumption
Impacts on ground and surface water storage and flows
Thermal impacts
Land footprint of facilities
Impacts on affected biota and ecosystems
Occupational impacts from radiation exposure
Conventional occupational risks
Community health impacts of nuclear facilities including accidents
Introduction
16 The Pembina Institute • Nuclear Power in Canada: An Examination of Risks, Impacts and Sustainability 17Nuclear Power in Canada: An Examination of Risks, Impacts and Sustainability • The Pembina Institute
hazards permit much higher levels of acceptable risk than is the case for chemical and other hazards.20
More broadly, recent research on the effects of even very low levels of ionizing radiation suggests that no level is safe to health. The risk of cancer has been found to be greatest for women and children and to be higher for younger children.21
1.3.2. Generation of Low-, Intermediate- and High-level Radioactive WastesNuclear energy generation results in the production of low-, intermediate- and high-level radioactive wastes.
Low-level waste includes items that have become contaminated with radioactive material or have become radioactive through exposure to neutron radiation. This waste typically consists of contami-nated protective shoe covers and clothing, wiping rags, mops, filters, reactor water treatment residues, equipment and tools, luminous dials, medical tubes, swabs, injection needles, syringes, and laboratory ani-mal carcasses and tissues.22
Low-level waste is further categorized according to source and includes wastes from fuel manufactur-ing, electricity generation, radioisotope production and use, nuclear research and, and historic low-level waste.23 Low-level waste is considered by the Canadian Nuclear Safety Commission (CNSC) as safe enough to handle without any radiation protection.
Intermediate-level wastes are of a level where shield-ing is required to protect workers and can include ion exchange resins, filters, and irradiated core compo-nents.24 Waste rock and tailings from uranium mining and milling operation can also be radioactive.
High-level radioactive wastes include waste fuel from reactors, and reactor components that may be removed as part of refurbishment or decommission-ing projects.
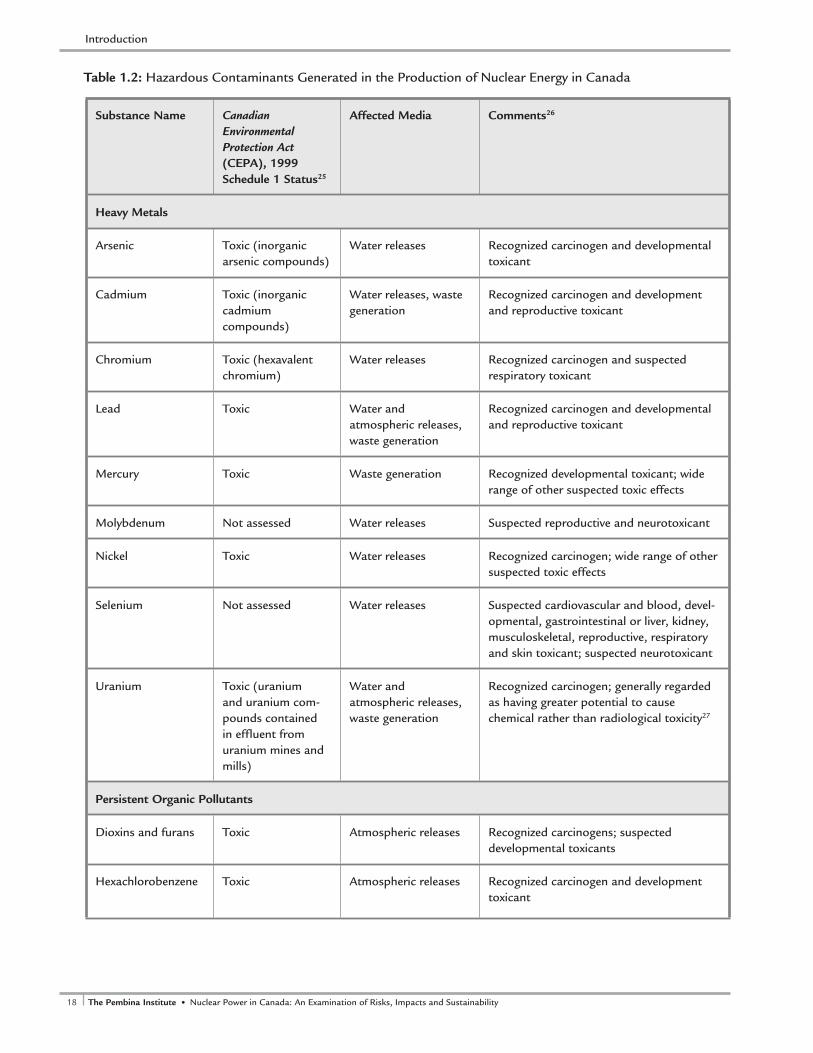
1.3.3. Generation and Release of Hazardous ContaminantsHazardous contaminants generated in the produc-tion of nuclear energy include the substances listed in Table 1.2.
1.3.4. NutrientsNutrients generated in the production of nuclear ener-gy include nitrates and phosphorus. In most freshwa-ter bodies, phosphorus is the primary nutrient that limits plant and algae growth. Excessive phosphorus and nitrate levels can lead to changes in numbers and types of plants, decline of oxygen levels in the water
and increased buildup rates of dead organic mate-rial.29,30 High concentrations of nitrates in drinking water are associated with health impacts.31
1.3.5. Criteria Air PollutantsCriteria air pollutants generated in uranium mining and milling, fuel production and nuclear power plant operations include sulphur and nitrogen oxides (SOx and NOx), particulate matter (PM) and volatile organ-ic compounds (VOCs). SOx and NOx are important precursors for acid rain and smog. PM less than 10 µm in diameter is commonly referred to as inhalable or thoracic particles as it can penetrate into the thoracic compartment of the human respiratory tract. Such particles are known to cause human health impacts. In addition, particles 10 µm in diameter and smaller can scatter light and therefore generate atmospheric haze. SOx, NOx, respirable PM, and PM containing metals from certain sources are classified as toxic sub-stances for the purposes of the Canadian Environmental Protection Act.32
1.3.5.1. Volatile Organic Compounds (VOCs)VOCs are smog precursors and can have significant hazardous properties of their own, including being recognized as carcinogens. VOCs participate in atmo-spheric photochemical reactions and a number of individual VOCs such as benzene, have been classified as toxic substances for the purposes of the Canadian Environmental Protection Act.33
1.3.6. Greenhouse Gases Greenhouse gases (GHGs) contribute to global cli-mate change. These gases include carbon dioxide (CO2), nitrous oxide (N2O), ozone, methane (CH4), hydrofluorocarbons, perfluorocarbons, and water vapour. The Intergovernmental Panel on Climate Change (IPCC) in 2002 stated that “there is new and stronger evidence that most of the warming observed over the last 50 years is attributable to human activi-ties.” GHGs have been classified as toxic substances for the purposes of the Canadian Environmental Protection Act.34
1.3.7. Landscape and Water ImpactsThe production of nuclear energy may result in land-scape disturbance as a result of the construction and operation of mining, processing, energy production or waste management facilities. Facilities may also use or require the removal or use of large amounts of surface water and groundwater.
Introduction
18 The Pembina Institute • Nuclear Power in Canada: An Examination of Risks, Impacts and Sustainability 19Nuclear Power in Canada: An Examination of Risks, Impacts and Sustainability • The Pembina Institute
Substance Name Canadian Environmental Protection Act (CEPA), 1999 Schedule 1 Status25
Affected Media Comments26
Heavy Metals
Arsenic Toxic (inorganic arsenic compounds)
Water releases Recognized carcinogen and developmental toxicant
Cadmium Toxic (inorganic cadmium compounds)
Water releases, waste generation
Recognized carcinogen and development and reproductive toxicant
Chromium Toxic (hexavalent chromium)
Water releases Recognized carcinogen and suspected respiratory toxicant
Lead Toxic Water and atmospheric releases, waste generation
Recognized carcinogen and developmental and reproductive toxicant
Mercury Toxic Waste generation Recognized developmental toxicant; wide range of other suspected toxic effects
Molybdenum Not assessed Water releases Suspected reproductive and neurotoxicant
Nickel Toxic Water releases Recognized carcinogen; wide range of other suspected toxic effects
Selenium Not assessed Water releases Suspected cardiovascular and blood, devel-opmental, gastrointestinal or liver, kidney, musculoskeletal, reproductive, respiratory and skin toxicant; suspected neurotoxicant
Uranium Toxic (uranium and uranium com-pounds contained in effluent from uranium mines and mills)
Water and atmospheric releases, waste generation
Recognized carcinogen; generally regarded as having greater potential to cause chemical rather than radiological toxicity27
Persistent Organic Pollutants
Dioxins and furans Toxic Atmospheric releases Recognized carcinogens; suspected developmental toxicants
Hexachlorobenzene Toxic Atmospheric releases Recognized carcinogen and development toxicant
Table 1.2: Hazardous Contaminants Generated in the Production of Nuclear Energy in Canada
Introduction
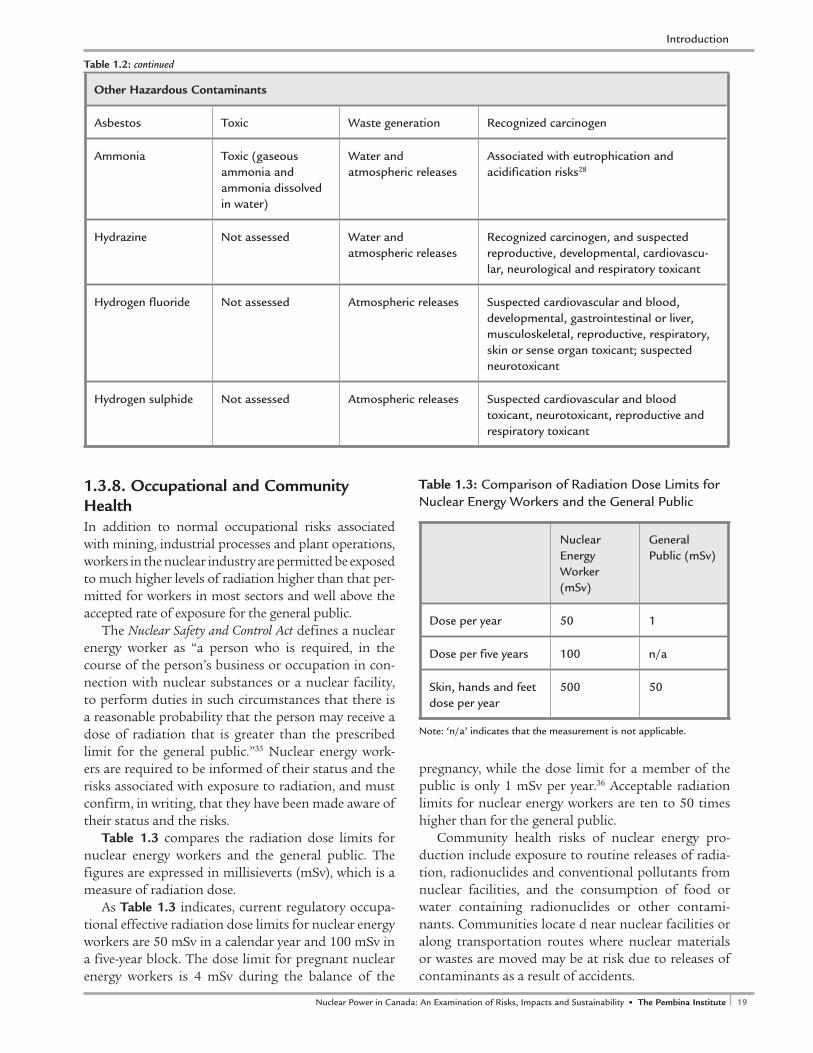
18 The Pembina Institute • Nuclear Power in Canada: An Examination of Risks, Impacts and Sustainability 19Nuclear Power in Canada: An Examination of Risks, Impacts and Sustainability • The Pembina Institute
Other Hazardous Contaminants
Asbestos Toxic Waste generation Recognized carcinogen
Ammonia Toxic (gaseous ammonia and ammonia dissolved in water)
Water and atmospheric releases
Associated with eutrophication and acidification risks28
Hydrazine Not assessed Water and atmospheric releases
Recognized carcinogen, and suspected reproductive, developmental, cardiovascu-lar, neurological and respiratory toxicant
Hydrogen fluoride Not assessed Atmospheric releases Suspected cardiovascular and blood, developmental, gastrointestinal or liver, musculoskeletal, reproductive, respiratory, skin or sense organ toxicant; suspected neurotoxicant
Hydrogen sulphide Not assessed Atmospheric releases Suspected cardiovascular and blood toxicant, neurotoxicant, reproductive and respiratory toxicant
Introduction
1.3.8. Occupational and Community HealthIn addition to normal occupational risks associated with mining, industrial processes and plant operations, workers in the nuclear industry are permitted be exposed to much higher levels of radiation higher than that per-mitted for workers in most sectors and well above the accepted rate of exposure for the general public.
The Nuclear Safety and Control Act defines a nuclear energy worker as “a person who is required, in the course of the person’s business or occupation in con-nection with nuclear substances or a nuclear facility, to perform duties in such circumstances that there is a reasonable probability that the person may receive a dose of radiation that is greater than the prescribed limit for the general public.”35 Nuclear energy work-ers are required to be informed of their status and the risks associated with exposure to radiation, and must confirm, in writing, that they have been made aware of their status and the risks.
Table 1.3 compares the radiation dose limits for nuclear energy workers and the general public. The figures are expressed in millisieverts (mSv), which is a measure of radiation dose.
As Table 1.3 indicates, current regulatory occupa-tional effective radiation dose limits for nuclear energy workers are 50 mSv in a calendar year and 100 mSv in a five-year block. The dose limit for pregnant nuclear energy workers is 4 mSv during the balance of the
Table 1.3: Comparison of Radiation Dose Limits for Nuclear Energy Workers and the General Public
Nuclear Energy Worker (mSv)
General Public (mSv)
Dose per year 50 1
Dose per five years 100 n/a
Skin, hands and feet dose per year
500 50
pregnancy, while the dose limit for a member of the public is only 1 mSv per year.36 Acceptable radiation limits for nuclear energy workers are ten to 50 times higher than for the general public.
Community health risks of nuclear energy pro-duction include exposure to routine releases of radia-tion, radionuclides and conventional pollutants from nuclear facilities, and the consumption of food or water containing radionuclides or other contami-nants. Communities locate d near nuclear facilities or along transportation routes where nuclear materials or wastes are moved may be at risk due to releases of contaminants as a result of accidents.
Note: ‘n/a’ indicates that the measurement is not applicable.
Table 1.2: continued
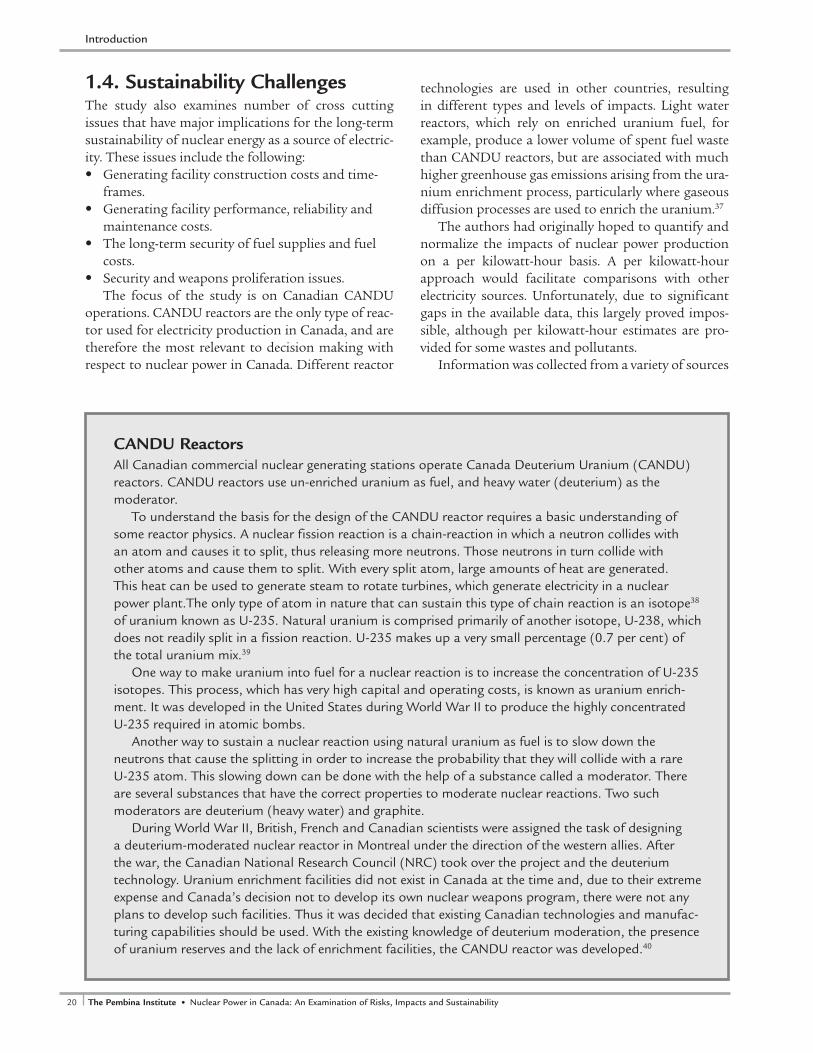
20 The Pembina Institute • Nuclear Power in Canada: An Examination of Risks, Impacts and Sustainability 21Nuclear Power in Canada: An Examination of Risks, Impacts and Sustainability • The Pembina Institute
1.4. Sustainability Challenges The study also examines number of cross cutting issues that have major implications for the long-term sustainability of nuclear energy as a source of electric-ity. These issues include the following:• Generating facility construction costs and time-
frames.• Generating facility performance, reliability and
maintenance costs.• The long-term security of fuel supplies and fuel
costs.• Security and weapons proliferation issues.
The focus of the study is on Canadian CANDU operations. CANDU reactors are the only type of reac-tor used for electricity production in Canada, and are therefore the most relevant to decision making with respect to nuclear power in Canada. Different reactor
Introduction
technologies are used in other countries, resulting in different types and levels of impacts. Light water reactors, which rely on enriched uranium fuel, for example, produce a lower volume of spent fuel waste than CANDU reactors, but are associated with much higher greenhouse gas emissions arising from the ura-nium enrichment process, particularly where gaseous diffusion processes are used to enrich the uranium.37
The authors had originally hoped to quantify and normalize the impacts of nuclear power production on a per kilowatt-hour basis. A per kilowatt-hour approach would facilitate comparisons with other electricity sources. Unfortunately, due to significant gaps in the available data, this largely proved impos-sible, although per kilowatt-hour estimates are pro-vided for some wastes and pollutants.
Information was collected from a variety of sources
CANDU ReactorsAll Canadian commercial nuclear generating stations operate Canada Deuterium Uranium (CANDU) reactors. CANDU reactors use un-enriched uranium as fuel, and heavy water (deuterium) as the moderator.
To understand the basis for the design of the CANDU reactor requires a basic understanding of some reactor physics. A nuclear fission reaction is a chain-reaction in which a neutron collides with an atom and causes it to split, thus releasing more neutrons. Those neutrons in turn collide with other atoms and cause them to split. With every split atom, large amounts of heat are generated. This heat can be used to generate steam to rotate turbines, which generate electricity in a nuclear power plant.The only type of atom in nature that can sustain this type of chain reaction is an isotope38 of uranium known as U-235. Natural uranium is comprised primarily of another isotope, U-238, which does not readily split in a fission reaction. U-235 makes up a very small percentage (0.7 per cent) of the total uranium mix.39
One way to make uranium into fuel for a nuclear reaction is to increase the concentration of U-235 isotopes. This process, which has very high capital and operating costs, is known as uranium enrich-ment. It was developed in the United States during World War II to produce the highly concentrated U-235 required in atomic bombs.
Another way to sustain a nuclear reaction using natural uranium as fuel is to slow down the neutrons that cause the splitting in order to increase the probability that they will collide with a rare U-235 atom. This slowing down can be done with the help of a substance called a moderator. There are several substances that have the correct properties to moderate nuclear reactions. Two such moderators are deuterium (heavy water) and graphite.
During World War II, British, French and Canadian scientists were assigned the task of designing a deuterium-moderated nuclear reactor in Montreal under the direction of the western allies. After the war, the Canadian National Research Council (NRC) took over the project and the deuterium technology. Uranium enrichment facilities did not exist in Canada at the time and, due to their extreme expense and Canada’s decision not to develop its own nuclear weapons program, there were not any plans to develop such facilities. Thus it was decided that existing Canadian technologies and manufac-turing capabilities should be used. With the existing knowledge of deuterium moderation, the presence of uranium reserves and the lack of enrichment facilities, the CANDU reactor was developed.40
20 The Pembina Institute • Nuclear Power in Canada: An Examination of Risks, Impacts and Sustainability 21Nuclear Power in Canada: An Examination of Risks, Impacts and Sustainability • The Pembina Institute
including available literature and discussions with rel-evant and credible experts. Key sources of information included the Canadian Nuclear Safety Commission (CNSC), the National Pollutant Release Inventory (NPRI), and the operators of individual nuclear facili-ties, particularly Cameco and OPG. The exclusion of radionuclides and the exemption of stage one mining activities (i.e., extraction and primary crushing) from the NPRI significantly limits the usefulness of the inventory as an information source.
The authors are aware that estimating actual lev-els of hazard or risk posed by wastes, emissions and exposures associated with mining, fuel production,
plant operation and waste disposal is often the sub-ject of intense scientific debate. We have not sought to resolve these debates. Rather we simply highlight where they exist and leave it to readers to draw their own conclusions from the available literature.
Consistent with the sustainability principles “pol-luter pays” and “intergenerational justice,”41 particular note is given to situations where wastes or pollutants are generated that have the potential to transfer risks and impacts over time, beyond present consumers of the electricity and other benefits associated with their generation, on to future generations.
Introduction

22 The Pembina Institute • Nuclear Power in Canada: An Examination of Risks, Impacts and Sustainability 23Nuclear Power in Canada: An Examination of Risks, Impacts and Sustainability • The Pembina Institute

22 The Pembina Institute • Nuclear Power in Canada: An Examination of Risks, Impacts and Sustainability 23Nuclear Power in Canada: An Examination of Risks, Impacts and Sustainability • The Pembina Institute
Summary of Key Findings• The environmental impacts of uranium mining and milling are severe. They represent
the most significant short-term environmental impacts of nuclear energy production in Canada. A number of jurisdictions in Canada and Australia have adopted bans on the establishment of new uranium mines due to concerns over the potential environmental and health impacts of such operations.
• The key impacts of uranium mining and milling include the following:
• The generation of large quantities of waste rock and mill tailings. These are typically acidic or potentially acid generating, comprise long-lived radionuclides, heavy metals, and other contaminants.
– Uranium mining milling to supply Canadian domestic power generation is estimated to result in the production of more than 90,000 tonnes of tailings, and up to 2.9 million tonnes of waste rock per year.
– Canadian uranium mines and mills have an inventory of 109 million tonnes of waste rock, and 214 million tonnes of tailings.
– There are major concerns regarding long-term integrity of tailings and waste rock containment facilities. These facilities will require perpetual care. The adequacy of current financial assurances required by governments for the closure and long-term care of containment facilities has been questioned.
• Severe contamination of groundwater with radionuclides, heavy metals, and other contaminants has occurred at tailings management facilities and waste rock storage areas.
• Uranium mining and milling facility surface water discharges have resulted in the contamination of the receiving environment with radionuclides and heavy metals. Effluent from historic and operating uranium mines and mills, particularly ura-nium discharges, have been determined to be toxic for the purposes of the Canadian Environmental Protection Act by Environment Canada and Health Canada.
• Uranium mining operations are associated with the extensive removal of groundwater (in excess of 16 billion litres per year).
• The environment and biota in the vicinity of uranium mines and mills has been contaminated with radionuclides particularly via windblown dust from tailings sites. Significant potential increases in cancer risks to humans from the consumption of caribou in the vicinity of uranium mines have been identified.
2. Phase I: Uranium Mining and Milling
24 The Pembina Institute • Nuclear Power in Canada: An Examination of Risks, Impacts and Sustainability 25Nuclear Power in Canada: An Examination of Risks, Impacts and Sustainability • The Pembina Institute
• Uranium mines and tailings storage areas have been identified as significant sources of atmospheric releases of radon gas.
• Major atmospheric releases of sulphur dioxide and VOCs are associated with the uranium milling process. In 2004, VOC emissions from the sector were equivalent to the average annual emissions of more than 300,000 cars. The Rabbit Lake facility acid plant reported releases of 43,000 tonnes of SO2 in 2004.
• Atmospheric releases of NOx and PM result from the milling process and the operation of fossil fuel-powered machinery and equipment.
• Annual CO2 emissions resulting from uranium mining, milling and tailings manage-ment activities in Canada are estimated at between 160,000 and 250,000 tonnes.
• The mining of lower grade ores would result in the generation of proportionally larger amounts of tailings, other wastes and emissions, as larger amounts of ore would have to be processed to produce the same amount of uranium concentrate. Processing of ore that is 0.01% uranium, for example, would generate approximately ten times the tailings of ore that is 0.1% uranium.
Workers at uranium mines and mills typically receive annual effective radiation doses higher than those considered acceptable to members of the general public. Increased inci-dences of lung cancer as well as deaths resulting from silica exposure are reported among uranium miners.
Phase I: Uranium Mining and Milling
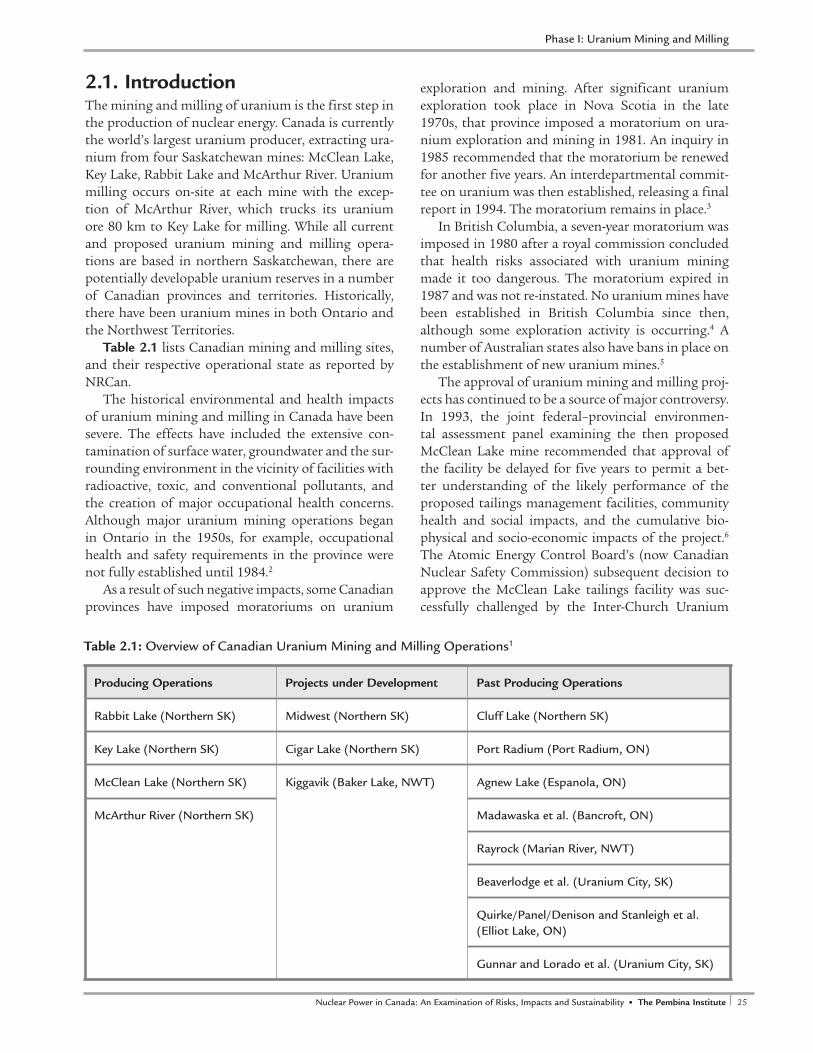
24 The Pembina Institute • Nuclear Power in Canada: An Examination of Risks, Impacts and Sustainability 25Nuclear Power in Canada: An Examination of Risks, Impacts and Sustainability • The Pembina Institute
2.1. IntroductionThe mining and milling of uranium is the first step in the production of nuclear energy. Canada is currently the world’s largest uranium producer, extracting ura-nium from four Saskatchewan mines: McClean Lake, Key Lake, Rabbit Lake and McArthur River. Uranium milling occurs on-site at each mine with the excep-tion of McArthur River, which trucks its uranium ore 80 km to Key Lake for milling. While all current and proposed uranium mining and milling opera-tions are based in northern Saskatchewan, there are potentially developable uranium reserves in a number of Canadian provinces and territories. Historically, there have been uranium mines in both Ontario and the Northwest Territories.
Table 2.1 lists Canadian mining and milling sites, and their respective operational state as reported by NRCan.
The historical environmental and health impacts of uranium mining and milling in Canada have been severe. The effects have included the extensive con-tamination of surface water, groundwater and the sur-rounding environment in the vicinity of facilities with radioactive, toxic, and conventional pollutants, and the creation of major occupational health concerns. Although major uranium mining operations began in Ontario in the 1950s, for example, occupational health and safety requirements in the province were not fully established until 1984.2
As a result of such negative impacts, some Canadian provinces have imposed moratoriums on uranium
exploration and mining. After significant uranium exploration took place in Nova Scotia in the late 1970s, that province imposed a moratorium on ura-nium exploration and mining in 1981. An inquiry in 1985 recommended that the moratorium be renewed for another five years. An interdepartmental commit-tee on uranium was then established, releasing a final report in 1994. The moratorium remains in place.3
In British Columbia, a seven-year moratorium was imposed in 1980 after a royal commission concluded that health risks associated with uranium mining made it too dangerous. The moratorium expired in 1987 and was not re-instated. No uranium mines have been established in British Columbia since then, although some exploration activity is occurring.4 A number of Australian states also have bans in place on the establishment of new uranium mines.5
The approval of uranium mining and milling proj-ects has continued to be a source of major controversy. In 1993, the joint federal–provincial environmen-tal assessment panel examining the then proposed McClean Lake mine recommended that approval of the facility be delayed for five years to permit a bet-ter understanding of the likely performance of the proposed tailings management facilities, community health and social impacts, and the cumulative bio-physical and socio-economic impacts of the project.6 The Atomic Energy Control Board’s (now Canadian Nuclear Safety Commission) subsequent decision to approve the McClean Lake tailings facility was suc-cessfully challenged by the Inter-Church Uranium
Producing Operations Projects under Development Past Producing Operations
Rabbit Lake (Northern SK) Midwest (Northern SK) Cluff Lake (Northern SK)
Key Lake (Northern SK) Cigar Lake (Northern SK) Port Radium (Port Radium, ON)
McClean Lake (Northern SK) Kiggavik (Baker Lake, NWT) Agnew Lake (Espanola, ON)
McArthur River (Northern SK) Madawaska et al. (Bancroft, ON)
Rayrock (Marian River, NWT)
Beaverlodge et al. (Uranium City, SK)
Quirke/Panel/Denison and Stanleigh et al. (Elliot Lake, ON)
Gunnar and Lorado et al. (Uranium City, SK)
Table 2.1: Overview of Canadian Uranium Mining and Milling Operations1
Phase I: Uranium Mining and Milling
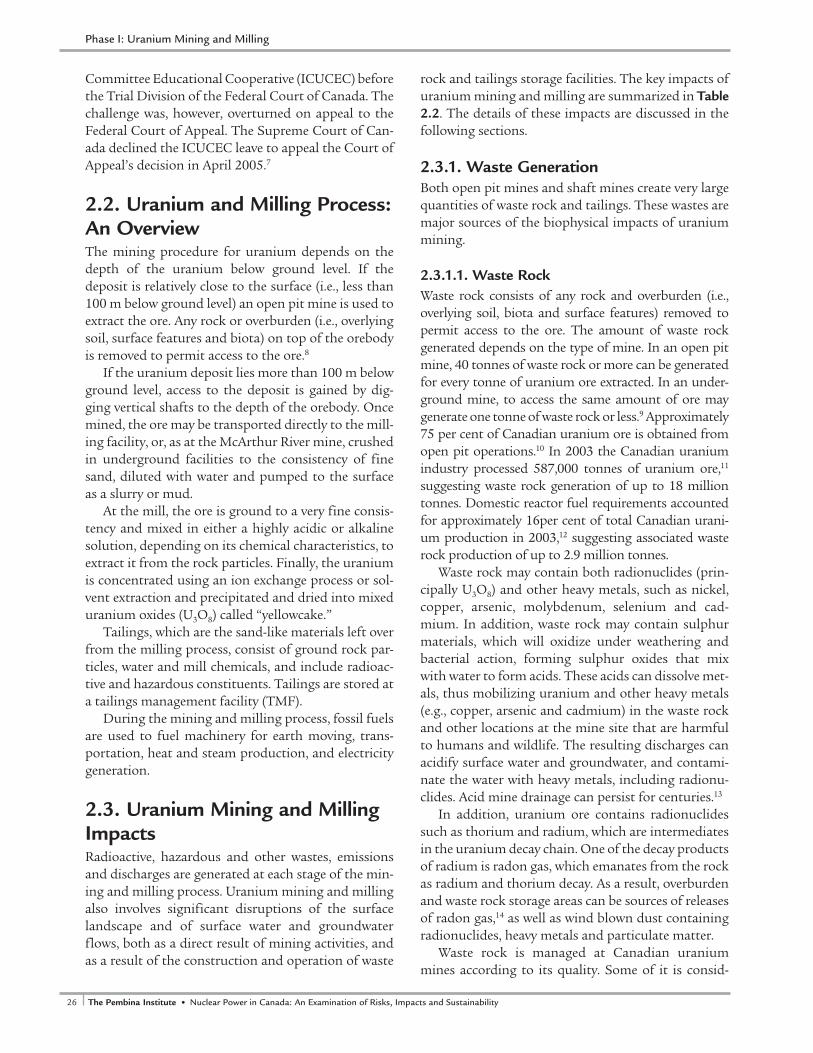
26 The Pembina Institute • Nuclear Power in Canada: An Examination of Risks, Impacts and Sustainability 27Nuclear Power in Canada: An Examination of Risks, Impacts and Sustainability • The Pembina Institute
Committee Educational Cooperative (ICUCEC) before the Trial Division of the Federal Court of Canada. The challenge was, however, overturned on appeal to the Federal Court of Appeal. The Supreme Court of Can-ada declined the ICUCEC leave to appeal the Court of Appeal’s decision in April 2005.7
2.2. Uranium and Milling Process: An Overview The mining procedure for uranium depends on the depth of the uranium below ground level. If the deposit is relatively close to the surface (i.e., less than 100 m below ground level) an open pit mine is used to extract the ore. Any rock or overburden (i.e., overlying soil, surface features and biota) on top of the orebody is removed to permit access to the ore.8
If the uranium deposit lies more than 100 m below ground level, access to the deposit is gained by dig-ging vertical shafts to the depth of the orebody. Once mined, the ore may be transported directly to the mill-ing facility, or, as at the McArthur River mine, crushed in underground facilities to the consistency of fine sand, diluted with water and pumped to the surface as a slurry or mud.
At the mill, the ore is ground to a very fine consis-tency and mixed in either a highly acidic or alkaline solution, depending on its chemical characteristics, to extract it from the rock particles. Finally, the uranium is concentrated using an ion exchange process or sol-vent extraction and precipitated and dried into mixed uranium oxides (U3O8) called “yellowcake.”
Tailings, which are the sand-like materials left over from the milling process, consist of ground rock par-ticles, water and mill chemicals, and include radioac-tive and hazardous constituents. Tailings are stored at a tailings management facility (TMF).
During the mining and milling process, fossil fuels are used to fuel machinery for earth moving, trans-portation, heat and steam production, and electricity generation.
2.3. Uranium Mining and Milling Impacts Radioactive, hazardous and other wastes, emissions and discharges are generated at each stage of the min-ing and milling process. Uranium mining and milling also involves significant disruptions of the surface landscape and of surface water and groundwater flows, both as a direct result of mining activities, and as a result of the construction and operation of waste
rock and tailings storage facilities. The key impacts of uranium mining and milling are summarized in Table 2.2. The details of these impacts are discussed in the following sections.
2.3.1. Waste Generation Both open pit mines and shaft mines create very large quantities of waste rock and tailings. These wastes are major sources of the biophysical impacts of uranium mining.
2.3.1.1. Waste RockWaste rock consists of any rock and overburden (i.e., overlying soil, biota and surface features) removed to permit access to the ore. The amount of waste rock generated depends on the type of mine. In an open pit mine, 40 tonnes of waste rock or more can be generated for every tonne of uranium ore extracted. In an under-ground mine, to access the same amount of ore may generate one tonne of waste rock or less.9 Approximately 75 per cent of Canadian uranium ore is obtained from open pit operations.10 In 2003 the Canadian uranium industry processed 587,000 tonnes of uranium ore,11 suggesting waste rock generation of up to 18 million tonnes. Domestic reactor fuel requirements accounted for approximately 16per cent of total Canadian urani-um production in 2003,12 suggesting associated waste rock production of up to 2.9 million tonnes.
Waste rock may contain both radionuclides (prin-cipally U3O8) and other heavy metals, such as nickel, copper, arsenic, molybdenum, selenium and cad-mium. In addition, waste rock may contain sulphur materials, which will oxidize under weathering and bacterial action, forming sulphur oxides that mix with water to form acids. These acids can dissolve met-als, thus mobilizing uranium and other heavy metals (e.g., copper, arsenic and cadmium) in the waste rock and other locations at the mine site that are harmful to humans and wildlife. The resulting discharges can acidify surface water and groundwater, and contami-nate the water with heavy metals, including radionu-clides. Acid mine drainage can persist for centuries.13
In addition, uranium ore contains radionuclides such as thorium and radium, which are intermediates in the uranium decay chain. One of the decay products of radium is radon gas, which emanates from the rock as radium and thorium decay. As a result, overburden and waste rock storage areas can be sources of releases of radon gas,14 as well as wind blown dust containing radionuclides, heavy metals and particulate matter.
Waste rock is managed at Canadian uranium mines according to its quality. Some of it is consid-
Phase I: Uranium Mining and Milling
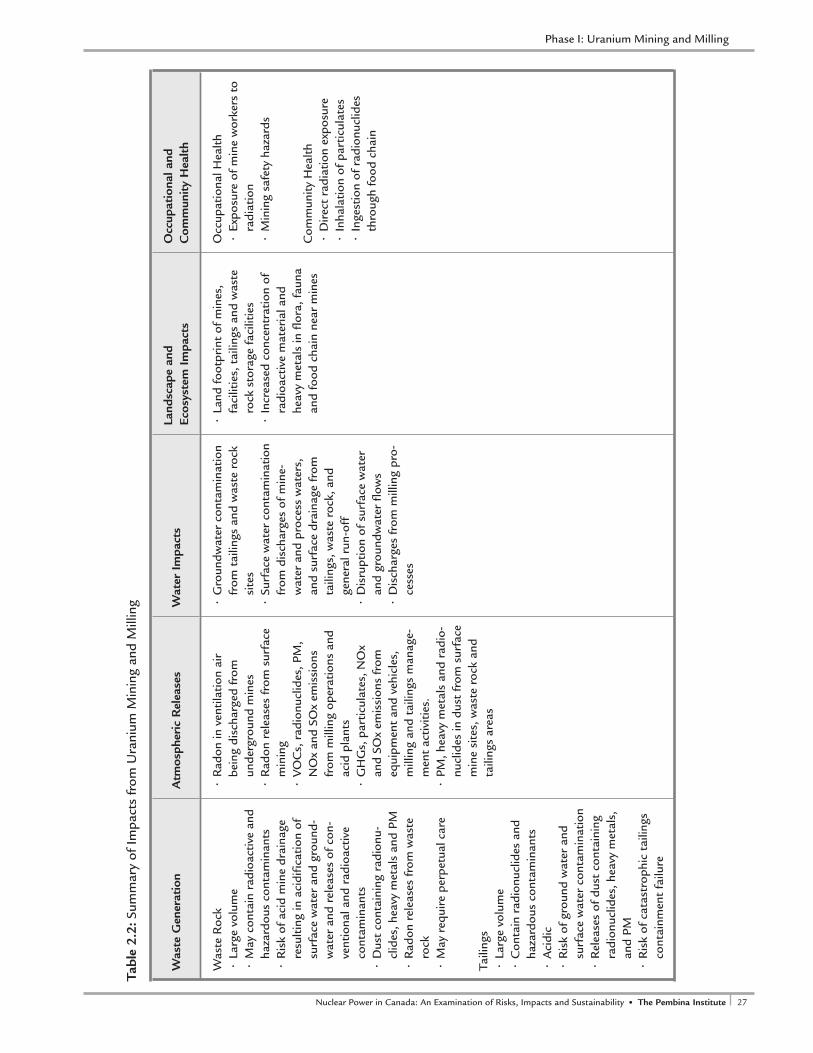
26 The Pembina Institute • Nuclear Power in Canada: An Examination of Risks, Impacts and Sustainability 27Nuclear Power in Canada: An Examination of Risks, Impacts and Sustainability • The Pembina Institute
Was
te G
ener
atio
n A
tmos
pher
ic R
elea
ses
Wat
er I
mpa
cts
Land
scap
e an
d Ec
osys
tem
Im
pact
s O
ccup
atio
nal a
nd
Com
mun
ity
Hea
lth
Was
te R
ock
• La
rge
volu
me
• M
ay c
onta
in r
adio
activ
e an
d ha
zard
ous
cont
amin
ants
•
Ris
k of
aci
d m
ine
drai
nage
re
sulti
ng in
aci
dific
atio
n of
su
rfac
e w
ater
and
gro
und-
wat
er a
nd r
elea
ses
of c
on-
vent
iona
l and
rad
ioac
tive
cont
amin
ants
• D
ust
cont
aini
ng r
adio
nu-
clid
es, h
eavy
met
als
and
PM•
Rad
on r
elea
ses
from
was
te
rock
• M
ay r
equi
re p
erpe
tual
car
e
Taili
ngs
• La
rge
volu
me
• C
onta
in r
adio
nucl
ides
and
ha
zard
ous
cont
amin
ants
• A
cidi
c•
Ris
k of
gro
und
wat
er a
nd
surf
ace
wat
er c
onta
min
atio
n •
Rel
ease
s of
dus
t co
ntai
ning
ra
dion
uclid
es, h
eavy
met
als,
an
d PM
•
Ris
k of
cat
astr
ophi
c ta
iling
s co
ntai
nmen
t fa
ilure
• R
adon
in v
entil
atio
n ai
r be
ing
disc
harg
ed fr
om
unde
rgro
und
min
es•
Rad
on r
elea
ses
from
sur
face
m
inin
g•
VOC
s, r
adio
nucl
ides
, PM
, N
Ox
and
SOx
emis
sion
s fr
om m
illin
g op
erat
ions
and
ac
id p
lant
s•
GH
Gs,
par
ticul
ates
, NO
x an
d SO
x em
issi
ons
from
eq
uipm
ent
and
vehi
cles
, m
illin
g an
d ta
iling
s m
anag
e-m
ent
activ
ities
. •
PM, h
eavy
met
als
and
radi
o-nu
clid
es in
dus
t fr
om s
urfa
ce
min
e si
tes,
was
te r
ock
and
taili
ngs
area
s
• G
roun
dwat
er c
onta
min
atio
n fr
om t
ailin
gs a
nd w
aste
roc
k si
tes
• Su
rfac
e w
ater
con
tam
inat
ion
from
dis
char
ges
of m
ine-
wat
er a
nd p
roce
ss w
ater
s,
and
surf
ace
drai
nage
from
ta
iling
s, w
aste
roc
k, a
nd
gene
ral r
un-o
ff
• D
isru
ptio
n of
sur
face
wat
er
and
grou
ndw
ater
flo
ws
• D
isch
arge
s fr
om m
illin
g pr
o-ce
sses
• La
nd fo
otpr
int
of m
ines
, fa
cilit
ies,
tai
lings
and
was
te
rock
sto
rage
fac
ilitie
s•
Incr
ease
d co
ncen
trat
ion
of
radi
oact
ive
mat
eria
l and
he
avy
met
als
in f
lora
, fau
na
and
food
cha
in n
ear
min
es
Occ
upat
iona
l Hea
lth•
Expo
sure
of m
ine
wor
kers
to
radi
atio
n•
Min
ing
safe
ty h
azar
ds
Com
mun
ity H
ealth
•
Dir
ect
radi
atio
n ex
posu
re•
Inha
latio
n of
par
ticul
ates
• In
gest
ion
of r
adio
nucl
ides
th
roug
h fo
od c
hain
Tabl
e 2.
2: S
umm
ary
of Im
pact
s fr
om U
rani
um M
inin
g an
d M
illin
g
Phase I: Uranium Mining and Milling

28 The Pembina Institute • Nuclear Power in Canada: An Examination of Risks, Impacts and Sustainability 29Nuclear Power in Canada: An Examination of Risks, Impacts and Sustainability • The Pembina Institute
ered “clean waste” (non-acid generating waste, less than 0.03per cent U3O8) and is used for surface work or backfill aggregate. Potentially acid generating waste rock (less than 0.03per cent U3O8) is stored on lined waste pads and disposed of at the bottom of flooded mine pits to prevent it from oxidizing.15 Mineralized waste (greater than 0.03per cent U3O8 but less than 2.0per cent U3O8) is used as blend materials for the milling feed stream.16
As of December 2001, there were 3.7 million tonnes of mineralized waste rock and 105 million tonnes of non-mineralized waste rock in inventory at the McClean Lake, Key Lake, Rabbit Lake, Cluff Lake, McArthur River and Cigar Lake sites.17
2.3.1.2. TailingsOre mined in open pit or underground mines is crushed and leached in a uranium mill, a chemi-cal plant designed to extract uranium from the ore. Tailings are the waste by-product of the milling pro-cess. The amount of tailings produced is proportional to the grade and amount of the ore milled. At a grade of 0.3per cent uranium, for example, 99.7per cent of the material is left over.
Tailings consist of ground rock particles, water, and mill chemicals, and contain radioactive and haz-ardous constituents. Up to 85per cent of the radiologi-cal elements, contained in the uranium ore end up in the tailings.18 The following radionuclides may be present: polonium-210, bismuth-210, lead-210, polo-nium-214, bismuth-214, lead-214, polonium-218, radon-222, radium-226, thorium-230, uranium-234, protactinium-234m, thorium-234, and uranium-238.19 Radium-226 and uranium are considered the most significant radionuclides present in Canadian uranium mill tailings.20
Radon gas will be released from the tailings if the containment area is not constructed properly. Due to the continuous production of radon from the decay of radium-226, which has a half-life of 1,600 years, radon presents a long-term hazard. Further, because the par-ent product of radium-226—thorium-230 (with a half-life of 80,000 years)—is also present, there is con-tinuous production of radium-226. After about one million years, the radioactivity of the tailings and thus its radon emanation will have decreased so that it is only limited by the residual uranium contents, which continuously produce new thorium-230.21
In addition to radionuclides, tailings may contain heavy metals (e.g., arsenic, molybdenum, selenium) and residual mill process chemicals.22 The tailings may also be acidic as a result of the presence of sulphidic
ore or chemicals introduced through milling, with the result that they present a risk of acid drainage to sur-face water and groundwater. Dust from tailings areas may contain radionuclides (e.g., uranium, radon-226 and lead-210, and other decay products), heavy metals (e.g., arsenic), PM and other contaminants.23
Both the radioactive and chemically hazardous materials contained in uranium mill tailings need to be managed for an indefinite amount of time, with the radioactive material carrying risks that are more long term. As a result, tailings containment areas are con-sidered perpetual environmental hazards.24
At all of the newer operations in Saskatchewan, tailings are managed in mined-out pits converted to TMFs, which use hydraulic containment during oper-ation. The pits are maintained in a partially dewatered state relative to the surrounding natural water table so that all groundwater flow is towards the TMF. Currently active TMFs are the Deilmann TMF at Key Lake operation, the Rabbit Lake In-Pit TMF at Rabbit Lake operation, and the Jeb TMF at McClean Lake operation.
The TMFs have treatment facilities that receive contaminated water feeds, remove dissolved metals, radionuclides and suspended solids, and discharge the treated water to a Treated Effluent Management System (TEMS).25 The sludge produced is pumped directly to the tailings preparation circuit in the mill and disposed of in the TMF. The TEMS also receives clean groundwater from dewatering facilities at the TMF. The effluent from the TEMS is discharged into nearby water bodies.
Specific information on the contents and quanti-ties of tailings being generated by Canadian uranium mining operations was sought from the relevant gov-ernment agencies and individual facility managers, without success. Transfers for materials to tailings facilities are not reported by uranium mining compa-nies to the NPRI. Natural Resources Canada reports that, in 2003, the Canadian uranium mining industry processed 587,000 tonnes of uranium ore, with an average grade of 18 kg of uranium per tonne (1.8per cent),26 suggesting tailings production in excess of 575,000 tonnes. Domestic reactor fuel requirements accounted for approximately 16 per cent of total Canadian uranium production in 2003,27 suggesting the production of approximately 92,000 tonnes of tailings to fuel Canadian reactor operations in that year. The processing of lower grade ores would result in the generation of proportionally larger amounts of tailings, as larger amounts of ore would have to be processed to produce the same amount of uranium concentrate. Processing of ore that is 0.01% uranium,
Phase I: Uranium Mining and Milling
28 The Pembina Institute • Nuclear Power in Canada: An Examination of Risks, Impacts and Sustainability 29Nuclear Power in Canada: An Examination of Risks, Impacts and Sustainability • The Pembina Institute
for example, would generate approximately ten times the tailings of ore that is 0.1% uranium.
As of December 2003, there were 213 million tonnes of uranium mill tailings in storage at 24 tail-ings sites across Canada. This is enough material to fill the Toronto Rogers Centre (formerly the Sky-Dome) approximately 100 times.28
The majority of these tailings are located at inactive or decommissioned operations in Ontario (82.8per cent), the last of which was closed in 1996. A small portion (0.5per cent) is located in the Northwest Ter-ritories at one decommissioned (1984) and another inactive (1959) operation. The remaining portion is located at active, inactive and decommissioned opera-tions in Saskatchewan (16.7per cent).29
2.3.2. Atmospheric Releases Atmospheric releases of contaminants arise from many sources during the uranium mining and milling process. Dusts containing radionuclides, heavy metals and PM can be released from underground ventilation systems, waste rock and tailings storage areas, surface mining operations and milling operations. Radon gas may also be released from these sources. Milling operations produce releases of NOx, VOCs, CO2 and
PM. Acid plants producing acid for milling operations release large amounts of SO2. The combustion of fos-sil fuels to operate equipment and vehicles for earth moving, transportation, heat and steam production and electricity supply generates releases of criteria air pollutants and GHGs.
2.3.2.1. RadionuclidesRadon gas is released as radium and thorium decay as part of the uranium decay chain. For underground mines, the release of radon has been estimated to be between 1 and 2,000 GBq/t of U3O8 produced, with a production average of 300 GBq/t.33 Ventilation sys-tems for underground mines have been identified as the leading source of radon emissions from uranium mining operations. Active open pit operations also produce significant atmospheric releases of radon.34 Releases from mills have been estimated to be 13 GBq/t of U3O8 produced.35 Additional releases of radon occur from waste rock, tailings and ore storage areas.
Normal background radon concentrations in Sas-katchewan are considered to be in the range of 37 Bq/m3 to 74 Bq/m3.36
The Saskatchewan Environment Cumulative Envi-ronmental Monitoring program monitors radon levels
Uranium Mine Tailings Management FailuresUranium tailings management in the 1950s and 1960s was considered similar to other non-radioactive tailings management. The poor understanding of radiological and toxicological risks was clearly demonstrated by such practices as the use of uranium tailings as a building material in nearby cities.
Historical tailings practice exclusive to Canada included the disposal of tailings directly into deep lakes without controls or treatment. This includes the deep discharge from Port Radium (Northwest Territories) into Great Bear Lake, from Gunnar mill into Mudford Lake, and from Beaverlodge mill into Fookes/Marie Lakes. This practice is no longer permitted. In other cases, tailings were either disposed of as backfill in underground mines or placed in natural containment areas such as lakes and valleys and confined by permeable or water-retaining dams. Surface tailings were left bare or covered with soil and vegetated or flooded.15
As tailings management awareness grew, the complexity of tailings management increased as well. Tailings containment facilities were engineered and built, however, these were not without their own problems. Emissions of radioactive and non-radioactive substances occurred by several mechanisms: radon emanation, dust dispersal, and leaching into surface water and groundwater. Tailings discharges to water can occur when bottom-liners are absent and drainage waters are not collected from TMFs (dams and structures), or where these structures fail.30
Examples of uranium mill tailings containment failures include dispersal of radioactive dust (Colorado, Germany, Hungary, Bulgaria, Kyrgyzstan, Australia, Kazakhstan), erosion of tailings containment (Australia, Germany), seepage through floors/walls (Hungary, Germany, Kyrgyzstan), effluent discharge (Rabbit Lake, Saskatchewan and Elliott Lake, Ontario, where effluent discharge resulted in significant radiological contamination and acidification of the 300 km2 Quirke Lake) 31 and tailings dam overflows (Key Lake, Saskatchewan, 1984).32
Phase I: Uranium Mining and Milling
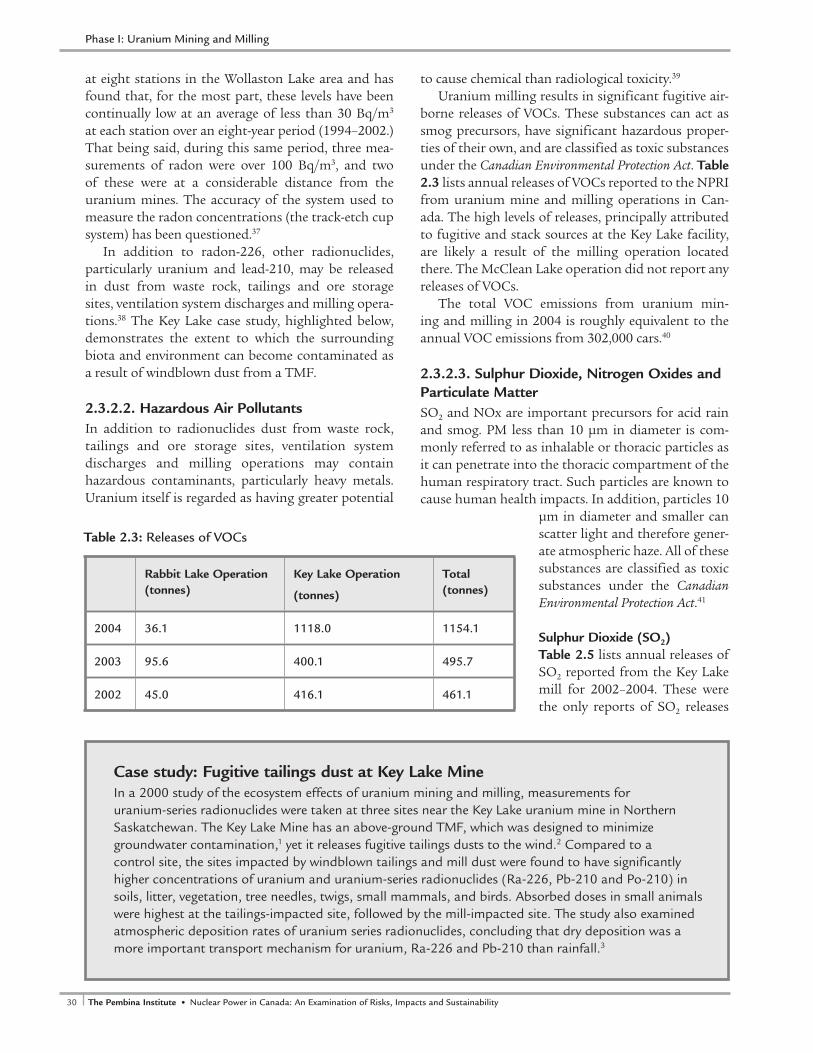
30 The Pembina Institute • Nuclear Power in Canada: An Examination of Risks, Impacts and Sustainability 31Nuclear Power in Canada: An Examination of Risks, Impacts and Sustainability • The Pembina Institute
at eight stations in the Wollaston Lake area and has found that, for the most part, these levels have been continually low at an average of less than 30 Bq/m3 at each station over an eight-year period (1994–2002.) That being said, during this same period, three mea-surements of radon were over 100 Bq/m3, and two of these were at a considerable distance from the uranium mines. The accuracy of the system used to measure the radon concentrations (the track-etch cup system) has been questioned.37
In addition to radon-226, other radionuclides, particularly uranium and lead-210, may be released in dust from waste rock, tailings and ore storage sites, ventilation system discharges and milling opera-tions.38 The Key Lake case study, highlighted below, demonstrates the extent to which the surrounding biota and environment can become contaminated as a result of windblown dust from a TMF.
2.3.2.2. Hazardous Air PollutantsIn addition to radionuclides dust from waste rock, tailings and ore storage sites, ventilation system discharges and milling operations may contain hazardous contaminants, particularly heavy metals. Uranium itself is regarded as having greater potential
to cause chemical than radiological toxicity.39
Uranium milling results in significant fugitive air-borne releases of VOCs. These substances can act as smog precursors, have significant hazardous proper-ties of their own, and are classified as toxic substances under the Canadian Environmental Protection Act. Table 2.3 lists annual releases of VOCs reported to the NPRI from uranium mine and milling operations in Can-ada. The high levels of releases, principally attributed to fugitive and stack sources at the Key Lake facility, are likely a result of the milling operation located there. The McClean Lake operation did not report any releases of VOCs.
The total VOC emissions from uranium min-ing and milling in 2004 is roughly equivalent to the annual VOC emissions from 302,000 cars.40
2.3.2.3. Sulphur Dioxide, Nitrogen Oxides and Particulate Matter SO2 and NOx are important precursors for acid rain and smog. PM less than 10 µm in diameter is com-monly referred to as inhalable or thoracic particles as it can penetrate into the thoracic compartment of the human respiratory tract. Such particles are known to cause human health impacts. In addition, particles 10
µm in diameter and smaller can scatter light and therefore gener-ate atmospheric haze. All of these substances are classified as toxic substances under the Canadian Environmental Protection Act.41
Sulphur Dioxide (SO2)Table 2.5 lists annual releases of SO2 reported from the Key Lake mill for 2002–2004. These were the only reports of SO2 releases
Case study: Fugitive tailings dust at Key Lake MineIn a 2000 study of the ecosystem effects of uranium mining and milling, measurements for uranium-series radionuclides were taken at three sites near the Key Lake uranium mine in Northern Saskatchewan. The Key Lake Mine has an above-ground TMF, which was designed to minimize groundwater contamination,1 yet it releases fugitive tailings dusts to the wind.2 Compared to a control site, the sites impacted by windblown tailings and mill dust were found to have significantly higher concentrations of uranium and uranium-series radionuclides (Ra-226, Pb-210 and Po-210) in soils, litter, vegetation, tree needles, twigs, small mammals, and birds. Absorbed doses in small animals were highest at the tailings-impacted site, followed by the mill-impacted site. The study also examined atmospheric deposition rates of uranium series radionuclides, concluding that dry deposition was a more important transport mechanism for uranium, Ra-226 and Pb-210 than rainfall.3
Rabbit Lake Operation (tonnes)
Key Lake Operation
(tonnes)
Total (tonnes)
2004 36.1 1118.0 1154.1
2003 95.6 400.1 495.7
2002 45.0 416.1 461.1
Table 2.3: Releases of VOCs
Phase I: Uranium Mining and Milling
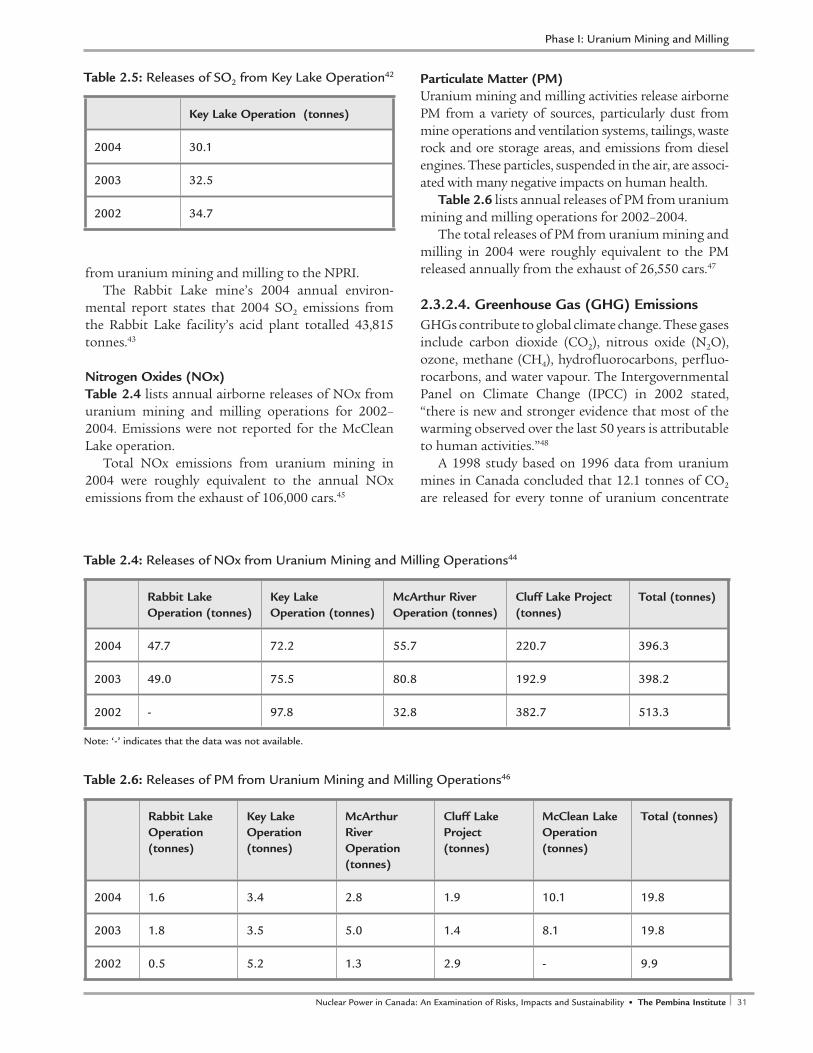
30 The Pembina Institute • Nuclear Power in Canada: An Examination of Risks, Impacts and Sustainability 31Nuclear Power in Canada: An Examination of Risks, Impacts and Sustainability • The Pembina Institute
from uranium mining and milling to the NPRI. The Rabbit Lake mine’s 2004 annual environ-
mental report states that 2004 SO2 emissions from the Rabbit Lake facility’s acid plant totalled 43,815 tonnes.43
Nitrogen Oxides (NOx)Table 2.4 lists annual airborne releases of NOx from uranium mining and milling operations for 2002–2004. Emissions were not reported for the McClean Lake operation.
Total NOx emissions from uranium mining in 2004 were roughly equivalent to the annual NOx emissions from the exhaust of 106,000 cars.45
Particulate Matter (PM)Uranium mining and milling activities release airborne PM from a variety of sources, particularly dust from mine operations and ventilation systems, tailings, waste rock and ore storage areas, and emissions from diesel engines. These particles, suspended in the air, are associ-ated with many negative impacts on human health.
Table 2.6 lists annual releases of PM from uranium mining and milling operations for 2002–2004.
The total releases of PM from uranium mining and milling in 2004 were roughly equivalent to the PM released annually from the exhaust of 26,550 cars.47
2.3.2.4. Greenhouse Gas (GHG) EmissionsGHGs contribute to global climate change. These gases include carbon dioxide (CO2), nitrous oxide (N2O), ozone, methane (CH4), hydrofluorocarbons, perfluo-rocarbons, and water vapour. The Intergovernmental Panel on Climate Change (IPCC) in 2002 stated, “there is new and stronger evidence that most of the warming observed over the last 50 years is attributable to human activities.”48
A 1998 study based on 1996 data from uranium mines in Canada concluded that 12.1 tonnes of CO2 are released for every tonne of uranium concentrate
Key Lake Operation (tonnes)
2004 30.1
2003 32.5
2002 34.7
Table 2.5: Releases of SO2 from Key Lake Operation42
Rabbit Lake Operation (tonnes)
Key Lake Operation (tonnes)
McArthur River Operation (tonnes)
Cluff Lake Project(tonnes)
Total (tonnes)
2004 47.7 72.2 55.7 220.7 396.3
2003 49.0 75.5 80.8 192.9 398.2
2002 - 97.8 32.8 382.7 513.3
Table 2.4: Releases of NOx from Uranium Mining and Milling Operations44
Note: ‘-’ indicates that the data was not available.
Rabbit Lake Operation(tonnes)
Key Lake Operation(tonnes)
McArthur River Operation(tonnes)
Cluff Lake Project(tonnes)
McClean Lake Operation(tonnes)
Total (tonnes)
2004 1.6 3.4 2.8 1.9 10.1 19.8
2003 1.8 3.5 5.0 1.4 8.1 19.8
2002 0.5 5.2 1.3 2.9 - 9.9
Table 2.6: Releases of PM from Uranium Mining and Milling Operations46
Phase I: Uranium Mining and Milling
32 The Pembina Institute • Nuclear Power in Canada: An Examination of Risks, Impacts and Sustainability 33Nuclear Power in Canada: An Examination of Risks, Impacts and Sustainability • The Pembina Institute
produced. This figure was based on the fact that cer-tain mines obtain power from nearby hydropower dams, while others are too remote and must rely on on-site diesel generation. If all of the power consumed at these mines had been generated via fossil fuels (die-sel), this figure would increase to 20.7 tonnes of CO2 for every tonne of uranium concentrate produced. 49
During the milling process, there are additional CO2 releases from acid leaching of the ore, which con-tains carbonate, and the use of lime, which is used to neutralize the tailings. In total, milling releases an additional 3.2 tonnes of CO2 for every tonne of ura-nium concentrate produced.50 These estimates do not appear to include the emissions associated with the transportation of ore 80 km by truck from the McAr-thur River mine to the Key Lake site for milling.51
On the basis of these estimates the 10.5 kilotonnes of uranium concentrate produced by Canadian ura-nium mines and mills in 2003 would have resulted in the release of between 160 and 250 kilotonnes of CO2.52 This is roughly equivalent to the annual GHG emissions from 71,495 cars driving an average of 15,000 km /year.53 The mining and milling of lower grade ores would require larger energy inputs as a larger volume of ore needs to be mined and processed to produce the same amount of uranium concentrate. The result is proportionally higher levels of emissions of greenhouse gases and other pollutants.54
2.2.3. Water ImpactsUranium mining and milling releases contaminants to groundwater and surface water through discharges of process and mine waters, leaching from TMFs and waste rock storage sites, and general run-off from mine sites. Releases can include radioactive conventional pollutants (e.g., total suspended solids) and hazardous pollutants (e.g., heavy metals), as well as acid drainage. Mining and milling operations can also disrupt surface water and groundwater features and flows.
In 2004 Health Canada and Environment Canada concluded that “releases of uranium and uranium compounds contained in effluent from uranium mines and mills are entering the environment in quantities or concentrations or under conditions that have or may have a harmful immediate or long-term effect on the environment or its biological diversity” and are therefore “toxic” as defined in s. 64 of the Canadian Environmental Protection Act, 1999.55
2.2.3.1 Groundwater ContaminationGroundwater contamination can occur as a result of leachate seeping into the ground from waste rock or TMFs. The tailings may be acidic as a result of the presence of sulphidic ore or chemicals introduced through milling, with the result that they present a risk of acid drainage to surface water and groundwa-
Case Study: Groundwater Quality Impacts at Cluff Lake Mine The Cluff Lake project is the first modern uranium mine decommissioning project in Canada. The mine opened in 1980 and had accumulated 3.28 million tonnes1 of tailings by the time it closed in 2002. The tailings are stored in an above-ground facility behind a dam.
Groundwater chemistry was monitored and compared to baseline (unimpacted) data as part of the Environmental Assessment for the Cluff Lake Mine decommissioning project. Adverse groundwater quality has been measured from releases of leachate from the tailings management area (TMA), backfill materials and waste rock piles. Decommissioning of the pits and mining areas is expected to have fur-ther impacts, as hydraulic containment (i.e., pumping) in these areas will no longer be used.
Groundwater in areas near the decommissioned TMA at Cluff Lake Mine was found to have elevated concentrations of major ions (potassium, magnesium, bicarbonate, chloride, calcium, sodium, sulphate) ranging from 10 to 200 times the levels in unimpacted groundwater, respectively. Concentrations of arsenic, cobalt, iron, lead, manganese, molybdenum, nickel, radionuclides Pb-210, Po-210 and Ra-226, uranium and vanadium were also found to be elevated from baseline data.2
Groundwater near the mine areas and waste rock storage facilities at Cluff Lake Mine was found to have significantly higher concentrations of major ions (chloride, potassium, calcium, sodium, magne-sium) than were found in unimpacted groundwater. The concentrations ranged from 4.5 times higher (chloride) to 135 times higher (magnesium). The sulphate concentration of groundwater near the facili-ties was 1,450 times higher than that of unimpacted groundwater. Concentrations of arsenic, copper, lead, manganese, molybdenum, nickel and zinc were also found to be elevated from baseline data, with arsenic concentrations 66 times higher, manganese 1,100 times higher, and nickel 1,250 times higher.2
Phase I: Uranium Mining and Milling
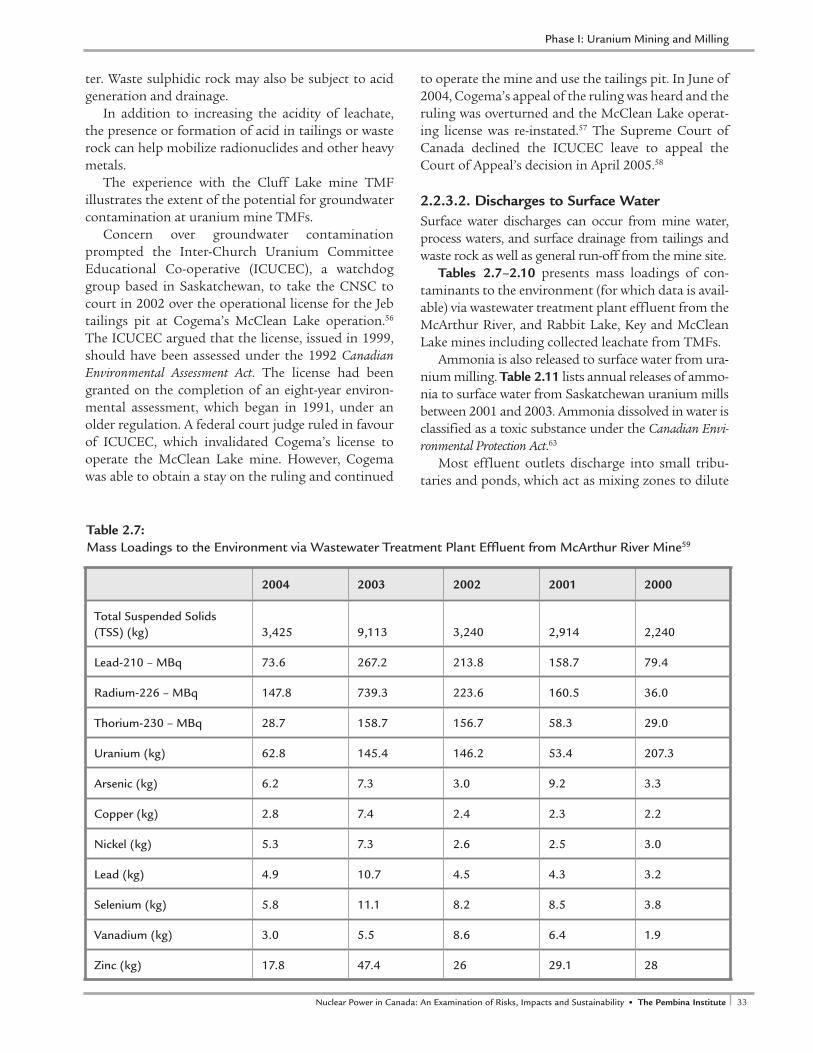
32 The Pembina Institute • Nuclear Power in Canada: An Examination of Risks, Impacts and Sustainability 33Nuclear Power in Canada: An Examination of Risks, Impacts and Sustainability • The Pembina Institute
ter. Waste sulphidic rock may also be subject to acid generation and drainage.
In addition to increasing the acidity of leachate, the presence or formation of acid in tailings or waste rock can help mobilize radionuclides and other heavy metals.
The experience with the Cluff Lake mine TMF illustrates the extent of the potential for groundwater contamination at uranium mine TMFs.
Concern over groundwater contamination prompted the Inter-Church Uranium Committee Educational Co-operative (ICUCEC), a watchdog group based in Saskatchewan, to take the CNSC to court in 2002 over the operational license for the Jeb tailings pit at Cogema’s McClean Lake operation.56 The ICUCEC argued that the license, issued in 1999, should have been assessed under the 1992 Canadian Environmental Assessment Act. The license had been granted on the completion of an eight-year environ-mental assessment, which began in 1991, under an older regulation. A federal court judge ruled in favour of ICUCEC, which invalidated Cogema’s license to operate the McClean Lake mine. However, Cogema was able to obtain a stay on the ruling and continued
to operate the mine and use the tailings pit. In June of 2004, Cogema’s appeal of the ruling was heard and the ruling was overturned and the McClean Lake operat-ing license was re-instated.57 The Supreme Court of Canada declined the ICUCEC leave to appeal the Court of Appeal’s decision in April 2005.58
2.2.3.2. Discharges to Surface WaterSurface water discharges can occur from mine water, process waters, and surface drainage from tailings and waste rock as well as general run-off from the mine site.
Tables 2.7–2.10 presents mass loadings of con-taminants to the environment (for which data is avail-able) via wastewater treatment plant effluent from the McArthur River, and Rabbit Lake, Key and McClean Lake mines including collected leachate from TMFs.
Ammonia is also released to surface water from ura-nium milling. Table 2.11 lists annual releases of ammo-nia to surface water from Saskatchewan uranium mills between 2001 and 2003. Ammonia dissolved in water is classified as a toxic substance under the Canadian Envi-ronmental Protection Act.63
Most effluent outlets discharge into small tribu-taries and ponds, which act as mixing zones to dilute
2004 2003 2002 2001 2000
Total Suspended Solids (TSS) (kg) 3,425 9,113 3,240 2,914 2,240
Lead-210 – MBq 73.6 267.2 213.8 158.7 79.4
Radium-226 – MBq 147.8 739.3 223.6 160.5 36.0
Thorium-230 – MBq 28.7 158.7 156.7 58.3 29.0
Uranium (kg) 62.8 145.4 146.2 53.4 207.3
Arsenic (kg) 6.2 7.3 3.0 9.2 3.3
Copper (kg) 2.8 7.4 2.4 2.3 2.2
Nickel (kg) 5.3 7.3 2.6 2.5 3.0
Lead (kg) 4.9 10.7 4.5 4.3 3.2
Selenium (kg) 5.8 11.1 8.2 8.5 3.8
Vanadium (kg) 3.0 5.5 8.6 6.4 1.9
Zinc (kg) 17.8 47.4 26 29.1 28
Table 2.7: Mass Loadings to the Environment via Wastewater Treatment Plant Effluent from McArthur River Mine59
Phase I: Uranium Mining and Milling
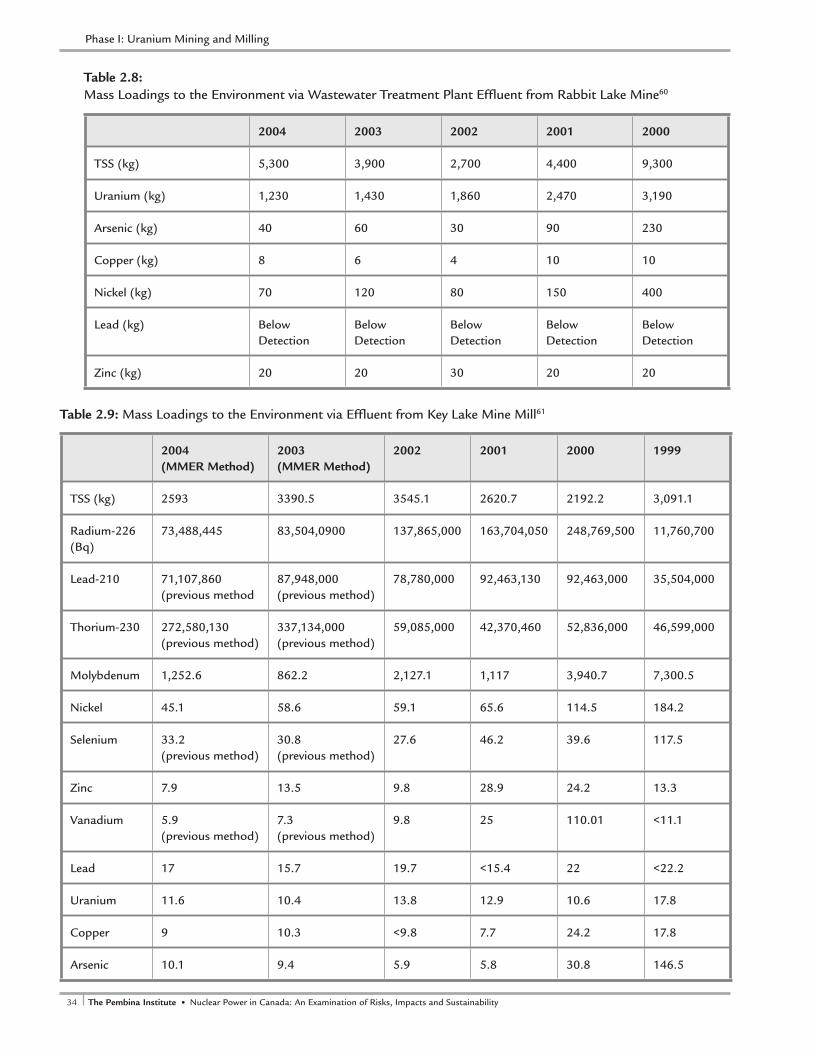
34 The Pembina Institute • Nuclear Power in Canada: An Examination of Risks, Impacts and Sustainability 35Nuclear Power in Canada: An Examination of Risks, Impacts and Sustainability • The Pembina Institute
2004 2003 2002 2001 2000
TSS (kg) 5,300 3,900 2,700 4,400 9,300
Uranium (kg) 1,230 1,430 1,860 2,470 3,190
Arsenic (kg) 40 60 30 90 230
Copper (kg) 8 6 4 10 10
Nickel (kg) 70 120 80 150 400
Lead (kg) Below Detection
Below Detection
Below Detection
Below Detection
Below Detection
Zinc (kg) 20 20 30 20 20
Table 2.8: Mass Loadings to the Environment via Wastewater Treatment Plant Effluent from Rabbit Lake Mine60
2004 (MMER Method)
2003 (MMER Method)
2002 2001 2000 1999
TSS (kg) 2593 3390.5 3545.1 2620.7 2192.2 3,091.1
Radium-226 (Bq)
73,488,445 83,504,0900 137,865,000 163,704,050 248,769,500 11,760,700
Lead-210 71,107,860 (previous method
87,948,000 (previous method)
78,780,000 92,463,130 92,463,000 35,504,000
Thorium-230 272,580,130 (previous method)
337,134,000 (previous method)
59,085,000 42,370,460 52,836,000 46,599,000
Molybdenum 1,252.6 862.2 2,127.1 1,117 3,940.7 7,300.5
Nickel 45.1 58.6 59.1 65.6 114.5 184.2
Selenium 33.2 (previous method)
30.8 (previous method)
27.6 46.2 39.6 117.5
Zinc 7.9 13.5 9.8 28.9 24.2 13.3
Vanadium 5.9 (previous method)
7.3 (previous method)
9.8 25 110.01 <11.1
Lead 17 15.7 19.7 <15.4 22 <22.2
Uranium 11.6 10.4 13.8 12.9 10.6 17.8
Copper 9 10.3 <9.8 7.7 24.2 17.8
Arsenic 10.1 9.4 5.9 5.8 30.8 146.5
Table 2.9: Mass Loadings to the Environment via Effluent from Key Lake Mine Mill61
Phase I: Uranium Mining and Milling
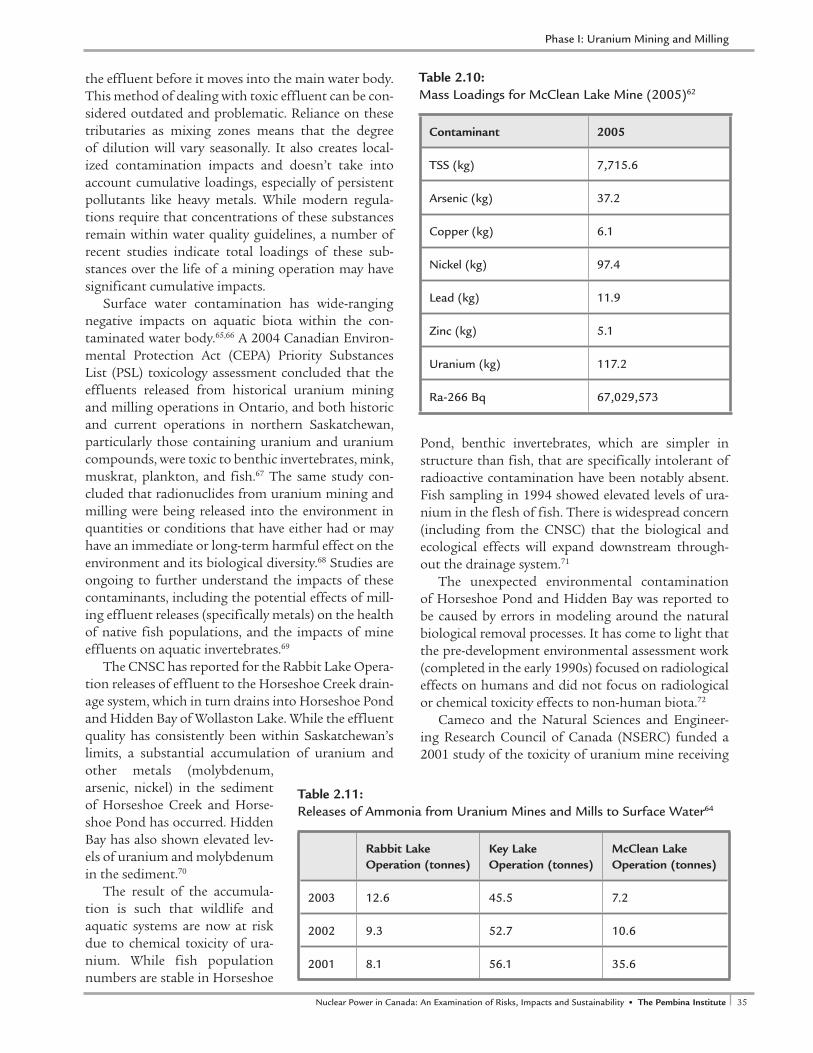
34 The Pembina Institute • Nuclear Power in Canada: An Examination of Risks, Impacts and Sustainability 35Nuclear Power in Canada: An Examination of Risks, Impacts and Sustainability • The Pembina Institute
the effluent before it moves into the main water body. This method of dealing with toxic effluent can be con-sidered outdated and problematic. Reliance on these tributaries as mixing zones means that the degree of dilution will vary seasonally. It also creates local-ized contamination impacts and doesn’t take into account cumulative loadings, especially of persistent pollutants like heavy metals. While modern regula-tions require that concentrations of these substances remain within water quality guidelines, a number of recent studies indicate total loadings of these sub-stances over the life of a mining operation may have significant cumulative impacts.
Surface water contamination has wide-ranging negative impacts on aquatic biota within the con-taminated water body.65,66 A 2004 Canadian Environ-mental Protection Act (CEPA) Priority Substances List (PSL) toxicology assessment concluded that the effluents released from historical uranium mining and milling operations in Ontario, and both historic and current operations in northern Saskatchewan, particularly those containing uranium and uranium compounds, were toxic to benthic invertebrates, mink, muskrat, plankton, and fish.67 The same study con-cluded that radionuclides from uranium mining and milling were being released into the environment in quantities or conditions that have either had or may have an immediate or long-term harmful effect on the environment and its biological diversity.68 Studies are ongoing to further understand the impacts of these contaminants, including the potential effects of mill-ing effluent releases (specifically metals) on the health of native fish populations, and the impacts of mine effluents on aquatic invertebrates.69
The CNSC has reported for the Rabbit Lake Opera-tion releases of effluent to the Horseshoe Creek drain-age system, which in turn drains into Horseshoe Pond and Hidden Bay of Wollaston Lake. While the effluent quality has consistently been within Saskatchewan’s limits, a substantial accumulation of uranium and other metals (molybdenum, arsenic, nickel) in the sediment of Horseshoe Creek and Horse-shoe Pond has occurred. Hidden Bay has also shown elevated lev-els of uranium and molybdenum in the sediment.70
The result of the accumula-tion is such that wildlife and aquatic systems are now at risk due to chemical toxicity of ura-nium. While fish population numbers are stable in Horseshoe
Pond, benthic invertebrates, which are simpler in structure than fish, that are specifically intolerant of radioactive contamination have been notably absent. Fish sampling in 1994 showed elevated levels of ura-nium in the flesh of fish. There is widespread concern (including from the CNSC) that the biological and ecological effects will expand downstream through-out the drainage system.71
The unexpected environmental contamination of Horseshoe Pond and Hidden Bay was reported to be caused by errors in modeling around the natural biological removal processes. It has come to light that the pre-development environmental assessment work (completed in the early 1990s) focused on radiological effects on humans and did not focus on radiological or chemical toxicity effects to non-human biota.72
Cameco and the Natural Sciences and Engineer-ing Research Council of Canada (NSERC) funded a 2001 study of the toxicity of uranium mine receiving
Contaminant 2005
TSS (kg) 7,715.6
Arsenic (kg) 37.2
Copper (kg) 6.1
Nickel (kg) 97.4
Lead (kg) 11.9
Zinc (kg) 5.1
Uranium (kg) 117.2
Ra-266 Bq 67,029,573
Table 2.10: Mass Loadings for McClean Lake Mine (2005)62
Rabbit Lake Operation (tonnes)
Key Lake Operation (tonnes)
McClean Lake Operation (tonnes)
2003 12.6 45.5 7.2
2002 9.3 52.7 10.6
2001 8.1 56.1 35.6
Table 2.11: Releases of Ammonia from Uranium Mines and Mills to Surface Water64
Phase I: Uranium Mining and Milling
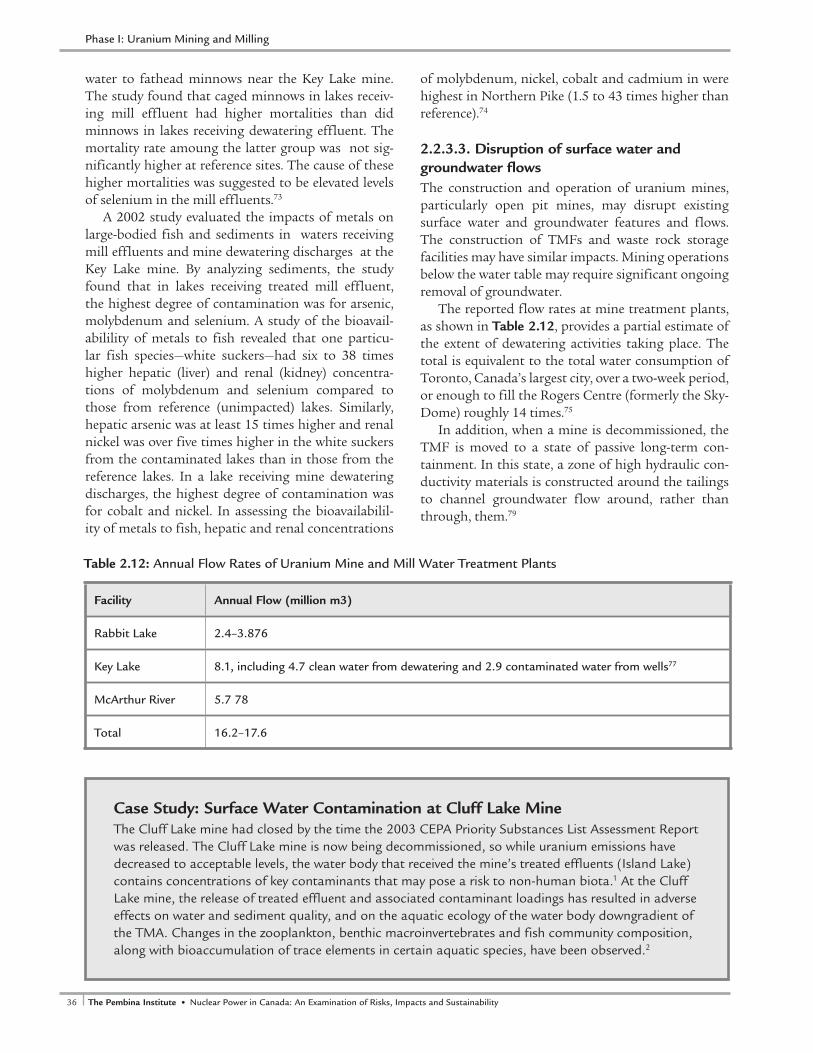
36 The Pembina Institute • Nuclear Power in Canada: An Examination of Risks, Impacts and Sustainability 37Nuclear Power in Canada: An Examination of Risks, Impacts and Sustainability • The Pembina Institute
water to fathead minnows near the Key Lake mine. The study found that caged minnows in lakes receiv-ing mill effluent had higher mortalities than did minnows in lakes receiving dewatering effluent. The mortality rate amoung the latter group was not sig-nificantly higher at reference sites. The cause of these higher mortalities was suggested to be elevated levels of selenium in the mill effluents.73
A 2002 study evaluated the impacts of metals on large-bodied fish and sediments in waters receiving mill effluents and mine dewatering discharges at the Key Lake mine. By analyzing sediments, the study found that in lakes receiving treated mill effluent, the highest degree of contamination was for arsenic, molybdenum and selenium. A study of the bioavail-abilility of metals to fish revealed that one particu-lar fish species—white suckers—had six to 38 times higher hepatic (liver) and renal (kidney) concentra-tions of molybdenum and selenium compared to those from reference (unimpacted) lakes. Similarly, hepatic arsenic was at least 15 times higher and renal nickel was over five times higher in the white suckers from the contaminated lakes than in those from the reference lakes. In a lake receiving mine dewatering discharges, the highest degree of contamination was for cobalt and nickel. In assessing the bioavailabilil-ity of metals to fish, hepatic and renal concentrations
of molybdenum, nickel, cobalt and cadmium in were highest in Northern Pike (1.5 to 43 times higher than reference).74
2.2.3.3. Disruption of surface water and groundwater flowsThe construction and operation of uranium mines, particularly open pit mines, may disrupt existing surface water and groundwater features and flows. The construction of TMFs and waste rock storage facilities may have similar impacts. Mining operations below the water table may require significant ongoing removal of groundwater.
The reported flow rates at mine treatment plants, as shown in Table 2.12, provides a partial estimate of the extent of dewatering activities taking place. The total is equivalent to the total water consumption of Toronto, Canada’s largest city, over a two-week period, or enough to fill the Rogers Centre (formerly the Sky-Dome) roughly 14 times.75
In addition, when a mine is decommissioned, the TMF is moved to a state of passive long-term con-tainment. In this state, a zone of high hydraulic con-ductivity materials is constructed around the tailings to channel groundwater flow around, rather than through, them.79
Case Study: Surface Water Contamination at Cluff Lake MineThe Cluff Lake mine had closed by the time the 2003 CEPA Priority Substances List Assessment Report was released. The Cluff Lake mine is now being decommissioned, so while uranium emissions have decreased to acceptable levels, the water body that received the mine’s treated effluents (Island Lake) contains concentrations of key contaminants that may pose a risk to non-human biota.1 At the Cluff Lake mine, the release of treated effluent and associated contaminant loadings has resulted in adverse effects on water and sediment quality, and on the aquatic ecology of the water body downgradient of the TMA. Changes in the zooplankton, benthic macroinvertebrates and fish community composition, along with bioaccumulation of trace elements in certain aquatic species, have been observed.2
Facility Annual Flow (million m3)
Rabbit Lake 2.4–3.876
Key Lake 8.1, including 4.7 clean water from dewatering and 2.9 contaminated water from wells77
McArthur River 5.7 78
Total 16.2–17.6
Table 2.12: Annual Flow Rates of Uranium Mine and Mill Water Treatment Plants
Phase I: Uranium Mining and Milling

36 The Pembina Institute • Nuclear Power in Canada: An Examination of Risks, Impacts and Sustainability 37Nuclear Power in Canada: An Examination of Risks, Impacts and Sustainability • The Pembina Institute
2.3.4 Landscape ImpactsThe land footprint of uranium mines and mill-ing operations can be very large. The land foot-print of uranium mine development includes the tailings and waste rock storage areas, the
mine and mill, and all associated infrastructure. Table 2.13 displays the areas covered under the
surface lease agreements for northern Saskatchewan uranium operations.
The surface lease of the mine represents the largest theoretical area that can be developed by a company. The total in Table 2.13 represents an area equivalent to almost 26,000 football fields. The lease areas do not include the area taken up by access roads and power corridors.
Although a mine may not physically disturb the entire surface lease agreement area, given the poten-tial impacts to the surrounding ecosystems, the actual area of disturbance from a uranium mine can be con-sidered far greater than its surface lease agreement area. These impacts include contamination of the sur-rounding environment and biota (Sections 2.3.2. and 2.3.3.) and disruptions of surface water and ground-
water flows (Section 2.3.3.3) that may extend through-out the affected watersheds. In addition, large areas may be affected by exploration activity before a mine is developed, including line cutting, trenching and the establishment of temporary roads and camps.
2.3.5 Occupational and Community Health Impacts
2.3.5.1. Occupational Health and Safety Historically, radiation exposure levels of uranium mine workers often exceeded the occupational limits set by the mine itself.81 Dust is the main source of radiation exposure in open pit mines and in milling facilities. Radon gas is the primary radiation exposure in underground mines.82
While today uranium mining and milling opera-tions follow mandated radiation exposure limits much more closely, a number of studies link relatively low level radon and radiation exposure to cancers.83,84 The annual effective radiation doses received at Canadian uranium mine and mill sites are summa-rized in Table 2.14.
A 2005 report from the United States National Academy of Sciences presented the findings that even low levels of ionizing radiation are harmful.89
Mine Surface Lease Agreement Areas (ha)
McArthur River 651
Key Lake 3,476
Cigar Lake 984
Rabbit Lake 2,001
McClean Lake 3,677
Cluff Lake 1,631
Midwest Joint Venture 646
Parks Lake (essentially the first Rabbit Lake tailings area, post decommissioning monitoring) 800
Beaverlodge (water quality monitoring stations, post decommissioning monitoring) Not available
TOTAL 13,866
Table 2.13: Surface Lease Agreement Areas for Northern Saskatchewan Uranium Operations80
Land footprintA land footprint is the measure of the total land surface area used by a given facility.
Phase I: Uranium Mining and Milling

38 The Pembina Institute • Nuclear Power in Canada: An Examination of Risks, Impacts and Sustainability 39Nuclear Power in Canada: An Examination of Risks, Impacts and Sustainability • The Pembina Institute
The report also commented on findings from a com-bined analysis of data from nuclear workers designed to increase the sensitivity analysis of exposure studies and provide direct estimates of the effects of long-term low dose radiation. The analyses were found to be “compatible with a range of possibilities, from a reduction of risk at low doses to risks twice those upon which current radiation protection recommen-dations are based.”90
The health impacts of uranium mining have been the subject of over fifty studies globally. Most of these studies find the health impacts to occur over the long term and report levels of lung cancer between two and five times higher in workers who have been exposed to high levels of radon, or exposed over long periods of time to lower levels.91
Between 1995 and 2005, 44 fatalities were attrib-uted to the uranium mining industry in Ontario alone (historical claims) as reported by the Ontario Work-place Safety and Insurance Board. All 44 fatalities were attributed to occupational disease, one-third of which were attributed to the effects of silica exposure.92 Sil-ica is a compound commonly found in uranium ore, which enters the lungs via dust during the mining process.93 Several of the claims were for exposure to solvents, several were for exposure to asbestos, and the remainder were for radiation exposure.94
In addition to radiation exposure risks, mine workers are at risk of injury from dusty or noisy work-places, rockfalls, exposure to chemicals, heavy lifting or repetitive tasks.95 Over the 2000–2005 period, the uranium mining industry in Saskatchewan suffered two occupational fatalities, 403 claims for injuries without time losses and 172 claims with time losses.96
2.3.5.2. Community Health ImpactsReleases of radiation and other contaminants through air and water also have an impact on the surrounding community. The main exposure pathways for radioac-tivity from tailings are direct gamma radiation, inha-lation of radioactive particulates, and ingestion of radionuclides97 through the food chain. While radia-tion has been shown to accumulate in the biota near uranium mines, the impacts of exposure to the health of the surrounding community are highly contested.
Saskatchewan Health does not study the health impacts of uranium mines on communities near the uranium mines due to confounding factors such as radon in homes and cigarette smoking. However, studies have been performed to assess the health of foodstuffs near uranium mines in northern Saskatch-ewan by toxicology researchers at the University of Saskatchewan.98
In one study in this area, tissues from moose and cattle to be consumed as food were collected. The study concluded that moose and human radiation doses in the Wollaston area were two to three times higher than in control areas. 99
Another tissue study from 18 Wollaston caribou concluded that an adult eating 100 g/day of caribou meat would receive annual effective doses of 0.85 mSv/year. Additional eating one liver and ten kidneys per year would double this dose to 1.7 mSv/year. A one-year-old child who consumed only 10per cent of the adult caribou intake would receive more than half the adult dose of radiation. These doses are predomi-nantly from the presence of polonium-210 in the soft tissue. The lichen–caribou–human food chain is con-sidered the most critical food chain in the world for concentrating airborne radionuclides.100
2004 (mSv) 2003 (mSv) 2002 (mSv)
McArthur River
Average effective dose per employee 1.0 1.6 1.4
McClean Lake
Site average effective dose 0.86 1.00 1.03
Rabbit Lake88
Average effective dose 2.41 2.12 1.21
Table 2.14: Annual Effective Radiation Doses at Mine and Mill Sites85,86,87
Phase I: Uranium Mining and Milling
38 The Pembina Institute • Nuclear Power in Canada: An Examination of Risks, Impacts and Sustainability 39Nuclear Power in Canada: An Examination of Risks, Impacts and Sustainability • The Pembina Institute
While the study concluded that consumption of moose did not carry with it significant health risks, the consumption of caribou was found to potentially increase the chance of developing cancer to as high as 0.6per cent over a 70-year lifetime, which is equiva-lent to a rate of six cancers per 1,000 people.101 This far exceeds the US Environmental Protection Agency (EPA) range of acceptable cancer risks of 1 in 10,000 to 1 in 1,000,000.102
The issue of whether radiation risk models cor-rectly estimate risks to human health is a subject of considerable debate. Recently, these debates have questioned whether current models are appropriate for assessing the effects of radioactive substances taken into the body. These models are based on sig-nificant uncertainties, and it has been suggested that the risks posed by radioactive sources inside the body must be judged carefully.103
2.3.6. Mine Closure and Post Closure CareOnce uranium ore reserves are exhausted, the mine, mill and TMF must be decommissioned. Decommissioned mines must be managed in perpetuity to prevent the release of contaminated tailings and waste rock to the surrounding ecosystem and community. Therefore, mine decommissioning is one of the most important steps in the mining and milling process.
Decommissioning consists of removing equip-ment, materials and buildings, remediating, grading, and revegetating surrounding areas, refilling pits and sealing shafts, and preparing the TMF and waste rock management areas for long-term management.104 While remediation is the goal of mine decommis-sioning, it is important to note that sites cannot be returned to their natural state, given the extent of the physical disruption of the landscape that occurs as a result of mining operations, the extent of permanent waste rock and tailings management areas (TMAs), and the presence of long-lived radionuclides and other contaminants at mine sites.
Current practice for the long-term management of TMFs usually involves construction of a zone of high hydraulic conductivity (pervious) material around the tailings, if it does not exist naturally, to channel the groundwater flow around rather than through the tailings.105 The length and type of monitoring required for the decommissioned project will vary from site to site, and is the responsibility of the mine owner/operator. An Environmental Assessment of the project determines the effects and what mitigation needs to occur.106
The management of all decommissioned mines must be considered in perpetuity. The Auditor Gen-eral of Canada has observed that,
In Canada, a “walk-away” solution is not realistic for decommissioning most uranium tailings sites. Long-term storage requires long-term institutional care to monitor and main-tain the containment structures and to control access to, and use of, the land.107
Historically, uranium mines were abandoned without any decommissioning. Prior to the 1980s, uranium mines in northern Saskatchewan were aban-doned with very little closure activities and practically no provisions for public safety, environmental protec-tion, or aesthetics. In the 25 to 50 years since closure, many of the sites have deteriorated through natural degradation and vandalism to the point that they now pose “significant public safety hazards and possible long-term environmental concerns.”108 In 2001, the Saskatchewan Government identified 67 mines that had not been properly decommissioned and were in need of further investigation.109
Of the sites assessed, the Gunnar mine near Uranium City poses the highest risk to environmental and public safety. Since closure of the Gunnar mine in 1964, 4.4 million tonnes of unconfined tailings containing radioactive waste have made their way into Lake Athabasca. The Lorado Mill site was also ranked among the top ten highest risk sites by the same study, as the tailings at this site cover almost 14 hectares and are leaching into two adjacent lakes.110
Federal and provincial governments have had to assume residual responsibility for abandoned ura-nium mine sites where the original producer of the waste or the current owner could not be held respon-sible for the waste, or was unwilling or unable to pay to manage it.111
In 1994, Natural Resources Canada estimated that the total cost for decommissioning uranium tailings sites in Canada may exceed $400 million (in 1994 dollars) and that the federal government’s potential liabilities to meet its residual responsibilities could be in the “tens of millions of dollars.”112
In 2005 the federal and Saskatchewan governments came to a $24 million cost-sharing agreement for the clean-up of abandoned uranium mine sites (primarily the former Gunnar and Lorado mines) near Uranium City in northern Saskatchewan.113
Current requirements for planning for decom-missioning of a mining/milling operation can be
Phase I: Uranium Mining and Milling
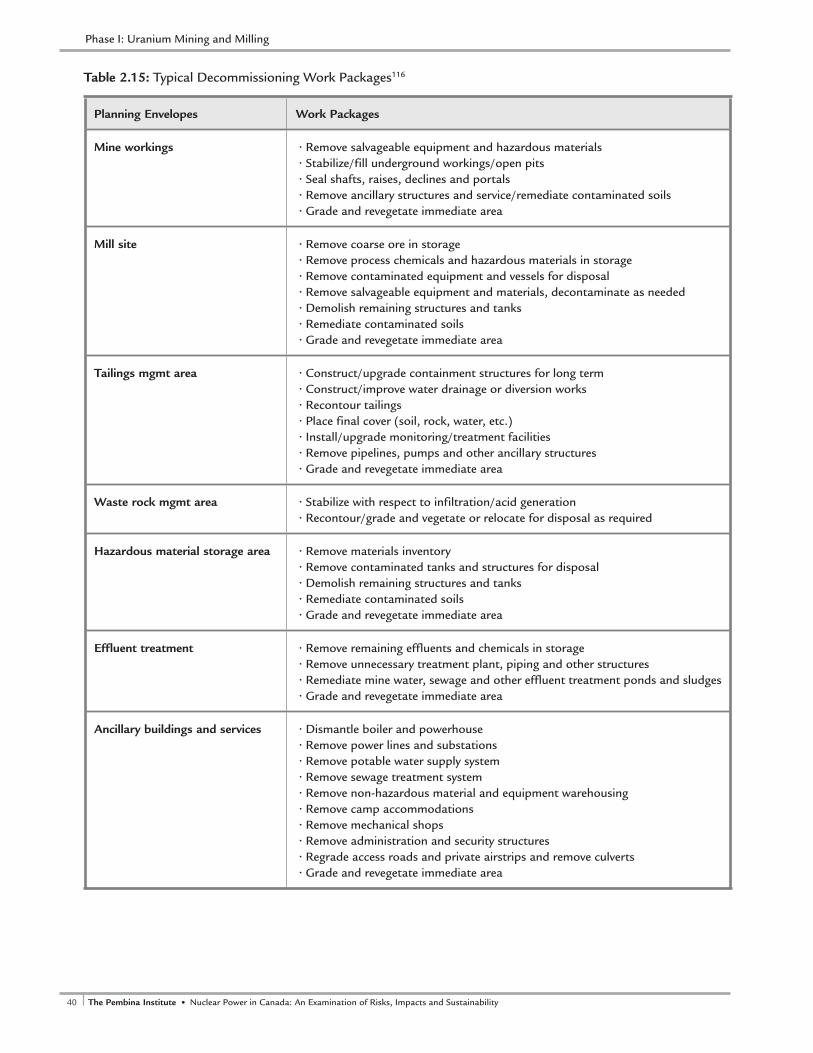
40 The Pembina Institute • Nuclear Power in Canada: An Examination of Risks, Impacts and Sustainability 41Nuclear Power in Canada: An Examination of Risks, Impacts and Sustainability • The Pembina Institute
Planning Envelopes Work Packages
Mine workings • Remove salvageable equipment and hazardous materials• Stabilize/fill underground workings/open pits• Seal shafts, raises, declines and portals• Remove ancillary structures and service/remediate contaminated soils• Grade and revegetate immediate area
Mill site • Remove coarse ore in storage• Remove process chemicals and hazardous materials in storage• Remove contaminated equipment and vessels for disposal• Remove salvageable equipment and materials, decontaminate as needed• Demolish remaining structures and tanks• Remediate contaminated soils• Grade and revegetate immediate area
Tailings mgmt area • Construct/upgrade containment structures for long term• Construct/improve water drainage or diversion works• Recontour tailings• Place final cover (soil, rock, water, etc.)• Install/upgrade monitoring/treatment facilities• Remove pipelines, pumps and other ancillary structures• Grade and revegetate immediate area
Waste rock mgmt area • Stabilize with respect to infiltration/acid generation• Recontour/grade and vegetate or relocate for disposal as required
Hazardous material storage area • Remove materials inventory• Remove contaminated tanks and structures for disposal• Demolish remaining structures and tanks• Remediate contaminated soils• Grade and revegetate immediate area
Effluent treatment • Remove remaining effluents and chemicals in storage• Remove unnecessary treatment plant, piping and other structures• Remediate mine water, sewage and other effluent treatment ponds and sludges• Grade and revegetate immediate area
Ancillary buildings and services • Dismantle boiler and powerhouse• Remove power lines and substations• Remove potable water supply system• Remove sewage treatment system• Remove non-hazardous material and equipment warehousing• Remove camp accommodations• Remove mechanical shops• Remove administration and security structures• Regrade access roads and private airstrips and remove culverts• Grade and revegetate immediate area
Table 2.15: Typical Decommissioning Work Packages116
Phase I: Uranium Mining and Milling
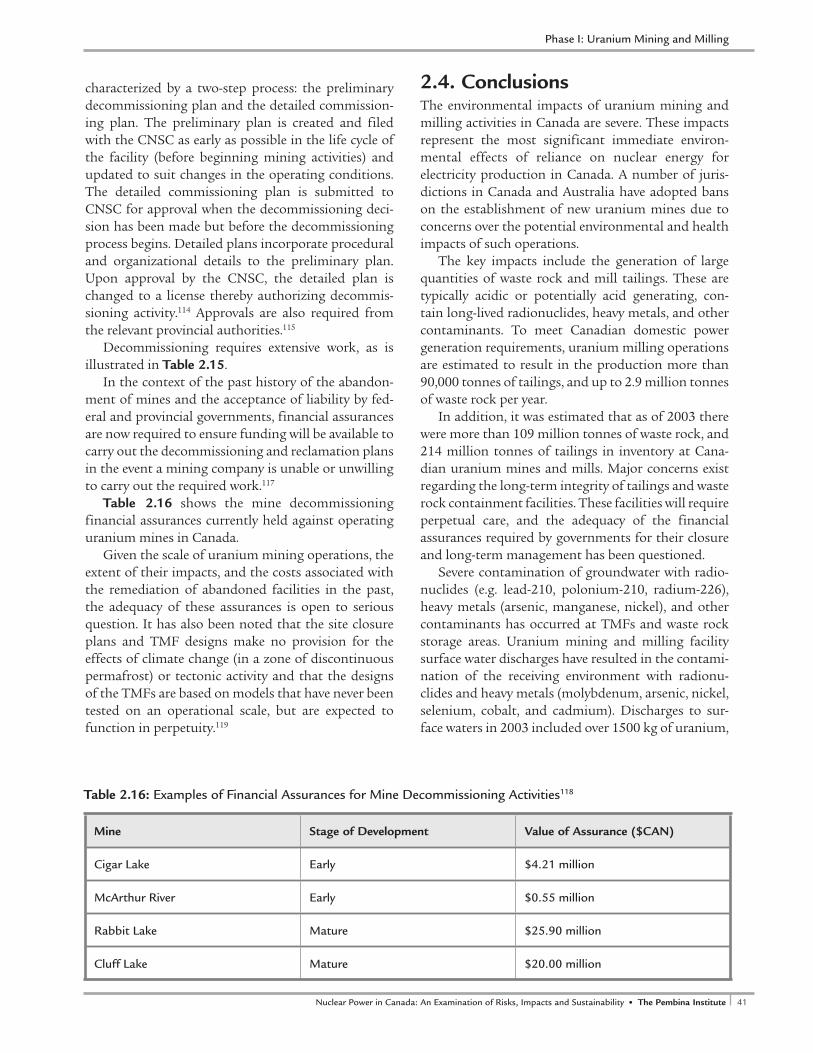
40 The Pembina Institute • Nuclear Power in Canada: An Examination of Risks, Impacts and Sustainability 41Nuclear Power in Canada: An Examination of Risks, Impacts and Sustainability • The Pembina Institute
characterized by a two-step process: the preliminary decommissioning plan and the detailed commission-ing plan. The preliminary plan is created and filed with the CNSC as early as possible in the life cycle of the facility (before beginning mining activities) and updated to suit changes in the operating conditions. The detailed commissioning plan is submitted to CNSC for approval when the decommissioning deci-sion has been made but before the decommissioning process begins. Detailed plans incorporate procedural and organizational details to the preliminary plan. Upon approval by the CNSC, the detailed plan is changed to a license thereby authorizing decommis-sioning activity.114 Approvals are also required from the relevant provincial authorities.115
Decommissioning requires extensive work, as is illustrated in Table 2.15.
In the context of the past history of the abandon-ment of mines and the acceptance of liability by fed-eral and provincial governments, financial assurances are now required to ensure funding will be available to carry out the decommissioning and reclamation plans in the event a mining company is unable or unwilling to carry out the required work.117
Table 2.16 shows the mine decommissioning financial assurances currently held against operating uranium mines in Canada.
Given the scale of uranium mining operations, the extent of their impacts, and the costs associated with the remediation of abandoned facilities in the past, the adequacy of these assurances is open to serious question. It has also been noted that the site closure plans and TMF designs make no provision for the effects of climate change (in a zone of discontinuous permafrost) or tectonic activity and that the designs of the TMFs are based on models that have never been tested on an operational scale, but are expected to function in perpetuity.119
2.4. ConclusionsThe environmental impacts of uranium mining and milling activities in Canada are severe. These impacts represent the most significant immediate environ-mental effects of reliance on nuclear energy for electricity production in Canada. A number of juris-dictions in Canada and Australia have adopted bans on the establishment of new uranium mines due to concerns over the potential environmental and health impacts of such operations.
The key impacts include the generation of large quantities of waste rock and mill tailings. These are typically acidic or potentially acid generating, con-tain long-lived radionuclides, heavy metals, and other contaminants. To meet Canadian domestic power generation requirements, uranium milling operations are estimated to result in the production more than 90,000 tonnes of tailings, and up to 2.9 million tonnes of waste rock per year.
In addition, it was estimated that as of 2003 there were more than 109 million tonnes of waste rock, and 214 million tonnes of tailings in inventory at Cana-dian uranium mines and mills. Major concerns exist regarding the long-term integrity of tailings and waste rock containment facilities. These facilities will require perpetual care, and the adequacy of the financial assurances required by governments for their closure and long-term management has been questioned.
Severe contamination of groundwater with radio-nuclides (e.g. lead-210, polonium-210, radium-226), heavy metals (arsenic, manganese, nickel), and other contaminants has occurred at TMFs and waste rock storage areas. Uranium mining and milling facility surface water discharges have resulted in the contami-nation of the receiving environment with radionu-clides and heavy metals (molybdenum, arsenic, nickel, selenium, cobalt, and cadmium). Discharges to sur-face waters in 2003 included over 1500 kg of uranium,
Mine Stage of Development Value of Assurance ($CAN)
Cigar Lake Early $4.21 million
McArthur River Early $0.55 million
Rabbit Lake Mature $25.90 million
Cluff Lake Mature $20.00 million
Table 2.16: Examples of Financial Assurances for Mine Decommissioning Activities118
Phase I: Uranium Mining and Milling

42 The Pembina Institute • Nuclear Power in Canada: An Examination of Risks, Impacts and Sustainability 43Nuclear Power in Canada: An Examination of Risks, Impacts and Sustainability • The Pembina Institute
860 kg of molybdenum, 70 kg of arsenic, 185 kg of nickel, and 40 kg of selenium. Effluent from historic and operating uranium mines and mills, particularly uranium discharges, have been determined to be toxic for the purposes of the Canadian Environmental Protec-tion Act by Environment Canada and Health Canada.
Extensive dewatering operations (in excess of 16 billion litres per year) are associated with uranium mining in northern Saskatchewan.
Contamination of the surrounding environment and biota with radionuclides (uranium, radium-226, and lead-210) has occurred, particularly via wind-blown dust from tailings facilities and mill dust. A significant potential increase in cancer risk from con-sumption of caribou in the vicinity of uranium mines has been identified as a result.
Major releases of SO2 and VOCs are associated with the milling process. VOC emissions from the Key Lake mill in 2004 were equivalent to the average annual emissions of more than 300,000 cars. Annual releases
of over 43,000 tonnes of SO2 are reported from the Rabbit Lake acid plant.
Atmospheric releases of NOx and PM also occur from milling processes, and the operation of fossil fuel-powered machinery and equipment.
Annual GHG emissions resulting from uranium mining, milling and tailings management activities in Canada are estimated at between 160,000 and 250,000 tonnes of CO2. The use of lower grade ores would result in the generation of proportionally larger amounts of tailings, other wastes and emissions, as larger amounts of ore would have to be processed to produce the same amount of uranium concentrate.
Workers at uranium mines and mills typically receive annual effective radiation doses higher than those considered acceptable to members of the gen-eral public. Increased incidences of lung cancer as well as deaths resulting from silica exposure are reported among uranium miners.
Phase I: Uranium Mining and Milling
42 The Pembina Institute • Nuclear Power in Canada: An Examination of Risks, Impacts and Sustainability 43Nuclear Power in Canada: An Examination of Risks, Impacts and Sustainability • The Pembina Institute
Summary of Findings• The available information on the impacts of uranium refining, conversion and fuel
fabrication is limited.
• The major impacts identified include the following:
• The generation of low and intermediate levels of radioactive wastes associated with fuel production for domestic use in Canada is estimated in the range of 990 tonnes of solid wastes and 9,000 m3 of liquid wastes per year
• The occupational exposure of workers to radiation in refining conversion and particu-larly fuel fabrication stages, although within the range acceptable for nuclear energy workers, exceeds levels that would be considered safe for members of the public.
• Considerable debates exist about the extent of the community health impacts of facilities, particularly in relation to the Port Hope conversion facility, where there is a history of significant contamination of the surrounding community with radionuclides, heavy metals and other contaminants associated with the plant.
• Releases to the air and water of uranium occur from refining and conversion facilities. Releases of other radionuclides may also occur. Total annual releases range between 17 and 60 kg of uranium to the air, and 6.8 kg to surface waters.
• Environment Canada concluded in 2004 that releases of uranium and ionizing radiation from uranium refining and conversion facilities were not toxic to the environment for the purposes of the Canadian Environmental Protection Act. The assessment did not consider human health impacts.
• Releases to the air of lead (approx 10 kg per year) are reported from the Port Hope conversion facility. Releases to the air of persistent organic pollutants, hydrogen fluoride, and criteria air pollutants are reported from refining and conversion facilities as are discharges of ammonia, nitrates and phosphorous to surface waters.
• Atmospheric releases of NOx, PM and GHGs are associated with transportation of uranium from mill sites in northern Saskatchewan to the Blind River refinery, and then on to the Port Hope conversion facility.
• Total GHG emissions associated with uranium refining, conversion and fuel fabrication activities in Canada are estimated at between 80,000 and 116,000 tonnes per year.
3. Phase II: Fuel Processing and Production

44 The Pembina Institute • Nuclear Power in Canada: An Examination of Risks, Impacts and Sustainability 45Nuclear Power in Canada: An Examination of Risks, Impacts and Sustainability • The Pembina Institute
• The production of enriched uranium fuel, for use in light water, rather than CANDU, reactors is associated with much higher greenhouse gas emissions, particularly where gaseous diffusion processes are used to enrich the uranium. Uranium enrichment processes are also associated with higher atmospheric releases of uranium, and generation of depleted uranium (DU) waste streams.
• No refining, conversion or fuel fabrication facilities have been decommissioned to date. Decommissioning would likely result in the generation of large amounts of hazardous and low- and intermediate-level radioactive wastes. The adequacy of the financial assurances provided by facility operators for decommissioning, waste management and long-term care costs has been questioned.
Phase II: Fuel Processing and Production
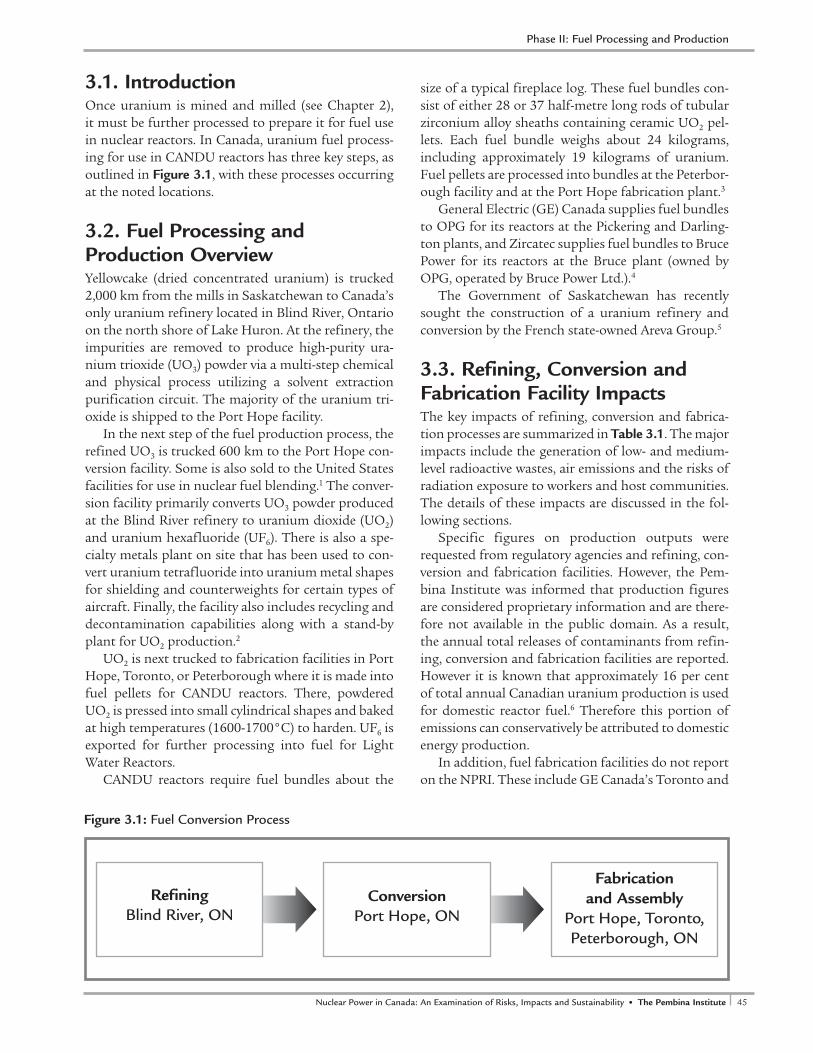
44 The Pembina Institute • Nuclear Power in Canada: An Examination of Risks, Impacts and Sustainability 45Nuclear Power in Canada: An Examination of Risks, Impacts and Sustainability • The Pembina Institute
3.1. Introduction Once uranium is mined and milled (see Chapter 2), it must be further processed to prepare it for fuel use in nuclear reactors. In Canada, uranium fuel process-ing for use in CANDU reactors has three key steps, as outlined in Figure 3.1, with these processes occurring at the noted locations.
3.2. Fuel Processing and Production OverviewYellowcake (dried concentrated uranium) is trucked 2,000 km from the mills in Saskatchewan to Canada’s only uranium refinery located in Blind River, Ontario on the north shore of Lake Huron. At the refinery, the impurities are removed to produce high-purity ura-nium trioxide (UO3) powder via a multi-step chemical and physical process utilizing a solvent extraction purification circuit. The majority of the uranium tri-oxide is shipped to the Port Hope facility.
In the next step of the fuel production process, the refined UO3 is trucked 600 km to the Port Hope con-version facility. Some is also sold to the United States facilities for use in nuclear fuel blending.1 The conver-sion facility primarily converts UO3 powder produced at the Blind River refinery to uranium dioxide (UO2) and uranium hexafluoride (UF6). There is also a spe-cialty metals plant on site that has been used to con-vert uranium tetrafluoride into uranium metal shapes for shielding and counterweights for certain types of aircraft. Finally, the facility also includes recycling and decontamination capabilities along with a stand-by plant for UO2 production.2
UO2 is next trucked to fabrication facilities in Port Hope, Toronto, or Peterborough where it is made into fuel pellets for CANDU reactors. There, powdered UO2 is pressed into small cylindrical shapes and baked at high temperatures (1600-1700°C) to harden. UF6 is exported for further processing into fuel for Light Water Reactors.
CANDU reactors require fuel bundles about the
size of a typical fireplace log. These fuel bundles con-sist of either 28 or 37 half-metre long rods of tubular zirconium alloy sheaths containing ceramic UO2 pel-lets. Each fuel bundle weighs about 24 kilograms, including approximately 19 kilograms of uranium. Fuel pellets are processed into bundles at the Peterbor-ough facility and at the Port Hope fabrication plant.3
General Electric (GE) Canada supplies fuel bundles to OPG for its reactors at the Pickering and Darling-ton plants, and Zircatec supplies fuel bundles to Bruce Power for its reactors at the Bruce plant (owned by OPG, operated by Bruce Power Ltd.).4
The Government of Saskatchewan has recently sought the construction of a uranium refinery and conversion by the French state-owned Areva Group.5
3.3. Refining, Conversion and Fabrication Facility Impacts The key impacts of refining, conversion and fabrica-tion processes are summarized in Table 3.1. The major impacts include the generation of low- and medium-level radioactive wastes, air emissions and the risks of radiation exposure to workers and host communities. The details of these impacts are discussed in the fol-lowing sections.
Specific figures on production outputs were requested from regulatory agencies and refining, con-version and fabrication facilities. However, the Pem-bina Institute was informed that production figures are considered proprietary information and are there-fore not available in the public domain. As a result, the annual total releases of contaminants from refin-ing, conversion and fabrication facilities are reported. However it is known that approximately 16 per cent of total annual Canadian uranium production is used for domestic reactor fuel.6 Therefore this portion of emissions can conservatively be attributed to domestic energy production.
In addition, fuel fabrication facilities do not report on the NPRI. These include GE Canada’s Toronto and
Figure 3.1: Fuel Conversion Process
RefiningBlind River, ON
Fabrication and Assembly
Port Hope, Toronto, Peterborough, ON
ConversionPort Hope, ON
Phase II: Fuel Processing and Production

46 The Pembina Institute • Nuclear Power in Canada: An Examination of Risks, Impacts and Sustainability 47Nuclear Power in Canada: An Examination of Risks, Impacts and Sustainability • The Pembina Institute
Peterborough nuclear fuel fabrication facilities and Cameco’s (Zircatec) Port Hope and Cobourg nuclear fuel fabrication facilities.7 The reasons for non-report-ing are unknown.
The non-coverage of radionuclides by the NPRI also limits the inventory’s usefulness in understanding the extent of releases and transfers of these substances from refining, conversion and fabrication facilities.
3.3.1. Waste GenerationNo specific information on waste generation during the refining, conversion and refining of uranium for fuel purposes in Canada is publicly available. Low-level radioactive wastes known to be generated in these processes in Canada include scrap lumber, pallets, rags, paper, cardboard, rubber and plastic. These wastes are typically incinerated. Other radioac-tive wastes generated include contaminated air filters, fibreglass, polyvinyl chloride (PVC) ductwork, floor sweepings, sandblast sand, insulation, sample bottles, scrap metal, anodes, recyclable scrap metal, radioac-tive drain wastes and contaminated equipment.8
The International Atomic Energy Agency gives the following estimates of the amounts of wastes gener-ated during the processing and production of ura-nium fuel, including processes similar to those used in the preparation of fuel for CANDU reactors.
With 2003 domestic reactor requirements of 1,650 tonnes of uranium,10 these estimates would suggest
990 tonnes of solid wastes, and 9,000 m3 of liquid wastes from fuel production for domestic use.
The only off-site disposal of material reported to the NPRI by refining, conversion and fabrication facilities is the transfer in 2004 of 76 kg of lead to the Port Hope conversion facility, and in 2005 of 2,178 kg of lead to physical treatment off-site.11
It has been reported that, in the production of UO2, an ammonium nitrate by-product solution is pro-duced. The solution is treated to reduce uranium and radium to levels less than 10 mgU/L and 370 mBq/L respectively. The batches of the solution are analysed for uranium, radium and selected heavy metals to ensure compliance with the Atomic Energy Control Board (AECB, now CNSC) limits, and then released to a local agricultural supply company for use as a fertil-izer. It was reported in 1999 that approximately two million litres of solution are transferred every year for this purpose.12 It has been estimated that this quantity of solution would contain up to 20 kg of uranium.13
It is further estimated that 3.5 million cubic metres of historic wastes associated with the Port Hope con-version facility, containing waste uranium, radium and their radioactive decay products, and various heavy metals, still remain within town. It has been sug-gested that another 872,000 cubic metres lie in the area immediately west of Port Hope at Welcome and Port Granby, awaiting a disposal solution. Approximately 200,000 tonnes of radioactive materials were trans-
Waste Generation Atmospheric Releases
Water Impacts Landscape Impacts Occupational and Community Health
• Low-level radio-active waste—all stages
• Release of uranium, heavy metals dioxins and furans, hexachlo-robenzene, ammonia, PM, sulphuric acid, NOx, hydrogen chloride and hydrogen fluoride
• GHGs and other air pollutants released as a result of transportation from mill to pro-cessing facilities and all stages of fuel processing
• Release of uranium, ammonia, nitrates, phosphorus
• Facility land impacts.
• Off-site ecosystem impacts of pollutant releases
• Radiation exposure for workers
• Historical radioactive contamination in Port Hope area
Table 3.1: Key Impacts of Refining, Conversion and Fabrication Processes
Phase II: Fuel Processing and Production
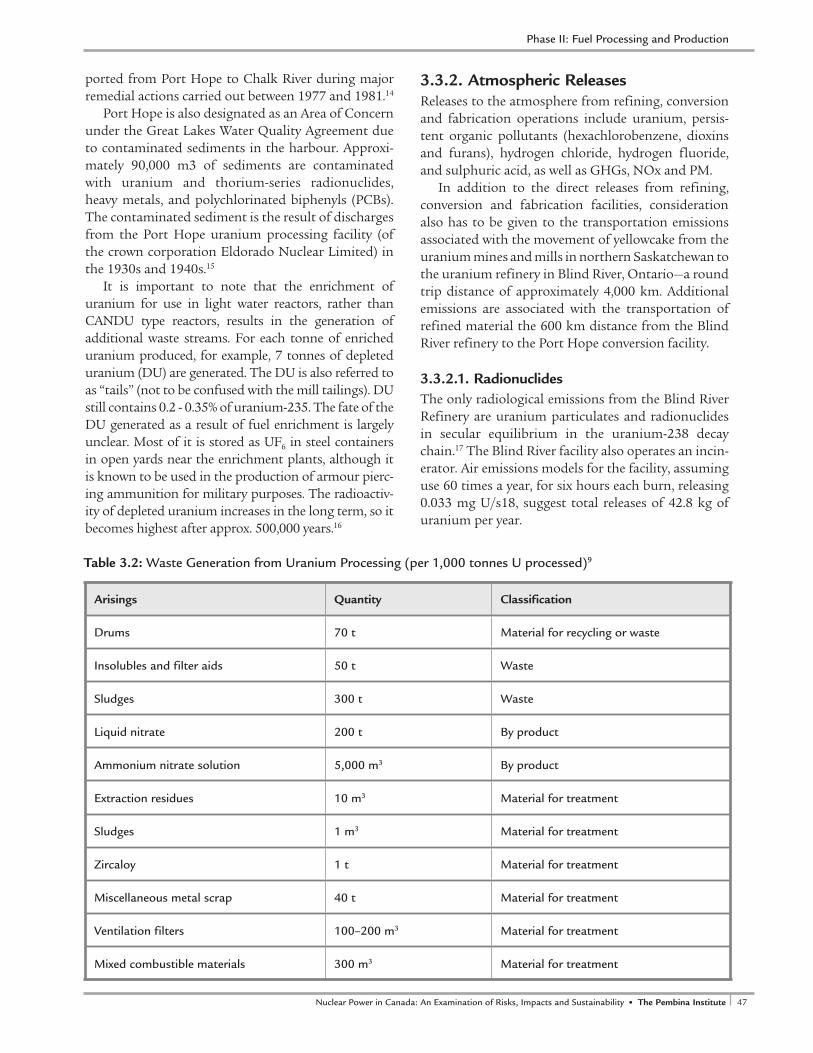
46 The Pembina Institute • Nuclear Power in Canada: An Examination of Risks, Impacts and Sustainability 47Nuclear Power in Canada: An Examination of Risks, Impacts and Sustainability • The Pembina Institute
ported from Port Hope to Chalk River during major remedial actions carried out between 1977 and 1981.14
Port Hope is also designated as an Area of Concern under the Great Lakes Water Quality Agreement due to contaminated sediments in the harbour. Approxi-mately 90,000 m3 of sediments are contaminated with uranium and thorium-series radionuclides, heavy metals, and polychlorinated biphenyls (PCBs). The contaminated sediment is the result of discharges from the Port Hope uranium processing facility (of the crown corporation Eldorado Nuclear Limited) in the 1930s and 1940s.15
It is important to note that the enrichment of uranium for use in light water reactors, rather than CANDU type reactors, results in the generation of additional waste streams. For each tonne of enriched uranium produced, for example, 7 tonnes of depleted uranium (DU) are generated. The DU is also referred to as “tails” (not to be confused with the mill tailings). DU still contains 0.2 - 0.35% of uranium-235. The fate of the DU generated as a result of fuel enrichment is largely unclear. Most of it is stored as UF6 in steel containers in open yards near the enrichment plants, although it is known to be used in the production of armour pierc-ing ammunition for military purposes. The radioactiv-ity of depleted uranium increases in the long term, so it becomes highest after approx. 500,000 years.16
3.3.2. Atmospheric ReleasesReleases to the atmosphere from refining, conversion and fabrication operations include uranium, persis-tent organic pollutants (hexachlorobenzene, dioxins and furans), hydrogen chloride, hydrogen fluoride, and sulphuric acid, as well as GHGs, NOx and PM.
In addition to the direct releases from refining, conversion and fabrication facilities, consideration also has to be given to the transportation emissions associated with the movement of yellowcake from the uranium mines and mills in northern Saskatchewan to the uranium refinery in Blind River, Ontario—a round trip distance of approximately 4,000 km. Additional emissions are associated with the transportation of refined material the 600 km distance from the Blind River refinery to the Port Hope conversion facility.
3.3.2.1. RadionuclidesThe only radiological emissions from the Blind River Refinery are uranium particulates and radionuclides in secular equilibrium in the uranium-238 decay chain.17 The Blind River facility also operates an incin-erator. Air emissions models for the facility, assuming use 60 times a year, for six hours each burn, releasing 0.033 mg U/s18, suggest total releases of 42.8 kg of uranium per year.
Arisings Quantity Classification
Drums 70 t Material for recycling or waste
Insolubles and filter aids 50 t Waste
Sludges 300 t Waste
Liquid nitrate 200 t By product
Ammonium nitrate solution 5,000 m3 By product
Extraction residues 10 m3 Material for treatment
Sludges 1 m3 Material for treatment
Zircaloy 1 t Material for treatment
Miscellaneous metal scrap 40 t Material for treatment
Ventilation filters 100–200 m3 Material for treatment
Mixed combustible materials 300 m3 Material for treatment
Table 3.2: Waste Generation from Uranium Processing (per 1,000 tonnes U processed)9
Phase II: Fuel Processing and Production
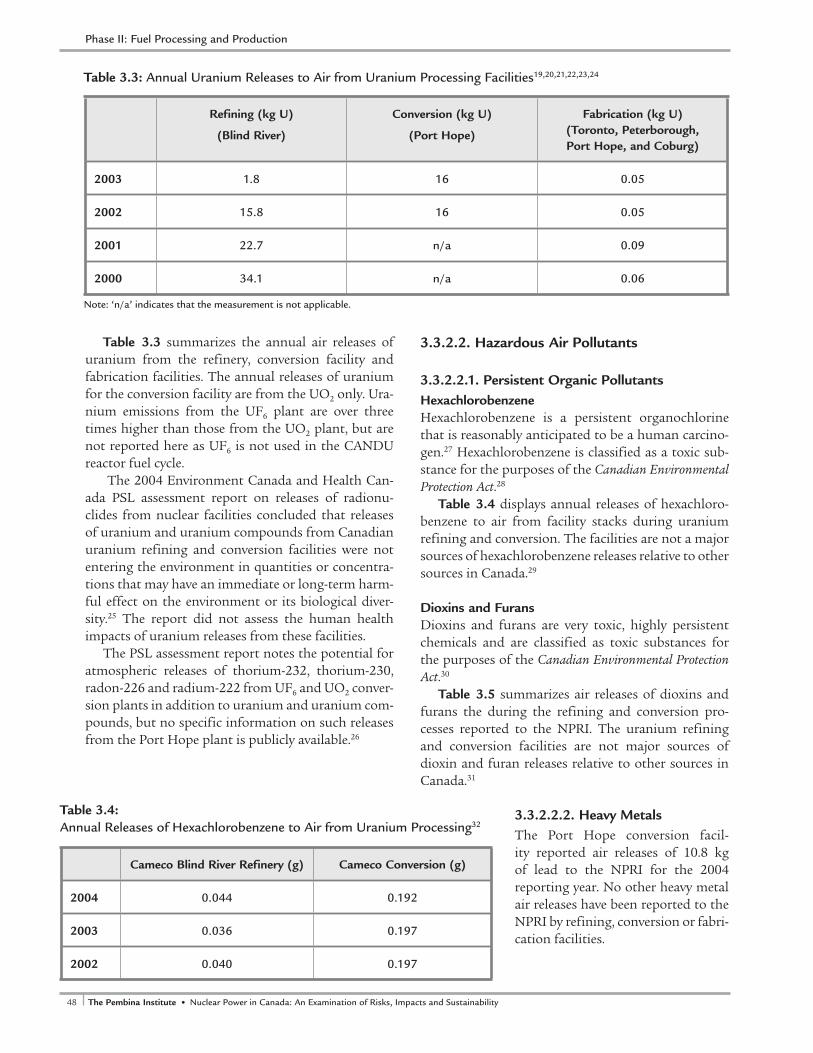
48 The Pembina Institute • Nuclear Power in Canada: An Examination of Risks, Impacts and Sustainability 49Nuclear Power in Canada: An Examination of Risks, Impacts and Sustainability • The Pembina Institute
Table 3.3 summarizes the annual air releases of uranium from the refinery, conversion facility and fabrication facilities. The annual releases of uranium for the conversion facility are from the UO2 only. Ura-nium emissions from the UF6 plant are over three times higher than those from the UO2 plant, but are not reported here as UF6 is not used in the CANDU reactor fuel cycle.
The 2004 Environment Canada and Health Can-ada PSL assessment report on releases of radionu-clides from nuclear facilities concluded that releases of uranium and uranium compounds from Canadian uranium refining and conversion facilities were not entering the environment in quantities or concentra-tions that may have an immediate or long-term harm-ful effect on the environment or its biological diver-sity.25 The report did not assess the human health impacts of uranium releases from these facilities.
The PSL assessment report notes the potential for atmospheric releases of thorium-232, thorium-230, radon-226 and radium-222 from UF6 and UO2 conver-sion plants in addition to uranium and uranium com-pounds, but no specific information on such releases from the Port Hope plant is publicly available.26
3.3.2.2. Hazardous Air Pollutants
3.3.2.2.1. Persistent Organic PollutantsHexachlorobenzeneHexachlorobenzene is a persistent organochlorine that is reasonably anticipated to be a human carcino-gen.27 Hexachlorobenzene is classified as a toxic sub-stance for the purposes of the Canadian Environmental Protection Act.28
Table 3.4 displays annual releases of hexachloro-benzene to air from facility stacks during uranium refining and conversion. The facilities are not a major sources of hexachlorobenzene releases relative to other sources in Canada.29
Dioxins and FuransDioxins and furans are very toxic, highly persistent chemicals and are classified as toxic substances for the purposes of the Canadian Environmental Protection Act.30
Table 3.5 summarizes air releases of dioxins and furans the during the refining and conversion pro-cesses reported to the NPRI. The uranium refining and conversion facilities are not major sources of dioxin and furan releases relative to other sources in Canada.31
3.3.2.2.2. Heavy MetalsThe Port Hope conversion facil-ity reported air releases of 10.8 kg of lead to the NPRI for the 2004 reporting year. No other heavy metal air releases have been reported to the NPRI by refining, conversion or fabri-cation facilities.
Refining (kg U)
(Blind River)
Conversion (kg U)
(Port Hope)
Fabrication (kg U) (Toronto, Peterborough, Port Hope, and Coburg)
2003 1.8 16 0.05
2002 15.8 16 0.05
2001 22.7 n/a 0.09
2000 34.1 n/a 0.06
Note: ‘n/a’ indicates that the measurement is not applicable.
Table 3.3: Annual Uranium Releases to Air from Uranium Processing Facilities19,20,21,22,23,24
Cameco Blind River Refinery (g) Cameco Conversion (g)
2004 0.044 0.192
2003 0.036 0.197
2002 0.040 0.197
Table 3.4: Annual Releases of Hexachlorobenzene to Air from Uranium Processing32
Phase II: Fuel Processing and Production
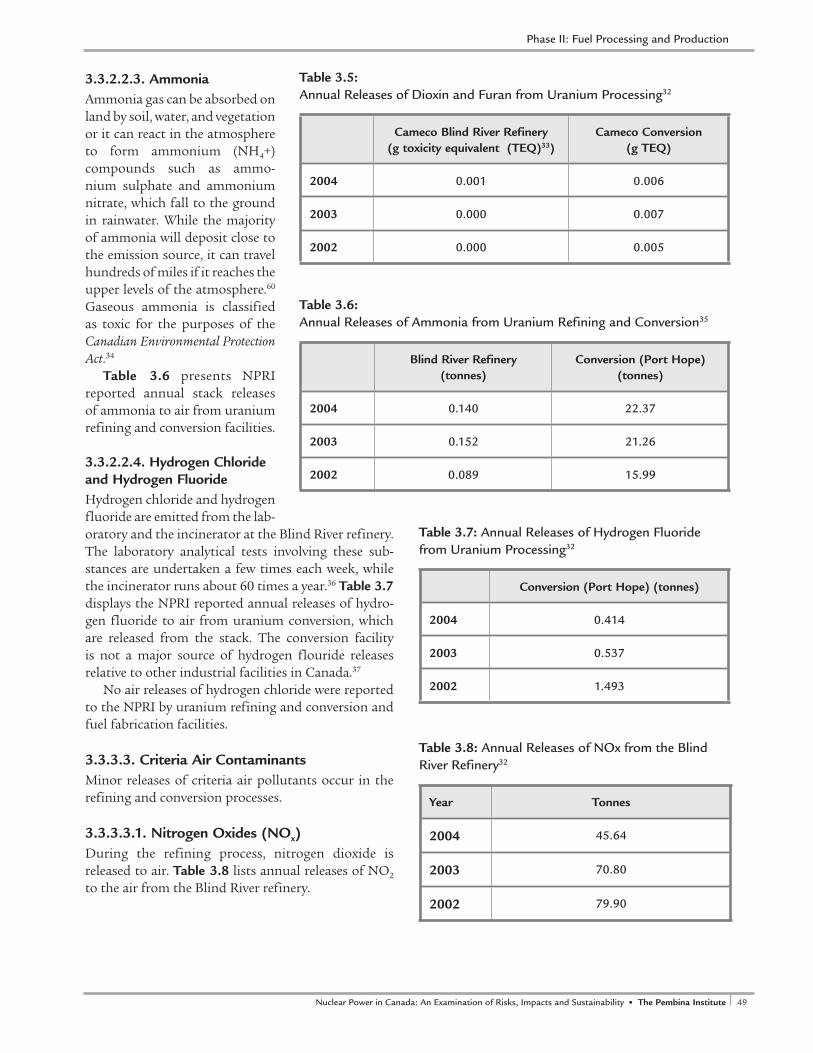
48 The Pembina Institute • Nuclear Power in Canada: An Examination of Risks, Impacts and Sustainability 49Nuclear Power in Canada: An Examination of Risks, Impacts and Sustainability • The Pembina Institute
3.3.2.2.3. Ammonia Ammonia gas can be absorbed on land by soil, water, and vegetation or it can react in the atmosphere to form ammonium (NH4+) compounds such as ammo-nium sulphate and ammonium nitrate, which fall to the ground in rainwater. While the majority of ammonia will deposit close to the emission source, it can travel hundreds of miles if it reaches the upper levels of the atmosphere.60 Gaseous ammonia is classified as toxic for the purposes of the Canadian Environmental Protection Act.34
Table 3.6 presents NPRI reported annual stack releases of ammonia to air from uranium refining and conversion facilities.
3.3.2.2.4. Hydrogen Chloride and Hydrogen FluorideHydrogen chloride and hydrogen fluoride are emitted from the lab-oratory and the incinerator at the Blind River refinery. The laboratory analytical tests involving these sub-stances are undertaken a few times each week, while the incinerator runs about 60 times a year.36 Table 3.7 displays the NPRI reported annual releases of hydro-gen fluoride to air from uranium conversion, which are released from the stack. The conversion facility is not a major source of hydrogen flouride releases relative to other industrial facilities in Canada.37
No air releases of hydrogen chloride were reported to the NPRI by uranium refining and conversion and fuel fabrication facilities.
3.3.3.3. Criteria Air ContaminantsMinor releases of criteria air pollutants occur in the refining and conversion processes.
3.3.3.3.1. Nitrogen Oxides (NOx)During the refining process, nitrogen dioxide is released to air. Table 3.8 lists annual releases of NO2 to the air from the Blind River refinery.
Cameco Blind River Refinery(g toxicity equivalent (TEQ)33)
Cameco Conversion(g TEQ)
2004 0.001 0.006
2003 0.000 0.007
2002 0.000 0.005
Table 3.5: Annual Releases of Dioxin and Furan from Uranium Processing32
Blind River Refinery(tonnes)
Conversion (Port Hope)(tonnes)
2004 0.140 22.37
2003 0.152 21.26
2002 0.089 15.99
Table 3.6: Annual Releases of Ammonia from Uranium Refining and Conversion35
Conversion (Port Hope) (tonnes)
2004 0.414
2003 0.537
2002 1.493
Table 3.7: Annual Releases of Hydrogen Fluoride from Uranium Processing32
Year Tonnes
2004 45.64
2003 70.80
2002 79.90
Table 3.8: Annual Releases of NOx from the Blind River Refinery32
Phase II: Fuel Processing and Production

50 The Pembina Institute • Nuclear Power in Canada: An Examination of Risks, Impacts and Sustainability 51Nuclear Power in Canada: An Examination of Risks, Impacts and Sustainability • The Pembina Institute
3.3.3.3.2. Particulate Matter (PM)PM is a byproduct of both the refining process and the conversion process. Table 3.9 lists annual quantities of PM released to the air from uranium processing facilities.
3.3.3.3.3. Sulphuric AcidSulphuric acid gas emissions (normally formed in the atmosphere from SO2 emissions) can dissolve in water droplets and can be carried long distances by prevailing winds. The resulting water droplets are consequently acidic and fall to the ground as rainfall, fog, snow and other forms of precipitation where they are absorbed into soil and damage plants.40 The Port Hope conver-sion facility had reported to the NPRI sulphuric acid releases to the air as summarized in Table 3.10.
In 2004, sulphuric acid emissions to air were reported as 0.174 tonnes as stack releases and 0.015
tonnes as fugitive releases. In 2003 and 2002, sulphuric acid emissions were reported entirely as fugitive releases.
3.3.2.4. Greenhouse GasesGHGs are produced at all points in uranium production: refining, conversion and fabrication.
Fossil fuel inputs to the Blind River refinery are primarily natu-ral gas but also include small
amounts of fuel oil, propane and gasoline, primarily to generate steam. In total, 1.33–2.80 units of CO2 have been estimated to be released for every unit of uranium processed (i.e., 2.8 tonnes CO2 per tonne of uranium), depending on the fuel source for electricity generation. Organic solvents are also used in the pro-cess and contribute to CO2 emissions at 0.04 units per unit uranium.41
At the Port Hope conversion facility, electricity, natural gas, fuel oil, propane and gasoline are the major energy sources. In total, 2.80–4.84 units of CO2 have been estimated to be released for every unit of uranium processed, depending on how the electricity was generated.42
Based on data from fabrication facilities in Ontario, the production of 1,775 tonnes of uranium required 500,000 m3 of natural gas and 14,500 terawatt hours (TWh) of electricity.43 This resulted in the production of 2.65 units of CO2 per unit of uranium fabricated.44
Cumulatively, uranium refining, processing and fuel fabrication releases 6.8–10.3 units of CO2 per unit of uranium processed on a mass basis. On the basis of total primary production in 2003 of 10,455 tonnes of uranium produced,45 and presumably processed, total releases would be in the range of 71,094–107,687 tonnes CO2.
It is important to note that the production of enriched uranium fuel, for use in light water, rather than CANDU, reactors is associated with much higher greenhouse gas emissions particularly where gaseous diffusion processes are used to enrich the uranium.46
3.3.2.6. Transportation-related ReleasesGiven the long distance between the uranium mines and mills in northern Saskatchewan and the uranium refinery in Blind River, Ontario, air emissions resulting from trucking the unrefined
Conversion (Port Hope)(tonnes)
2004 0.19
2003 0.22
2002 0.21
Table 3.10: Annual Releases of Sulphuric Acid from Uranium Processing Facilities32
GHGs(tonnes CO2)48
NOx(tonnes)49
PM(tonnes)50
Total 8,516 64.86 1.85
Table 3.11: Transportation related emissions – uranium refining, conversion and fuel fabrication
Refining (Blind River) (tonnes)
Conversion (Port Hope)(tonnes)
Total (tonnes)
2004 0.93 3.96 4.89
2003 1.06 4.83 5.93
2002 1.10 4.12 5.22
Table 3.9: Annual Releases of PM from Uranium Processing Facilities38,39
Phase II: Fuel Processing and Production
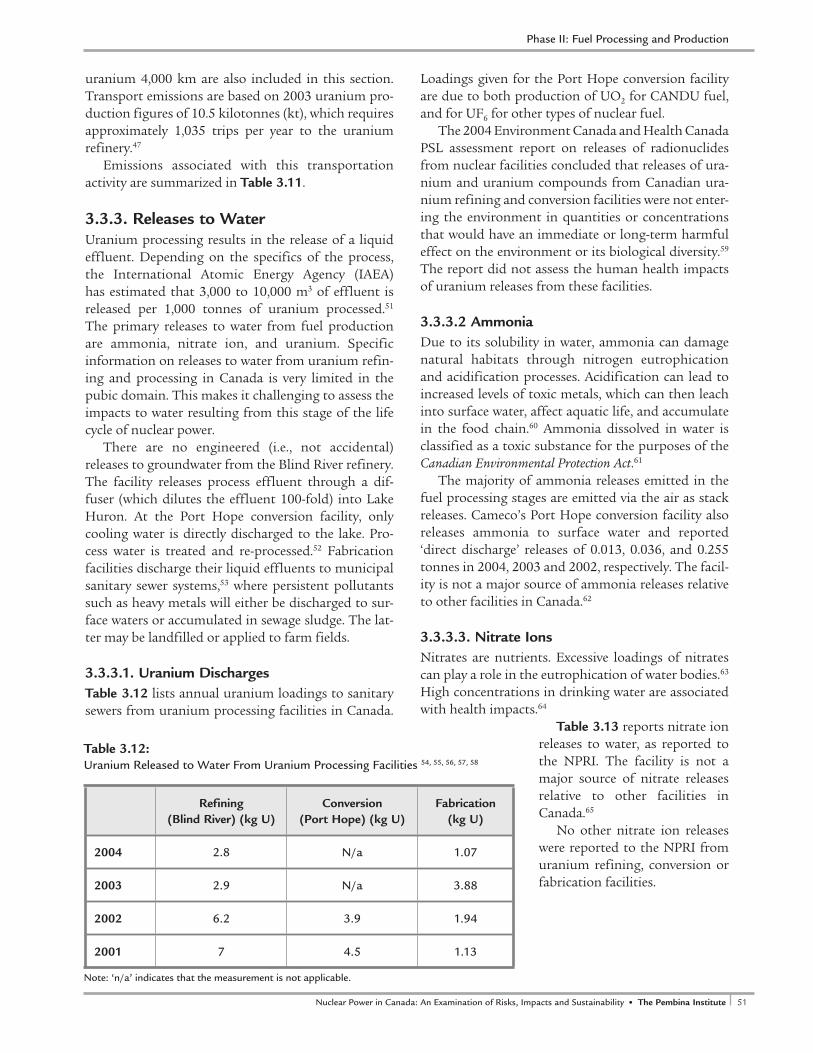
50 The Pembina Institute • Nuclear Power in Canada: An Examination of Risks, Impacts and Sustainability 51Nuclear Power in Canada: An Examination of Risks, Impacts and Sustainability • The Pembina Institute
uranium 4,000 km are also included in this section. Transport emissions are based on 2003 uranium pro-duction figures of 10.5 kilotonnes (kt), which requires approximately 1,035 trips per year to the uranium refinery.47
Emissions associated with this transportation activity are summarized in Table 3.11.
3.3.3. Releases to WaterUranium processing results in the release of a liquid effluent. Depending on the specifics of the process, the International Atomic Energy Agency (IAEA) has estimated that 3,000 to 10,000 m3 of effluent is released per 1,000 tonnes of uranium processed.51 The primary releases to water from fuel production are ammonia, nitrate ion, and uranium. Specific information on releases to water from uranium refin-ing and processing in Canada is very limited in the pubic domain. This makes it challenging to assess the impacts to water resulting from this stage of the life cycle of nuclear power.
There are no engineered (i.e., not accidental) releases to groundwater from the Blind River refinery. The facility releases process effluent through a dif-fuser (which dilutes the effluent 100-fold) into Lake Huron. At the Port Hope conversion facility, only cooling water is directly discharged to the lake. Pro-cess water is treated and re-processed.52 Fabrication facilities discharge their liquid effluents to municipal sanitary sewer systems,53 where persistent pollutants such as heavy metals will either be discharged to sur-face waters or accumulated in sewage sludge. The lat-ter may be landfilled or applied to farm fields.
3.3.3.1. Uranium DischargesTable 3.12 lists annual uranium loadings to sanitary sewers from uranium processing facilities in Canada.
Loadings given for the Port Hope conversion facility are due to both production of UO2 for CANDU fuel, and for UF6 for other types of nuclear fuel.
The 2004 Environment Canada and Health Canada PSL assessment report on releases of radionuclides from nuclear facilities concluded that releases of ura-nium and uranium compounds from Canadian ura-nium refining and conversion facilities were not enter-ing the environment in quantities or concentrations that would have an immediate or long-term harmful effect on the environment or its biological diversity.59 The report did not assess the human health impacts of uranium releases from these facilities.
3.3.3.2 AmmoniaDue to its solubility in water, ammonia can damage natural habitats through nitrogen eutrophication and acidification processes. Acidification can lead to increased levels of toxic metals, which can then leach into surface water, affect aquatic life, and accumulate in the food chain.60 Ammonia dissolved in water is classified as a toxic substance for the purposes of the Canadian Environmental Protection Act.61
The majority of ammonia releases emitted in the fuel processing stages are emitted via the air as stack releases. Cameco’s Port Hope conversion facility also releases ammonia to surface water and reported ‘direct discharge’ releases of 0.013, 0.036, and 0.255 tonnes in 2004, 2003 and 2002, respectively. The facil-ity is not a major source of ammonia releases relative to other facilities in Canada.62
3.3.3.3. Nitrate Ions Nitrates are nutrients. Excessive loadings of nitrates can play a role in the eutrophication of water bodies.63 High concentrations in drinking water are associated with health impacts.64
Table 3.13 reports nitrate ion releases to water, as reported to the NPRI. The facility is not a major source of nitrate releases relative to other facilities in Canada.65
No other nitrate ion releases were reported to the NPRI from uranium refining, conversion or fabrication facilities.
Refining (Blind River) (kg U)
Conversion (Port Hope) (kg U)
Fabrication (kg U)
2004 2.8 N/a 1.07
2003 2.9 N/a 3.88
2002 6.2 3.9 1.94
2001 7 4.5 1.13
Note: ‘n/a’ indicates that the measurement is not applicable.
Table 3.12: Uranium Released to Water From Uranium Processing Facilities 54, 55, 56, 57, 58
Phase II: Fuel Processing and Production

52 The Pembina Institute • Nuclear Power in Canada: An Examination of Risks, Impacts and Sustainability 53Nuclear Power in Canada: An Examination of Risks, Impacts and Sustainability • The Pembina Institute
3.3.3.4. PhosphorusAquatic algae and plants use phosphorus for nutrition making it difficult to detect as it is quickly absorbed by plants. In most freshwater bodies, phosphorus is the primary nutrient that limits plant and algae growth. Excessive phosphorus levels can lead to changes in numbers and types of plants, decline of oxygen levels in the water and increased buildup rates of dead organic material.67
Table 3.14 outlines phosphorus releases to surface water as direct discharge, as reported to the NPRI for the Blind River Refinery. Again, no other facilities reported phosphorous releases. The facility is not a major source of phosphorous relative to other facili-ties in Canada.68
3.3.4. Landscape ImpactsCameco Corporation only reports its land use in Canada aggregated for its entire operations, which include mining, milling, refining, processing, nuclear fabrication facilities and other undisclosed operations. Reported numbers include 20 km2 disturbed land, 4 km2 rehabilitated land, and 83 km2 total owned and leased land. Land use per uranium processing facility is generally not available in the public domain.69
At the Blind River Refinery, Cameco owns 636 acres of land and has leased an additional 481 acres from the town. The refinery physically occupies 28 acres of land.70
3.3.5. Occupational and Community Health
3.3.5.1. Occupational Health Uranium refining, conversion, and fabrication in Canada employs approximately 900 workers. The unique occupational health and safety risk in the sec-tor is radiation exposure.
3.3.5.1.1. Radiation ExposureWorkers at uranium fabrication facilities receive doses of radiation due to their proximity to and contact with uranium. Table 3.15 lists annual average skin, extremity and whole body doses at all uranium pro-cessing facilities in Ontario. The whole body effective dose limit for nuclear energy workers, as regulated by the CNSC, is 50 mSv in one year and 100 mSv in five years. The annual effective radiation dose limits to skin, hands and feet are each 500 mSv. For compara-tive purposes, annual effective dose limits to members of the public for skin, hands and feet are each 50 mSv, while the limit for the whole body is 1 mSv. 71
Whole body doses and skin doses are measured by dosimeters worn on the breast pocket, while extremity doses are measured with dosimeter rings or bracelets worn for one week each quarter.
Table 3.15 indicates that, if nuclear energy workers were subject to the same standards as the general pub-lic, workers at the GE fabrication facility in Toronto would consistently face higher than acceptable levels of radiation exposure to their extremities. Production at the GE Canada Toronto fabrication facility requires the handling of open source UO2 material, while pro-duction at the Peterborough facility, where pellets are mounted into bundles, requires handling of UO2 sheathed inside zirconium.80
Table 3.15 also indicates that workers at all facili-ties regularly receive whole body doses above the levels considered acceptable to the general public. Finally Table 3.15 indicates that Cameco does not measure exposure to extremities at its facilities. Extremities are exposed to higher rates of radiation than are other parts of the body.
3.3.5.1.2. Workplace SafetyFrom 1995–2005, the uranium processing industry in Ontario reported one fatality, 102 lost time accidents, and 464 medical aid claims with no lost time. The fatality was a result of asbestos exposure.81
Refinery (Blind River) (tonnes)
2004 6.329
2003 4.755
2002 6.235
Table 3.13: Nitrate Ion Releases from Cameco’s Blind River Refinery66
Blind River Refinery(tonnes)
2004 0.171
2003 0.157
Table 3.14: Phosphorus Releases from Cameco’s Blind River Refinery
Phase II: Fuel Processing and Production
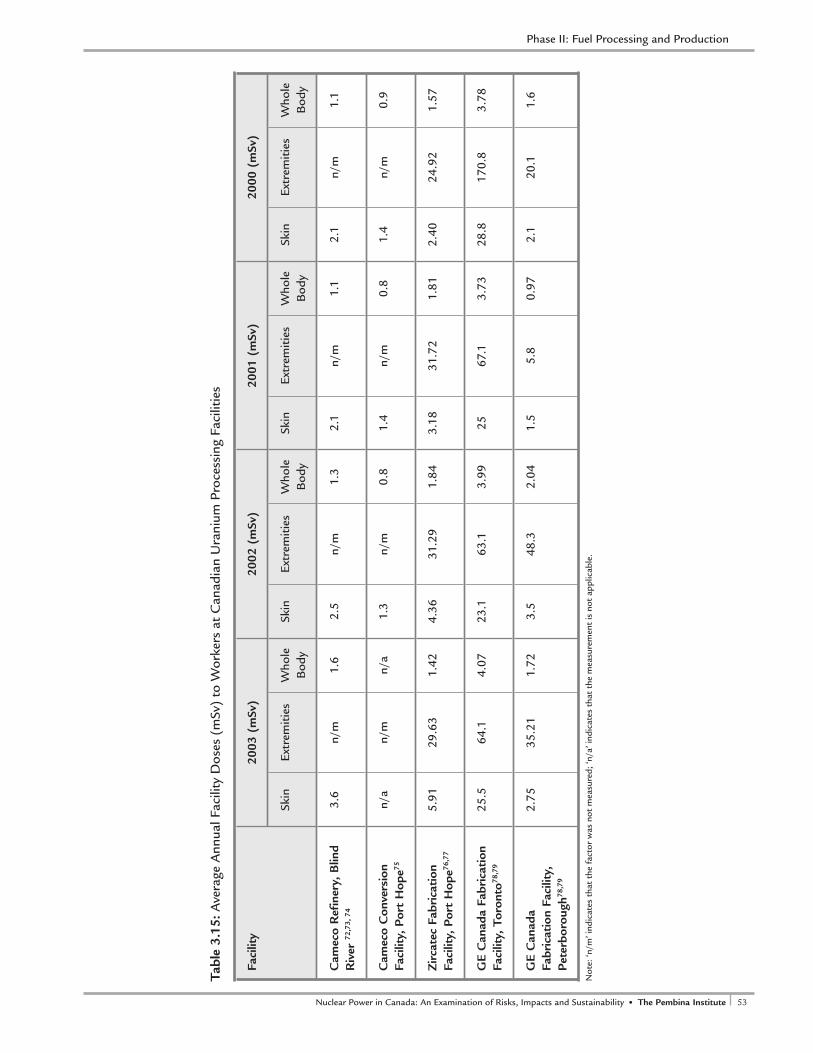
52 The Pembina Institute • Nuclear Power in Canada: An Examination of Risks, Impacts and Sustainability 53Nuclear Power in Canada: An Examination of Risks, Impacts and Sustainability • The Pembina Institute
Faci
lity
2003
(m
Sv)
2002
(m
Sv)
2001
(m
Sv)
2000
(m
Sv)
Skin
Extr
emiti
esW
hole
B
ody
Skin
Extr
emiti
esW
hole
B
ody
Skin
Extr
emiti
esW
hole
B
ody
Skin
Extr
emiti
esW
hole
B
ody
Cam
eco
Ref
iner
y, B
lind
Riv
er 72
,73,
74
3.6
n/m
1.6
2.5
n/m
1.3
2.1
n/m
1.1
2.1
n/m
1.1
Cam
eco
Con
vers
ion
Faci
lity,
Por
t H
ope75
n/a
n/m
n/a
1.3
n/m
0.8
1.4
n/m
0.8
1.4
n/m
0.9
Zirc
atec
Fab
rica
tion
Fa
cilit
y, P
ort
Hop
e76,7
7
5.91
29.6
31.
424.
3631
.29
1.84
3.18
31.7
21.
812.
4024
.92
1.57
GE
Can
ada
Fabr
icat
ion
Faci
lity,
Tor
onto
78,7
9
25.5
64.1
4.07
23.1
63.1
3.99
2567
.13.
7328
.817
0.8
3.78
GE
Can
ada
Fabr
icat
ion
Faci
lity,
Pe
terb
orou
gh78
,79
2.75
35.2
11.
723.
548
.32.
041.
55.
80.
972.
120
.11.
6
Not
e: ‘n
/m’ i
ndic
ates
tha
t th
e fa
ctor
was
not
mea
sure
d; ‘n
/a’ i
ndic
ates
tha
t th
e m
easu
rem
ent
is n
ot a
pplic
able
.
Tabl
e 3.
15: A
vera
ge A
nnua
l Fac
ility
Dos
es (
mSv
) to
Wor
kers
at
Can
adia
n U
rani
um P
roce
ssin
g Fa
cilit
ies
Phase II: Fuel Processing and Production
54 The Pembina Institute • Nuclear Power in Canada: An Examination of Risks, Impacts and Sustainability 55Nuclear Power in Canada: An Examination of Risks, Impacts and Sustainability • The Pembina Institute
3.3.5.2. Community Health ImpactsIn addition to nuclear energy workers, the processing of nuclear fuel also has health impacts on the sur-rounding community. The focus of this section is on radiation dose limits and linkages to increased cancer rates resulting from discharges of radioactive material. Only limited information on this subject was found in the public domain.
3.3.5.2.1. Radiation DosesThe public radiation dose limit prescribed in Radiation Protection Regulations is 1 mSv/year. Annual doses to the most exposed individuals living near uranium conversion and refinery facilities are estimated to be 0.0025–0.2 mSv. For individuals liv-ing near fabrication facilities, the dose range is 0–0.17 mSv.82 This dose is in addition to the radiation dose obtained from natural sources. These levels are below the CNSC annual public dose limit of 1,000 micro-sieverts (µSv).83
Respirable uranium particulate in air has been monitored at three locations around the Port Hope fuel facility since 1998. The highest average particu-late measured at one of these stations was 0.0074 µg/m3.84 The corresponding radiation dose from inhala-tion can be calculated at 0.013 mSv/ per year. 85
The 2004 Environment Canada and Health Can-ada PSL assessment report on releases of radionu-clides from nuclear facilities concluded that ionizing radiation from Canadian uranium refining and con-version facilities was not entering the environment in quantity or concentration that may have an immedi-ate or long-term harmful effect on the environment or its biological diversity.86 However, the assessment did not assess the human health impacts of radiation from these facilities.
In February 2002, the CNSC, after holding a two-day public hearing, issued a five-year license renewal for Cameco Corporation of Saskatoon, Saskatchewan to operate its uranium processing facility in Port Hope.
In a dissenting statement—unprecedented in the history of the commission and of its predecessor, the Atomic Energy Control Board—Commission Member Dr. C.R. Barnes disagreed with the five-year duration of the license term (rather than the three-year terms issued earlier):
Commission Member Dr. C. R. Barnes con-curred with the other Members that the licensee meets the requirements of section 24(4) of the Nuclear Safety and Control Act (NSCA) and therefore that a licence should be issued.
Dr. Barnes, however, disagreed with the majority view on the duration of the licence term. In Dr. Barnes’ view, a maximum licence term of three years should be approved. Dr. Barnes held that a five-year licence should be reserved for facilities where the effects have been demonstrated to be well characterized and where public concerns about health and safety are not high. Dr. Barnes found that a five-year licence in this case would not adequately address the significant remaining concerns of the public about the health effects of the facility in com-bination with the past uranium contamination in the community. Furthermore, Dr. Barnes was also concerned about the current lack of envi-ronmental effects monitoring in the vicinity of the facility. Dr. Barnes is of the view that bring-ing the matter of the licence renewal before the Commission in three years time, as opposed to a status report, will have a greater influence on ensuring the licensee maintains close attention to the design and implementation of the envi-ronmental effects monitoring program and the need to continue to address the significant remaining concerns of the people potentially affected.87
As noted earlier, Port Hope is designated as an Area of Concern under the Great Lakes Water Quality Agreement due to sediments contaminated with ura-nium and thorium-series radionuclides, heavy metals, and PCBs in the harbour.88 An estimated 3.5 million m3 of similarly contaminated historic waste associated with the conversion facility remains within the town.89 In the Mill Street/Madison Street area located south-east of the facility, for example, the Ontario Ministry of the Environment found a uranium concentration of 135 parts per million (ppm) in 1986. The concen-tration had decreased to 40 ppm in 1997.90
The current uranium deposition rate has been monitored at five test plots; three have ben monitored by Cameco and two by the Ontario Ministry of the Environment (MOE). At the Cameco soil test plots, a maximum increase in soil uranium concentration of 0.58 ppm per year was observed for 1998—the first year of monitoring. At MOE’s Town Hall plot, the ura-nium concentration in soil dropped from 0.85 ppm to 0.56 ppm in 1997 and 0.58 ppm in 1998. At MOE’s Marina plot, the uranium concentration increased from 0.85 ppm to 1.78 ppm in 1997 and 3.93 ppm in 1998. In Ontario, normal background levels for ura-nium in soil are up to 2 ppm.91
Phase II: Fuel Processing and Production
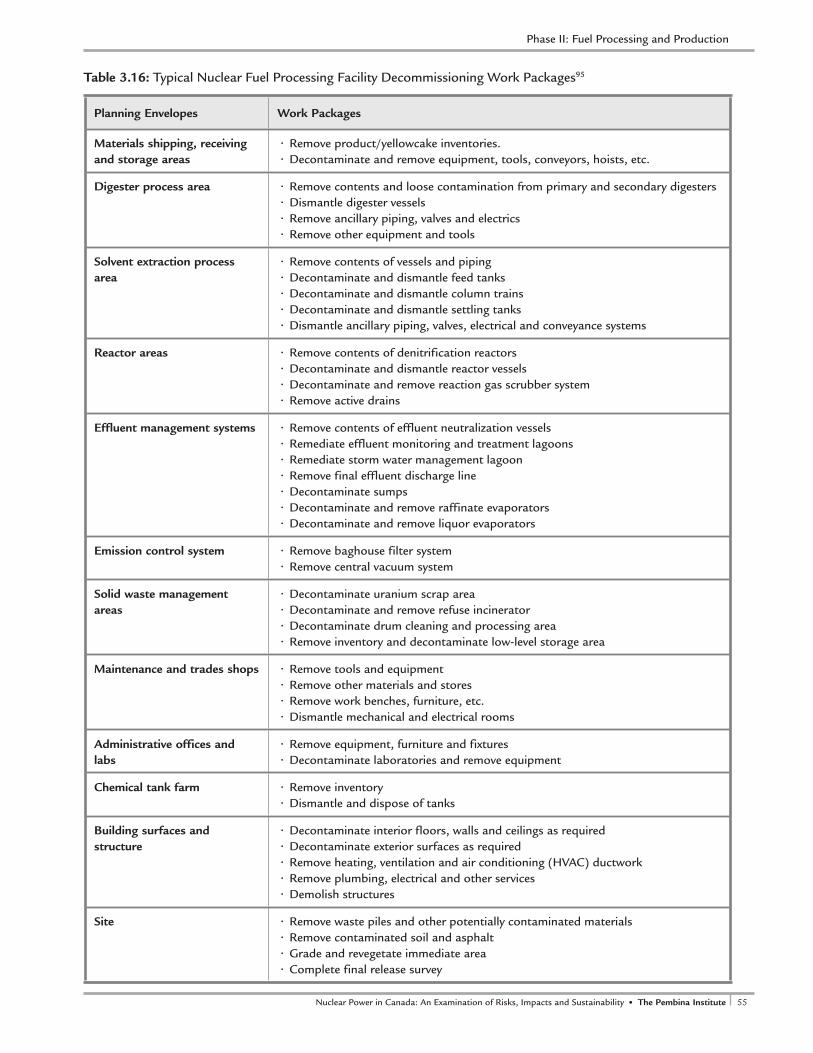
54 The Pembina Institute • Nuclear Power in Canada: An Examination of Risks, Impacts and Sustainability 55Nuclear Power in Canada: An Examination of Risks, Impacts and Sustainability • The Pembina Institute
Planning Envelopes Work Packages
Materials shipping, receiving and storage areas
• Remove product/yellowcake inventories.• Decontaminate and remove equipment, tools, conveyors, hoists, etc.
Digester process area • Remove contents and loose contamination from primary and secondary digesters• Dismantle digester vessels• Remove ancillary piping, valves and electrics• Remove other equipment and tools
Solvent extraction process area
• Remove contents of vessels and piping• Decontaminate and dismantle feed tanks• Decontaminate and dismantle column trains• Decontaminate and dismantle settling tanks• Dismantle ancillary piping, valves, electrical and conveyance systems
Reactor areas • Remove contents of denitrification reactors• Decontaminate and dismantle reactor vessels• Decontaminate and remove reaction gas scrubber system• Remove active drains
Effluent management systems • Remove contents of effluent neutralization vessels• Remediate effluent monitoring and treatment lagoons• Remediate storm water management lagoon• Remove final effluent discharge line• Decontaminate sumps• Decontaminate and remove raffinate evaporators• Decontaminate and remove liquor evaporators
Emission control system • Remove baghouse filter system• Remove central vacuum system
Solid waste management areas
• Decontaminate uranium scrap area• Decontaminate and remove refuse incinerator• Decontaminate drum cleaning and processing area• Remove inventory and decontaminate low-level storage area
Maintenance and trades shops • Remove tools and equipment• Remove other materials and stores• Remove work benches, furniture, etc.• Dismantle mechanical and electrical rooms
Administrative offices and labs
• Remove equipment, furniture and fixtures• Decontaminate laboratories and remove equipment
Chemical tank farm • Remove inventory• Dismantle and dispose of tanks
Building surfaces and structure
• Decontaminate interior floors, walls and ceilings as required• Decontaminate exterior surfaces as required• Remove heating, ventilation and air conditioning (HVAC) ductwork• Remove plumbing, electrical and other services• Demolish structures
Site • Remove waste piles and other potentially contaminated materials• Remove contaminated soil and asphalt• Grade and revegetate immediate area• Complete final release survey
Table 3.16: Typical Nuclear Fuel Processing Facility Decommissioning Work Packages95
Phase II: Fuel Processing and Production

56 The Pembina Institute • Nuclear Power in Canada: An Examination of Risks, Impacts and Sustainability 57Nuclear Power in Canada: An Examination of Risks, Impacts and Sustainability • The Pembina Institute
Uranium(kg)
Dioxins and
Furans (grams TEQ)
Hexachloro-benzene (grams)
Sulphuric Acid
(tonnes)
Hydrogen Fluoride (tonnes)
Ammonia (tonnes)
NOx (tonnes)
PM (tonnes)
GHGs (tonnes)
17.85 0.007 0.233 0.22 0.537 21.4 135.66 7.78 79,610 – 116,303
Table 3.17: Total 2003 Air Releases Considering Transportation and Production
In March 2001, an agreement was reached between the federal government, the town of Port Hope and adjacent municipalities on the cleanup of wastes and development of facilities for their long-term man-agement. This $260 million project,88 called the Port Hope Area Initiative (PHAI), is being managed by the Low Level Radioactive Waste Management Office (LLRWMO) of the Ministry of Natural Resources.92
Concerns have been raised by community resi-dents about the health impacts of exposure to histori-cal radioactive and other materials in Port Hope, as well as emissions from the current uranium process-ing industry. A Health Canada study in 2000 found that Port Hope cancer rates were comparable to that of the rest of Ontario.93 These findings have been challenged by independent researchers and commu-nity residents.94
3.3.6 Facility DecommissioningTo date, no uranium refining, conversion, or fuel fabrication facilities in Canada have been decommis-sioned. Decommissioning would be a complex and potentially expensive undertaking, and would gener-ate substantial amounts of low- and medium-level radioactive wastes.
Table 3.16, taken from CNSC Regulatory Guide G-219, outlines typical work packages that would be completed for the decommissioning of nuclear fuel processing facilities.
The CSNC requires that, as part of its license, Cam-eco make a financial guarantee for future decommis-sioning of its Port Hope conversion facility. Cameco submitted to the CNSC an irrevocable standby Letter of Credit for $33.8 million devoted to decommission-ing costs.96 A financial assurance of $14.6 million is held against the Blind River refinery.97 An assurance of $3.3 million is held against the Zincatec Port Hope fuel fabrication facility.98 The adequacy of these assur-ances to cover actual decommissioning costs has been questioned.99
3.4 ConclusionsThe publicly available information on the impacts of uranium refining, conversion and fuel fabrication is limited.
The major impacts identified in this chapter include the generation of low and intermediate levels of radioactive wastes, estimated in the range of 990 tonnes of solid wastes and 9,000 m3 of liquid wastes per year, as a result of fuel production for domestic use.
Releases of uranium from refining and conversion facilities to the atmosphere and to water do occur. Releases of other radionuclides may also occur. Total annual releases range between 17 and 60 kg of ura-nium to the air, and 6.8 kg to surface waters. Environ-ment Canada concluded in 2004 that releases of ura-nium and ionizing radiation from uranium refining and conversion facilities were not toxic to the environ-ment for the purposes of the Canadian Environmental Protection Act. The assessment did not consider human health impacts.
Releases to the atmosphere of lead (approximately 10 kg per year) are reported from the Port Hope con-version facility. Minor releases to the air of persistent organic pollutants, hydrogen fluoride, and criteria air pollutants are reported from the Blind River refin-ing and Port Hope conversion facilities, as are minor discharges of ammonia, nitrates and phosphorous to surface waters.
Atmospheric releases of nitrogen oxides, PM and GHGs are associated with transportation of uranium from mill sites in northern Saskatchewan to the Blind River refinery, and then on to the Port Hope Conver-sion facility.
Total air releases from uranium refining, conversion and fuel fabrication operations and associated trans-portation activities are summarized in Table 3.17.
Total releases of NOx from uranium processing facilities, including transport from northern Sas-
Phase II: Fuel Processing and Production
56 The Pembina Institute • Nuclear Power in Canada: An Examination of Risks, Impacts and Sustainability 57Nuclear Power in Canada: An Examination of Risks, Impacts and Sustainability • The Pembina Institute
katchewan, are roughly equivalent to the annual exhaust of 29,600 cars.100 In 2004 the total releases of PM from uranium processing facilities (including transport from northern Saskatchewan) were roughly equivalent to the annual exhaust of 9,000 cars.101 Total GHG emissions in the same year were equivalent to those produced annually by 22,700 to 33,100 cars.
The production of enriched uranium fuel, for use in light water, rather than CANDU, reactors is associ-ated with much higher greenhouse gas emissions par-ticularly where gaseous diffusion processes are used to enrich the uranium. Uranium enrichment is also associated with much higher atmospheric releases of uranium, and the production of depleted uranium (DU) waste streams.
No refining, conversion or fuel fabrication facilities have been decommissioned to date. Decommissioning would likely result in the generation of large amounts
of hazardous and low- and medium-level radioactive wastes. The adequacy of the financial assurances pro-vided by facility operators for decommissioning, waste management and long-term care costs has been ques-tioned.
The occupational exposure of workers to radiation in refining, conversion and, particularly, fuel fabri-cation stages, although within the range acceptable for nuclear energy workers, exceeds levels considered unacceptable to members of the public.
Major debates exist about the extent of the com-munity health impacts of refining, conversion and fuel fabrication facilities, particularly in relation to the Port Hope conversion facility. There is a history of significant contamination of the surrounding com-munity with radionuclides, heavy metals and other contaminants associated with the facility.
Phase II: Fuel Processing and Production

58 The Pembina Institute • Nuclear Power in Canada: An Examination of Risks, Impacts and Sustainability 59Nuclear Power in Canada: An Examination of Risks, Impacts and Sustainability • The Pembina Institute

58 The Pembina Institute • Nuclear Power in Canada: An Examination of Risks, Impacts and Sustainability 59Nuclear Power in Canada: An Examination of Risks, Impacts and Sustainability • The Pembina Institute
Summary of FindingsThe major environmental impacts of nuclear power plant operation in Canada include the following:
• The generation of approximately 85,000 waste fuel bundles each year. These fuel bun-dles are extremely radioactive, contain other toxic materials, and require isolation from the environment for one million years. No long-term management strategy for these wastes is in place. A strategy proposed by the Nuclear Waste Management Organization is currently under consideration by the federal government.
• The generation of between 5,500 and 7,000 m3 of low-level radioactive wastes per year (Ontario only). No national strategy for the management of these wastes is in place or under development. A wide range of radiological and hazardous pollutants has been released to the atmosphere as a result of the incineration of these wastes at the Bruce Western Waste Management facility. A new incinerator installed at the in 2003 has reduced emissions of hazardous, but not radiological, pollutants.
• The generation of waste heavy metals and other hazardous wastes (e.g., asbestos) from facility operation and maintenance and refurbishment activities.
• The generation of large amounts of radioactive and hazardous wastes from reactor decommissioning (expected to occur 30 years after the end of the plant’s life). The costs of decommissioning Ontario’s existing reactors have been estimated at $7.474 billion (present value $6.263 billion). The decommissioning fund maintained by OPG currently has a balance of $4.211 billion. The province of Ontario provides a financial guarantee for any shortfall between the value of the decommissioning fund and the actual costs of decommissioning.
• Routine and accidental releases of tritium oxide and carbon-14 to surface water and groundwater from nuclear generating facilities. The health and environmental signifi-cance of these releases is highly disputed. The current permissible levels of tritium in drinking water in Ontario and are substantially higher than those permitted in the United States or European Union.
• Discharges of hydrazine, a recognized carcinogen, to surface waters. Ontario nuclear facilities are the most significant source of such discharges in Canada.
• Significant discharges of metals (copper, zinc and chromium) have resulted from scour-ing and corrosion of boilers and heat exchangers in Ontario nuclear facilities.
• The use of large amounts of cooling water. The Darlington and Pickering facilities alone used approximately 8.9 trillion litres in 2003, approximately 19 times the City of
4. Phase III: Power Plant Operation
60 The Pembina Institute • Nuclear Power in Canada: An Examination of Risks, Impacts and Sustainability 61Nuclear Power in Canada: An Examination of Risks, Impacts and Sustainability • The Pembina Institute
Toronto’s annual water consumption Adverse impacts on fish arising from the thermal impacts of large cooling water discharges have been noted.
• Routine and accidental releases of tritium oxide, noble gases, iodine-131, radioactive particulates, elemental tritium and carbon-14 to the atmosphere. Recent studies have suggested that the community health impacts of these releases, particularly with respect to their effects on infants and children, may be more significant than previously thought.
• Atmospheric releases of hydrazine, an extremely hazardous pollutant. Ontario nuclear generating facilities are the most significant source of such releases in Canada.
• Minor releases of criteria air pollutants and GHGs as a result of the testing of fossil fuel-powered emergency generating equipment at nuclear generating facilities.
• Large-scale flaring of hydrogen sulphide (H2S) (up to 2,000 tonnes per year) in the past due to the production of the heavy water moderator (deuterium oxide) for CANDU reactors.Releases of radioactive materials to the environment as a result of accidents, and a
potential, although low probability, of catastrophic accidents at nuclear generating facili-ties. Catastrophic accidents at generating facilities would have impacts over a much wider area and longer term, than accidents involving any other electricity generating technology, particularly as a result of the large-scale release of radiation and radionuclides. It has been estimated that the monetized value of the off-site environmental, health and economic impacts of a major accident at the Darlington generating facility, for example, would exceed $1 trillion (1991 $Cdn).
Phase III: Power Plant Operation
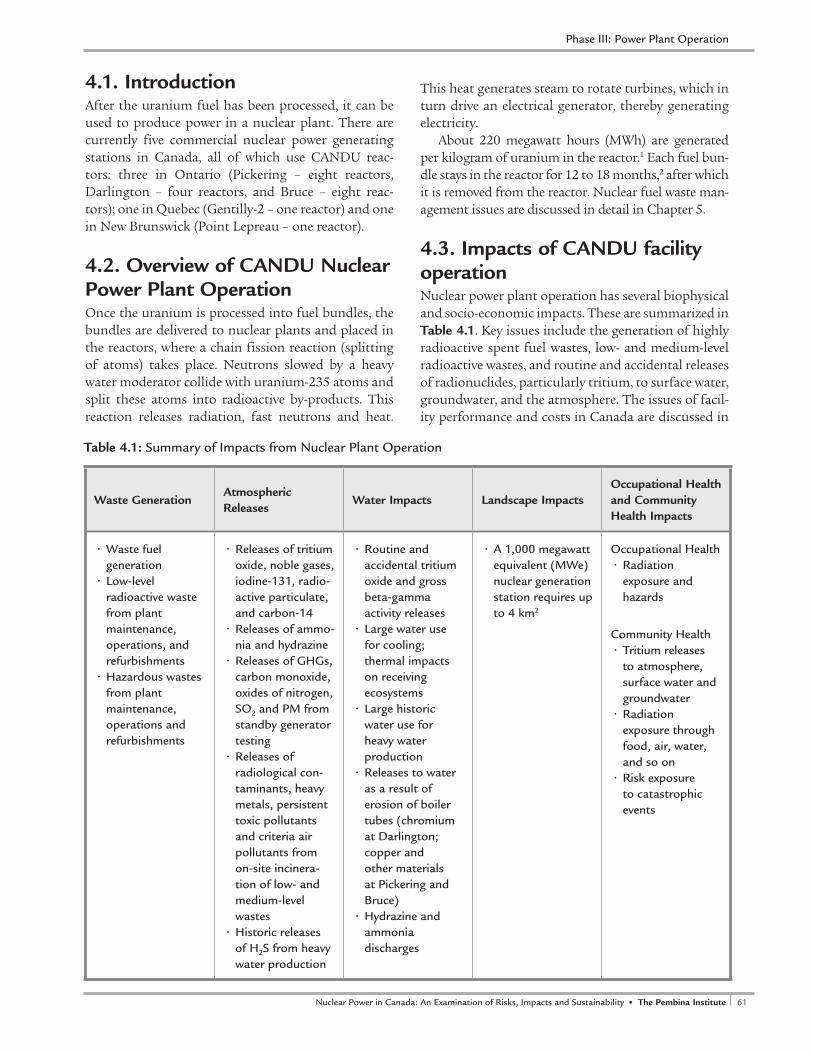
60 The Pembina Institute • Nuclear Power in Canada: An Examination of Risks, Impacts and Sustainability 61Nuclear Power in Canada: An Examination of Risks, Impacts and Sustainability • The Pembina Institute
4.1. IntroductionAfter the uranium fuel has been processed, it can be used to produce power in a nuclear plant. There are currently five commercial nuclear power generating stations in Canada, all of which use CANDU reac-tors: three in Ontario (Pickering – eight reactors, Darlington – four reactors, and Bruce – eight reac-tors); one in Quebec (Gentilly-2 – one reactor) and one in New Brunswick (Point Lepreau – one reactor).
4.2. Overview of CANDU Nuclear Power Plant OperationOnce the uranium is processed into fuel bundles, the bundles are delivered to nuclear plants and placed in the reactors, where a chain fission reaction (splitting of atoms) takes place. Neutrons slowed by a heavy water moderator collide with uranium-235 atoms and split these atoms into radioactive by-products. This reaction releases radiation, fast neutrons and heat.
This heat generates steam to rotate turbines, which in turn drive an electrical generator, thereby generating electricity.
About 220 megawatt hours (MWh) are generated per kilogram of uranium in the reactor.1 Each fuel bun-dle stays in the reactor for 12 to 18 months,2 after which it is removed from the reactor. Nuclear fuel waste man-agement issues are discussed in detail in Chapter 5.
4.3. Impacts of CANDU facility operationNuclear power plant operation has several biophysical and socio-economic impacts. These are summarized in Table 4.1. Key issues include the generation of highly radioactive spent fuel wastes, low- and medium-level radioactive wastes, and routine and accidental releases of radionuclides, particularly tritium, to surface water, groundwater, and the atmosphere. The issues of facil-ity performance and costs in Canada are discussed in
Waste Generation Atmospheric Releases
Water Impacts Landscape ImpactsOccupational Health and Community Health Impacts
• Waste fuel generation
• Low-level radioactive waste from plant maintenance, operations, and refurbishments
• Hazardous wastes from plant maintenance, operations and refurbishments
• Releases of tritium oxide, noble gases, iodine-131, radio-active particulate, and carbon-14
• Releases of ammo-nia and hydrazine
• Releases of GHGs, carbon monoxide, oxides of nitrogen, SO2 and PM from standby generator testing
• Releases of radiological con-taminants, heavy metals, persistent toxic pollutants and criteria air pollutants from on-site incinera-tion of low- and medium-level wastes
• Historic releases of H2S from heavy water production
• Routine and accidental tritium oxide and gross beta-gamma activity releases
• Large water use for cooling; thermal impacts on receiving ecosystems
• Large historic water use for heavy water production
• Releases to water as a result of erosion of boiler tubes (chromium at Darlington; copper and other materials at Pickering and Bruce)
• Hydrazine and ammonia discharges
• A 1,000 megawattequivalent (MWe) nuclear generation station requires up to 4 km2
Occupational Health • Radiation
exposure and hazards
Community Health• Tritium releases
to atmosphere, surface water and groundwater
• Radiation exposure through food, air, water, and so on
• Risk exposure to catastrophic events
Table 4.1: Summary of Impacts from Nuclear Plant Operation
Phase III: Power Plant Operation

62 The Pembina Institute • Nuclear Power in Canada: An Examination of Risks, Impacts and Sustainability 63Nuclear Power in Canada: An Examination of Risks, Impacts and Sustainability • The Pembina Institute
detail in Chapter 6. It is important to note that the poor performance of a large portion of the Ontario reactor fleet has resulted in major increases in reli-ance on electricity sources with high environmental impacts of their own, particularly domestic and imported coal-fired generation.
4.3.1. Waste GenerationThe operation of nuclear power plants results in the generation of a number of waste streams, including waste nuclear fuel, low and intermediate level radioac-tive wastes, and other hazardous wastes, particularly heavy metals and asbestos.
4.3.1.1. Nuclear Fuel Waste When a spent fuel rod is removed from a CANDU nuclear reactor, it is extremely radioactive; an unpro-tected person standing within a metre of such a bundle would die within an hour.3 The radioactivity decreases with time. After one year, it decreases to about 1per cent of its initial value; after 100 years, it decreases to about 0.01per cent of its initial value. But it takes one million years for the level of radioactivity of spent fuel to return to that of natural uranium.4 Spent fuel also gives off heat and contains toxic chemical elements such as heavy metals.5 It must therefore be isolated and contained over extremely long periods of time. Waste nuclear fuel also contains materials (uranium and plutonium) that can be used in nuclear weapons production, and therefore must be secured against access for such uses.
About 85,000 used fuel bundles are gen-erated every year by Canadian nuclear reac-tors.6 As of 2003, there were 1.7 million fuel bundles in storage at nuclear generators and this number continues to grow.7 Figure
4.1 shows the breakdown of spent nuclear fuel bundle accumulation by source. More than 85per cent of the total is in Ontario.
The spent fuel waste is currently stored at the reactor sites. Its continued storage at the reactors is not considered a long-term solution due to the unsuitability of the sites and the fact that the communities hosting the reactors did not agree to, or anticipate, the long-term stor-age of nuclear waste at these sites.9
A full discussion of waste nuclear fuel man-agement impacts and issues is provided in Chapter 5.
4.3.1.2. Low-level and Medium-level Radioactive Wastes
Low- and medium- (or intermediate-) level waste (LILW) is waste that can be dangerous for either short or extended periods of time. It can include waste with an amount of radioactivity that requires shielding containers. LILW is further segregated into “short-lived” (less than 30 years) and “long-lived” (more than 30 years) categories depending on the half-lives of the radionuclides within.10
Low-level wastes are items with low levels of radio-activity that have been contaminated during clean-up and/or maintenance activities at power generation facilities and can include mops, rags, floor sweepings, clothing, and tools. Low-level waste is considered by the CNSC as safe enough to handle without any radia-tion protection. Intermediate-level wastes are of a level where shielding is required to protect workers and can include ion exchange resins, filters, and irradiated core components.11
Nuclear power plants produce about 80per cent of the low-level radioactive waste that is accumulated in Canada each year.12 Wastes generated as a result of plant operations and maintenance include paper, plastic, rubber, cotton, wood, organic liquids, plastic PVC suits, fibreglass, metal pieces, empty drums, fil-ters, light bulb cable, used equipment, construction debris, absorbents (sand, vermiculite, sweeping com-pound), ion exchange resins, reactor core components and retubing wastes, radioactive drain wastes and chemical cleaning solutions. Low- and medium-level wastes are also generated as a result of reactor refur-bishment projects.
Figure 4.1: Breakdown of Spent Nuclear Fuel Bundle Accumulation by Source, 2003 (adapted from the Low Level Radioactive Waste Management Office)8
�����������������������������������������
���������
�����������������
�����������������������������
Phase III: Power Plant Operation
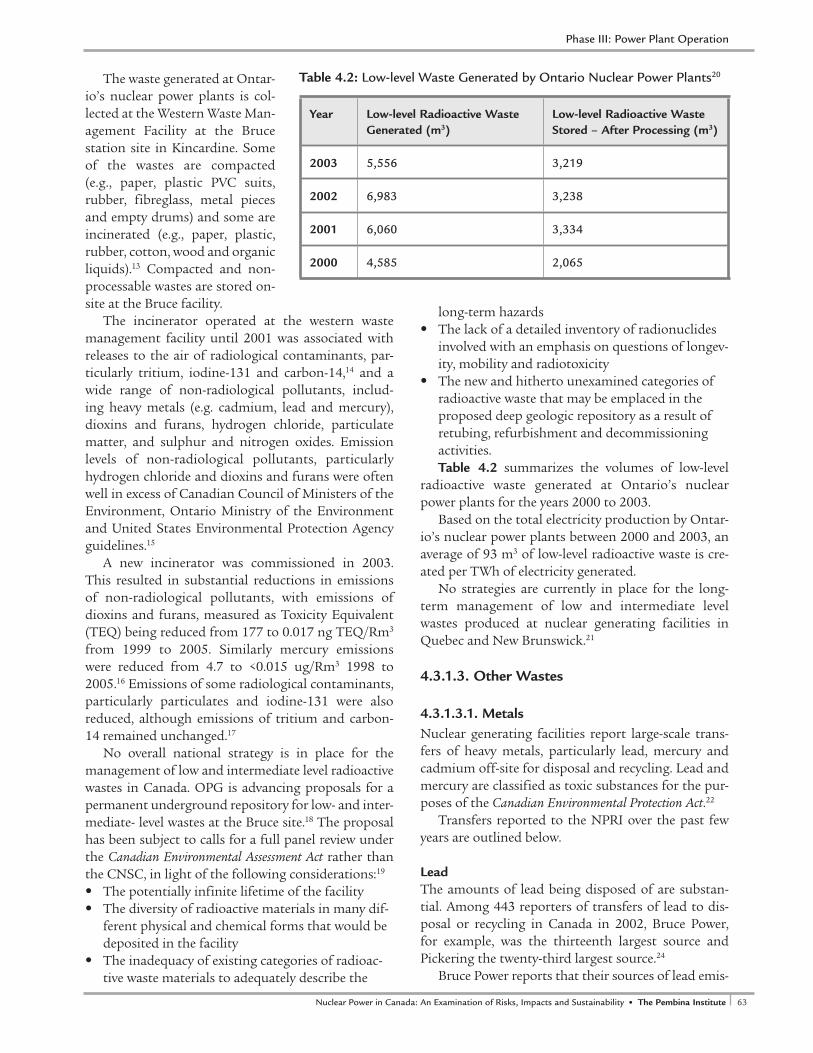
62 The Pembina Institute • Nuclear Power in Canada: An Examination of Risks, Impacts and Sustainability 63Nuclear Power in Canada: An Examination of Risks, Impacts and Sustainability • The Pembina Institute
The waste generated at Ontar-io’s nuclear power plants is col-lected at the Western Waste Man-agement Facility at the Bruce station site in Kincardine. Some of the wastes are compacted (e.g., paper, plastic PVC suits, rubber, fibreglass, metal pieces and empty drums) and some are incinerated (e.g., paper, plastic, rubber, cotton, wood and organic liquids).13 Compacted and non-processable wastes are stored on-site at the Bruce facility.
The incinerator operated at the western waste management facility until 2001 was associated with releases to the air of radiological contaminants, par-ticularly tritium, iodine-131 and carbon-14,14 and a wide range of non-radiological pollutants, includ-ing heavy metals (e.g. cadmium, lead and mercury), dioxins and furans, hydrogen chloride, particulate matter, and sulphur and nitrogen oxides. Emission levels of non-radiological pollutants, particularly hydrogen chloride and dioxins and furans were often well in excess of Canadian Council of Ministers of the Environment, Ontario Ministry of the Environment and United States Environmental Protection Agency guidelines.15
A new incinerator was commissioned in 2003. This resulted in substantial reductions in emissions of non-radiological pollutants, with emissions of dioxins and furans, measured as Toxicity Equivalent (TEQ) being reduced from 177 to 0.017 ng TEQ/Rm3 from 1999 to 2005. Similarly mercury emissions were reduced from 4.7 to <0.015 ug/Rm3 1998 to 2005.16 Emissions of some radiological contaminants, particularly particulates and iodine-131 were also reduced, although emissions of tritium and carbon-14 remained unchanged.17
No overall national strategy is in place for the management of low and intermediate level radioactive wastes in Canada. OPG is advancing proposals for a permanent underground repository for low- and inter-mediate- level wastes at the Bruce site.18 The proposal has been subject to calls for a full panel review under the Canadian Environmental Assessment Act rather than the CNSC, in light of the following considerations:19
• The potentially infinite lifetime of the facility• The diversity of radioactive materials in many dif-
ferent physical and chemical forms that would be deposited in the facility
• The inadequacy of existing categories of radioac-tive waste materials to adequately describe the
long-term hazards• The lack of a detailed inventory of radionuclides
involved with an emphasis on questions of longev-ity, mobility and radiotoxicity
• The new and hitherto unexamined categories of radioactive waste that may be emplaced in the proposed deep geologic repository as a result of retubing, refurbishment and decommissioning activities.Table 4.2 summarizes the volumes of low-level
radioactive waste generated at Ontario’s nuclear power plants for the years 2000 to 2003.
Based on the total electricity production by Ontar-io’s nuclear power plants between 2000 and 2003, an average of 93 m3 of low-level radioactive waste is cre-ated per TWh of electricity generated.
No strategies are currently in place for the long-term management of low and intermediate level wastes produced at nuclear generating facilities in Quebec and New Brunswick.21
4.3.1.3. Other Wastes
4.3.1.3.1. MetalsNuclear generating facilities report large-scale trans-fers of heavy metals, particularly lead, mercury and cadmium off-site for disposal and recycling. Lead and mercury are classified as toxic substances for the pur-poses of the Canadian Environmental Protection Act.22
Transfers reported to the NPRI over the past few years are outlined below.
Lead The amounts of lead being disposed of are substan-tial. Among 443 reporters of transfers of lead to dis-posal or recycling in Canada in 2002, Bruce Power, for example, was the thirteenth largest source and Pickering the twenty-third largest source.24
Bruce Power reports that their sources of lead emis-
Year Low-level Radioactive Waste Generated (m3)
Low-level Radioactive Waste Stored – After Processing (m3)
2003 5,556 3,219
2002 6,983 3,238
2001 6,060 3,334
2000 4,585 2,065
Table 4.2: Low-level Waste Generated by Ontario Nuclear Power Plants20
Phase III: Power Plant Operation

64 The Pembina Institute • Nuclear Power in Canada: An Examination of Risks, Impacts and Sustainability 65Nuclear Power in Canada: An Examination of Risks, Impacts and Sustainability • The Pembina Institute
Phase III: Power Plant Operation
Total Bruce (kg) Pickering (kg) Darlington (kg) Gentilly-2 (kg) Point Lepreau (kg)
2004 13,729.000 110.500 60,000.000 - -
2003 123,564.000 82,100.000 30,000.000 - -
2002 160,647.000 41,000.000 - - -
Note: ‘-’ indicates that data was not reported.
Table 4.3: Off-site Releases of Lead from Nuclear Power Plant Facilities (Off-site Disposal and Recycling)23
Total Bruce (kg) Pickering (kg) Darlington (kg) Gentilly-2 (kg) Point Lepreau (kg)
2004 176.000 - - - -
2003 168.800 - - - -
2002 168.800 - - - -
Note: ‘-’ indicates that data was not reported.
Table 4.4: Off-site Releases of Cadmium from Nuclear Power Plant Facilities (Off-site Disposal)26
Total Bruce (kg) Pickering (kg) Darlington (kg) Gentilly-2 (kg) Point Lepreau (kg)
2004 - 156.060 0.354 - -
2003 - 1.600 0.656 - -
2002 8.792 1.676 5.110 - -
Table 4.5: Off-site Releases of Mercury from Nuclear Power Plant Facilities (Off-site Disposal and Recycling)28
TotalBruce
(tonnes)Pickering (tonnes)
Darlington (tonnes)
Gentilly-2 (tonnes)
Point Lepreau (tonnes)
2004 0.007 - - - -
2003 0.000 - - - -
2002 0.008 - - - -
Table 4.6: Off-site Releases of Chromium from Nuclear Power Plant Facilities (Off-site Disposal and Recycling)30
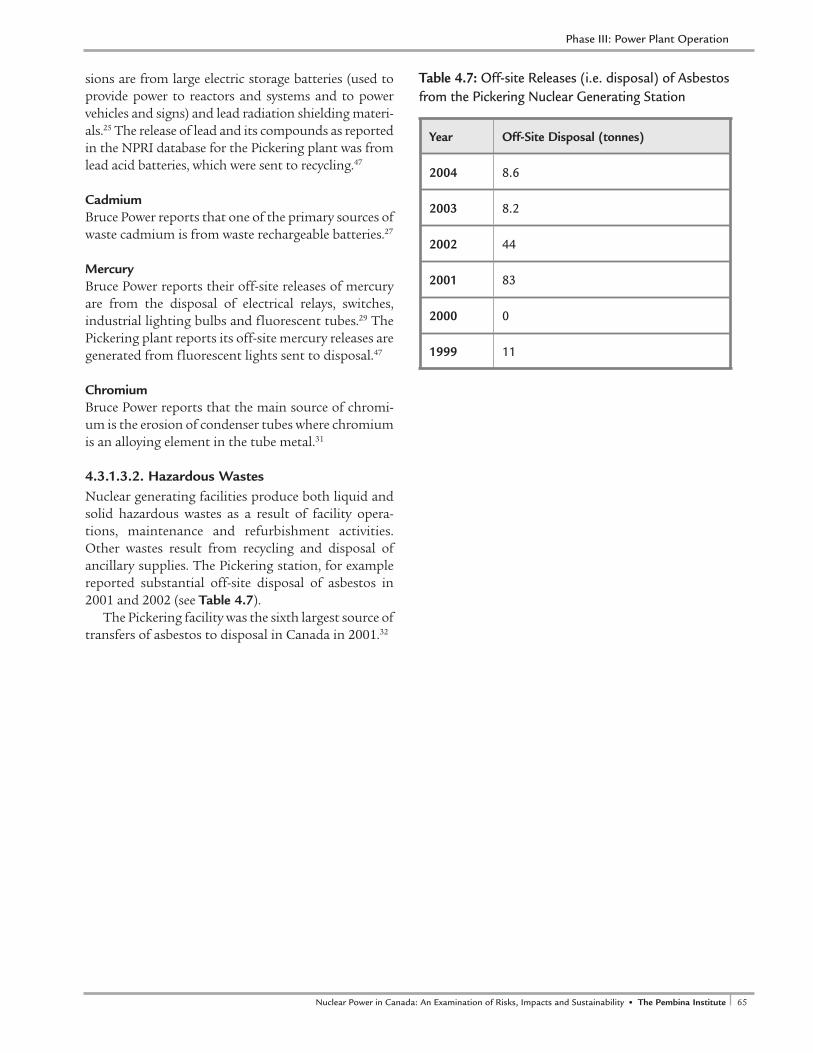
64 The Pembina Institute • Nuclear Power in Canada: An Examination of Risks, Impacts and Sustainability 65Nuclear Power in Canada: An Examination of Risks, Impacts and Sustainability • The Pembina Institute
sions are from large electric storage batteries (used to provide power to reactors and systems and to power vehicles and signs) and lead radiation shielding materi-als.25 The release of lead and its compounds as reported in the NPRI database for the Pickering plant was from lead acid batteries, which were sent to recycling.47
CadmiumBruce Power reports that one of the primary sources of waste cadmium is from waste rechargeable batteries.27
MercuryBruce Power reports their off-site releases of mercury are from the disposal of electrical relays, switches, industrial lighting bulbs and fluorescent tubes.29 The Pickering plant reports its off-site mercury releases are generated from fluorescent lights sent to disposal.47
Chromium Bruce Power reports that the main source of chromi-um is the erosion of condenser tubes where chromium is an alloying element in the tube metal.31
4.3.1.3.2. Hazardous WastesNuclear generating facilities produce both liquid and solid hazardous wastes as a result of facility opera-tions, maintenance and refurbishment activities. Other wastes result from recycling and disposal of ancillary supplies. The Pickering station, for example reported substantial off-site disposal of asbestos in 2001 and 2002 (see Table 4.7).
The Pickering facility was the sixth largest source of transfers of asbestos to disposal in Canada in 2001.32
Phase III: Power Plant Operation
Year Off-Site Disposal (tonnes)
2004 8.6
2003 8.2
2002 44
2001 83
2000 0
1999 11
Table 4.7: Off-site Releases (i.e. disposal) of Asbestos from the Pickering Nuclear Generating Station
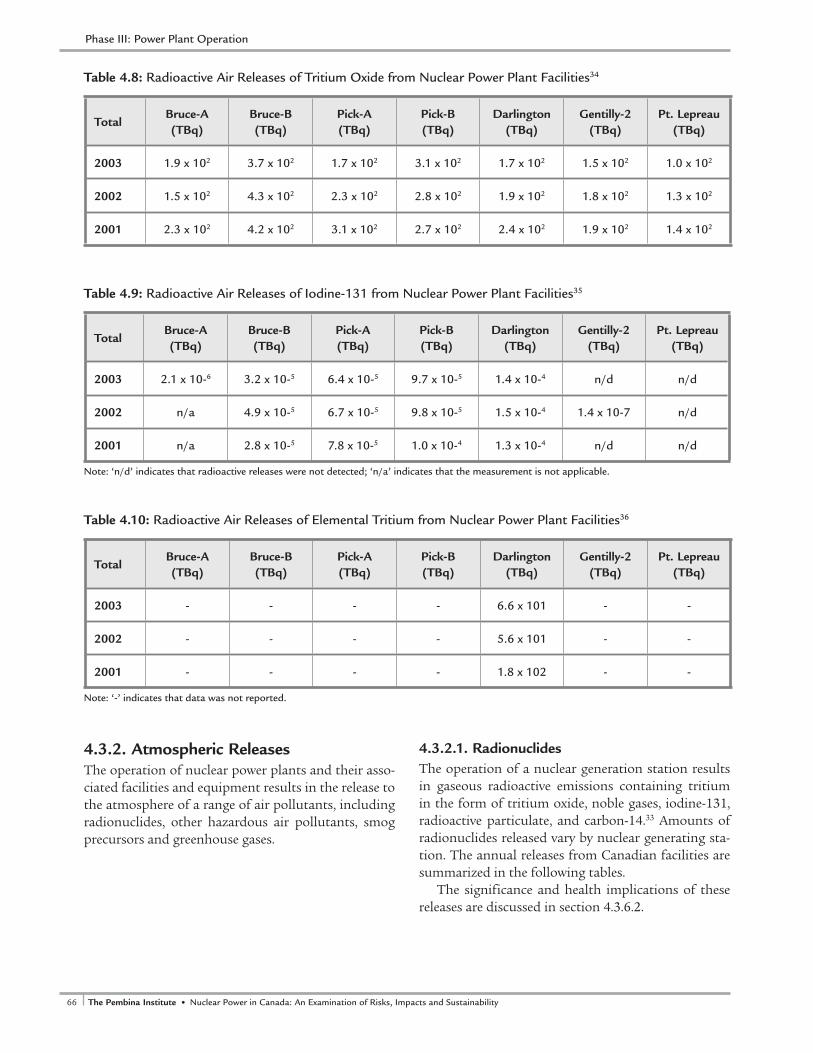
66 The Pembina Institute • Nuclear Power in Canada: An Examination of Risks, Impacts and Sustainability 67Nuclear Power in Canada: An Examination of Risks, Impacts and Sustainability • The Pembina Institute
Phase III: Power Plant Operation
TotalBruce-A(TBq)
Bruce-B(TBq)
Pick-A (TBq)
Pick-B (TBq)
Darlington (TBq)
Gentilly-2 (TBq)
Pt. Lepreau (TBq)
2003 1.9 x 10² 3.7 x 10² 1.7 x 10² 3.1 x 10² 1.7 x 10² 1.5 x 10² 1.0 x 10²
2002 1.5 x 10² 4.3 x 10² 2.3 x 10² 2.8 x 10² 1.9 x 10² 1.8 x 10² 1.3 x 10²
2001 2.3 x 10² 4.2 x 10² 3.1 x 10² 2.7 x 10² 2.4 x 10² 1.9 x 10² 1.4 x 10²
Table 4.8: Radioactive Air Releases of Tritium Oxide from Nuclear Power Plant Facilities34
TotalBruce-A(TBq)
Bruce-B(TBq)
Pick-A (TBq)
Pick-B (TBq)
Darlington (TBq)
Gentilly-2 (TBq)
Pt. Lepreau (TBq)
2003 2.1 x 10⁻⁶ 3.2 x 10⁻⁵ 6.4 x 10⁻⁵ 9.7 x 10⁻⁵ 1.4 x 10⁻⁴ n/d n/d
2002 n/a 4.9 x 10⁻⁵ 6.7 x 10⁻⁵ 9.8 x 10⁻⁵ 1.5 x 10⁻⁴ 1.4 x 10⁻⁷ n/d
2001 n/a 2.8 x 10⁻⁵ 7.8 x 10⁻⁵ 1.0 x 10⁻⁴ 1.3 x 10⁻⁴ n/d n/d
Note: ‘n/d’ indicates that radioactive releases were not detected; ‘n/a’ indicates that the measurement is not applicable.
Table 4.9: Radioactive Air Releases of Iodine-131 from Nuclear Power Plant Facilities35
TotalBruce-A(TBq)
Bruce-B(TBq)
Pick-A (TBq)
Pick-B (TBq)
Darlington (TBq)
Gentilly-2 (TBq)
Pt. Lepreau (TBq)
2003 - - - - 6.6 x 101 - -
2002 - - - - 5.6 x 101 - -
2001 - - - - 1.8 x 10² - -
Note: ‘-’ indicates that data was not reported.
Table 4.10: Radioactive Air Releases of Elemental Tritium from Nuclear Power Plant Facilities36
4.3.2. Atmospheric ReleasesThe operation of nuclear power plants and their asso-ciated facilities and equipment results in the release to the atmosphere of a range of air pollutants, including radionuclides, other hazardous air pollutants, smog precursors and greenhouse gases.
4.3.2.1. Radionuclides The operation of a nuclear generation station results in gaseous radioactive emissions containing tritium in the form of tritium oxide, noble gases, iodine-131, radioactive particulate, and carbon-14.33 Amounts of radionuclides released vary by nuclear generating sta-tion. The annual releases from Canadian facilities are summarized in the following tables.
The significance and health implications of these releases are discussed in section 4.3.6.2.
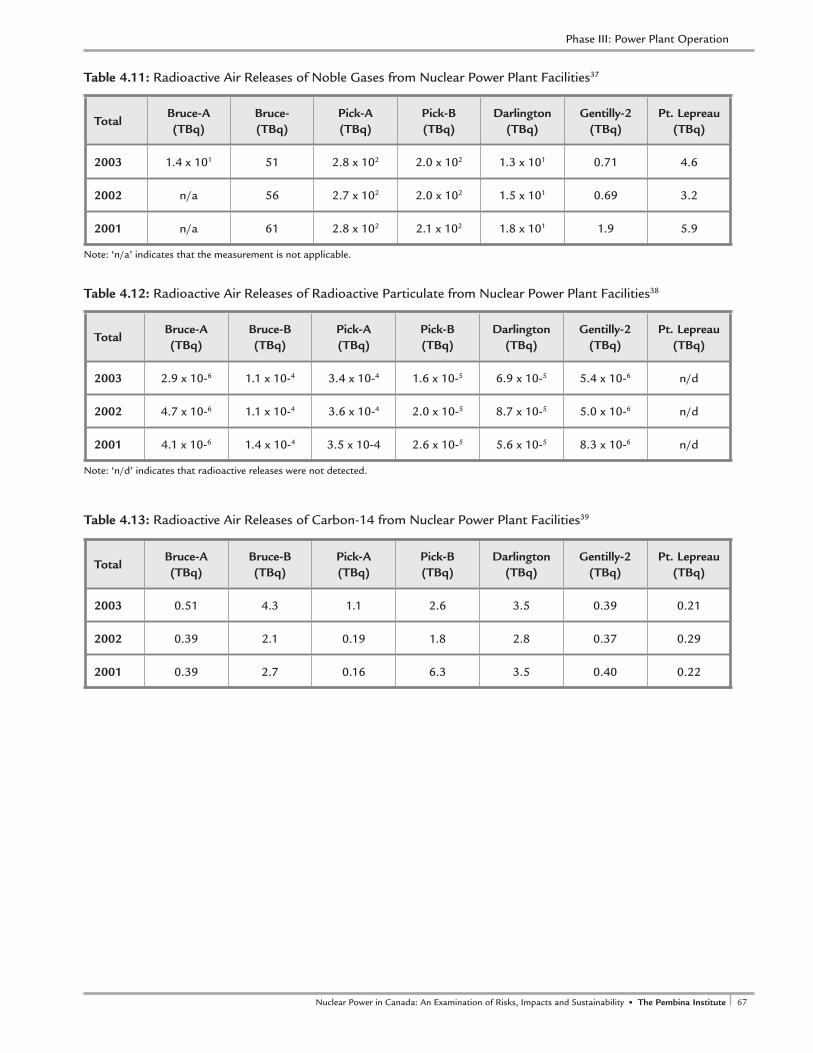
66 The Pembina Institute • Nuclear Power in Canada: An Examination of Risks, Impacts and Sustainability 67Nuclear Power in Canada: An Examination of Risks, Impacts and Sustainability • The Pembina Institute
Phase III: Power Plant Operation
TotalBruce-A(TBq)
Bruce-(TBq)
Pick-A (TBq)
Pick-B (TBq)
Darlington (TBq)
Gentilly-2 (TBq)
Pt. Lepreau (TBq)
2003 1.4 x 101 51 2.8 x 10² 2.0 x 10² 1.3 x 101 0.71 4.6
2002 n/a 56 2.7 x 10² 2.0 x 10² 1.5 x 101 0.69 3.2
2001 n/a 61 2.8 x 10² 2.1 x 10² 1.8 x 101 1.9 5.9
Note: ‘n/a’ indicates that the measurement is not applicable.
Table 4.11: Radioactive Air Releases of Noble Gases from Nuclear Power Plant Facilities37
TotalBruce-A(TBq)
Bruce-B(TBq)
Pick-A (TBq)
Pick-B (TBq)
Darlington (TBq)
Gentilly-2 (TBq)
Pt. Lepreau (TBq)
2003 2.9 x 10⁻⁶ 1.1 x 10⁻⁴ 3.4 x 10⁻⁴ 1.6 x 10⁻⁵ 6.9 x 10⁻⁵ 5.4 x 10⁻⁶ n/d
2002 4.7 x 10⁻⁶ 1.1 x 10⁻⁴ 3.6 x 10⁻⁴ 2.0 x 10⁻⁵ 8.7 x 10⁻⁵ 5.0 x 10⁻⁶ n/d
2001 4.1 x 10⁻⁶ 1.4 x 10⁻⁴ 3.5 x 10⁻⁴ 2.6 x 10⁻⁵ 5.6 x 10⁻⁵ 8.3 x 10⁻⁶ n/d
Note: ‘n/d’ indicates that radioactive releases were not detected.
Table 4.12: Radioactive Air Releases of Radioactive Particulate from Nuclear Power Plant Facilities38
TotalBruce-A(TBq)
Bruce-B(TBq)
Pick-A (TBq)
Pick-B (TBq)
Darlington (TBq)
Gentilly-2 (TBq)
Pt. Lepreau (TBq)
2003 0.51 4.3 1.1 2.6 3.5 0.39 0.21
2002 0.39 2.1 0.19 1.8 2.8 0.37 0.29
2001 0.39 2.7 0.16 6.3 3.5 0.40 0.22
Table 4.13: Radioactive Air Releases of Carbon-14 from Nuclear Power Plant Facilities39
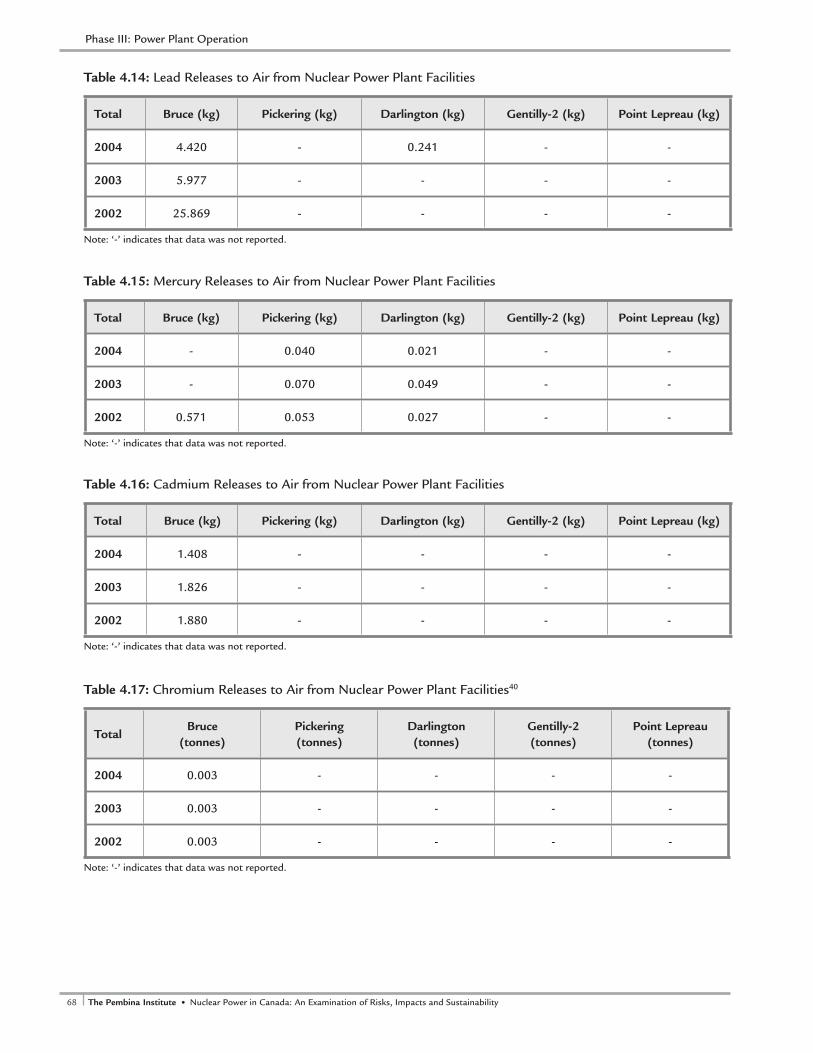
68 The Pembina Institute • Nuclear Power in Canada: An Examination of Risks, Impacts and Sustainability 69Nuclear Power in Canada: An Examination of Risks, Impacts and Sustainability • The Pembina Institute
Phase III: Power Plant Operation
Total Bruce (kg) Pickering (kg) Darlington (kg) Gentilly-2 (kg) Point Lepreau (kg)
2004 4.420 - 0.241 - -
2003 5.977 - - - -
2002 25.869 - - - -
Note: ‘-’ indicates that data was not reported.
Table 4.14: Lead Releases to Air from Nuclear Power Plant Facilities
Total Bruce (kg) Pickering (kg) Darlington (kg) Gentilly-2 (kg) Point Lepreau (kg)
2004 - 0.040 0.021 - -
2003 - 0.070 0.049 - -
2002 0.571 0.053 0.027 - -
Note: ‘-’ indicates that data was not reported.
Table 4.15: Mercury Releases to Air from Nuclear Power Plant Facilities
Total Bruce (kg) Pickering (kg) Darlington (kg) Gentilly-2 (kg) Point Lepreau (kg)
2004 1.408 - - - -
2003 1.826 - - - -
2002 1.880 - - - -
Note: ‘-’ indicates that data was not reported.
Table 4.16: Cadmium Releases to Air from Nuclear Power Plant Facilities
TotalBruce
(tonnes)Pickering (tonnes)
Darlington (tonnes)
Gentilly-2 (tonnes)
Point Lepreau (tonnes)
2004 0.003 - - - -
2003 0.003 - - - -
2002 0.003 - - - -
Note: ‘-’ indicates that data was not reported.
Table 4.17: Chromium Releases to Air from Nuclear Power Plant Facilities40

68 The Pembina Institute • Nuclear Power in Canada: An Examination of Risks, Impacts and Sustainability 69Nuclear Power in Canada: An Examination of Risks, Impacts and Sustainability • The Pembina Institute
4.3.2.2. Heavy MetalsLeadTable 4.14 summarizes the lead releases from the five Canadian nuclear power generating facilities as reported to the NPRI.
Mercury Table 4.15 summarizes the mercury (and its com-pounds) releases from the five Canadian nuclear power generating facilities as reported to the NPRI.
CadmiumTable 4.16 summarizes the cadmium (and its com-pounds) releases from the five Canadian nuclear power generating facilities as reported to the NPRI.
ChromiumTable 4.17 summarizes the chromium releases from the five Canadian nuclear power generating facilities as reported to the NPRI.
Bruce Power reports much higher emissions of heavy metals to the NPRI than do other facilities. Bruce Power indicates that a large portion of these emissions come from the combustion of fossil fuels from the facility’s Bruce Alternate Steam Supply (BASS) Plant. The BASS Plant supplies building heat-ing steam and process steam to the off-site Bruce Energy Centre industrial park. The portion of the Bruce facility’s heavy metal emissions reported to NPRI attributed to the plant include41
• 99per cent of nickel • 91per cent of lead • 90per cent of mercury • 88per cent of chromium • 77per cent of cadmium.
4.3.2.3. Criteria Air ContaminantsThe testing of diesel and gas turbine-powered standby and emergency generators at nuclear generating facili-ties contains carbon monoxide (CO), NOx, SO2, PM and CO2.42 These generators are tested monthly, with the resultant air emissions displayed in Table 4.18.43
Bruce Power reports much higher emissions of
criteria air pollutants to the NPRI than shown in Table 4.18. In particular, for 2004, the Bruce facility reported to the NPRI releases of 16.2 tonnes of CO, 662 tonnes of SO2, 145 tonnes of NOx and 48 tonnes of total PM. A large portion of these emissions come from the combustion of fossil fuels from the BASS Plant. The portion of the Bruce facility’s criteria air pollutant emissions reported to NPRI attributed to the BASS Plant include44
• 98per cent of Total PM (not including road dust)• 98per cent of SO2
• 85per cent of CO• 76per cent of NOx
Bruce Power reports their total PM air emissions to be from various forms of vehicular traffic (passenger vehicles, truck and heavy work equipment) and road dust. Vehicular traffic is stated to contribute 98per cent of all non-road-dust PM.45
4.3.2.4. Ammonia and Hydrazine The steam released from a nuclear power plant contains ammonia and hydrazine.46 Ammonia is a breakdown product of hydrazine, which is used in the boilers to prevent boiler corrosion.47 Hydrazine is an extremely hazardous chemical; it is a recognized carcinogen, and suspected reproductive, developmen-tal, cardiovascular, neurological and respiratory toxi-cant.48 Gaseous ammonia is classified as a toxic sub-stance for the purposes of the Canadian Environmental Protection Act.49
The air releases of ammonia reported to the NPRI by nuclear power plants over the past three years are summarized in Table 4.19.
Table 4.20 summarizes the air release of hydrazine (and its salts) reported to the NPRI by nuclear power plants over the past three years. Ontario nuclear gener-ating facilities are the only electricity generating facilities in Canada to report discharges of hydrazine to the air.50
Based on annual electricity production by Ontario’s nuclear power stations and annual releases reported in the NPRI database, an average of 0.5 tonnes of ammo-nia and 0.03 tonnes of hydrazine are released per TWh of electricity produced at Ontario’s nuclear plants.
Phase III: Power Plant Operation
Total CO (tonnes) NOx (tonnes) Total PM (tonnes) SO2 (tonnes)
2004 5.50 44.27 1.16 14.74
2003 4.40 91.27 1.73 18.71
Table 4.18: Annual Releases to Air from Ontario’s Nuclear Generating Stations
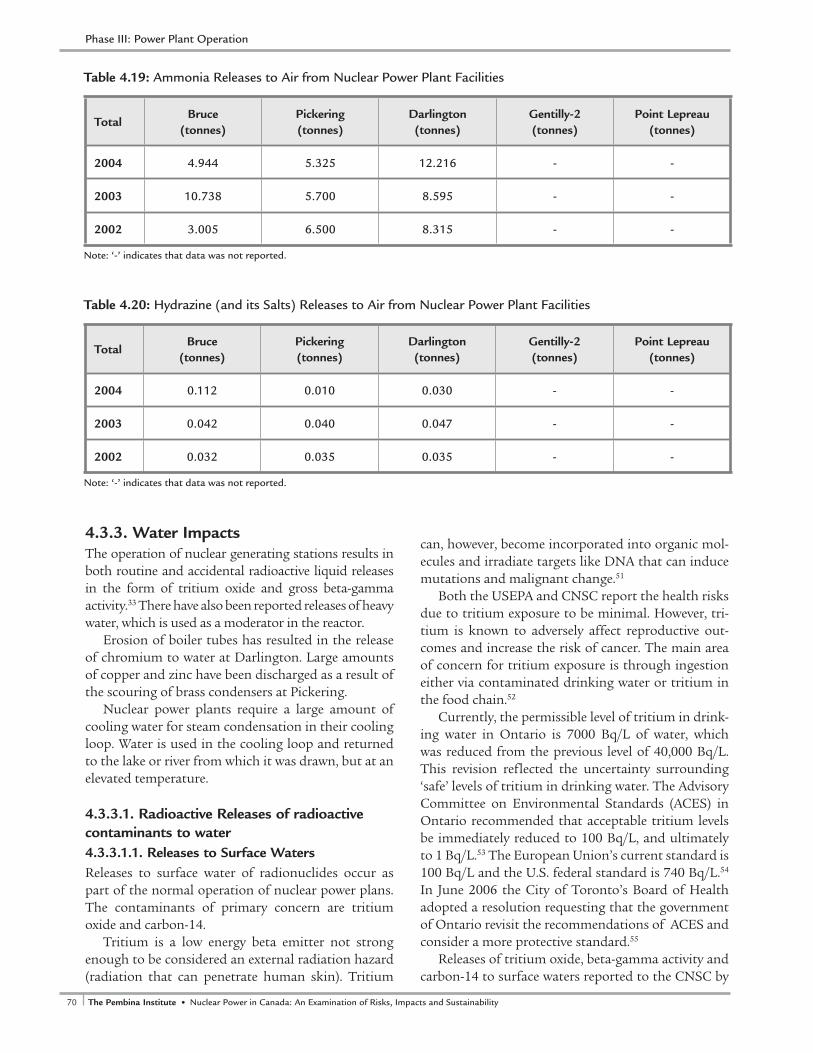
70 The Pembina Institute • Nuclear Power in Canada: An Examination of Risks, Impacts and Sustainability 71Nuclear Power in Canada: An Examination of Risks, Impacts and Sustainability • The Pembina Institute
4.3.3. Water ImpactsThe operation of nuclear generating stations results in both routine and accidental radioactive liquid releases in the form of tritium oxide and gross beta-gamma activity.33 There have also been reported releases of heavy water, which is used as a moderator in the reactor.
Erosion of boiler tubes has resulted in the release of chromium to water at Darlington. Large amounts of copper and zinc have been discharged as a result of the scouring of brass condensers at Pickering.
Nuclear power plants require a large amount of cooling water for steam condensation in their cooling loop. Water is used in the cooling loop and returned to the lake or river from which it was drawn, but at an elevated temperature.
4.3.3.1. Radioactive Releases of radioactive contaminants to water4.3.3.1.1. Releases to Surface WatersReleases to surface water of radionuclides occur as part of the normal operation of nuclear power plans. The contaminants of primary concern are tritium oxide and carbon-14.
Tritium is a low energy beta emitter not strong enough to be considered an external radiation hazard (radiation that can penetrate human skin). Tritium
can, however, become incorporated into organic mol-ecules and irradiate targets like DNA that can induce mutations and malignant change.51
Both the USEPA and CNSC report the health risks due to tritium exposure to be minimal. However, tri-tium is known to adversely affect reproductive out-comes and increase the risk of cancer. The main area of concern for tritium exposure is through ingestion either via contaminated drinking water or tritium in the food chain.52
Currently, the permissible level of tritium in drink-ing water in Ontario is 7000 Bq/L of water, which was reduced from the previous level of 40,000 Bq/L. This revision reflected the uncertainty surrounding ‘safe’ levels of tritium in drinking water. The Advisory Committee on Environmental Standards (ACES) in Ontario recommended that acceptable tritium levels be immediately reduced to 100 Bq/L, and ultimately to 1 Bq/L.53 The European Union’s current standard is 100 Bq/L and the U.S. federal standard is 740 Bq/L.54 In June 2006 the City of Toronto’s Board of Health adopted a resolution requesting that the government of Ontario revisit the recommendations of ACES and consider a more protective standard.55
Releases of tritium oxide, beta-gamma activity and carbon-14 to surface waters reported to the CNSC by
Phase III: Power Plant Operation
TotalBruce
(tonnes)Pickering (tonnes)
Darlington (tonnes)
Gentilly-2 (tonnes)
Point Lepreau (tonnes)
2004 4.944 5.325 12.216 - -
2003 10.738 5.700 8.595 - -
2002 3.005 6.500 8.315 - -
Note: ‘-’ indicates that data was not reported.
Table 4.19: Ammonia Releases to Air from Nuclear Power Plant Facilities
TotalBruce
(tonnes)Pickering (tonnes)
Darlington (tonnes)
Gentilly-2 (tonnes)
Point Lepreau (tonnes)
2004 0.112 0.010 0.030 - -
2003 0.042 0.040 0.047 - -
2002 0.032 0.035 0.035 - -
Note: ‘-’ indicates that data was not reported.
Table 4.20: Hydrazine (and its Salts) Releases to Air from Nuclear Power Plant Facilities
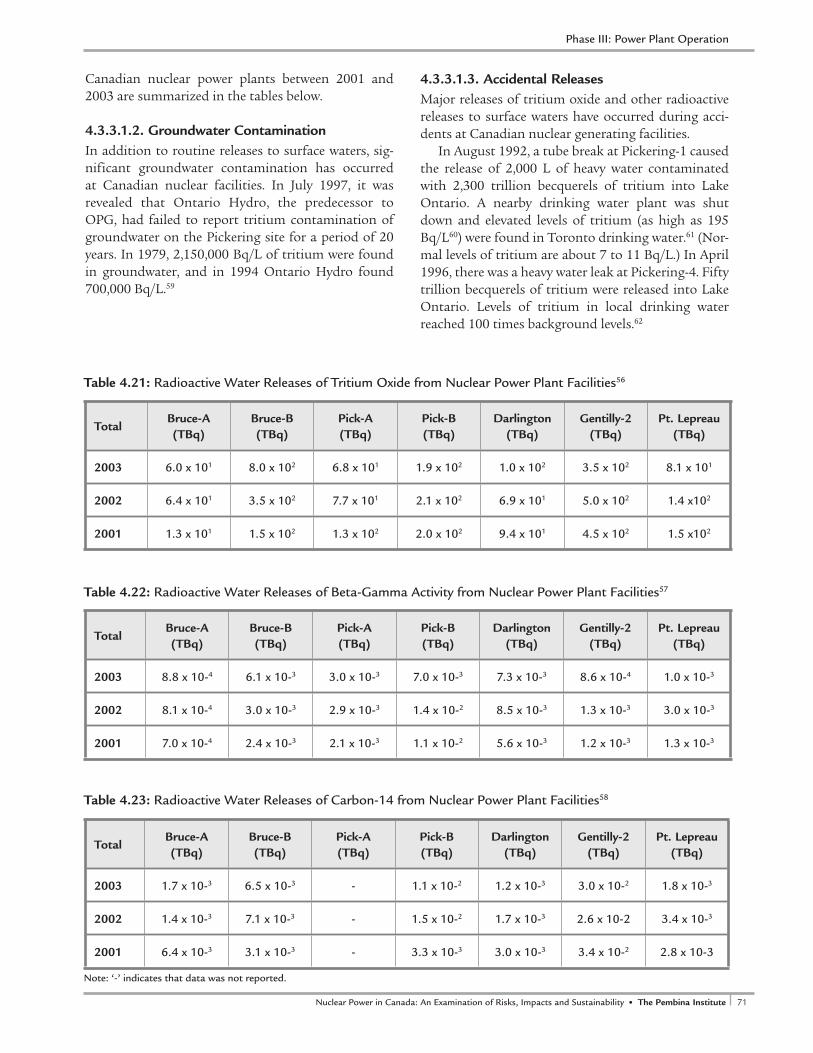
70 The Pembina Institute • Nuclear Power in Canada: An Examination of Risks, Impacts and Sustainability 71Nuclear Power in Canada: An Examination of Risks, Impacts and Sustainability • The Pembina Institute
Canadian nuclear power plants between 2001 and 2003 are summarized in the tables below.
4.3.3.1.2. Groundwater ContaminationIn addition to routine releases to surface waters, sig-nificant groundwater contamination has occurred at Canadian nuclear facilities. In July 1997, it was revealed that Ontario Hydro, the predecessor to OPG, had failed to report tritium contamination of groundwater on the Pickering site for a period of 20 years. In 1979, 2,150,000 Bq/L of tritium were found in groundwater, and in 1994 Ontario Hydro found 700,000 Bq/L.59
4.3.3.1.3. Accidental ReleasesMajor releases of tritium oxide and other radioactive releases to surface waters have occurred during acci-dents at Canadian nuclear generating facilities.
In August 1992, a tube break at Pickering-1 caused the release of 2,000 L of heavy water contaminated with 2,300 trillion becquerels of tritium into Lake Ontario. A nearby drinking water plant was shut down and elevated levels of tritium (as high as 195 Bq/L60) were found in Toronto drinking water.61 (Nor-mal levels of tritium are about 7 to 11 Bq/L.) In April 1996, there was a heavy water leak at Pickering-4. Fifty trillion becquerels of tritium were released into Lake Ontario. Levels of tritium in local drinking water reached 100 times background levels.62
Phase III: Power Plant Operation
TotalBruce-A(TBq)
Bruce-B(TBq)
Pick-A (TBq)
Pick-B (TBq)
Darlington (TBq)
Gentilly-2 (TBq)
Pt. Lepreau (TBq)
2003 1.7 x 10⁻³ 6.5 x 10⁻³ - 1.1 x 10⁻² 1.2 x 10⁻³ 3.0 x 10⁻² 1.8 x 10⁻³
2002 1.4 x 10⁻³ 7.1 x 10⁻³ - 1.5 x 10⁻² 1.7 x 10⁻³ 2.6 x 10⁻² 3.4 x 10⁻³
2001 6.4 x 10⁻³ 3.1 x 10⁻³ - 3.3 x 10⁻³ 3.0 x 10⁻³ 3.4 x 10⁻² 2.8 x 10⁻³
Note: ‘-’ indicates that data was not reported.
Table 4.23: Radioactive Water Releases of Carbon-14 from Nuclear Power Plant Facilities58
TotalBruce-A(TBq)
Bruce-B(TBq)
Pick-A (TBq)
Pick-B (TBq)
Darlington (TBq)
Gentilly-2 (TBq)
Pt. Lepreau (TBq)
2003 6.0 x 101 8.0 x 10² 6.8 x 101 1.9 x 10² 1.0 x 10² 3.5 x 10² 8.1 x 101
2002 6.4 x 101 3.5 x 10² 7.7 x 101 2.1 x 10² 6.9 x 101 5.0 x 10² 1.4 x10²
2001 1.3 x 101 1.5 x 10² 1.3 x 10² 2.0 x 10² 9.4 x 101 4.5 x 10² 1.5 x10²
Table 4.21: Radioactive Water Releases of Tritium Oxide from Nuclear Power Plant Facilities56
TotalBruce-A(TBq)
Bruce-B(TBq)
Pick-A (TBq)
Pick-B (TBq)
Darlington (TBq)
Gentilly-2 (TBq)
Pt. Lepreau (TBq)
2003 8.8 x 10⁻⁴ 6.1 x 10⁻³ 3.0 x 10⁻³ 7.0 x 10⁻³ 7.3 x 10⁻³ 8.6 x 10⁻⁴ 1.0 x 10⁻³
2002 8.1 x 10⁻⁴ 3.0 x 10⁻³ 2.9 x 10⁻³ 1.4 x 10⁻² 8.5 x 10⁻³ 1.3 x 10⁻³ 3.0 x 10⁻³
2001 7.0 x 10⁻⁴ 2.4 x 10⁻³ 2.1 x 10⁻³ 1.1 x 10⁻² 5.6 x 10⁻³ 1.2 x 10⁻³ 1.3 x 10⁻³
Table 4.22: Radioactive Water Releases of Beta-Gamma Activity from Nuclear Power Plant Facilities57
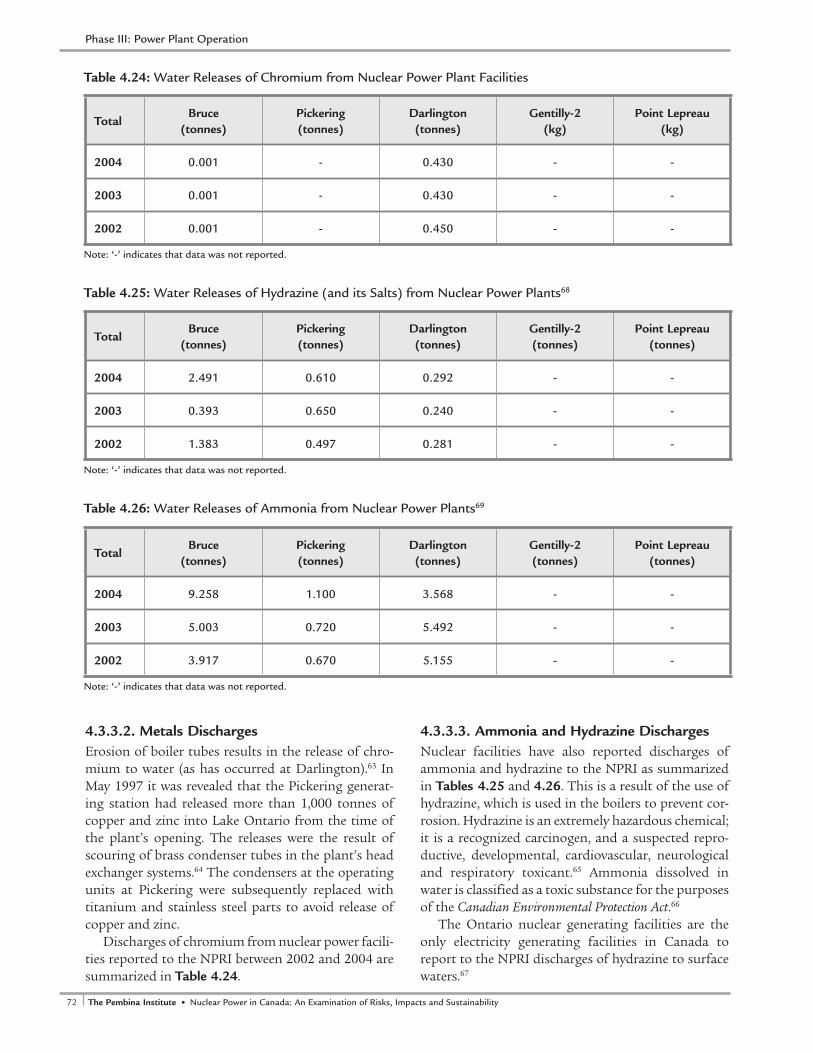
72 The Pembina Institute • Nuclear Power in Canada: An Examination of Risks, Impacts and Sustainability 73Nuclear Power in Canada: An Examination of Risks, Impacts and Sustainability • The Pembina Institute
4.3.3.2. Metals Discharges Erosion of boiler tubes results in the release of chro-mium to water (as has occurred at Darlington).63 In May 1997 it was revealed that the Pickering generat-ing station had released more than 1,000 tonnes of copper and zinc into Lake Ontario from the time of the plant’s opening. The releases were the result of scouring of brass condenser tubes in the plant’s head exchanger systems.64 The condensers at the operating units at Pickering were subsequently replaced with titanium and stainless steel parts to avoid release of copper and zinc.
Discharges of chromium from nuclear power facili-ties reported to the NPRI between 2002 and 2004 are summarized in Table 4.24.
4.3.3.3. Ammonia and Hydrazine DischargesNuclear facilities have also reported discharges of ammonia and hydrazine to the NPRI as summarized in Tables 4.25 and 4.26. This is a result of the use of hydrazine, which is used in the boilers to prevent cor-rosion. Hydrazine is an extremely hazardous chemical; it is a recognized carcinogen, and a suspected repro-ductive, developmental, cardiovascular, neurological and respiratory toxicant.65 Ammonia dissolved in water is classified as a toxic substance for the purposes of the Canadian Environmental Protection Act.66
The Ontario nuclear generating facilities are the only electricity generating facilities in Canada to report to the NPRI discharges of hydrazine to surface waters.67
TotalBruce
(tonnes)Pickering (tonnes)
Darlington (tonnes)
Gentilly-2 (kg)
Point Lepreau (kg)
2004 0.001 - 0.430 - -
2003 0.001 - 0.430 - -
2002 0.001 - 0.450 - -
Note: ‘-’ indicates that data was not reported.
Table 4.24: Water Releases of Chromium from Nuclear Power Plant Facilities
TotalBruce
(tonnes)Pickering (tonnes)
Darlington (tonnes)
Gentilly-2 (tonnes)
Point Lepreau (tonnes)
2004 2.491 0.610 0.292 - -
2003 0.393 0.650 0.240 - -
2002 1.383 0.497 0.281 - -
Note: ‘-’ indicates that data was not reported.
Table 4.25: Water Releases of Hydrazine (and its Salts) from Nuclear Power Plants68
TotalBruce
(tonnes)Pickering (tonnes)
Darlington (tonnes)
Gentilly-2 (tonnes)
Point Lepreau (tonnes)
2004 9.258 1.100 3.568 - -
2003 5.003 0.720 5.492 - -
2002 3.917 0.670 5.155 - -
Note: ‘-’ indicates that data was not reported.
Table 4.26: Water Releases of Ammonia from Nuclear Power Plants69
Phase III: Power Plant Operation
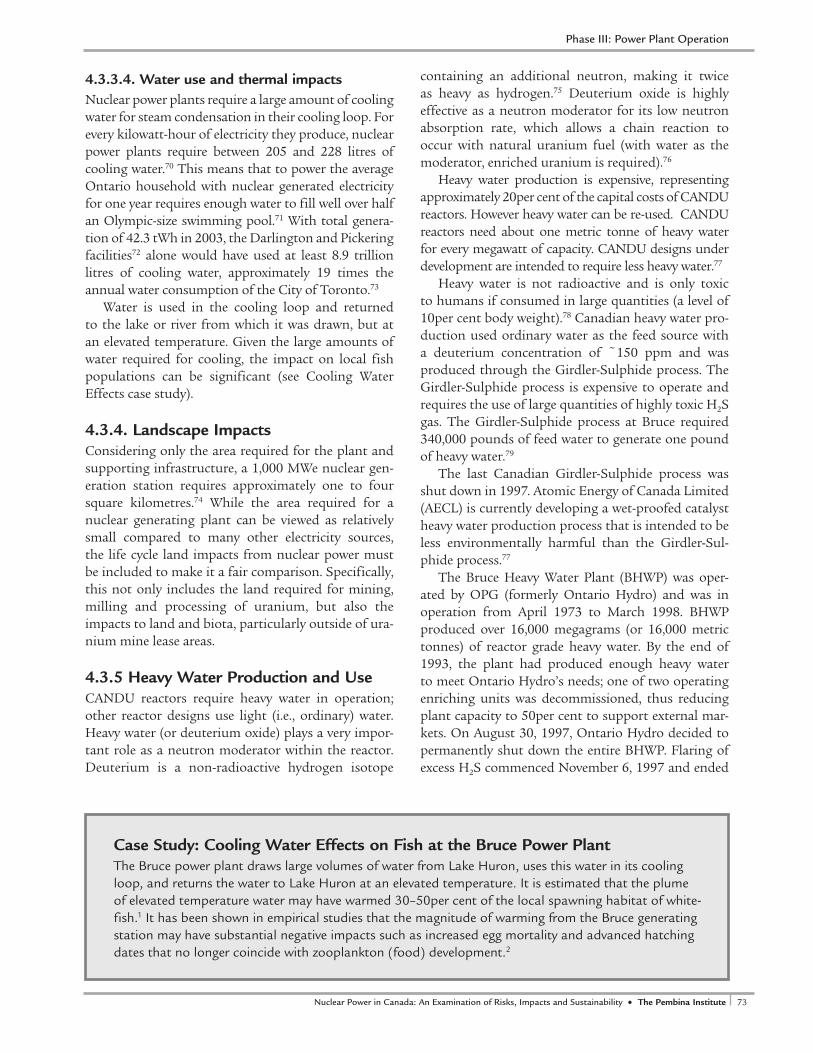
72 The Pembina Institute • Nuclear Power in Canada: An Examination of Risks, Impacts and Sustainability 73Nuclear Power in Canada: An Examination of Risks, Impacts and Sustainability • The Pembina Institute
4.3.3.4. Water use and thermal impactsNuclear power plants require a large amount of cooling water for steam condensation in their cooling loop. For every kilowatt-hour of electricity they produce, nuclear power plants require between 205 and 228 litres of cooling water.70 This means that to power the average Ontario household with nuclear generated electricity for one year requires enough water to fill well over half an Olympic-size swimming pool.71 With total genera-tion of 42.3 tWh in 2003, the Darlington and Pickering facilities72 alone would have used at least 8.9 trillion litres of cooling water, approximately 19 times the annual water consumption of the City of Toronto.73
Water is used in the cooling loop and returned to the lake or river from which it was drawn, but at an elevated temperature. Given the large amounts of water required for cooling, the impact on local fish populations can be significant (see Cooling Water Effects case study).
4.3.4. Landscape ImpactsConsidering only the area required for the plant and supporting infrastructure, a 1,000 MWe nuclear gen-eration station requires approximately one to four square kilometres.74 While the area required for a nuclear generating plant can be viewed as relatively small compared to many other electricity sources, the life cycle land impacts from nuclear power must be included to make it a fair comparison. Specifically, this not only includes the land required for mining, milling and processing of uranium, but also the impacts to land and biota, particularly outside of ura-nium mine lease areas.
4.3.5 Heavy Water Production and UseCANDU reactors require heavy water in operation; other reactor designs use light (i.e., ordinary) water. Heavy water (or deuterium oxide) plays a very impor-tant role as a neutron moderator within the reactor. Deuterium is a non-radioactive hydrogen isotope
containing an additional neutron, making it twice as heavy as hydrogen.75 Deuterium oxide is highly effective as a neutron moderator for its low neutron absorption rate, which allows a chain reaction to occur with natural uranium fuel (with water as the moderator, enriched uranium is required).76
Heavy water production is expensive, representing approximately 20per cent of the capital costs of CANDU reactors. However heavy water can be re-used. CANDU reactors need about one metric tonne of heavy water for every megawatt of capacity. CANDU designs under development are intended to require less heavy water.77
Heavy water is not radioactive and is only toxic to humans if consumed in large quantities (a level of 10per cent body weight).78 Canadian heavy water pro-duction used ordinary water as the feed source with a deuterium concentration of ~150 ppm and was produced through the Girdler-Sulphide process. The Girdler-Sulphide process is expensive to operate and requires the use of large quantities of highly toxic H2S gas. The Girdler-Sulphide process at Bruce required 340,000 pounds of feed water to generate one pound of heavy water.79
The last Canadian Girdler-Sulphide process was shut down in 1997. Atomic Energy of Canada Limited (AECL) is currently developing a wet-proofed catalyst heavy water production process that is intended to be less environmentally harmful than the Girdler-Sul-phide process.77
The Bruce Heavy Water Plant (BHWP) was oper-ated by OPG (formerly Ontario Hydro) and was in operation from April 1973 to March 1998. BHWP produced over 16,000 megagrams (or 16,000 metric tonnes) of reactor grade heavy water. By the end of 1993, the plant had produced enough heavy water to meet Ontario Hydro’s needs; one of two operating enriching units was decommissioned, thus reducing plant capacity to 50per cent to support external mar-kets. On August 30, 1997, Ontario Hydro decided to permanently shut down the entire BHWP. Flaring of excess H2S commenced November 6, 1997 and ended
Case Study: Cooling Water Effects on Fish at the Bruce Power PlantThe Bruce power plant draws large volumes of water from Lake Huron, uses this water in its cooling loop, and returns the water to Lake Huron at an elevated temperature. It is estimated that the plume of elevated temperature water may have warmed 30–50per cent of the local spawning habitat of white-fish.1 It has been shown in empirical studies that the magnitude of warming from the Bruce generating station may have substantial negative impacts such as increased egg mortality and advanced hatching dates that no longer coincide with zooplankton (food) development.2
Phase III: Power Plant Operation
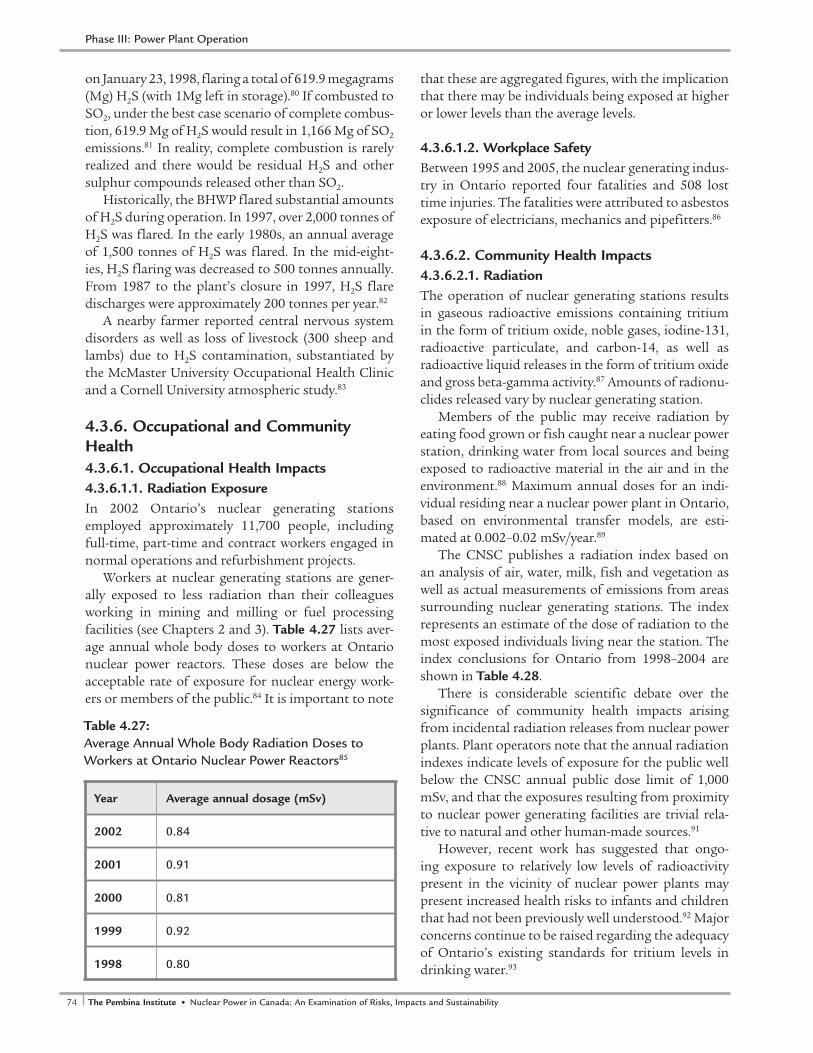
74 The Pembina Institute • Nuclear Power in Canada: An Examination of Risks, Impacts and Sustainability 75Nuclear Power in Canada: An Examination of Risks, Impacts and Sustainability • The Pembina Institute
on January 23, 1998, flaring a total of 619.9 megagrams (Mg) H2S (with 1Mg left in storage).80 If combusted to SO2, under the best case scenario of complete combus-tion, 619.9 Mg of H2S would result in 1,166 Mg of SO2 emissions.81 In reality, complete combustion is rarely realized and there would be residual H2S and other sulphur compounds released other than SO2.
Historically, the BHWP flared substantial amounts of H2S during operation. In 1997, over 2,000 tonnes of H2S was flared. In the early 1980s, an annual average of 1,500 tonnes of H2S was flared. In the mid-eight-ies, H2S flaring was decreased to 500 tonnes annually. From 1987 to the plant’s closure in 1997, H2S flare discharges were approximately 200 tonnes per year.82
A nearby farmer reported central nervous system disorders as well as loss of livestock (300 sheep and lambs) due to H2S contamination, substantiated by the McMaster University Occupational Health Clinic and a Cornell University atmospheric study.83
4.3.6. Occupational and Community Health 4.3.6.1. Occupational Health Impacts4.3.6.1.1. Radiation ExposureIn 2002 Ontario’s nuclear generating stations employed approximately 11,700 people, including full-time, part-time and contract workers engaged in normal operations and refurbishment projects.
Workers at nuclear generating stations are gener-ally exposed to less radiation than their colleagues working in mining and milling or fuel processing facilities (see Chapters 2 and 3). Table 4.27 lists aver-age annual whole body doses to workers at Ontario nuclear power reactors. These doses are below the acceptable rate of exposure for nuclear energy work-ers or members of the public.84 It is important to note
that these are aggregated figures, with the implication that there may be individuals being exposed at higher or lower levels than the average levels.
4.3.6.1.2. Workplace SafetyBetween 1995 and 2005, the nuclear generating indus-try in Ontario reported four fatalities and 508 lost time injuries. The fatalities were attributed to asbestos exposure of electricians, mechanics and pipefitters.86
4.3.6.2. Community Health Impacts4.3.6.2.1. RadiationThe operation of nuclear generating stations results in gaseous radioactive emissions containing tritium in the form of tritium oxide, noble gases, iodine-131, radioactive particulate, and carbon-14, as well as radioactive liquid releases in the form of tritium oxide and gross beta-gamma activity.87 Amounts of radionu-clides released vary by nuclear generating station.
Members of the public may receive radiation by eating food grown or fish caught near a nuclear power station, drinking water from local sources and being exposed to radioactive material in the air and in the environment.88 Maximum annual doses for an indi-vidual residing near a nuclear power plant in Ontario, based on environmental transfer models, are esti-mated at 0.002–0.02 mSv/year.89
The CNSC publishes a radiation index based on an analysis of air, water, milk, fish and vegetation as well as actual measurements of emissions from areas surrounding nuclear generating stations. The index represents an estimate of the dose of radiation to the most exposed individuals living near the station. The index conclusions for Ontario from 1998–2004 are shown in Table 4.28.
There is considerable scientific debate over the significance of community health impacts arising from incidental radiation releases from nuclear power plants. Plant operators note that the annual radiation indexes indicate levels of exposure for the public well below the CNSC annual public dose limit of 1,000 mSv, and that the exposures resulting from proximity to nuclear power generating facilities are trivial rela-tive to natural and other human-made sources.91
However, recent work has suggested that ongo-ing exposure to relatively low levels of radioactivity present in the vicinity of nuclear power plants may present increased health risks to infants and children that had not been previously well understood.92 Major concerns continue to be raised regarding the adequacy of Ontario’s existing standards for tritium levels in drinking water.93
Year Average annual dosage (mSv)
2002 0.84
2001 0.91
2000 0.81
1999 0.92
1998 0.80
Table 4.27: Average Annual Whole Body Radiation Doses to Workers at Ontario Nuclear Power Reactors85
Phase III: Power Plant Operation
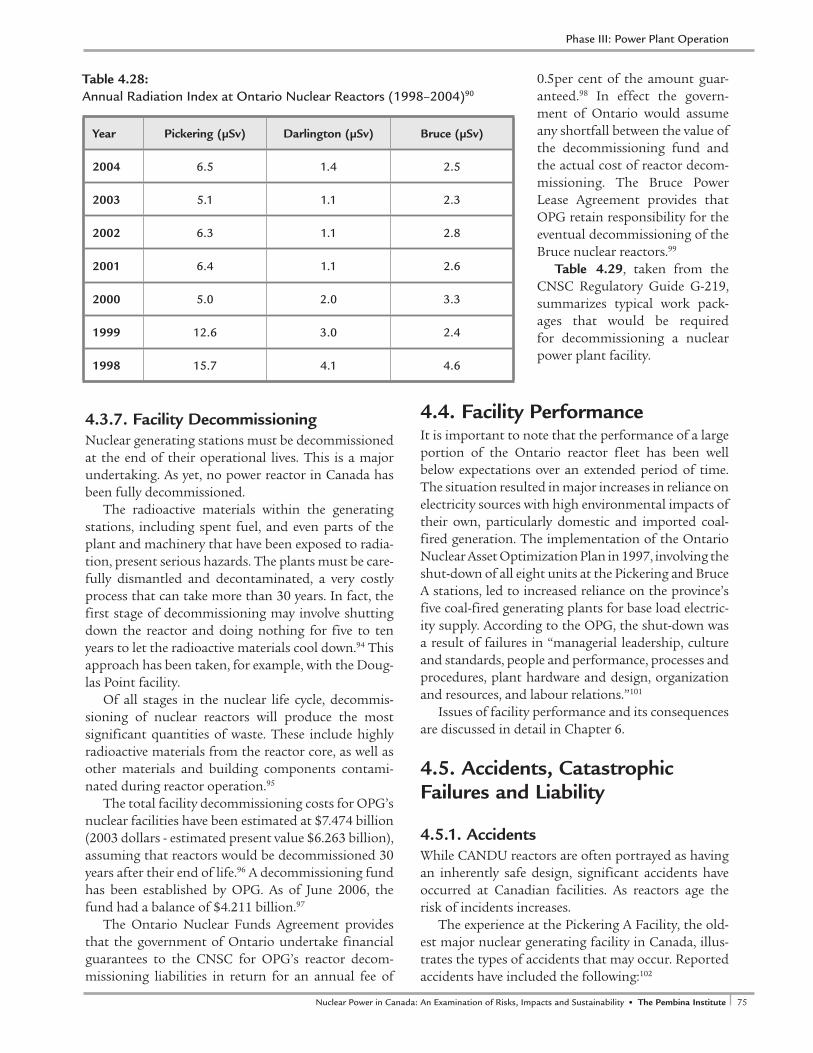
74 The Pembina Institute • Nuclear Power in Canada: An Examination of Risks, Impacts and Sustainability 75Nuclear Power in Canada: An Examination of Risks, Impacts and Sustainability • The Pembina Institute
4.3.7. Facility Decommissioning Nuclear generating stations must be decommissioned at the end of their operational lives. This is a major undertaking. As yet, no power reactor in Canada has been fully decommissioned.
The radioactive materials within the generating stations, including spent fuel, and even parts of the plant and machinery that have been exposed to radia-tion, present serious hazards. The plants must be care-fully dismantled and decontaminated, a very costly process that can take more than 30 years. In fact, the first stage of decommissioning may involve shutting down the reactor and doing nothing for five to ten years to let the radioactive materials cool down.94 This approach has been taken, for example, with the Doug-las Point facility.
Of all stages in the nuclear life cycle, decommis-sioning of nuclear reactors will produce the most significant quantities of waste. These include highly radioactive materials from the reactor core, as well as other materials and building components contami-nated during reactor operation.95
The total facility decommissioning costs for OPG’s nuclear facilities have been estimated at $7.474 billion (2003 dollars - estimated present value $6.263 billion), assuming that reactors would be decommissioned 30 years after their end of life.96 A decommissioning fund has been established by OPG. As of June 2006, the fund had a balance of $4.211 billion.97
The Ontario Nuclear Funds Agreement provides that the government of Ontario undertake financial guarantees to the CNSC for OPG’s reactor decom-missioning liabilities in return for an annual fee of
0.5per cent of the amount guar-anteed.98 In effect the govern-ment of Ontario would assume any shortfall between the value of the decommissioning fund and the actual cost of reactor decom-missioning. The Bruce Power Lease Agreement provides that OPG retain responsibility for the eventual decommissioning of the Bruce nuclear reactors.99
Table 4.29, taken from the CNSC Regulatory Guide G-219, summarizes typical work pack-ages that would be required for decommissioning a nuclear power plant facility.
4.4. Facility PerformanceIt is important to note that the performance of a large portion of the Ontario reactor fleet has been well below expectations over an extended period of time. The situation resulted in major increases in reliance on electricity sources with high environmental impacts of their own, particularly domestic and imported coal-fired generation. The implementation of the Ontario Nuclear Asset Optimization Plan in 1997, involving the shut-down of all eight units at the Pickering and Bruce A stations, led to increased reliance on the province’s five coal-fired generating plants for base load electric-ity supply. According to the OPG, the shut-down was a result of failures in “managerial leadership, culture and standards, people and performance, processes and procedures, plant hardware and design, organization and resources, and labour relations.”101
Issues of facility performance and its consequences are discussed in detail in Chapter 6.
4.5. Accidents, Catastrophic Failures and Liability
4.5.1. AccidentsWhile CANDU reactors are often portrayed as having an inherently safe design, significant accidents have occurred at Canadian facilities. As reactors age the risk of incidents increases.
The experience at the Pickering A Facility, the old-est major nuclear generating facility in Canada, illus-trates the types of accidents that may occur. Reported accidents have included the following:102
Year Pickering (µSv) Darlington (µSv) Bruce (µSv)
2004 6.5 1.4 2.5
2003 5.1 1.1 2.3
2002 6.3 1.1 2.8
2001 6.4 1.1 2.6
2000 5.0 2.0 3.3
1999 12.6 3.0 2.4
1998 15.7 4.1 4.6
Table 4.28: Annual Radiation Index at Ontario Nuclear Reactors (1998–2004)90
Phase III: Power Plant Operation
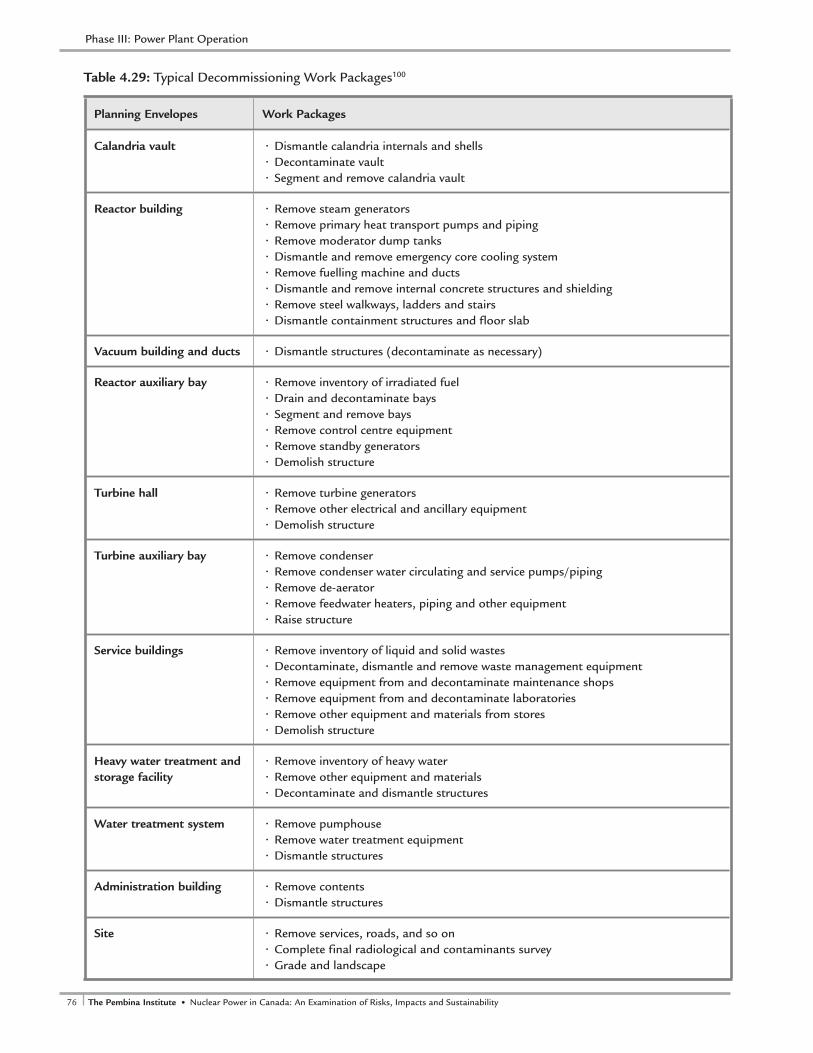
76 The Pembina Institute • Nuclear Power in Canada: An Examination of Risks, Impacts and Sustainability 77Nuclear Power in Canada: An Examination of Risks, Impacts and Sustainability • The Pembina Institute
Planning Envelopes Work Packages
Calandria vault • Dismantle calandria internals and shells• Decontaminate vault• Segment and remove calandria vault
Reactor building • Remove steam generators• Remove primary heat transport pumps and piping• Remove moderator dump tanks• Dismantle and remove emergency core cooling system• Remove fuelling machine and ducts• Dismantle and remove internal concrete structures and shielding• Remove steel walkways, ladders and stairs• Dismantle containment structures and floor slab
Vacuum building and ducts • Dismantle structures (decontaminate as necessary)
Reactor auxiliary bay • Remove inventory of irradiated fuel• Drain and decontaminate bays• Segment and remove bays• Remove control centre equipment• Remove standby generators• Demolish structure
Turbine hall • Remove turbine generators• Remove other electrical and ancillary equipment• Demolish structure
Turbine auxiliary bay • Remove condenser• Remove condenser water circulating and service pumps/piping• Remove de-aerator• Remove feedwater heaters, piping and other equipment• Raise structure
Service buildings • Remove inventory of liquid and solid wastes• Decontaminate, dismantle and remove waste management equipment• Remove equipment from and decontaminate maintenance shops• Remove equipment from and decontaminate laboratories• Remove other equipment and materials from stores• Demolish structure
Heavy water treatment and storage facility
• Remove inventory of heavy water• Remove other equipment and materials• Decontaminate and dismantle structures
Water treatment system • Remove pumphouse• Remove water treatment equipment• Dismantle structures
Administration building • Remove contents• Dismantle structures
Site • Remove services, roads, and so on• Complete final radiological and contaminants survey• Grade and landscape
Table 4.29: Typical Decommissioning Work Packages100
Phase III: Power Plant Operation

76 The Pembina Institute • Nuclear Power in Canada: An Examination of Risks, Impacts and Sustainability 77Nuclear Power in Canada: An Examination of Risks, Impacts and Sustainability • The Pembina Institute
• On August 1, 1983, Pickering reactor 2 had a loss of coolant accident after a pressure tube suffered a metre-long rupture. The station was shut down and the four reactors at Pickering A were eventu-ally retubed at a cost of about $1 billion.
• On November 22, 1988, an operator error dam-aged 36 fuel bundles. The cooling system was con-taminated by radioactive iodine that was vented into the environment over several weeks following the accident.
• On September 25, 1990, Pickering reactor 2 expe-rienced large power shifts in the reactor core. Staff spent two days trying to stabilize it before shut-ting it down. The AECB later criticized the utility for not shutting down immediately.
• On August 2, 1992, Pickering reactor 1 had a heavy water leak from a heat exchanger that resulted in a release of 2,300 trillion Bq of radioac-tive tritium into Lake Ontario.
• On April 15, 1996, Pickering reactor 4 had a heavy water leak from a heat exchanger that resulted in a release of 50 trillion Bq of tritium into Lake Ontario.
4.5.2. Catastrophic FailuresNuclear generating facilities are unique among elec-tricity generating systems in that they have the poten-tial to release large amounts of radioactive materials to the environment in the event of a catastrophic fail-ure. The 1986 Chernobyl accident has been the most extreme example of such an event to date.103
It has been noted that, in comparison with the majority of the world’s commercial reactors, which are pressurized, light water reactors (PWR), the CANDU heavy water reactor design has several inher-ent safety advantages. A CANDU reactor has relatively large inventories of both (heavy) water and uranium. If cooling of the reactor core is interrupted for what-ever reason, the thermal mass of the (heavy) water and uranium will slow the rate of temperature increase in the reactor core. The separation of cooling water and moderator water in the CANDU design is also seen as a safety advantage.104
At the same time, it has also been noted that the CANDU design uses a relatively large amount of zir-conium alloy in the fuel bundles, almost four times as much as is present in some light water reactors. This large zirconium inventory gives CANDU reactors an inherent safety disadvantage. Zirconium reacts vigor-ously and exothermically (produces heat) with steam at the high temperatures that would be experienced during a core damage accident. This reaction pro-
duces hydrogen gas that can quickly reach explosive concentrations within the reactor containment build-ing.105
Another area of concern is the potential serious-ness of a loss of coolant accident. In light water reac-tors, the power level declines if the cooling water is lost. In CANDU reactors, like the RBMK reactor in Chernobyl, however, power levels increase when coolant is lost. An accident of particular concern for CANDU reactors involves a loss of coolant accident together with a failure of the reactor shutdown sys-tem. If the fast shutdown fails, the power level can rise dramatically. A violent disruption of the reactor core can occur within four to five seconds and release sig-nificant quantities of radioactive materials.106
Assessments of the potential for major accidents at Canadian nuclear generating stations have sug-gested a very low probability of severe core damage or major releases of radioactive materials. The probabil-ity of severe core damage at the Darlington station, for example, has been estimated at 1.5 per 100,000 years of reactor operation.107 The reliability of these estimates has been challenged.108 Catastrophic acci-dents at generating facilities would have impacts over a much wider area and longer term than accidents involving any other electricity generating technology, particularly as a result of the large-scale release of radiation and radionuclides.
Modelling undertaking in the early 1990s esti-mated that a major accident at the Darlington nuclear generating station east of Toronto, would result in an average collective radiation does of 2.7 million person-Seivert. By comparison, the Chernnobel accident led to a collective radiation does of at least 600,000 to 1.2 million person-Seivert. The monetized value of the offsite consequences of a severe accident at the Dar-lington facility was estimated to be at least $1 trillion (1991 $Cdn).109
4.5.3. Accident Liability Currently, the liability of OPG and/or Bruce Power in the event of a nuclear accident is limited to $75 mil-lion by the Nuclear Liability Act. Additionally, manu-facturers of nuclear reactor components are exempt from all liability.110 The $75 million limitation was first stipulated in 1976 and was to be reviewed every five years.111
In 2001, officials from Natural Resources Canada pointed out that, accounting for inflation, an equiva-lent amount would be $250 million, while interna-tional standards at the time were approximately $650 million.112 The Senate Standing Committee on Energy,
Phase III: Power Plant Operation
78 The Pembina Institute • Nuclear Power in Canada: An Examination of Risks, Impacts and Sustainability 79Nuclear Power in Canada: An Examination of Risks, Impacts and Sustainability • The Pembina Institute
Environment and Natural Resources, in its 2002 review of nuclear safety issues in Canada, concluded that, considering emerging international standards, a requirement for liability coverage by operators in the range of $3 billion would be more appropriate.113
4.6. ConclusionsPerhaps the most significant environmental impact of nuclear power plant operation in Canada is the gen-eration of approximately 85,000 waste fuel bundles each year. These fuel bundles are extremely radioac-tive, contain other toxic materials, and require isola-tion from the environment for one million years. No long-term management strategy for these wastes is in place, although a strategy has been proposed by the Nuclear Waste Management Organization. As of 2003, 1.7 million waste fuel bundles were in storage at nuclear generating facilities in Canada.
In addition, the Ontario facilities generate between 5,500 and 7,000 m3 of low-level radioactive wastes per year as a result of plant operations, maintenance and refurbishment activities. There is no national man-agement strategy for low and intermediate radioactive wastes in place or under development in Canada. OPG is pursing the development of a deep underground disposal facility the low- and intermediate- wastes generated at Ontario facilities.
A wide range of pollutants, including radiological contaminants, persistent organic pollutants, heavy metals and criteria air pollutants have been released to the atmosphere as a result of the incineration of a portion of the low- and intermediate-level wastes generated in Ontario at the Bruce facility. A new incinerator, commissioned in 2003 has subsequently reduced emissions of non-radiological pollutants. Large amounts of waste heavy metals and other hazardous wastes (e.g., asbestos) are also generated as a result of facility operation, maintenance and refurbishment activities.
Large amounts of radioactive and hazardous wastes will be generated from reactor decommission-ing, which is expected to occur 30 years after the end of a facility’s operational lifetime. The costs of decom-missioning Ontario’s existing reactors have been esti-mated at $7.474 billion (present value $6.263 billion). The decommissioning fund maintained by OPG cur-rently has a balance of $4.211 billion. The province of Ontario provides a financial guarantee for any short-fall between the value of the decommissioning fund and the actual costs of decommissioning.
There are routine and accidental releases of tritium oxide and carbon-14 to surface water and groundwater
from nuclear generating facilities. The health and envi-ronmental significance of these releases is highly dis-puted. Ontario’s current drinking water quality stan-dards for tritium are substantially weaker than those in place in the United States and European Union.
In addition, Ontario nuclear facilities are the most significant source of discharges of hydrazine, a recog-nized carcinogen, to surface waters in Canada. There have also been significant discharges of metals (copper, zinc and chromium) as a result of scouring and corro-sion of boilers and heat exchangers at the facilities.
Nuclear generating facilities use large amounts of cooling water. The Darlington and Pickering facilities, for example, used at least 8.9 trillion litres in 2003, more than 19 times the annual water consumption of the City of Toronto. Adverse impacts on fish arising from the thermal impacts of large cooling water dis-charges have been noted.
Routine and accidental releases of tritium oxide, noble gases, iodine-131, radioactive particulates, elemental tritium (Darlington only) and carbon-14 to the atmosphere occur in the course of plant opera-tions. Recent studies have suggested that the commu-nity health impacts of these releases, particularly with respect to their effects on infants and children, may be more significant than previously thought.
Ontario nuclear generating facilities are the most significant source of atmospheric releases of hydra-zine, an extremely hazardous pollutant, in Canada. Minor releases of criteria air pollutants and GHGs occur as a result of the testing of fossil fuel-powered emergency generating equipment at nuclear generat-ing facilities.
Historically, large scale (up to 2,000 tonnes per year) flaring of H2S was associated with the produc-tion of the heavy water moderator for CANDU reac-tors. The process also used large amounts of water.
There is a history of accidents, particularly at the Pickering facility, resulting in releases of radioac-tive materials to the environment, and a potential, although, low probability, of catastrophic accidents at nuclear generating facilities. Catastrophic accidents at generating facilities would have impacts over a much wider area and longer term than accidents involving any other electricity generating technology, particu-larly as a result of the large-scale release of radiation and radionuclides. The monetized value of the off-site consequences of a severe accident at the Darlington facility, for example, has been estimated to be at least $1 trillion (1991 $Cdn).
Phase III: Power Plant Operation

78 The Pembina Institute • Nuclear Power in Canada: An Examination of Risks, Impacts and Sustainability 79Nuclear Power in Canada: An Examination of Risks, Impacts and Sustainability • The Pembina Institute
Summary of Findings• Approximately 85,000 waste fuel bundles are generated each year in Canadian nuclear
reactors. It is estimated there will be 3.6 million waste fuel bundles in storage in Canada by 2033.
• Waste nuclear fuel is extremely hazardous, and remains hazardous over extremely long time frames. It requires management over the very long term (i.e., one million years) to protect human health and the environment and to address the risks of the use of uranium and plutonium contained in waste fuel for nuclear weapons or other damaging purposes.
• No strategy for managing waste nuclear fuel in Canada is in place. The Nuclear Waste Management Organization (NMWO) has proposed a “phased adaptive management strategy” culminating in storage in a deep geological repository, with a total cost of $24 billion. The proposed strategy would require more than 300 years to be fully implement-ed. The NWMO proposal is now under consideration by the federal government.
• OPG will be responsible for more than ninety per cent of the waste fuel generated in Canada. OPG’s current waste fuel management fund and contributions to the NWMO’s trust fund are not sufficient to cover the estimated cost of OPG waste fuel management, with the difference in costs being guaranteed by the province of Ontario. The current arrangements between OPG and the province of Ontario do not reflect the increased amounts of waste fuel that would be generated as a result of the proposed extensions of reactor lifetimes or the construction of new reactors.
• Short-term risks of waste fuel management are seen to be largely associated with the large-scale transportation of waste fuel that would flow from a central repository strategy. As a result of the risk of accidents or other incidents, waste transportation is generally regarded as the most dangerous and highest risk aspect of nuclear waste management.
• The most direct short-term impacts of waste fuel management are the air pollution associated with transportation of waste fuel to a central storage facility and long-term disposal facility. If transportation occurs by road, it would involve 19,000 shipments over a 30-year period, or 53 shipments per month.
• The long-term risks arising from waste fuel disposal are ultimately unknown, given timeframes over which a permanent repository would be required to last.
• Waste nuclear fuel management presents major ethical challenges. Failures of present management options may leave future generations with very large costs and risks.
5. Phase IV: Waste Fuel Management

80 The Pembina Institute • Nuclear Power in Canada: An Examination of Risks, Impacts and Sustainability 81Nuclear Power in Canada: An Examination of Risks, Impacts and Sustainability • The Pembina Institute
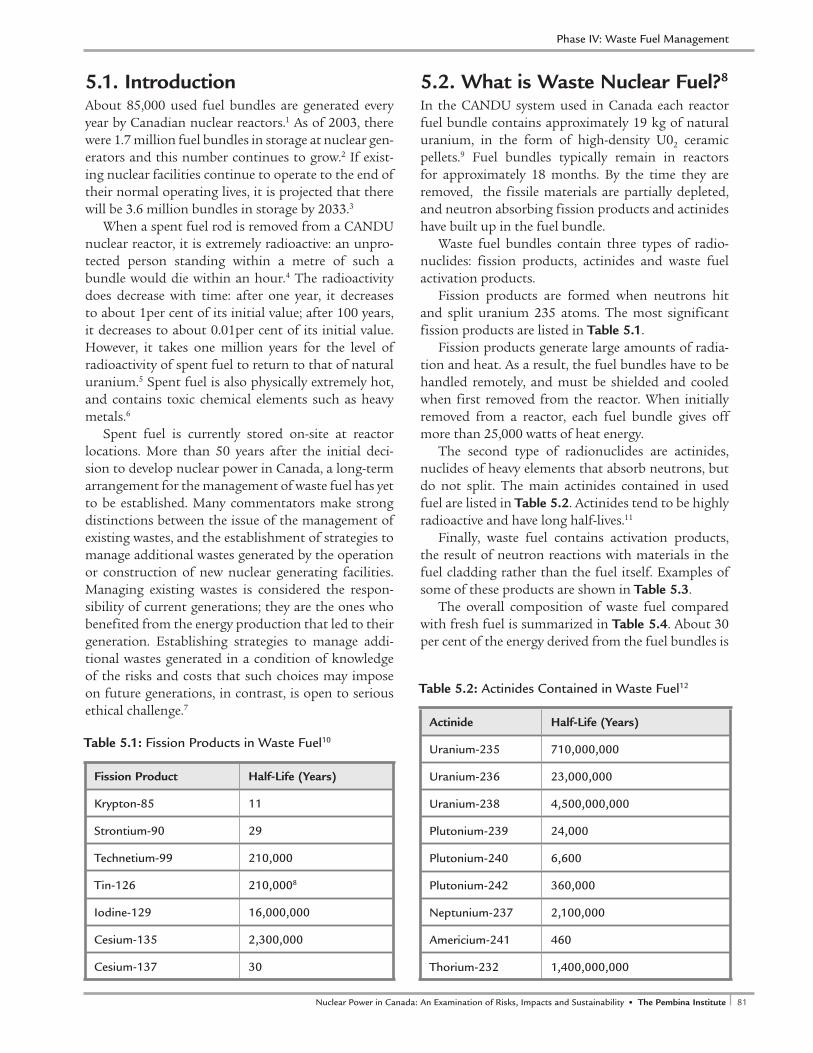
80 The Pembina Institute • Nuclear Power in Canada: An Examination of Risks, Impacts and Sustainability 81Nuclear Power in Canada: An Examination of Risks, Impacts and Sustainability • The Pembina Institute
5.1. Introduction About 85,000 used fuel bundles are generated every year by Canadian nuclear reactors.1 As of 2003, there were 1.7 million fuel bundles in storage at nuclear gen-erators and this number continues to grow.2 If exist-ing nuclear facilities continue to operate to the end of their normal operating lives, it is projected that there will be 3.6 million bundles in storage by 2033.3
When a spent fuel rod is removed from a CANDU nuclear reactor, it is extremely radioactive: an unpro-tected person standing within a metre of such a bundle would die within an hour.4 The radioactivity does decrease with time: after one year, it decreases to about 1per cent of its initial value; after 100 years, it decreases to about 0.01per cent of its initial value. However, it takes one million years for the level of radioactivity of spent fuel to return to that of natural uranium.5 Spent fuel is also physically extremely hot, and contains toxic chemical elements such as heavy metals.6
Spent fuel is currently stored on-site at reactor locations. More than 50 years after the initial deci-sion to develop nuclear power in Canada, a long-term arrangement for the management of waste fuel has yet to be established. Many commentators make strong distinctions between the issue of the management of existing wastes, and the establishment of strategies to manage additional wastes generated by the operation or construction of new nuclear generating facilities. Managing existing wastes is considered the respon-sibility of current generations; they are the ones who benefited from the energy production that led to their generation. Establishing strategies to manage addi-tional wastes generated in a condition of knowledge of the risks and costs that such choices may impose on future generations, in contrast, is open to serious ethical challenge.7
5.2. What is Waste Nuclear Fuel?8
In the CANDU system used in Canada each reactor fuel bundle contains approximately 19 kg of natural uranium, in the form of high-density U02 ceramic pellets.9 Fuel bundles typically remain in reactors for approximately 18 months. By the time they are removed, the fissile materials are partially depleted, and neutron absorbing fission products and actinides have built up in the fuel bundle.
Waste fuel bundles contain three types of radio-nuclides: fission products, actinides and waste fuel activation products.
Fission products are formed when neutrons hit and split uranium 235 atoms. The most significant fission products are listed in Table 5.1.
Fission products generate large amounts of radia-tion and heat. As a result, the fuel bundles have to be handled remotely, and must be shielded and cooled when first removed from the reactor. When initially removed from a reactor, each fuel bundle gives off more than 25,000 watts of heat energy.
The second type of radionuclides are actinides, nuclides of heavy elements that absorb neutrons, but do not split. The main actinides contained in used fuel are listed in Table 5.2. Actinides tend to be highly radioactive and have long half-lives.11
Finally, waste fuel contains activation products, the result of neutron reactions with materials in the fuel cladding rather than the fuel itself. Examples of some of these products are shown in Table 5.3.
The overall composition of waste fuel compared with fresh fuel is summarized in Table 5.4. About 30 per cent of the energy derived from the fuel bundles is
Table 5.1: Fission Products in Waste Fuel10
Phase IV: Waste Fuel Management
Actinide Half-Life (Years)
Uranium-235 710,000,000
Uranium-236 23,000,000
Uranium-238 4,500,000,000
Plutonium-239 24,000
Plutonium-240 6,600
Plutonium-242 360,000
Neptunium-237 2,100,000
Americium-241 460
Thorium-232 1,400,000,000
Table 5.2: Actinides Contained in Waste Fuel12
Fission Product Half-Life (Years)
Krypton-85 11
Strontium-90 29
Technetium-99 210,000
Tin-126 210,0008
Iodine-129 16,000,000
Cesium-135 2,300,000
Cesium-137 30

82 The Pembina Institute • Nuclear Power in Canada: An Examination of Risks, Impacts and Sustainability 83Nuclear Power in Canada: An Examination of Risks, Impacts and Sustainability • The Pembina Institute
derived from the fissioning of plutonium. Radioactive decay continues when the used fuel
is removed from the reactor, causing emissions of radiation and heat at decreasing rates and changing composition over time. Of the 350 different isotopes present, approximately 200 are radioactive. The total radioactivity per bundle of used fuel is summarized in Figure 5.1 below.
The level of radioactivity declines rapidly at first, then tails off. Activity declines to that of natural ura-nium and its associated decay products after approxi-mately one million years. It is assumed that waste fuel will need to be isolated from the environment until its radioactivity reaches that level.
In addition to the hazards of radioactivity and heat, used nuclear fuel has the potential to release chemically toxic elements, including heavy metals. Uranium itself has greater chemical toxicity than radiotoxicity; once it decays it becomes lead, which is also toxic. Other elemental products of radioactive decay are rare, but do exist, and little is known about their environmental behaviour. In addition to the trace elements that appear from the decay of radio-nuclides, there are a number of trace elements present in the fuel cladding or containment vessels. If these contaminants move into ground or surface waters or enter the atmosphere and are taken up by organisms, they can cause harm.16
In addition to the immediate safety, health and environmental risks posed by waste nuclear fuel, the waste fuel contains materials (uranium-235 and plu-tonium-239) that can be used for nuclear weapons production. These fissile materials are highly attrac-tive materials for countries or individuals seeking to develop nuclear weapons.17 Although the radioactiv-ity of fresh waste fuel makes the extraction of pluto-nium difficult, after some decades radioactivity falls sufficiently to make extraction relatively easy.18 This implies that waste fuel not only needs to be isolated from the environment for a time period of approxi-mately one million years, but also needs to be kept secure from deliberate human disturbance for weap-ons development purposes.
These environment and security requirements clearly present major technological and manage-rial challenges. Waste nuclear fuel management also presents major ethical issues. The risks and costs of potential failures of any management strategy chosen may fall on generations far into the future, rather than on current generations that consumed the electricity associated with the production of the waste fuel.
Figure 5.1: Total Radioactivity Per Bundle of Used Fuel15
���� ��� ��� ��� ���
������������
���
�����
�����
����
���
��������������������
���
���
����
����
����
����
���
���
����
����
����
����
��������������������������������������������������
�����������������������������������������
�����
��������������������������������������������������
���������������������������������������������
Phase IV: Waste Fuel Management
Table 5.3: Waste Fuel Activation Products13
Isotope Half-Life (Years)
Carbon-14 5,700
Chlorine-36 300,000
Zirconium-93 1,500,000
Table 5.4: Composition of Waste Fuel Compared to Fresh Fuel14
Component Composition of Fresh Fuel, %
Composition of Used Fuel, %
Uranium-235 0.72 0.23
Uranium-236 0 0.07
Uranium-238 99.28 98.58
Plutonium-239 0 0.25
Plutonium-240 0 0.10
Plutonium-241 0 0.02
Plutonium-242 0 0.01
Fission products - 0.74

82 The Pembina Institute • Nuclear Power in Canada: An Examination of Risks, Impacts and Sustainability 83Nuclear Power in Canada: An Examination of Risks, Impacts and Sustainability • The Pembina Institute
Storage Location Licencee Fuel Bundles in Reactor
Used Fuel Bundles in Wet Storage
Used Fuel Bundles in Dry Storage
Total Fuel Bundles
ONTARIO
Bruce A (1) Bruce Power Corporation
0 354,567 0 354,567
Bruce B (1) Bruce Power Corporation
24,679 356,519 0 381,198
Pickering (2) Ontario Power Generation
96,796 393,690 99,106 529,552
Darlington (3) Ontario Power Generation
24,960 211,932 0 238,892
Douglas Point (13) AECL 0 22,256 22,256
Chalk River Laboratories (12)
(used fuel from Rolphton Nuclear Power Demonstration)
AECL 0 4,853 4,853
QUEBEC
Gentilly 1 (14) AECL 0 0 3,213 3,213
Gentilly2 (4) Hydro-Quebec 4,560 37,181 48,000 89,741
NEW BRUNSWICK
Point Lepreau (5) New Brunswick Power 4,560 40,482 52,920 97,962
MANITOBA
Whiteshell Laboratories (15)
(used fuel from Douglas Point and non-standard waste)
AECL 0 360 360
TOTAL 95,515 1,394,371 230,708 1,720,594
5.3. Current Management PracticesAll nuclear fuel waste in Canada is currently in “inter-im storage” at reactor sites pending a resolution of the question of long-term management. When the waste fuel is removed from the reactor it is initially placed in water-filled pools, where it remains until its heat and radioactivity decline. After approximately seven to ten years, the bundles are transferred to dry stor-age at the reactor sites. Dry storage containers are designed to last 50 years, at which point they have to be replaced.19
The total amounts of waste fuel in storage in Can-ada as of December 2002 are shown in Table 5.5.
5.4. Waste Fuel Management InitiativesThe decision to pursue the development of nuclear energy for electricity generation in Canada was made in the 1950s, and the construction of generating facili-ties was initiated in the 1960s.21 However, serious con-sideration of how to manage waste fuel did not begin in Canada until the early 1970s, after the first generat-ing facilities had been brought into service.
In 1977, the federal department of Energy, Mines and Resources engaged an expert group under the chair of Dr. Kenneth Hare to examine potential man-agement methods. The resulting “Hare Report” con-cluded that deep burial in the Canadian Shield would
Table 5.5: Waste Nuclear Fuel in Storage in Canada, December 200220
Phase IV: Waste Fuel Management
84 The Pembina Institute • Nuclear Power in Canada: An Examination of Risks, Impacts and Sustainability 85Nuclear Power in Canada: An Examination of Risks, Impacts and Sustainability • The Pembina Institute
be the best approach. Subsequently, Atomic Energy of Canada was given responsibility for researching and developing “disposal in a deep underground reposi-tory in intrusive igneous rock.”22
Between 1978 and 1995, $538 million was spent on research and development of the concept of deep geological disposal of nuclear waste in hard rock. Of this amount, about $370 million was federal fund-ing to AECL and about $133 million was provided by Ontario Hydro, with the balance coming from other sources, primarily foreign waste management research agencies.23
In the late 1980s the concept of deep disposal in the Canadian Shield was examined under the fed-eral Environmental Assessment Review Process. The Environmental Assessment Panel, chaired by Blair Seaborn, tabled its report in 1988. The panel’s conclu-sions were as follows:24
• “From a technical perspective, safety of the AECL concept has been on balance adequately demon-strated for a conceptual stage of development, but from a social perspective, it has not.
• As it stands, the AECL concept for deep geological disposal has not been demonstrated to have broad public support. The concept in its current form does not have the required level of acceptability to be adopted as Canada’s approach for managing nuclear fuel wastes.” The panel identified a number of additional steps
that would be required to develop an approach for managing nuclear fuel wastes in a way that could achieve broad public support. These included• issuing a policy statement on managing nuclear
fuel wastes; • initiating an Aboriginal participation process; • creating a nuclear fuel waste management agency
(NFWMA); • conducting a public review of AECB regulatory
documents using a more effective consultation process;
• developing a comprehensive public participation plan;
• developing an ethical and social assessment framework; and
• developing and comparing options for managing nuclear fuel wastes.
The panel made the following basic recommenda-tions to governments with respect to a management agency:• that an NFWMA be established quickly, at arm’s
length from the utilities and AECL, with the sole purpose of managing and co-ordinating the full
range of activities relating to the long-term man-agement of nuclear fuel wastes;
• that it be fully funded in all its operations from a segregated fund to which only the producers and owners of nuclear fuel wastes would contribute;
• that its board of directors, appointed by the federal government, be representative of key stakeholders;
• that it have a strong and active advisory council representative of a wide variety of interested parties;
• that its purposes, responsibilities and accountabil-ity, particularly in relation to the ownership of the wastes, be clearly and explicitly spelled out, preferably in legislation or in its charter of incorporation; and
• that it be subject to multiple oversight mecha-nisms, including federal regulatory control, with respect to its scientific–technical work and the adequacy of its financial guarantees; to policy direction from the federal government; and to regular public review, preferably by Parliament. The panel concluded that, until these steps had
been completed and broad public acceptance of a nuclear fuel waste management approach had been achieved, the search for a specific site should not proceed.
In 2002, the Nuclear Fuel Waste Act was enacted, establishing a Nuclear Waste Management Organi-zation (NWMO) to investigate approaches to man-aging Canada’s spent nuclear fuel. The legislation mandated the NWMO to make a recommendation to the federal Minister of Natural Resources regarding a preferred option for the long-term management of waste nuclear fuel by November 2005. In developing its recommendation, the NWMO was directed by the legislation to consider three options:• deep geological disposal in the Canadian Shield,
based on the AECL concept• storage at reactor sites• centralized storage, either above or below ground.
Between 2002 and 2005, the NWMO conducted an extensive study during which it engaged in consulta-tions with experts, stakeholders and citizens, includ-ing Aboriginal peoples.
In November 2005, the NWMO submitted its final study report to the Minister of Natural Resources, recommending a strategy of Adaptive Phased Manage-ment. 25 This strategy consists of three phases:26
1. Preparing for central used fuel management (30 years)
Phase IV: Waste Fuel Management
84 The Pembina Institute • Nuclear Power in Canada: An Examination of Risks, Impacts and Sustainability 85Nuclear Power in Canada: An Examination of Risks, Impacts and Sustainability • The Pembina Institute
• Continue use of storage reactor sites while final disposal site is selected and approved
• Construct underground characterization facil-ity
• Conduct shallow storage if this option is cho-sen
2. Central storage and technology demonstration (30 years)
• Begin transport of used fuel to shallow storage (if selected)
• Research and demonstrate to confirm site suit-ability
• Assess site, technology and timing for used fuel placement
• Construct and licence deep repository3. Long-term containment in a deep geological
repository in the Canadian Shield or Ordovician sedimentary rock (beyond 60 years)
• Move used fuel from shallow storage or reac-tors for repackaging
• Place used fuel in containers in deep repository • Monitor and maintain access • Leave future generation to decide when to
close repository and the nature of ongoing monitoring.
The planned timeframes for this project are extremely long. The geological storage phase would not begin for approximately 60 years, and complete implementation of the strategy would extend over more than 300 years.27 The NWMO states that it intends to seek an informed, willing community host for the central facilities. NWMO estimates that the cost of its proposed waste fuel management strategy will be $24 billion (2002$) over the life of the project, equivalent to $6.1 billion in 2004 dollars.28
The NWMO’s recommendations highlight the fact that Canada remains a considerable distance from actual implementation of a long-term strategy to manage waste nuclear fuel. A number of factors need to be taken into account before this situation can be addressed.
First, the NMWO’s recommendations have yet to be accepted by the federal government. The pro-cess of seeking approvals for specific activities or facilities cannot begin until the recommendations are accepted. The proposed strategy would be subject to a comprehensive environmental assessment under the Canadian Environmental Assessment Act.29
Secondly, the legitimacy of the NWMO’s recom-mendations and consultative processes has been chal-lenged by a range of stakeholders. It has been pointed
out that the NWMO board is made up of representa-tives of Canada’s nuclear corporations, in contradic-tion to the Seaborn Panel’s recommendation of an arm’s length agency. The NWMO’s failure to address the question of the long-term role of nuclear energy in Canada has also been a significant source of criti-cism.30
In addition, the NWMO will need to identify a willing community in Ontario, Quebec, New Bruns-wick or Saskatchewan to host a permanent facility. This may be a significant challenge. Saskatchewan Premier Lorne Calvert has indicated that he will not allow a nuclear waste disposal facility to be located in Saskatchewan.31 Ontario Natural Resources Minister David Ramsay has stated: “We don’t like the idea of nuclear waste coming to Northern Ontario.”32 Mani-toba has enacted legislation prohibiting the storage of high-level radioactive waste generated outside of Man-itoba, and prohibiting the establishment of high-level waste disposal facilities within the province.33
5.5. Impacts of Waste Fuel ManagementTable 5.6 provides an overview of the environmental and health impacts and risks associated with nuclear waste fuel management. The potential impacts out-lined are based on the premise of the implementation of the NWMO’s recommendations.
It is important to note that the NWMO itself points out that the performance of its proposed dis-posal technology in the long term is unknown due to the impossibility of forecasting thousands of years into the future.34 It is known, for example, that in the long-term disposal facilities would be exposed to envi-ronmental stresses beyond current experience, such as ice ages and other extreme climate changes.35
In the short term, the largest environmental and occupational and community health risks associated with waste fuel management are seen to involve the potential for accidents during the transport of waste fuel to centralized management facilities.36 Waste fuel transportation would itself be an enormous under-taking, estimated to require more than 50 truck trips per month over a period of 30 years.37 The air pollu-tion emissions associated with these transportation activities would constitute the most direct short-term environmental impact of waste fuel management activities.
Phase IV: Waste Fuel Management
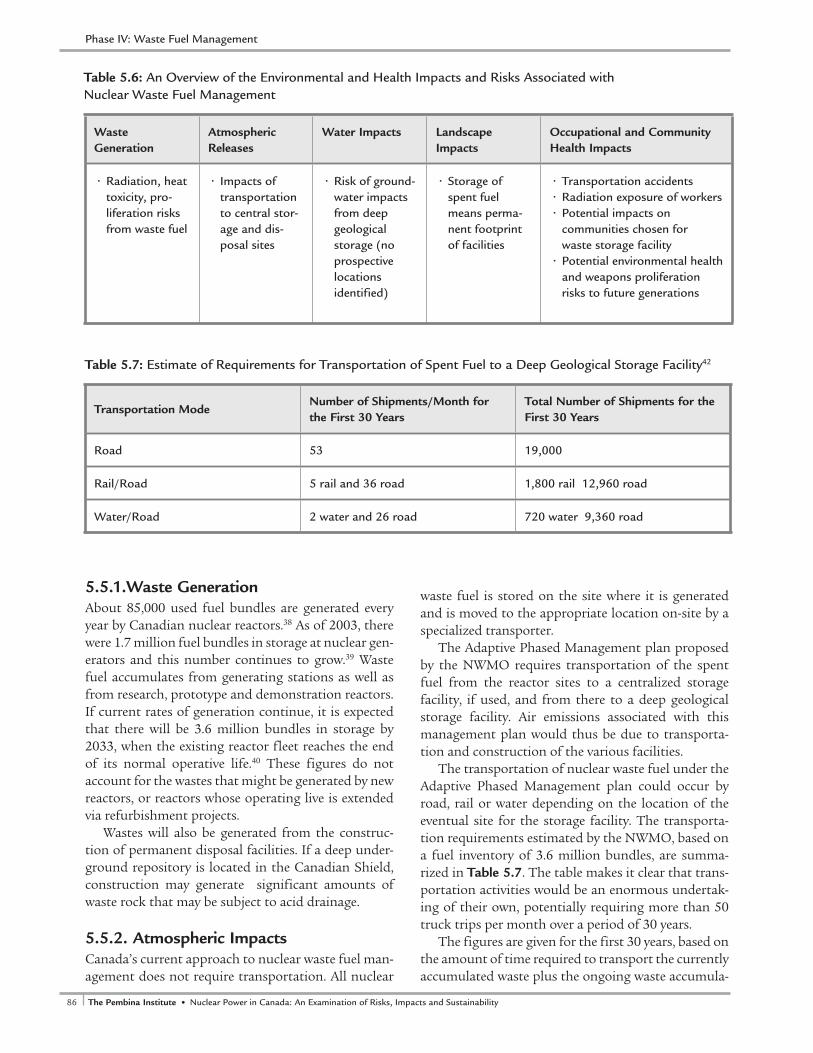
86 The Pembina Institute • Nuclear Power in Canada: An Examination of Risks, Impacts and Sustainability 87Nuclear Power in Canada: An Examination of Risks, Impacts and Sustainability • The Pembina Institute
5.5.1.Waste Generation About 85,000 used fuel bundles are generated every year by Canadian nuclear reactors.38 As of 2003, there were 1.7 million fuel bundles in storage at nuclear gen-erators and this number continues to grow.39 Waste fuel accumulates from generating stations as well as from research, prototype and demonstration reactors. If current rates of generation continue, it is expected that there will be 3.6 million bundles in storage by 2033, when the existing reactor fleet reaches the end of its normal operative life.40 These figures do not account for the wastes that might be generated by new reactors, or reactors whose operating live is extended via refurbishment projects.
Wastes will also be generated from the construc-tion of permanent disposal facilities. If a deep under-ground repository is located in the Canadian Shield, construction may generate significant amounts of waste rock that may be subject to acid drainage.
5.5.2. Atmospheric ImpactsCanada’s current approach to nuclear waste fuel man-agement does not require transportation. All nuclear
waste fuel is stored on the site where it is generated and is moved to the appropriate location on-site by a specialized transporter.
The Adaptive Phased Management plan proposed by the NWMO requires transportation of the spent fuel from the reactor sites to a centralized storage facility, if used, and from there to a deep geological storage facility. Air emissions associated with this management plan would thus be due to transporta-tion and construction of the various facilities.
The transportation of nuclear waste fuel under the Adaptive Phased Management plan could occur by road, rail or water depending on the location of the eventual site for the storage facility. The transporta-tion requirements estimated by the NWMO, based on a fuel inventory of 3.6 million bundles, are summa-rized in Table 5.7. The table makes it clear that trans-portation activities would be an enormous undertak-ing of their own, potentially requiring more than 50 truck trips per month over a period of 30 years.
The figures are given for the first 30 years, based on the amount of time required to transport the currently accumulated waste plus the ongoing waste accumula-
Transportation ModeNumber of Shipments/Month for the First 30 Years
Total Number of Shipments for the First 30 Years
Road 53 19,000
Rail/Road 5 rail and 36 road 1,800 rail 12,960 road
Water/Road 2 water and 26 road 720 water 9,360 road
Table 5.7: Estimate of Requirements for Transportation of Spent Fuel to a Deep Geological Storage Facility42
Waste Generation
Atmospheric Releases
Water Impacts Landscape Impacts
Occupational and Community Health Impacts
• Radiation, heat toxicity, pro-liferation risks from waste fuel
• Impacts of transportation to central stor-age and dis-posal sites
• Risk of ground-water impacts from deep geological storage (no prospective locations identified)
• Storage of spent fuel means perma-nent footprint of facilities
• Transportation accidents• Radiation exposure of workers • Potential impacts on
communities chosen for waste storage facility
• Potential environmental health and weapons proliferation risks to future generations
Table 5.6: An Overview of the Environmental and Health Impacts and Risks Associated with Nuclear Waste Fuel Management
Phase IV: Waste Fuel Management

86 The Pembina Institute • Nuclear Power in Canada: An Examination of Risks, Impacts and Sustainability 87Nuclear Power in Canada: An Examination of Risks, Impacts and Sustainability • The Pembina Institute
tion. One shipment by truck contains 192 bundles and has a full payload of approximately 42.5 tonnes. One shipment by water contains 5,760 bundles, which would weigh 1,015 tonnes including transport containers.41
To facilitate initial cost–ben-efit studies of the Adaptive Phased Management approach, the NWMO used four illustrative examples of sites for nuclear waste disposal. The sites are not repre-sentative of actual sites, but rather represent a range of characteristics. The four sites have average distances of 260, 1,000, 2,000 and 3,500 km from current reactor sites.43 Based on the waste inventories and hypotheti-cal distances to the example waste disposal sites, esti-mates of total distances traveled to move all currently accumulated waste plus ongoing waste accumulation ranges from five million to 69 million kilometres.
It is worth noting that the scenario of five million total kilometres is unlikely to gain public acceptance as this waste disposal site would be located in an area with a medium population density near the Bruce Peninsula in southern Ontario.44 We suggest that, were a suitable disposal site actually found, total dis-tance traveled for disposal would likely be closer to the 69 million kilometre estimate.
5.5.2.1. GHG, PM, and NOx EmissionsEstimates of GHG, PM, and NOx air emissions result-ing from transport of spent nuclear to disposal sites are reported below in Table 5.8. Emissions are calculated for the shortest (five million) and longest (69 million) transport distances estimated by the NWMO.
To provide some context, the GHG and PM emissions in Table 5.8 are roughly equivalent to the annual emissions of 1,500 and 21,000 passenger cars for the transportation of spent fuel five million and 69 million kilometres, respectively. The NOx emissions are equivalent to the amount annually produced by 10,500 and 145,000 passenger cars for five million and 69 million kilometre distances, respectively.
In addition to their air pollution impacts, waste transport is generally regarded as the most dangerous, highest risk aspect of nuclear waste management.49 The greater the distance transportation nuclear fuel waste is transported, the greater the potential for an accident that would release radioactivity to the sur-rounding area. The issue of accident risks and their potential consequences is discussed in section 5.5.5.2.
5.5.3. Water ImpactsOne of the principle critiques of the deep geologi-cal disposal option that would form the final phase of the strategy proposed by the NWMO is that no container can remain water resistant for hundreds of years. It has been argued that groundwater will find its way into any vault, no matter how well designed, and will eventually seep in and out of the nuclear waste containers, carrying radioactive substances. This contaminated groundwater may then show up in wells, springs, lakes, and rivers, and be taken up into the food chain. It has also been pointed out that it is impossible to predict geological activity with certainty even in stable geological formations.50
NWMO argues that below 500 metres groundwa-ter is very saline, reducing and old, and therefore can be considered stagnant over the period of concern for a repository facility (i.e., one million years). The plu-tonic rock of the Canadian Shield has this attribute, as do bedded salts and shales.51 However, the validity of modeling groundwater behaviour over such long time periods has been challenged.52 It has also been pointed out that the option provides little flexibility for future generations to influence the management of waste fuel, or to make fundamental changes without incur-ring considerable additional costs.53
5.5.4. Landscape ImpactsA deep geologic storage facility will have to be a per-manent structure that will last virtually in perpetuity. Therefore, the land footprint of such a facility will also be permanent. However, the area of land required for these facilities will likely be fairly small. Of greater con-cern is the potential impact to land, human health and surrounding biota in the event of a catastrophic failure.
Depending on the location of the facility and the mode of transportation chosen, the construction of roads or rail lines would also impact the land and associated biophysical environment.
Scenario: Total km Traveled
GHG Emissions (tonnes)
PM Emissions (tonnes)
NOx Emissions (tonnes)
Closest: 5 million
5,200 1.1 39.2
Farthest: 69 million
72,000 15.0 540.0
Table 5.8: Total Estimated Air Emissions from Spent Fuel Transport Scenarios45,46,47,48
Phase IV: Waste Fuel Management

88 The Pembina Institute • Nuclear Power in Canada: An Examination of Risks, Impacts and Sustainability 89Nuclear Power in Canada: An Examination of Risks, Impacts and Sustainability • The Pembina Institute
5.5.5. Occupational and Community Health Impacts 5.5.5.1. Occupational Health Implementation of the nuclear waste management strategy is expected to bring significant employment and income benefits to the local host economic region. It is estimated that thousands of jobs could be created as a result of the implementation of the strat-egy.54 However, like all jobs in the nuclear industry, these jobs would require exposure to a higher rate of radiation than is acceptable for the general public.
A 2002 report for the State of Nevada estimated that there could be significant radiation exposure to drivers and others involved in the transport of nuclear waste, as well as to members of the public on transpor-tation routes. While the report is specific to the pro-posed plan to transport nuclear fuel waste in Nevada, it is nonetheless instructive in highlighting the poten-tial exposure risks associated with transport of nuclear fuel waste in Canada. The likely radiation exposures risks associated with waste fuel transportation as iden-tified by the report are outlined in Table 5.9.
It is instructive to compare these values with the regulated dose limits for the general public and nuclear energy workers of 1.0 mSv/year and 50 mSv/year, respectively, as referenced in Table 1.3.
In general, one hour of exposure to an average transport cask at a distance of two metres exposes an individual to a dose equivalent to a whole body X-ray.57
5.5.5.2. Accident Risks The transportation of waste nuclear fuel is generally regarded as the most dangerous, highest risk aspect of nuclear waste management due to the risk of acci-dents.58
In the event of a transportation accident, people who live and work near the accident site will be severely impacted. The NWMO argues that radioac-tive materials have been transported around the world for 40 years, with no accidents that have resulted in the release of “significant amounts” of radioactivity.59 However, because the frequency of transport required under the Adaptive Phased Management plan is cur-rently unknown, the eventual plan may result in more transportation than currently occurs; this will bring with it an increased likelihood of accidents.
The State of Nevada contracted Radioactive Waste Management Associates (RWMA) to model the con-sequences of a nuclear waste fuel transportation acci-dent. Using accident scales of the US Department of Energy (DOE), the RWMA chose to focus on category five accidents (out of six categories) because these were deemed to be severe, yet realistic scenarios, and chose Los Angeles as the site of a potential urban accident. The RWMA found that the results of such an accident would be serious. Inhalation of radioactive particles would expose thousands of individuals to 1,000 mSv, several hundred times the background radiation in the area. Radioactive particles could infiltrate ventila-tion systems, causing particles to settle on furniture and in rugs. Radioactive particles would also be spread by vehicles and people traveling away from the acci-dent site. The RWMA found that this type of accident would overwhelm the emergency response team and the medical community in Los Angeles.60
It has also been pointed out that waste fuel storage installations at individual reactor sites may be targets for attack by groups or individuals motivated by politi-cal purpose, insanity or both. It has been suggested that, if such an attack were to lead to the loss of water from a spent-fuel pool with high density racks, it could lead to a runaway zirconium–air or zirconium–steam reaction;
the resulting heat production and fuel degradation would release a large amount of radioactive mate-rial to the atmosphere.61
5.6. Proliferation and Security Issues While it cannot ignite or explode, nuclear waste fuel is highly radio-active and contains uranium and plutonium. These fissile materi-als are highly attractive materials for countries or groups seeking to develop nuclear weapons.62
Occupation Exposure
Safety inspector 85 mSv/year
Truck driver 40 mSv/year
Service station attendant on transport route 5–10 mSv/year
Driver in gridlock with transport truck (4 hours) 0.04–0.08 mSv/hour
Average American exposure from X-rays, etc.56 0.65 mSv/year
Table 5.9: Estimated Exposure Risks Associated with Spent Nuclear Fuel Transport in Nevada55
Phase IV: Waste Fuel Management
88 The Pembina Institute • Nuclear Power in Canada: An Examination of Risks, Impacts and Sustainability 89Nuclear Power in Canada: An Examination of Risks, Impacts and Sustainability • The Pembina Institute
In 1996, researchers from the US National Nuclear Security Administration estimated that “a determined group of six persons who have familiarized themselves with the unclassified technical literature could pro-duce 1 significant quantity (SQ)63 of plutonium metal eight weeks after the receipt of a sufficient quantity of spent enriched uranium fuel.”64 Since CANDU fuel is made of un-enriched uranium, 2.5 tonnes of it would be necessary to produce 1 SQ of plutonium. Obtaining such an amount of spent CANDU fuel would not be easy. Nevertheless, there are significant security risks associated with the transportation and storage of spent nuclear fuel.65,66
The weapons proliferation risks associated with nuclear waste fuel were demonstrated on May 17, 1974, when India detonated a 12-kiloton nuclear bomb in the Rajasthan desert. The bomb was allegedly built using plutonium derived from Canadian-sup-plied uranium in a Cirus research reactor donated by Canada in 1956 under the Commonwealth “Colombo Plan” aid program to promote economic and social development in south and southeast Asia.67
In the Adaptive Phased Management plan proposed by the NWMO, used nuclear fuel bundles will have to be transported from the reactor sites to the central-ized facilities, and then from the centralized facilities to the geological storage facilities, thereby increasing the associated risks of transporting nuclear waste.
While the NWMO claims that transport of nuclear fuel waste is safe, the potential impacts of a terrorist attack or sabotage are substantial. A 1999 study for the US DOE found that the casks in which nuclear fuel is transported are vulnerable to high energy explo-sive attacks, as could be used in a terrorist attack.68 Similarly, the NWMO report states that the casks are designed to withstand “expected accident condi-tions.”69 These do not include terrorist attacks.
The draft Environmental Impact Statement pre-pared by the US DOE for nuclear waste transport in Nevada estimated that a successful attack on a truck cask in an urbanized area would result in about 15 cancer fatalities among those exposed to the release of radioactive materials. An analysis prepared for Nevada by the Radioactive Waste Management Agency (RWMA) estimated sabotage impacts could be sig-nificantlygreater than the US DOE’s estimate (6–104 fatalities). Under worst case weather conditions, the RWMA estimated 4–165 latent cancer fatalities would result. Further, cleanup costs and other economic impacts were estimated at $3.1–13.5 billion (2000$) for average weather conditions, and $10.1–20.9 billion (2000$) for worst case weather conditions.70
Concern has also been raised that long-term waste disposal sites could become the “plutonium mines of the future,” raising longer-term proliferation issues. Plutonium in fresh spent fuel is “protected” by the high radioactivity of the material. This radioactiv-ity decays after some decades, whereupon separation of plutonium from the fuel would become relatively simple.71
5.7. Costs and LiabilitiesBetween 1978 and 1995, $538 million was spent on research and development of the concept of deep geological disposal of nuclear waste in hard rock. Of this amount, about $370 million was federal funding to AECL and about $133 million was provided by Ontario Hydro, with the balance coming from other sources, primarily foreign waste management research agencies.72
NWMO estimates that the cost of its proposed long-term spent fuel management strategy will be $24 billion over the life of the project (2002$).73
The project will be funded by the entities that operate nuclear reactors and produce waste nuclear fuel. Under the provisions of the Nuclear Waste Fuel Management Act, a trust fund has been established for this purpose, to which OPG has deposited $500 mil-lion, Hydro Quebec and New Brunswick Power have each deposited $20 million, and AECL has depos-ited $10 million.74 Additionally, each utility makes an annual contribution to the fund: $100 million by Ontario Power Generation), $4 million by Hydro Quebec, $4 million by New Brunswick Power and $2 million by AECL. These funds can not be used until a construction license has been granted for the waste management approach recommended by the NWMO. As of November 2005, total contributions to the trust fund were $880 million.75
It is expected that OPG will responsible for over 90 per cent of the waste nuclear fuel generated in Canada76 OPG has provided the CNSC with a finan-cial guarantee of $4.5 billion (present value as of Janu-ary 1, 2005) for waste fuel management, reflecting the estimated present value costs of these activities.77 OPG’s Used Fuel Fund currently contains assets of $2.985 billion,78 while OPG had contributed $807 million to the NWMO trust as of March 31, 2005. Under the Ontario Nuclear Funds Agreement, the provincial government has provided an unconditional guarantee to cover any shortfall between OPG’s finan-cial guarantee to CNSC, and the funds contained in OPG’s Used Fuel Fund and its contributions to the NWMO trust. As of 2005, the province’s guarantee to
Phase IV: Waste Fuel Management
90 The Pembina Institute • Nuclear Power in Canada: An Examination of Risks, Impacts and Sustainability 91Nuclear Power in Canada: An Examination of Risks, Impacts and Sustainability • The Pembina Institute
the Canadian Nuclear Safety Commission on behalf of OPG amounted $1.5 billion.79
More generally, the Ontario Nuclear Funds Agree-ment, between OPG and the province of Ontario, lim-its OPG’s liabilities for disposal of used nuclear fuel. The agreement stipulates that OPG will be responsible for all costs (present value as of January 1, 1999) up to $4.6 billion; will share costs on an equal basis between $4.6 and $6.6 billion; and will be responsible for 10 per cent of the costs incurred between $6.6 and $10 billion, while the province will be responsible for any costs above $10 billion.80
It is important to note that the $4.5 billion waste fuel management cost estimates on which the ONFA was based were premised on the 1.76 million waste fuel bundles estimated to be generated by the end of 2005.81 In contrast, NWMO’s estimated $6.1 billion present value cost of the its proposed waste man-agement strategy, was premised on a 40 year reactor life, resulting the generation of 3.6 million waste fuel bundles of which 3.3 million would be the responsi-bility of OPG.82 The provisions of the ONFA will need to be adjusted to reflect the increased waste manage-ment costs associated with the extension of reactor lifetimes, or the province of Ontario may be faced with significant additional liabilities for waste fuel management.
The NWMO’s cost estimates also assume that the long-term management project would be completed on budget and on time. Given the complexity and long timelines associated with the project, these may not be valid assumptions.
5.8. ConclusionsApproximately 85,000 waste fuel bundles generated each year in Canadian nuclear reactors. It is estimated there will be 3.6 million waste fuel bundles in storage in Canada by 2033. This figure assumes that no new nuclear generating facilities are brought into service. Waste nuclear fuel is extremely hazardous. It remains hazardous over extremely long time frames, and requires management over the very long term (i.e., one million years) to protect human health and the environment, and to address the risks of the use of uranium and plutonium contained in waste fuel for nuclear weapons or other damaging purposes.
No strategy is in place for managing nuclear waste fuel in Canada. The NMWO, established in 2002, has proposed a “phased adaptive management strategy” extending over more than a century, and culminating
in storage of the fuel in a deep geological repository, with a total estimated cost of $24 billion. The strategy has yet to be approved by the federal government, and a location for a permanent facility has not been identi-fied. The strategy would require more than 300 years to fully implement.
OPG will be responsible for more than ninety per cent of the waste fuel generated in Canada. OPG’s current waste fuel management fund and contribu-tions to the NWMO’s trust fund are not sufficient to cover the estimated present value cost of OPG waste fuel management, with the difference in costs being guaranteed by the province of Ontario. The cur-rent arrangements between OPG and the province of Ontario do not reflect the increased amounts of waste fuel that would be generated as a result of the pro-posed extensions of reactor lifetimes or the construc-tion of new reactors.
The short-term risks related to waste fuel man-agement are seen to be largely associated with the large-scale transportation of waste fuel that would flow from a central repository strategy. Waste trans-portation is generally regarded as the most dangerous and highest risk aspect of nuclear waste management due to the risks of accidents or other incidents during transportation.
The most direct short-term impact of waste fuel management is the air pollution associated with trans-portation of waste fuel to a central storage facility and long-term disposal facility. If transportation occurs by road, it would involve 19,000 shipments over a 30-year period, or 53 shipments per month.
The long-term environmental risks associated with waste fuel management are unknown, given the time-frames over which a permanent repository would be required to last.
Waste nuclear fuel management presents major ethical challenges. Failures of the management options chosen in the present may burden future gen-erations with very large costs and risks arising from wastes associated with past generations’ consumption of energy produced from nuclear facilities. Strong dis-tinctions are made between the management of exist-ing wastes—current generations benefited from the energy production that led to their generation and thus have a responsibility to ensure their safe manage-ment—and the generation of additional wastes via the operation or construction of new nuclear generating facilities—there is knowledge of the risks and costs that such choices may impose on future generations.
Phase IV: Waste Fuel Management
90 The Pembina Institute • Nuclear Power in Canada: An Examination of Risks, Impacts and Sustainability 91Nuclear Power in Canada: An Examination of Risks, Impacts and Sustainability • The Pembina Institute
Summary of FindingsIn addition to its physical environmental impacts, particularly waste generation, nuclear energy faces a number of unique economic, security and policy challenges.
• Generating facilities are subject to very high capital costs, and long construction times. This makes it difficult for such facilities to compete for private capital invest-ments against potential investments that will bring more rapid and secure returns. Extraordinary financial guarantees by governments have been required to overcome these barriers.
• In Ontario there is a history of serious delays and cost overruns on nuclear generating facility projects, accounting for a large portion of the “stranded debt” left by Ontario Hydro.
• The Ontario CANDU fleet has been plagued by performance and maintenance prob-lems. In recent years average fleet capacity has been in the 50 per cent range rather than the expected 85–90 per cent range. Reactors expected to have operational lifetimes in the range of 40 years turned out to require major refurbishments after approximately 25 years of service. Refurbishment projects themselves have run seriously over budget and behind schedule.
• The poor performance of the Ontario CANDU fleet has had major collateral envi-ronmental and health impacts. These impacts have been the result of the province’s increased reliance on domestic and imported coal-fired generation to replace electricity that would have been provided by out-of-service nuclear units.
• Fuel costs are emerging as a significant issue for the nuclear industry. World uranium prices have increased by more than a factor of six since 2001 and are expected to con-tinue to rise.
• The question of the long-term fuel supply for nuclear generating facilities is emerging as a concern, particularly if there is a large-scale expansion of reliance on nuclear genera-tion. Current Canadian uranium reserves are estimated to be sufficient for 40 years at present levels of consumption, significantly less than other non-renewable fuels such as natural gas and coal. Efforts to increase the available fuel supply through the reprocess-ing of waste fuel, or the use of fast breeder reactors (FBRs), are seen to present serious waste management, technological and weapons proliferation risks.
6. Sustainability Challenges
92 The Pembina Institute • Nuclear Power in Canada: An Examination of Risks, Impacts and Sustainability 93Nuclear Power in Canada: An Examination of Risks, Impacts and Sustainability • The Pembina Institute
• The potential for, and reality of, links between technologies and materials used for nuclear energy production and nuclear weapons have always given rise to concerns about nuclear weapons proliferation. The concerns about these connections have grown in the past few years as a result of nuclear programs in Iran, North Korea, India and Pakistan. Large-scale reprocessing activities to increase the nuclear fuel supply would seriously exacerbate the existing weapons proliferation risks.
• Nuclear generating facilities and their associated waste fuel storage facilities have been identified as potential targets for attack by groups or individuals motivated by political purposes, insanity or both. The consequences of such an attack, if successful, would be uniquely severe, as an attack could result in the release of large amounts of radioactive material to the atmosphere.
Sustainability Challenges
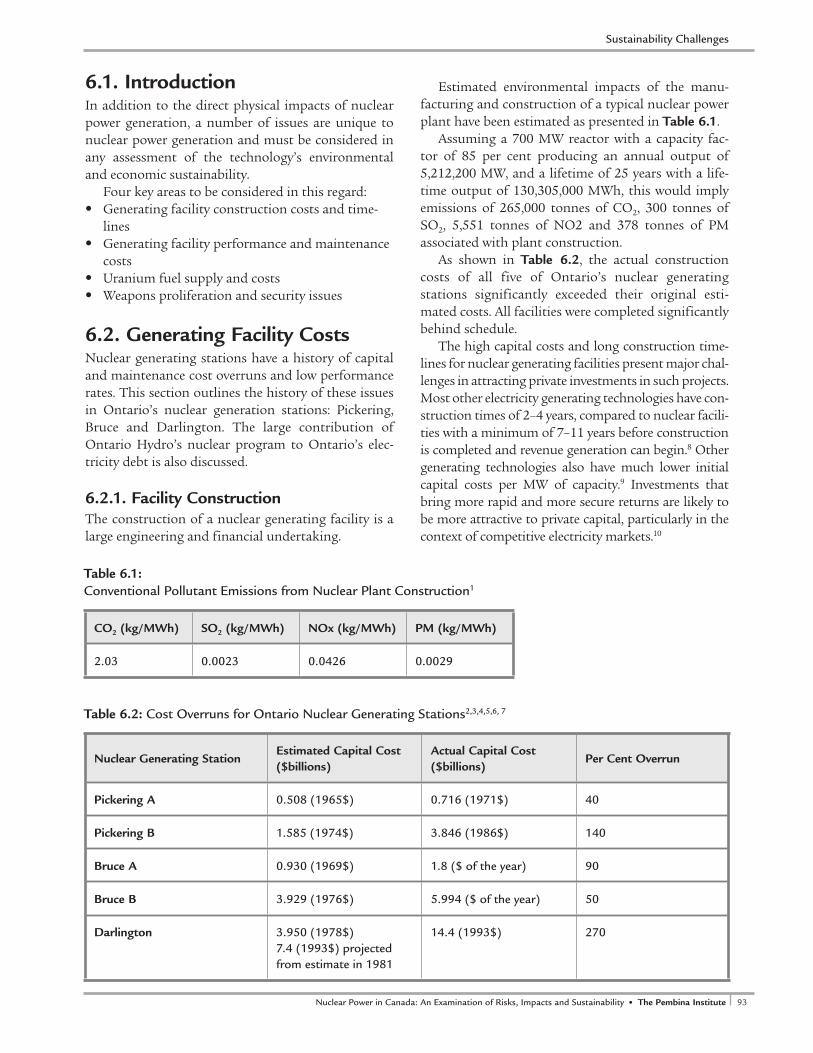
92 The Pembina Institute • Nuclear Power in Canada: An Examination of Risks, Impacts and Sustainability 93Nuclear Power in Canada: An Examination of Risks, Impacts and Sustainability • The Pembina Institute
6.1. IntroductionIn addition to the direct physical impacts of nuclear power generation, a number of issues are unique to nuclear power generation and must be considered in any assessment of the technology’s environmental and economic sustainability.
Four key areas to be considered in this regard:• Generating facility construction costs and time-
lines• Generating facility performance and maintenance
costs• Uranium fuel supply and costs• Weapons proliferation and security issues
6.2. Generating Facility Costs Nuclear generating stations have a history of capital and maintenance cost overruns and low performance rates. This section outlines the history of these issues in Ontario’s nuclear generation stations: Pickering, Bruce and Darlington. The large contribution of Ontario Hydro’s nuclear program to Ontario’s elec-tricity debt is also discussed.
6.2.1. Facility ConstructionThe construction of a nuclear generating facility is a large engineering and financial undertaking.
Estimated environmental impacts of the manu-facturing and construction of a typical nuclear power plant have been estimated as presented in Table 6.1.
Assuming a 700 MW reactor with a capacity fac-tor of 85 per cent producing an annual output of 5,212,200 MW, and a lifetime of 25 years with a life-time output of 130,305,000 MWh, this would imply emissions of 265,000 tonnes of CO2, 300 tonnes of SO2, 5,551 tonnes of NO2 and 378 tonnes of PM associated with plant construction.
As shown in Table 6.2, the actual construction costs of all five of Ontario’s nuclear generating stations significantly exceeded their original esti-mated costs. All facilities were completed significantly behind schedule.
The high capital costs and long construction time-lines for nuclear generating facilities present major chal-lenges in attracting private investments in such projects. Most other electricity generating technologies have con-struction times of 2–4 years, compared to nuclear facili-ties with a minimum of 7–11 years before construction is completed and revenue generation can begin.8 Other generating technologies also have much lower initial capital costs per MW of capacity.9 Investments that bring more rapid and more secure returns are likely to be more attractive to private capital, particularly in the context of competitive electricity markets.10
CO2 (kg/MWh) SO2 (kg/MWh) NOx (kg/MWh) PM (kg/MWh)
2.03 0.0023 0.0426 0.0029
Table 6.1: Conventional Pollutant Emissions from Nuclear Plant Construction1
Table 6.2: Cost Overruns for Ontario Nuclear Generating Stations2,3,4,5,6, 7
Nuclear Generating StationEstimated Capital Cost ($billions)
Actual Capital Cost ($billions)
Per Cent Overrun
Pickering A 0.508 (1965$) 0.716 (1971$) 40
Pickering B 1.585 (1974$) 3.846 (1986$) 140
Bruce A 0.930 (1969$) 1.8 ($ of the year) 90
Bruce B 3.929 (1976$) 5.994 ($ of the year) 50
Darlington 3.950 (1978$)7.4 (1993$) projected from estimate in 1981
14.4 (1993$) 270
Sustainability Challenges
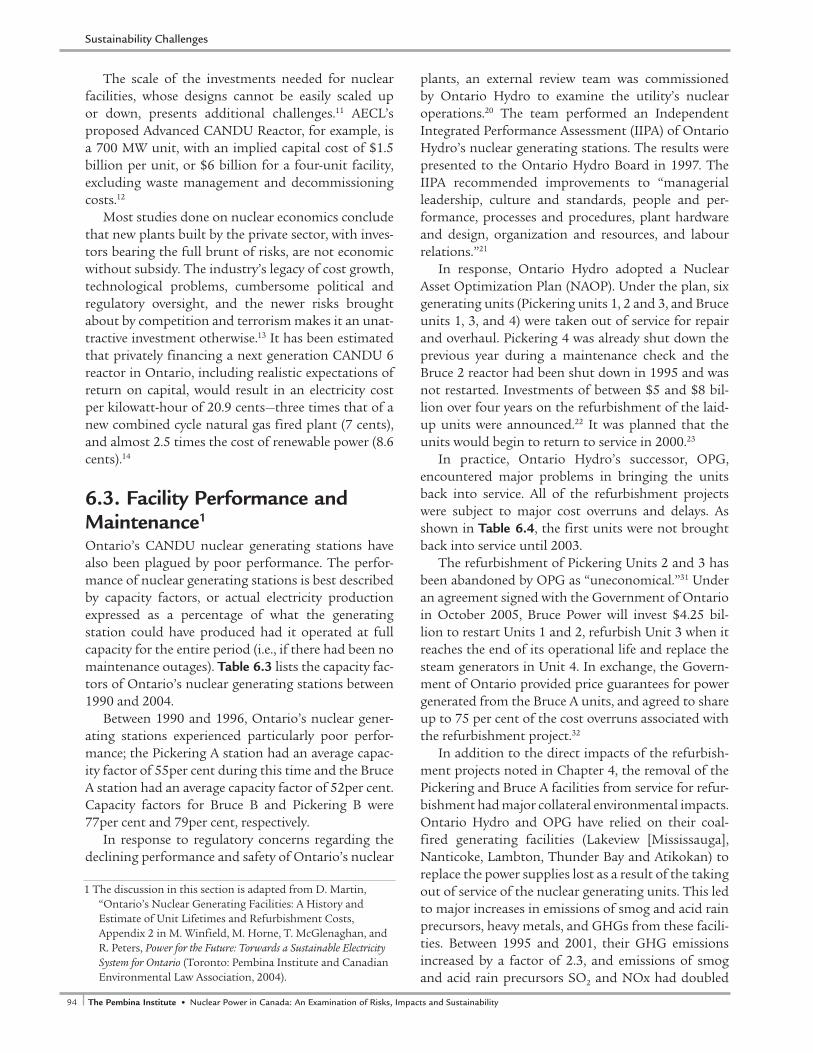
94 The Pembina Institute • Nuclear Power in Canada: An Examination of Risks, Impacts and Sustainability 95Nuclear Power in Canada: An Examination of Risks, Impacts and Sustainability • The Pembina Institute
The scale of the investments needed for nuclear facilities, whose designs cannot be easily scaled up or down, presents additional challenges.11 AECL’s proposed Advanced CANDU Reactor, for example, is a 700 MW unit, with an implied capital cost of $1.5 billion per unit, or $6 billion for a four-unit facility, excluding waste management and decommissioning costs.12
Most studies done on nuclear economics conclude that new plants built by the private sector, with inves-tors bearing the full brunt of risks, are not economic without subsidy. The industry’s legacy of cost growth, technological problems, cumbersome political and regulatory oversight, and the newer risks brought about by competition and terrorism makes it an unat-tractive investment otherwise.13 It has been estimated that privately financing a next generation CANDU 6 reactor in Ontario, including realistic expectations of return on capital, would result in an electricity cost per kilowatt-hour of 20.9 cents—three times that of a new combined cycle natural gas fired plant (7 cents), and almost 2.5 times the cost of renewable power (8.6 cents).14
6.3. Facility Performance and Maintenance1
Ontario’s CANDU nuclear generating stations have also been plagued by poor performance. The perfor-mance of nuclear generating stations is best described by capacity factors, or actual electricity production expressed as a percentage of what the generating station could have produced had it operated at full capacity for the entire period (i.e., if there had been no maintenance outages). Table 6.3 lists the capacity fac-tors of Ontario’s nuclear generating stations between 1990 and 2004.
Between 1990 and 1996, Ontario’s nuclear gener-ating stations experienced particularly poor perfor-mance; the Pickering A station had an average capac-ity factor of 55per cent during this time and the Bruce A station had an average capacity factor of 52per cent. Capacity factors for Bruce B and Pickering B were 77per cent and 79per cent, respectively.
In response to regulatory concerns regarding the declining performance and safety of Ontario’s nuclear
plants, an external review team was commissioned by Ontario Hydro to examine the utility’s nuclear operations.20 The team performed an Independent Integrated Performance Assessment (IIPA) of Ontario Hydro’s nuclear generating stations. The results were presented to the Ontario Hydro Board in 1997. The IIPA recommended improvements to “managerial leadership, culture and standards, people and per-formance, processes and procedures, plant hardware and design, organization and resources, and labour relations.”21
In response, Ontario Hydro adopted a Nuclear Asset Optimization Plan (NAOP). Under the plan, six generating units (Pickering units 1, 2 and 3, and Bruce units 1, 3, and 4) were taken out of service for repair and overhaul. Pickering 4 was already shut down the previous year during a maintenance check and the Bruce 2 reactor had been shut down in 1995 and was not restarted. Investments of between $5 and $8 bil-lion over four years on the refurbishment of the laid-up units were announced.22 It was planned that the units would begin to return to service in 2000.23
In practice, Ontario Hydro’s successor, OPG, encountered major problems in bringing the units back into service. All of the refurbishment projects were subject to major cost overruns and delays. As shown in Table 6.4, the first units were not brought back into service until 2003.
The refurbishment of Pickering Units 2 and 3 has been abandoned by OPG as “uneconomical.”31 Under an agreement signed with the Government of Ontario in October 2005, Bruce Power will invest $4.25 bil-lion to restart Units 1 and 2, refurbish Unit 3 when it reaches the end of its operational life and replace the steam generators in Unit 4. In exchange, the Govern-ment of Ontario provided price guarantees for power generated from the Bruce A units, and agreed to share up to 75 per cent of the cost overruns associated with the refurbishment project.32
In addition to the direct impacts of the refurbish-ment projects noted in Chapter 4, the removal of the Pickering and Bruce A facilities from service for refur-bishment had major collateral environmental impacts. Ontario Hydro and OPG have relied on their coal-fired generating facilities (Lakeview [Mississauga], Nanticoke, Lambton, Thunder Bay and Atikokan) to replace the power supplies lost as a result of the taking out of service of the nuclear generating units. This led to major increases in emissions of smog and acid rain precursors, heavy metals, and GHGs from these facili-ties. Between 1995 and 2001, their GHG emissions increased by a factor of 2.3, and emissions of smog and acid rain precursors SO2 and NOx had doubled
1 The discussion in this section is adapted from D. Martin, “Ontario’s Nuclear Generating Facilities: A History and Estimate of Unit Lifetimes and Refurbishment Costs, Appendix 2 in M. Winfield, M. Horne, T. McGlenaghan, and R. Peters, Power for the Future: Torwards a Sustainable Electricity System for Ontario (Toronto: Pembina Institute and Canadian Environmental Law Association, 2004).
Sustainability Challenges
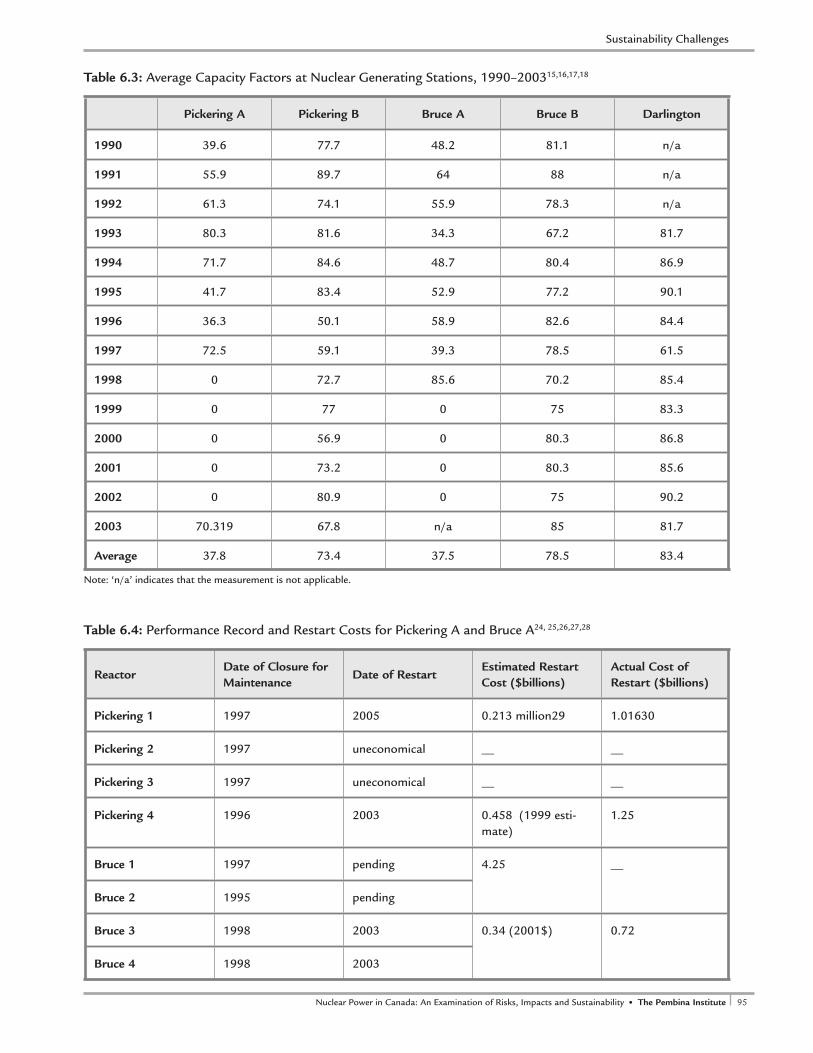
94 The Pembina Institute • Nuclear Power in Canada: An Examination of Risks, Impacts and Sustainability 95Nuclear Power in Canada: An Examination of Risks, Impacts and Sustainability • The Pembina Institute
Pickering A Pickering B Bruce A Bruce B Darlington
1990 39.6 77.7 48.2 81.1 n/a
1991 55.9 89.7 64 88 n/a
1992 61.3 74.1 55.9 78.3 n/a
1993 80.3 81.6 34.3 67.2 81.7
1994 71.7 84.6 48.7 80.4 86.9
1995 41.7 83.4 52.9 77.2 90.1
1996 36.3 50.1 58.9 82.6 84.4
1997 72.5 59.1 39.3 78.5 61.5
1998 0 72.7 85.6 70.2 85.4
1999 0 77 0 75 83.3
2000 0 56.9 0 80.3 86.8
2001 0 73.2 0 80.3 85.6
2002 0 80.9 0 75 90.2
2003 70.319 67.8 n/a 85 81.7
Average 37.8 73.4 37.5 78.5 83.4
Note: ‘n/a’ indicates that the measurement is not applicable.
Table 6.3: Average Capacity Factors at Nuclear Generating Stations, 1990–200315,16,17,18
ReactorDate of Closure for Maintenance
Date of RestartEstimated Restart Cost ($billions)
Actual Cost of Restart ($billions)
Pickering 1 1997 2005 0.213 million29 1.01630
Pickering 2 1997 uneconomical __ __
Pickering 3 1997 uneconomical __ __
Pickering 4 1996 2003 0.458 (1999 esti-mate)
1.25
Bruce 1 1997 pending 4.25 __
Bruce 2 1995 pending
Bruce 3 1998 2003 0.34 (2001$) 0.72
Bruce 4 1998 2003
Table 6.4: Performance Record and Restart Costs for Pickering A and Bruce A24, 25,26,27,28
Sustainability Challenges

96 The Pembina Institute • Nuclear Power in Canada: An Examination of Risks, Impacts and Sustainability 97Nuclear Power in Canada: An Examination of Risks, Impacts and Sustainability • The Pembina Institute
and increased by a factor of 1.7, respectively.33 The increased emissions from the Lambton, Nanticoke, and Lakeview facilities in particular have significantly exacerbated the severe air quality problems regularly experienced in southern Ontario34 and emerged as a major political issue in the province.
The NAOP highlighted additional problems with CANDU reactors. Traditionally, Ontario Hydro and OPG have depreciated nuclear power plants assum-ing that their life expectancy was 40 years.35 However, due to the demonstrated need for retubing and major rehabilitation at much earlier dates, a reasonable esti-mate of CANDU lifetime is no more than 25 years, in the absence of major rehabilitation efforts. This esti-mate is consistent with the position of the Canadian Nuclear Association, which has stated,
It is . . . assumed that all [CANDU] nuclear power plants will have to undergo one major rehabilitation program after 25 years in service to get to the full 40 years. Hence the forecast on availability depends on whether or not a deci-sion is made to rehabilitate a nuclear plant after 25 years in service.36
Ontario Hydro also estimated periods shorter than 40 years, when major rehabilitation of nuclear plants would be needed for removal and replacement of fuel channels and steam generators. Thus, it can be seen from Table 6.5 that these dates were also typically close to 25 years after the initial date of first commer-cial operation.
There is a secondary question as to the period of time that reactors can be expected to operate after they have undergone retubing and/or rehabilitation. The only evidence in this regard is the experience of the Pickering A station that was retubed from 1983 to 1993. After being retubed, the Pickering reactor 1 lasted 10 years 3 months before being shutdown
at the end of 1997; the Pickering reactor 2 lasted 9 years 1 month; the Pickering reactor 3 lasted 6 years 4 months; and the Pickering reactor 4 lasted 4 years 9 months.
After being shut down on December 31, 1997, the Pickering reactor 4 was restarted in October 2003, but OPG has not said how long it expects the reactor to operate. However, in 1997, as part of the Nuclear Asset Optimization Plan, Ontario Hydro suggested that the Pickering reactor 4 would require pressure tube replacement in March 2017.38 This study has therefore assumed that the most recent rehabilitation of Pickering 4 will give a life expectancy of 13 years to the reactor, i.e., until 2016. This estimate is consistent with the estimate of Torrie Smith Associates.39 This is also consistent with the position of the Ontario Power Generation Review Committee, which estimated a life-time of 8–14 years for Pickering reactor 1 after refur-bishment.40
The OPG Review Committee has suggested that the Pickering B plant may last longer.41 It has sug-gested that the rehabilitation dates for the Pickering reactors are 2012–2016, or 29–30 years after the start of commercial operation. The committee’s estimates for Bruce B and Darlington are consistent with the estimates of this study. The OPG Review Commit-tee suggests that rehabilitation dates for Bruce B are 2009–2017 (24–30 years post-commercial operation), and for Darlington are 2013–2020 (21–27 years post-commercial operation).
When Ontario’s electricity sector was restructured in 1999, Ontario Hydro had $30.5 billion of debt and $7.6 billion of other liabilities.42 To keep OPG solvent, $19.433 billion of Ontario Hydro’s accumulated debt or unfunded liabilities associated with electricity gen-eration facilities was transferred to the Ontario Elec-tricity Financial Corporation (OEFC) as “stranded debt” or “unfunded liabilities.” Of this amount, $15.147 billion was nuclear related.43
6.4. Fuel Supply and Costs6.4.1. Uranium Costs Part of original the rationale for developing nuclear energy in Ontario was that it relied on a domestically sourced fuel that was not subject to political risks and international price shifts.44
This is no longer the case. Uranium mining has ceased in
Station Time PeriodYears Past
Commercial Operation
Bruce A Reactors 3 & 4 2001–2008 23–29
Pickering B 2008–2012 25–26
Bruce B 2010–2013 26–26
Darlington 2016–2019 26–26
Table 6.5. Fuel Channel and Steam Generator Replacement Times37
Sustainability Challenges
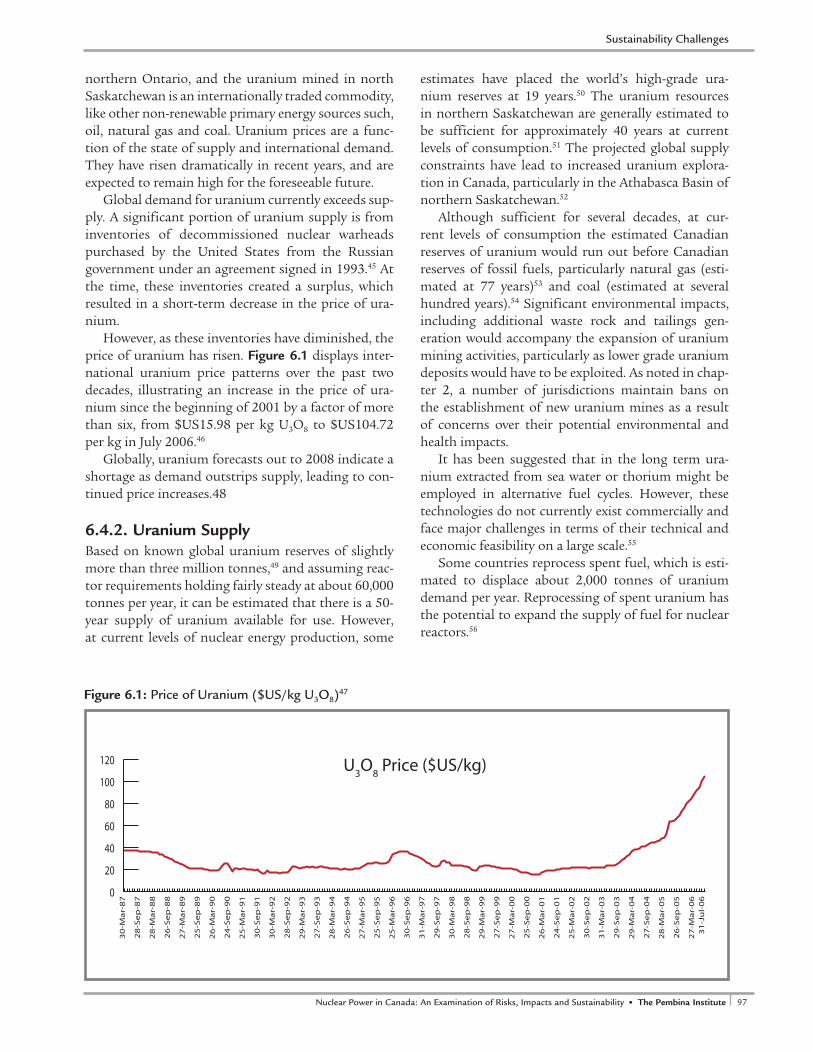
96 The Pembina Institute • Nuclear Power in Canada: An Examination of Risks, Impacts and Sustainability 97Nuclear Power in Canada: An Examination of Risks, Impacts and Sustainability • The Pembina Institute
northern Ontario, and the uranium mined in north Saskatchewan is an internationally traded commodity, like other non-renewable primary energy sources such, oil, natural gas and coal. Uranium prices are a func-tion of the state of supply and international demand. They have risen dramatically in recent years, and are expected to remain high for the foreseeable future.
Global demand for uranium currently exceeds sup-ply. A significant portion of uranium supply is from inventories of decommissioned nuclear warheads purchased by the United States from the Russian government under an agreement signed in 1993.45 At the time, these inventories created a surplus, which resulted in a short-term decrease in the price of ura-nium.
However, as these inventories have diminished, the price of uranium has risen. Figure 6.1 displays inter-national uranium price patterns over the past two decades, illustrating an increase in the price of ura-nium since the beginning of 2001 by a factor of more than six, from $US15.98 per kg U3O8 to $US104.72 per kg in July 2006.46
Globally, uranium forecasts out to 2008 indicate a shortage as demand outstrips supply, leading to con-tinued price increases.48
6.4.2. Uranium Supply Based on known global uranium reserves of slightly more than three million tonnes,49 and assuming reac-tor requirements holding fairly steady at about 60,000 tonnes per year, it can be estimated that there is a 50-year supply of uranium available for use. However, at current levels of nuclear energy production, some
estimates have placed the world’s high-grade ura-nium reserves at 19 years.50 The uranium resources in northern Saskatchewan are generally estimated to be sufficient for approximately 40 years at current levels of consumption.51 The projected global supply constraints have lead to increased uranium explora-tion in Canada, particularly in the Athabasca Basin of northern Saskatchewan.52
Although sufficient for several decades, at cur-rent levels of consumption the estimated Canadian reserves of uranium would run out before Canadian reserves of fossil fuels, particularly natural gas (esti-mated at 77 years)53 and coal (estimated at several hundred years).54 Significant environmental impacts, including additional waste rock and tailings gen-eration would accompany the expansion of uranium mining activities, particularly as lower grade uranium deposits would have to be exploited. As noted in chap-ter 2, a number of jurisdictions maintain bans on the establishment of new uranium mines as a result of concerns over their potential environmental and health impacts.
It has been suggested that in the long term ura-nium extracted from sea water or thorium might be employed in alternative fuel cycles. However, these technologies do not currently exist commercially and face major challenges in terms of their technical and economic feasibility on a large scale.55
Some countries reprocess spent fuel, which is esti-mated to displace about 2,000 tonnes of uranium demand per year. Reprocessing of spent uranium has the potential to expand the supply of fuel for nuclear reactors.56
Figure 6.1: Price of Uranium ($US/kg U3O8)47
�
��
��
��
��
���
���
���������
����
�����
���������
����
�����
���������
����
�����
���������
����
�����
���������
����
�����
���������
����
�����
���������
����
�����
���������
����
�����
���������
����
�����
���������
����
�����
���������
����
�����
���������
����
�����
���������
����
�����
���������
����
�����
���������
����
�����
���������
����
�����
���������
����
�����
���������
����
�����
���������
����
�����
���������
����
�����
���
����������������
Sustainability Challenges
98 The Pembina Institute • Nuclear Power in Canada: An Examination of Risks, Impacts and Sustainability 99Nuclear Power in Canada: An Examination of Risks, Impacts and Sustainability • The Pembina Institute
However, reprocessing was ruled out as an option in the Canadian context by the NWMO. The NWMO assessment concluded that the costs of building the necessary industrial capacity to undertake reprocess-ing would imply the need to commit to an expanded and multigenerational nuclear fuel cycle. NWMO also noted that reprocessing would increase the generation of high-level nuclear wastes.57 The present process (the Purex process originally developed for the Manhattan project) produces 14 m3 of waste per tonne of spent fuel processed.58
Additionally, as reprocessing plants separate pluto-nium from spent fuel, reprocessing would also carry with it risks of spreading technology and materials that could be used for the production of nuclear weapons.59 In addition, large-scale reprocessing would involve extensive shipments of materials between reactors, reprocessing plants, and fresh fuel produc-tion facilities, most involving plutonium-containing materials. The proliferation concerns associated with such reprocessing led the United States government to prohibit the reprocessing of spent fuel from civilian plants in the 1970s.60
In the longer term, it has been suggested that fast breeder reactors, which are able to convert uranium 238 into plutonium, thereby producing more fuel than they burn, could be used to provide additional fuel. It is generally thought that FBRs are several decades from even a prototype stage, and would be extremely expensive to build and operate.
Research on FBRs was abandoned in the United States in the 1970s after they were shown to increase the risks of nuclear weapons proliferation.61
6.5 Weapons Proliferation Risks The use of nuclear energy for power production arose from the US Manhattan project during World War II. The early development of nuclear energy was largely for military purposes, and surrounded by great secrecy.
In the 1950s Canada decided not to pursue nuclear weapons development, but to focus on potential energy production instead.67 Other countries, such as France, the Soviet Union and the United Kingdom, were more interested in the development of nuclear weapons, and designed their first reactors so that they could be used for plutonium production.68 Even in Canada, the division between civilian and military uses was not complete, with Canadian uranium mines providing materials for United States and British weapons programs until the mid-1970s.69
The potential for weapons development offered by
the technologies and materials associated with nuclear energy remains a subject of major global concern.
The Treaty on the Non-Proliferation of Nuclear Weapons, opened for signing in 1968 and ratified by 189 nations, requires non-nuclear weapons states (including Canada) to accept and maintain IAEA safe-guards with respect to all source and special nuclear material, including spent fuel. Under the treaty, only the five nations that possessed nuclear weapons at the time of the creation of the treaty are permitted to pos-sess nuclear weapons: United States, France, United Kingdom, Russia and China. These states are prohib-ited from transferring nuclear weapon technology to non-nuclear weapons states, and have entered into voluntary safeguard agreements arising from their civil nuclear power programs.70
In practice it has proved difficult to keep nuclear energy and weapons development technologies apart. India’s 1974 nuclear bomb, developed in part using Canadian-supplied technology and uranium, demon-strated this clearly.71 Recent high-profile international concerns regarding the nuclear weapons potential of the Iranian,72 North Korean,73 Indian,74 and Paki-stani75 nuclear programs continue to highlight the proliferation risks of nuclear energy technologies. A worldwide expansion of the role of nuclear energy, particularly if it involves large-scale reprocessing or FBRs, would likely exacerbate these risks.76
In addition to the potential for the use of nuclear materials in the construction of nuclear weapons, materials generated through nuclear programs can be used to produce a “dirty” bomb—a conventional explosive combined with radioactive materials, intended to disperse radionuclides over a wide area, presenting radiation hazards and significant clean-up challenges.77
For its part, the Environmental Audit Committee on the UK Parliament raised a number of concerns regarding the British government’s nuclear expansion proposals in an April 2006 Report. The committee’s key concerns included the following:79
• The extremely long time frames for the construc-tion of nuclear power plants relative to other options, meaning that they could make little contribution to shorter term gaps in generating capacity.
• The degree to which subsidies for nuclear facilities would displace investments in energy efficiency and low-impact renewable energy sources.
• The costs of plant decommissioning and long-term waste management.
Sustainability Challenges
98 The Pembina Institute • Nuclear Power in Canada: An Examination of Risks, Impacts and Sustainability 99Nuclear Power in Canada: An Examination of Risks, Impacts and Sustainability • The Pembina Institute
6.6. Unique Security RisksNuclear generating facilities and their associated waste fuel storage facilities have been identified as potential targets for attack by groups or individuals motivated by political purposes, insanity or both. The consequences of such an attack, if successful, would be uniquely severe, as an attack could result in the release of large amounts of radioactive material to the atmosphere. Such outcomes would make response and recovery extremely difficult, and would result in environmental and health impacts over a much wider area than any other type of electricity generating facil-ity subject to such an attack.80
6.7. ConclusionsIn addition to its physical environmental impacts, par-ticularly waste generation, nuclear energy faces a num-ber of unique economic, security and policy challenges.
Nuclear generating facilities are subject to very high capital costs, and long construction times. This makes it difficult for facilities to compete for private capital against potential investments that will bring much more rapid and secure returns on investment. Extraor-dinary financial guarantees by governments, for which taxpayers have assumed much of the financial risk, have been required to overcome these barriers.
In addition, in Ontario there is a history of serious delays and cost overruns on nuclear generating facility generating projects, accounting for more than 75 per cent of the $19 billion “stranded debt” left by Ontario Hydro. This history again reduces the attractiveness of nuclear projects to private sector investors.
The Ontario CANDU fleet has been plagued by performance and maintenance problems. In recent years the average fleet capacity factor has been in the 50 per cent range rather than the expected 85–90 per cent range. Reactors expected to have operational lifetimes in the range of 40 years turn out to require major refurbishments after approximately 25 years of service. Refurbishment projects themselves have run seriously over budget and behind schedule. Refur-bished units appear to have operational lifetimes of 8–14 years. It had been thought units could be refur-bished in indefinite cycles, although the OPG decision not to refurbish Pickering units 2 and 3 suggests there are limits to the degree to which this can be done.
The poor performance of the Ontario CANDU fleet has had major collateral environmental and health impacts. These impacts have been the result of the province’s increased reliance on domestic and imported coal-fired generation from 1997 onwards to replace electricity that would have been provided by out-of-service nuclear units.
Origins of Canada’s Nuclear ProgramIn 1942, a joint British–Canadian laboratory was started in Montreal, Quebec to design a nuclear reactor. The Zero Energy Experimental Pile (ZEEP), an experimental 10-watt research reactor, was con-structed in Chalk River, Ontario, under the administration of the National Research Council. ZEEP had two purposes: to advance Canada’s civilian nuclear program and to produce plutonium for the United States military in the production of nuclear weapons.62 The ZEEP reactor, the first large-scale nuclear reactor ever built in Canada, began operating in 1945 and continued to operate for 25 years.
Building on the knowledge acquired from the ZEEP reactor, the National Research Experimental (NRX) research reactor was started in 1947 at Chalk River, Ontario. Similar to the ZEEP reactor, the NRX reactor employed unenriched uranium as a fuel and heavy water as a moderator.63 Also in 1947, a facility was built to extract plutonium from fuel rods irradiated in the ZEEP and NRX reactors for British and American nuclear weapons production.64 In 1952, the Chalk River project became the crown cor-poration Atomic Energy of Canada Limited (AECL).
Nuclear power was mentioned for the first time in Ontario Hydro’s 1954 annual report, and plans were put place to build a 20 MW demonstration power plant.65 The 20 MW Nuclear Power Demonstration (NPD), a prototype CANDU reactor, was declared in-service at Rolphton, Ontario in 1962. In 1968, the first prototype commercial reactor—Douglas Point, in Kincardine, Ontario—was declared in-service. Located on the Bruce Peninsula on Lake Huron, the Douglas Point facility had a lifetime capacity factor of 50per cent over less than 18 years.66 However, a major program of nuclear generating facility construction followed. Five commercial nuclear power stations with a total of 22 reactors were brought into service between 1971 and 1993 in Ontario, Quebec and New Brunswick.
Sustainability Challenges
100 The Pembina Institute • Nuclear Power in Canada: An Examination of Risks, Impacts and Sustainability 101Nuclear Power in Canada: An Examination of Risks, Impacts and Sustainability • The Pembina Institute
Report of the UK Sustainable Development Commission78
According to the UK Sustainable Development Commission (SDC), nuclear power is not the answer to tackling climate change or security of supply.
In response to the government’s current Energy Review, the SDC nuclear report draws together the most comprehensive evidence base available and finds that there is no justification for bringing forward a new nuclear power program at present.
Based on eight new research papers, the SDC report gives a balanced examination of the pros and cons of nuclear power. Its research recognizes that nuclear is a low carbon technology, with an impressive safety record in the UK. Nuclear could generate large quantities of electricity, contribute to stabilising CO2 emissions and add to the diversity of the UK’s energy supply.
However, the research establishes that, even if the UK’s existing nuclear capacity was doubled, it would only give an 8 per cent cut on CO2 emissions by 2035 (and nothing before 2010). This must be set against the risks.
The report identifies five major disadvantages of nuclear power:
1. Long-term waste – no long-term solutions are yet available, let alone acceptable to the general public; it is impossible to guarantee safety over the long-term disposal of waste.
2. Cost – the economics of nuclear new-build are highly uncertain. There is little, if any, justification for public subsidy, but if estimated costs escalate, there’s a clear risk that the taxpayer will have to pick up the tab.
3. Inflexibility – nuclear would lock the UK into a centralised distribution system for the next 50 years, at exactly the time when opportunities for microgeneration and local distribution networks are stronger than ever.
4. Undermining energy efficiency – a new nuclear program would give out the wrong signal to consumers and businesses, implying that a major technological fix is all that is required, weakening the urgent action needed on energy efficiency.
5. International security – if the UK brings forward a new nuclear power program, it cannot deny other countries the same technology. Having lower safety standards, other countries run higher risks of accidents, radiation exposure, proliferation and terrorist attacks.
On balance, the SDC finds that these problems outweigh the advantages of nuclear. However, the SDC does not rule out further research into new nuclear technologies and pursuing answers to the waste problem, as future technological developments may justify a re-examination of the issue.
SDC Chair, Jonathon Porritt, says:
It’s vital that we get to grips with the complexity of nuclear power. Far too often, the debate is highly polarised, with NGOs claiming to see no advantages to nuclear at all, and the pro-nuclear lobby claiming that it’s the only solution available to us.
Instead of hurtling along to a pre-judged conclusion (which many fear the Government is intent on doing), we must look to the evidence. There’s little point in denying that nuclear power has benefits, but in our view, these are outweighed by serious disadvantages. The Government is going to have to stop looking for an easy fix to our climate change and energy crises—there simply isn’t one.
Concluding with advice on a future energy strategy, the SDC report establishes that it is indeed possible to meet the UK’s energy needs without nuclear power. With a combination of a low-carbon innovation strategy and an aggressive expansion of energy efficiency and renewables, the UK would become a leader in low-carbon technologies. This would enhance economic competitiveness whilst meeting the UK’s future energy needs.
Sustainability Challenges
100 The Pembina Institute • Nuclear Power in Canada: An Examination of Risks, Impacts and Sustainability 101Nuclear Power in Canada: An Examination of Risks, Impacts and Sustainability • The Pembina Institute
Fuel costs are emerging as a significant issue for the nuclear industry. World uranium prices have increased by a factor of more than six since 2001 and are expected to continue to rise. The question of secu-rity of long-term fuel supply for nuclear generating facilities is also emerging as a concern, particularly if there is a large-scale expansion of reliance on nuclear generation. Current Canadian uranium reserves are estimated to be sufficient for 40 years at present levels of consumption. This is significantly less than other non-renewable fuels, such as natural gas and coal. Efforts to increase the available fuel supply through the reprocessing of waste fuel or the use of fast breeder reactors are seen to present serious technological challenges and waste management and weapons pro-liferation risks.
The potential for, and reality of, links between technologies and materials used for nuclear energy production and nuclear weapons have always given rise to concerns about nuclear weapons proliferation. Concerns about these connections have grown in the past few years as a result of nuclear programs in Iran, North Korea, India and Pakistan. Large-scale repro-cessing activities to increase the nuclear fuel supply would seriously exacerbate existing weapons prolif-eration risks.
Nuclear generating facilities and their associated waste fuel storage facilities have been identified as potential targets for attack by groups or individuals motivated by political purposes, insanity or both. The consequences of such an attack, if successful, would be uniquely severe, as it could result in the release of large amounts of radioactive material to the atmosphere.
Sustainability Challenges

102 The Pembina Institute • Nuclear Power in Canada: An Examination of Risks, Impacts and Sustainability 103Nuclear Power in Canada: An Examination of Risks, Impacts and Sustainability • The Pembina Institute
102 The Pembina Institute • Nuclear Power in Canada: An Examination of Risks, Impacts and Sustainability 103Nuclear Power in Canada: An Examination of Risks, Impacts and Sustainability • The Pembina Institute
7.1. IntroductionThis study examined the environmental impacts of the use of nuclear energy in Canada, through each of the four major stages of nuclear energy produc-tion: uranium mining and milling; uranium refining; conversion and fuel fabrication; nuclear power plant operation; and waste fuel management.
The impacts of nuclear energy production were examined in terms of waste generation, atmospheric releases of pollutants and contaminants, impacts on water quality and water use, landscape and ecosystem impacts, and occupational and community health impacts. In addition, a number of challenges to the long-term sustainability of the use of nuclear energy for electricity production were examined. These chal-lenges included power plant construction costs and timeframes, power plant performance and associated maintenance costs, the fuel supply security and costs, and security and weapons proliferation risks.
7.2. Overview of ImpactsThe annual physical impacts associated with nuclear energy production in Canada are summarized in Table 7.1 using data for 2003 (except as noted), the most recent year for which relatively complete data is available. The figures for emissions and waste gen-eration from mining, milling and refining, conversion and fuel fabrication facilities are adjusted to reflect the portion of these activities (approximately 16 per cent) associated with fuel production for domestic energy production purposes. The major findings are discussed in the following sections.
7.2.1. Waste Generation The most significant short-term environmental impact of the use of nuclear power to produce elec-tricity in Canada is the generation of a number of
extremely large waste streams that contain a wide range of radioactive and hazardous contaminants, and some of which also represent serious security, accident and weapons proliferation risks. All of these waste streams will require care and management over very long time frames for safety, environmental and security reasons.
Major waste streams arise at each stage of the nuclear power production process. The key waste streams include the following:
Uranium mining and milling• An estimated 575,000 tonnes of tailings per year,
of which 90–100,000 tonnes can be attributed to uranium production for domestic energy pur-poses. Uranium mill tailings contain a range of radionuclides, heavy metals and other hazardous contaminants.
• Waste rock production may be as high as 18 mil-lion tonnes per year, of which 2.9 million tonnes can be attributed to mining for domestic energy production purposes.
• It is estimated that there are more than 213 mil-lion tonnes of uranium mine tailings in facilities in Canada.
Refining and conversion operations• IAEA figures suggest that nearly 1,000 tonnes
of solid wastes and 9,000 m3 of liquid wastes are produced per year as a result of uranium refin-ing, conversion and fuel production for domestic energy generation purposes. Information on the precise character and fate of these wastes is not publicly available.
Power Plant operation• Approximately 85,000 waste fuel bundles are
7. Summary and Conclusions
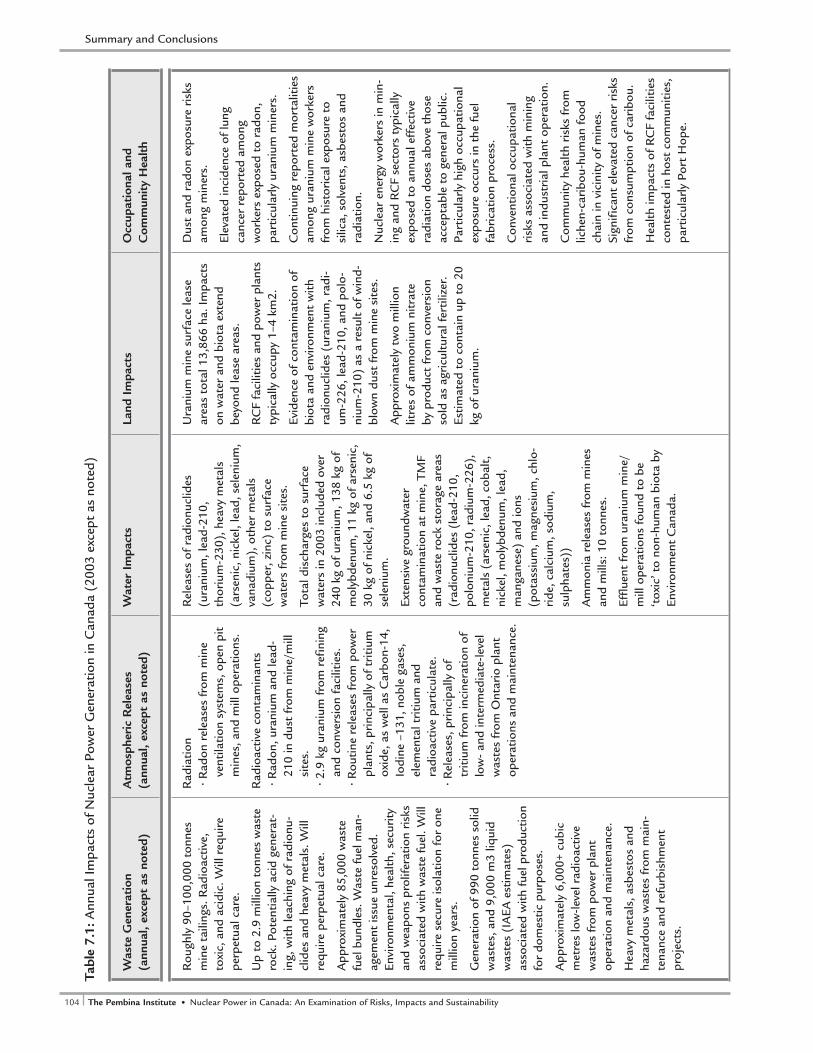
104 The Pembina Institute • Nuclear Power in Canada: An Examination of Risks, Impacts and Sustainability 105Nuclear Power in Canada: An Examination of Risks, Impacts and Sustainability • The Pembina Institute
Rou
ghly
90–
100,
000
tonn
es
min
e ta
iling
s. R
adio
activ
e,
toxi
c, a
nd a
cidi
c. W
ill r
equi
re
perp
etua
l car
e.
Up
to 2
.9 m
illio
n to
nnes
was
te
rock
. Pot
entia
lly a
cid
gene
rat-
ing,
with
leac
hing
of r
adio
nu-
clid
es a
nd h
eavy
met
als.
Will
re
quir
e pe
rpet
ual c
are.
App
roxi
mat
ely
85,0
00 w
aste
fu
el b
undl
es. W
aste
fuel
man
-ag
emen
t is
sue
unre
solv
ed.
Envi
ronm
enta
l, he
alth
, sec
urity
an
d w
eapo
ns p
rolif
erat
ion
risk
s as
soci
ated
with
was
te fu
el. W
ill
requ
ire
secu
re is
olat
ion
for
one
mill
ion
year
s.
Gen
erat
ion
of 9
90 t
onne
s so
lid
was
tes,
and
9,0
00 m
3 liq
uid
was
tes
(IA
EA e
stim
ates
) as
soci
ated
with
fuel
pro
duct
ion
for
dom
estic
pur
pose
s.
App
roxi
mat
ely
6,00
0+ c
ubic
m
etre
s lo
w-le
vel r
adio
activ
e w
aste
s fr
om p
ower
pla
nt
oper
atio
n an
d m
aint
enan
ce.
Hea
vy m
etal
s, a
sbes
tos
and
haza
rdou
s w
aste
s fr
om m
ain-
tena
nce
and
refu
rbis
hmen
t pr
ojec
ts.
Rad
iatio
n• R
adon
rel
ease
s fr
om m
ine
vent
ilatio
n sy
stem
s, o
pen
pit
min
es, a
nd m
ill o
pera
tions
.
Rad
ioac
tive
cont
amin
ants
• Rad
on, u
rani
um a
nd le
ad-
210
in d
ust
from
min
e/m
ill
site
s.• 2
.9 k
g ur
aniu
m fr
om r
efin
ing
and
conv
ersi
on f
acili
ties.
• Rou
tine
rele
ases
from
pow
er
plan
ts, p
rinc
ipal
ly o
f tri
tium
ox
ide,
as
wel
l as
Car
bon-
14,
Iodi
ne –
131,
nob
le g
ases
, el
emen
tal t
ritiu
m a
nd
radi
oact
ive
part
icul
ate.
• R
elea
ses,
pri
ncip
ally
of
triti
um fr
om in
cine
ratio
n of
lo
w-
and
inte
rmed
iate
-leve
l w
aste
s fr
om O
ntar
io p
lant
op
erat
ions
and
mai
nten
ance
.
Rel
ease
s of
rad
ionu
clid
es
(ura
nium
, lea
d-21
0,
thor
ium
-230
), h
eavy
met
als
(ars
enic
, nic
kel,
lead
, sel
eniu
m,
vana
dium
), o
ther
met
als
(cop
per,
zin
c) t
o su
rfac
e w
ater
s fr
om m
ine
site
s.
Tota
l dis
char
ges
to s
urfa
ce
wat
ers
in 2
003
incl
uded
ove
r 24
0 kg
of u
rani
um, 1
38 k
g of
m
olyb
denu
m, 1
1 kg
of a
rsen
ic,
30 k
g of
nic
kel,
and
6.5
kg o
f se
leni
um.
Exte
nsiv
e gr
ound
wat
er
cont
amin
atio
n at
min
e, T
MF
and
was
te r
ock
stor
age
area
s (r
adio
nucl
ides
(le
ad-2
10,
polo
nium
-210
, rad
ium
-226
),
met
als
(ars
enic
, lea
d, c
obal
t,
nick
el, m
olyb
denu
m, l
ead,
m
anga
nese
) an
d io
ns
(pot
assi
um, m
agne
sium
, chl
o-ri
de, c
alci
um, s
odiu
m,
sulp
hate
s))
Am
mon
ia r
elea
ses
from
min
es
and
mill
s: 1
0 to
nnes
.
Efflu
ent
from
ura
nium
min
e/m
ill o
pera
tions
foun
d to
be
‘tox
ic’ t
o no
n-hu
man
bio
ta b
y En
viro
nmen
t C
anad
a.
Ura
nium
min
e su
rfac
e le
ase
area
s to
tal 1
3,86
6 ha
. Im
pact
s on
wat
er a
nd b
iota
ext
end
beyo
nd le
ase
area
s.
RC
F fa
cilit
ies
and
pow
er p
lant
s ty
pica
lly o
ccup
y 1–
4 km
2.
Evid
ence
of c
onta
min
atio
n of
bi
ota
and
envi
ronm
ent
with
ra
dion
uclid
es (
uran
ium
, rad
i-um
-226
, lea
d-21
0, a
nd p
olo-
nium
-210
) as
a r
esul
t of
win
d-bl
own
dust
from
min
e si
tes.
App
roxi
mat
ely
two
mill
ion
litre
s of
am
mon
ium
nitr
ate
by p
rodu
ct fr
om c
onve
rsio
n so
ld a
s ag
ricu
ltura
l fer
tiliz
er.
Estim
ated
to
cont
ain
up t
o 20
kg
of u
rani
um.
Dus
t an
d ra
don
expo
sure
ris
ks
amon
g m
iner
s.
Elev
ated
inci
denc
e of
lung
ca
ncer
rep
orte
d am
ong
wor
kers
exp
osed
to
rado
n,
part
icul
arly
ura
nium
min
ers.
Con
tinui
ng r
epor
ted
mor
talit
ies
amon
g ur
aniu
m m
ine
wor
kers
fr
om h
isto
rica
l exp
osur
e to
si
lica,
sol
vent
s, a
sbes
tos
and
radi
atio
n.
Nuc
lear
ene
rgy
wor
kers
in m
in-
ing
and
RC
F se
ctor
s ty
pica
lly
expo
sed
to a
nnua
l eff
ectiv
e ra
diat
ion
dose
s ab
ove
thos
e ac
cept
able
to
gene
ral p
ublic
. Pa
rtic
ular
ly h
igh
occu
patio
nal
expo
sure
occ
urs
in t
he fu
el
fabr
icat
ion
proc
ess.
Con
vent
iona
l occ
upat
iona
l ri
sks
asso
ciat
ed w
ith m
inin
g an
d in
dust
rial
pla
nt o
pera
tion.
Com
mun
ity h
ealth
ris
ks fr
om
liche
n-ca
ribo
u-hu
man
food
ch
ain
in v
icin
ity o
f min
es.
Sign
ifica
nt e
leva
ted
canc
er r
isks
fr
om c
onsu
mpt
ion
of c
arib
ou.
Hea
lth im
pact
s of
RC
F fa
cilit
ies
cont
este
d in
hos
t co
mm
uniti
es,
part
icul
arly
Por
t H
ope.
Tabl
e 7.
1: A
nnua
l Im
pact
s of
Nuc
lear
Pow
er G
ener
atio
n in
Can
ada
(200
3 ex
cept
as
note
d)
Was
te G
ener
atio
n (a
nnua
l, ex
cept
as
note
d)A
tmos
pher
ic R
elea
ses
(ann
ual,
exce
pt a
s no
ted)
Wat
er I
mpa
cts
Land
Im
pact
sO
ccup
atio
nal a
nd
Com
mun
ity
Hea
lth
Summary and Conclusions
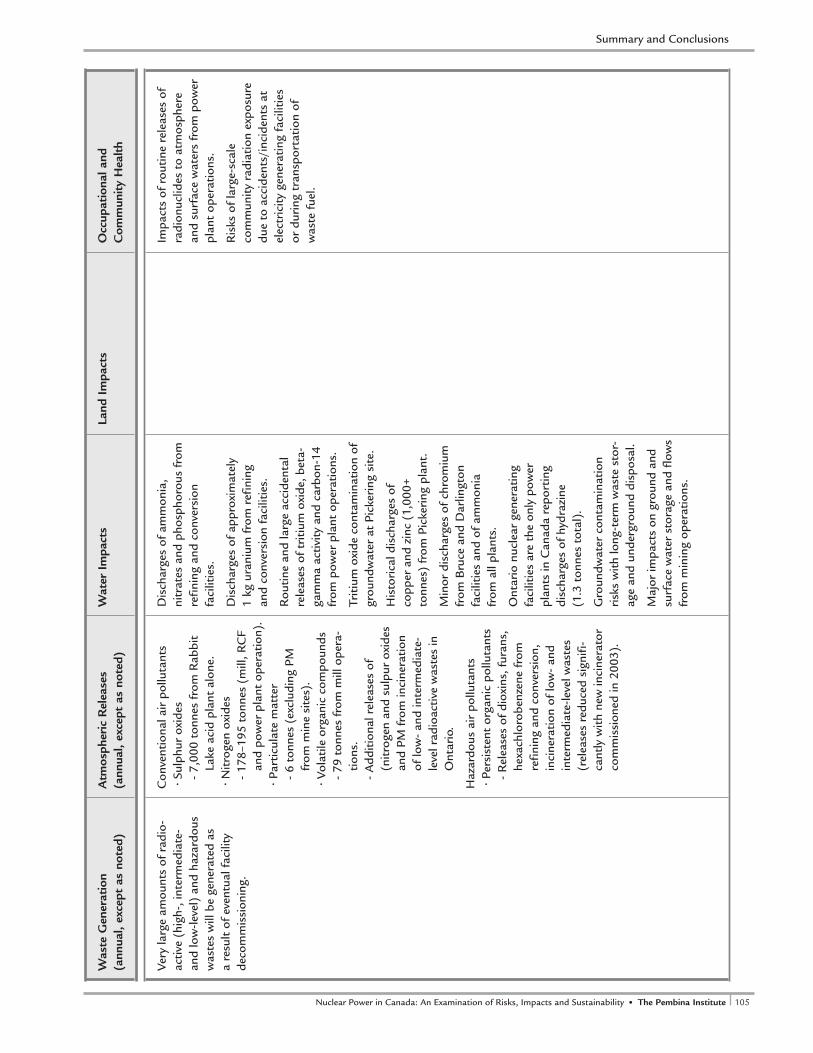
104 The Pembina Institute • Nuclear Power in Canada: An Examination of Risks, Impacts and Sustainability 105Nuclear Power in Canada: An Examination of Risks, Impacts and Sustainability • The Pembina Institute
Very
larg
e am
ount
s of
rad
io-
activ
e (h
igh-
, int
erm
edia
te-
and
low
-leve
l) a
nd h
azar
dous
w
aste
s w
ill b
e ge
nera
ted
as
a re
sult
of e
vent
ual f
acili
ty
deco
mm
issi
onin
g.
Con
vent
iona
l air
pol
luta
nts
• Sul
phur
oxi
des
- 7,
000
tonn
es fr
om R
abbi
t La
ke a
cid
plan
t al
one.
• N
itrog
en o
xide
s-
178–
195
tonn
es (
mill
, RC
F an
d po
wer
pla
nt o
pera
tion)
.• P
artic
ulat
e m
atte
r-
6 to
nnes
(ex
clud
ing
PM
from
min
e si
tes)
.• V
olat
ile o
rgan
ic c
ompo
unds
- 79
ton
nes
from
mill
ope
ra-
tions
.-
Add
ition
al r
elea
ses
of
(nitr
ogen
and
sul
pur
oxid
es
and
PM fr
om in
cine
ratio
n of
low
- an
d in
term
edia
te-
leve
l rad
ioac
tive
was
tes
in
Ont
ario
.
Haz
ardo
us a
ir p
ollu
tant
s• P
ersi
sten
t or
gani
c po
lluta
nts
- R
elea
ses
of d
ioxi
ns, f
uran
s,
hexa
chlo
robe
nzen
e fr
om
refin
ing
and
conv
ersi
on,
inci
nera
tion
of lo
w-
and
inte
rmed
iate
-leve
l was
tes
(rel
ease
s re
duce
d si
gnifi
-ca
ntly
with
new
inci
nera
tor
com
mis
sion
ed in
200
3).
Dis
char
ges
of a
mm
onia
, ni
trat
es a
nd p
hosp
horo
us fr
om
refin
ing
and
conv
ersi
on
faci
litie
s.
Dis
char
ges
of a
ppro
xim
atel
y 1
kg u
rani
um fr
om r
efin
ing
and
conv
ersi
on f
acili
ties.
Rou
tine
and
larg
e ac
cide
ntal
re
leas
es o
f tri
tium
oxi
de, b
eta-
gam
ma
activ
ity a
nd c
arbo
n-14
fr
om p
ower
pla
nt o
pera
tions
.
Triti
um o
xide
con
tam
inat
ion
of
grou
ndw
ater
at
Pick
erin
g si
te.
His
tori
cal d
isch
arge
s of
co
pper
and
zin
c (1
,000
+ to
nnes
) fr
om P
icke
ring
pla
nt.
Min
or d
isch
arge
s of
chr
omiu
m
from
Bru
ce a
nd D
arlin
gton
fa
cilit
ies
and
of a
mm
onia
fr
om a
ll pl
ants
.
Ont
ario
nuc
lear
gen
erat
ing
faci
litie
s ar
e th
e on
ly p
ower
pl
ants
in C
anad
a re
port
ing
disc
harg
es o
f hyd
razi
ne
(1.3
ton
nes
tota
l).
Gro
undw
ater
con
tam
inat
ion
risk
s w
ith lo
ng-t
erm
was
te s
tor-
age
and
unde
rgro
und
disp
osal
.
Maj
or im
pact
s on
gro
und
and
surf
ace
wat
er s
tora
ge a
nd f
low
s fr
om m
inin
g op
erat
ions
.
Impa
cts
of r
outin
e re
leas
es o
f ra
dion
uclid
es t
o at
mos
pher
e an
d su
rfac
e w
ater
s fr
om p
ower
pl
ant
oper
atio
ns.
Ris
ks o
f lar
ge-s
cale
co
mm
unity
rad
iatio
n ex
posu
re
due
to a
ccid
ents
/inc
iden
ts a
t el
ectr
icity
gen
erat
ing
faci
litie
s or
dur
ing
tran
spor
tatio
n of
w
aste
fuel
.
Was
te G
ener
atio
n (a
nnua
l, ex
cept
as
note
d)A
tmos
pher
ic R
elea
ses
(ann
ual,
exce
pt a
s no
ted)
Wat
er I
mpa
cts
Land
Im
pact
sO
ccup
atio
nal a
nd
Com
mun
ity
Hea
lth
Summary and Conclusions
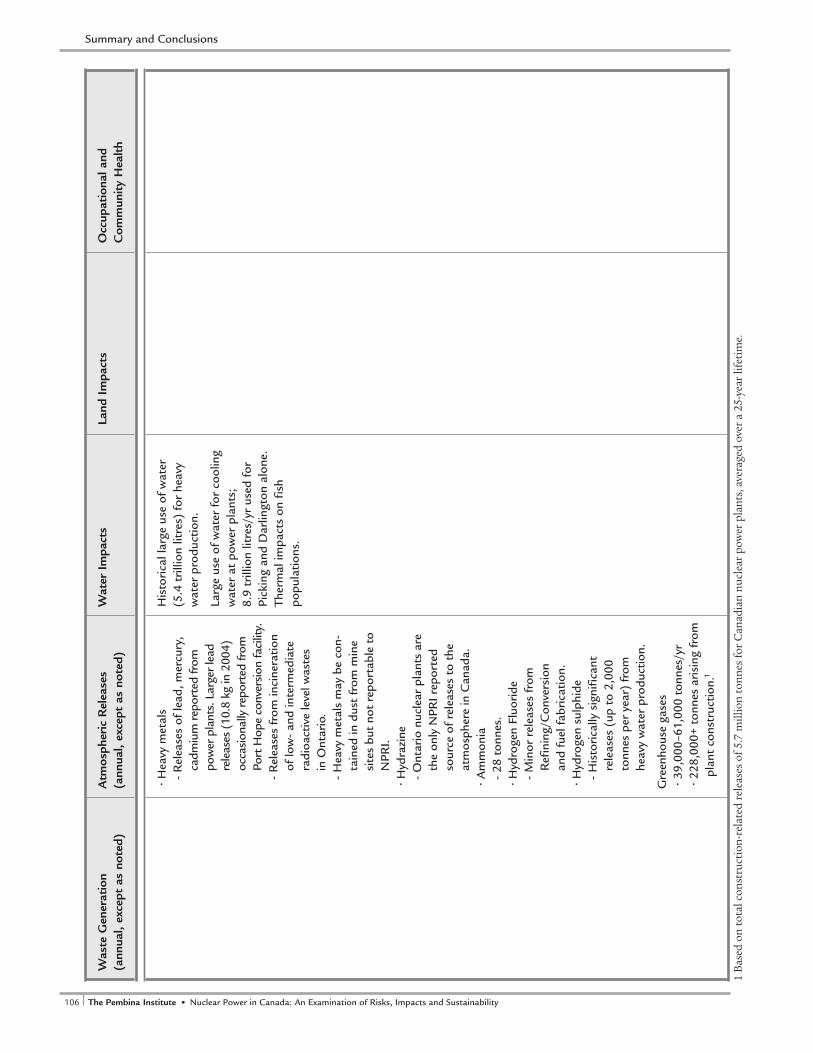
106 The Pembina Institute • Nuclear Power in Canada: An Examination of Risks, Impacts and Sustainability 107Nuclear Power in Canada: An Examination of Risks, Impacts and Sustainability • The Pembina Institute
• H
eavy
met
als
- R
elea
ses
of le
ad, m
ercu
ry,
cadm
ium
rep
orte
d fr
om
pow
er p
lant
s. L
arge
r lea
d re
leas
es (
10.8
kg
in 2
004)
oc
casi
onal
ly r
epor
ted
from
Po
rt H
ope
conv
ersi
on fa
cilit
y.-
Rel
ease
s fr
om in
cine
ratio
n of
low
- an
d in
term
edia
te
radi
oact
ive
leve
l was
tes
in O
ntar
io.
- H
eavy
met
als
may
be
con-
tain
ed in
dus
t fr
om m
ine
site
s bu
t no
t re
port
able
to
NPR
I. • H
ydra
zine
- O
ntar
io n
ucle
ar p
lant
s ar
e th
e on
ly N
PRI r
epor
ted
sour
ce o
f rel
ease
s to
the
at
mos
pher
e in
Can
ada.
• Am
mon
ia-
28 t
onne
s.• H
ydro
gen
Fluo
ride
- M
inor
rel
ease
s fr
om
Ref
inin
g/C
onve
rsio
n an
d fu
el f
abri
catio
n.
• Hyd
roge
n su
lphi
de-
His
tori
cally
sig
nific
ant
rele
ases
(up
to
2,00
0 to
nnes
per
yea
r) fr
om
heav
y w
ater
pro
duct
ion.
Gre
enho
use
gase
s• 3
9,00
0–61
,000
ton
nes/
yr• 2
28,0
00+
tonn
es a
risi
ng fr
om
plan
t co
nstr
uctio
n.1
His
tori
cal l
arge
use
of w
ater
(5
.4 t
rilli
on li
tres
) fo
r he
avy
wat
er p
rodu
ctio
n.
Larg
e us
e of
wat
er fo
r co
olin
g w
ater
at
pow
er p
lant
s;
8.9
trill
ion
litre
s/yr
use
d fo
r Pi
ckin
g an
d D
arlin
gton
alo
ne.
Ther
mal
impa
cts
on f
ish
popu
latio
ns.
Was
te G
ener
atio
n (a
nnua
l, ex
cept
as
note
d)A
tmos
pher
ic R
elea
ses
(ann
ual,
exce
pt a
s no
ted)
Wat
er I
mpa
cts
Land
Im
pact
sO
ccup
atio
nal a
nd
Com
mun
ity
Hea
lth
Summary and Conclusions
1 B
ased
on
tota
l con
stru
ctio
n-re
late
d re
leas
es o
f 5.7
mill
ion
tonn
es fo
r C
anad
ian
nucl
ear
pow
er p
lant
s, a
vera
ged
over
a 2
5-ye
ar li
feti
me.
106 The Pembina Institute • Nuclear Power in Canada: An Examination of Risks, Impacts and Sustainability 107Nuclear Power in Canada: An Examination of Risks, Impacts and Sustainability • The Pembina Institute
generated by Canadian nuclear reactors each year. As of 2003, 1.7 million bundles were in storage at reactor sites. It is estimated that these wastes will have to be secured for approximately one million years for safety, environmental and security rea-sons.
• Approximately 6,000 cubic metres of lower level radioactive wastes are generated each year in Ontario as a result of power plant operations, maintenance, and refurbishment. A wide range of radiological and hazardous pollutants has been released to the atmosphere as a result of the incin-eration of these wastes at the Bruce Western Waste Management facility. A new incinerator installed at the in 2003 has reduced emissions of hazard-ous, but not radiological, pollutants.
• Power plant maintenance and refurbishment also result in the generation of substantial amounts of additional hazardous wastes, including heavy met-als and asbestos.
• Very large amounts of low-, intermediate- and high-level radioactive wastes will be produced as a result of the eventual decommissioning of refining, conversion and fabrication facilities and power plants. The costs of decommissioning Ontario’s existing reactors have been estimated at $7.474 billion (present value $6.263 billion)
Proposals have been advanced since the 1970s for the management of waste fuel, but no long-term management strategy has been adopted to date. The Nuclear Waste Management Organization (NWMO), established by the federal government in 2002, has proposed a “phased adaptive management strategy,” for waste fuel from existing reactors. The proposal is currently under consideration by the federal gov-ernment. It is estimated that implementation of the NWMO’s proposed strategy would have a total cost in the range of $24 billion, and extend over a period of more than 300 years.
There is no national management strategy in place or under development for low-and intermediate- level radioactive wastes arising from uranium refining and conversion activities and nuclear power plant opera-tion, maintenance and refurbishment and eventual decommissioning. Ontario Power Generation is cur-rently pursuing a proposal for a deep underground repository for low and intermediate-level wastes gen-erated by its facilities.
The effectiveness and adequacy of tailings manage-ment facilities at mine sites has been subject to serious question. There is a long history of uranium mine tail-ings management facility failures in Canada and else-
where in the world, resulting in severe surface water and groundwater contamination. In addition, wind-blown dust from tailings management facilities has contaminated surrounding environments and biota. The generation of waste rock and tailings increase proportionally with the use of lower grade uranium ores, as larger amounts of ore would have to be pro-cessed to produce the same amount of uranium con-centrate. The processing of ore that is 0.01% uranium, for example, would generate approximately ten times the amount of tailings compared to the processing of ore that is 0.1% uranium.
The extremely long timelines over which the wastes arising from reliance on nuclear power will have to be managed, make the projection of future risks and costs arising from their management extremely dif-ficult. The resulting situation raises important chal-lenges to the use of nuclear energy for electricity pro-duction. The nature and volume of the wastes gener-ated mean significant or unknown risks and costs will be passed on to generations far into the future as a result of energy consumption in the present.
7.2.2. Water ImpactsThe second major area of impacts is water related. These impacts relate to both water quality and the quantities of surface and groundwater affected in the course of the production of nuclear energy.
7.2.2.1. Water Quality ImpactsSevere contamination of surface water and ground-water with radionuclides, heavy metals and other pollutants has arisen from uranium mine tailing management facilities and mine and mill operations. Discharges to surface waters from uranium mines and mills in Canada in 2003 included over 1,500 kg of uranium, 860 kg of molybdenum, 70 kg of arsenic, 185 kg of nickel, 40 kg of selenium, and 10 tonnes of ammonia.
Concentrations of major ions (potassium, mag-nesium, bicarbonate, chloride, calcium, sodium and sulphate) ranging from 10 to 200 times the levels of un-impacted groundwater have been found in areas near uranium mine tailings management facilities. Effluent from uranium mines and mills was found by Health Canada and Environment Canada to be ‘toxic’ for the purposes of the Canadian Environmental Protec-tion Act in 2004.
Routine and accidental releases of radionuclides to surface waters occur in the course of power plant operations, with tritium oxide and carbon-14 being the key radioactive pollutants of concern. Groundwa-
Summary and Conclusions
108 The Pembina Institute • Nuclear Power in Canada: An Examination of Risks, Impacts and Sustainability 109Nuclear Power in Canada: An Examination of Risks, Impacts and Sustainability • The Pembina Institute
ter contamination with tritium has also occurred at the Pickering generating facility in Ontario.
Ontario’s nuclear power plants are the lead-ing source of discharges of hydrazine, an extremely hazardous pollutant, to surface waters in Canada. Nuclear generating facilities have also been sources of discharges of metals (copper, zinc, and chromium) and ammonia to surface waters. Minor discharges of ammonia, nitrates and phosphorous to surface waters occur from refining and conversion facilities, along with discharges of approximately 1 kg of uranium per year.
7.2.2.2. Water use Nuclear power generation is a major consumer of water. Uranium mining operations involve extensive dewatering (pumping out of groundwater from the mine to avoid flooding), in the range of at least 16–17 billion litres per year, with the implication of impacts on groundwater and surface water storage and flows. Approximately 5.4 trillion litres of water were histori-cally used in heavy water production for CANDU reac-tors.
Generating facilities require large amounts of cool-ing water. The Darlington and Pickering facilities use approximately 8.9 trillion litres of water for cooling purposes per year — more than 19 times the annual water consumption of the City of Toronto. Adverse thermal impacts of cooling water discharges on fish populations in the vicinity of nuclear power plants have been observed.
7.2.3. Atmospheric ImpactsContrary to frequent statements that nuclear energy provides “emission free” energy, there are releases of criteria, radioactive and hazardous air pollutants and greenhouse gases throughout the nuclear energy pro-duction process.
7.2.3.1. RadionuclidesAtmospheric releases of a range of radionuclides occur at all stages of nuclear power production. Atmospheric releases of radon gas occur as a result of mining and milling operations and from tailings management facilities. Windblown dust from mine sites and TMFs contains a range of radionuclides (e.g. uranium, Ra-226, Pb-210, and Po-210). Atmospheric releases (principally uranium) arise from refining and conversion activities. Routine and accidental releases of radiation and radionuclides occur from power plant operations, including tritium oxide, carbon-14, noble gases, iodine-131, radioactive particulate and
elemental tritium. The incineration of low and inter-mediate-level radioactive wastes from power plant operations and maintenance in Ontario has resulted in further atmospheric releases of radionuclides, par-ticularly tritium.
7.2.3.2. Hazardous air pollutants. Windblown dust from mine sites and TMFs contains a range of heavy metals. In addition, releases of a num-ber of hazardous air pollutants, including dioxins and furans, hexachlorobenzene, heavy metals (principally lead) ammonia and hydrogen fluoride arise from ura-nium refining and conversion operations. Ontario nuclear power plants are the only NPRI reported source of releases of hydrazine to the air in Canada. A wide range of hazardous air pollutants have been released to the atmosphere as a result of the incinera-tion of low and intermediate-level radioactive wastes at the Bruce Western Waste Management facility. A new incinerator installed at the in 2003 has reduced emissions of hazardous, but not radiological, pollut-ants Major historical releases (up to 2,000 tonnes per year) of H2S were associated with heavy water produc-tion in Canada for CANDU reactors.
7.2.3.3. Criteria air pollutantsMining and milling operations are major sources of releases of SO2 (43,000 tonnes per year from the Rabbit Lake Acid plant alone), VOCs (500 tonnes per year) and NOx (400 tonnes per year). Additional releases of NOx, PM, and sulphuric acid arise from refining and conversion activities, and from the road transportation of uranium from mill sites in northern Saskatchewan to the Blind River refinery in northern Ontario and then on to the Port Hope conversion facility in southern Ontario. Minor releases of criteria air pollutants are associated with the testing of fos-sil fuel-powered emergency generating equipment at nuclear generating facilities. Further transportation related releases of criteria air pollutants would arise from the long-term management of waste nuclear fuel and other radioactive wastes arising from facil-ity operations, maintenance and decommissioning, particularly if the management strategies for these materials require the movement of wastes from reac-tor sites to centralized facilities.
7.2.3.4. Greenhouse gas emissions GHG emissions arise at each stage of the nuclear energy cycle, with power plant construction being the most significant source of releases. Further releases of GHGs occur as a result of the operation of equip-
Summary and Conclusions
108 The Pembina Institute • Nuclear Power in Canada: An Examination of Risks, Impacts and Sustainability 109Nuclear Power in Canada: An Examination of Risks, Impacts and Sustainability • The Pembina Institute
ment in the uranium mining process, the milling of uranium ore, mill tailings management activities, and refining and conversion operations. The generation of greenhouse gases from mining and milling operations would increase proportionally with the use of lower grade uranium ores, as larger amounts of ore would have to be extracted and processed to produce the same amount of uranium concentrate.
The road transportation of uranium between milling, refining and conversion facilities results in additional releases. As with criteria air pollutants, the management of waste nuclear fuel, and other radioac-tive wastes could involve significant transportation activities, leading to further generation of greenhouse gases emissions.
In Canada, total GHG emissions associated with uranium mining, milling, refining, conversion and fuel fabrication are between 240,000 and 366,000 tonnes of CO2 per year. Total emissions associated with the sector, including the emissions associated with power plant construction, are in the range of 468,000 and 594,000 tonnes of CO2 per year, equiva-lent to the emissions of between 134,000 and 170,000 cars per year. Total annual GHG emissions associated solely with domestic power production are estimated at between 267,000 and 289,000 tonnes of CO2 per year. This total is almost certainly an underestimate, due to a lack of complete information. Other recent estimates suggest total GHG emissions associated with nuclear power in Canada are in the range of at least 840,000 tonnes per year. 10
7.2.4. Landscape Impacts Uranium mine surface lease areas in Canada total 13,866 ha. However, as a result of discharges of con-taminants to surface water and groundwater and windblown dust from mine sites containing radionu-clides and heavy metals, the impacts of mining and milling activities extend well beyond lease areas.
Similarly, though refining, conversion and fuel production facilities and power plants typically occupy a relatively small area (1–4 km2), they can easily have impacts well beyond their fence lines. For example, 3.5 million m3 of historic wastes associated with the Port Hope conversion facility remain within the town. These wastes contain uranium, radium and their radioactive decay products, together with vari-ous heavy metals. Another 872,000 m3 lie in the area immediately west of Port Hope at Welcome and Port Granby. Approximately two million litres of ammo-nium nitrate by-product from the conversion process are reported to be sold as agricultural fertilizer each
year. This material has been estimated to contain up to 20 kg of uranium.
7.2.5. Occupational and Community Health The International Agency for Research on Cancer (IARC) lists a number of radionuclides as carcinogenic to humans, including isotopes produced in uranium mining and milling, fuel production and nuclear power plant operations. It has been argued that exist-ing standards in Canada for cancer risks arising from radiological hazards permit much higher levels of acceptable risk than is the case for chemical and other hazards. More broadly, recent research on the effects of even very low levels of ionizing radiation suggests that no level is safe to health. The risk of cancer has been found to be greatest for women and children and to be higher for younger children.
Workers in the mining and refining, conversion and fuel fabrication sub-sectors are routinely exposed to levels of radiation above those which would be considered acceptable to members of the general pub-lic. Particularly high levels of occupational exposure occur in the fuel fabrication process.
There is a history of significant occupational health effects, particularly elevated incidences of lung cancer, among uranium miners attributed to radon exposure. Increased mortality among uranium miners is also attributed to exposure to silica, solvents, asbes-tos and radiation.
The community health impacts of nuclear facil-ity operation is a matter of ongoing controversy. Substantial health risks have been identified in rela-tion to the consumption of certain types of “country” food, particularly caribou, in the vicinity of uranium mine/mill operations, as a result of contamination by radionuclides.
Nuclear generating facility operators argue that the levels of public exposure to radiation arising from facility operations are trivial in comparison to other sources. These claims are contested, as recent stud-ies suggest that health impacts of low-level radiation exposure may be more significant than previously thought, and that children and infants may be par-ticularly at risk from such exposures.
There are long-standing community concerns regarding the health impacts of the Port Hope con-version facility in particular. There are also continu-ing concerns with respect to the adequacy of existing drinking water standards in Ontario for tritium and carbon-14. The existing Ontario drinking water stan-dard for tritium of 7,000 Bq/L is significantly weaker
Summary and Conclusions
110 The Pembina Institute • Nuclear Power in Canada: An Examination of Risks, Impacts and Sustainability 111Nuclear Power in Canada: An Examination of Risks, Impacts and Sustainability • The Pembina Institute
than the standards adopted in other jurisdictions. The standard in the United States is 740 Bq/L and in the European Union is 100 Bq/L.
Finally, there are low probability, but extremely high impact, risks of large-scale community radiation exposure due to accidents or incidents at electricity generating facilities, at waste fuel storage facilities or during the transportation of waste fuel. It has been estimated, for example, that the monetized value of the off-site environmental, health and economic impacts of a major accident at the Darlington gener-ating facility east of the City of Toronto, would exceed $1 trillion.
7.2.6. Data and Study limitationsThe findings outlined in this section likely underesti-mate the overall impacts of the use of nuclear energy for electricity production in Canada. The findings are focussed on impacts about which information could be accessed in the public domain.
The lack of coverage by the NPRI of the impact of mining activities up to the primary crushing stage results in significant data gaps with respect to the generation and fate of pollutants related to uranium mining activities. The non-inclusion of radionuclides in the NPRI results in additional information gaps in the reporting of releases and transfers of these sub-stances resulting from uranium mining and milling, refining, conversion and fuel fabrication, and nuclear power plant operation. Virtually no information was available regarding fate of wastes from refining, con-version and fuel fabrication operations.
In addition, key pieces of information were found to be scattered among a variety of sources, ranging from individual facilities and companies to regula-tory bodies. In some cases, freedom of information requests were required to obtain basic information on environmental releases of pollutants. In other cases, important information proved to be inaccessible due to business confidentiality issues.
Finally, the study relied on what were likely con-servative estimates from industry-related sources in a number of key areas, particularly with respect to the generation of GHG emissions, and waste generation from the refining, conversion and fuel fabrication processes.
7.2.7. Impacts of Non-CANDU type nuclear reactors. The study findings are focussed on the impacts of the operation of CANDU type reactors as these are the only type of reactor used for electricity generation
in Canada. Different types of reactors are associated with different impacts and risks. Light-water reac-tors, employing enriched uranium fuel, for example, are associated with the generation of lower volumes of waste fuel. However, the process of producing enriched uranium fuel for these types of reactors is associated with much higher emissions of greenhouse gases, particular where gas diffusion based enrichment processes are employed, as well as higher atmospheric releases of uranium and the generation of large vol-umes of depleted uranium (DU) wastes.
7.3. Sustainability ChallengesIn addition to its physical environmental impacts, particularly waste generation, nuclear energy genera-tion faces a number of unique challenges relative to energy generation via other sources.
7.3.1. Capital costs and construction times Nuclear power generating facilities are subject to very high capital costs and long construction times rela-tive to other electricity supply options. In addition, in Ontario there is a history of serious delays and cost overruns on nuclear generating facility projects, accounting for $15 billion of the nearly $20 billion “stranded debt” left by Ontario Hydro. Even with extensive subsidies and financial guarantees provided by government, these costs, timelines and risks make it difficult for nuclear power projects to compete for private capital investments against potential invest-ments that will bring much more rapid and secure returns.
7.3.2. Facility reliability The Ontario CANDU reactor fleet has been plagued by performance and maintenance problems. Over the past decade the Ontario facilities have had an average operating capacity in the 50per cent range rather than the expected 85–90 per cent range. Reactors expected to have operational lifetimes in the range of 40 years have turned out to require major refurbishments after approximately 25 years of service. Refurbishment projects themselves have run seriously over budget and behind schedule.
The poor performance of the Ontario CANDU fleet has had major collateral adverse effects on the province’s environment and the health of its residents. These impacts have been the result of the province’s increased reliance on domestic and imported coal-fired generation to replace electricity that would have
Summary and Conclusions
110 The Pembina Institute • Nuclear Power in Canada: An Examination of Risks, Impacts and Sustainability 111Nuclear Power in Canada: An Examination of Risks, Impacts and Sustainability • The Pembina Institute
been provided by out-of-service nuclear units. As a result of the shutdown of eight reactors under the 1997 Nuclear Asset Optimization Plan between 1995 and 2001, emissions of GHGs from the province’s coal-fired power plants increased by a factor of 2.3, sulphur dioxide emissions by a factor of 2, and nitro-gen oxide emissions by a factor of 1.7, significantly exacerbating the severe air quality problems regularly experienced in southern Ontario.
7.3.3. Fuel supply and costsUranium supply and costs are emerging as significant issues for reliance on nuclear power for electricity gen-eration. World uranium prices increased more than sixfold since 2001 and are expected to continue to rise. Uranium has experienced a much higher rate of price increase compared to other fuels in recent years, including natural gas. The question of the security of long-term uranium supplies is also an emerging concern, particularly if there is a large-scale expansion of reliance on nuclear generation. Current Canadian uranium reserves are estimated to be sufficient for 40 years at present levels of consumption. Efforts to increase the available fuel supply through the repro-cessing of waste fuel, or the use of fast breeder reac-tors, present serious waste management, technologi-cal and weapons proliferation risks.
Other suggested fuel sources, such as thorium or extraction of uranium from seawater, face major tech-nological, environmental and economic hurdles. Sig-nificant environmental impacts, including additional waste rock and tailings generation would accompany the expansion of uranium mining activities, particu-larly as lower grade uranium deposits would have to be exploited.
7.3.4. Weapons proliferation Nuclear energy’s shared origins with nuclear weapons programs raise the potential for and reality of links between technologies and materials used for energy production and for nuclear weapons development. Concerns about these connections have grown in the past few years as a result of nuclear programs in North Korea, Iran, India and Pakistan. Any large-scale expansion of reliance on nuclear energy would carry significant risks of the proliferation of materials and technologies that could be applied to weapons devel-opment. India’s 1974 nuclear bomb, developed in part using Canadian-supplied technology and uranium, demonstrated this problem clearly.
7.3.5. Security risksNuclear generating facilities and their associated waste fuel storage facilities have been identified as potential targets for attack by groups or individuals motivated by political purposes, insanity or both. The consequences of such attacks, if successful, would be uniquely severe; they could result in the release of large amounts of radioactive material to the atmosphere, which could be distributed over a large area. By com-parison, the impacts of major incidents or accidents at facilities employing other generating technologies would be short term and largely limited to the facility site itself.
7.4. Conclusions This study has sought to portray, in as complete a manner as possible based on publicly available and accessible information sources, a picture of the envi-ronmental impacts resulting from the use of nuclear energy for electricity generation in Canada. It is intended to inform comparisons with other energy sources.
The study finds that nuclear power, like other non-renewable energy sources, is associated with severe environmental impacts. In short, the use of nuclear power for electricity generation cannot be considered “clean.” Each stage of the nuclear energy production process generates large amounts of uniquely difficult-to-manage wastes that will require perpetual care, and that effectively push costs and risks arising from cur-rent energy consumption onto future generations. The process also has severe impacts on surface water and groundwater water quality via a range of radioac-tive and hazardous pollutants, and results in releases to the atmosphere of a wide range of criteria, radioac-tive and hazardous pollutants as well as GHGs.
In addition, the technology poses unique occu-pational and community health risks, along with security, accident and weapons proliferation risks not shared by any other energy source.
Nuclear generating facilities suffer from high capi-tal costs and long-construction times, with significant risks of cost overruns and delays. These are major bar-riers to private investment in the sector, particularly in combination with a history of poor facility perfor-mance in Ontario and emerging challenges regarding uranium costs and supply.
In the context of these impacts and risks, nuclear energy cannot be seen as a viable response to GHG emission problems associated with reliance on fossil fuels (e.g., coal) for electricity generation. In addition to the consideration that nuclear power is not itself a
Summary and Conclusions
112 The Pembina Institute • Nuclear Power in Canada: An Examination of Risks, Impacts and Sustainability 113Nuclear Power in Canada: An Examination of Risks, Impacts and Sustainability • The Pembina Institute
GHG emission-free energy source, a future path based on nuclear energy would simply replace one problem (GHG emissions) with a series of different, but equally unacceptable impacts and risks. These impacts and risks encompass everything from facility reliability and waste management to the potential for cata-strophic accidents and nuclear weapons proliferation.
As a result, proposals for the retention and expan-sion of the role of nuclear power must be approached with the greatest of caution. Such proposals must be examined in the full light of their environmental, eco-
nomic and security implications, not only for Canada, but the rest of the world as well. They must also be examined in the context of the full range of available alternatives. Such an examination is likely to conclude that better options are readily available. These options range from making the most efficient use possible of existing energy resources to expanding the role of low-impact renewable energy sources that offer far safer, cheaper, more reliable and more sustainable options for meeting society’s energy needs.
Summary and Conclusions
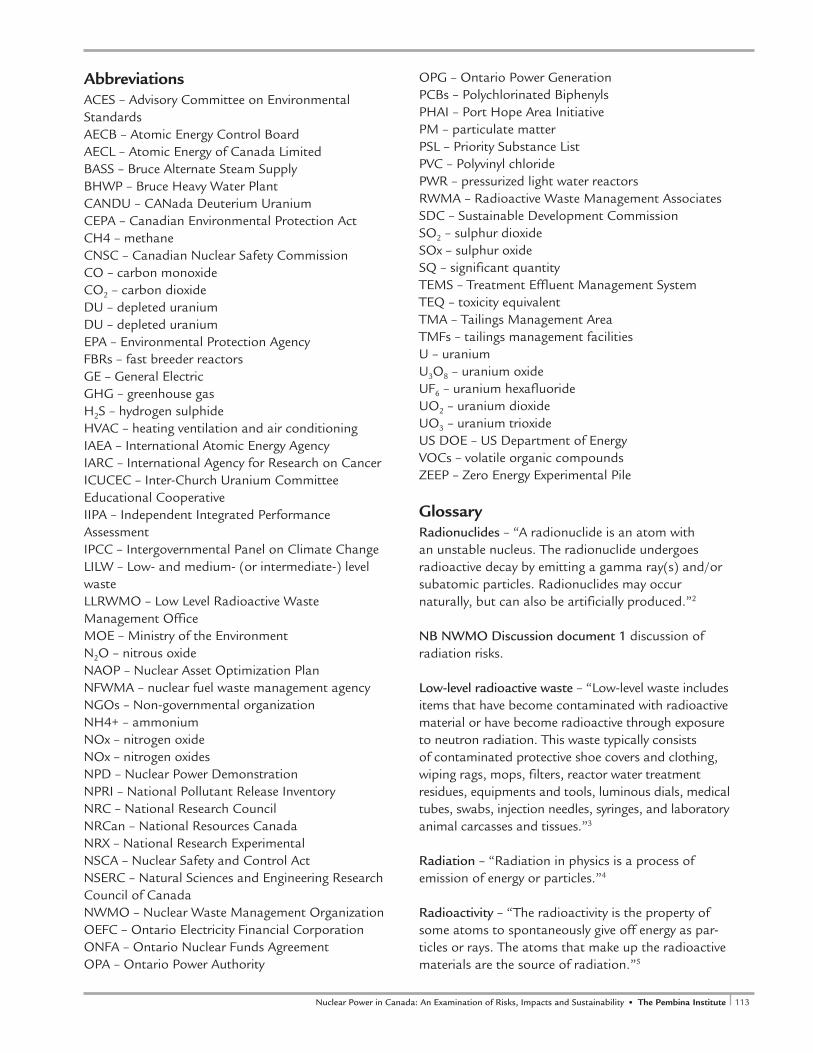
112 The Pembina Institute • Nuclear Power in Canada: An Examination of Risks, Impacts and Sustainability 113Nuclear Power in Canada: An Examination of Risks, Impacts and Sustainability • The Pembina Institute
AbbreviationsACES – Advisory Committee on Environmental StandardsAECB – Atomic Energy Control BoardAECL – Atomic Energy of Canada LimitedBASS – Bruce Alternate Steam SupplyBHWP – Bruce Heavy Water PlantCANDU – CANada Deuterium UraniumCEPA – Canadian Environmental Protection Act CH4 – methaneCNSC – Canadian Nuclear Safety CommissionCO – carbon monoxideCO2 – carbon dioxideDU – depleted uraniumDU – depleted uraniumEPA – Environmental Protection AgencyFBRs – fast breeder reactorsGE – General ElectricGHG – greenhouse gasH2S – hydrogen sulphideHVAC – heating ventilation and air conditioning IAEA – International Atomic Energy AgencyIARC – International Agency for Research on CancerICUCEC – Inter-Church Uranium Committee Educational CooperativeIIPA – Independent Integrated Performance AssessmentIPCC – Intergovernmental Panel on Climate ChangeLILW – Low- and medium- (or intermediate-) level wasteLLRWMO – Low Level Radioactive Waste Management OfficeMOE – Ministry of the EnvironmentN2O – nitrous oxideNAOP – Nuclear Asset Optimization PlanNFWMA – nuclear fuel waste management agencyNGOs – Non-governmental organizationNH4+ – ammoniumNOx – nitrogen oxideNOx – nitrogen oxidesNPD – Nuclear Power DemonstrationNPRI – National Pollutant Release InventoryNRC – National Research CouncilNRCan – National Resources CanadaNRX – National Research ExperimentalNSCA – Nuclear Safety and Control ActNSERC – Natural Sciences and Engineering Research Council of CanadaNWMO – Nuclear Waste Management OrganizationOEFC – Ontario Electricity Financial CorporationONFA – Ontario Nuclear Funds AgreementOPA – Ontario Power Authority
OPG – Ontario Power GenerationPCBs – Polychlorinated BiphenylsPHAI – Port Hope Area InitiativePM – particulate matterPSL – Priority Substance ListPVC – Polyvinyl chloride PWR – pressurized light water reactorsRWMA – Radioactive Waste Management AssociatesSDC – Sustainable Development CommissionSO2 – sulphur dioxideSOx – sulphur oxideSQ – significant quantityTEMS – Treatment Effluent Management SystemTEQ – toxicity equivalentTMA – Tailings Management AreaTMFs – tailings management facilitiesU – uraniumU3O8 – uranium oxideUF6 – uranium hexafluorideUO2 – uranium dioxideUO3 – uranium trioxideUS DOE – US Department of EnergyVOCs – volatile organic compoundsZEEP – Zero Energy Experimental Pile
Glossary Radionuclides – “A radionuclide is an atom with an unstable nucleus. The radionuclide undergoes radioactive decay by emitting a gamma ray(s) and/or subatomic particles. Radionuclides may occur naturally, but can also be artificially produced.”2
NB NWMO Discussion document 1 discussion of radiation risks.
Low-level radioactive waste – “Low-level waste includes items that have become contaminated with radioactive material or have become radioactive through exposure to neutron radiation. This waste typically consists of contaminated protective shoe covers and clothing, wiping rags, mops, filters, reactor water treatment residues, equipments and tools, luminous dials, medical tubes, swabs, injection needles, syringes, and laboratory animal carcasses and tissues.”3
Radiation – “Radiation in physics is a process of emission of energy or particles.”4
Radioactivity – “The radioactivity is the property of some atoms to spontaneously give off energy as par-ticles or rays. The atoms that make up the radioactive materials are the source of radiation.”5

114 The Pembina Institute • Nuclear Power in Canada: An Examination of Risks, Impacts and Sustainability 115Nuclear Power in Canada: An Examination of Risks, Impacts and Sustainability • The Pembina Institute
Sieverts (Sv) – The Sievert is the SI derived unit of dose equivalent that reflects the biological effects of radiation.6
Gamma radiation – Gamma rays are an energetic form of electromagnetic radiation produced by radio-active decay or other nuclear or subatomic processes.7
Becquerels (Bq) – The becquerel (symbol Bq) is the SI derived unit of radioactivity, defined as the activity of a quantity of radioactive material in which one nucleus decays per second.8
Radon – A radioactive noble gas formed by the dis-integration of radium, radon is one of the heaviest gases and is considered to be a health hazard.9
Tailings – Produced during the milling process, tailings consist largely of ground rock particles, water and various amounts of mill chemicals; they also contain radioactive and hazardous constituents.
Glossary
114 The Pembina Institute • Nuclear Power in Canada: An Examination of Risks, Impacts and Sustainability 115Nuclear Power in Canada: An Examination of Risks, Impacts and Sustainability • The Pembina Institute
1. Introduction1 M. Winfield, M. Horne, T. McClenaghan, and R. Peters, Power
for the Future: Towards a Sustainable Electricity System for Ontario (Toronto: Pembina Institute and Canadian Environmental Law Association, 2004).
2 Environment Canada, Priority Substances List Assessment Report. Releases of Radionuclides from Nuclear Facilities (Impact on Non-human Biota) (Ottawa: Government of Canada, May 2003).
3 The Power Authority is an agency created through the Electricity Restructuring Act, 2004. The Authority’s mandate includes electricity system planning. The Authority is subject to directives issued by the Minister of Energy. www.powerauthority.on.ca.
4 Ontario Power Authority, Supply Mix Advice Report (Toronto: Ontario Power Authority, December 2005), pg.49.
5 See, for example, G. Scotton, “French Minister Nuclear Pitchman,” Calgary Herald, March 29, 2006. See also B. Duane, “Implementing Kyoto in Canada: The Role of Nuclear Power,” The Energy Journal 26, no. 1 (insert year here), pp.107–21.
6 The Hon. D. Duncan, Ontario Minister of Energy, Supply Mix Directive to Ontario Power Authority, June 13, 2006, 2006).
7 Ontario Power Generation is a successor corporation to Ontario Hydro. It owns the province’s existing nuclear gen-erating facilities and operates the Picking and Darlington Facilities. www.opg.com.
8 Ministry of Energy, “McGuinty Government Delivers a Balanced Plan for Ontario’s Electricity Future,” news release, June 13, 2006.
9 See generally M. Winfield, R. Peters and M. Horne, The Ontario Power Authority’s Supply Mix Advice: A Review and Response (Toronto: The Pembina Institute, February 2006).
10 Dr. D. McKeown, Medical Office of Health, City of Toronto, “Letter to Premier McGuinty Re: Ontario Power Authority’s Supply Mix Advice Report,” February 3, 2006.
11 See, for example, T. McClenaghan, K. Cooper, P. Muldoon and R. Lindgren, Ontario Power Authority Supply Mix Advice Report (December 2005): Response to Consultation (Toronto: Canadian Environmental Law Association, February 2006).
12 Ontario Power Generation (OPG), “Pickering Nuclear,” Accessed November 21, 2005 at http://www.opg.com/ops/N_pickering.asp
13 The consortium of Bruce Power consists of Cameco Corporation, TransCanada Corporation, BPC Generation Infrastructure Trust (a trust established by the Ontario Municipal Employees Retirement System), the Power Workers’ Union and The Society of Energy Professionals. Source: Bruce Power, “About,” Accessed August 29, 2005 at http://www.brucepower.com/bpcms_web/pagecontent.aspx?navuid=111
14 Bruce Power, “Annual Review, 2001–2002,” Accessed November 21, 2005 at http://www.brucepower.com/bpcms_web/uc/GetDocument.aspx?docid=945
15 OPG, 2003. “2003 Fact Sheet.” at http://www.opg.com/ir/reports/2004yearendfs.pdf
16 Hydro-Québec. “Gentilly-2 Nuclear Generating Station.”
Accessed August 29, 2005 at http://www.hydroquebec.com/generation/classics/nuclear/gentilly_2/index.html
17 New Brunswick Power Generation. “System Map.” Accessed August 29, 2005 at http://generation.nbpower.com/en/systemmap/systemmap.aspx
18 Adapted from N. Lester, “Radiation” in J. Swaigen and D. Estrin (Eds.), Environment on Trial: A Guidebook to Ontario Environmental Law and Policy (Toronto: Emond-Montgomery Publishers and Canadian Institute for Environmental Law and Policy, 1993) pp.672–673, and Nuclear Waste Management Organization (NWMO), Asking the Right Questions: The Future of Canada’s Used Nuclear Fuel (Toronto: NWMO, 2003), p.28.
19 http://monographs.iarc.fr/ENG/Classification/crthgr01.php20 See N.Rubin, “Risk Methodology and Criteria for a Nuclear
Waste Disposal Facility” (Toronto: Borealis Energy Research Association for Energy Probe, 1996).
21 Committee to Assess Health Risks from Exposure to Low Levels of Ionizing Radiation, Health Risks from Exposure to Low Levels of Ionizing Radiation (BEIR VII) (Washington: The National Academy Press, 2005).
22 US Nuclear Regulatory Commission, “Low-Level Waste.” Accessed January 27, 2006 at http://www.nrc.gov/waste/low-level-waste.html
23 CNSC, Canadian National Report for the Joint Convention on the Safety of Spent Fuel Management and on the Safety of Radioactive Waste Management (Ottawa: Government of Canada, 2003). Accessed October 17, 2005 at http://www.nuclearsafety.gc.ca/pubs_catalogue/uploads/I0738_E.pdf.
24 CNSC. “Environmental Assessment: Ontario Power Generation – Proposal to Construct and Operate a Deep Geologic Repository for Disposal of Low and Intermediate Radioactive Waste.” Accessed March 30, 2006 at http://www.nuclearsafety.gc.ca/eng/assessments/EA_06_03_17520.cfm
Table 1.225 Department of Justice Canada, Canadian Environmental
Protection Act, Schedule 1 (Ottawa: Government of Canada, 1999). Accessed at http://lois.justice.gc.ca/en/C-15.31/index.html
26 Chemical profiles from www.scorecard.org. 27 Environment Canada, Priority Substances List Assessment Report.
Releases of Radionuclides from Nuclear Facilities (Impact on Non-human Biota), p.7.
28 Department for Environment, Food and Rural Affairs (DEFRA), Ammonia in the UK (London: DEFRA, 2002). Accessed February 12, 2006 at http://www.defra.gov.uk/environment/airquality/ammonia/pdf/ammonia_uk.pdf
29 Environment Canada, “Clean Water – Life Depends on It!” Accessed February 21, 2006 at http://www.ec.gc.ca/water/en/info/pubs/FS/e_FSA3.htm
30 Environment Canada. “Canadian Water Quality Guideline – Phosphorus.” Accessed February 21, 2006 at http://www.ec.gc.ca/ceqg-rcqe/English/Html/GAAG_Phosphorus_WQG.cfm
Endnotes
116 The Pembina Institute • Nuclear Power in Canada: An Examination of Risks, Impacts and Sustainability 117Nuclear Power in Canada: An Examination of Risks, Impacts and Sustainability • The Pembina Institute
31 Wilkes University. “Nitrates and Nitrites in Drinking Water.” Accessed February 21, 2006 at http://www.water-research.net/nitrate.htm#health
32 Department of Justice Canada, Canadian Environmental Protection Act, 1999, Schedule 1.
33 Department of Justice Canada, Canadian Environmental Protection Act, 1999, Schedule 1.
34 Department of Justice Canada, Canadian Environmental Protection Act, 1999, Schedule 1.
35 Department of Justice Canada, Nuclear Safety and Control Act (Ottawa: Government of Canada, 1997). Accessed November 15, 2005 at http://laws.justice.gc.ca/en/n-28.3/88752.html
36 Department of Justice Canada, Nuclear Safety and Control Act, 1997.
37 See Wise Uranium Project “Nuclear Fuel Production” slides 32 and 33 accessed September 6, 2006 at http://www.wise-uranium.org/stk.html?src=stkd02e for an estimate of CO2 emissions associated with uranium enrichment, based on an assumption of energy consumption of 2300-2500KWh/SWU (separative work unit). Modern centrifuge enrichment plants consume substantially less energy.
38 An isotope of an element is a species where the atoms have the same number of electrons and protons but different numbers of neutrons in the nucleus. As a result, the nucleus properties of isotopes of a certain element can vary.
39 G.A. Pon, “Nuclear Power Symposium Lecture No.1: Introduction,” AECL Power Projects. Accessed August 29, 2005 at http://canteach.candu.org/library/19720101.pdf
40 G.L. Brooks, “CANDU Origins and Evolution Part 2 of 5: Why CANDU.” Paper prepared as a contribution to the CANTEACH project sponsored by AECL. Accessed August 26, 2005 at http://canteach.candu.org/library/20010302.pdf
41 See generally R.B.Gibson, Sustainability Assessment: Criteria and Processes (London: Earthscan, 2005) Ch.3.
2. Phase I: Uranium Mining and Milling 1 R. Vance, “Uranium” in Canadian Minerals Yearbook, 2003
(Ottawa: Natural Resources Canada, 2005), p.58.3. Accessed February 13, 2006 at http://www.nrcan.gc.ca/mms/cmy/content/2003/64.pdf . Rabbit Lake and Key Lake mines are closed as their uranium reserves are depleted, but milling of uranium from nearby mines occurs here, so the sites are still listed as operational.
2 For a discussion of these impacts, see, for example, N. Lester “Radiation” in J. Swaigen and D. Estrin, (Eds.), Environment on Trail: A Guide to Ontario Environmental Law and Policy (Toronto: Canadian Institute for Environmental Law and Policy and Emond-Montgomery Publishers, 1993). See also A. Nikiforuk, “Echoes of the Atomic Age: Cancer Kills Fourteen Aboriginal Uranium Workers,” Calgary Herald, March 14, 1998, http://www.ccnr.org/deline_deaths.html
3 G. O’Reilly Mineral Resources Branch, Government of Nova Scotia), personal communication, November 15, 2005.
4 See http://www.stockhouse.com/shfn/article.asp?EdtID=18254
5 The Economist, “Glowing” August 19, 2006. 6 Planning and Environmental Assessment Caucus,
“Environmental Assessment of McLean Lake” in Our Experience with Environmental Assessment: Selected Case Studies in Environmental Planning and Assessment Processes in Canada,
(Ottawa: Canadian Environmental Network, January 2000). Accessed at http://www.cen-rce.org/eng/caucuses/assessment/index.html.
7 L. Murphy, ICUCEC, Case summary in an e-mail to the Canadian Environmental Network Environmental Assessment and Planning Caucus, April 15, 2005.
8 Cameco Corporation, “Nuclear Fuel Cycle.” Accessed June 17, 2005 at http://www.cameco.com/uranium_101/uranium_science/nuclear_fuel/index.php#three
9 S. Frost, “Waste Management in the Uranium Mining Industry” in The Uranium Institute: Twenty Third Annual International Symposium 1998. Accessed November 23, 2005 at http://www.world-nuclear.org/sym/1998/frost.htm
10 J. Andseta, M. J. Thompson, J. P. Jarrell, and D. R. Pendergast, CANDU Reactors and Greenhouse Gas Emissions (Banff, Alberta: Pacific Basin Nuclear Conference, 1998).
11 Natural Resources Industry, “Canada’s Uranium Industry 2004.” Accessed at http://www2.nrcan.gc.ca/es/erb/erb/english/View.asp?x=454&oid=967 indicates that domestic reactor requirements in 2003 were 1,600 tU. Total Canadian production was 10,455 tU in 2003.
12 Natural Resources Industry, “Canada’s Uranium Industry 2004.”
13 Natural Resources Canada, “Mining and Minerals Factsheets.” Accessed March 1, 2006 at http://www.nrcan-rncan.gc.ca/biotechnology/english/m_solution.html
14 T. Gesell, “Nuclear Fuel Production and Reprocessing,” Health Physics Lecture, Idaho State University. Accessed at http://www.physics.isu.edu/~gesell/Nuclear%20Fuel%20Production%20and%20Reprocessing%204pp.pdf
15 CNSC, Canadian National Report for the Joint Convention on the Safety of Spent Fuel Management and on the Safety of Radioactive Waste Management (Ottawa: Government of Canada, 2003). Accessed October 17, 2005 at http://www.nuclearsafety.gc.ca/pubs_catalogue/uploads/I0738_E.pdf
16 K. Scissons Saskatchewan Environment), personal commu-nication, April 5, 2006.
17 Canadian Nuclear Safety Commission “Caandian National Report for the Joint Convention on the Safety of Spent Fuel Managemnet and the Safety of Radioactive Waste Management,” (Ottawa: CNSC, 2003) accessed October 17th 2005, at www.nuclearsafety.gc.ca/pubs_catalogue/uploads/I0738_E.pdf.
18 Low-Level Radioactive Waste Management Office, Inventory of Radioactive Waste in Canada 2004 (Ottawa: LLRWMO, 2004). Also available online at http://www.llrwmo.org/en/programs/ongoing/Inventory_Report_2004.pdf
19 WISE Uranium Project, “Radon.” Accessed March 6, 2006 at http://www.wise-uranium.org/rup.html#RN
20 Environment Canada, Priority Substances List Assessment Report. Releases of Radionuclides from Nuclear Facilities (Impact on Non-human Biota).
21 WISE Uranium Project. “Uranium Mill Tailings Deposits.” Accessed at http://www.wise-uranium.org/uwai.html#TAILCHAR
22 WISE Uranium Project. “Uranium Mill Tailings Deposits.” 23 Environment Canada, Priority Substances List Assessment Report.
Releases of Radionuclides from Nuclear Facilities (Impact on Non-human Biota), p.8.
Endnotes

116 The Pembina Institute • Nuclear Power in Canada: An Examination of Risks, Impacts and Sustainability 117Nuclear Power in Canada: An Examination of Risks, Impacts and Sustainability • The Pembina Institute
24 Canadian Environmental Assessment Agency, “Elliot Lake Uranium Mine Tailings Areas: Executive Summary.” Accessed October 24, 2005 at http://www.ceaa-acee.gc.ca/010/0001/0001/0014/0001/summary_e.htm
25 COGEMA Resources Inc., “McClean Lake Project Description: Sue E Project Description.” Accessed September 17, 2005 at http://www.se.gov.sk.ca/environment/assessment/notices/Sue%20E%20Project%20Description%20Rev%202.pdf
26 Natural Resources Industry, “Canada’s Uranium Industry 2004.”
27 Natural Resources Industry, “Canada’s Uranium Industry 2004.”
28 Total volume of these accumulated tailings is estimated at between 142 and 213 million m3, based on a typical dry den-sity of about 1 to 1.5 tonnes/m3.
29 Low Level Radioactive Waste Management Office, Inventory of Radioactive Waste in Canada 2004.
30 International Atomic Energy Agency (IAEA). “Long-Term Stabilisation of Uranium Mill Tailings.” Accessed March 6, 2006 at http://www.iaea.org/programmes/ne/nefw/crp1/CRPL-TStabFinRepV31.pdf
31 IAEA,”Long-Term Stabilisation of Uranium Mill Tailings.” 32 WISE Uranium, “Chronology of Uranium Tailings Dam
Failures.” Accessed at http://www.wise-uranium.org/mdafu.html
33 United Nations Scientific Committee on the Effects of Atomic Radiation (UNSCEAR), Sources and Effects of Ionizing Radiation, Annex C: Exposures to the Public from Man-made Sources of Radiation (New York: Report to the General Assembly, 2000). Accessed October 28, 2005 at http://www.unscear.org/unscear/en/publications/2000_2.html
34 T. Gesell, “Nuclear Fuel Production and Reprocessing.” 35 UNSCEAR, Sources and Effects of Ionizing Radiation.36 R.L. Grasty, A Cross-Canada Outdoor Radon Survey (Winnipeg,
MN: Canadian Radiation Protection Association (CRPA) Conference, 1991).
37 Saskatchewan Environment, Uranium Mining Cumulative Effects Monitoring Program: 2002 Annual Report (Prepared by Canada North Environmental Services, and Zajdlik & Associates, 2003).
38 Environment Canada, Priority Substances List Assessment Report. Releases of Radionuclides from Nuclear Facilities (Impact on Non-human Biota), p.8.
Case study: Fugitive tailings dust at Key Lake Mine1 Cameco. 2004. Key Lake Mine 2004 annual report.2 Thomas, P. 2000. “Radionuclides in the terrestrial ecosys-
tem near a Canadian uranium mill. Part I: Distribution and doses.” Health Physics 78(6):614–624.
3 Thomas, P. 2000. “Radionuclides in the terrestrial ecosys-tem near a Canadian uranium mill. Part I: Distribution and doses.” Health Physics 78(6):614–624.
39 Environment Canada, Priority Substances List Assessment Report. Releases of Radionuclides from Nuclear Facilities (Impact on Non-human Biota), p.1.
40 US Environmental Protection Agency. “Federal Certification Exhaust Emission Standards.” Accessed at http://
www.epa.gov/otaq/cert/veh-cert/b00001a.pdf using Tier 1 values VOC (THC), an average of 15,000 km/year driving, and 1.609 km/mile.
41 Department of Justice Canada, Canadian Environmental Protection Act, Schedule 1.
42 Environment Canada, “NPRI.”43 Cameco Corporation, Rabbit Lake Mine Annual Report, 2004,
using Air Quality data found in Section 4 on page 4-1 for sulphur dioxide air-stack monitoring.
44 Environment Canada, “National Pollutant Release Inventory (NPRI), 2005.” Accessed at http://www.ec.gc.ca/pdb/npri/npri_online_data_e.cfm
45 US Environmental Protection Agency. “Federal Certification Exhaust Emission Standards.”
46 Environment Canada, “NPRI.”47 US Environmental Protection Agency, “Federal Certification
Exhaust Emission Standards.” 48 IPCC, “Climate Change 2001: Working Group I: The
Scientific Basis” http://www.grida.no/climate/ipcc_tar/wg1/007.htm
49 J. Andseta et al., CANDU Reactors and Greenhouse Gas Emissions. 50 J. Andseta et al., CANDU Reactors and Greenhouse Gas Emissions. 51 Cameco Corporation, “McArthur River Fact Sheet.” Accessed
March 29, 2006 at http://www.cameco.com/operations/uranium/mcarthur_river/fact.php
52 CO2 calculation based on 10,455 tonnes of uranium mined in Canada 2003. Natural Resources Canada, “Canada’s Uranium Industry – 2004.” Accessed Jan 26, 2006 at http://www2.nrcan.gc.ca/es/erb/erb/english/View.asp?x=454&oid=967
53 CO2 calculation based on 250 kilotonnes CO2 and 233 g CO2 emissions/km. Natural Resources Canada, Energy Use Data Handbook, 1990 and 1995 to 2001 (Gatineau, PQ: Office of Energy Efficiency, Natural Resources Canada, ), p.103 and 107.
54 See Wise Uranium Project “Nuclear Fuel Production” slides 32 and 33 accessed September 14, 2006 at http://www.wise-uranium.org/stk.html?src=stkd02e.
55 Environment Canada, Priority Substances List Assessment Report. Releases of Radionuclides from Nuclear Facilities (Impact on Non-human Biota), p.2.
Case Study: Groundwater Quality Impacts at Cluff
Lake Mine 1 Low Level Radioactive Waste Management Office. 2004.
Inventory of radioactive waste in Canada 2004. Ottawa.2 Canadian Nuclear Safety Commission. 2003. Comprehensive
study report: Cluff Lake Decommissioning Project. http://www.ceaa-acee.gc.ca/010/0003/0019/report_e.htm (accessed October 25, 2005).
56 Inter-Church Uranium Committee Educational Co-opera-tive. “Court Case Update.” Accessed November 14, 2005 at http://www.icucec.org/index.html
57 M. Lyons, “Panel to Hear Mine Appeal,” The Star Phoenix (Saskatoon), December 3, 2003.
58 L. Murphy, ICUCEC, Case summary in an e-mail to the Canadian Environmental Network Environmental Assessment and Planning Caucus, April 15, 2005.
Endnotes
118 The Pembina Institute • Nuclear Power in Canada: An Examination of Risks, Impacts and Sustainability 119Nuclear Power in Canada: An Examination of Risks, Impacts and Sustainability • The Pembina Institute
59 Environment data found in Table 7.4.3 for Mass Loading. Cameco Corporation, McArthur River Operation Annual Report, 2004.
60 Environment data found in Table 5.2.2. 7.4.3 for Mass Loading. Cameco Corporation, Rabbit Lake Operation Annual Report, 2004.
61 Cameco Corporation, Key Lake Operation Annual Report, 2004. These figures may underestimate total loadings, as they do not include all discharges for mine, waste rock and tailings areas.
62 Cogema Inc., 2006, 2005. “McClean Lake Annual Environmental Reports,” tables A38(a) and A.46(a). The cumulative mass loadings for 2005 were calculated from the JEB WTP mill data (Table A.38a) and the SUE WTP effluent data (Table A.46a). The data was calculated as a sum of both JEB WTP and SUE WTP effluents to the sink reservoir. The JEB and SUE loading data was calculated as the concentra-tion composite samples multiplied by the volume (m^3) for each month respectively. The monthly totals were then summed to get the total mass loading for the 2005 year.
63 Department of Justice Canada, Canadian Environmental Protection Act, 1999 Schedule 1.
64 Environment Canada, “NPRI.” 65 G.G. Pyle, “Toxicity of Uranium Mine-Receiving Waters
to Caged Fathead Minnows, Pimephales promelas,” Ecotoxicology and Environmental Safety 48 (2001), pp.202–214.
66 J.F. Klaverkamp, C.L. Baron, B.W. Fallis, C.R. Ranson, K.G. Wautier, and P. Vanriel. “Metals and Metallothionein in Fishes and Metals in Sediments from Lakes Impacted by Uranium Mining and Milling in Northern Saskatchewan,” Canadian Technical Report of Fisheries and Aquatic Sciences 2420, no. 72 (2002). Accessed at http://www.dfo-mpo.gc.ca/Library/267553.pdf
67 Environment Canada, Priority Substances List Assessment Report. Releases of Radionuclides from Nuclear Facilities (Impact on Non-human Biota), p.1.
68 Environment Canada, Priority Substances List Assessment Report. Releases of Radionuclides from Nuclear Facilities (Impact on Non-human Biota).
69 D. Janz University of Saskatchewan, Biomedical Sciences, Veterinary Medicine), personal communication, November 23, 2003.
Case Study: Surface Water Contamination at Cluff Lake Mine
1 Canadian Nuclear Safety Commission, 2003. Comprehensive study report: Cluff Lake Decommissioning Project. http://www.ceaa-acee.gc.ca/010/0003/0019/report_e.htm (accessed October 25, 2005).
2 Frost, S. 1998. “Waste management in the uranium min-ing industry.” Paper presented at the Uranium Institute: 23rd Annual International Symposium. http://www.world-nuclear.org/sym/1998/frost.htm (accessed November 16, 2005).
70 CNSC, Record of Proceedings, Including Reasons for Decision In the Matter of Cameco Corporation: Application for the Renewal of the Mining Operating Licence for the Rabbit Lake Operation (October 24, 2003), pp.6–10. Accessed March 1, 2006 at http:
//www.nuclearsafety.gc.ca/eng/commission/pdf/Cameco-RabbitLake-Renewal-e.pdf
71 CNSC, Record of Proceedings, Including Reasons for Decision In the Matter of Cameco Corporation: Application for the Renewal of the Mining Operating Licence for the Rabbit Lake Operation, pp.6–10.
72 CNSC, Record of Proceedings, Including Reasons for Decision In the Matter of Cameco Corporation: Application for the Renewal of the Mining Operating Licence for the Rabbit Lake Operation, pp.6–10.
73 Pyle, “Toxicity of Uranium Mine-Receiving Waters to Caged Fathead Minnows, Pimephales promelas.”
74 Klaverkamp et al., “Metals and Metallothionein in Fishes and Metals in Sediments from Lakes Impacted by Uranium Mining and Milling in Northern Saskatchewan.”
75 Based on City of Toronto daily water consumption of 1.24 million m3/day. http://www.toronto.ca/watereff/home.htm
76 Cameco Corporation, Rabbit Lake Mine Annual Report, 2004.77 Cameco, Key Lake Operation Annual Report 2004, Table 4.37.78 http://www.nuclearsafety.gc.ca/eng/commission/pdf/trans-
04-H17-Day2.pdf 79 LLRWMO, Inventory of Radioactive Waste in Canada 2004. 80 Carol Rowlett (Mining Development Officer with Resource
and Industry Development, Saskatchewan Northern Affairs), e-mail communication, December 7, 2005.
81 M. Firth, J. Brophy, and M. Keith, Workplace Roulette: Gambling With Cancer (Toronto: Between the Lines, 1997), p.33.
82 Uranium Information Centre, “Occupational Safety in Uranium Mining,” Nuclear Issues Briefing Paper 6 (Melbourne, AU: Uranium Information Centre, 2006). Accessed January 4, 2006 at www.uic.com.au/nip06.htm
83 CNSC, “Backgrounder: Health Studies for Saskatchewan Uranium Miners,” news release, June 22, 2004. Accessed November 22, 2005 at http://www.cnsc-ccsn.gc.ca/eng/media/news/news_release.cfm?news_release_id=98
84 National Research Council, Health Effects of Exposure to Radon: BEIR VI. (Washington: Committee on Health Risks of Exposure to Radon (BEIR VI), Board on Radiation Effects Research, Commission on Life Sciences, National Academy Press, 1999).
85 Cameco Corporation, Rabbit Lake Mine Annual Report, 2003.86 Cameco Corporation, Rabbit Lake Mine Annual Report, 2002. 87 Avera, McClean Lake Annual Report, 2004. 88 The Rabbit Lake mill ran in full production mode for the last
four months of 2002, after a year of care and maintenance shutdown during which 36 staff were employed. The under-ground mine started preparation work in April, and was fully staffed by July. The operation was fully staffed (i.e. 326 per-sons ) by December.
89 Committee to Assess Health Risks from Exposure to Low Levels of Ionizing Radiation, National Research Council, Health Risks From Exposure to Low Levels of Ionizing Radiation: BEIR VII Phase 2 (Washington, DC: The National Academies Press, 2006).
90 Committee to Assess Health Risks from Exposure to Low Levels of Ionizing Radiation, National Research Council, Health Risks From Exposure to Low Levels of Ionizing Radiation: BEIR VII Phase 2.
91 C. Stephens and M. Ahern, Worker and Community Health Impacts Related to Mining Operations Internationally: A Rapid
Endnotes
118 The Pembina Institute • Nuclear Power in Canada: An Examination of Risks, Impacts and Sustainability 119Nuclear Power in Canada: An Examination of Risks, Impacts and Sustainability • The Pembina Institute
Review of the Literature (London: London School of Hygiene and Tropical Medicine, 2001). Accessed February 16, 2006 at http://www.iied.org/mmsd/mmsd_pdfs/worker_commu-nity_health_impacts_literature_review.pdf
92 Ontario Workplace Safety and Insurance Board (Medical and Occupational Disease Policy Branch), e-mail communication, January 31, 2006 and February 20, 2006.
93 P. Robinson, “More than Radon in the Uranium Dust.” Statement in Support of Testimony at US House of Representatives Judiciary Committee Subcommittee on Immigration and Claims Hearing on Uranium Workers Health Effects and Radiation Exposure Compensation Act Amendments. Accessed February 20, 2006 at http://www.sric.org/mining/docs/RECA.html
94 Ontario Workplace Safety and Insurance Board (Medical and Occupational Disease Policy Branch), e-mail communica-tion, .
95 Cameco Corporation, Sustainable? Cameco Sustainable Development Report. (Saskatoon, SK: Cameco Corporation, 2005). Accessed October 31, 2005 at http://www.cameco.com/sustainability/reports/2005/common/pdfs/01-full.pdf
96 J. Langen Work Injury Statistics for Uranium Industry, Saskatchewan Workers Compensation Board), personal com-munication, 2005
97 A radionuclide is an atom with an unstable nucleus, so it undergoes radioactive decay by emitting gamma rays and/or subatomic particles. Uranium is an example of a naturally occurring radionuclide, while other radionuclides can be arti-ficially produced in nuclear reactors.
98 S. Christiansen Health Cumulative Affects Scientific Committee, Saskatchewan Health), personal communica-tion, 2005.
99 P. Thomas et al., “Radionuclides and Trace Metals in Canadian Moose Near Uranium Mines: Comparison of Radiation Doses and Food Chain Transfer with Cattle and Caribou,” Health Physics 88, no. 5 (2005), pp.423–438.
100 P. Thomas and T. Gates, “Radionuclides in the Lichen–Caribou–Human Food Chain near Uranium Mining Operations in Northern Saskatchewan, Canada,” Environmental Health Perspectives 107 (1999), pp.527–537.
101 Thomas and Gates, “Radionuclides in the Lichen–Caribou– Human Food Chain near Uranium Mining Operations in Northern Saskatchewan, Canada.”
102 U.S. Environmental Protection Agency, Role of the Baseline Risk Assessment in Superfund Remedy Selection Decisions. Memorandum from Assistant Administrator Don R. Clay to the Regions. OSWER Directive 9355.0-30. (Washington, D.C.: Office of Solid Waste and Emergency Response, April 22, 1991).
103 Committee Examining Radiation Risks of Internal Emitters, Report of the Committee Examining Radiation Risks of Internal Emitters (CERRIE) (London: CERRIE, 2004). Accessed October 26, 2005 at http://www.cerrie.org/pdfs/ cerrie_report_e-book.pdf
104 CNSC, Regulatory Guide G-219: Decommissioning Planning For Licensed Activities (Ottawa: CNSC, June 2000). Accessed October 24, 2005 at http://www.nuclearsafety.gc.ca/pubs_ catalogue/uploads/G219_e.pdf
105 LLRWMO, Inventory of Radioactive Waste in Canada 2004.
106 C. Natomagan CNSC), “Monitoring Requirements at Decommissioned Uranium Mines,” personal communication, 2005.
107 Auditor General of Canada, “Federal Radioactive Waste Management,” 1995 Report to the House of Commons, paragraph 3.131.
108 Clifton Associates Ltd., An Assessment of Abandoned Mines in Northern Saskatchewan. Prepared for Saskatchewan Environment (Regina, SK: Clifton Associates, May 2003).
109 Saskatchewan Environment, Assessing Northern Abandoned Mines (Regina, SK: Saskatchewan Environment, 2001). Accessed Jan 1, 2006 at http://www.se.gov.sk.ca/media/ Saskatchewan%20Environmentnewsreleases/ Abandoned-Mines.htm
110 Saskatchewan Environment, Assessing Northern Abandoned Mines.
111 Saskatchewan Environment, Assessing Northern Abandoned Mines.
112 Auditor General of Canada, “Federal Radioactive Waste Management,” 1995 Report to the House of Commons, paragraph 3.129.
113 Government of Saskatchewan, “Saskatchewan Welcomes Federal Commitment on Mine Sites Clean-Up,” news release, June 17, 2005. Accessed October 26, 2005 at http: //www.gov.sk.ca/newsrel/releases/2005/06/17-575.html
114 CNSC, Regulatory Guide G-219: Decommissioning Planning For Licensed Activities.
115 Institutional Control Working Group, Post Closure Institutional Control Management of Decommissioned Mine/Mill Properties Located on Crown Land: Background Paper (Regina, SK: Government of Saskatchewan, 2005). Accessed March 2, 2006 at http://www.se.gov.sk.ca/environment/protection/ land/ICMF%20-%20Backgound_paper.pdf
116 CNSC, Regulatory Guide G-219: Decommissioning Planning for Licensed Activities.
117 CNSC, Regulatory Guide G-206: Financial Guarantees For the Decommissioning of Licensed Activities (Ottawa: CNSC, June 2000). Accessed March 2, 2006 at http: //www.nuclearsafety.gc.ca/pubs_catalogue/uploads/G206_ e.pdf
118 G. Parsons and R. Barsi, “Uranium Mining in Northern Saskatchewan: A Public-Private Transition (Part 1)” in G. McMahon and F. Remy (Eds.), Large Mines and the Community: Socioeconomic and Environmental Effects in Latin America, Canada, and Spain (Ottawa: IRDC/World Bank, 2001). Accessed March 3, 2006 at http://www.idrc.ca/en/ ev-28036-201-1-DO_TOPIC.html
119 Jamie Kneen , MiningWatch Canada), personal communication, July 18, 2006.
3. Phase II: Fuel Processing and Production1 CNSC, Interim Licensing Report: Cameco Corporation’s Class 1B
Nuclear Facility in Blind River, Ontario, (CMD 05-H6.1, January 24, 2005).
2 CNSC, Interim Licencing Report on Cameco Corporation’s Class 1B Nuclear Facility in Port Hope, Ontario (CMD-05-H5, February 23, 2005). Accessed February 6, 2006 at http://www.cameco.com/regulatory_initiatives/pdfs/PH_CMD.pdf
Endnotes

120 The Pembina Institute • Nuclear Power in Canada: An Examination of Risks, Impacts and Sustainability 121Nuclear Power in Canada: An Examination of Risks, Impacts and Sustainability • The Pembina Institute
3 CNSC, 2004. “Processing and Fuel Fabrication Facilities.” Accessed June 20, 2005 at http://www.nuclearsafety.gc.ca/eng/about_us/regulate/processing_fuel_fabrication.cfm
4 M. Scallen, CNSC, Communications and Regulatory Affairs Division, Office of Communication and Regulatory Affairs), personal communication, 2005.
5 P. Brethour, “Calvert Seeking Uranium refinery: Saskatchewan Premier in France to Lobby Officials to Build Local Facility,” The Globe and Mail, June 23, 2006.
6 Natural Resources Canada, Canadian Uranium Industry – 2004. Accessed at www2.nrcan/gc/ca/es/erb/erb/English/view.asp?x454&oid=967.
7 Zircatec’s Cobourg operation supplies the zirconium tubing required for fuel bundle fabrication at the Port Hope fabrica-tion facility.
8 LLRWMO, Inventory of Radioactive Waste in Canada 2004.9 IAEA. Minimization of Waste from Uranium Purification,
Enrichment and Fuel Fabrication. IAEA-TECDOC-1115 (Vienna: IAEA, 1999). Accessed November 28, 2005 at http://www-pub.iaea.org/MTCD/publications/PDF/te_1115_prn.pdf
10 Natural Resources Canada, Canada’s Uranium Industry – 2004.11 NPRI data search, July 18, 2006. Accessed at http://
www.ec.gc.ca/pdb/npri/npri_online_data_e.cfm 12 Cameco Corporation, 1999. Port Hope – Renewal of Fuel Facility
Operating Licence. AECB BMD 99-123, AECB-FFOL-225-4, 1999-09-21.
13 WISE Uranium. “Uranium Enrichment and Fuel Fabrication – Current Issues (Canada).” Accessed at http://www.wise-uranium.org/epcdn.html
14 Port Hope Community Health Concerns Committee. “A History of Contamination.” Accessed at http://www.porthopehealthconcerns.com/history_contamination.htm
15 Environment Canada, “Remedial Action Plans: Port Hope Harbour Area of Concern.” Accessed October 20, 2005 at http://www.on.ec.gc.ca/water/raps/porthope/intro_e.html
16 WISE- Uranium Project, “Slide Talk: Nuclear Fuel Production” accessed at http://www.wise-uranium.org/stk.html?src=stkd02e, September 20, 2006.
17 Cameco Corporation, Ecological Risk Assessment and Environmental Effects Monitoring for Cameco Facility: Blind River, (Richmond Hill, ON: SENES Consultants for Cameco Corporation, 2004).
18 Cameco Corporation, Ecological Risk Assessment and Environmental Effects Monitoring for Cameco Facility: Blind River.
19 Cameco Corporation, Quarterly Environmental Compliance Report – Port Hope Facility.
20 Zircatec Precision Industries, 2003 Annual Health Physics Compliance Report.
21 Zircatec Precision Industries, Annual Compliance Report 2004. 22 Zircatec Precision Industries, Annual Compliance Report 2002.23 Zircatec Precision Industries, Annual Compliance Report 2001. 24 CNSC, Interim Licensing Report on Cameco Corporation’s Class 1B
Nuclear Facility in Port Hope, Ontario.25 Environment Canada, Priority Substances List Assessment Report.
Releases of Radionuclides from Nuclear Facilities (Impact on Non-human Biota), p.2.
26 Environment Canada. Priority Substances List Assessment Report. Releases of Radionuclides from Nuclear Facilities (Impact on Non-human Biota), p.10.
27 IARC,Overall Evaluations of Carcinogenicity. IARC Monographs on the Evaluation of Carcinogenic Risk of Chemicals to Humans, Supplement 7, p. 440.
28 Canadian Environmental Protection Act, 1999, Schedule 1. 29 The largest source of hexachlorobenzene releases in Canada
reported releases of 2,800 grams in 2003. NPRI data search March 30, 2006.
30 Department of Justice Canada, Canadian Environmental Protection Act, 1999, Schedule 1.
31 The largest source of dioxin and furan releases in Canada reported releases of 8 grams TEQ in 2003. NPRI data search March 30, 2006.
32 NPRI, 2004, 2003, 2002. Data obtained from on-line data search. Accessed at http://www.ec.gc.ca/pdb/npri/npri_online_data_e.cfm
33 Note that g TEQ refers to grams of Toxic Equivalents—a weighted value determined by substance toxicity (also known as toxic equivalency factor). The total g TEQ released in Ontario in 2004 was 17.2 g.
34 Department of Justice Canada, Canadian Environmental Protection Act, 1999, Schedule 1.
35 NPRI, 2004, 2003, 2002. Data obtained from on-line data search. Accessed at http://www.ec.gc.ca/pdb/npri/npri_online_data_e.cfm
36 Cameco Corporation, Ecological Risk Assessment and Environmental Effects Monitoring for Cameco Facility: Blind River.
37 The largest source of hydrogen flouride releases in Canada reported releases of 449 tonnes in 2003. NPRI data search March 30, 2006.
38 NPRI, 2005. Data obtained from on-line data search. Accessed at http://www.ec.gc.ca/pdb/npri/npri_online_data_e.cfm
39 US Environmental Protection Agency, “Emission Facts: Average In-Use Emissions from Heavy-Duty Trucks.”
40 Environment Canada. “Atmospheric Science: Acid Rain FAQ.” Accessed February 14, 2006 at http://www.atl.ec.gc.ca/msc/as/acidfaq.html
41 J. Andseta et al., CANDU Reactors and Greenhouse Gas Emissions. 42 J. Andseta et al., CANDU Reactors and Greenhouse Gas Emissions.43 J. Andseta et al., CANDU Reactors and Greenhouse Gas Emissions.44 Electricity emissions are based on the 2002 Ontario grid
emissions intensity factor of 258 g CO2 eq/kWh, from Environment Canada, Canada’s Greenhouse Gas Inventory: 1990–2002 (Ottawa: Environment Canada, Greenhouse Gas Division, 2004). Natural gas emissions intensity of 1,920 kg CO2 per 1000 m3 combusted NG to produce heat are taken from U.S. EPA, “External Combustion Sources,” in AP-42 Environmental Inventory Database (5th edition) (Research Triangle Park, NC: US EPA, 1995).
45 Natural Resources Canada, Canadian Uranium Industry – 2004.46 See Wise Uranium Project “Nuclear Fuel Production” slides
32 and 33 accessed September 6, 2006 at http://www.wise-uranium.org/stk.html?src=stkd02e for an estimate of CO2 emissions associated with uranium enrichment, based on an assumption of energy consumption of 2300-2500KWh/SWU (separative work unit).
47 Based on the assumption that each load contains 43 drums, weighing 400 kg when full. Cameco Corporation, “Nuclear Fuel Cycle.” Accessed February 6, 2006 at http://
Endnotes
120 The Pembina Institute • Nuclear Power in Canada: An Examination of Risks, Impacts and Sustainability 121Nuclear Power in Canada: An Examination of Risks, Impacts and Sustainability • The Pembina Institute
www.cameco.com/uranium_101/uranium_science/nuclear_fuel/ A full drum contains approximately 235 kg uranium. Iraq Watch, “Note by the Secretary General,” November 14, 1991. Accessed February 6, 2006 at www.iraqwatch.org/un/IAEA/s-23215.htm
48 Greenhouse gas emissions from truck transport are based on 2,757 g CO2eq/L, from Environment Canada, Canada’s Greenhouse Gas Inventory: 1990–2002 (Ottawa: Environment Canada, Greenhouse Gas Division, 2004); 233 g CO2 emissions/km, from Natural Resources Canada, Energy Use Data Handbook, 1990 and 1995 to 2001 (Ottawa: Natural Resources Canada, 20030; 2.65 km/L fuel efficiency, pers comm. from Diamond International, Edmonton, Alberta, 1999. (Large general transport company). Emissions based on a return trip with empty drums.
49 US Environmental Protection Agency, “Emission Facts: Average In-Use Emissions from Heavy-Duty Trucks.”
50 US Environmental Protection Agency, “Emission Facts: Average In-Use Emissions from Heavy-Duty Trucks.”
51 IAEA, “Minimization of Waste from Uranium Purification, Enrichment and Fuel Fabrication.”
52 Cameco Corporation, Cameco Corporation’s SEU Blending Project: Environmental Assessment Study Report: Volumes 1 and 2. Final Report (Saskatoon, SK: Cameco Corporation, 2004).
53 Environment Canada. Priority Substances List Assessment Report. Releases of Radionuclides from Nuclear Facilities (Impact on Non-human Biota), p.10.
54 Cameco Corporation, Quarterly Environmental Compliance Report – Port Hope Facility.
55 Zircatec Precision Industries, 2003 Annual Health Physics Compliance Report.
56 Zircatec Precision Industries, Annual Compliance Report 2004.57 Zircatec Precision Industries, Annual Compliance Report 2002.58 Zircatec Precision Industries, Annual Compliance Report 2001.59 Environment Canada. Priority Substances List Assessment Report.
Releases of Radionuclides from Nuclear Facilities (Impact on Non-human Biota), p.2.
60 DEFRA, Ammonia in the UK.61 Department of Justice Canada, Canadian Environmental
Protection Act, 1999, Schedule 1. 62 NPRI data search March 30, 2006.63 Environment Canada, “Clean Water – Life Depends on It!”64 Wilkes University. “Nitrates and Nitrites in Drinking
Water.” Accessed February 21, 2006 at http://www.water-research.net/nitrate.htm#health
65 NPRI data search March 30, 2006.66 NPRI, 2004, 2003, 2002. Data obtained from on-line data
search. Accessed at http://www.ec.gc.ca/pdb/npri/npri_online_data_e.cfm
67 Environment Canada. “Canadian Water Quality Guideline – Phosphorus.” Accessed February 21, 2006 at http://www.ec.gc.ca/ceqg-rcqe/English/Html/GAAG_Phosphorus_WQG.cfm
68 NPRI data search March 30, 2006.69 Rhonda Stang, Cameco Corporation, Land Use
Requirements), personal communication, February 14, 2006. 70 CNSC, Interim Licensing Report: Cameco Corporation’s Class 1B
Nuclear Facility in Blind River, Ontario.
71 Department of Justice Canada, Nuclear Safety and Control Act, 1997. Accessed November 15, 2005 at http://laws.justice.gc.ca/en/n-28.3/88752.html
72 Cameco Corporation, Blind River Refinery Annual Compliance Report 2003 (Saskatoon, SK: Cameco Corporation, 2004).
73 Cameco Corporation, Blind River Refinery Annual Compliance Report 2002 (Saskatoon, SK: Cameco Corporation, 2003).
74 Cameco Corporation, Blind River Refinery Fourth Quarter Report 2001 (Saskatoon, SK: Cameco Corporation, 2002).
75 Cameco Corporation, 2002 Annual Operational Compliance Report for the Port Hope Facility (Saskatoon, SK: Cameco Corporation, 2003).
76 Production at the Zircatec facility in Port Hope consists of both fabrication and bundling of the pellets. Doses for this facility represent an average of the two activities.
77 Zircatec Precision Industries, Inc. Annual Compliance Report, 2003. PH7-8228.04 (Port Hope, ON: Zircatec Precision Industries, 2004).
78 GE Canada, General Electric Canada Incorporated Nuclear Fuel Fabrication Facilities Toronto / Peterborough, Ontario: Nuclear Products 2001 Annual Compliance Report. ACR2001 (Mississauga, ON: GE Canada, 2001).
79 GE Canada, General Electric Canada Incorporated Nuclear Fuel Fabrication Facilities Toronto and Peterborough, Ontario: Nuclear Products 2003 Annual Compliance Report. ACR2003 (Mississauga, ON: GE Canada, 2003).
80 GE Canada, General Electric Canada Incorporated Nuclear Fuel Fabrication Facilities Toronto and Peterborough, Ontario: Nuclear Products 2003 Annual Compliance Report. ACR2003 (Mississauga, ON: GE Canada, 2003).
81 Ontario Workplace Safety and Insurance Board (Medical and Occupational Disease Policy Branch), e-mail communication, January 31, 2006 and February 20, 2006.
82 Health Canada, “Assessment and Management of Cancer Risks from Radiological and Chemical Hazards.” Accessed November 11, 2005 at http://www.hc-sc.gc.ca/ewh-semt/pubs/radiation/98ehd-dhm216/management-gestion_e.html
83 Ontario Power Generation states that the average Canadian receives about 1,770 microsieverts of radiation dose from natural sources such as radon gas decay products and cosmic radiation entering the Earth’s atmosphere and approxi-mately 70 microsieverts from human-made sources includ-ing residual fallout from past nuclear weapons testing and use of radiation sources in industrial processes. Ontario Power Generation, “Annual Summary and Assessment of Environmental Radiological Data.” Accessed at http://www.opg.com/ops/remp.asp#public.
84 AECB BMD 99-123, September 21, 1999.85 WISE Uranium, “Uranium Enrichment and Fuel Fabrication
– Current Issues (Canada).”86 Environment Canada. Priority Substances List Assessment Report.
Releases of Radionuclides from Nuclear Facilities (Impact on Non-human Biota), p.2.
87 CNSC, Record of Proceedings, Including Reasons for Decision in the Matter of Cameco Corporation: Application for the Renewal of the Mining Operating License for the Rabbit Lake Operation.
88 Environment Canada, “Remedial Action Plans: Port Hope Harbour Area of Concern.” Accessed October 20, 2005 at http://www.on.ec.gc.ca/water/raps/porthope/intro_e.html
Endnotes
122 The Pembina Institute • Nuclear Power in Canada: An Examination of Risks, Impacts and Sustainability 123Nuclear Power in Canada: An Examination of Risks, Impacts and Sustainability • The Pembina Institute
89 Port Hope Community Health Concerns Committee, “A History of Contamination.” Accessed at http://www.porthopehealthconcerns.com/history_contamination.htm
90 AECB BMD 00-29, February 1, 2000.91 AECB BMD 99-123, September 21, 1999.92 LLRWMO, Environmental Assessment Study Report: Executive
Summary (Revision 0). The Port Hope Long-Term Low-Level Radioactive Waste Management Project (Port Hope, ON: LLRWMO, March 2005, Draft). Accessed October 20, 2005 at http://www.llrwmo.org/en/pdf/Executive%20Summarys/EASR%20PH%20Executive%20summary-ENGLISH1.pdf
93 CNSC, “Port Hope Cancer Incidence Study Released.” Accessed October 20, 2005 at http://www.nuclearsafety.gc.ca/eng/media/news/002208.cfm
94 See the Port Hope Community Health Concerns Committee, http://www.porthopehealthconcerns.com/
95 CNSC, Regulatory Guide G-219: Decommissioning Planning for Licensed Activities.
96 CNSC, Interim Licensing Report: Cameco Corporation Port Hope Nuclear Fuel Facility.
97 CNSC, Record of Proceedings, Including Reasons for Decision in the Matter of Cameco Corporation for the Application for a Licence to Operate the Blind River Nuclear Fuel Facility (February 18, 2002). Accessed at http://www.nuclearsafety.gc.ca/eng/commission/pdf/BlindRiver3-e.pdf
98 CNSC, Record of Proceedings in the matter of Zircatec Precision Industries Inc. on the Mid-term Performance Report on the Operation of the Port Hope Fuel Fabrication Facility (May 18, 2005). Accessed at http://www.nuclearsafety.gc.ca/eng/commission/pdf/RecordofProceedings-Zircatec-Feb23-e.pdf
99 CNSC, Record of Proceedings, Including Reasons for Decision In the Matter of Cameco Corporation for the Application for a Licence to Operate the Blind River Nuclear Fuel Facility (February 18, 2002), p.17.
100 US Environmental Protection Agency, Emissions Standards Reference Guide for Heavy-Duty and Nonroad Engines. (Washington, DC: US EPA, 1997). Accessed at http:// www.epa.gov/otaq/cert/hd-cert/stds-eng.pdf A trip length of 4,000 km, 608 trips per year, fuel density of 845 g/L, and a fuel efficiency of 6.25 miles/US gal were obtained through internal Pembina Institute documents.
101 US Environmental Protection Agency, “Federal Certification Exhaust Emission Standards.”
4. Phase III: Power Plant Operation)1 P. Gierszawski ( Ontario Power Generation), “Fuel Burn-up,”
personal communication, 2005. 2 AECL. “Nuclear Energy.” Accessed October 26, 2005 at http:
//www.aecl.ca/images/up-FS_EnergyEfficiency.pdf 3 Royal Commission on Electric Power Planning, Interim Report
on Nuclear Power in Ontario (Toronto: Queen’s Printer for Ontario, 1978).
4 NWMO, Choosing a Way Forward: The Future of Canada’s Used Nuclear Fuel. Draft Study Report. (Toronto: NWMO, 2005). Accessed January 26, 2006 at http://www.nwmo.ca/adx/asp/adxGetMedia.asp?DocID=1224,1026,20,1,Documents&MediaID=2341&Filename=NWMO_DSR_E.pdf
5 Centre for Energy, “Nuclear Fuel Waste.” Accessed January 26, 2006 at http://www.centreforenergy.com/silos/nuclear/nuclearEnvironment/generatingNuclearEnvWastes04.asp
6 NWMO, “Fact Sheet: Nuclear Fuel Waste in Canada.” Accessed October 27, 2005 at http://www.nwmo.ca/adx/asp/adxGetMedia.asp?DocID=177,20,1,Documents&MediaID=406&Filename=Fact_Sheet_2_Waste.pdf
7 LLRWMO, Inventory of Radioactive Waste in Canada 2004.8 NWMO. “Fact Sheet: Nuclear Fuel Waste in Canada.”9 NWMO. “Fact Sheet: Nuclear Fuel Waste in Canada.”10 IAEA, “Managing Radioactive Waste.” Accessed March
29, 2006 at http://www.iaea.org/Publications/Factsheets/English/manradwa.html
11 CNSC, “Environmental Assessment: Ontario Power Generation – Proposal to Construct and Operate a Deep Geologic Repository for Disposal of Low and Intermediate Radioactive Waste.”
12 CNSC, “Environmental Assessment: Ontario Power Generation – Proposal to Construct and Operate a Deep Geologic Repository for Disposal of Low and Intermediate Radioactive Waste.”
13 LLRWMO, Inventory of Radioactive Waste in Canada 2004. 14 Ontario Power Generation, “Response to access to informa-
tion request 060019” August 28, 2006.15 Conor Pacific Environmental Technologies Inc., A Final
Report for Airborn Emission Characterization Study of the Waste Management Division Radioactive Waste Incinerator (Toronto: Prepared for Ontario Hydro, February 1999), Table 8-1. Obtained via Access to Information request to OPG.
16 Ontario Power Generation, Response to Access to Information Request 060019, August 28, 2006.
17 Ontario Power Generation, Response to Access to Information Request 060019, August 28, 2006, Releases of tritium totaled 1.38 x 10¹³ Bq in 1995 and 4.97 x 10¹³ Bq in 2005. Releases of carbon 14 were 9.95 x 10 8 Bq in 1999 and 4.56 x 10⁸ Bq in 2005.
18 Ontario Power Generation, “Long-Term Management of Low and Intermediate Level Radioactive Waste.” Accessed at http://www.opg.com/dgr/nwasteias2.asp
19 G. Edwards, Submission to the CNSC Re: Scoping Document for Environmental Assessment of the Proposal by Ontario Power Generation for a Deep Geologic Repository for Low- and Intermediate-Level Radioactive Waste (Montreal: Canadian Coalition for Nuclear Responsibility, July 2006).
20 M. Garamszeghy ( Ontario Power Generation, Nuclear Waste Management Division), “Low and Intermediate Level Waste Generated by Ontario Nuclear Power Plants, 1999–2003,” personal communication, 2005.
21 See generally, Greenpeace Canada, “Petition Pursuant to Section 22 of the Auditor General Act Regarding Federal Oversight of the Nuclear Industry in Canada,” filed June 15, 2005.
22 Department of Justice Canada, Canadian Environmental Protection Act, 1999 Schedule 1.
23 NPRI, 2004, 2003, 2002. Data obtained from on-line data search. Accessed at http://www.ec.gc.ca/pdb/npri/npri_online_data_e.cfm
24 Query run through the Commission for Environmental Cooperation’s “Taking Stock Query Builder,” March 21, 2006.
25 Personal communication on NPRI substances, Bruce Power Ltd. , October 2005.
Endnotes
122 The Pembina Institute • Nuclear Power in Canada: An Examination of Risks, Impacts and Sustainability 123Nuclear Power in Canada: An Examination of Risks, Impacts and Sustainability • The Pembina Institute
26 NPRI, 2004, 2003, 2002. Data obtained from on-line data search. Accessed at http://www.ec.gc.ca/pdb/npri/npri_online_data_e.cfm
27 Personal communication, Bruce Power Ltd., October 2005. 28 NPRI, 2004, 2003, 2002. Data obtained from on-line data
search. Accessed at http://www.ec.gc.ca/pdb/npri/npri_online_data_e.cfm
29 Personal communication, Bruce Power Ltd., October 2005. 30 NPRI, 2004, 2003, 2002. Data obtained from on-line data
search. Accessed at http://www.ec.gc.ca/pdb/npri/npri_online_data_e.cfm
31 Personal communication, Bruce Power Ltd., October 2005. 32 Query run through Commission for Environmental
Cooperation’s “Taking Stock Query Builder,” March 21, 2006.
33 CNSC, Radioactive Release Data from Nuclear Generating Stations 1994–2003, INFO-0210 (Revision 12) (Ottawa: CNSC, January 2005). Accessed February 27, 2006 at http://www.nuclearsafety.gc.ca/pubs_catalogue/uploads/I0210r12_e.pdf
34 CNSC, Radioactive Release Data from Nuclear Generating Stations 1994–2003, INFO-0210 (Revision 12).
35 CNSC, Radioactive Release Data from Nuclear Generating Stations 1994–2003, INFO-0210 (Revision 12).
36 CNSC, Radioactive Release Data from Nuclear Generating Stations 1994–2003, INFO-0210 (Revision 12).
37 CNSC, Radioactive Release Data from Nuclear Generating Stations 1994–2003, INFO-0210 (Revision 12).
38 CNSC, Radioactive Release Data from Nuclear Generating Stations 1994–2003, INFO-0210 (Revision 12).
39 CNSC, Radioactive Release Data from Nuclear Generating Stations 1994–2003, INFO-0210 (Revision 12).
40 NPRI, 2004, 2003, 2002. Data obtained from on-line data search. Accessed at http://www.ec.gc.ca/pdb/npri/npri_online_data_e.cfm.
41 Personal communication, Bruce Power, Ltd. October 2005. 42 B. Lionel, (OPG), “Sources of NPRI Releases from OPG’s
Nuclear Generation Stations,” personal communication, 2005.
43 F. Bajourney(OPG). “Sources of Pollutant Releases from Pickering Station as Reported in NPRI.” Personal communi-cation.
44 Personal communication, Bruce Power Ltd., October 2005. 45 Personal communication, Bruce Power Ltd., October 2005. 46 B. Lionel, (OPG), “Sources of NPRI Releases from OPG’s
Nuclear Generation Stations,” personal communication.47 F. Bajourney, (OPG). “Sources of Pollutant Releases from
Pickering Station as Reported in NPRI” Personal communi-cation.
48 Chemical Profile from www.scorecard.org. Accessed March 21, 2006.
49 Department of Justice Canada, Canadian Environmental Protection Act, Schedule 1.
50 Query Run through the Commission for Environmental Cooperation’s “Taking Stock Query Builder,” March 21, 2006.
51 CNSC, Protection of Non-Human Biota From Ionizing Radiation, INFO-0730 (Prepared by the former Advisory Committee on Radiological Protection as ACRP-22, August 2002). Accessed
January 30, 2006 at http://www.nuclearsafety.gc.ca/pubs_catalogue/uploads/I0730en.pdf
52 Rosalie Bertell, “Environmental Impacts on the Health of Women in the Great Lakes Basin,” Health Canada (2005). Accessed January 30, 2006 at http://www.hc-sc.gc.ca/hl-vs/alt_formats/hpb-dgps/pdf/environ_e.pdf. On Tritium see also the Canadian Coalition for Nuclear Responsibility at http://www.ccnr.org/tritium_1.html.
53 Rosalie Bertell, “Environmental Impacts on the Health of Women in the Great Lakes Basin,” Health Canada (2005). Accessed January 30, 2006 at http://www.hc-sc.gc.ca/hl-vs/alt_formats/hpb-dgps/pdf/environ_e.pdf. On Tritium see also the Canadian Coalition for Nuclear Responsibility at http://www.ccnr.org/tritium_1.html.
54 Occupational and Environmental Carcinogens Working Group of the Toronto Cancer Prevention Coalition, Letter to Councillor John Fillion, Chair, Toronto Board of Health Re: Ionizing Radiation and Public Health in the City of Toronto (GTA) in relation to the refurbish and expansion of nuclear power reactors and facilities on Lake Ontario, May 10, 2006.
55 Board of Health, City of Toronto, Decision Document, June 19, 2006 Meeting, Item 12.
56 CNSC, Radioactive Release Data from Nuclear Generating Stations 1994 – 2003, INFO-0210 (Revision 12).
57 CNSC, Radioactive Release Data from Nuclear Generating Stations 1994 – 2003, INFO-0210 (Revision 12).
58 CNSC, Radioactive Release Data from Nuclear Generating Stations 1994 – 2003, INFO-0210 (Revision 12).
59 Sierra Club of Canada, April 20, 2006. “Take Action: Say No to Nuclear Power in Ontario.” Accessed at http://sierraclub.ca/national/getinvolved/item.shtml?x=925
60 B. Livesey, 2000. “What’s in Toronto’s Drinking Water?.” Accessed January 18, 2006 at http://www.eye.net/eye/issue/issue_07.06.00/news/water.html
61 Sierra Club of Canada. “The Canadian Nuclear Lesson.” Accessed at http://www.sierraclub.ca/national/programs/atmosphere-energy/nuclear-free/reactors/nuclear-and-cli-mate-change.pdf
62 Sierra Club of Canada, “The Canadian Nuclear Lesson.” 63 B. Lionel, “Sources of NPRI Releases from OPG’s Nuclear
Generation Stations,” Personal Communication64 Review Team, Evaluation of Emission from Ontario Hydro
Admiralty Brass Condensers to the Great Lakes (Toronto: Ontario Hydro Nuclear, June 1997).
65 Chemical Profile from www.scorecard.org, March 21, 2006.66 Department of Justice Canada, Canadian Environmental
Protection Act, Schedule 1. 67 Query Run through Commission for Environmental
Cooperation Taking Stock Query Builder, March 21, 2006.68 NPRI, 2004, 2003, 2002. Data obtained from on-line data
search, accessed at http://www.ec.gc.ca/pdb/npri/npri_online_data_e.cfm
69 NPRI, 2004, 2003, 2002. Data obtained from on-line data search, accessed at http://www.ec.gc.ca/pdb/npri/npri_online_data_e.cfm
Endnotes
124 The Pembina Institute • Nuclear Power in Canada: An Examination of Risks, Impacts and Sustainability 125Nuclear Power in Canada: An Examination of Risks, Impacts and Sustainability • The Pembina Institute
Case Study: Cooling Water Effects on Fish at the Bruce Power Plant
1 Griffiths, J.S. 1992. Growth of Lake Ontario round whitefish in the vicinity of Darlington NGS 1974-1987. Ont. Hydro Res. Div. Rep. No. 92-220-K
2 Griffiths, J.S. 1980. Potential effects of unstable thermal dis-charges on incubation of round whitefish eggs. Ont. Hydro Res. Div. Rep. No. 80-140-K.
70 Centre for Energy. “Water.” Accessed January 4, 2005 at http://www.centreforenergy.com/silos/nuclear/nuclearEnvironment/generatingNuclearEnvWater01.asp?PostID=. See also Senes Consultants Ltd., Methods to Assess the Impacts on the Natural Environment of Generation Options (Richmond Hill: Prepared for the Ontario Power Authority, September 2005), pp.8-12.
71 Calculation based on average annual household electricity consumption in Ontario is 7MWh/yr from Ontario Power Generation. Standard Olympic swimming pool dimensions are 50m x 25m x 2m.
72 Ontario Power Generation. “2004 Fact Sheet” .73 Based on City of Toronto consumption of 1.24 million cubic
metres per day. 74 Atomic Energy Canada Limited, 2002. “Environmental
Benefits: Land and Water.” Accessed July 25, 2005 at http://www.aecl.ca/index.asp?layid=3&csid=306&menuid=555&miid=557
75 Atomic Energy Canada Limited. “Heavy Water Production and Processing.” Accessed February 2, 2006, at http://www.aecl.ca/index.asp?menuid=31&miid=244&layid=3&csid=115
76 CANDU Owners Group. “CANDU Reactors” .Accessed February 2, 2006 at http://www.candu.org/candu_reactors.html
77 Canadian Nuclear FAQ. “What is Heavy Water?.” Accessed February 2, 2006 at http://www.nuclearfaq.ca/cnf_sectionA.htm#e
78 The Sudbury Neutrino Observatory, Queens University. “Heavy Water.” Accessed February 21, 2006 at http://www.sno.phy.queensu.ca/sno/D2O.html
79 Federation of American Scientists. “Heavy Water Production.” Accessed February 21, 2006 at http://www.fas.org/nuke/intro/nuke/heavy.htm
80 OPG, “Bruce Heavy Water Plant Decommissioning – Environmental Assessment Report – Final Submission to CNSC.”
81 Web Elements. “Periodic Table.” Accessed February 22, 2006 at http://www.webelements.com/ . Used molecular weights of Sulphur, Oxygen and Hydrogen to calculate theoretical mass of SO2 released from H2S flaring.
82 Joy Parr, 2005. “Smells Like?: Sources of Uncertainty in the History of an Environment.” Accessed February 22, 2006 at http://publish.uwo.ca/~jparr/ParrEHRevApril05.htm
83 OPG, “Bruce Heavy Water Plant Decommissioning – Environmental Assessment Report – Final Submission to CNSC – Appendix C. 3 Period 3: July 2002 to September 2002.”
84 See Table 1.3 in Chapter 1 regarding acceptable exposure levels to radiation.
85 Health Canada, Annual Reports on Occupational Radiation Exposure in Canada. Accessed November 22, 2005 at http://www.hc-sc.gc.ca/ewh-semt/pubs/occup-travail/radiation/regist/reports_radiation-rapports_radioexpositions_e.html
86 Ontario Workplace Safety and Insurance Board (Medical and Occupational Disease Policy Branch), email communication.
87 CNSC, Radioactive Release Data from Nuclear Generating Stations 1994 – 2003, INFO-0210 (Revision 12).
88 CNSC, 2005. “Radiation Index.” Accessed October 21, 2005 at http://www.nuclearsafety.gc.ca/eng/safety/environment/radiationIndex.cfm
89 CNSC, 2005. “Radiation Index.” Accessed October 21, 2005 at http://www.nuclearsafety.gc.ca/eng/safety/environment/radiationIndex.cfm
90 CNSC, “Radiation Index.” 91 Ontario power generation, for example, states that the aver-
age Canadian receives about 1,770 microsieverts of radiation dose from natural sources such as radon gas decay products and cosmic radiation entering the earth’s atmosphere and approximately 70 microsieverts from man-made sources including residual fallout from past nuclear weapons testing and use of radiation sources in industrial processesOntario Power Generation, “Annual Summary and Assessment of Environmental Radiological Data,” 2005, http://www.opg.com/ops/remp.asp#public
92 See, for example, J.J. Mangano, “A Short Latency Between Radiation Exposure from Nuclear Plants and Cancer in Young Children,” Environmental Health Policy Vol.36, No.1. Pages 113-135, 2006.
93 Occupational and Environmental Carcinogens Working Group of the Toronto Cancer Prevention Coalition, Letter to Councillor John Fillion, Chair, Toronto Board of Health Re: Ionizing Radiation and Public Health in the City of Toronto (GTA) in relation to the refurbish and expansion of nuclear power reactors and facilities on Lake Ontario, May 10, 2006.
94 J.Swaigen and D.Estrin, eds., Environment on Trial (Toronto: Emond-Montgomery Publishers and Canadian Institute for Environmental Law and Policy, 1993), p. 685.
95 Low Level Radioactive Waste Management Office, “Inventory of Radioactive Waste in Canada 2004.”
96 Ontario Power Authority (OPA), Supply Mix Background Reports (Volume 3), pp. 113-114.
97 Ontario Power Generation, 2006 Second Quarter Report, August 17, 2006, pg.37. Current figure confirmed by pers.comm., John Van Den Hengel, Ontario Power Generation, September 14, 2007.
98 OPG, “Annual Information Form for the year Ended December 31, 2003” (April 30, 2004), pp. 30-31.
99 OPG, “Ontario Power Generation Reports Third Quarter 2004 Earnings, 9” (November 15, 2004), p.3.
100 CNSC, “Regulatory Guide G-219: Decommissioning Planning for Licensed Activities.”
101 OPG. “Backgrounder on the Nuclear Recovery Program.” Accessed at http://www.opg.com/about/ backgrounderIIP.pdf
102 N.W. Taylor, and M. Spivak, Canada’s Nuclear Reactors: How Much Safety is Enough? Interim Report (The Standing Senate Committee on Energy, the Environment and Natural Resources, June 2001). Accessed January 20, 2005
Endnotes
124 The Pembina Institute • Nuclear Power in Canada: An Examination of Risks, Impacts and Sustainability 125Nuclear Power in Canada: An Examination of Risks, Impacts and Sustainability • The Pembina Institute
at http://www.parl.gc.ca/37/1/parlbus/commbus/senate/ com-E/pdf-e/interim-enrg-e.pdf
103 On the Chernobyl accident see Greenpeace, Chernobyl Catastrophe: Consequences on Human Health (Amsterdam, The Netherlands: 2006). Accessed at www.greenpeace.org/ chernobylhealthconsequncesreport and B. Bennett, M. Repacholi, and Z. Carr, Health Effects of the Chernobyl Acceident and Special Health Care Programs (Geneva, Switzerland: World Health Organization, Report of the UN Chernobyl Forum, Expert Group “Health,” 2006). Accessed at http://www.who.int/ionizing_radiation/chernobyl/who_ chernobyl_report_2006.pdf
104 Taylor, and Spivak, Canada’s Nuclear Reactors: How Much Safety is Enough? Interim Report.
105 Taylor, and Spivak, Canada’s Nuclear Reactors: How Much Safety is Enough? Interim Report.
106 Taylor, and Spivak, Canada’s Nuclear Reactors: How Much Safety is Enough? Interim Report.
107 Taylor, and Spivak, Canada’s Nuclear Reactors: How Much Safety is Enough? Interim Report, p.18.
108 See, for example, G. Thompson, A Review of the Accident Risk Posed by the Pickering A Nuclear Generating Station Report (The Senate Standing Committee on Energy, the Environment and Natural Resources, August 2000).
109 G.Thompson, Risk Implications of Potential New Nuclear Plants in Ontario: Summary (Institute for Resource and Security Studies (prepared for the Coalition of Environmental Groups for a Sustainable Energy Future) December 1992).
110 Department of Justice Canada, Nuclear Liability Act (R.S. 1985, c. N-28). Accessed November 9, 2005 at http://laws.justice.gc.ca/en/N-28/
111 Department of Justice Canada, Nuclear Liability Act ( R.S. 1985, c. N-28 ).
112 Taylor, and Spivak, Canada’s Nuclear Reactors: How Much Safety is Enough? Interim Report.
113 Standing Senate Committee on Energy, the Environment and Natural Resources, Report on International Aspects of Nuclear Reactor Safety (June 6, 2002).
5. Phase IV: Waste Fuel Management1 NWMO, “Fact Sheet: Nuclear Fuel Waste in Canada”
Undated, accessed at www.nwmo.ca, September 18, 2006. 2 Low Level Radioactive Waste Management Office, Inventory
of Radioactive Waste in Canada 2004. 3 NWMO, “Fact Sheet: Nuclear Fuel Waste in Canada.” 4 Royal Commission on Electric Power Planning, Final Report
(Toronto: Queen’s Printer for Ontario 1978). 5 NWMO, Choosing a Way Forward: The Future Management of
Canada’s Used Nuclear Fuel. (Toronto: NWMO, 2005), Appendix 3.
6 Center for Energy. “Nuclear Fuel Wastes.” Accessed January 26, 2006 at http://www.centreforenergy.com/silos/nuclear/nuclearEnvironment/generatingNuclearEnvWastes04.asp
7 P.Timmermans, 2003, “Ethics of High Level Nuclear Waste Disposal in Canada” NWMO Background Paper accessed at http://www.nwmo.ca/Default.aspx?DN=223,207,199,20,1,Documents
8 Summary adapted from NWMO, Asking the Right Questions? The Future Management of Canada’s Used Nuclear Fuel, pp.25-27.
9 The actual size of the bundles varies from plant to plant, depending on facility design.
10 NWMO, Asking the Right Questions? The Future Management of Canada’s Used Nuclear Fuel, (Toronto: NWMO, 2003) Table 2.1.
11 P.Beck, “Nuclear Energy in the 21st Century: An Examination of a Contentious Subject,” Annual Review of Energy and Environment 24 (1999), p.130.
12 Summary adapted from NWMO, Asking the Right Questions? The Future Management of Canada’s Used Nuclear Fuel, Table 2.2.
13 Summary adapted from NWMO, Asking the Right Questions? The Future Management of Canada’s Used Nuclear Fuel, Table 2.3.
14 Summary adapted from NWMO, Asking the Right Questions? The Future Management of Canada’s Used Nuclear Fuel, Table 2.4.
15 Summary adapted from NWMO, Asking the Right Questions? The Future Management of Canada’s Used Nuclear Fuel, Figure 2.3.
16 Summary adapted from NWMO, Asking the Right Questions? The Future Management of Canada’s Used Nuclear Fuel, p.29.
17 K.F. Donovan, Status of Canadian and International Efforts to Reduce the Security Risk of Nuclear Fuel Waste (NWMO Background Papers: Health and Safety, 2003). Accessed August 17, 2005 at http://www.nwmo.ca/adx/asp/adxGetMedia.asp?DocID=229,208,199,20,1,Documents&MediaID=774&Filename=33_NWMO_background_paper.pdf
18 Beck, “Nuclear Energy in the Twenty First Century: An Examination of a Contentious Subject”.
19 Summary adapted from NWMO, Asking the Right Questions? The Future Management of Canada’s Used Nuclear Fuel, p.31.
20 Summary adapted from NWMO, Asking the Right Questions? The Future Management of Canada’s Used Nuclear Fuel, Table 2.7.
21 See generally R. Bothwell, Nucleus: The History of Atomic Energy of Canada Limited (Toronto: University of Toronto Press, 1988).
22 Summary adapted from NWMO, Asking the Right Questions? The Future Management of Canada’s Used Nuclear Fuel, p.17.
23 NWMO, Choosing a Way Forward: The Future Management of Canada’s Used Nuclear Fuel, pg.118.
24 Government of Canada, Report of the Nuclear Fuel Waste Management and Disposal Concept Environmental Assessment Panel (Ottawa: Ministry of Public Works and Government Services, February 1988).
25 NWMO, Choosing a Way Forward: The Future Management of Canada’s Used Nuclear Fuel, pg.23.
26 NWMO, Backgrounder, “NWMO’s Final Study Report,” November 3, 2005.
27 NWMO, Choosing a Way Forward: The Future of Canada’s Used Nuclear Fuel, Table 1-1.
28 NWMO, 2005, Backgrounder: “NWMO’s Final Study Report.”
29 Canadian Environmental Assessment Act, 1992 as amended, Comprehensive Study List Regulation (SOR/94-638).
30 See Nuclear Waste Watch. “High Level Radioactive Waste.” Accessed at http://www.cnp.ca/nww/index.php. See also Sierra Club of Canada, November 4, 2005. “NWMO report result of Mandate Twisting, says Sierra Club of Canada” (News Release).
Endnotes
126 The Pembina Institute • Nuclear Power in Canada: An Examination of Risks, Impacts and Sustainability 127Nuclear Power in Canada: An Examination of Risks, Impacts and Sustainability • The Pembina Institute
31 M. Campbell, “Bury nuclear waste underground, group says,” The Globe and Mail, November 4, 2005.
32 Campbell, “Bury nuclear waste underground, group says.” 33 The High Level Radioactive Waste Act, C.C.S.M, cR10. 34 NWMO, Choosing a Way Forward: The Future Management of
Canada’s Used Nuclear Fuel, Table 8-7.35 NWMO, Assessing the Options: Future Management of used
Nuclear Fuel in Canada, p.49. 36 K. Shrader-Frechette, Risk and Uncertainly in Nuclear Waste
Management (NWMO Background Paper 1-5, November 2003).
37 NWMO, Choosing a Way Forward: The Future Management of Canada’s Used Nuclear Fuel, Table 1-1.
38 NWMO, “Fact Sheet: Nuclear Fuel Waste in Canada.” 39 Low Level Radioactive Waste Management Office, “Inventory
of Radioactive Waste in Canada 2004.” 40 NWMO, “Fact Sheet: Nuclear Fuel Waste in Canada.” 41 Mike Krizanc (Communications Manager, NWMO), Personal
Communication, January 26, 2006.42 NWMO, Choosing a Way Forward: The Future Management of
Canada’s Used Nuclear Fuel, Table 1-1. 43 Golder Associates Ltd. and Gartner Lee Ltd. 2005. “NMWO
Background Paper: Assessments of Benefits, Risks and Costs of a Proposed Adaptive Phased Management Approach by Illustrative Economic Region.” Accessed January 27, 2006 at http://www.nwmo.ca/adx/asp/adxGetMedia.asp?DocID=1231,1090,199,20,1,Documents&MediaID=2350&Filename=92b_NWMO_Background_Paper.pdf
44 Golder Associates Ltd. and Gartner Lee Ltd., “NMWO Background Paper: Assessments of Benefits, Risks and Costs of a Proposed Adaptive Phased Management Approach by Illustrative Economic Region.”
45 Greenhouse gas emissions from truck transport based on 2757 g CO2eq / L from “Canada’s Greenhouse Gas Inventory: 1990-2002.” Environment Canada, Greenhouse Gas Division, 2004. 233 g CO2 emissions / km from “Energy Use Data Handbook, 1990 and 1995 to 2001.” Natural Resources Canada, 2003. 2.65 km/L fuel efficiency from Diamond International, Edmonton, Alberta, 1999. (Large general transport company).
46 US Environmental Protection Agency, “Emission Facts – Average In-Use Emissions from Heavy-Duty Trucks
47 US Environmental Protection Agency, “Federal Certification Exhaust Emission Standards.”
48 US Environmental Protection Agency, “Emission Facts – Average In-Use Emissions from Heavy-Duty Trucks
49 K. Shrader-Frechette, Risk and Uncertainly in Nuclear Waste Management, p. 3.
50 N.Lister, “Radiation” in J. Swaigen and D. Estrin (Eds.), Environment on Trial: A Guidebook to Ontario Environmental Law and Policy, p. 689.
51 NWMO, Assessing the Options: Future Management of used Nuclear Fuel in Canada, p. 49.
52 Shrader-Frechette, Risk and Uncertainly in Nuclear Waste Management.
53 NWMO, Choosing a Way Forward: The Future Management of Canada’s Used Nuclear Fuel, Table 8-2.
54 NWMO, Choosing a Way Forward: The Future Management of Canada’s Used Nuclear Fuel, Table 8-5.
55 Nevada Office of the Governor Agency for Nuclear Projects, 2002. “A Mountain of Trouble: A Nation at Risk.” Accessed January 26, 2006 at http://www.state.nv.us/nucwaste/yucca/impactreport.pdf
56 Does not include background radiation.57 Nevada Office of the Governor Agency for Nuclear Projects,
“A Mountain of Trouble: A Nation at Risk.” 58 Shrader-Frechette, Risk and Uncertainly in Nuclear Waste
Management, p. 3. 59 Wadrop Engineering Inc., Status of Transportation Systems for
High-level Radioactive Waste Management (HLRWM), (NWMO Background Papers, June 2003). Accessed November 18, 2005 at http://www.nwmo.ca/adx/asp/adxGetMedia.asp?DocID=243,237,199,20,1,Documents&MediaID=888&Filename=66_NWMO_background_paper.pdf
60 Nevada Office of the Governor Agency for Nuclear Projects, “A Mountain of Trouble: A Nation at Risk.”
61 G.R. Thompson, CRS Discussion Paper 2005-03 Potential Radioactive Releases from Commercial Reactors and Spent Fuel, (Worcester MA: Centre for Risk and Security, George Perkins Marsh Institute, Clark University, June 2005).
62 K.F. Donovan, Status of Canadian and International Efforts to Reduce the Security Risk of Nuclear Fuel Waste.
63 Significant Quantities. Defined by the IAEA, a Significant Quantity is “the approximate quantity of nuclear material in respect of which, taken into account any conversion process involved, the manufacturing of a nuclear explosive device cannot be excluded.”
64 J.P. Hinton et al, 1996. Cited in: F. Griffiths, Nuclear Waste Management in Canada: The Security Dimension (NWMO Background Papers, 2003). Accessed at http://www.nwmo.ca/adx/asp/adxGetMedia.asp?DocID=219,206,199,20,1,Documents&MediaID=768&Filename=14_NWMO_background_paper.pdf
65 F. Griffiths, Nuclear Waste Management in Canada: The Security Dimension.
66 E.S. Lyman, Comments on “Nuclear Waste Management in Canada: The Security Dimension,” by Prof. Franklyn Griffiths (Washington: Union of Concerned Scientists, September 9, 2003). Accessed November 21 2005 at http://www.nwmo.ca/adx/asp/adxGetMedia.asp?DocID=271,219,206,199,20,1,Documents&MediaID=798&Filename=14_NWMO_Comments_Lyman.pdf
67 CBC, 1974. “India’s ‘peaceful bomb” (Broadcast Archives). Accessed October 3, 2005 at http://archives.cbc.ca/IDC-1-75-104-898/science_technology/candu/clip4. See also J.Cirincoine, “Let’s not help India build more nuclear weap-ons,” Globe and Mail, March 6, 2006.
68 Nevada Office of the Governor Agency for Nuclear Projects, “A Mountain of Trouble: A Nation at Risk.”
69 NWMO, Choosing a Way Forward: The Future of Canada’s Used Nuclear Fuel, pg.218.
70 Nevada Office of the Governor Agency for Nuclear Projects, “A Mountain of Trouble: A Nation at Risk.”
71 P.Beck, “Nuclear Energy in the 21st Century: An Examination of a Contentious Subject.”
72 NWMO, Choosing a Way Forward: The Future Management of Canada’s Used Nuclear Fuel, pg.118.
73 NWMO, 3005, Backgrounder “NWMO’s Final Study Report.”
Endnotes
126 The Pembina Institute • Nuclear Power in Canada: An Examination of Risks, Impacts and Sustainability 127Nuclear Power in Canada: An Examination of Risks, Impacts and Sustainability • The Pembina Institute
74 NWMO, 2005. “Trust Funds: A Solid Foundation.” Accessed November 9, 2005 at http://www.nwmo.ca/Default.aspx?DN=187,183,113,19,1,Documents
75 NWMO, Choosing a Way Forward, pg.258.76 NWMO, Asking the Right Questions? Table 2.8 indicates that
OPG would be responsible for 3.3 million of a total of 3.6. million waste fuel bundles expected to eventually be in the used fuel inventory.
77 NWMO, Choosing a Way Forward, pg. 261. 78 Pers.comm., John Van Den Hengel, Ontario Power
Generation, September 14, 2006. 79 Ontario Ministry of Finance, Budget Paper A Appendix: Details
of Ontario’s Finances (Ontario Budget, 2005). 80 Ontario Power Generation, “Annual Information Form For
The Year Ended December 31, 2003.”81 Pers.communications., John van den Hengel, OPG,
September 12 and September 14, 2006. 82 NWMO, 2005, Backgrounder: “NWMO’s Final Study
Report.”
6. Sustainability Challenges1 Senes Consultants Ltd., Methods to Assess the Impacts on the
Natural Environment of Generation Options, pp. 7-18; citing International Energy Agency data.
2 Ontario Hydro, Demand Supply Plan Hearing Interrogatory No 9.7.62., (February 1991, p.1). Cited in M.Winfield et al, Power for the Future: Towards a Sustainable Electricity System for Ontario.
3 Ontario Hydro, A Journalist’s Guide to Nuclear Power (1998). Cited in M.Winfield et al., Power for the Future: Towards a Sustainable Electricity System for Ontario.
4 Ontario Hydro, Demand Supply Plan Hearing Interrogatory No 9.7.62., (February 1991, attachment 1). Cited in M.Winfield et al., Power for the Future: Towards a Sustainable Electricity System for Ontario.
5 Ontario Hydro, Demand Supply Plan Hearing Interrogatory No 9.7.62., (February 1991, Attachment 2, p. 2-1). Cited in M.Winfield et al., Power for the Future: Towards a Sustainable Electricity System for Ontario.
6 OPG, 2005. “Ontario Power Generation Not Proceeding with the Refurbishment of Pickering Units 2 and 3” (Media Release). Accessed October 26 at http://www.opg.com/info/news/NewsAug12_05-NRUnit2and3.asp
7 OPG Review Committee, Transforming Ontario’s Power Generation Company (March 2004, p. 50). Cited in M.Winfield et al, Power for the Future: Towards a Sustainable Electricity System for Ontario.
8 See M.Winfield et al, Power for the Future: Towards a Sustainable Electricity System for Ontario, Table 5.9 and supporting refer-ences.
9 See M.Winfield et al, Power for the Future: Towards a Sustainable Electricity System for Ontario, Table 5.8 and supporting refer-ences.
10 The Economist, July 7, 2005. “Nuclear Power: The Shape of Things to Come?”
11 See M.Winfield et al, Power for the Future: Towards a Sustainable Electricity System for Ontario, Table 5.8 and supporting refer-ences.
12 J. Spears, “8 Nuclear reactors proposed for Ontario,” Toronto Star, December 31, 2003.
13 The Economist, “Nuclear Power: The Shape of Things to Come?”
14 Ontario Clean Air Alliance, “High Cost Energy: The Economics of Nuclear Power,” Air Quality Issues Fact Sheet #20, March 2006.
15 Nucleonic Week, February 12, 2004. “Gross Generation by Reactor Type and Vendor.”
16 OPG, 2004. 2004 Performance Report for Pickering Nuclear. Accessed at http://www.opg.com/ops/reportcards/Pick04_YE.pdf
17 OPG, 2004. 2004 Performance Report for Darlington Nuclear. Accessed at http://www.opg.com/ops/reportcards/Darl04_YE.pdf
18 Bruce Power, 2002. Annual Review. Accessed at http://www.brucepower.com/bpcms_web/uc/GetDocument.aspx?docid=947
19 The given capacity factor is for reactor 4, the only functional reactor in 2003.
20 N.W. Taylor and M. Spivak, Canada’s Nuclear Reactors: How Much Safety is Enough? Interim Report.
21 OPG, March 16, 2004. Backgrounder on the Nuclear Recovery Program. Accessed at http://www.opg.com/about/backgrounderIIP.pdf
22 Ontario Hydro, “Ontario Hydro moving ahead on major overhaul of production facilities,” News Release, August 13, 1997.
23 OPG, Backgrounder on the Nuclear Recovery Program. 24 Pickering Review Panel, December 2003. Report of the Pickering
‘A’ Review Panel. Accessed December 1, 2005 at http://cna.ca/english/Studies/Pickering_Review_%2004/pickering_report_dec2003_en.pdf
25 OPG, “Ontario Power Generation Not Proceeding with the Refurbishment of Pickering Units 2 and 3.”
26 J. Spears, “Nuclear power key to future: Bruce chief,” Toronto Star, January 30, 2004. Cited in M.Winfield et al, Power for the Future: Towards a Sustainable Electricity System for Ontario.
27 Ontario Ministry of Energy, 2005. Media Release “Government and Bruce Power Reach Agreement to Restart Nuclear Units.”
28 OPG, 2005. “OPG Moving Ahead with Pickering A Unit 1 Return to Service.” Accessed October 25, 2005 at http://www.opg.com/info/news/NewsJuly07_04.asp
29 Ontario Clean Air Alliance, Increasing Productivity and Moving Towards a Renewable Future: A New Electricity Strategy for Ontario (October 2005), p. 15; and OPG, “Ontario Power Generation Reports 2005 Third Quarter Financial Results,” News from Ontario Power Generation (November 11, 2005).
30 Including costs of feeder inspection and replacement ($20 million), not included in original scope. OPG, 2005. “Ontario Power Generation Reports 2005 Third Quarter Financial Results.” Accessed November 14, 2005 at http://www.opg.com/ir/reports/Q3_05all.pdf
31 OPG, “Ontario Power Generation not proceeding with the refurbishment of Pickering A Units 2 and 3.”
32 Ontario Ministry of Energy, “Agreement Strengthens reli-ability of supply and brings on enough new power for one million homes,” News Release, October 2005.
33 J. Gibbons, “Countdown Coal: How Ontario can improve air quality by phasing out coal-fired electricity generation”
Endnotes
128 The Pembina Institute • Nuclear Power in Canada: An Examination of Risks, Impacts and Sustainability 129Nuclear Power in Canada: An Examination of Risks, Impacts and Sustainability • The Pembina Institute
(Toronto: Ontario Clean Air Alliance, February 2003), Appendix C.
34 See, for example, Toronto Public Health, Air Pollution Burden of Illness in Toronto: Summary Report (Toronto: City of Toronto, May 2000).
35 See for example: Ontario Hydro, Final Annual Report January 1988-March 1999, pp. 44-45.
36 Canadian Nuclear Association, The Value of Nuclear Power to Canada’s CO2 emissions trading system, October 2003, p. 12.
37 Ontario Hydro, Final Annual Report January 1988-March 1999, p. 56.
38 Rick Machon, “Option Selection Basis,” Nuclear Asset Optimization Plan (NAOP) Development & Recommendation (August 11, 1997), p. 16.
39 Ralph Torrie and Richard Parfett, Phasing out Nuclear Power in Canada: Toward Sustainable Electricity Futures, (Torrie Smith Associates, Campaign for Nuclear Phaseout, July 2003), p. i.
40 OPG Review Committee, Transforming Ontario’s Power Generation Company (March 2004), p. 50.
41 Ontario Power Generation Review Committee, Transforming Ontario’s Power Generation Company, March 2004, p. 19.
42 Ontario Electricity Financial Corporation, 1999. “Debt Management.” Accessed November 22, 2005 at http://www.oefc.on.ca/debtmanage.html
43 Ontario Electricity Finance Corporation, Annual Report, April 1, 1999 to March 31, 2000, p. 21. The remainder of the debt was related to power purchase contracts.
44 E. Dewar, “Nuclear Resurrection: Must Ontario fire up more reactors to power its future?” Canadian Geographic, May/June 2005.
45 R.A. Falkenrath, 1995. “The U.S.-Russian HEU Purchase Agreement: Achievements, Problems, Prospects.” Accessed November 7, 2005 at http://bcsia.ksg.harvard.edu/BCSIA_content/documents/disc_paper_95_07.pdf
46 The Ux Consulting Company, LLC http://www.uxc.com/”; accessed September 22, 2006.
47 The Ux Consulting Company, LLC http://www.uxc.com/”; accessed September 22, 2006.
48 Morgan Stanley Equity Research, 2005. “Metals and Mining: Global Insights.” Accessed October 27, 2005 at http://www.alberta-star.com/morganstanley.pdf
49 As determined by the Nuclear Energy Agency of the OECD and the United Nations International Atomic Energy Agency. World Nuclear Association. “Uranium Resources.” AccessedNovember 16, 2005 at http://www.world-nuclear.org/factsheets/uranium.htm
50 M.Diesendorf, “Can Nuclear Energy Reduce CO2 Emissions,” Australian Science, July 2005.
51 C.C.Plummer et al, Physical Geology and the Environment (Toronto: McGraw-Hill Ryerson, 2004), p.309. See also Senes Consultants Ltd., Methods to Assess the Impacts on the Natural Environment of Generation Options, p. 7-45.
52 Natural Resources Canada, “Canada’s Uranium Industry – 2004.”
53 OPA, Supply Mix Advice Report, p. 80. 54 See, for example, Senes Consultants Ltd., Methods to Assess
the Impacts on the Natural Environment of Generation Options, p. 8-15.
55 However, these technologies do not currently exist on a commercial scale. For a detailed critique of these pos-sibilities see D.Flemming, “Why nuclear power cannot be a major energy source,” feasta (April 2006) accessed at www.neweconomics.org.
56 World Nuclear Association, “Uranium Resources.” 57 NWMO, Assessing the Options: Future Management of Used
Nuclear Fuel in Canada, pp. 27-28.58 P. Beck, “Nuclear energy in the Twenty-First Century: An
examination of a contentious subject,” p. 128. 59 NWMO, Assessing the Options: Future Management of Used
Nuclear Fuel in Canada, pp. 27-28.60 P.W. Beck, “Nuclear energy in the 21st century: An examina-
tion of a contentious subject.” 61 P.W. Beck, “Nuclear energy in the 21st century: An examina-
tion of a contentious subject.” 62 Duane Bratt, “Canada’s nuclear schizophrenia,” Bulletin of the
Atomic Scientist 58, no. 2 (2002), pp. 44-50. 63 Atomic Energy of Canada Limited. “Our History.” Accessed
August 17, 2005 at http://www.aecl.ca/index.asp?layid=3&csid=47&menuid=20
64 CNSC, 2004. Environmental Assessment: Decommissioning of a plutonium recovery laboratory at Chalk River Laboratories. Accessed August 17, 2005 at http://www.nuclearsafety.gc.ca/eng/assessments/EA_04_01_6503.cfm Confirmation on this point was requested from CEAA on March 28, 2006. No response received to date.
65 E. Dewar, “Nuclear Resurrection: Must Ontario fire up more reactors to power its future?”
66 International Atomic Energy Agency, “Operating Experience with Nuclear Power Stations in Member States in 1984” (Vienna: p. 67). Cited in Pembina Institute, “Power for the Future,” Appendix 2: Ontario’s Nuclear Generating Facilities: A History and Estimate of Unity Lifetimes and Refurbishment Costs (2005).
67 See generally, R. Bothwell, Nucleus: A History of Atomic Energy of Canada Limited (Toronto: University of Toronto Press, 1988).
68 P.W. Beck, “Nuclear energy in the 21st century: An examina-tion of a contentious subject.”
69 G. Edwards, “Canada’s Nuclear Industry and the Myth of the Peaceful Atom,” (Canadian Coalition for Nuclear Safetey, 1996). Accessed March 28, 2006 at http://www.ccnr.org/myth_1.html
70 T. Graham and J. Glasgow, Nonproliferation Aspects of Spent Fuel Storage and Transportation (NWMO Background Papers: Guiding Concepts, December 2003). Accessed October 4, 2005 at http://www.nwmo.ca/adx/asp/adxGetMedia.asp?DocID=329,206,199,20,1,Documents&MediaID=1237&Filename=18_NWMO_Background_Paper.pdf
71 CBC, 1974. “India’s ‘peaceful bomb” Broadcast Archives. Accessed October 3rd, 2005 at http://archives.cbc.ca/IDC-1-75-104-898/science_technology/candu/clip4
72 The Economist, “The world wants Iran to stop,” March 11,2006.
73 The Economist, “North Korea’s Nuclear Weapons,” January 2, 2003.
74 See, for example, The Economist, “Dr.Strangedeal,” March 11, 2006.
Endnotes
128 The Pembina Institute • Nuclear Power in Canada: An Examination of Risks, Impacts and Sustainability 129Nuclear Power in Canada: An Examination of Risks, Impacts and Sustainability • The Pembina Institute
75 The Economist, “Weapons proliferation,” January 31, 2002. 76 P.W. Beck, “Nuclear energy in the 21st century: An examina-
tion of a contentious subject.” 77 See, for example, Toronto Star, “Dirty bomb material smug-
gled,” March 28, 2005.78 Sustainable Development Commission. “Nuclear power is
not the answer to tackling climate change or security of sup-ply.” Accessed at http://www.sd-commission.org.uk/pages/060306.html
79 The Economist, “Power Politics: Critics of Tony Blair’s plans for a nuclear revival make their case,” April 20, 2006.
80 G.R. Thompson, CRS Discussion Paper 2005-03 Potential Radioactive Releases from Commercial Reactors and Spent Fuel, (Worcester MA: Centre for Risk and Security, George Perkins Marsh Institute, Clark University, June 2005).
7. Summary and Conclusions and Glossary1 Based on total construction-related releases of 5.7 million
tonnes for Canadian nuclear power plants, averaged over a 25-year lifetime.
2 Wikipedia The Free Encyclopedia, “Radionuclide,” Accessed January 27, 2006 at http://en.wikipedia.org/wiki/Radionuclides.
3 US Nuclear Regulatory Commission, “Low-Level Waste,” Accessed January 27, 2006 at http://www.nrc.gov/waste/low-level-waste.html.
4 Wikipedia The Free Encyclopedia, “Radiation,” Accessed February 28, 2006 at http://en.wikipedia.org/wiki/Radiation.
5 US Environmental Protection Agency, “Understanding Radiation,” Accessed February 28, 2006 at http://www.epa.gov/radiation/understand/index.html.
6 Wikipedia The Free Encyclopedia, “Sievert,” Accessed February 1, 2006 at http://en.wikipedia.org/wiki/Sievert.
7 Wikipedia The Free Encyclopedia, “Gamma Ray,” Accessed January 27, 2006 at http://en.wikipedia.org/wiki/Gamma_radiation.
8 Wikipedia The Free Encyclopedia, “Becquerel,” Accessed January 27, 2006 at http://en.wikipedia.org/wiki/Becquerel.
9 Wikipedia The Free Encyclopedia, “Radon,” Accessed January 27, 2006 at http://en.wikipedia.org/wiki/Radon.
10 Based on Ontario Power Authority, Supply Mix Analysis Report Volume 2 (Toronto: Ontario Power Authority, 2005), Table 2.7.40 estimate of emissions of 12kg CO2 equivalent per MWh of electricity and total 2003 nuclear power generation of 70,000,000 MWh.
Endnotes