Embed Size (px)
Citation preview
December, 2006 F I N I S A R C O R P O R A T I O N
FinisarSAN Availability Solutions
Enterprise Business
FinisarSAN Availability Solutions
Enterprise Business
2
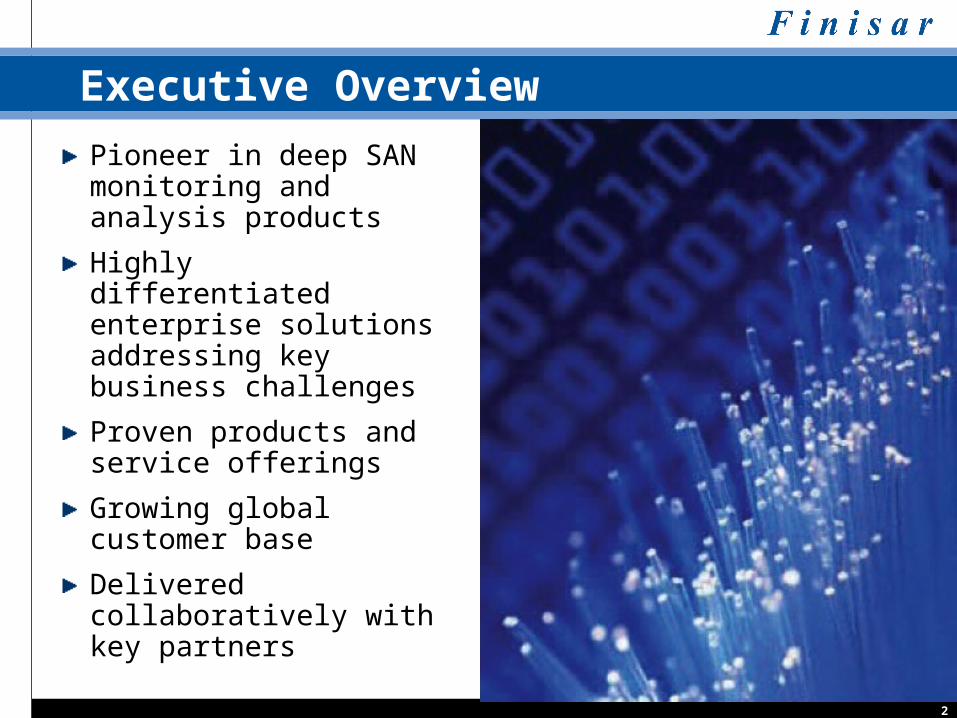
Executive Overview
Pioneer in deep SAN monitoring and analysis products
Highly differentiated enterprise solutions addressing key business challenges
Proven products and service offerings
Growing global customer base
Delivered collaboratively with key partners

3
Finisar at a Glance
Established in 1988, over $400M in revenues, publicly traded on NASDAQ; FNSR
#1 supplier of pluggable optical modules worldwide
#1 volume leader in 1G Ethernet (LAN) and 2/4G Fibre Channel (SAN) optical transceivers
#1 storage industry’s protocol analyzer: Xgig
#1 storage industry’s testing and training facility: Medusa Labs

4
Fiber Optic Transceivers and Modules
OPTICAL ELECTRICAL
Optical data sent by VCSEL
Optical data received by photodiode Circuitry provides
translation between optical and electrical
information
router, switch, HBA
or other device

5
Vendor Trusted & Proven Technology
Vendor R&D LabsFinisar’s products are “Industry Standard” offerings used by major storage, switch and HBA vendors for testing & troubleshooting SAN devices
Vendor Field Support OrganizationsFinisar’s Xgig Analyzer is used by vendor’s field service organizations when Enterprise customers experience elusive SAN connectivity or performance problems
Finisar’s SAN Availability solutions are Vendor Trusted & Vendor Proven
The “Finisar Trace” is an industry standard format recognized by every major storage vendor

6
Storage Vendors who use and trust Finisar
and others …

7
NetWisdom SAN problem detection & avoidance
Used to avoid problems – detecting traffic congestion, application slowdown, failing devices, etc.
Enterprise SAN Availability Solutions Xgig SAN Resiliency Testing
Used to test SAN infrastructures – Physical layer testing and protocol error injection
SAN problem identification & diagnosisUsed when problems occur – pinpoints traffic issues and errors
Medusa Test Tools SAN Load Generation & Stress Testing
Used to simulate traffic – test storage network resiliency to support application traffic
Detecting Storage Network problems before
Applications and Users are impacted
8
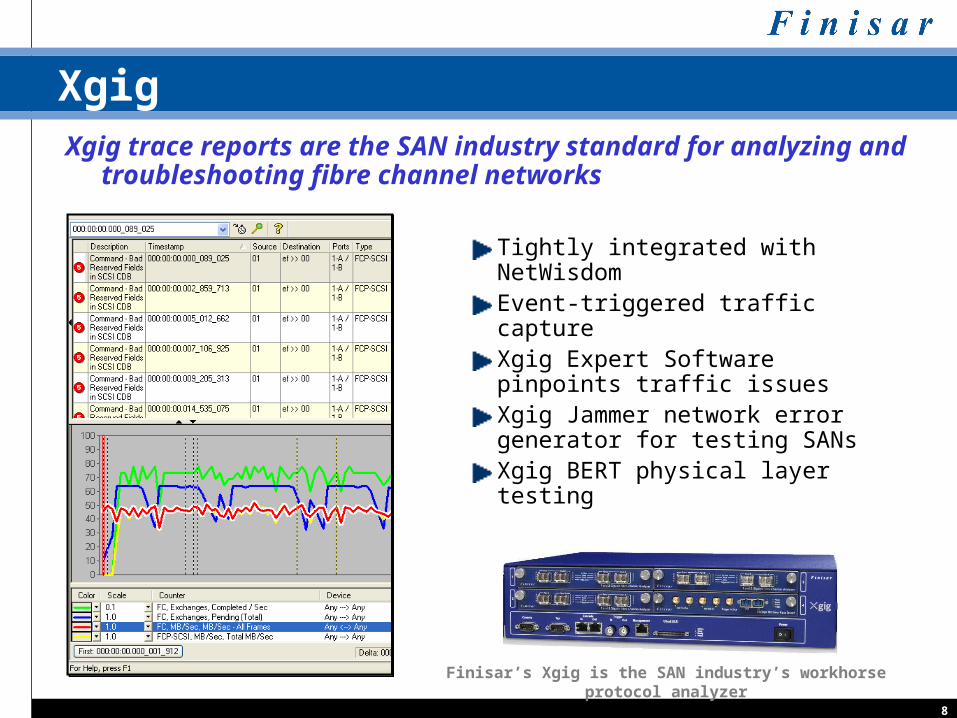
Xgig
Tightly integrated with NetWisdom Event-triggered traffic captureXgig Expert Software pinpoints traffic issuesXgig Jammer network error generator for testing SANsXgig BERT physical layer testing
Xgig trace reports are the SAN industry standard for analyzing and troubleshooting fibre channel networks
Finisar’s Xgig is the SAN industry’s workhorse protocol analyzer
9
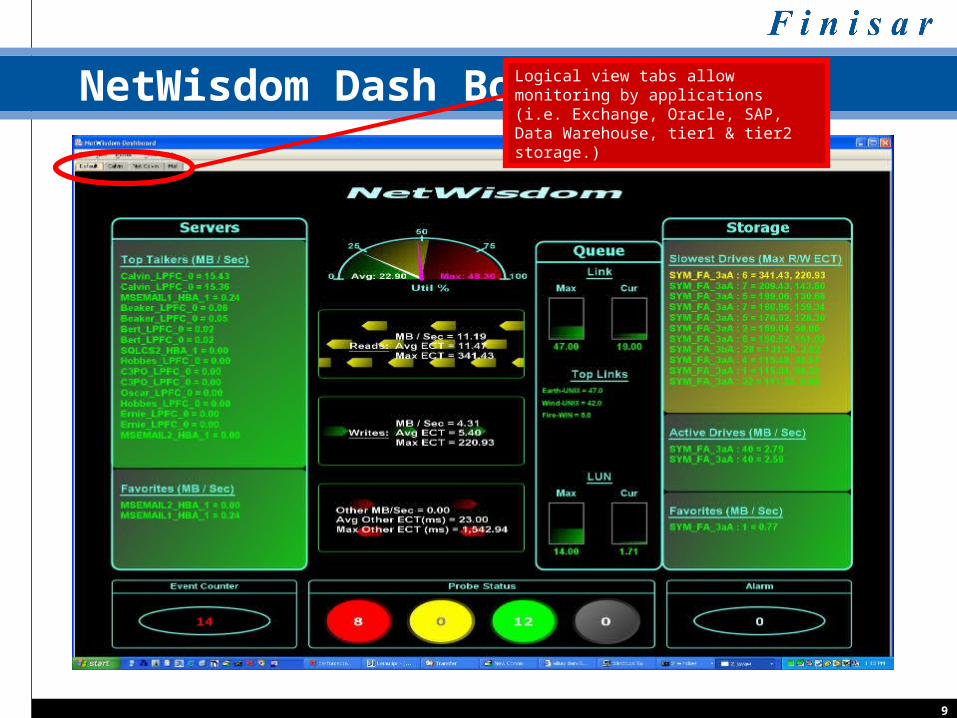
NetWisdom Dash BoardLogical view tabs allow monitoring by applications (i.e. Exchange, Oracle, SAP, Data Warehouse, tier1 & tier2 storage.)

10
NetWisdomPre-defined reports
Customize everything
Trending
11
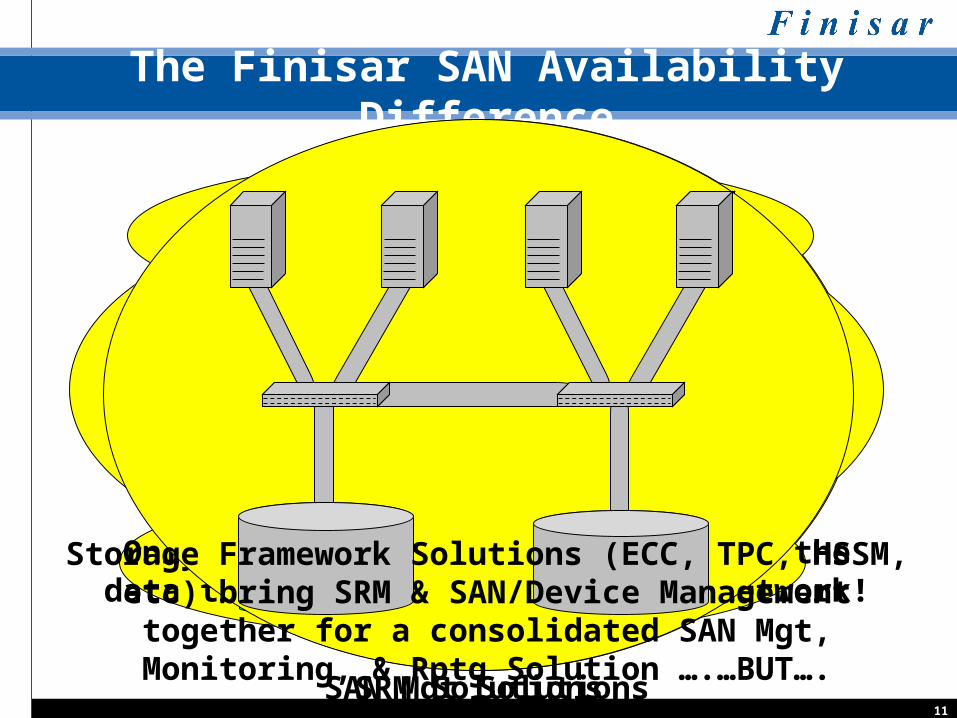
The Finisar SAN Availability Difference
&
SRM Solutions
Server Asset & File System Capacity/Allocation info.
Storage Asset & Raw/Allocated Capacity info.
SAN Mgt Solutions
Aggregated Switch Views & Fabric Topology Mapping
Only Finisar provides insight into the data traffic & flows inside the network!
Storage Framework Solutions (ECC, TPC, HSSM, etc) bring SRM & SAN/Device
Management together for a consolidated SAN Mgt, Monitoring, & Rptg Solution ….…BUT….
12
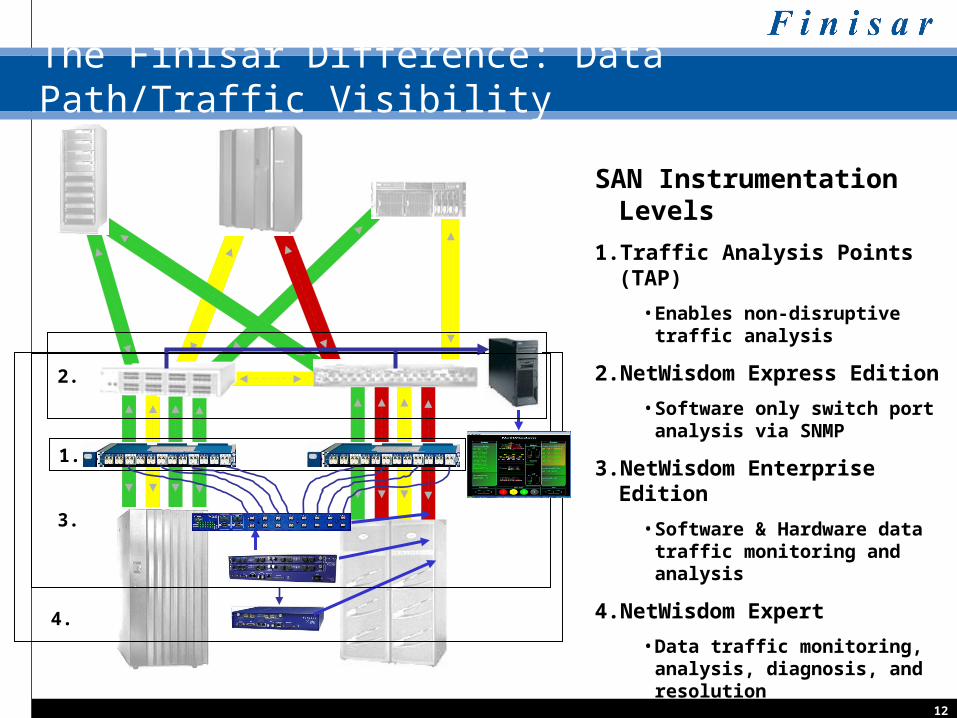
The Finisar Difference: Data Path/Traffic Visibility
SAN Instrumentation Levels
1. Traffic Analysis Points (TAP)
• Enables non-disruptive traffic analysis
2. NetWisdom Express Edition
• Software only switch port analysis via SNMP
3. NetWisdom Enterprise Edition
• Software & Hardware data traffic monitoring and analysis
4. NetWisdom Expert
• Data traffic monitoring, analysis, diagnosis, and resolution
1.
4.
2.
3.

13
What are Analysts saying….
"It's ironic that the largest, most sophisticated IT shops in the world are the ones most likely to have hidden problems."
"The issue is visibility - or the absolute lack of. We have no idea what issues we have, and where, most of the time. When you add virtual services into the infrastructure, you only compound the problem. It's like driving blind - you can wing it for a while, but sooner or later you will hit something."
- Steve Duplessie, Founder, Enterprise Strategy Group.
14
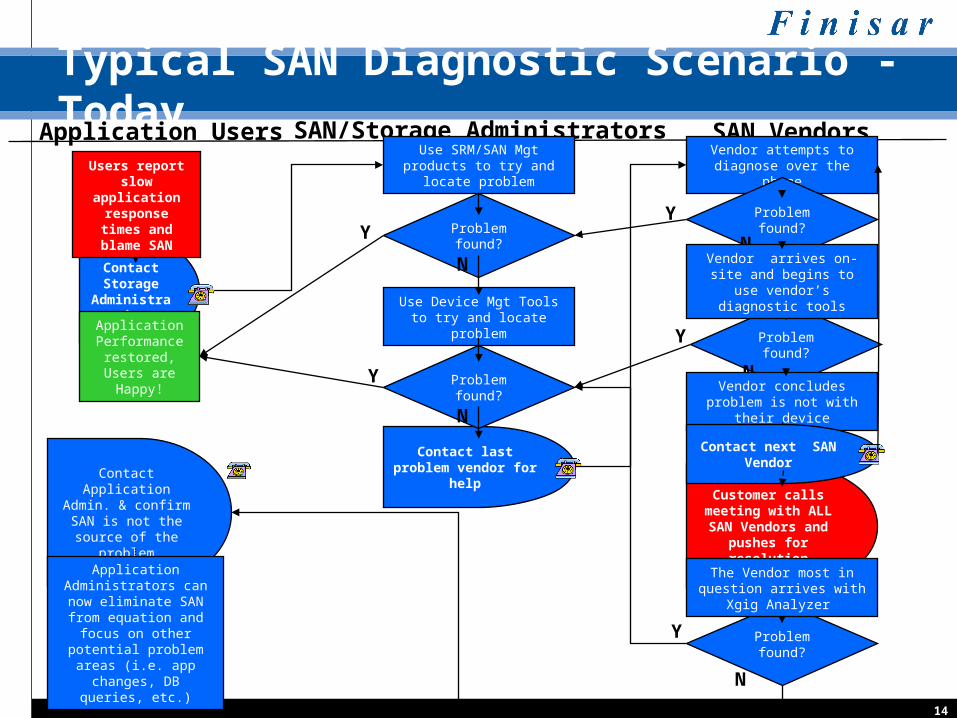
Typical SAN Diagnostic Scenario - TodayApplication Users SAN/Storage Administrators SAN Vendors
Contact Storage
Administration
Users report slow application
response times and blame SAN
Problem found?
N
Use Device Mgt Tools to try and locate problem
Contact last problem vendor for help
Use SRM/SAN Mgt products to try and locate problem
Problem found?Y
N
Vendor attempts to diagnose over the phone
Problem found?Y
N
Problem found?Y
N
Problem found?Y
Vendor arrives on-site and begins to use vendor’s
diagnostic tools
Vendor concludes problem is not with their device
Customer calls meeting with ALL SAN Vendors and
pushes for resolution
The Vendor most in question arrives with Xgig Analyzer
Contact next SAN Vendor
Application Performance
restored, Users are Happy!
Y
Users report slow application response times and blame SAN
Contact Application Admin. & confirm SAN is not the
source of the problem
Application Administrators can now eliminate SAN from equation and focus
on other potential problem areas (i.e. app changes,
DB queries, etc.) N
15
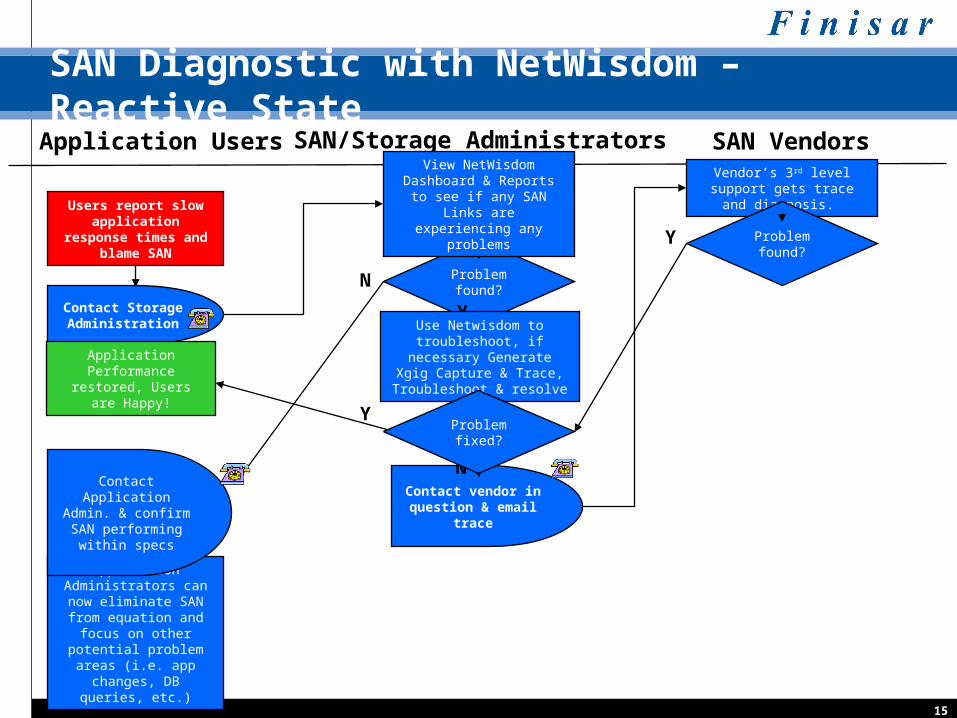
SAN Diagnostic with NetWisdom – Reactive StateApplication Users SAN/Storage Administrators SAN Vendors
Contact Storage Administration
Users report slow application
response times and blame SAN
Problem found?
YUse Netwisdom to
troubleshoot, if necessary Generate Xgig Capture &
Trace, Troubleshoot & resolve
Contact vendor in question & email trace
Vendor’s 3rd level support gets trace and diagnosis.
Problem found?Y
N
Users report slow application response times and blame SAN
Application Administrators can now eliminate SAN from equation and focus
on other potential problem areas (i.e. app changes,
DB queries, etc.)
Contact Application Admin. & confirm SAN performing
within specs
View NetWisdom Dashboard & Reports to see if any SAN Links are experiencing any
problems
Application Performance restored, Users are
Happy!
Y
N
Problem fixed?
16
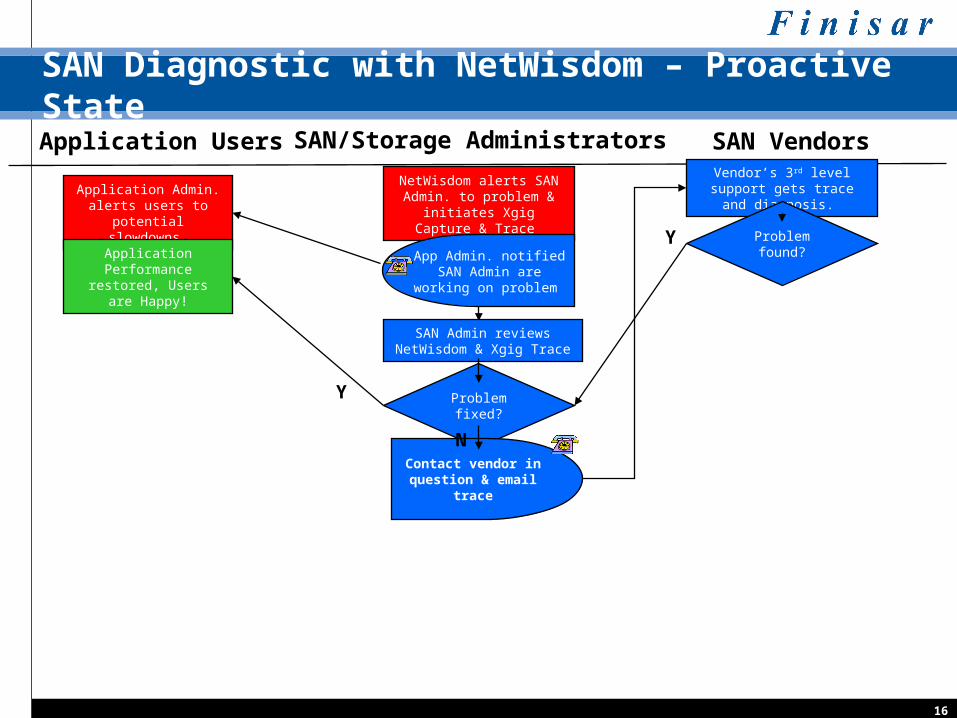
SAN Diagnostic with NetWisdom – Proactive State
Application Users SAN/Storage Administrators SAN Vendors
Users report slow application
response times and blame SAN
Problem fixed?
SAN Admin reviews NetWisdom & Xgig Trace
Contact vendor in question & email trace
Vendor’s 3rd level support gets trace and diagnosis.
Problem found?Y
NetWisdom alerts SAN Admin. to problem & initiates
Xgig Capture & Trace
Application Admin. alerts users to potential
slowdowns
Y
N
App Admin. notified SAN Admin are working on
problem
Application Performance restored, Users are
Happy!
17
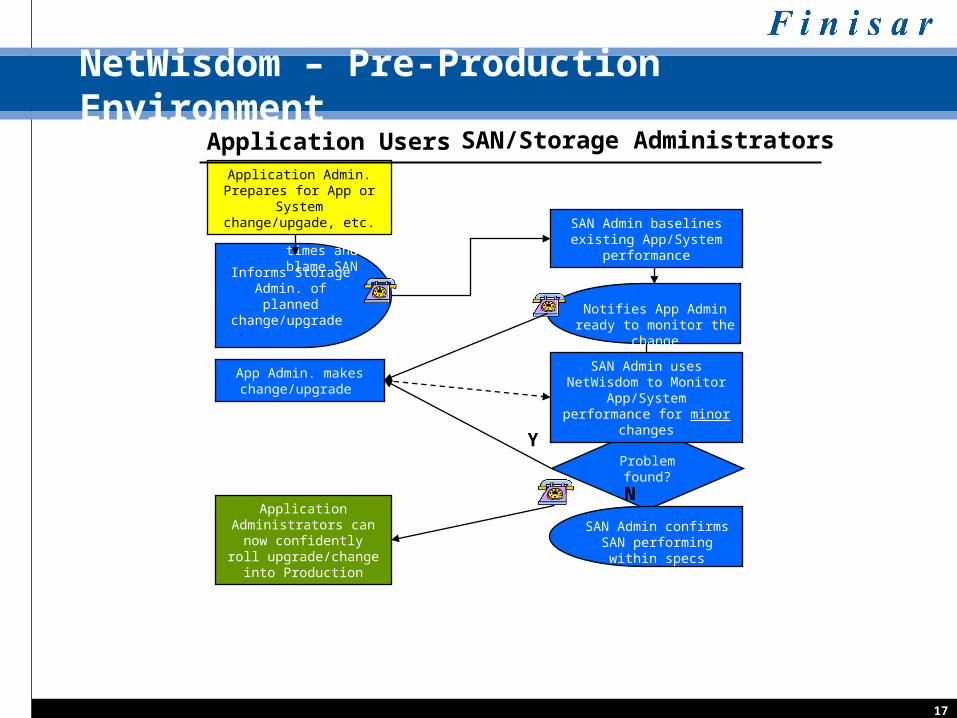
NetWisdom – Pre-Production EnvironmentApplication Users SAN/Storage Administrators
Informs Storage Admin. of planned change/upgrade
Users report slow application
response times and blame SAN
Problem found?
N
Application Admin. Prepares for App or System
change/upgade, etc.
Application Administrators can now confidently roll
upgrade/change into Production
SAN Admin baselines existing App/System
performance
App Admin. makes change/upgrade
Y
Notifies App Admin ready to monitor the change
SAN Admin confirms SAN performing within specs
SAN Admin uses NetWisdom to Monitor App/System performance for minor
changes
18
SAN Availability Solutions
1. Remote Replication Availability
2. Application Availability
3. Infrastructure Availability
4. Server/Storage Consolidation Availability
5. Pre-Production Availability
6. Backup Infrastructure Availability
19
Representative Enterprise Customers
Albertson’s
Austrian Lottery
Bank of New York
Baptist Memorial
Bosch
Bundesamt fur Informatik und Telekommunikation
Caterpillar
Cedars-Sinai Medical
Chicago Mercantile
Cingular
Con-way (CNF)
Government of BC
Halifax Bank of Scotland
Kaiser Permanente
Lawrence Livermore Labs
MD Anderson Cancer Ctr.
Microsoft
Motorola
NASA
San Diego Super Computer
United Airlines
US Homeland Security
20
Finisar Services
SAN Healthcheck Services Troubled link, Application, Storage, Pre-
production, Backup/Remote Replication
Monthly/Quarterly SAN Optimization Check Monthly/Quarterly SAN Analysis to ensure
maximum utilization & performance of SAN infrastructure, and provide advanced insight into potential problem areas
SANGuard Monitoring Services 24x7 SAN monitoring service to ensure ongoing
optimization of SAN resources and advanced notification of potential problem areas
21
Finisar Benefits Summary
Storage vendor trusted & proven technologyAvoid SAN vendor finger pointing & locate root cause of problem fasterDetect, diagnose, & resolve SAN data path problems before application/user impactEnsure SAN Resources are fully utilized and performing optimallyImprove SAN capacity planning through better insight into current link utilizationsImprove service levels & customer satisfaction
22
Product Demonstration
23
Backup
24
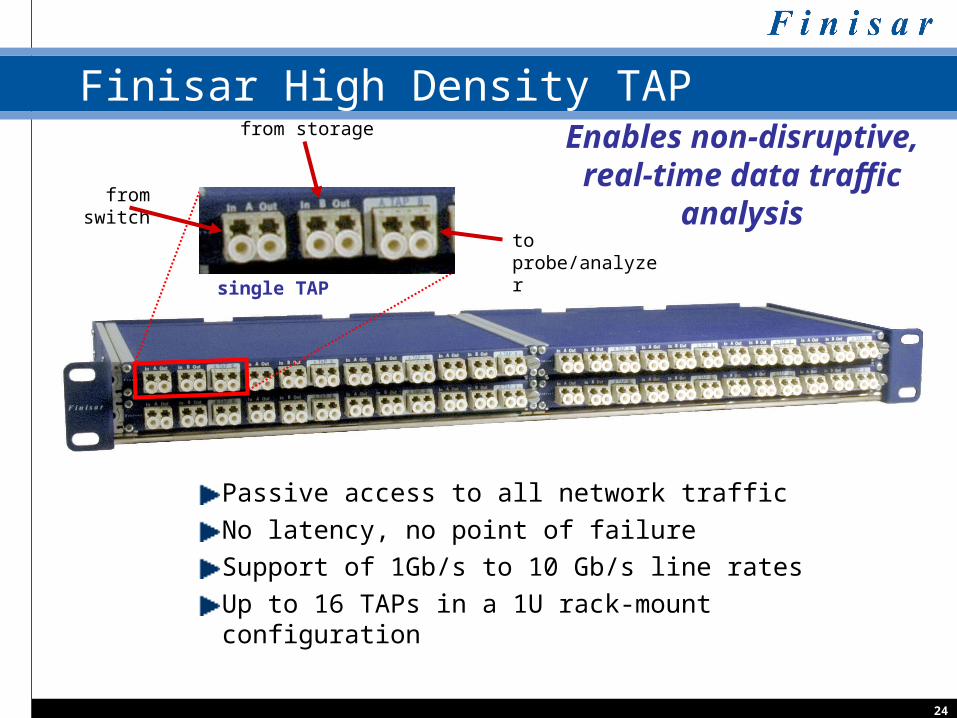
Finisar High Density TAP
Passive access to all network traffic
No latency, no point of failure
Support of 1Gb/s to 10 Gb/s line rates
Up to 16 TAPs in a 1U rack-mount configuration
Enables non-disruptive, real-time data traffic
analysisfrom switch
from storage
to probe/analyzer
single TAP
25
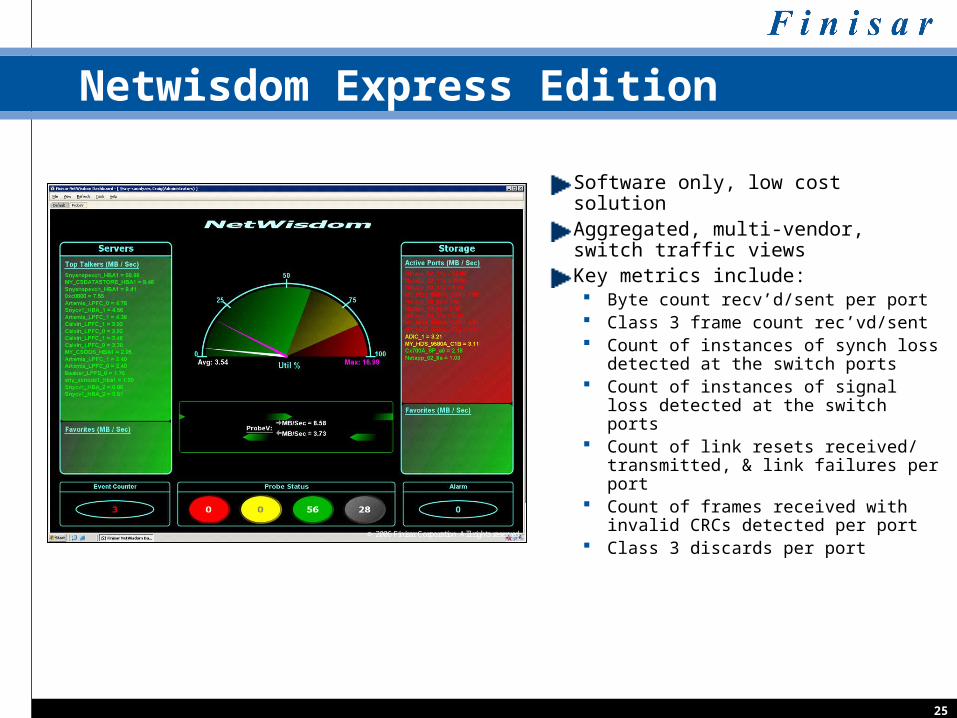
Netwisdom Express Edition
Software only, low cost solutionAggregated, multi-vendor, switch traffic viewsKey metrics include: Byte count recv’d/sent per port Class 3 frame count rec’vd/sent Count of instances of synch loss
detected at the switch ports Count of instances of signal loss
detected at the switch ports Count of link resets received/
transmitted, & link failures per port
Count of frames received with invalid CRCs detected per port
Class 3 discards per port
F i n i s a r © 2006 Finisar Corporation. All rights reserved.
NetWisdom ExpressNetWisdom Express
© 2006 Finisar Corporation. All rights reserved.
26
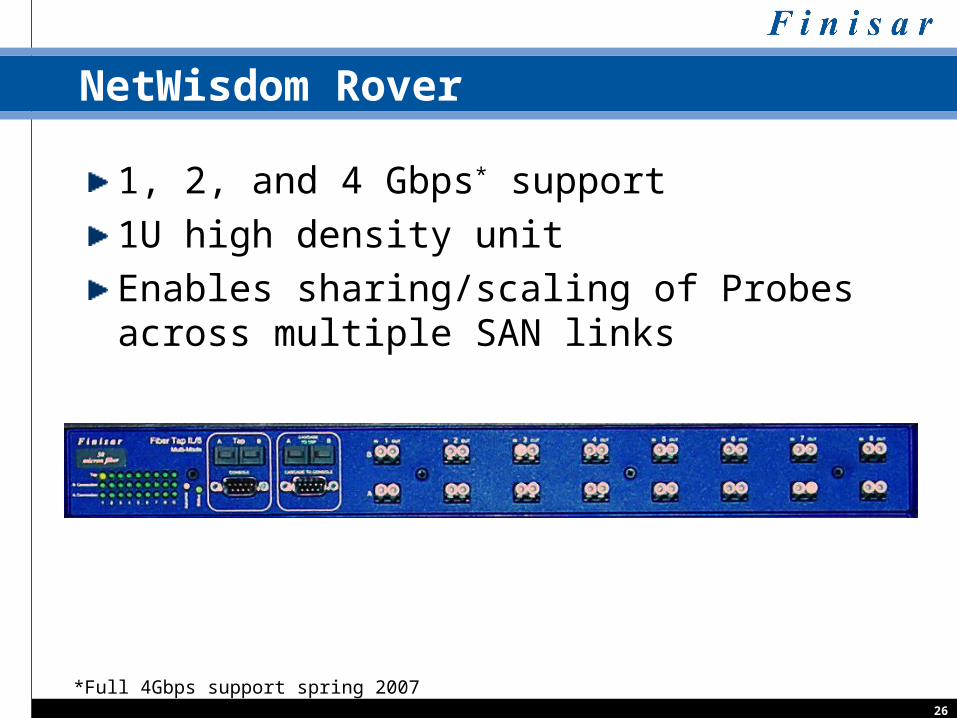
NetWisdom Rover
1, 2, and 4 Gbps* support
1U high density unit
Enables sharing/scaling of Probes across multiple SAN links
*Full 4Gbps support spring 2007

27
NetWisdom ProbeFCX Features
1, 2, and 4 Gbps support
Blade architecture, with 2 probes per blade
2U high density, 4 slot chassis
Dedicated monitoring via passive HD-TAPs

28
Solution: Remote Replication Availability
9/11. natural disasters, security concerns driving need for secure, remote site backup
Time to restore operations a major concern
Other tools provide little or no insight on impact of WAN performance on SAN operations
We can offer pre-install infrastructure assurance, post-install replication health check, and on-going replication assurance
29
Remote Replication Availability Solution
Pre-installation Remote Replication Infrastructure Provide a predictable process and shorten the time to production Verify the long distance connection is working in advance and meets the
planned capacity requirements Remote Replication Health Check Tune WAN expenditures to actual bandwidth consumption Capacity planning and usage Workflow versus bandwidth Verify replication goals (RPOs, RTOs)
Continuous Remote Replication Availability Detect Replication problems and slow downs before any data loss Verify compliance with DR policies (RPO, RTO)
30
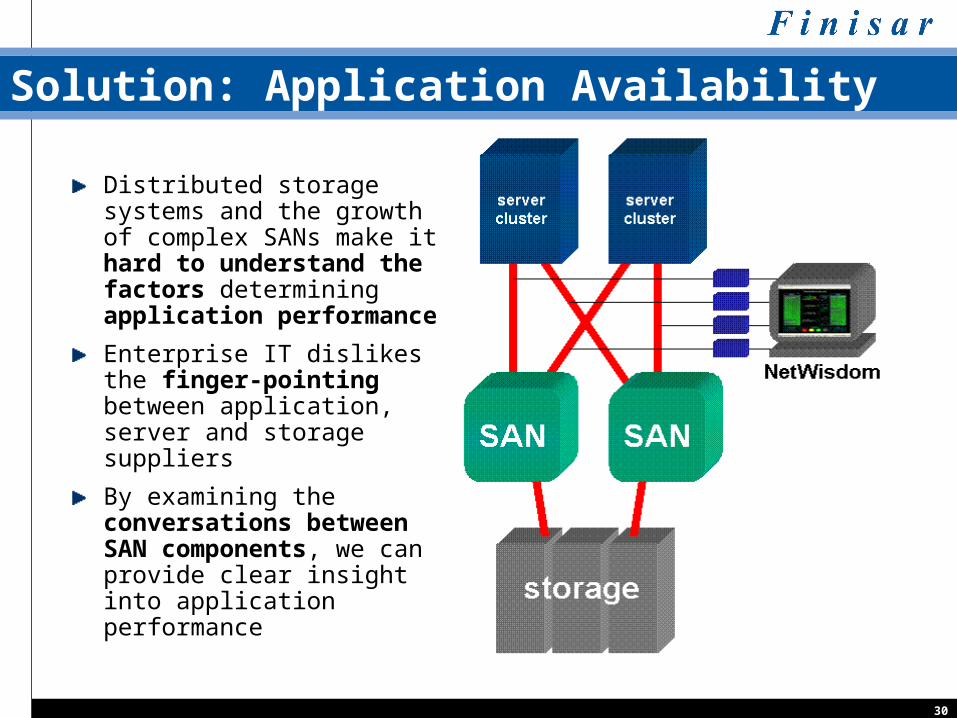
Solution: Application Availability
Distributed storage systems and the growth of complex SANs make it hard to understand the factors determining application performance
Enterprise IT dislikes the finger-pointing between application, server and storage suppliers
By examining the conversations between SAN components, we can provide clear insight into application performance

31
Application Availability Solution
Pre-installation Application Infrastructure Availability Verify the infrastructure is working in advance and meets the planned
capacity requirements for the applicationApplication Traffic Analysis Verify traffic capacity used by the application Verify traffic is flowing according to failover policy and configuration Verify traffic is clean – no protocol error pollution from failing devices,
overrun queues, CRCs, etc.Continuous Application Availability Detect Application traffic slow downs before they impact the users Correlates application level workloads to actual SAN traffic Detect impacts to the application traffic after configuration, firmware or
hardware changes in the SAN Detect failing devices Trend the application traffic capacity Automated front-end for trace creation for hardware vendor problem
analysis

32
Netwisdom Editions
Fibre channel link events for the sampling interval for a channel
(15 metrics)
# Loss of Sync# Loss of Signal# LIPs# NOS and OLS sequences# FC ELS Frames (PLOGI, etc.) # FC Service Frames# Fabric Frames (SOF(f) for E-port)# Basic Link Service Frames# Link Control Frames# Link ups (ret to idle after LOS, etc.)# SCSI Check condition status frames# SCSI Bad status Frames (queuefull.)# SCSI Task Mgmt Frames# FC code violations# Frame errors
Netwisdom Enterprise Edition Software/Hardware solution Data traffic/flow monitoring & analysis Key metrics include:

33
Netwisdom Enterprise Edition (cont.)
Fibre Channel Link Groups for the sampling interval for a channel (8 metrics)
# Logins Frames (FLOGI, PLOGI, etc)# Logouts (LOGO, PRLO, etc.)#Abort Seq Frames# Notification type frames (RSCN, etc.)#Reject type frames#Busy type frames (P_BSY, etc.)#Accept type frames# Loop Init Frames
SCSI Link Pending Exchange Metrics for the sampling interval for a channel (3 metrics)
# SCSI exchanges openedMin # of SCSI exchanges open at a timeMax # of SCSI exchanges open at a time
End Device Conversation Information for a ITL for the sampling interval for a channel(6 metrics)
# Frames/sec used by SCSI exchanges# MB of frame payload/sec between ITL# SCSI Task mgmt Frames # SCSI Bad status Frames # SCSI check condition status frames # SCSI exchanges aborted (ABTS)
34
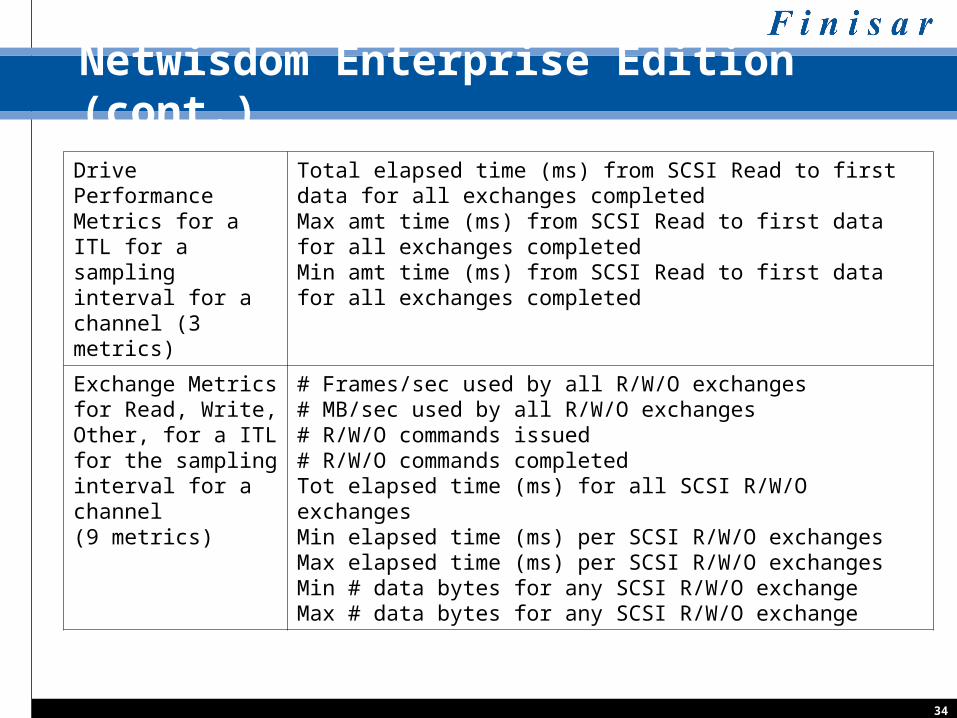
Netwisdom Enterprise Edition (cont.)
Drive Performance Metrics for a ITL for a sampling interval for a channel (3 metrics)
Total elapsed time (ms) from SCSI Read to first data for all exchanges completed Max amt time (ms) from SCSI Read to first data for all exchanges completed Min amt time (ms) from SCSI Read to first data for all exchanges completed
Exchange Metrics for Read, Write, Other, for a ITL for the sampling interval for a channel(9 metrics)
# Frames/sec used by all R/W/O exchanges# MB/sec used by all R/W/O exchanges# R/W/O commands issued# R/W/O commands completedTot elapsed time (ms) for all SCSI R/W/O exchangesMin elapsed time (ms) per SCSI R/W/O exchangesMax elapsed time (ms) per SCSI R/W/O exchangesMin # data bytes for any SCSI R/W/O exchangeMax # data bytes for any SCSI R/W/O exchange
35
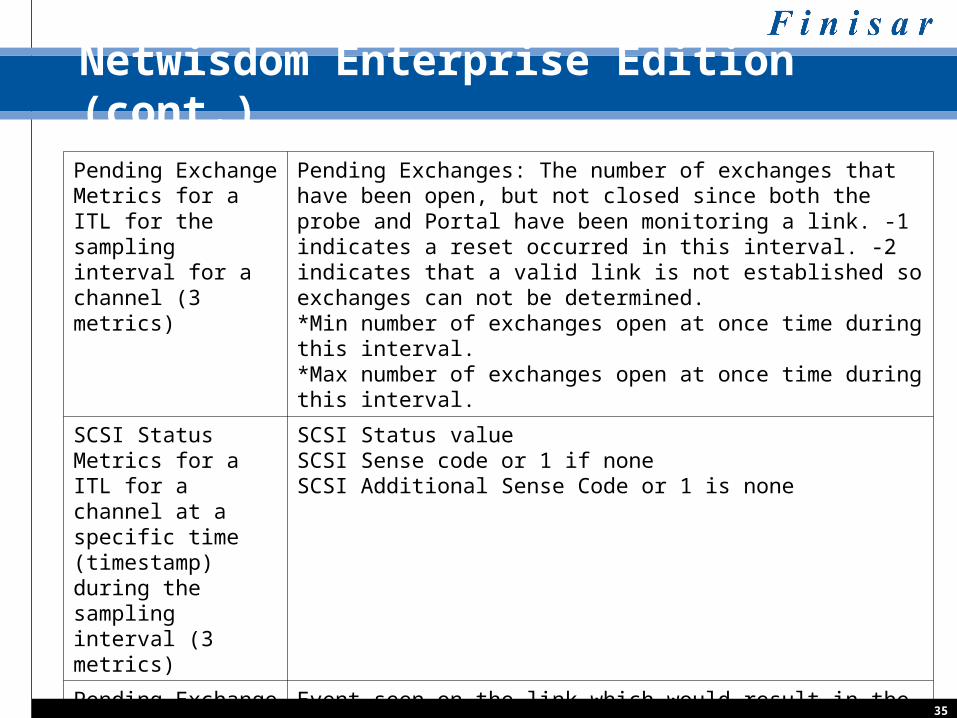
Netwisdom Enterprise Edition (cont.)
Pending Exchange Metrics for a ITL for the sampling interval for a channel (3 metrics)
Pending Exchanges: The number of exchanges that have been open, but not closed since both the probe and Portal have been monitoring a link. -1 indicates a reset occurred in this interval. -2 indicates that a valid link is not established so exchanges can not be determined.*Min number of exchanges open at once time during this interval.*Max number of exchanges open at once time during this interval.
SCSI Status Metrics for a ITL for a channel at a specific time (timestamp) during the sampling interval (3 metrics)
SCSI Status valueSCSI Sense code or 1 if noneSCSI Additional Sense Code or 1 is none
Pending Exchange Resets for a ITL
Event seen on the link which would result in the abortion of multiple pending exchanges. For example, if an initiator were to logout from a target, all pending exchanges between that initiator and target regardless of LUN should be reset to zero. The purpose of this is to tell the Portal to reset the pending exchanges for that particular initiator and target.