Embed Size (px)
Citation preview

Florida & Metro Forecast2014-2017
I n s t i t u t e f o r E c o n o m i c C o m p e t i t i v e n e s s
C o l l e g e o f B u s i n e s s A d m i n i s t r a t i o n
U n i v e r s i t y o f C e n t r a l F l o r i d a
P u b l i s h e d D e c e m b e r 2 0 1 4

A B O U T U N I V E R S I T Y O F C E N T R A L F L O R I D A ( U C F )
A B O U T T H E C O L L E G E O F B U S I N E S S A D M I N I S T R AT I O N

2014 - 2017
D e c e m b e r 2 0 1 4 R e p o r t
I n s t i t u t e f o r E c o n o m i c C o m p e t i t i v e n e s s
C o l l e g e o f B u s i n e s s A d m i n i s t r a t i o n
U n i v e r s i t y o f C e n t r a l F l o r i d a
FLORIDA FORECAST
Published quarterly by the Institute for Economic Competitiveness, College of Business Administration, University of Central Florida
Copyright © 2014 Institute for Economic Competitiveness. All rights reserved.
This forecast was prepared based upon assumptions reflecting the Institute for Economic Competitiveness’ judgments as of the date it bears. Actual results could vary materially from the forecast. Neither the Institute for Economic Competitiveness nor the University of Central Florida shall be held responsible as a consequence of any such variance. Unless approved by the Institute for Economic Competitiveness, the publication or distribution of this forecast and the preparation, publication or distribution of any excerpts from this forecast are prohibited.
Publications of the Institute for Economic Competitiveness are made possible by the following staff:
Dr. Sean Snaith, DirectorAngela Ayala, Administrative AssistantJonathan Fagbohungbe, ResearcherAshley Miller, ResearcherTrevi Sellers, Researcher

TA
BL
E O
F C
ON
TE
NT
S
TABLE OF CONTENTS
Florida Highlights and Summary ....................... 5-12
Florida Forecast Tables ..................................... 13-18
Florida Forecast Charts ..................................... 19-27
Florida News Summaries ...................................... 28
Deltona-Daytona Beach-Ormond Beach ......... 30-34
Gainesville ........................................................ 35-39
Jacksonville ...................................................... 40-44
Lakeland ........................................................... 45-49
Miami-Fort Lauderdale-Pompano Beach ......... 50-54
Naples-Marco Island ........................................ 55-59
Ocala ................................................................ 60-64
Orlando-Kissimmee ......................................... 65-69
Palm Bay-Melbourne-Titusville ........................ 70-74
Pensacola-Ferry Pass-Brent ............................. 75-79
Tallahassee ....................................................... 80-84
Tampa-St. Petersburg-Clearwater ................... 85-89
Industry Location Quotient .................................... 90

F L O R I D A H I G H L I G H T S
Institute for Economic Competitiveness 5
• Kris Kringle has nothing on the Sunshine State. That 34th street miracle pales in comparison to the economic miracle in the 27th state.
• During 2014-2017 it is expected that Florida’s economy, as measured by real state GDP, will expand at an average annual rate of 2.8%, and that payroll job creation will average an annual pace of 2.2%. Both remain stronger than the pace expected for the national economy.
• As of October 2014, 39.9% of single-family home transactions in Florida were cash sales, down from 44.3% a year earlier. The share of cash purchases has declined year over year since June 2013. Investors may be reaching their fill of Florida residential real estate. Will traditional buyers pick up the slack?
• Payroll job growth year over year should average 2.8% in 2014, 2.3% in 2015, 1.9% in 2016, and 1.6% in 2017. It will be the 4th quarter of 2015 before payrolls recover to their pre-recession highs.
• Labor force growth in Florida will average 2.0% from 2014-2017. The faster pace of job creation has breathed new life into Florida’s labor market. The improved prospect of finding a job is putting more Floridians back on the job hunt.
• The growing labor force and rising labor force participation rate (60.6% in October 2014) will make lowering the unemployment rate more challenging. The pace of decline will slow dramatically (and could reverse direction in any given month) as labor force growth picks up. As a result of this headwind, the unemployment rate should still hover around 5.8% by the end of 2017.
• In Florida, Underemployment (U-6), a broader measure of labor market weakness than headline unemployment (U-3), remains at 13.4% through the 3rd quarter of 2014, down from 19.3% in 2010.
• The sectors expected to have the strongest average job growth during 2014-2017 are Construction (9.2%), Professional and Business Services (3.5%), Trade, Transportation & Utilities (3.3%), Leisure & Hospitality (2.0%), and Education & Health Services (1.9%).
• Housing starts continue to rise, but the pace of increase drops as interest rates rise. Total starts will be almost 83,400 in 2014, just over 111,500 in 2015, hit 133,700 in 2016, and level off at nearly 150,500 in 2017.
• Real Gross State Product (RGSP) will expand 2.6% in 2014; growth will be 2.7% in 2015 and 2.8% in 2016 before rising to 3.0% in 2017. Average growth will be 2.8% during 2014-2017, 0.4 percentage points faster than average U.S. GDP growth.
• Over 2014-2017 real personal income growth will accelerate and average 3.7%, with 3.5% growth in 2014 rising up to 4.2% growth in 2017.
• Retail sales will grow at an average pace of 4.5% during 2014-2017, with lower gasoline prices raising consumer confidence and disposable incomes.
H I G H L I G H T S O F T H E D E C E M B E R 2 0 1 4 F L O R I D A F O R E C A S T 2 0 1 4 - 2 0 1 7

F L O R I D A S U M M A R Y
6 Florida & Metro Forecast - December 2014
The October 2014 single-family home report released by Florida Realtors continues to depict a housing market that is improving at a slower pace. The median sales price for single-family homes increased $7,804 in October 2014 year over year and now stands at $177,000, a year-over-year price appreciation of 4.6%. Price appreciation in the townhome/condominium market slowed to 7.7% as the median sales price increased $10,000 year over year and registered $139,900 in October.
Inventories of single-family homes in October are up slightly from a year ago and are now 5.4 months, which according to the Florida Realtors report indicates a balance in the single-family market slightly favoring sellers1.
Inventories of condominiums rose from their level of 5.6 months’ supply back in October of 2013 and are now 5.9 months, which according to the Florida Realtors report indicates a balance in the condo market that is tipping in favor of buyers.
Distressed sales of single-family homes in the form of short sales are continuing to contract year over year (-48.0%), but foreclosure/REO sales are up versus October 2013 (38.8%), and traditional sales were up 18.6% year over year in October 2014.
Distressed sales of condos in the form of short sales are rapidly contracting year over year (-55.6%), but foreclosure/REO sales are up versus October 2014 (24.0%), while traditional sales were up 11.6% in October 2014 compared to October 2013.
The percentage of closed sales of single-family homes that were cash transactions stood at 39.9% in October 2014. For condos that figure was even higher as 65.3% of all closings were cash transactions. Both of these markets’ shares of cash transactions have fallen during the course of 2014, which may suggest a waning role of investors in Florida’s housing market.
The declining, though still high, levels of investor activity in residential real estate around the state continue to drive these high percentages of cash transactions.
1 According to the Florida Realtors, the benchmark for a balanced market (favoring neither buyer nor seller) is 5.5 months of inventory. Higher numbers indicate a buyers’ market, lower numbers a sellers’ market.
International buyers and individuals who are able to liquidate financial assets, whose values have soared in recent years, allowing them to make cash purchases are helping sustain these levels.
Will traditional buyers of homes in Florida be able to fill the vacuum as investors become less active in Florida’s residential real estate market? This transition will ultimately determine the path that the housing market follows in 2014 and beyond. Since traditional buyers are finance dependent, mortgage availability will be a primary determinant of how smoothly this transition from investors to traditional individual buyers transpires. Mortgage credit availability data raises the concern that this transition may be rocky.
The Mortgage Bankers Association’s Credit Availability Index has crept slightly higher since sliding at the start of 2014. It currently stands at 113.2, down from 116.1 in September 2014. The index is benchmarked to 100 in March 2012, and to get a sense of how far housing finance has contracted, the Mortgage Bankers Association recently released historical estimates of its Credit Availability Index stretching back ten years. The availability of mortgage credit has been dramatically curtailed relative to pre-recession levels. In 2006 the index was just under 869!
New regulations on qualified mortgages, part of the massive Dodd-Frank financial regulation law, are in effect. Higher capital standards for banks and stringent underwriting standards continue to impact lending.
Current levels of the mortgage credit availability index are only 13.0% of the 2006 peak levels. While the recklessly easy mortgage credit environment of 2006 should not have come to pass, the current tightness in the mortgage market with the availability of mortgages at a mere fraction of prerecession levels is not consistent with a housing market recovery maintaining momentum. Indeed in 2014 we watched price appreciation slow from solid double-digit levels to the sub 5.0% rate that has been the average over the last 3 months.
Figure 1 depicts the monthly realtor sales of existing single-family homes, as well as the 12-month moving average of these sales depicted as the less volatile of the two lines by smoothing out the seasonality in the housing market monthly data. Sales continue on an
FLORIDA’S HOUSING MARKET

F L O R I D A S U M M A R Y
Institute for Economic Competitiveness 7
upward trajectory after bottoming out in early 2008. The economic and demographic drivers of the housing market in Florida continue to strengthen. Job growth in Florida continues to outperform the labor market nationally, and the aging Baby Boomers bode well for continued population growth via the in-migration of
retirees to Florida. As the fundamentals of a healthy housing market in Florida continue to improve, we expect that the upward trend in sales will continue. This continued improvement in the housing market will be increasingly dependent on normalization of mortgage credit availability.
Figure 2 displays median sales prices for single-family existing homes. Median sales prices bottomed out until 2011, but since then have been on an upward climb. As stated in an earlier Florida & Metro forecast, the double-digit pace of price increases was not sustainable, and in 2014 the pace has slowed. Over the past year, the 12-month moving average of median sales prices has risen by nearly $11,700, up 7.1% from a year ago. This recovery in the housing market is a critical component of Florida’s continued economic recovery, and if price appreciation is sustained, it will help feed economic growth over the next several years.
Homeowners are still well below the levels of home equity wealth they had seen at the peak of the housing market (median prices are currently $80,800 below the 2006 peak of $257,800), but rising prices have allowed some homeowners to escape after being trapped in mortgages that were underwater for years. However, a high percentage of Floridians still remain underwater in their mortgages. RealtyTrac puts the percentage of mortgage holders in Florida that are severely underwater in their mortgage at 28%.
Florida’s housing market continues its recovery, but the upward progress is being met with an increasing headwind. There is
still a lot of damage that has yet to be repaired and it will be years before the housing market could be considered fully recovered.
If the availability of mortgage credit does not improve over the next couple years, and if the share of cash
Source: Florida Realtors
0
5,000
10,000
15,000
20,000
25,000
30,000
FloridaSingle-Family, Existing Homes
Realtor Sales Total
Moving Average
Figure 1.
Source: Florida Realtors
$0
$50,000
$100,000
$150,000
$200,000
$250,000
$300,000
FloridaSingle-Family, Existing Homes
Median Sales Price Dollars
Moving Average
Figure 2.

F L O R I D A S U M M A R Y
8 Florida & Metro Forecast - December 2014
transactions declines as we are predicting they will, the demand for housing will be curtailed and this mortgage credit crunch will sap any remaining strength from the housing market’s recovery in Florida. In 2014 we have seen the signs of this weakening manifest itself in the form of slower rates of price appreciation, and in absence of an easing of the mortgage credit crunch; we expect to see this pattern continue throughout the forecast horizon.
OUTLOOK FOR FLORIDA 2014-2017GROSS STATE PRODUCTA Miracle in the 27th State?
Real Gross State Product (RGSP) growth in Florida is still expected to grow at a faster pace than we are forecasting for the U.S. economy over the next four years. Florida’s recession started before and ended well after the national recession. While no official dating of the business cycle is done at the state level, I would suggest that Florida spent an additional 32 months in recession compared to the U.S. as a whole.
Thirty-two months longer.That is just two months shy of the total number of
months the U.S. spent in recession over the past three recessions–combined.
This later end date for the recession in Florida indicates that Florida’s recession lasted 50 months in total, more than four full years. That is longer than the combined length of the past four recessions in the United States, which stretches back to 1981.
In 2012 Florida finally got back up off of the canvas after being knocked out cold by that Category 5 recession, and the economy grew at a modest rate of 2.2%. In 2013 the economy stayed at that pace of growth as rising consumer confidence, the housing market recovery, population growth, and the continuing progress in labor market helped set the stage for faster economic growth in the state.
These improvements in the fundamentals of the state’s economy will accelerate growth in 2014, 2015, 2016, and 2017 when Real GSP is expected to grow 2.6%, 2.7%, 2.8%, and 3.0% respectively.
This average growth of 2.8% through 2017 may be small in comparison to the 6.7% growth rate the state experienced in 2005, but it is based more on improvements in the fundamental drivers of the state’s economy and a more sustainable fiscal situation in state and local government. It is also higher than the average of our forecasted growth for the U.S. economy.
Housing prices have made a strong upward movement from the depths to which they plunged during the housing crisis. In the crisis, median home prices fell to a low of $122,200 but now are at a current level of $177,000. This price appreciation is repairing damage to Floridians’ household balance sheets, but it will take many more years to recover all the wealth that was lost when the housing market collapsed and housing prices plummeted from their median price high of $257,800.
Rising house prices are lifting more mortgage holders in the state above the surface of the water for the first time in several years, providing some financial breathing room, though thousands of Floridians remain deeply underwater in their mortgages. Despite this progress and as noted above, RealtyTrac estimates that 28% of mortgaged homes in Florida are deeply underwater.
Nominal Gross State Product continues to rise toward the $1 trillion mark, surpassing $963 billion in 2017, an increase of $163 billion from 2013 and $242 billion from 2009. In 2018 Florida will break that $1 trillion mark.
If the national economic policy and regulatory environment were more of a catalyst instead of becoming ever more restrictive as we discussed in the December 2014 U.S. Forecast, the outlook for Florida’s economy would be even brighter.
As we have gained some historical perspective and examined the revised data on the recession and subsequent recovery in Florida, the economic turnaround is looking more like a miracle that would surely put a twinkle in Kris Kringle’s eye.
PERSONAL INCOME, RETAIL SALES, AND AUTO SALES
Personal income growth in Florida lost momentum in 2013 as a number of factors conspired to bring about deceleration. One full year of sequester spending cuts took place, the payroll tax cut expired, dividend payments dropped off as many companies paid dividends at the end

F L O R I D A S U M M A R Y
Institute for Economic Competitiveness 9
of 2012 to avoid rising dividend tax rates in 2013, and a federal government shutdown took place. This led to a deceleration of personal income growth in Florida from 3.3% in 2012 to 2.4% in 2013.
This lost momentum in personal income growth has returned in 2014, and is expected to be preserved through the end of 2017. In 2014 Florida will experience personal income growth of 4.9%. That growth will ease slightly in 2015 as personal income growth comes in at 4.5%. From there it will accelerate to 5.1% in 2016, and then to 5.8% in 2017. After six years with personal income growth lower than the national rate, these positions reversed in 2013 as personal income growth in Florida grew 2.9% while U.S. growth was just 2.0%. Florida is expected to continue to outpace the nation with personal income growth that is an average of 0.7 of a percentage point higher than the national average growth for 2014 through 2017. Personal income growth during 2014-2017 will average 5.1% in Florida. Personal income will reach in excess of $989 trillion in 2017, with personal income growing nearly $55 billion that final year of our forecast.
In 2014 real disposable income growth will average 3.4%, up from the previous year’s 0.1%. Average growth during 2014-2017, however, will be a more robust 3.6% with growth peaking at 4.3% in 2017.
Financial markets have prospered since the low point of the financial crisis due in large part to the Federal Reserve Bank’s zero interest rate policy coupled with three subsequently larger rounds of quantitative easing. The Dow Jones Industrial Average fell to the 6,600 level in March of 2009, but has since surged back to exceed 17,000, though volatility has increased in recent days. The bond market also continues a strong bull run. Both of these runs will likely be over as the Fed implements interest rate hikes commencing in late 2015.
As a result of this bull run, financial assets held by U.S. households have values that are $27.2 trillion higher than the 2009 nadir of the financial crisis levels, and $15.4 trillion higher than prerecession peaks. Unfortunately, the same cannot be said for home equity wealth held by America’s households. That wealth is still over $2.3 trillion lower than 2005 highs, but home equity wealth has made sizable progress from the bottom of the housing crisis. U.S. households now hold $4.8 trillion more home equity wealth then they held at the low point of the housing market.
The housing market in Florida has not recovered as rapidly or as completely as financial markets have, but housing prices have been rising over the past couple years. The $2.3 trillion dollars in home equity still lost nationwide could take many years to recover with the housing recovery facing a stiffening headwind over the next several years. In Florida, this wealth effect will continue to weigh upon consumer spending through the end of 2017. As noted twice earlier, 28% of Florida’s mortgage holders are still severely underwater in their mortgages.
Years of persistently high unemployment and even higher underemployment compounded the effects of lost housing wealth on consumer spending in Florida. As the labor market in Florida continues to show an acceleration of job creation, there will be a boost in both consumer confidence and spending. Plummeting gasoline prices further buoy confidence and serve as a boost to retail sales outside of gasoline, with more money staying in consumers’ pockets that previously went into the tank.
Retail sales in Florida grew robustly in 2010 and 2011. Part of that growth was due to higher gasoline prices, but it also reflected an ongoing release of pent-up demand by Florida’s consumers as well as spending by domestic and international tourists. As the labor market recovery builds momentum and as more home equity wealth is recovered, retail spending will begin to recover across a broad array of sectors in the economy. The average year-over-year growth rate of retail sales will be over 4.5% during 2014-2017.
When the national recession came to an end, replacement needs and pent-up demand drove light vehicle sales significantly higher. Consumers began to purchase vehicles again after the recession’s end. This replacement demand has been reflected in national sales data despite the historically weak recovery, and earlier in the recovery reflected in consumer’s light vehicle demand. Vehicle registration growth in Florida exhibited that pent-up demand during 2010-2013 when registrations grew at a year-over-year average rate of near 12.0%. This burst followed three years during which registrations contracted at an average rate of near 20.0%.
The venting of pent-up demand being over means more modest growth in vehicle registration in Florida during 2014-2017 despite increased incentives and plentiful financing even to sub-prime borrowers. Over this period,

F L O R I D A S U M M A R Y
10 Florida & Metro Forecast - December 2014
vehicle registration in Florida is expected to average around 5.1%, with 2014 doing most of the heavy lifting in that average. Beyond 2014, growth will average a more modest 3.5% the following three years.
In 2017, Florida’s new passenger car and truck registrations will reach more than 1.34 million, representing an increase of over 634,000 registrations from the 2009 bottom. However, this much-improved level is still below the 2005 peak level of 1.45 million registrations during the height of the economic boom. EMPLOYMENT
Florida’s labor market recovery continues to outpace the recovery in the national job market. In 2013, payroll job growth was 2.5%. This is much stronger when compared to the national rate of job creation, which was 1.7% for the same year. In 2014, the labor market in Florida accelerated with job growth of 2.8%. Payroll job growth will ease to 2.3% in 2015 and 1.9% in 2016, before easing to 1.6% in 2017. Florida will outpace national job growth over the entire forecast horizon by an average of 0.8% over 2014-2017.
The Construction sector has broken free its terrible legacy. Devastated by the housing market’s collapse, it suffered job losses five straight years at an average annual rate of -12.9%. In 2009 alone, the sector had year-over-year job loss at a rate of -23.1%. Job growth finally returned in 2012 and continued to build momentum, exceeding 10% in 2014.
Construction job growth is expected to surge to 10.4% in 2014 before settling at 8.7% in 2015, 8.8% in 2016, and easing higher to 8.9% in 2017. Average annual job growth during 2014-2017 will be 9.2%. Construction will be the fastest growing sector in the state’s economy through 2017. This high-level employment growth may at first glance overstate the strength of the recovery in this sector since it is being calculated from a considerably lower base of employment.
The Professional and Business Services sector will be the state’s second fastest growing sector on average through 2017. Job growth in this sector is expected to be healthy, averaging 3.5% during 2014-2017. Job growth during the first four years of the sector’s recovery averaged 3.0%, but over the next four years it will see more robust growth. Job growth will hit 3.9% in 2014 before easing to 3.7% in 2015 and 2016. This sector, which includes
almost exclusively white collar businesses from law firms to notaries to advertising and PR firms, recovered jobs lost during the recession quickly and has already reached pre-recession peak levels of employment.
The Information sector in Florida experienced year-over-year job growth in 2013 for the first time since 2005. The industry is still roiled by changes as the gathering and delivery of information continues its rapid evolution. The traditional print and radio industry within the sector will be stagnant as the news industry continues to evolve under the unrelenting pressure from smaller digital channels of information dissemination. Sources of growth within this sector, such as software development, data processing and hosting, and wireless telecommunications, will help offset the loss of jobs in legacy media.
Mild annual job growth of 0.2% returned to the Information sector in 2013. After 1.3% growth in 2014 and 2015, growth will then rise to 1.7% in 2016. Average growth of 1.2% is expected during 2014-2017.
The Education and Health Services sector remained immune to the recession that wreaked havoc on most sectors of Florida’s economy. The Health Services sector actually continued to add jobs throughout the recession and continues to do so. This is the only sector of Florida’s economy that performed this recession-defying feat, and it is expected to continue to grow through the end of 2017. During 2014-2017 employment in this sector is expected to expand at an average rate of 1.9%.
Persistent uncertainty surrounding the Affordable Care Act’s impact on healthcare in the face of impending implementation of the law’s mandates and the growing concern about the fiscal feasibility of the law itself casts a pall over this sector. Healthcare providers continue to feel their way along, slowly navigating the multitude of uncertainties this law creates.
Regardless of the law’s ultimate fate in front of the Supreme Court, there will be expanded insurance coverage as a result of the passage of the law, and this expansion coupled with the aging of our already older-than-average population guarantees that the demand for health services in Florida should remain strong. This demand will continue to drive job growth in the Health and Education sector.
Manufacturing employment expanded in Florida at an average rate of 1.6% in 2012, but in 2013 growth eased as domestic and global economic environments weakened.

F L O R I D A S U M M A R Y
Institute for Economic Competitiveness 11
The weakening of economic expansions along with a series of minor crises in emerging economies, growing concern over a slowdown in China, a strengthening U.S. dollar, and persistent struggles in Europe will drive down job growth in the manufacturing sector beyond 2014.
After stumbling slightly in 2013, we are expecting to see job growth of 2.0% in manufacturing for the full year in 2014, followed by a year of milder job growth in 2015 when manufacturing employment will expand at a rate of 1.0%. Manufacturing is expected to revisit the job losses that have come to characterize the sector. In 2016 job growth is expected to be -0.9%, and the sector shrinks further in 2017 with employment growth at -0.6%.
The State & Local Government sector is seeing improved revenue streams, and budgets are recovering after being emaciated by the recession and housing crisis. The budgetary crisis impacted governments at all levels in Florida. Consequently, job losses in this sector persisted for five years extending through 2013. In 2014, job losses in the State and Local Government sector ended but growth was still non-existent. From this point, growth will remain positive and accelerate year over year, averaging 0.7% during 2015-2017. As Florida’s population and economy continue to grow, the demand for state and local government services will grow and employment growth will be a necessary part of the solution to meet the demands of our growing economy. State and local government will remain cautious in hiring. The housing bubble filled state and local government coffers to the point of overflow. The subsequent budget slashing that was necessitated as revenues plummeted forced local government to learn how to do more with less. This hard-learned lesson in austerity will keep the pace of job growth suppressed through the next several years while still being able to meet the growing demand for services.
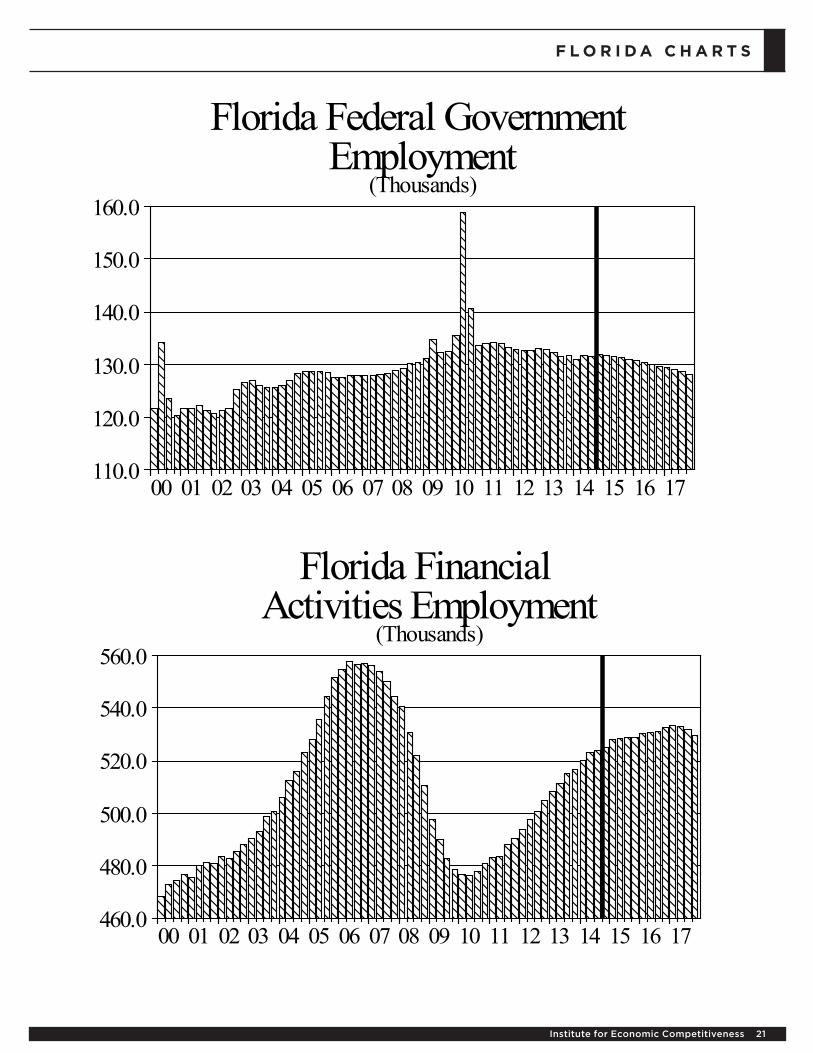
The outlook for Federal Government employment growth in Florida on the other hand, continues to be negative through the end of our 2017 forecast horizon. Any solution to our federal deficit and debt problems will require more revenue, but ultimately cuts in federal spending will be necessitated as well. As the Fed eventually embarks on a cycle of interest rate hikes in late 2015, the burden of servicing a national debt that is in excess of $18 trillion will consume a larger slice of federal tax revenue pie. This increasing share will have to come from somewhere, and the portion of federal tax revenue that goes toward discretionary spending will, by necessity,
get smaller. It is unlikely that there will be layoffs, but as federal employees retire or otherwise leave positions in the years ahead many of these posts will remain unfilled. It will likely be 2020 before the decennial census drives the first expansion in Federal Government employment in Florida since 2010. Employment in the sector will contract at an average rate of 0.6% during 2014-2017.
UNEMPLOYMENTThe unemployment rate in Florida continues to fall,
standing at 6.0% as of October 2014. Unemployment has substantially declined from its peak, and after spending many years above the national rate of unemployment, Florida’s unemployment rate is now 0.2 percentage points above that of the nation as a whole. These declines in the unemployment rate earlier in the recovery in Florida and the nation were in part driven by a shrinking labor force participation rate. Florida’s labor force participation in October stood at 60.6%, up from 59.9% a year earlier. The national labor force participation rate, however, stood at 62.8% in November 2014, the lowest since March 1978 and down 3.4 percentage points from the start of the recession.
Understanding these different trends in the labor force participation rate in Florida relative to the nation as a whole is critical to understanding comparative movements in the unemployment rate going forward. If Florida continues to see a rising labor force participation rate while the national rate languishes, it is likely we will see the unemployment rate in Florida continue to remain above that of the nation as a whole. As counterintuitive as it may seem, this will be evidence that Florida’s labor market is healing faster than the national labor market.
The unemployment rate in Florida, 6.0% in October 2014, represents a 5.4 percentage point decline from the peak unemployment rate in 2010.
We are forecasting stronger economic growth in Florida over the forecast horizon as well as continued strong payroll job growth. This faster economic growth, however, will be faced with a headwind of a rising labor force participation rate that will make progress in reducing the unemployment rate a more challenging task. We expect the labor force to grow more rapidly during 2014-2017 as job seekers become encouraged by job growth in the state and reenter the labor force. This will have a net result of seeing modest declines in

F L O R I D A S U M M A R Y
12 Florida & Metro Forecast - December 2014
unemployment rates and the occasional increase in the unemployment rate in Florida on a month-to-month basis.
The labor force in Florida is expected to grow an average of 2.0% during 2014-2017. That compares to an average growth rate of just 0.9% during the four years prior. As a result, the unemployment rate is expected to continue to hover around the 5.8% level during 2015- 2017. This will represent a decline in the average unemployment rate of just 0.2% during 2014-2017. Contrast that modest dip to the previous four years decline of 4.1 percentage points while the labor market did not face the stiff headwinds of a rapidly growing labor force.
Nationally and in Florida, the levels of underemployment—those who are working part-time but not by their choice, and workers marginally attached to the labor force (those who are neither working nor currently looking for work, but indicate that they want and are available for a job, and have looked for work sometime in the past twelve months)—are still elevated. When adding these workers to the headline unemployment figure we get the broadest measure of unemployment known as U-6. Looking at U-6 we see a labor market still deeply damaged, as U-6 in Florida averaged 13.4% for the four quarters ending in Q3 2014 according to the Bureau of Labor Statistics, while the national rate of U-6 stands at 12.5 over that same period.
While U-6 is down from its 2012 reading of 16.0%, the current rate still reflects more depth of the damage to the labor market in Florida than might be reflected in the current headline unemployment rate of 6.0%.
As the employer mandates of the Affordable Care Act are finally enforced in the next few years, the potential for increasing levels of underemployment in response to the full/part-time distinction in the law will require continued scrutiny of U-6 at the national and state level to fully gauge the impact of the healthcare law on the labor market.

F L O R I D A S U M M A R Y TA B L E S
Institute for Economic Competitiveness 13
Table 1. Annual Summary of the University of Central Florida Forecast for Florida
2009 2010 2011 2012 2013 2014 2015 2016 2017
Personal Income (Bil. $) 696.7 725.2 767.4 793.0 811.4 850.9 888.9 934.6 989.2Florida.(%Ch Year ago) -5.3 4.1 5.8 3.3 2.4 4.9 4.5 5.1 5.8U.S.(%Ch Year ago) -2.8 2.8 6.2 5.2 2.0 4.2 4.1 4.4 4.9Personal Income (Bil. 2005$) 696.7 713.3 736.9 747.6 755.9 782.0 808.3 838.7 873.7Florida.(%Ch Year ago) -5.2 2.4 3.3 1.5 1.1 3.5 3.4 3.8 4.2U.S.(%Ch Year ago) -2.7 1.2 3.7 3.3 0.8 2.8 3.0 3.1 3.3Disp. Income (Bil. 2005$) 643.2 658.8 673.1 679.3 680.1 703.2 725.4 751.8 784.1Florida.(%Ch Year ago) -3.4 2.5 2.2 0.9 0.1 3.4 3.2 3.6 4.3U.S.(%Ch Year ago) -0.4 1.0 2.5 3.0 -0.2 2.7 2.5 3.0 3.4GSP (Bil. $) 721.7 728.6 736.4 769.0 800.5 837.0 877.2 918.1 963.3(%Ch Year ago) -4.1 1.0 1.1 4.4 4.1 4.6 4.8 4.7 4.9GSP (Bil. 2005$) 721.7 721.0 718.2 734.3 750.5 770.3 791.5 813.7 837.7(%Ch Year ago) -6.1 -0.1 -0.4 2.2 2.2 2.6 2.7 2.8 3.0
Employment -5.7 -0.1 2.2 2.9 2.4 3.0 2.6 2.1 1.9Labor Force -1.4 0.9 1.1 1.1 0.7 1.9 2.2 2.1 1.9FL Unemployment Rate (%) 10.4 11.3 10.3 8.8 7.2 6.2 5.8 5.7 5.8U.S. Unemployment Rate (%) 9.3 9.6 8.9 8.1 7.4 6.2 5.8 5.8 5.8
Total Nonfarm U.S. -4.3 -0.7 1.2 1.7 1.7 1.8 1.7 1.2 1.0 Florida -6.3 -0.8 1.1 2.0 2.5 2.8 2.3 1.9 1.6Mining -11.5 -0.5 4.0 -0.3 0.3 3.4 0.8 -2.0 -0.2Construction -23.1 -11.2 -4.4 1.9 7.5 10.4 8.7 8.8 8.9Manufacturing -12.7 -4.5 1.1 1.6 1.4 2.0 1.0 -0.2 -0.5Nondurable Goods -10.0 -3.6 0.8 1.1 -0.5 -0.6 -0.1 -0.9 -0.6Durable Goods -14.0 -4.9 1.3 1.8 2.4 3.3 1.6 0.1 -0.4Trans. Warehs. & Utility -6.6 -2.0 3.7 2.2 2.7 3.6 2.6 3.7 3.4Wholesale Trade -7.9 -2.8 -0.3 1.8 1.0 2.2 2.0 2.5 2.5Retail Trade -6.6 0.2 2.3 2.4 2.8 3.1 1.8 -0.1 -0.5Financial Activities -7.3 -1.9 1.8 2.7 2.7 2.0 1.0 0.5 0.2Prof. and Business Services -8.2 1.2 3.0 3.7 4.0 3.9 3.7 3.7 2.8Edu & Health Services 1.2 1.9 1.9 1.7 1.7 2.0 2.4 2.1 1.4Leisure & Hospitality -4.5 0.5 2.8 4.2 3.9 3.6 2.3 1.1 1.1Information -8.5 -4.6 -1.0 -1.6 0.2 1.3 1.3 1.7 0.7Federal Gov't. 2.3 7.2 -5.4 -0.8 -0.5 -0.4 -0.1 -1.0 -1.0State & Local Gov't. -1.5 -1.2 -1.1 -1.4 -0.2 0.0 0.2 0.7 1.2
Population (thous) 18,682.3 18,879.7 19,113.0 19,349.2 19,581.9 19,817.7 20,085.0 20,379.1 20,694.0(%Ch Year ago) 0.8 1.1 1.2 1.2 1.2 1.2 1.3 1.5 1.5Net Migration (thous) 106.8 168.1 198.9 199.6 200.7 208.5 243.0 258.2 269.4(%Ch Year ago) 42.5 70.3 22.6 0.4 0.6 3.9 16.8 6.3 4.4
Housing Starts Tot. Private (thous) 33.7 38.1 41.6 59.7 81.2 83.4 111.6 133.7 150.5Housing Starts Single Family (thous) 26.8 31.8 32.0 42.8 55.0 57.8 74.3 87.2 103.2Housing Starts Multi-Family (thous) 6.9 6.3 9.6 16.9 26.1 25.6 37.3 46.5 47.3
(%Ch Year ago) -0.2 1.2 3.1 1.9 1.5 2.0 1.1 1.5 2.0Consumer Prices
Housing
Population and Migration
NonFarm Employment (Payroll Survey % Change Year Ago)
Employment and Labor Force (Household Survey % Change Year Ago)
Personal Income and GSP

F L O R I D A S U M M A R Y TA B L E S
14 Florida & Metro Forecast - December 2014
Table 2. Quarterly Summary of the University of Central Florida Forecast for Florida*
2014Q4 2015Q1 2015Q2 2015Q3 2015Q4 2016Q1 2016Q2 2016Q3 2016Q4 2017Q1 2017Q2 2017Q3 2017Q4
Personal Income (Bil. $) 865.8 876.0 884.0 892.6 902.9 916.3 927.6 940.3 954.1 969.3 982.7 995.7 1008.9Florida.(%Ch Year ago) 5.4 5.1 4.3 4.2 4.3 4.6 4.9 5.3 5.7 5.8 5.9 5.9 5.7U.S.(%Ch Year ago) 4.8 4.7 4.0 3.9 3.9 4.1 4.3 4.5 4.8 4.9 5.0 5.0 4.9Personal Income (Bil. 2005$) 793.2 801.1 805.4 809.9 816.9 826.7 834.2 842.3 851.6 861.9 869.5 877.6 885.8Florida.(%Ch Year ago) 4.0 4.0 3.4 3.1 3.0 3.2 3.6 4.0 4.3 4.3 4.2 4.2 4.0U.S.(%Ch Year ago) 3.5 3.5 3.1 2.8 2.6 2.7 3.0 3.2 3.4 3.3 3.3 3.3 3.2Disp. Income (Bil. 2005$) 714.4 719.9 722.7 726.6 732.4 740.5 747.4 755.3 764.1 772.1 779.7 788.1 796.5Florida.(%Ch Year ago) 4.2 4.1 3.4 2.6 2.5 2.9 3.4 3.9 4.3 4.3 4.3 4.3 4.2U.S.(%Ch Year ago) 3.4 3.2 2.5 2.3 2.1 2.4 2.8 3.2 3.5 3.4 3.4 3.4 3.4GSP (Bil. $) 853.3 862.8 872.2 882.5 891.3 900.9 912.0 923.8 935.7 946.5 957.8 968.6 980.2(%Ch Year ago) 4.5 5.6 4.6 4.6 4.5 4.4 4.6 4.7 5.0 5.1 5.0 4.9 4.8GSP (Bil. 2005$) 778.9 783.9 788.6 794.3 799.1 804.0 810.2 816.8 823.7 829.1 834.8 840.4 846.5(%Ch Year ago) 2.5 3.4 2.6 2.5 2.6 2.6 2.7 2.8 3.1 3.1 3.0 2.9 2.8
Employment 3.2 2.6 2.3 3.0 2.7 2.4 2.1 1.9 2.0 2.0 1.9 1.8 1.7Labor Force 2.6 2.3 1.8 2.4 2.4 2.2 2.1 2.0 2.0 2.0 1.9 1.9 1.8FL Unemployment Rate (%) 6.0 5.9 5.8 5.7 5.7 5.7 5.8 5.8 5.7 5.7 5.8 5.8 5.8U.S. Unemployment Rate (%) 5.8 5.8 5.7 5.7 5.8 5.8 5.8 5.8 5.8 5.8 5.8 5.8 5.8
Total Nonfarm U.S. 1.9 2.0 1.8 1.7 1.4 1.3 1.2 1.1 1.2 1.1 1.1 0.9 0.8 Florida 2.5 2.5 2.2 2.3 2.2 2.0 1.9 1.8 1.9 1.8 1.7 1.6 1.4Mining 5.8 4.4 2.0 -1.2 -2.0 -2.4 -2.3 -1.8 -1.5 -0.9 -0.3 0.1 0.4Construction 8.7 8.5 9.0 8.5 8.8 8.7 8.7 8.6 9.3 9.3 9.2 9.0 8.2Manufacturing 1.5 0.7 1.2 1.3 0.7 0.4 -0.2 -0.5 -0.8 -0.7 -0.4 -0.3 -0.4Nondurable Goods -0.3 -0.2 0.5 -0.1 -0.7 -0.8 -0.9 -0.9 -1.0 -0.9 -0.6 -0.5 -0.3Durable Goods 2.3 1.2 1.6 2.0 1.4 1.0 0.2 -0.2 -0.6 -0.6 -0.3 -0.3 -0.4Trans. Warehs. & Utility 3.5 2.6 2.6 2.5 2.8 3.5 3.8 3.7 3.8 3.8 3.6 3.4 3.1Wholesale Trade 2.7 1.5 1.4 2.5 2.6 2.6 2.6 2.4 2.5 2.6 2.4 2.5 2.4Retail Trade 2.3 2.6 2.0 1.6 1.0 0.5 0.0 -0.4 -0.4 -0.6 -0.5 -0.5 -0.4Financial Activities 1.8 1.5 1.0 0.9 0.7 0.4 0.4 0.4 0.7 0.6 0.5 0.1 -0.5Prof. and Business Services 3.6 3.3 3.7 3.9 4.0 3.9 3.6 3.7 3.8 3.7 3.3 2.5 1.7Edu & Health Services 2.0 2.5 2.4 2.4 2.2 2.1 1.9 1.9 2.4 2.0 1.5 1.2 0.8Leisure & Hospitality 3.0 3.0 1.8 2.4 2.2 1.8 1.2 0.8 0.5 0.3 0.8 1.3 1.7Information 2.3 3.5 1.1 1.0 -0.5 -1.9 1.8 3.6 3.1 3.1 0.7 -0.8 -0.3Federal Gov't. 0.1 0.6 -0.1 -0.2 -0.7 -0.8 -1.0 -1.0 -1.0 -1.0 -0.9 -1.1 -1.2State & Local Gov't. -0.1 0.0 0.0 0.4 0.5 0.5 0.7 0.8 0.8 1.0 1.1 1.3 1.5
Population (thous) 19,911.1 19,979.4 20,048.8 20,119.7 20,191.9 20,265.5 20,340.3 20,416.5 20,494.2 20,573.6 20,653.6 20,734.0 20,814.8(%Ch Year ago) 1.2 1.3 1.3 1.4 1.4 1.4 1.5 1.5 1.5 1.5 1.5 1.6 1.6Net Migration (thous) 57.3 59.3 60.2 61.3 62.2 63.2 63.9 65.0 66.0 67.2 67.3 67.4 67.6(%Ch Year ago) 13.8 17.8 19.4 21.5 8.5 6.5 6.2 6.1 6.2 6.3 5.3 3.6 2.3
Housing Starts Tot. Private (thous) 90.9 99.5 108.9 116.3 121.6 127.3 129.7 134.1 143.9 147.9 149.0 152.2 152.8Housing Starts Single Family (thous) 62.6 68.5 72.7 77.5 78.6 80.8 83.3 88.2 96.5 100.6 102.8 104.4 104.8Housing Starts Multi-Family (thous) 28.3 31.0 36.2 38.8 43.0 46.5 46.5 45.9 47.3 47.3 46.2 47.7 48.0
(%Ch Year ago) 1.6 1.2 0.8 1.0 1.3 1.5 1.5 1.5 1.7 1.8 2.1 2.1 2.1
*Quarterly at an annual rate
Housing
Consumer Prices
Personal Income and GSP
Employment and Labor Force (Household Survey % Change Year Ago)
NonFarm Employment (Payroll Survey % Change Year Ago)
Population and Migration

F L O R I D A S U M M A R Y TA B L E S
Institute for Economic Competitiveness 15
Table 3. Employment Quarterly*
2014Q4 2015Q1 2015Q2 2015Q3 2015Q4 2016Q1 2016Q2 2016Q3 2016Q4 2017Q1 2017Q2 2017Q3 2017Q4
Total Nonfarm 7,856.9 7,906.7 7,952.1 7,995.1 8,029.3 8,065.3 8,101.1 8,139.3 8,181.0 8,210.4 8,241.6 8,269.3 8,295.8
Manufacturing 330.1 330.7 331.6 332.1 332.6 332.2 331.0 330.6 330.1 329.9 329.7 329.4 328.8
Durable Goods 223.4 224.2 225.2 226.0 226.7 226.4 225.6 225.5 225.2 225.1 225.0 224.8 224.3
Wood Products 10.8 10.9 11.0 11.1 11.2 11.2 11.1 11.2 11.2 11.3 11.3 11.3 11.2
Computer & Electronics 40.3 40.2 39.9 39.5 39.2 38.9 38.6 38.4 38.3 38.1 38.0 37.9 37.9
Transportation Equipment 39.0 39.2 39.3 39.2 39.1 38.8 38.5 38.2 38.0 37.9 37.7 37.4 37.2
Nondurables 106.7 106.6 106.4 106.1 105.9 105.7 105.4 105.1 104.8 104.8 104.7 104.6 104.5
Foods 28.5 28.5 28.5 28.5 28.5 28.4 28.4 28.3 28.2 28.3 28.3 28.4 28.4
Non-Manufacturing 7,526.8 7,576.0 7,620.5 7,663.0 7,696.7 7,733.2 7,770.1 7,808.7 7,851.0 7,880.5 7,911.9 7,939.8 7,967.0
Mining 5.9 5.9 5.9 5.9 5.8 5.8 5.8 5.8 5.7 5.8 5.8 5.8 5.8
Construction 418.3 426.9 436.3 446.6 455.1 464.1 474.4 485.1 497.4 507.5 518.2 528.6 538.0
Trans. Warehs. & Utility 259.2 259.6 261.3 263.7 266.3 268.6 271.2 273.6 276.3 278.8 280.9 282.8 284.8
Wholesale Trade 329.5 331.3 333.4 336.1 338.1 339.8 342.1 344.1 346.7 348.5 350.4 352.5 354.8
Retail Trade 1,047.5 1,051.7 1,054.4 1,057.6 1,057.6 1,056.6 1,054.7 1,053.8 1,053.2 1,050.3 1,049.8 1,049.1 1,048.6
Information 137.1 139.2 137.3 136.6 136.3 136.5 139.8 141.6 140.6 140.8 140.8 140.4 140.2
Prof. & Bus. Services 1,174.5 1,185.3 1,198.0 1,210.1 1,221.9 1,231.5 1,241.2 1,254.3 1,268.0 1,276.6 1,281.9 1,285.2 1,289.7
Admin. & Support 592.1 598.4 606.8 614.2 621.8 629.6 637.9 649.9 661.4 670.5 675.7 679.6 684.6
Prof. Sci & Tech 490.1 494.0 497.9 502.3 506.3 508.0 509.1 510.0 512.0 511.3 511.3 510.5 509.8
Mgmt. of Co. 92.4 93.0 93.3 93.6 93.8 94.0 94.2 94.3 94.6 94.8 94.9 95.1 95.3
Financial Activities 525.4 528.1 528.4 529.0 528.8 530.1 530.7 531.2 532.7 533.5 533.3 532.0 530.0
Real Estate & Rent 171.6 172.3 173.0 173.7 174.3 175.2 175.9 176.8 177.9 178.9 179.7 180.3 180.8
Fin. & Insurance 353.8 355.8 355.4 355.3 354.5 354.9 354.7 354.4 354.8 354.6 353.6 351.7 349.2
Edu. & Health Service 1,158.0 1,166.0 1,177.6 1,182.1 1,183.8 1,190.6 1,199.7 1,204.7 1,211.7 1,213.9 1,217.5 1,219.4 1,221.1
Education Services 148.7 149.3 149.1 149.1 149.0 149.0 148.8 148.5 148.3 147.8 147.3 146.8 146.0
Health Services 1,009.3 1,016.7 1,028.5 1,033.0 1,034.8 1,041.7 1,050.9 1,056.3 1,063.4 1,066.0 1,070.2 1,072.7 1,075.1
Leisure & Hospitality 1,082.3 1,090.8 1,095.4 1,100.9 1,106.1 1,110.3 1,108.9 1,109.9 1,111.2 1,113.7 1,118.3 1,124.5 1,130.6
Other Services 312.9 314.2 315.2 316.2 317.1 318.2 319.3 320.3 321.4 322.4 323.2 324.0 324.8
Government 1,076.2 1,076.8 1,077.4 1,078.1 1,079.7 1,080.9 1,082.3 1,084.3 1,086.1 1,089.0 1,092.0 1,095.4 1,098.7
Federal Gov't. 132.0 131.8 131.7 131.4 131.1 130.8 130.3 130.0 129.7 129.5 129.2 128.7 128.2
State & Local Gov't 944.1 945.0 945.7 946.8 948.6 950.1 952.0 954.3 956.4 959.6 962.8 966.7 970.5
*Quarterly at an annual rate
Florida Payroll Employment (Thousands)

F L O R I D A S U M M A R Y TA B L E S
16 Florida & Metro Forecast - December 2014
Table 4. Employment Annual
2009 2010 2011 2012 2013 2014 2015 2016 2017
Total Nonfarm 7,230.6 7,172.3 7,252.3 7,396.7 7,580.1 7,791.4 7,970.8 8,121.7 8254.3
Manufacturing 324.0 309.1 312.5 317.4 322.0 328.5 331.8 330.9 329.5
Durable Goods 214.5 203.6 206.2 209.9 215.0 222.1 225.5 225.7 224.8
Wood Products 9.1 8.4 8.6 8.8 10.4 10.8 11.0 11.2 11.3
Computer & Electronics 44.7 43.0 43.0 42.5 40.9 40.1 39.7 38.6 37.9
Transportation Equipment 34.9 33.8 34.2 35.4 36.6 38.4 39.2 38.4 37.6
Nondurables 109.5 105.5 106.3 107.5 107.0 106.4 106.2 105.3 104.7
Foods 27.9 27.5 28.7 29.2 29.2 28.4 28.5 28.3 28.3
Non-Manufacturing 6,906.6 6,863.3 6,939.7 7,079.3 7,258.2 7,463.0 7,639.0 7,790.7 7,924.8
Mining 5.5 5.4 5.7 5.6 5.7 5.8 5.9 5.8 5.8
Construction 396.7 351.1 335.4 341.9 367.7 405.9 441.2 480.2 523.1
Trans. Warehs. & Utility 231.8 227.1 235.4 240.6 247.2 256.0 262.7 272.5 281.8
Wholesale Trade 322.4 313.2 312.2 317.9 321.1 328.2 334.7 343.2 351.6
Retail Trade 932.3 934.0 955.3 978.3 1,005.4 1,036.9 1,055.3 1,054.6 1,049.4
Information 143.8 137.1 135.7 133.6 133.9 135.7 137.4 139.6 140.5
Prof. & Bus. Services 993.2 1,005.4 1,035.8 1,074.3 1,117.4 1,160.4 1,203.8 1,248.8 1,283.4
Admin. & Support 481.8 493.8 516.6 537.9 558.4 581.7 610.3 644.7 677.6
Prof. Sci & Tech 431.5 432.5 437.9 451.0 468.1 486.3 500.1 509.8 510.7
Mgmt. of Co. 80.0 79.1 81.4 85.4 90.9 92.4 93.4 94.3 95.0
Financial Activities 487.4 477.9 486.4 499.4 512.8 523.3 528.6 531.2 532.2
Real Estate & Rent 154.9 150.4 153.0 160.0 165.7 171.2 173.3 176.5 179.9
Fin. & Insurance 332.4 327.5 333.4 339.4 347.1 352.1 355.3 354.7 352.3
Edu. & Health Service 1,050.8 1,070.7 1,091.2 1,109.5 1,127.9 1,150.1 1,177.4 1,201.7 1,218.0
Education Services 127.6 134.6 136.8 139.6 142.7 147.5 149.1 148.6 147.0
Health Services 923.2 936.1 954.5 969.9 985.2 1,002.6 1,028.3 1,053.1 1,071.0
Leisure & Hospitality 926.9 931.2 957.2 997.5 1,036.4 1,073.2 1,098.3 1,110.1 1,121.8
Other Services 301.1 297.3 295.7 301.6 306.4 311.4 315.7 319.8 323.6
Government 1,114.8 1,112.8 1,093.5 1,079.1 1,076.4 1,076.1 1,078.0 1,083.4 1,093.8
Federal Gov't. 132.7 142.2 134.0 132.8 132.2 131.6 131.5 130.2 128.9
State & Local Gov't 982.2 970.6 959.6 946.3 944.3 944.5 946.5 953.2 964.9
Florida Payroll Employment (Thousands)

F L O R I D A S U M M A R Y TA B L E S
Institute for Economic Competitiveness 17
Table 5. Personal Income-Quarterly*
2014Q4 2015Q1 2015Q2 2015Q3 2015Q4 2016Q1 2016Q2 2016Q3 2016Q4 2017Q1 2017Q2 2017Q3 2017Q4
Personal Income 865.8 876.0 884.0 892.6 902.9 916.3 927.6 940.3 954.1 969.3 982.7 995.7 1008.9
Wages & Salaries 385.3 390.8 395.7 400.7 405.7 411.0 416.3 421.9 427.8 433.6 439.3 445.1 451.0
Other Labor Income 86.2 86.8 87.4 88.2 89.1 90.2 91.0 92.0 93.1 94.6 95.5 96.5 97.5
Nonfarm 51.7 52.5 53.4 54.0 54.5 55.3 56.2 56.7 57.3 57.9 58.7 58.9 59.3
Farm 1.2 1.1 1.1 1.2 1.3 1.3 1.4 1.4 1.4 1.4 1.3 1.4 1.4
Property Income 225.7 226.2 227.2 228.6 231.6 235.0 238.5 243.4 248.8 253.8 258.9 263.7 268.5
Transfer Payments 174.7 178.5 179.9 181.3 182.8 187.1 188.2 189.7 191.5 195.6 197.4 199.2 201.1
Social Insurance 61.2 62.4 63.1 63.8 64.6 66.0 66.6 67.4 68.3 70.1 71.0 71.8 72.6
Personal Income 793.2 801.1 805.4 809.9 816.9 826.7 834.2 842.3 851.6 861.9 869.5 877.6 885.8
Wages & Salaries 353.0 357.4 360.6 363.6 367.0 370.8 374.4 377.9 381.8 385.5 388.7 392.3 396.0
Other Labor Income 79.0 79.4 79.6 80.0 80.7 81.4 81.9 82.5 83.1 84.1 84.5 85.1 85.6
Nonfarm 47.4 48.0 48.7 49.0 49.3 49.9 50.6 50.8 51.2 51.5 51.9 51.9 52.1
Farm 1.1 1.1 1.0 1.1 1.2 1.2 1.2 1.3 1.2 1.2 1.2 1.2 1.2
Property Income 206.7 206.9 207.0 207.5 209.6 212.0 214.5 218.1 222.1 225.7 229.1 232.5 235.7
Transfer Payments 160.0 163.3 163.9 164.5 165.4 168.8 169.3 169.9 170.9 173.9 174.7 175.6 176.5
Social Insurance 56.1 57.0 57.5 57.9 58.4 59.5 59.9 60.4 61.0 62.3 62.8 63.3 63.8
New Passenger Car & Truck Registrations 1228.73 1224.71 1235.69 1251.72 1266.57 1281.17 1294.49 1301.58 1313.34 1325.74 1338.34 1351.82 1351.80
Retail Sales (Billions $) 297.4 299.8 303.0 306.7 309.6 312.7 316.2 320.5 324.1 327.5 331.9 335.4 338.9
Real Retail Sales (Billions 2005$) 272.5 274.1 276.0 278.3 280.1 282.1 284.4 287.1 289.3 291.2 293.7 295.6 297.5
*Quarterly at an annual rate
Billions Current Dollars
Billions 2005 $
F L O R I D A S U M M A R Y TA B L E S
18 Florida & Metro Forecast - December 2014
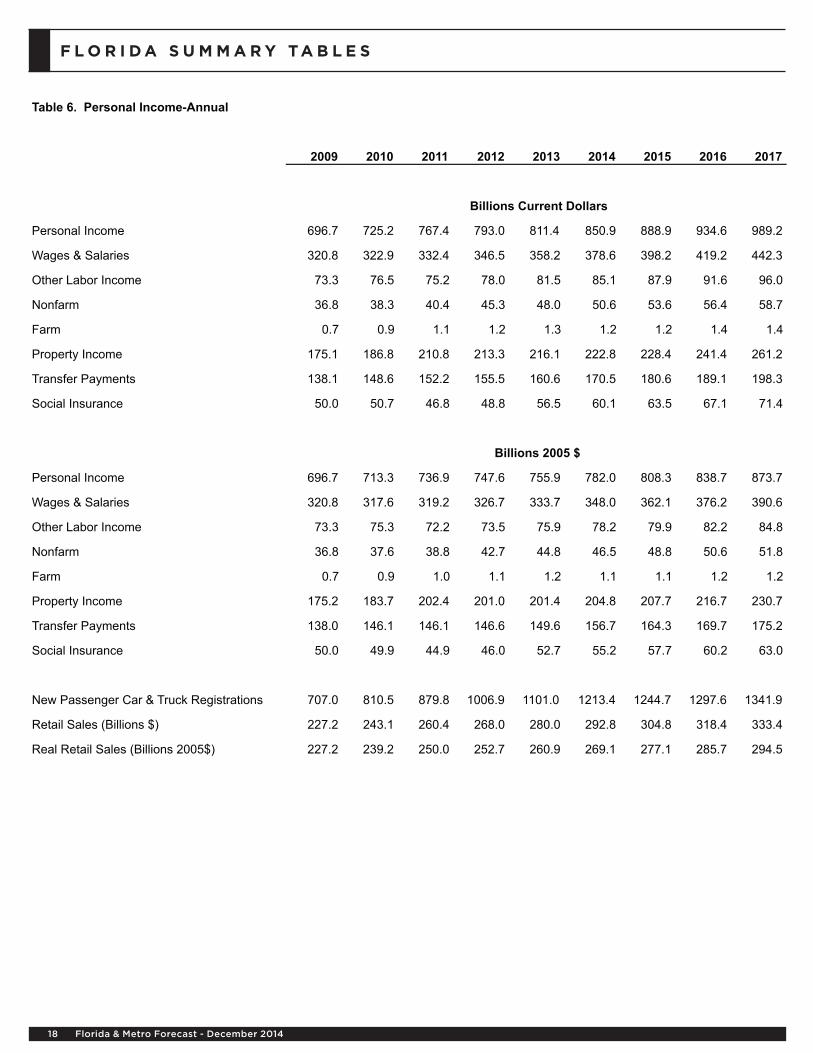
Table 6. Personal Income-Annual
2009 2010 2011 2012 2013 2014 2015 2016 2017
Personal Income 696.7 725.2 767.4 793.0 811.4 850.9 888.9 934.6 989.2
Wages & Salaries 320.8 322.9 332.4 346.5 358.2 378.6 398.2 419.2 442.3
Other Labor Income 73.3 76.5 75.2 78.0 81.5 85.1 87.9 91.6 96.0
Nonfarm 36.8 38.3 40.4 45.3 48.0 50.6 53.6 56.4 58.7
Farm 0.7 0.9 1.1 1.2 1.3 1.2 1.2 1.4 1.4
Property Income 175.1 186.8 210.8 213.3 216.1 222.8 228.4 241.4 261.2
Transfer Payments 138.1 148.6 152.2 155.5 160.6 170.5 180.6 189.1 198.3
Social Insurance 50.0 50.7 46.8 48.8 56.5 60.1 63.5 67.1 71.4
Personal Income 696.7 713.3 736.9 747.6 755.9 782.0 808.3 838.7 873.7
Wages & Salaries 320.8 317.6 319.2 326.7 333.7 348.0 362.1 376.2 390.6
Other Labor Income 73.3 75.3 72.2 73.5 75.9 78.2 79.9 82.2 84.8
Nonfarm 36.8 37.6 38.8 42.7 44.8 46.5 48.8 50.6 51.8
Farm 0.7 0.9 1.0 1.1 1.2 1.1 1.1 1.2 1.2
Property Income 175.2 183.7 202.4 201.0 201.4 204.8 207.7 216.7 230.7
Transfer Payments 138.0 146.1 146.1 146.6 149.6 156.7 164.3 169.7 175.2
Social Insurance 50.0 49.9 44.9 46.0 52.7 55.2 57.7 60.2 63.0
New Passenger Car & Truck Registrations 707.0 810.5 879.8 1006.9 1101.0 1213.4 1244.7 1297.6 1341.9
Retail Sales (Billions $) 227.2 243.1 260.4 268.0 280.0 292.8 304.8 318.4 333.4
Real Retail Sales (Billions 2005$) 227.2 239.2 250.0 252.7 260.9 269.1 277.1 285.7 294.5
Billions Current Dollars
Billions 2005 $

F L O R I D A C H A R T S
Institute for Economic Competitiveness 19
171615141312111009080706050403020100
14.0%
12.0%
10.0%
8.0%
6.0%
4.0%
2.0%
Florida & U.S. Unemployment Rate(%)
FL Unemployment RateU.S. Unemployment Rate
171615141312111009080706050403020100
700.0
600.0
500.0
400.0
300.0
Florida Construction Employment(Thousands)

F L O R I D A C H A R T S
20 Florida & Metro Forecast - December 2014
171615141312111009080706050403020100
6%
4%
2%
0%
-2%
-4%
Florida Consumer Price Index(% change year ago)
FL CPI
171615141312111009080706050403020100
1250.01200.01150.01100.01050.01000.0950.0900.0850.0800.0
Florida Education & Health Services Employment
(Thousands)
F L O R I D A C H A R T S
Institute for Economic Competitiveness 21
171615141312111009080706050403020100
160.0
150.0
140.0
130.0
120.0
110.0
Florida Federal Government Employment
(Thousands)
171615141312111009080706050403020100
560.0
540.0
520.0
500.0
480.0
460.0
Florida Financial Activities Employment
(Thousands)

F L O R I D A C H A R T S
22 Florida & Metro Forecast - December 2014
171615141312111009080706050403020100
12%10%8%6%4%2%0%
-2%-4%-6%
Florida Gross State Product(% change year ago)
FL Gross State Product
171615141312111009080706050403020100
300.0
250.0
200.0
150.0
100.0
50.0
0.0
9%
8%
7%
6%
5%
4%
3%
Florida Housing Starts(thousands)
Total Private Housing Starts30 year Mortgage Rates

F L O R I D A C H A R T S
Institute for Economic Competitiveness 23
171615141312111009080706050403020100
190.0
180.0
170.0
160.0
150.0
140.0
130.0
120.0
Florida Information Employment(Thousands)
171615141312111009080706050403020100
1150.0
1100.01050.01000.0
950.0900.0
850.0800.0
Florida Leisure & Hospitality Employment
(Thousands)

F L O R I D A C H A R T S
24 Florida & Metro Forecast - December 2014
171615141312111009080706050403020100
500.0
450.0
400.0
350.0
300.0
250.0
Florida Manufacturing Employment(Thousands)
171615141312111009080706050403020100
30%20%10%0%
-10%-20%-30%-40%-50%
New Passenger Car & LightTruck Registrations
(% change year ago)

F L O R I D A C H A R T S
Institute for Economic Competitiveness 25
171615141312111009080706050403020100
8400.08200.08000.07800.07600.07400.07200.07000.06800.0
Florida Employment(Thousands)
Wage & Salary Employment
171615141312111009080706050403020100
12%
9%
6%
3%
0%
-3%
-6%
-9%
Florida Personal Income(% change year ago)

F L O R I D A C H A R T S
26 Florida & Metro Forecast - December 2014
171615141312111009080706050403020100
21000.0
20000.0
19000.0
18000.0
17000.0
16000.0
15000.0
Florida Population(Thousands)
171615141312111009080706050403020100
1300.0
1200.0
1100.0
1000.0
900.0
800.0
Florida Professional & Business Services Employment
(Thousands)
171615141312111009080706050403020100
10%
5%
0%
-5%
-10%
Florida Real Gross State Product(% change year ago)

F L O R I D A C H A R T S
Institute for Economic Competitiveness 27
171615141312111009080706050403020100
1050.0
1000.0
950.0
900.0
850.0
Florida State & Local Government Employment
(Thousands)
171615141312111009080706050403020100
1700.0
1650.0
1600.0
1550.0
1500.0
1450.0
Florida Trade, Transportation & Utilities Employment
(Thousands)
171615141312111009080706050403020100
14.0%
12.0%
10.0%
8.0%
6.0%
4.0%
2.0%
0.0%
Florida Unemployment Rate(percent)
Unemployment Rate

F L O R I D A N E W S S U M M A R I E S
28 Florida & Metro Forecast - December 2014
2014-15 forecast Citrus Season Shapes Up Favorably• Orange growers will see the farm price for oranges rise during
this season, however orange juice consumers may see prices fall and level out, according to Marisa Zansler, chief economist at the Florida Department of Citrus, who was present at a meeting with the Florida Citrus Commission.
• Zansler states that there may be an issue in the fact that the increases in revenue will be neutralized with higher costs. This may be made more apparent due to the high cost of combating this bacterial disease called Citrus Greening.
• For the current outlook of this season, a slowdown of the decline in U.S. retail orange juice sales may become more probable but still total sales will drop for the 13th time in the past 14 seasons.
• Polk County leads the state’s citrus producing counties with 81,810 grove acres and 10 million trees from the start of this current season, according to U.S. Department of Agriculture data. Orange growers should also see an increase of 10.5 percent in the farm price for their oranges harvested from October to March.
Source: The Ledger, October 23, 2014
Record number of tourists keep flocking to Florida• It was announced by Gov. Rick Scott that nearly 24 million
tourists visited the state of Florida during the third quarter of 2014. That is a 3.5 percent increase over the same time period a year ago.
• Visit Florida, reported that the record number of 23.7 million visitors includes 2.9 million foreigners and more than 500,000 Canadians.
• Gov. Rick Scott believes that an increase in spending by around $74 million on Visit Florida advertising will aid in boosting the state’s tourism industry.
• Almost 95 million people traveled to Florida for visits last year. Visit Florida estimated that nearly 74 million have passed the state through the end of September.
Source: Naples Daily News, November 20, 2014
Unemployment in Florida dips to lowest rate since June 2008• Data from the Florida Department of Economic Opportunity
shows that Florida’s unemployment rate reached around 6 percent for the first time since June 2008.
• Workforce data shows, 34,000 workers joined the workforce in Florida, in the last month.
• In regards to the Orlando metro area, unemployment dipped to 5.4 percent from 6.2 percent a year ago.
• The Orlando metro area’s four counties saw improvements of 0.7 percent to 0.9 percent year-over-year. Orange County’s unemployment rate improved to 5.4 percent from 6.2 percent, Osceola’s to 6.1 percent from 7 percent, Lake’s to 6 percent from 6.8 percent and Seminole’s to 5.0 percent from 5.7 percent. Each county has only made a slight progression—less than half a percentage point from the September’s figures.
Source: Orlando sentinel, November 21, 2014
Visit Florida offers $2.5M in grants for medical tourism• The marketing organization for the state of Florida, Visit
Florida, publicized the creation of a $2.5 million grant program to encourage medical tourism.
• Medical tourism is the trend by which individuals travel to a state for treatment, surgeries, and recovery. The program will be financed by the state legislature. In addition, some of the money will be used to promote Florida as a destination for medical conferences and training.
• Visit Florida President and CEO, Will Seccombe, hopes that the establishment of these grants is a tremendous first step in the process of highlighting Florida as a destination for top class doctors and facilities.
Source: Sun Sentinel, November 11, 2014
Florida PBS unveils free digital learning platform• Florida PBS was given $1 million out of the education budget,
for licensure and customization of digital learning content to meet Florida requirements.
• The features of platform include 87,000 learning objects that have been compiled and put together from PBS’s nonprofit association of public radio and television stations into relevant content that is searchable by grade level and topic. Florida PBS will look to increase that number from 87,000 to 100,000 this year.
• Florida PBS Learning Media will make sure that it is a safe and user-friendly place for students to enhance their learning online. For the parents who are worried about their students getting homework help in hazardous corners of the Internet, Florida PBS makes exceptional content available on this safe platform.
Source: Panama City News Herald, December 4, 2014
Florida’s sale of lux homes takes a twist in 2014• The sale of homes priced at $1 million or more has been on the
increase, however the increase in volume may be a cautionary sign that growth of sales are declining.
• A report from the Seattle-based Redfin, a real estate search and brokerage service, shows Florida’s third quarter sales of high-end homes measured 1,004, up 6 percent from 2013 and 115 percent from the same time in 2011.
• However this is a fall in growth from 2013, which saw a sharp 34 percent hike in million-dollar homes compared to to the previous year. Redfin’s study looked at 33 Florida regions, including some in Palm Beach County such as Palm Beach and Boca Raton.
• As a result, Redfin found that million-dollar-plus home sales were up a solid 9 percent in the third quarter compared to 2013, definitely outperforming the overall market, which saw a 1.2 percent decrease during the same time period.
Source: Palm Beach Post, December 5, 2014

F L O R I D A F O R E C A S T D e c e m b e r 2 0 14
ME
TR
OS

30 Florida & Metro Forecast - December 2014
D E LT O N A – D AY T O N A B E A C H – O R M O N D B E A C H
O U T L O O K S U M M A R I E SThe Deltona–Daytona–Ormond Beach Metropolitan
Statistical Area (MSA) is expected to show low levels of growth in most of the economic indicators measured in this forecast. Personal income is expected to average 4.6 percent growth, while the real per capita income level will average $34,000. Average annual wage will be the lowest level of the studied areas at $41,300. Average annual wage growth is expected to be moderate at 3.4 percent. Population growth will average 1.2 percent. Gross Metro Product will be at an average level of 13,020.19 million dollars.
The employment growth rate is expected to average 1.7 percent each year. Unemployment will average 6.2 percent.
The Deltona MSA will experience the most growth in the Construction and Mining sector, with an average growth rate of 8.1 percent annually. The Professional and Business Services sector will see the second highest average growth in the Deltona MSA at 4.8 percent annually. The Other Services sector follows with an average annual growth rate of 2.6 percent. The Information sector and Federal Government sector are the only sectors expected to experience declines, both at -0.5 percent.
M E T R O N E W S S U M M A R I E SDaytona airport eyes expansion; airline recruiting ongoing
• Daytona Beach International Airport has only had three of six boarding gates in use (by Delta and US Airways) since mid-2008 when two airlines pulled out during the Great Recession.
• Airport officials have continuously worked to recruit airlines and have proceeded with $65 million in capital improvement projects for the airport since 2006. Officials believe three hotels planned for the Daytona Beach area and larger events at the Ocean Center will drive new passenger growth.
• There is an additional $37 million in anticipated projects for the airport through 2018 including a commission to study the best use of 450 acres of
P R O F I L E SThe Deltona–Daytona–Ormond Beach MSA is
comprised only of Volusia County. It is located on the east coast of Florida and is notable for special events that occur throughout the year such as Bike Week. It is home to NASCAR headquarters and the Daytona International Speedway which hosts popular races such as the Daytona 500.
QUICK FACTS:• Population estimate of 600,756 as of July 1, 2013
census (U.S. Census Bureau).• Civilian labor force of 258,685 in October 2014
(Florida Research and Economic Database).• An unemployment rate of 5.7% as of October
2014, not seasonally adjusted. This amounts to 14,786 unemployed people (Florida Research and Economic Database).
TOP AREA EMPLOYERS:
• Volusia County Schools – 7,503• Halifax Health – 4,709• Florida Hospital Volusia-Flagler Market – 3,256• County of Volusia – 3,341• Daytona State College – 1,568• Embry-Riddle Aeronautical University – 1,423• Florida Health Care Plans, Inc. – 916• Frontier Communications – 800• Department of Transportation – 700• Bert Fish Medical Center – 700
Source: Volusia County Department of Economic Development and Enterprise Florida

Institute for Economic Competitiveness 31
D E LT O N A – D AY T O N A B E A C H – O R M O N D B E A C H
undeveloped property the airport could use for an expansion.
Source: Daytona Beach News-Journal, November 23, 2014
3,400-home project could create 1,900 jobs, developer’s study finds
• An economic impact report commissioned by project developer Minto Communities Florida suggests that their proposed 3,400-home gated Tomoka Community could generate $17 million in annual property taxes and create 1,900 permanent jobs.
• The community, which would be located just west of Interstate 95, would include a commercial center that could give the area a grocery store. The developer expects to spend $846 million to build the community in phases over a 15-year timeline.
• Minto Communities Florida is seeking a rezone and change of permissible land from the city for the 1600-acre development site.
Source: Daytona Beach News-Journal, November 22, 2014
Flagler tourism efforts ending year on high note• With renewed group business and many new athletic
events and conferences interest in coming to Flagler, Matt Dunn, Vice President of Tourism Development for the Flagler County Chamber of Commerce, said 2015 will be another busy year for the county.
• Dunn believes that 2015 will bring increases across the board for the county, including a significant increase in monthly bed-tax collections throughout the calendar year.
• The continued economic strength of Canada and the United Kingdom has brought a significant number of international visitors to the county.
Source: Daytona Beach News-Journal, November 23, 2014
US Foods Port Orange Division wins $312.6M contract with U.S. Navy
• The Navy awarded the national food services provider’s Port Orange division with a two-year contract to feed Navy personnel at Florida bases.
• Local business leaders say the contract is likely the largest ever awarded to a company in the Volusia-Flagler area. The contract will run through Oct 9, 2016 with options to be renewed for three more years.
• US Foods spokeswoman Lisa Lecas believes the contract will result in additional local jobs for the company, which currently employs 550 workers at its 409,000-square-foot Port Orange distribution center.
Source: Daytona Beach News-Journal, October 22, 2014
New York manufacturer Skyo Industries to open Ormond plant early next year
• City Commission unanimously approved the city’s $35,000 portion of an economic incentive package to offset New York-based hand tool manufacturer Skyo Industries’ relocation costs to Ormond Beach Aiport Business Park.
• Syko President Warren Anderson expects the plant to open in March, and is still waiting on official approval from the Florida Department of Economic Opportunity for the state’s portion of the $175,000 performance-based incentive package for creating new jobs.
• The job-creation incentive will only be received if the company meets its goal of creating 35 jobs within three years that pay an average of $42,600 a year.
Source: Daytona Beach News-Journal, December 3, 2014

32 Florida & Metro Forecast - December 2014
D E LT O N A – D AY T O N A B E A C H – O R M O N D B E A C H
0.0 0.2 0.4 0.6 0.8 1.0 1.2 1.4 1.6
Total Nonagricultural Employment
Total Private
Goods Producing
Service Producing
Private Service Providing
Mining, Logging, and Construction
Manufacturing
Trade, Transportation, and Utilities
Wholesale Trade
Retail Trade
Transportation, Warehousing and Utilities
Information
Financial Activities
Professional and Business Services
Educational and Health Services
Leisure and Hospitality
Other Services
Government
Deltona - Daytona Beach - Ormond Beach MSA
Industry Location Quotients
171615141312111009080706050403020100
175.0170.0165.0160.0155.0150.0145.0140.0
Deltona-Daytona Beach Payroll Employment
(Thousands)
Deltona Payroll Employment
171615141312111009080706050403020100
14000.0
13500.0
13000.012500.0
12000.0
11500.0
11000.0
Deltona-Daytona BeachReal Gross Metro Product
(Millions 2000 $)
Real Gross Metro Product
171615141312111009080706050403020100
8.0%6.0%4.0%2.0%0.0%
-2.0%-4.0%-6.0%-8.0%
-10.0%
Deltona-Daytona BeachReal Personal Income
(percent change year ago)
Real Personal Income
171615141312111009080706050403020100
12.0%
10.0%
8.0%
6.0%
4.0%
2.0%
Florida & Deltona-Daytona BeachUnemployment Rate
(percent)
FL Unemployment RateDeltona Unemployment Rate

Institute for Economic Competitiveness 33
D E LT O N A – D AY T O N A B E A C H – O R M O N D B E A C H
Annual Outlook for Deltona-Daytona Beach-Ormond Beach, FL December 2014
2009 2010 2011 2012 2013 2014 2015 2016 2017Personal Income (Billions $)Total Personal Income 15.6 16.1 16.6 17.1 17.4 18.2 18.9 19.8 20.9 Pct Chg Year Ago -5.5 3.8 2.7 3.3 1.7 4.2 4.1 4.8 5.5 Wages and Salaries 5.6 5.7 5.7 5.9 6.0 6.3 6.7 7.0 7.4 Nonwage Income 10.0 10.5 10.9 11.2 11.4 11.8 12.2 12.8 13.5Real Personal Income (05$) 15.6 15.9 15.9 16.2 16.2 16.7 17.2 17.8 18.5 Pct Chg Year Ago -5.4 2.1 0.3 1.4 0.5 2.8 3.0 3.4 3.9Per Capita Income (Ths) 31.4 32.6 33.5 34.4 34.7 35.9 37.0 38.2 39.8Real Per Capita Income (05$) 31.4 32.1 32.2 32.5 32.4 33.0 33.6 34.3 35.1Average Annual Wage (Ths) 35.7 36.5 36.7 37.7 38.1 39.3 40.4 41.9 43.5 Pct Chg Year Ago -0.7 2.5 0.3 2.9 1.0 3.1 2.9 3.5 4.0Establishment Employment (Place of Work, Thousands, SA)Total Employment 156.3 153.6 154.2 155.3 157.2 160.2 163.5 166.1 168.3 Pct Chg Year Ago -5.8 -1.7 0.4 0.7 1.3 1.9 2.1 1.6 1.3Manufacturing 7.8 7.5 8.1 8.4 9.0 9.4 9.5 9.4 9.4 Pct Chg Year Ago -14.0 -3.9 8.5 3.4 6.9 4.4 0.7 -0.6 -0.5Nonmanufacturing 148.4 146.0 146.0 146.9 148.2 150.8 154.0 156.7 159.0 Pct Chg Year Ago -5.3 -1.6 0.0 0.6 0.9 1.7 2.1 1.7 1.4 Construction & Mining 8.9 7.9 7.4 7.6 8.2 8.5 9.3 10.2 11.1 Pct Chg Year Ago -22.0 -11.6 -6.3 2.6 7.6 4.7 8.5 10.2 8.9 Trade, Trans, & Utilities 30.1 30.0 30.0 30.2 30.0 30.0 30.4 30.5 30.6 Pct Chg Year Ago -7.3 -0.5 0.2 0.6 -0.5 0.1 1.0 0.5 0.3 Wholesale Trade 4.9 4.7 4.8 4.7 4.3 4.2 4.3 4.4 4.5 Retail Trade 23.2 23.3 23.4 23.6 23.7 23.9 24.0 24.0 23.7 Trans, Wrhsng, & Util 2.1 1.9 1.8 1.9 2.0 2.0 2.0 2.0 2.1 Information 2.3 2.0 2.0 2.0 1.8 1.7 1.7 1.8 1.8 Pct Chg Year Ago -11.9 -10.9 -1.6 -1.3 -7.6 -5.4 0.0 2.3 0.9 Financial Activities 7.1 7.2 7.3 7.6 7.7 7.7 7.7 7.7 7.7 Pct Chg Year Ago -7.8 0.7 2.2 3.9 1.2 -0.1 0.6 0.2 -0.2 Prof & Business Services 16.0 15.4 15.7 16.3 17.2 18.6 19.5 20.2 20.7 Pct Chg Year Ago 0.2 -3.3 1.6 4.0 5.3 8.4 4.7 3.6 2.4 Educ & Health Services 31.5 31.7 32.3 32.3 32.7 32.7 33.4 33.9 34.3 Pct Chg Year Ago -1.2 0.6 1.9 0.2 1.3 0.0 2.0 1.6 1.2 Leisure & Hospitality 21.6 21.5 22.1 22.7 23.1 23.7 24.1 24.3 24.4 Pct Chg Year Ago -5.7 -0.4 2.9 2.4 1.8 2.6 1.9 0.5 0.4 Other Services 8.2 7.9 7.4 7.4 7.4 7.7 7.9 8.0 8.1 Pct Chg Year Ago 2.6 -3.7 -6.3 -0.8 -0.1 4.7 3.0 1.3 1.1 Federal Government 1.4 1.5 1.3 1.1 1.1 1.1 1.1 1.1 1.1 Pct Chg Year Ago 2.3 5.8 -15.9 -11.1 -3.0 0.3 -0.3 -0.9 -0.9 State & Local Government 21.3 20.9 20.5 19.7 19.1 19.0 18.9 19.0 19.2 Pct Chg Year Ago -4.9 -1.7 -2.0 -3.9 -3.3 -0.6 -0.3 0.5 1.0Other Economic IndicatorsPopulation (Ths) 495.1 495.5 494.9 497.5 501.4 505.7 510.8 517.8 525.2 Pct Chg Year Ago -0.4 0.1 -0.1 0.5 0.8 0.9 1.0 1.4 1.4Labor Force (Ths) 252.4 252.0 252.1 252.1 251.8 256.0 263.0 269.8 275.9 Pct Chg Year Ago -0.8 -0.2 0.0 0.0 -0.1 1.7 2.7 2.6 2.2Unemployment Rate (%) 10.6 11.5 10.6 8.9 7.3 6.1 6.0 6.4 6.6Total Housing Starts 662.5 718.0 1021.9 766.1 1432.9 1596.7 2963.2 3533.8 3914.3 Single-Family 602.3 658.9 504.7 749.0 1220.2 1335.4 1898.5 2444.0 2930.3 Multifamily 60 59 517 17 213 261 1065 1090 984

34 Florida & Metro Forecast - December 2014
D E LT O N A – D AY T O N A B E A C H – O R M O N D B E A C H
Quarterly Outlook for Deltona-Daytona Beach-Ormond Beach, FL December 2014
2014Q4 2015Q1 2015Q2 2015Q3 2015Q4 2016Q1 2016Q2 2016Q3 2016Q4 2017Q1 2017Q2 2017Q3 2017Q4
Personal Income (Billions $)Total Personal Income 18.4 18.6 18.8 19 19.2 19.4 19.7 19.9 20.2 20.5 20.8 21 21.3 Pct Chg Year Ago 4.7 4.7 3.9 3.8 4 4.2 4.6 5 5.3 5.5 5.7 5.6 5.4 Wages and Salaries 6.4 6.5 6.6 6.7 6.8 6.9 6.9 7 7.1 7.2 7.3 7.4 7.5 Nonwage Income 12 12.1 12.2 12.3 12.4 12.6 12.7 12.9 13.1 13.3 13.4 13.6 13.8Real Personal Income (05$) 16.9 17 17.1 17.2 17.3 17.5 17.7 17.8 18 18.2 18.4 18.5 18.7 Pct Chg Year Ago 3.4 3.5 2.9 2.7 2.7 2.8 3.2 3.7 3.9 4 4 3.9 3.7Per Capita Income (Ths) 36.3 36.7 36.9 37.1 37.4 37.7 38 38.4 38.8 39.2 39.6 40 40.3Real Per Capita Income (05$) 33.3 33.5 33.6 33.6 33.8 34 34.2 34.4 34.6 34.9 35.1 35.2 35.4Average Annual Wage (Ths) 39.7 40 40.3 40.6 40.9 41.3 41.7 42.1 42.5 42.9 43.3 43.8 44.2 Pct Chg Year Ago 3.9 3 2.7 2.9 3.1 3.3 3.5 3.7 3.7 3.9 3.9 4 4.1
Establishment Employment (Place of Work, Thousands, SA)Total Employment 161.3 162.2 163.2 164 164.5 165.2 165.7 166.5 167.2 167.6 168.2 168.6 169 Pct Chg Year Ago 1.5 2 1.9 2.3 2 1.8 1.6 1.5 1.6 1.5 1.5 1.3 1.1Manufacturing 9.4 9.4 9.5 9.5 9.5 9.4 9.4 9.4 9.4 9.4 9.4 9.4 9.3 Pct Chg Year Ago 2.5 1 0.2 1 0.5 0.1 -0.5 -0.7 -1 -0.8 -0.4 -0.4 -0.4Nonmanufacturing 151.9 152.8 153.7 154.5 155.1 155.7 156.3 157 157.8 158.2 158.8 159.2 159.6 Pct Chg Year Ago 1.5 2.1 2 2.3 2.1 1.9 1.7 1.6 1.7 1.6 1.6 1.4 1.2 Construction & Mining 8.8 9 9.2 9.4 9.6 9.8 10.1 10.4 10.6 10.9 11 11.2 11.4 Pct Chg Year Ago 5 6.4 7.8 10.3 9.6 9.6 10 10.4 10.7 10.7 9.6 8.2 7.2 Trade, Trans, & Utilities 30.1 30.2 30.3 30.4 30.5 30.5 30.5 30.5 30.5 30.5 30.6 30.6 30.7 Pct Chg Year Ago -0.8 0.3 0.7 1.8 1.3 0.9 0.5 0.2 0.2 0.2 0.3 0.4 0.4 Wholesale Trade 4.2 4.2 4.3 4.3 4.3 4.3 4.4 4.4 4.4 4.5 4.5 4.5 4.6 Retail Trade 23.9 24 24 24.1 24.1 24 24 23.9 23.9 23.8 23.8 23.7 23.7 Trans, Wrhsng, & Util 1.9 1.9 1.9 2 2 2 2 2 2 2.1 2.1 2.1 2.1 Information 1.7 1.7 1.7 1.7 1.7 1.7 1.8 1.8 1.8 1.8 1.8 1.8 1.8 Pct Chg Year Ago -3.8 -1.1 -0.8 1.6 0.3 -1.2 2.5 4.2 3.7 3.6 1.1 -0.6 -0.2 Financial Activities 7.7 7.7 7.7 7.7 7.7 7.7 7.7 7.7 7.7 7.7 7.7 7.7 7.7 Pct Chg Year Ago -0.2 0.2 0.5 0.9 0.7 0.5 0.3 0 0.1 0.1 0 -0.2 -0.8 Prof & Business Services 18.9 19.1 19.4 19.6 19.8 20 20.1 20.3 20.5 20.6 20.7 20.7 20.8 Pct Chg Year Ago 6.3 5.1 4.7 4.3 4.6 4.3 3.6 3.3 3.2 3.1 3 2.2 1.5 Educ & Health Services 33 33.1 33.4 33.5 33.5 33.6 33.9 34 34.2 34.2 34.3 34.4 34.4 Pct Chg Year Ago 1.1 2.8 1.8 1.9 1.6 1.5 1.3 1.5 2 1.7 1.4 1.1 0.6 Leisure & Hospitality 23.9 24 24.1 24.2 24.2 24.3 24.2 24.2 24.2 24.3 24.3 24.4 24.5 Pct Chg Year Ago 1.3 1.7 2.5 1.8 1.5 1.1 0.6 0.2 0 -0.2 0.3 0.7 1 Other Services 7.9 7.9 7.9 7.9 8 8 8 8.1 8.1 8.1 8.1 8.1 8.2 Pct Chg Year Ago 5.6 5.1 4.2 1.5 1.5 1.2 1.3 1.3 1.5 1.4 1.2 1.1 0.9 Federal Government 1.1 1.1 1.1 1.1 1.1 1.1 1.1 1.1 1.1 1.1 1.1 1.1 1.1 Pct Chg Year Ago 0.7 0.3 -1 0 -0.6 -0.7 -0.9 -1 -1 -0.9 -0.8 -0.9 -1 State & Local Government 18.9 18.9 18.9 18.9 18.9 18.9 19 19 19 19.1 19.1 19.2 19.3 Pct Chg Year Ago -0.7 -0.7 -1.2 0.3 0.3 0.3 0.4 0.6 0.6 0.8 0.9 1 1.2
Other Economic IndicatorsPopulation (Ths) 507.3 508.5 509.9 511.5 513.2 515 516.8 518.7 520.7 522.5 524.3 526.1 527.9 Pct Chg Year Ago 0.8 0.9 0.9 1.1 1.2 1.3 1.4 1.4 1.5 1.5 1.4 1.4 1.4Labor Force (Ths) 257.7 260 262.2 264.1 265.8 267.4 269 270.6 272.2 273.7 275.2 276.6 277.9 Pct Chg Year Ago 2.3 2.3 2.3 3.1 3.1 2.8 2.6 2.5 2.4 2.4 2.3 2.2 2.1Unemployment Rate (%) 5.8 5.9 5.9 5.9 6.1 6.2 6.3 6.4 6.5 6.6 6.6 6.6 6.6Total Housing Starts 2010 2453 2861 3174 3365 3489 3461 3451 3734 3852 3885 3956 3964 Single-Family 1416 1649 1826 2017 2102 2212 2321 2499 2743 2858 2921 2967 2975 Multifamily 594 804 1035 1157 1263 1277 1140 952 990 994 964 989 990
Institute for Economic Competitiveness 35
G A I N E S V I L L E
O U T L O O K S U M M A R I E SThe Gainesville Metropolitan Statistical Area (MSA)
is expected to show low levels of growth in most of the economic indicators. Personal income growth will see an average of 4.3 percent growth, the second lowest of the studied MSAs. Real per capita income level is expected to average $37,400. Average annual wage growth is expected to be 3.6 percent, the second highest of the twelve studied MSAs, while the average annual wage level will be at $46,000. Population growth will average the lowest of the studied areas at 0.8 percent annually. Gross Metro Product will be the second lowest of the studied MSAs at an average level of 10,250.72 million dollars.
Gainesville will see an average employment growth rate of 1.1 percent annually, the lowest growth of the MSAs. The Gainesville MSA will, however, maintain the lowest average unemployment rate of the twelve studied, at 4.7 percent.
The fastest growing sector in the area will be the Construction and Mining sector, with an average growth rate of 5.5 percent annually. This is followed by the Professional and Business Services sector with an average annual growth rate of 2.7 percent. The Information, Financial Activities, and Federal Government sectors will experience declines, with average annual growth rates of -0.3, -0.3, and -1.7 percent, respectively.
M E T R O N E W S S U M M A R I E S Gainesville Dojo’s former location to be demolished to make way for office building
• Soon the location previously filled by the Gainesville Dojo will be demolished in order to accommodate the construction of a two-story, 15,000-square-foot office building being developed by Trimark Properties.
• The demolition and construction is planned for early 2015 and is expected to be completed in late 2015. The new Nimbus building will be geared towards office and research uses.
• The new plan involves converting Fifth Terrance to a one-way South-flowing street with angled on-street parking.
P R O F I L E SThe Gainesville MSA is comprised of Alachua and
Gilchrist Counties and is located in the central-north portion of the state. This Metro is home to the University of Florida and the Florida Museum of Natural History, Florida’s official natural history museum.
QUICK FACTS:• Metro population estimate of 270,382 as of July 1,
2013 (U.S. Census Bureau).• Alachua County population estimate of 253,451
as of July 1, 2013 (U.S. Census Bureau).• Gilchrist County population estimate of 16,931 as
of July 1, 2013 (U.S. Census Bureau).• Civilian labor force of 144,979 in October 2014
(Florida Research and Economic Database).• An unemployment rate of 4.7% as of October
2014, not seasonally adjusted. This amounts to 6,764 unemployed people (Florida Research and Economic Database).
TOP AREA EMPLOYERS:• University of Florida – 27,870• UFHealth – 12,000• Alachua County School Board – 4,200• Veterans Affairs Medical Center – 3,500• City of Gainesville – 2,270• Publix Supermarkets – 2,160• North Florida Regional Medical Center – 2,100• Gator Dining Services – 1,200• Nationwide Insurance Company – 950• Wal-Mart Stores – 910
Source: Gainsville Area Chamber of Commerce

36 Florida & Metro Forecast - December 2014
G A I N E S V I L L E
• Trimark is actively developing the Innovation Square area. The company has already completed several building renovations.
Source: Gainesville Sun, November 3, 2014
Noodle House, Faith Vietnamese coming; Sharab closes
• University Towne Center, located at 3117 34th St., will soon welcome Noodle House. The restaurant is taking over the space that has been vacant since the departure of Fresco Neighborhood Italian in December 2012. Noodle House is expected to open by the end of the 2014.
• Nearby at 808 W. University Ave, a business named Faith Vietnamese Restaurant is moving in. The space was previously occupied by Saigon Café and Sushi 2 Go, which are now at 1412 W. University Ave.
• In downtown Gainesville, Sharab Lounge on Main Street has closed. Tom Fox, who has owned the building for 20 years, said he is in negotiations with two other serious parties to lease.
Source: Gainesville Sun, October 31, 2014
Drivers can give thanks for lowest pump prices in 5 years
• The national average price for a gallon of regular unleaded gasoline was $2.82 on November 24, 2014, down 46 cents from Thanksgiving Day 2013.
• The price of a gallon in Gainesville on November 24 was $2.85, six cents less than the previous week’s $2.91 according to the website GasBuddy.com.
• Mark Jenkins, AAA- The Auto Club Group spokesman says “Travelers are thankful to have more money in their pockets due to falling gas prices. The good news is gas should continue falling through the rest of the year. Cheaper gasoline has helped boost disposable income and consumer spending, which encourages more people to travel.”
Source: Gainesville Sun, November 24, 2014
Jobless rate dips slightly in October• Gainesville experienced a decline in the
unemployment rate in October from 4.9 percent to 4.7 percent. This is thought to be due to a decline in job growth of 0.1 percent. Gainesville’s job growth now matches that of the state at 6.0 percent, according to the Florida Department of Economic Opportunity.
• The Gainesville metro area (comprised of Alachua and Gilchrist counties) had a labor force of 144,979 in October and 6,764 people unemployed. In September these figures were 145,303 and 7,071, respectively.
• Employer surveys of job growth depict Gainesville as having a slower job growth rate than that of the state of Florida and of the country as a whole. The surveys pegged the Gainesville job growth rate at 1.2 percent, compared to a state rate of 2.7 percent.
Source: Gainesville Sun, November, 21, 2014
Halcyon Manufacturing expands, while bank, credit union grow
• Halcyon Manufacturing is expanding its presence in Gainesville through the purchase of a 23,000-square-foot warehouse and office space. This represents a 100% increase in space for the scuba diving equipment manufacturer.
• According to Chief Operating Officer Mark Messersmith, the company requires the additional space to accommodate new product development.
• Also growing, Citizens State Bank has opened its second location in Gainesville in the Magnolia Parke office complex at 4620 NW 39th Ave. The bank wanted to provide location convenience to its customers.
• The bank currently employs 54 people and has total assets worth $240 million. It was founded in 1958 and has locations in Perry, Madison, and Steinhatchee.
Source: Gainesville Sun, December 3, 2014

Institute for Economic Competitiveness 37
G A I N E S V I L L E
0 0.5 1 1.5 2 2.5
Total Nonagricultural Employment
Total Private
Goods Producing
Service Producing
Private Service Providing
Mining, Logging, and Construction
Manufacturing
Trade, Transportation, and Utilities
Wholesale Trade
Retail Trade
Transportation, Warehousing and Utilities
Information
Financial Activities
Professional and Business Services
Educational and Health Services
Leisure and Hospitality
Other Services
Government
Gainesville MSA
Industry Location Quotients
171615141312111009080706050403020100
136.0134.0132.0130.0128.0126.0124.0122.0120.0
Gainesville Payroll Employment(Thousands)
Gainesville Payroll Employment
171615141312111009080706050403020100
11000.0
10500.0
10000.0
9500.0
9000.0
8500.0
8000.0
7500.0
Gainesville Real Gross Metro Product(Millions 2000 $)
Real Gross Metro Product
171615141312111009080706050403020100
12.0%10.0%8.0%6.0%4.0%2.0%0.0%
-2.0%-4.0%-6.0%-8.0%
Gainesville Real Personal Income(percent change year ago)
Real Personal Income
171615141312111009080706050403020100
12.0%
10.0%
8.0%
6.0%
4.0%
2.0%
Florida & Gainesville Unemployment Rate(percent)
FL Unemployment RateGainesville Unemployment Rate

38 Florida & Metro Forecast - December 2014
G A I N E S V I L L E
Annual Outlook for Gainesville, FL December 2014
2009 2010 2011 2012 2013 2014 2015 2016 2017Personal Income (Billions $)Total Personal Income 9.0 9.4 9.9 10.2 10.3 10.7 11.1 11.6 12.2 Pct Chg Year Ago -3.5 4.3 5.4 3.3 1.3 3.5 3.9 4.5 5.2 Wages and Salaries 5.2 5.2 5.3 5.4 5.5 5.7 6.0 6.3 6.6 Nonwage Income 3.8 4.2 4.6 4.8 4.8 5.0 5.1 5.4 5.7Real Personal Income (05$) 9.0 9.2 9.5 9.6 9.6 9.8 10.1 10.4 10.8 Pct Chg Year Ago -3.4 2.6 2.9 1.4 0.1 2.1 2.8 3.1 3.5Per Capita Income (Ths) 34.1 35.4 37.1 38.0 38.2 39.3 40.6 42.0 43.8Real Per Capita Income (05$) 34.1 34.8 35.6 35.8 35.6 36.2 36.9 37.7 38.7Average Annual Wage (Ths) 40.3 40.8 41.3 42.1 42.6 43.7 45.1 46.7 48.6 Pct Chg Year Ago 3.0 1.3 1.4 1.9 1.0 2.6 3.2 3.6 4.0Establishment Employment (Place of Work, Thousands, SA)Total Employment 127.4 126.7 126.7 128.1 128.9 130.5 132.3 133.6 134.8 Pct Chg Year Ago -4.4 -0.6 0.0 1.1 0.6 1.3 1.4 1.0 0.8Manufacturing 4.7 4.4 4.4 4.4 4.5 4.6 4.6 4.6 4.6 Pct Chg Year Ago -16.0 -5.7 -0.9 0.4 1.5 2.1 1.2 -0.4 -0.4Nonmanufacturing 122.7 122.2 122.3 123.7 124.4 126.0 127.7 129.0 130.2 Pct Chg Year Ago -3.9 -0.4 0.1 1.1 0.6 1.2 1.4 1.0 0.9 Construction & Mining 4.6 4.2 3.9 4.3 4.3 4.1 4.4 4.9 5.3 Pct Chg Year Ago -18.3 -9.0 -8.7 10.6 1.2 -5.0 7.9 10.2 8.9 Trade, Trans, & Utilities 18.2 17.9 18.1 18.2 18.3 18.5 18.7 18.8 18.8 Pct Chg Year Ago -6.8 -1.6 1.0 0.6 0.6 1.5 1.0 0.1 0.0 Wholesale Trade 2.4 2.3 2.4 2.5 2.6 2.7 2.7 2.8 2.9 Retail Trade 13.3 13.2 13.4 13.3 13.1 13.3 13.4 13.2 13.1 Trans, Wrhsng, & Util 2.4 2.3 2.3 2.4 2.5 2.5 2.6 2.6 2.7 Information 1.6 1.5 1.5 1.5 1.5 1.4 1.4 1.4 1.5 Pct Chg Year Ago -13.8 -6.7 -0.5 -2.9 1.7 -4.2 0.9 1.7 0.5 Financial Activities 6.0 6.0 6.1 6.3 6.2 6.2 6.2 6.2 6.2 Pct Chg Year Ago -3.1 -0.4 2.0 3.6 -1.7 -0.7 0.2 0.0 -0.5 Prof & Business Services 10.3 10.4 10.8 11.3 11.4 11.5 12.0 12.4 12.7 Pct Chg Year Ago -3.9 0.6 3.7 4.5 1.1 1.4 3.8 3.5 2.2 Educ & Health Services 22.0 22.1 22.4 22.9 23.2 24.1 24.4 24.6 24.8 Pct Chg Year Ago 0.1 0.7 1.1 2.2 1.4 3.9 1.4 0.9 0.5 Leisure & Hospitality 13.6 13.2 13.3 13.4 13.8 14.4 14.7 14.7 14.7 Pct Chg Year Ago -7.1 -3.0 0.8 0.7 2.6 4.7 1.7 0.3 0.1 Other Services 4.2 4.1 4.1 4.1 4.0 4.0 4.0 4.1 4.1 Pct Chg Year Ago -6.5 -2.8 0.7 -1.6 -0.4 -1.1 0.9 0.9 0.5 Federal Government 4.3 4.7 4.4 4.4 4.4 4.3 4.2 4.2 4.1 Pct Chg Year Ago 5.4 10.9 -6.1 -1.2 0.6 -3.1 -0.6 -1.6 -1.6 State & Local Government 37.9 38.1 37.8 37.5 37.4 37.4 37.6 37.8 38.1 Pct Chg Year Ago -1.5 0.6 -0.8 -0.7 -0.4 0.1 0.5 0.5 0.9Other Economic IndicatorsPopulation (Ths) 263.7 265.2 266.9 268.9 270.6 272.1 274.4 276.7 279.1 Pct Chg Year Ago 0.7 0.6 0.7 0.7 0.7 0.6 0.8 0.9 0.9Labor Force (Ths) 137.7 138.7 139.9 140.8 140.2 142.4 145.7 148.8 151.2 Pct Chg Year Ago -1.0 0.7 0.8 0.7 -0.4 1.6 2.3 2.1 1.6Unemployment Rate (%) 7.1 8.0 7.7 6.6 5.5 4.9 4.6 4.6 4.7Total Housing Starts 511.7 509.1 446.1 575.1 722.1 715.7 952.7 1177.0 1302.9 Single-Family 363.6 406.6 299.4 397.6 506.2 488.8 571.6 670.5 791.1 Multifamily 148 102 147 177 216 227 381 506 512

Institute for Economic Competitiveness 39
G A I N E S V I L L E
Quarterly Outlook for Gainesville, FLDecember 2014
2014Q4 2015Q1 2015Q2 2015Q3 2015Q4 2016Q1 2016Q2 2016Q3 2016Q4 2017Q1 2017Q2 2017Q3 2017Q4
Personal Income (Billions $)Total Personal Income 10.9 11 11.1 11.2 11.3 11.4 11.6 11.7 11.8 12 12.2 12.3 12.4 Pct Chg Year Ago 4.1 4.3 4 3.7 3.8 4 4.3 4.7 5 5.1 5.3 5.2 5 Wages and Salaries 5.8 5.9 6 6 6.1 6.2 6.2 6.3 6.4 6.5 6.5 6.6 6.7 Nonwage Income 5.1 5.1 5.1 5.1 5.2 5.3 5.3 5.4 5.5 5.6 5.6 5.7 5.8Real Personal Income (05$) 10 10.1 10.1 10.1 10.2 10.3 10.4 10.5 10.6 10.7 10.8 10.8 10.9 Pct Chg Year Ago 2.8 3.1 3.1 2.7 2.5 2.6 2.9 3.3 3.6 3.6 3.6 3.5 3.3Per Capita Income (Ths) 39.9 40.2 40.4 40.7 41 41.4 41.8 42.2 42.7 43.2 43.6 44 44.4Real Per Capita Income (05$) 36.5 36.8 36.8 36.9 37.1 37.4 37.6 37.8 38.1 38.4 38.6 38.8 39Average Annual Wage (Ths) 44.2 44.5 44.9 45.2 45.6 46 46.5 46.9 47.4 47.8 48.3 48.8 49.3 Pct Chg Year Ago 3.3 3.2 3.2 3.3 3.3 3.4 3.6 3.7 3.8 3.9 3.9 4 4.1
Establishment Employment (Place of Work, Thousands, SA)Total Employment 131.2 131.7 132.2 132.6 132.8 133.1 133.4 133.8 134.1 134.4 134.7 134.9 135.1 Pct Chg Year Ago 1 1.2 1.7 1.5 1.2 1.1 0.9 0.9 1 0.9 0.9 0.8 0.7Manufacturing 4.6 4.6 4.6 4.6 4.6 4.6 4.6 4.6 4.6 4.6 4.6 4.6 4.6 Pct Chg Year Ago 1.4 1.7 1.3 1.2 0.7 0.3 -0.4 -0.6 -0.9 -0.7 -0.3 -0.3 -0.2Nonmanufacturing 126.6 127.1 127.6 128 128.2 128.5 128.8 129.2 129.6 129.8 130.1 130.3 130.5 Pct Chg Year Ago 1 1.2 1.7 1.5 1.3 1.1 1 1 1.1 1 1 0.9 0.7 Construction & Mining 4.2 4.3 4.4 4.5 4.6 4.7 4.8 4.9 5.1 5.2 5.3 5.3 5.4 Pct Chg Year Ago 2.6 4.9 6.8 10.6 9.2 9.5 10 10.4 10.8 10.8 9.7 8.2 7.1 Trade, Trans, & Utilities 18.6 18.7 18.7 18.8 18.8 18.8 18.8 18.7 18.8 18.7 18.8 18.8 18.8 Pct Chg Year Ago 0.7 0.9 1.1 1.3 0.8 0.5 0.2 -0.1 -0.1 -0.1 0 0.1 0 Wholesale Trade 2.7 2.7 2.7 2.7 2.8 2.8 2.8 2.8 2.8 2.8 2.8 2.9 2.9 Retail Trade 13.3 13.4 13.4 13.4 13.4 13.3 13.3 13.2 13.2 13.1 13.1 13 13 Trans, Wrhsng, & Util 2.6 2.6 2.6 2.6 2.6 2.6 2.6 2.7 2.7 2.7 2.7 2.7 2.7 Information 1.4 1.4 1.4 1.4 1.4 1.4 1.5 1.5 1.5 1.5 1.5 1.5 1.5 Pct Chg Year Ago -5.5 1.3 1.8 0.9 -0.4 -1.9 1.8 3.6 3.1 3.1 0.6 -0.9 -0.6 Financial Activities 6.2 6.2 6.2 6.2 6.2 6.2 6.2 6.2 6.2 6.2 6.2 6.2 6.1 Pct Chg Year Ago -1.3 -0.6 0.1 0.7 0.5 0.2 0 -0.3 -0.1 -0.2 -0.2 -0.4 -1.1 Prof & Business Services 11.7 11.8 11.9 12.1 12.2 12.3 12.3 12.4 12.6 12.6 12.7 12.7 12.7 Pct Chg Year Ago 1.1 2.2 4.3 4.2 4.5 4.2 3.5 3.2 3.1 2.9 2.8 2 1.3 Educ & Health Services 24.2 24.3 24.5 24.5 24.4 24.5 24.6 24.7 24.8 24.7 24.8 24.8 24.8 Pct Chg Year Ago 2.2 1.7 1.7 1.2 0.9 0.9 0.6 0.8 1.4 1 0.7 0.4 0 Leisure & Hospitality 14.5 14.6 14.7 14.7 14.7 14.8 14.7 14.7 14.7 14.7 14.7 14.8 14.8 Pct Chg Year Ago 4.5 1.7 2 1.6 1.4 1 0.4 0 -0.3 -0.5 0 0.4 0.7 Other Services 4 4 4 4 4 4.1 4.1 4.1 4.1 4.1 4.1 4.1 4.1 Pct Chg Year Ago 0.4 0 1.5 1.1 1 0.8 0.9 0.8 1 0.9 0.6 0.5 0.2 Federal Government 4.3 4.3 4.3 4.2 4.2 4.2 4.2 4.2 4.2 4.1 4.1 4.1 4.1 Pct Chg Year Ago -3.4 -0.8 0.4 -0.7 -1.3 -1.4 -1.6 -1.7 -1.7 -1.6 -1.5 -1.7 -1.8 State & Local Government 37.5 37.6 37.6 37.6 37.6 37.7 37.7 37.8 37.8 38 38.1 38.2 38.3 Pct Chg Year Ago 0.2 0.7 1 0.2 0.3 0.3 0.4 0.6 0.6 0.7 0.9 1 1.2
Other Economic IndicatorsPopulation (Ths) 272.8 273.5 274.1 274.7 275.3 275.9 276.4 277 277.6 278.2 278.8 279.4 280.1 Pct Chg Year Ago 0.6 0.7 0.8 0.9 0.9 0.9 0.9 0.8 0.8 0.8 0.9 0.9 0.9Labor Force (Ths) 143.1 144.3 145.3 146.3 147 147.8 148.4 149.1 149.8 150.3 150.9 151.4 151.9 Pct Chg Year Ago 2.1 1.8 1.8 2.8 2.8 2.4 2.1 2 1.8 1.8 1.7 1.5 1.4Unemployment Rate (%) 4.7 4.6 4.6 4.5 4.5 4.6 4.6 4.6 4.6 4.6 4.7 4.7 4.7Total Housing Starts 737 818 921 1004 1067 1123 1144 1178 1263 1290 1290 1316 1316 Single-Family 481 527 559 597 603 619 639 680 745 774 789 801 800 Multifamily 256 291 362 407 463 505 505 499 518 516 501 515 515

40 Florida & Metro Forecast - December 2014
J A C K S O N V I L L E
O U T L O O K S U M M A R I E SThe Jacksonville Metropolitan Statistical Area (MSA)
is expected to see strong growth in most of the economic indicators, relative to the other MSAs studied. Personal income will see an average growth rate of 5.3 percent. The real per capita income level is expected to average $42,000, the third highest of the twelve studied MSAs. Average annual wage growth is expected to be 3.2 percent, while the average annual wage level is expected to be $52,800. Population growth will be moderate at an average annual rate of 1.4 percent. Gross Metro Product will be at a level of 63,948.43 million dollars.
Employment growth is expected to average 2.3 percent annually. Unemployment will average 5.6 percent in the MSA.
The fastest growing sector in the Jacksonville MSA will be Construction and Mining, which will see an average annual growth rate of 7.2 percent. Following that sector is the Professional and Business Services sector, with an average annual growth rate of 4.4 percent, and then the Leisure and Hospitality sector with an average growth rate of 3.3 percent. The Federal Government sector will experience a decline with an average annual growth rate of -1.5 percent.
M E T R O N E W S S U M M A R I E S418-unit single-family community set for St. Johns County
• Double Eagle Development will hold the ceremonial groundbreaking for Treaty Oaks development on December 5th. Construction will be completed by WG Pitts Company with funding from STI Funding.
• The 165-acre development is located one mile east of Interstate 95 on route 207, 10 minutes from downtown St. Augustine.
• The new community has an estimated cost of $15 million and has a timeline of three to four years for completion. Home prices will start in the mid-$200,000s.
Source: Jacksonville Business Journal, November 25, 2014
P R O F I L E SThe Jacksonville MSA is comprised of Baker, Clay,
Duval, Nassau and St. Johns counties. It is located on the northeast coast of Florida and is home to several major U.S. military bases, such as the Jacksonville Naval Air Station, as well as shipyards, the University of North Florida, and the Jacksonville International Airport.
QUICK FACTS:• Metro population estimate of 1,394,624 as of July
1, 2013 (U.S. Census Bureau).• Baker County population estimate of 27,013 as of
July 1, 2013 (U.S. Census Bureau).• Clay County population estimate of 196,399 as of
July 1, 2013 (U.S. Census Bureau).• Duval County population estimate of 885,855 as
of July 1, 2013 (U.S. Census Bureau).• Nassau County population estimate of 75,710 as
of July 1, 2013 (U.S. Census Bureau).• St. Johns County population estimate of 209,647
as of July 1, 2013 (U.S. Census Bureau).• Civilian labor force of 734,947 in October 2014
(Florida Research and Economic Database).• An unemployment rate of 5.6% as of October
2014, not seasonally adjusted. This amounts to 40,931 unemployed people (Florida Research and Economic Database).
TOP AREA EMPLOYERS:• Naval Air Station Jacksonville – 25,240• Duval County Public Schools – 14,480• Naval Station Mayport – 9,000• City of Jacksonville – 8,820• Baptist Health Systems – 8,270• Bank of America Merrill Lynch – 8,000• Florida Blue – 6,500• Mayo Clinic – 4,970• Citi – 4,200• JP Morgan Chase – 4,200
Source: City of Jacksonville Office of Economic Development

Institute for Economic Competitiveness 41
J A C K S O N V I L L E
Artificial reefs near downtown Jacksonville will bring fish and fisherman to St. Johns River
• Crews will install reefs in St. John’s River south of Fuller Warren Bridge, providing fishermen with a productive fishing area close to downtown.
• The Jacksonville chapter of the Costal Conservation Association started the habitat enhancement project. The $59,000 was covered by a $30,000 grant from the Florida Department of Wildlife and Conservation and $30,000 from country singer Kenny Chesney.
• TISIRI, a nonprofit organization with previous reef installation experience in North Florida, will manage the project, which will include two 200-foot-by-200-foot reefs.
Source: Florida Times-Union, December 4, 2014
Jaxport Asian container volumes up 20 percent • Asian container trade, the fastest growing segment
of Jaxport’s container cargo business, has grown 20 percent year-over-year.
• In the fiscal year ending in September, 272,524 twenty-foot-long containers were moved compared to 226,038 last year. Asian container trade now accounts for 30 percent of business, and has averaged 28.5 percent annually over the last five years.
• Data on container shipments came from the port authority’s tracking of tenant container volume on its docks.
Source: Jacksonville Business Journal, October 29, 2014
Jacksonville named No. 3 in digital cities of U.S.• Jacksonville ranked 3rd for the second year in a row
in the Center for Digital Government’s annual survey.
• Criteria for the survey included areas of citizen engagement, policy operations, technology and data, and infrastructure resources.
• Mayor Alvin Brown said in a press release, “We can be proud of Jacksonville’s success in being recognized once again as a national leader in using digital technology to provide innovative, cost-effective services for our citizens and businesses.”
• Los Angeles ranked first, followed by Kansas City, Missouri and Seattle, Washington tied for second place.
Source: Jacksonville Business Journal, November 18, 2014
Bids to open for Mile Point project • The Mile Point dredging project will correct
crosscurrents from the Intercostal Waterway and St. John’s River that currently keep larger ships from crossing the channel.
• At an expected cost of $25 million to $50 million, the project will include 4,000 feet of a west leg training wall, removing 3,300 feet of an existing wall, dredging the area, demolishing the U.S. Coast Guard structure, and monitoring wildlife.
• Solicitation will begin on December 15 with responses taking place by February 13, 2015.
Source: Jacksonville Business Journal, December 2, 2014

42 Florida & Metro Forecast - December 2014
J A C K S O N V I L L E
0 0.2 0.4 0.6 0.8 1 1.2 1.4 1.6 1.8
Total Nonagricultural Employment
Total Private
Goods Producing
Service Producing
Private Service Providing
Mining, Logging, and Construction
Manufacturing
Trade, Transportation, and Utilities
Wholesale Trade
Retail Trade
Transportation, Warehousing and Utilities
Information
Financial Activities
Professional and Business Services
Educational and Health Services
Leisure and Hospitality
Other Services
Government
Jacksonville MSA
Industry Location Quotients
171615141312111009080706050403020100
680.0
660.0
640.0
620.0
600.0
580.0
560.0
540.0
Jacksonville Payroll Employment(Thousands)
Jacksonville Payroll Employment
171615141312111009080706050403020100
70000.0
65000.0
60000.0
55000.0
50000.0
45000.0
Jacksonville Real Gross Metro Product(Millions 2000 $)
Real Gross Metro Product
171615141312111009080706050403020100
10.0%8.0%6.0%4.0%2.0%0.0%
-2.0%-4.0%-6.0%-8.0%
Jacksonville Real Personal Income(percent change year ago)
Real Personal Income
171615141312111009080706050403020100
12.0%
10.0%
8.0%
6.0%
4.0%
2.0%
Florida & Jacksonville Unemployment Rate(percent)
FL Unemployment RateJacksonville Unemployment Rate

Institute for Economic Competitiveness 43
J A C K S O N V I L L E
Annual Outlook for Jacksonville, FL December 2014
2009 2010 2011 2012 2013 2014 2015 2016 2017Personal Income (Billions $)Total Personal Income 51.3 53.3 55.8 57.8 59.1 62.4 65.4 68.7 72.7 Pct Chg Year Ago -4.6 3.8 4.7 3.6 2.4 5.4 4.9 5.1 5.8 Wages and Salaries 27.3 27.7 28.5 29.7 30.6 32.4 34.2 35.9 37.8 Nonwage Income 24.1 25.5 27.3 28.0 28.5 30.0 31.2 32.8 34.9Real Personal Income (05$) 51.3 52.4 53.6 54.5 55.1 57.3 59.5 61.7 64.2 Pct Chg Year Ago -4.6 2.1 2.2 1.7 1.2 4.0 3.8 3.7 4.1Per Capita Income (Ths) 38.4 39.5 40.9 41.9 42.3 44.1 45.6 47.2 49.2Real Per Capita Income (05$) 38.4 38.8 39.3 39.5 39.4 40.5 41.5 42.4 43.5Average Annual Wage (Ths) 45.3 46.3 47.1 48.6 49.0 50.3 51.7 53.5 55.6 Pct Chg Year Ago 0.8 2.3 1.7 3.2 0.8 2.7 2.8 3.4 3.9Establishment Employment (Place of Work, Thousands, SA)Total Employment 583.5 580.0 586.4 594.6 608.5 627.6 644.1 655.2 665.6 Pct Chg Year Ago -5.7 -0.6 1.1 1.4 2.3 3.1 2.6 1.7 1.6Manufacturing 29.2 27.5 27.4 27.9 28.1 28.5 29.1 29.1 29.1 Pct Chg Year Ago -9.9 -6.0 -0.1 1.6 0.7 1.6 2.1 0.0 -0.2Nonmanufacturing 554.3 552.6 559.0 566.7 580.5 599.1 615.0 626.1 636.5 Pct Chg Year Ago -5.4 -0.3 1.2 1.4 2.4 3.2 2.7 1.8 1.7 Construction & Mining 33.4 29.2 27.5 27.8 30.2 32.0 34.4 36.9 39.9 Pct Chg Year Ago -23.4 -12.7 -5.6 1.0 8.7 6.0 7.3 7.3 8.0 Trade, Trans, & Utilities 126.9 124.4 124.1 125.5 128.2 130.5 133.1 135.0 136.8 Pct Chg Year Ago -6.9 -2.0 -0.2 1.1 2.2 1.8 2.0 1.4 1.4 Wholesale Trade 26.7 25.6 24.8 24.7 25.1 25.1 25.7 26.4 27.2 Retail Trade 69.5 68.8 69.0 70.2 71.9 73.2 74.2 74.1 73.8 Trans, Wrhsng, & Util 30.7 30.0 30.3 30.6 31.2 32.1 32.9 34.0 35.1 Information 10.3 10.2 9.6 9.2 9.1 9.1 9.1 9.2 9.3 Pct Chg Year Ago 1.2 -1.6 -5.6 -4.0 -1.2 0.1 0.0 1.4 0.7 Financial Activities 55.7 55.7 58.0 60.0 61.0 61.8 62.9 63.2 63.4 Pct Chg Year Ago -6.7 0.0 4.1 3.5 1.7 1.3 1.9 0.4 0.3 Prof & Business Services 79.4 82.4 87.6 91.0 94.5 102.1 106.9 109.7 112.1 Pct Chg Year Ago -5.7 3.7 6.3 3.9 3.8 8.0 4.7 2.7 2.2 Educ & Health Services 83.7 85.7 87.8 89.2 90.7 91.4 93.8 96.0 97.5 Pct Chg Year Ago 2.5 2.4 2.4 1.6 1.7 0.8 2.6 2.3 1.5 Leisure & Hospitality 65.3 65.0 66.3 69.0 72.4 78.1 80.6 81.4 82.2 Pct Chg Year Ago -3.8 -0.4 2.0 4.1 4.9 7.9 3.2 1.0 1.0 Other Services 23.2 23.0 21.6 20.3 20.4 20.5 20.7 21.0 21.3 Pct Chg Year Ago -10.1 -0.9 -6.0 -5.9 0.3 0.6 1.2 1.3 1.3 Federal Government 17.5 18.0 17.3 17.3 17.0 16.7 16.4 16.3 16.0 Pct Chg Year Ago 2.3 2.9 -3.8 -0.4 -1.4 -2.0 -1.5 -1.1 -1.3 State & Local Government 58.8 59.1 59.2 57.4 56.9 56.8 57.0 57.3 58.0 Pct Chg Year Ago -1.1 0.4 0.2 -3.0 -0.8 -0.2 0.4 0.6 1.2Other Economic IndicatorsPopulation (Ths) 1336.9 1350.4 1363.7 1380.1 1396.9 1414.4 1433.9 1455.0 1477.1 Pct Chg Year Ago 1.0 1.0 1.0 1.2 1.2 1.3 1.4 1.5 1.5Labor Force (Ths) 681.1 686.9 691.3 696.8 702.0 722.8 738.1 750.0 761.3 Pct Chg Year Ago -0.9 0.9 0.6 0.8 0.7 3.0 2.1 1.6 1.5Unemployment Rate (%) 9.8 10.9 9.9 8.4 6.9 5.9 5.5 5.4 5.4Total Housing Starts 4935.1 3710.4 3577.4 6373.2 7242.4 7717.1 8902.0 10438.5 11711.2 Single-Family 3400.5 3562.4 3173.8 4539.2 6125.5 6389.1 6723.8 6917.8 7988.3 Multifamily 1535 148 404 1834 1117 1328 2178 3521 3723
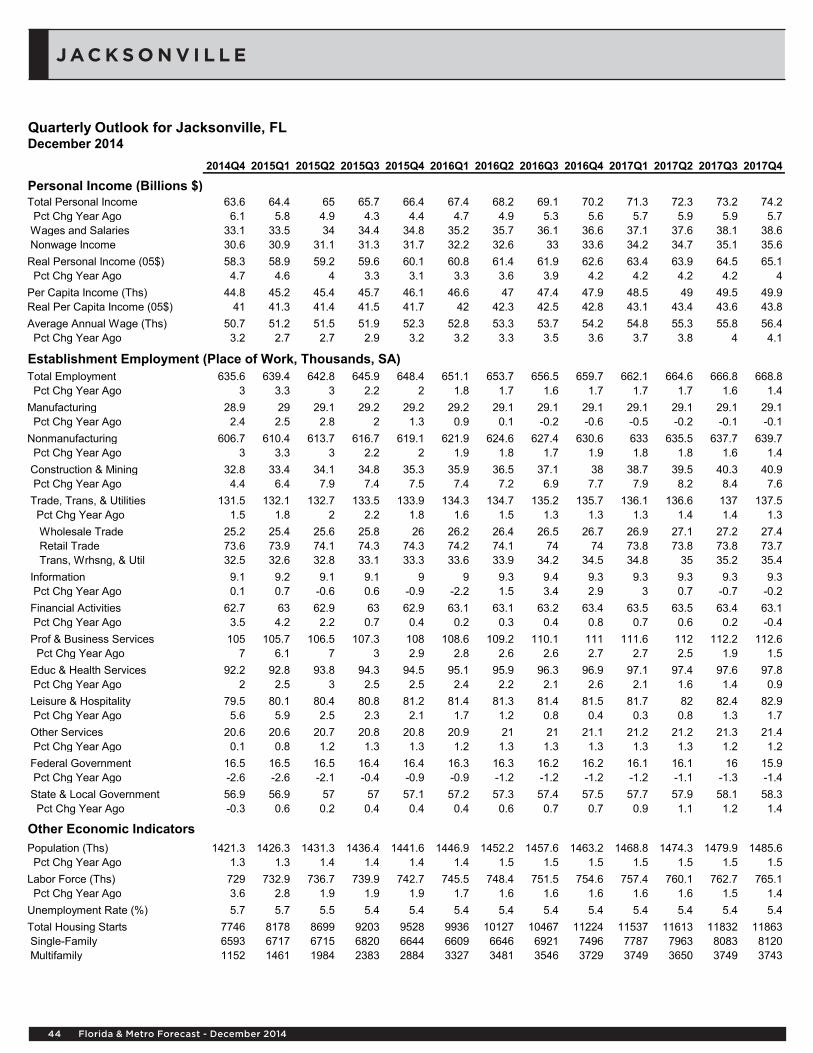
44 Florida & Metro Forecast - December 2014
J A C K S O N V I L L E
Quarterly Outlook for Jacksonville, FL December 2014
2014Q4 2015Q1 2015Q2 2015Q3 2015Q4 2016Q1 2016Q2 2016Q3 2016Q4 2017Q1 2017Q2 2017Q3 2017Q4
Personal Income (Billions $)Total Personal Income 63.6 64.4 65 65.7 66.4 67.4 68.2 69.1 70.2 71.3 72.3 73.2 74.2 Pct Chg Year Ago 6.1 5.8 4.9 4.3 4.4 4.7 4.9 5.3 5.6 5.7 5.9 5.9 5.7 Wages and Salaries 33.1 33.5 34 34.4 34.8 35.2 35.7 36.1 36.6 37.1 37.6 38.1 38.6 Nonwage Income 30.6 30.9 31.1 31.3 31.7 32.2 32.6 33 33.6 34.2 34.7 35.1 35.6Real Personal Income (05$) 58.3 58.9 59.2 59.6 60.1 60.8 61.4 61.9 62.6 63.4 63.9 64.5 65.1 Pct Chg Year Ago 4.7 4.6 4 3.3 3.1 3.3 3.6 3.9 4.2 4.2 4.2 4.2 4Per Capita Income (Ths) 44.8 45.2 45.4 45.7 46.1 46.6 47 47.4 47.9 48.5 49 49.5 49.9Real Per Capita Income (05$) 41 41.3 41.4 41.5 41.7 42 42.3 42.5 42.8 43.1 43.4 43.6 43.8Average Annual Wage (Ths) 50.7 51.2 51.5 51.9 52.3 52.8 53.3 53.7 54.2 54.8 55.3 55.8 56.4 Pct Chg Year Ago 3.2 2.7 2.7 2.9 3.2 3.2 3.3 3.5 3.6 3.7 3.8 4 4.1
Establishment Employment (Place of Work, Thousands, SA)Total Employment 635.6 639.4 642.8 645.9 648.4 651.1 653.7 656.5 659.7 662.1 664.6 666.8 668.8 Pct Chg Year Ago 3 3.3 3 2.2 2 1.8 1.7 1.6 1.7 1.7 1.7 1.6 1.4Manufacturing 28.9 29 29.1 29.2 29.2 29.2 29.1 29.1 29.1 29.1 29.1 29.1 29.1 Pct Chg Year Ago 2.4 2.5 2.8 2 1.3 0.9 0.1 -0.2 -0.6 -0.5 -0.2 -0.1 -0.1Nonmanufacturing 606.7 610.4 613.7 616.7 619.1 621.9 624.6 627.4 630.6 633 635.5 637.7 639.7 Pct Chg Year Ago 3 3.3 3 2.2 2 1.9 1.8 1.7 1.9 1.8 1.8 1.6 1.4 Construction & Mining 32.8 33.4 34.1 34.8 35.3 35.9 36.5 37.1 38 38.7 39.5 40.3 40.9 Pct Chg Year Ago 4.4 6.4 7.9 7.4 7.5 7.4 7.2 6.9 7.7 7.9 8.2 8.4 7.6 Trade, Trans, & Utilities 131.5 132.1 132.7 133.5 133.9 134.3 134.7 135.2 135.7 136.1 136.6 137 137.5 Pct Chg Year Ago 1.5 1.8 2 2.2 1.8 1.6 1.5 1.3 1.3 1.3 1.4 1.4 1.3 Wholesale Trade 25.2 25.4 25.6 25.8 26 26.2 26.4 26.5 26.7 26.9 27.1 27.2 27.4 Retail Trade 73.6 73.9 74.1 74.3 74.3 74.2 74.1 74 74 73.8 73.8 73.8 73.7 Trans, Wrhsng, & Util 32.5 32.6 32.8 33.1 33.3 33.6 33.9 34.2 34.5 34.8 35 35.2 35.4 Information 9.1 9.2 9.1 9.1 9 9 9.3 9.4 9.3 9.3 9.3 9.3 9.3 Pct Chg Year Ago 0.1 0.7 -0.6 0.6 -0.9 -2.2 1.5 3.4 2.9 3 0.7 -0.7 -0.2 Financial Activities 62.7 63 62.9 63 62.9 63.1 63.1 63.2 63.4 63.5 63.5 63.4 63.1 Pct Chg Year Ago 3.5 4.2 2.2 0.7 0.4 0.2 0.3 0.4 0.8 0.7 0.6 0.2 -0.4 Prof & Business Services 105 105.7 106.5 107.3 108 108.6 109.2 110.1 111 111.6 112 112.2 112.6 Pct Chg Year Ago 7 6.1 7 3 2.9 2.8 2.6 2.6 2.7 2.7 2.5 1.9 1.5 Educ & Health Services 92.2 92.8 93.8 94.3 94.5 95.1 95.9 96.3 96.9 97.1 97.4 97.6 97.8 Pct Chg Year Ago 2 2.5 3 2.5 2.5 2.4 2.2 2.1 2.6 2.1 1.6 1.4 0.9 Leisure & Hospitality 79.5 80.1 80.4 80.8 81.2 81.4 81.3 81.4 81.5 81.7 82 82.4 82.9 Pct Chg Year Ago 5.6 5.9 2.5 2.3 2.1 1.7 1.2 0.8 0.4 0.3 0.8 1.3 1.7 Other Services 20.6 20.6 20.7 20.8 20.8 20.9 21 21 21.1 21.2 21.2 21.3 21.4 Pct Chg Year Ago 0.1 0.8 1.2 1.3 1.3 1.2 1.3 1.3 1.3 1.3 1.3 1.2 1.2 Federal Government 16.5 16.5 16.5 16.4 16.4 16.3 16.3 16.2 16.2 16.1 16.1 16 15.9 Pct Chg Year Ago -2.6 -2.6 -2.1 -0.4 -0.9 -0.9 -1.2 -1.2 -1.2 -1.2 -1.1 -1.3 -1.4 State & Local Government 56.9 56.9 57 57 57.1 57.2 57.3 57.4 57.5 57.7 57.9 58.1 58.3 Pct Chg Year Ago -0.3 0.6 0.2 0.4 0.4 0.4 0.6 0.7 0.7 0.9 1.1 1.2 1.4
Other Economic IndicatorsPopulation (Ths) 1421.3 1426.3 1431.3 1436.4 1441.6 1446.9 1452.2 1457.6 1463.2 1468.8 1474.3 1479.9 1485.6 Pct Chg Year Ago 1.3 1.3 1.4 1.4 1.4 1.4 1.5 1.5 1.5 1.5 1.5 1.5 1.5Labor Force (Ths) 729 732.9 736.7 739.9 742.7 745.5 748.4 751.5 754.6 757.4 760.1 762.7 765.1 Pct Chg Year Ago 3.6 2.8 1.9 1.9 1.9 1.7 1.6 1.6 1.6 1.6 1.6 1.5 1.4Unemployment Rate (%) 5.7 5.7 5.5 5.4 5.4 5.4 5.4 5.4 5.4 5.4 5.4 5.4 5.4Total Housing Starts 7746 8178 8699 9203 9528 9936 10127 10467 11224 11537 11613 11832 11863 Single-Family 6593 6717 6715 6820 6644 6609 6646 6921 7496 7787 7963 8083 8120 Multifamily 1152 1461 1984 2383 2884 3327 3481 3546 3729 3749 3650 3749 3743

Institute for Economic Competitiveness 45
L A K E L A N D
O U T L O O K S U M M A R I E SThe Lakeland Metropolitan Statistical Area (MSA)
is expected to show low levels of growth in most of the economic indicators. Personal income is expected to grow moderately at average of 4.6 percent annually, while the real per capita income level will average $35,500, the third lowest of the twelve MSAs. Average annual wage growth is expected to be 3.2 percent, and the average annual wage level is expected to be at $45,200. Population growth is expected to average 1.0 percent annually. Gross Metro Product will be at an average level of 17,598.35 million dollars.
Employment growth is expected to average 1.5 percent annually. The unemployment rate for the metro will average 6.6 percent, the second highest of the twelve forecasted MSAs.
The Construction and Mining sector is expected to be the fastest growing sector in the area, averaging 7.3 percent annual growth. This is followed by the Trade, Transportation, & Utilities sector averaging 1.8 percent annual growth, and the Professional and Business Services sector averaging 1.5 percent. The Federal Government and State and Local Government sectors will experience a decline with an average annual growth rate of -2.6 and -0.5 percent respectively.
M E T R O N E W S S U M M A R I E SUnemployment Down, In Polk County; Job Growth Still Weak
• According to government workforce data, Polk’s unemployment dropped to 6.8 percent in October, down from 7.8 percent the year before and 7.3 percent in September.
• The county recorded 1,800 more jobs than in October 2013. Industries with the most job growth included retail, education and health services, and manufacturing.
• Florida’s unemployment rate stands at 6.0 percent in October and is the lowest jobless rate since June 2008. The October national unemployment rate stood at 5.8 percent.
Source: Lakeland Ledger, November 21, 2014
P R O F I L E SThe Lakeland MSA is comprised only of Polk
County. It is located in the western-center of the state and is heavily agriculturally based, especially in citrus. Lakeland is the home to Legoland Florida, and is also the location of Publix Supermarket headquarters. Each year the Detroit Tigers host spring training at Joker Marchant Stadium. Lakeland recently welcomed Florida Polytechnic University, the newest member of the State University System.
QUICK FACTS:• Population estimate of 623,009 as of July 1, 2013
(U.S. Census Bureau).• Civilian labor force of 277,154 in October 2014
(Florida Research and Economic Database).• An unemployment rate of 6.8% as of October
2014, not seasonally adjusted. This amounts to 18,884 unemployed people (Florida Research and Economic Database).
TOP AREA EMPLOYERS:• Publix Super Markets, Inc. – 6,644• Lakeland Regional Medical Center – 4,540• City of Lakeland – 2,600• GEICO – 2,300• Watson Clinic – 1,600• GC Services – 1,000• Rooms To Go – 900• Saddle Creek Logistics – 625• Stryker Sustainability Solutions – 600
Source: Lakeland Economic Development Council

46 Florida & Metro Forecast - December 2014
L A K E L A N D
2014-15 forecast: Citrus Season Shapes Up Favorably• Marisa Zansler, chief economist at the Florida
Department of Citrus believes Orange growers should see higher farm prices for the fruit in the current season, which began Oct 1. Zansler predicts a 10.5 percent increase in price for early and mid-season oranges harvests from October to March.
• Due to greening primarily, Florida orange production has been reduced from 242 million boxes in the 2003-04 season to just 108 million boxes this season. Meanwhile growers in Brazil, the largest orange grower and OJ processor country in the world, are predicting a 6 percent increase in their 2014-15 crop.
• With 81,810 grove acres and 10 million trees at the start of the 2014-15 season, Polk leads the state’s citrus-producing counties.
Source: Lakeland Ledger, October 23, 2014
Publix Reports Profits Up 6.8 percent, Stock Down Slightly
• Lakeland-based Publix Super Markets Inc. made a quarterly profit of $384.2 million, up 6.8 percent from the same time last year.
• Total sales were $7.5 billion, an increase of 5.1 percent on an annual basis. Same-store sales (which measures sales activity at locations open at least a year) grew by 5 percent.
• According to the Department of Agriculture, September’s overall grocery prices were up 3.2 percent compared to the same time last year.
Source: Lakeland Ledger, November 3, 2014
Winter Haven Chamber Leads ‘Shop Local’ Promotion • Winter Haven Chamber of Commerce launched a
“Tis the Season to Shop Local” promotion aimed at encouraging consumers to support businesses in the area.
• Chamber President and CEO Katie Worthington estimated 80 percent of the chamber’s 650 members are small businesses—those with 50 or fewer workers.
• The promotion will last November 7 to December 24. Businesses were invited to send any discounts they wanted advertised to be included in the Chamber’s promotional flier.
Source: Lakeland Ledger, October 30, 2014
Lakeland Lands AutoFest Events• Beginning in November 2015, the Sun ‘n Fun
complex will welcome AutoFest, a pair of annual events currently held each fall and winter in Zephryhills.
• Michael Garland, spokesman for Autofest organizer Carlisle Events, estimates that Autofest brings 20,000 to 30,000 people to Festival Park in Zephyrhills. With the relocation to Lakeland, the event will be able to expand capacity to accommodate a collector car show, more space for vendors, and room to park overnight campers, RVs, and pilots flying in.
• The Fall Autofest will be held November 12-15, 2015, and the Winter Autofest will be held February 25-28, 2016. Events will include a swap meet, classic cars for sale, and a 300-plus car auction.
Source: Lakeland Ledger, November 13, 2014
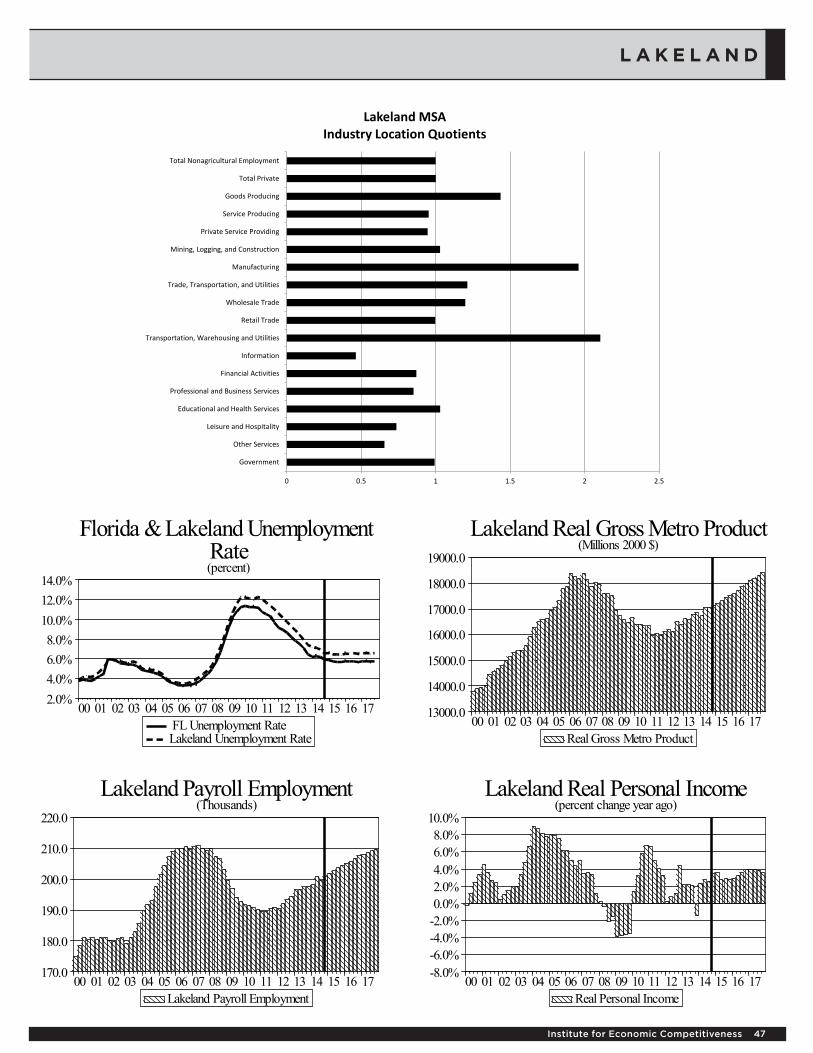
Institute for Economic Competitiveness 47
L A K E L A N D
0 0.5 1 1.5 2 2.5
Total Nonagricultural Employment
Total Private
Goods Producing
Service Producing
Private Service Providing
Mining, Logging, and Construction
Manufacturing
Trade, Transportation, and Utilities
Wholesale Trade
Retail Trade
Transportation, Warehousing and Utilities
Information
Financial Activities
Professional and Business Services
Educational and Health Services
Leisure and Hospitality
Other Services
Government
Lakeland MSA
Industry Location Quotients
171615141312111009080706050403020100
220.0
210.0
200.0
190.0
180.0
170.0
Lakeland Payroll Employment(Thousands)
Lakeland Payroll Employment
171615141312111009080706050403020100
19000.0
18000.0
17000.0
16000.0
15000.0
14000.0
13000.0
Lakeland Real Gross Metro Product(Millions 2000 $)
Real Gross Metro Product
171615141312111009080706050403020100
10.0%8.0%6.0%4.0%2.0%0.0%
-2.0%-4.0%-6.0%-8.0%
Lakeland Real Personal Income(percent change year ago)
Real Personal Income
171615141312111009080706050403020100
14.0%12.0%10.0%8.0%6.0%4.0%2.0%
Florida & Lakeland Unemployment Rate(percent)
FL Unemployment RateLakeland Unemployment Rate

48 Florida & Metro Forecast - December 2014
L A K E L A N D
Annual Outlook for Lakeland, FL December 2014
2009 2010 2011 2012 2013 2014 2015 2016 2017Personal Income (Billions $)Total Personal Income 18.7 19.8 21.3 22.0 22.6 23.5 24.5 25.7 27.1 Pct Chg Year Ago -3.8 6.0 7.3 3.5 2.4 4.2 4.1 4.8 5.5 Wages and Salaries 7.7 7.7 7.8 8.0 8.3 8.7 9.1 9.5 10.0 Nonwage Income 11.0 12.2 13.5 14.0 14.3 14.9 15.4 16.1 17.1Real Personal Income (05$) 18.7 19.5 20.4 20.8 21.0 21.6 22.3 23.0 23.9 Pct Chg Year Ago -3.7 4.3 4.7 1.7 1.2 2.8 3.0 3.4 3.8Per Capita Income (Ths) 31.2 32.8 34.8 35.7 36.2 37.3 38.5 40.0 41.6Real Per Capita Income (05$) 31.2 32.3 33.5 33.7 33.7 34.3 35.0 35.9 36.8Average Annual Wage (Ths) 39.0 39.9 40.6 41.4 41.9 43.1 44.3 45.8 47.6 Pct Chg Year Ago 0.9 2.3 1.6 2.1 1.1 2.9 2.8 3.4 3.8Establishment Employment (Place of Work, Thousands, SA)Total Employment 195.8 191.1 190.1 192.6 197.1 199.8 203.2 206.2 208.8 Pct Chg Year Ago -5.2 -2.4 -0.5 1.3 2.3 1.4 1.7 1.5 1.3Manufacturing 14.8 14.2 14.2 14.6 15.7 16.3 16.4 16.4 16.3 Pct Chg Year Ago -9.3 -4.3 0.0 2.9 7.6 3.6 0.9 -0.2 -0.3Nonmanufacturing 181.0 176.9 175.9 178.0 181.4 183.6 186.8 189.9 192.5 Pct Chg Year Ago -4.9 -2.3 -0.6 1.2 1.9 1.2 1.7 1.7 1.4 Construction & Mining 12.1 11.0 10.4 10.2 10.9 11.1 12.1 13.3 14.4 Pct Chg Year Ago -15.3 -8.8 -5.9 -1.4 6.4 2.4 8.5 9.8 8.6 Trade, Trans, & Utilities 45.3 44.9 46.0 47.1 48.2 49.9 50.8 51.4 51.9 Pct Chg Year Ago -5.9 -0.9 2.4 2.4 2.5 3.5 1.8 1.1 1.0 Wholesale Trade 9.1 8.7 9.0 9.2 9.5 10.0 10.3 10.5 10.7 Retail Trade 24.2 24.2 24.5 24.6 25.3 26.2 26.5 26.3 25.9 Trans, Wrhsng, & Util 12.0 12.0 12.5 13.2 13.4 13.7 13.9 14.4 14.8 Information 1.9 1.8 1.6 1.6 1.6 1.6 1.6 1.6 1.7 Pct Chg Year Ago -9.2 -7.0 -6.6 -3.0 -1.6 1.0 1.7 1.7 0.5 Financial Activities 12.0 11.8 11.6 11.4 11.6 11.7 11.8 11.8 11.8 Pct Chg Year Ago -3.4 -1.7 -1.4 -1.4 1.6 1.0 0.7 0.1 -0.3 Prof & Business Services 27.4 25.7 24.3 25.4 26.2 26.0 26.6 27.4 27.8 Pct Chg Year Ago -7.5 -6.3 -5.4 4.4 3.3 -0.9 2.4 2.9 1.7 Educ & Health Services 29.0 29.2 29.7 29.4 29.9 30.4 30.9 31.2 31.5 Pct Chg Year Ago -1.4 0.5 1.7 -0.9 1.6 1.8 1.5 1.2 0.8 Leisure & Hospitality 17.3 16.8 17.8 18.9 19.6 20.2 20.6 20.6 20.7 Pct Chg Year Ago -4.5 -3.3 6.0 6.1 3.8 3.1 1.7 0.4 0.3 Other Services 6.1 5.8 5.4 5.3 5.2 5.2 5.2 5.3 5.3 Pct Chg Year Ago -5.6 -4.5 -7.0 -2.0 -1.4 0.0 0.2 0.6 0.4 Federal Government 1.4 1.6 1.2 1.1 1.1 1.0 1.0 1.0 1.0 Pct Chg Year Ago -1.3 15.8 -24.6 -7.6 -3.8 -6.3 -1.0 -1.4 -1.5 State & Local Government 28.5 28.4 28.0 27.6 27.1 26.4 26.2 26.3 26.6 Pct Chg Year Ago 0.6 -0.3 -1.6 -1.3 -1.8 -2.7 -0.6 0.4 0.9Other Economic IndicatorsPopulation (Ths) 599.4 604.5 610.9 617.0 623.9 630.0 635.6 642.0 649.7 Pct Chg Year Ago 0.7 0.9 1.1 1.0 1.1 1.0 0.9 1.0 1.2Labor Force (Ths) 273.0 277.0 270.5 272.0 273.5 276.5 284.5 291.2 296.9 Pct Chg Year Ago -0.1 1.4 -2.3 0.6 0.6 1.1 2.9 2.4 1.9Unemployment Rate (%) 11.1 12.2 11.6 10.0 8.2 7.0 6.5 6.6 6.6Total Housing Starts 1203.3 1223.5 1114.4 1445.0 1924.7 2606.3 3478.8 4430.7 5171.8 Single-Family 1190.1 1168.5 1058.9 1392.7 1892.2 2592.5 3252.5 3650.8 4233.1 Multifamily 13 55 55 52 32 14 226 780 939

Institute for Economic Competitiveness 49
L A K E L A N D
Quarterly Outlook for Lakeland, FL December 2014
2014Q4 2015Q1 2015Q2 2015Q3 2015Q4 2016Q1 2016Q2 2016Q3 2016Q4 2017Q1 2017Q2 2017Q3 2017Q4
Personal Income (Billions $)Total Personal Income 23.9 24.2 24.4 24.6 24.9 25.2 25.5 25.8 26.2 26.6 26.9 27.2 27.6 Pct Chg Year Ago 4.8 4.7 3.7 3.9 4 4.2 4.6 5 5.3 5.5 5.6 5.6 5.3 Wages and Salaries 8.8 8.9 9 9.1 9.2 9.3 9.4 9.6 9.7 9.8 9.9 10.1 10.2 Nonwage Income 15.1 15.3 15.4 15.5 15.6 15.9 16 16.2 16.5 16.7 17 17.2 17.4Real Personal Income (05$) 21.9 22.1 22.2 22.3 22.5 22.7 22.9 23.1 23.4 23.6 23.8 24 24.2 Pct Chg Year Ago 3.5 3.6 2.8 2.9 2.7 2.8 3.2 3.6 3.9 3.9 3.9 3.8 3.6Per Capita Income (Ths) 37.8 38.1 38.4 38.6 39 39.4 39.7 40.1 40.6 41.1 41.5 41.8 42.2Real Per Capita Income (05$) 34.6 34.9 35 35 35.3 35.5 35.7 35.9 36.2 36.5 36.7 36.9 37.1Average Annual Wage (Ths) 43.5 43.8 44.1 44.5 44.8 45.2 45.6 46 46.4 46.9 47.3 47.8 48.3 Pct Chg Year Ago 3.5 2.9 2.6 2.8 3 3.2 3.4 3.5 3.6 3.7 3.8 3.9 4
Establishment Employment (Place of Work, Thousands, SA)Total Employment 200.8 201.7 202.8 203.7 204.4 205.1 205.8 206.6 207.5 208.1 208.6 209.1 209.5 Pct Chg Year Ago 1.5 1.7 1 2.1 1.8 1.7 1.5 1.4 1.5 1.4 1.4 1.2 1Manufacturing 16.3 16.4 16.4 16.4 16.5 16.4 16.4 16.4 16.3 16.3 16.3 16.3 16.3 Pct Chg Year Ago 2.3 1.1 0.5 1.2 0.7 0.3 -0.2 -0.4 -0.7 -0.5 -0.2 -0.2 -0.1Nonmanufacturing 184.4 185.4 186.4 187.3 188 188.7 189.4 190.3 191.1 191.7 192.3 192.8 193.2 Pct Chg Year Ago 1.4 1.8 1 2.2 1.9 1.8 1.6 1.6 1.7 1.6 1.5 1.3 1.1 Construction & Mining 11.5 11.7 11.9 12.2 12.5 12.7 13.1 13.5 13.8 14.1 14.3 14.5 14.7 Pct Chg Year Ago 4.5 6.8 7.5 11.1 8.7 8.9 9.5 10 10.5 10.4 9.4 7.9 6.7 Trade, Trans, & Utilities 50.3 50.5 50.7 50.9 51.1 51.2 51.3 51.4 51.6 51.7 51.8 51.9 52.1 Pct Chg Year Ago 3.4 2.5 1.4 1.7 1.5 1.3 1.2 0.9 1 1 1 1.1 1 Wholesale Trade 10.1 10.2 10.2 10.3 10.3 10.4 10.5 10.5 10.6 10.7 10.7 10.8 10.8 Retail Trade 26.4 26.5 26.5 26.5 26.5 26.4 26.3 26.2 26.2 26 25.9 25.9 25.8 Trans, Wrhsng, & Util 13.7 13.8 13.8 14 14.1 14.2 14.3 14.4 14.6 14.7 14.8 14.9 15 Information 1.6 1.6 1.6 1.6 1.6 1.6 1.6 1.7 1.7 1.7 1.7 1.7 1.6 Pct Chg Year Ago 1.8 4.8 1.4 1 -0.3 -1.9 1.8 3.6 3.1 3.1 0.6 -1 -0.7 Financial Activities 11.8 11.8 11.8 11.8 11.8 11.8 11.8 11.8 11.8 11.8 11.8 11.8 11.7 Pct Chg Year Ago 0.9 1 0.5 0.8 0.5 0.3 0.1 -0.1 0 0 -0.1 -0.3 -0.9 Prof & Business Services 26 26.2 26.5 26.7 27 27.1 27.2 27.4 27.6 27.8 27.8 27.8 27.9 Pct Chg Year Ago 0.4 2.3 -0.4 3.7 4 3.6 2.9 2.6 2.5 2.3 2.2 1.5 0.8 Educ & Health Services 30.5 30.7 30.9 30.9 30.9 31 31.2 31.3 31.4 31.4 31.5 31.5 31.5 Pct Chg Year Ago 2.1 1.8 1.4 1.5 1.2 1.1 0.9 1.1 1.7 1.3 1 0.7 0.2 Leisure & Hospitality 20.3 20.5 20.5 20.6 20.6 20.7 20.6 20.6 20.6 20.6 20.7 20.7 20.8 Pct Chg Year Ago 1.5 2.2 1.7 1.7 1.4 1 0.5 0.1 -0.2 -0.4 0.1 0.5 0.9 Other Services 5.2 5.2 5.2 5.2 5.2 5.3 5.3 5.3 5.3 5.3 5.3 5.3 5.3 Pct Chg Year Ago 0.3 -0.6 -0.3 0.8 0.8 0.6 0.6 0.6 0.7 0.7 0.5 0.3 0.1 Federal Government 1 1 1 1 1 1 1 1 1 1 1 1 1 Pct Chg Year Ago -0.4 -1.1 -1.2 -0.6 -1.1 -1.2 -1.5 -1.5 -1.6 -1.5 -1.4 -1.5 -1.6 State & Local Government 26.2 26.2 26.2 26.2 26.3 26.3 26.3 26.4 26.4 26.5 26.5 26.6 26.7 Pct Chg Year Ago -2.7 -1.5 -1.1 0.2 0.2 0.2 0.3 0.5 0.5 0.7 0.8 0.9 1.1
Other Economic IndicatorsPopulation (Ths) 632.1 633.5 634.9 636.3 637.8 639.4 641 642.8 644.7 646.7 648.7 650.8 652.8 Pct Chg Year Ago 0.9 0.9 0.9 0.9 0.9 0.9 1 1 1.1 1.2 1.2 1.2 1.3Labor Force (Ths) 279.1 281.5 283.7 285.6 287.3 288.9 290.5 292 293.5 294.9 296.3 297.6 298.7 Pct Chg Year Ago 2.6 3.2 2.5 2.9 2.9 2.6 2.4 2.2 2.2 2.1 2 1.9 1.8Unemployment Rate (%) 6.6 6.6 6.5 6.4 6.5 6.5 6.6 6.6 6.6 6.6 6.6 6.6 6.6Total Housing Starts 2843 3108 3359 3648 3800 4036 4234 4535 4918 5084 5141 5231 5231 Single-Family 2794 3042 3200 3381 3386 3441 3500 3662 4000 4149 4226 4280 4278 Multifamily 49 66 158 267 414 594 735 873 918 935 915 951 954

50 Florida & Metro Forecast - December 2014
M I A M I – F O R T L A U D E R D A L E – P O M PA N O B E A C H
O U T L O O K S U M M A R I E SThe Miami–Fort Lauderdale–Pompano Beach area
is expected to show mixed levels of growth in the economic indicators. Personal income is expected to grow an average of 5.0 percent annually. The average real per capita income level of $44,100 is the second highest in the areas studied. Average annual wage growth will be 3.2 percent. The average annual wage level is expected to be $54,700, the highest of the studied areas. Miami is expected to average a population growth of 1.2 percent each year. The area has the highest Gross Metro Product of the MSAs studied at an average level of 284,112.33 million dollars.
Employment is expected to grow at an average rate of 2.1 percent each year, while unemployment is expected to be moderate at an average rate of 5.7 percent.
Miami’s fastest growing sector is expected to be the Construction and Mining sector at an average of 8.7 percent annually, followed by the Professional and Business Services sector at 3.5 percent each year. The Federal Government sector is expected to experience a decline with an average annual growth rate of -1.3 percent.
M E T R O N E W S S U M M A R I E SSouth Florida housing market among least affordable
• South Florida rising house prices are not in conjunction with income. This has made the housing market in this area become one of the least affordable in the country.
• Interest.com, a trusted provider of personal financial advice and subsidiary of North Palm Beach-based Bankrate, looked at housing affordability in the 25 largest metro markets. The results showed that an average resident is earning 26 percent below what it would take to purchase a median-priced home.
• South Florida has a median income of $49,946. The median home price in South Florida is $270,000.
Source: South Florida Business Journal, November 17, 2014
P R O F I L E SThe Miami–Fort Lauderdale–Pompano Beach MSA
is comprised of Miami-Dade County, Broward County, and Palm Beach County. Located on the southeast coast of Florida, Miami is home to the Port of Miami, the largest cruise ship port in the world and one of nation’s busiest cargo ports. Miami is also home to many sports teams including the Miami Dolphins, the Miami Heat, the Florida Marlins and the Florida Panthers, as well as many institutions of higher education including the University of Miami and Florida International University.
QUICK FACTS:• Metro area population estimate of 5,828,191 as of
July 1, 2013 (U.S. Census Bureau).• Miami-Dade County population estimate of
2,617,176 as of July 1, 2013 (U.S. Census Bureau).• Broward County population estimate of
1,838,844 as of July 1, 2013 (U.S. Census Bureau).
• Palm Beach County population estimate of 1,372,171 as of July 1, 2013 (U.S. Census Bureau).
• Civilian labor force of 3,050,995 in October 2014 (Florida Research and Economic Database).
• An unemployment rate of 5.7% as of October 2014, not seasonally adjusted. This amounts to 175,106 unemployed people (Florida Research and Economic Database).
TOP AREA EMPLOYERS:• Miami-Dade County Public School – 48,571• Miami-Dade County – 29,000• Federal Government – 19,500• Florida State Government – 17,100• University of Miami – 16,000• Baptist Health South Florida – 13,376• Jackson Health System – 12,571• Publix Super Markets – 10,800• American Airlines – 9,000• Florida International University – 8,000• Miami-Dade College – 6,200
Source: The Beacon Council

Institute for Economic Competitiveness 51
M I A M I – F O R T L A U D E R D A L E – P O M P A N O B E A C H
Related Group inks $17M apartment deal• Related Group was involved in the purchase and sale
of a $16.75 million apartment complex in northwest Miami-Dade County.
• For the deal to press through, a $11.3 million mortgage through Wells Fargo Bank with support from Fannie Mae plus a $3 million loan from Miami-Dade County’s public housing program was secured.
• Built in 1999, the apartment complex has 194 units with 466 bedrooms. It totals 169,561 square feet on 8.4 acres.
Source: South Florida Business Journal, November 26, 2014
Boca Raton firm tops list of fast-growing Florida tech companies
• A Boca Raton biotech company ranked as the fastest-growing technology company in Florida
• TherapeuticsMD Inc. (NYSE: TXMD) saw substantial revenue growth of around 3,871 percent 2009 to 2013, according to the 2014 Deloitte Technology Fast 500 which ranks the company at 41st.
• In regards to other companies in Florida, Miami-based biotech company OPKO Health (NYSE: OPK) ranked 65th on the list of North American companies, with 2,085 percent growth.
• Financial news website Bankrate (NYSE: RATE) ranked 340th. Miami-based satellite provider Emerging Markets Communications ranked 492nd. The list also included seven other Florida companies.
Source: South Florida Business Journal, November 24, 2014
Medical tourism: The next big trend in Florida health care
• Experts at the BioFlorida annual conference in Ft. Lauderdale said patients traveling to secure an exceptional quality and/or lower cost of health care are spearheading the future of the Florida healthcare industry.
• Florida has pledged $5 million during the next
three years to advertise the state as a destination for medical tourism.
• Not only does the state need to focus on promotion, but in regards to tourism, as Anthony Brinceno, Vice President of Global Health, stated, the success will also come by looking at specialized health care and the patient’s overall experience in traveling to Florida.
Source: South Florida Business Journal, October 14, 2014
Badia Spices buys warehouse in Doral after county approves bond
• Badia Spices purchased a warehouse for $10 million for a Doral warehouse to aid in expanding its business with added help from a county-approved bond.
• The building that was purchased was acquired in 2012 for $8.5 million.
• The bond approved by the Miami-Dade County was for Badia Spices to purchase the warehouse and add 20 jobs to its current workforce of around 200.
• The company relayed to the county that it would need the facility to support their increasing growth in sales and also use some of the funds to make improvements to the warehouse. In 2013 Badia Spices stated that they generated $102 million in revenue. This was an improvement from $89.4 million in 2012.
Source: South Florida Business Journal, December 4, 2014

52 Florida & Metro Forecast - December 2014
M I A M I – F O R T L A U D E R D A L E – P O M PA N O B E A C H
0 0.2 0.4 0.6 0.8 1 1.2 1.4 1.6
Total Nonagricultural Employment
Total Private
Goods Producing
Service Producing
Private Service Providing
Mining, Logging, and Construction
Manufacturing
Trade, Transportation, and Utilities
Wholesale Trade
Retail Trade
Transportation, Warehousing and Utilities
Information
Financial Activities
Professional and Business Services
Educational and Health Services
Leisure and Hospitality
Other Services
Government
Miami - Fort Lauderdale - Pompano Beach MSA
Industry Location Quotients
171615141312111009080706050403020100
2600.0
2500.0
2400.0
2300.0
2200.0
2100.0
Miami Payroll Employment(Thousands)
Miami Payroll Employment
171615141312111009080706050403020100
300000.0
280000.0
260000.0
240000.0
220000.0
200000.0
Miami Real Gross Metro Product(Millions 2000 $)
Real Gross Metro Product
171615141312111009080706050403020100
8.0%6.0%4.0%2.0%0.0%
-2.0%-4.0%-6.0%-8.0%
-10.0%
Miami Real Personal Income(percent change year ago)
Real Personal Income
171615141312111009080706050403020100
12.0%
10.0%
8.0%
6.0%
4.0%
2.0%
Florida & Miami Unemployment Rate(percent)
FL Unemployment RateMiami Unemployment Rate

Institute for Economic Competitiveness 53
M I A M I – F O R T L A U D E R D A L E – P O M P A N O B E A C H
Annual Outlook for Miami-Fort Lauderdale-Pompano Beach (MD), FL December 2014
2009 2010 2011 2012 2013 2014 2015 2016 2017Personal Income (Billions $)Total Personal Income 224.3 232.3 247.1 255.1 261.3 274.0 286.1 300.4 317.4 Pct Chg Year Ago -6.2 3.6 6.4 3.2 2.4 4.9 4.4 5.0 5.7 Wages and Salaries 106.1 107.0 110.9 115.8 120.0 126.9 133.4 140.3 147.9 Nonwage Income 118.2 125.3 136.3 139.3 141.3 147.2 152.7 160.1 169.5Real Personal Income (05$) 224.3 228.5 237.3 240.5 243.4 251.9 260.2 269.6 280.4 Pct Chg Year Ago -6.2 1.9 3.8 1.3 1.2 3.5 3.3 3.6 4.0Per Capita Income (Ths) 40.7 41.5 43.4 44.2 44.8 46.4 47.9 49.6 51.8Real Per Capita Income (05$) 40.7 40.8 41.7 41.7 41.7 42.7 43.5 44.5 45.7Average Annual Wage (Ths) 47.7 48.4 49.3 50.3 50.8 52.2 53.7 55.4 57.5 Pct Chg Year Ago 0.4 1.5 1.8 2.1 1.0 2.8 2.8 3.3 3.8Establishment Employment (Place of Work, Thousands, SA)Total Employment 2212.0 2195.0 2234.7 2287.4 2349.3 2415.7 2472.5 2517.8 2557.2 Pct Chg Year Ago -6.3 -0.8 1.8 2.4 2.7 2.8 2.4 1.8 1.6Manufacturing 80.5 76.0 76.3 77.1 77.6 79.2 79.9 79.4 78.7 Pct Chg Year Ago -13.8 -5.6 0.5 0.9 0.7 2.0 0.9 -0.6 -0.9Nonmanufacturing 2131.5 2119.0 2158.3 2210.3 2271.7 2336.5 2392.7 2438.4 2478.6 Pct Chg Year Ago -5.9 -0.6 1.9 2.4 2.8 2.9 2.4 1.9 1.6 Construction & Mining 102.9 89.0 85.7 87.1 93.7 101.0 109.9 119.8 131.1 Pct Chg Year Ago -24.0 -13.5 -3.7 1.7 7.6 7.8 8.8 9.0 9.4 Trade, Trans, & Utilities 505.8 505.0 520.5 537.2 550.0 568.1 581.0 588.7 595.5 Pct Chg Year Ago -6.6 -0.2 3.1 3.2 2.4 3.3 2.3 1.3 1.2 Wholesale Trade 135.5 132.7 134.5 139.2 140.4 142.1 144.4 147.7 150.9 Retail Trade 281.2 284.0 294.9 303.8 312.7 325.5 331.9 331.3 329.2 Trans, Wrhsng, & Util 89.1 88.4 91.0 94.3 96.9 100.4 103.6 107.8 111.8 Information 44.9 43.6 44.1 45.2 46.1 46.8 47.2 47.8 47.9 Pct Chg Year Ago -9.6 -3.0 1.2 2.5 1.9 1.5 0.9 1.1 0.3 Financial Activities 156.3 153.3 156.4 161.4 165.0 168.1 170.0 170.6 170.6 Pct Chg Year Ago -9.1 -1.9 2.0 3.2 2.2 1.9 1.2 0.3 0.0 Prof & Business Services 322.2 325.8 339.5 353.1 371.2 385.4 400.6 415.2 426.1 Pct Chg Year Ago -7.9 1.1 4.2 4.0 5.1 3.8 3.9 3.7 2.6 Educ & Health Services 330.6 335.7 341.1 341.8 346.5 353.2 360.9 368.3 372.7 Pct Chg Year Ago 1.3 1.5 1.6 0.2 1.4 1.9 2.2 2.0 1.2 Leisure & Hospitality 248.2 252.2 262.1 275.7 286.3 295.6 302.9 306.0 308.9 Pct Chg Year Ago -3.7 1.6 3.9 5.2 3.8 3.3 2.5 1.0 1.0 Other Services 102.0 101.7 103.9 108.6 111.4 115.3 117.0 118.2 119.3 Pct Chg Year Ago -6.6 -0.3 2.2 4.5 2.6 3.5 1.4 1.0 1.0 Federal Government 34.1 36.7 34.1 33.8 33.5 32.8 32.5 32.2 31.8 Pct Chg Year Ago 0.7 7.6 -6.9 -1.0 -0.8 -2.2 -0.8 -1.0 -1.1 State & Local Government 284.5 276.0 271.0 266.4 267.9 270.2 270.6 271.8 274.7 Pct Chg Year Ago -2.3 -3.0 -1.8 -1.7 0.6 0.8 0.2 0.4 1.0Other Economic IndicatorsPopulation (Ths) 5515.6 5594.4 5695.4 5770.7 5836.5 5903.3 5975.9 6051.8 6131.5 Pct Chg Year Ago 1.0 1.4 1.8 1.3 1.1 1.1 1.2 1.3 1.3Labor Force (Ths) 2798.7 2836.4 2895.4 2948.5 2969.1 3016.1 3086.4 3146.0 3200.7 Pct Chg Year Ago -2.5 1.3 2.1 1.8 0.7 1.6 2.3 1.9 1.7Unemployment Rate (%) 10.3 11.2 10.3 8.7 7.4 6.1 5.6 5.6 5.6Total Housing Starts 3473.1 5026.6 7290.0 11447.0 17224.9 15533.0 22656.2 29696.0 33703.4 Single-Family 2217.1 3266.8 4124.7 5271.8 6257.6 6406.3 11076.6 15053.8 18451.5 Multifamily 1256 1760 3165 6175 10967 9127 11580 14642 15252

54 Florida & Metro Forecast - December 2014
M I A M I – F O R T L A U D E R D A L E – P O M PA N O B E A C H
Quarterly Outlook for Miami-Fort Lauderdale-Pompano Beach (MD), FL December 2014
2014Q4 2015Q1 2015Q2 2015Q3 2015Q4 2016Q1 2016Q2 2016Q3 2016Q4 2017Q1 2017Q2 2017Q3 2017Q4
Personal Income (Billions $)Total Personal Income 278.8 282 284.6 287.3 290.5 294.7 298.2 302.2 306.5 311.2 315.4 319.5 323.6 Pct Chg Year Ago 5.4 5.1 4.2 4.1 4.2 4.5 4.8 5.2 5.5 5.6 5.8 5.7 5.6 Wages and Salaries 129.1 130.9 132.6 134.2 135.9 137.6 139.4 141.2 143.1 145 146.9 148.9 150.8 Nonwage Income 149.7 151.1 152 153.1 154.6 157.1 158.8 161 163.4 166.2 168.5 170.6 172.8Real Personal Income (05$) 255.4 257.9 259.3 260.7 262.8 265.9 268.2 270.7 273.6 276.8 279.1 281.6 284.1 Pct Chg Year Ago 4 3.9 3.3 3.1 2.9 3.1 3.4 3.8 4.1 4.1 4.1 4 3.9Per Capita Income (Ths) 47 47.4 47.7 48 48.4 48.9 49.4 49.9 50.4 51 51.5 52 52.5Real Per Capita Income (05$) 43.1 43.4 43.5 43.6 43.8 44.1 44.4 44.7 45 45.4 45.6 45.8 46.1Average Annual Wage (Ths) 52.7 53.1 53.4 53.8 54.3 54.7 55.2 55.7 56.2 56.7 57.2 57.8 58.4 Pct Chg Year Ago 3.2 2.7 2.5 2.8 3.1 3.1 3.3 3.4 3.5 3.6 3.7 3.9 4
Establishment Employment (Place of Work, Thousands, SA)Total Employment 2437.5 2453 2467 2479.9 2490.2 2500.7 2511.7 2523 2535.8 2544.5 2553.6 2561.4 2569.5 Pct Chg Year Ago 2.7 2.6 2.3 2.3 2.2 1.9 1.8 1.7 1.8 1.8 1.7 1.5 1.3Manufacturing 79.6 79.7 79.9 79.9 80 79.8 79.4 79.2 79 78.9 78.8 78.6 78.4 Pct Chg Year Ago 1.6 0.9 1.2 1 0.4 0.1 -0.5 -0.9 -1.2 -1.1 -0.8 -0.7 -0.7Nonmanufacturing 2357.9 2373.3 2387.2 2400 2410.2 2420.9 2432.2 2443.8 2456.8 2465.6 2474.8 2482.8 2491.1 Pct Chg Year Ago 2.7 2.6 2.4 2.4 2.2 2 1.9 1.8 1.9 1.8 1.7 1.6 1.4 Construction & Mining 103.9 106.1 108.6 111.3 113.4 115.8 118.3 120.8 124.1 126.8 129.7 132.5 135.3 Pct Chg Year Ago 7.2 8.8 8 9.1 9.2 9.1 8.9 8.6 9.4 9.6 9.6 9.6 9 Trade, Trans, & Utilities 574.5 577 579.6 582.8 584.7 586.1 587.6 589.4 591.6 592.8 594.6 596.4 598.3 Pct Chg Year Ago 3.4 2.6 2.5 2.2 1.8 1.6 1.4 1.1 1.2 1.1 1.2 1.2 1.1 Wholesale Trade 142.2 143 143.8 144.9 145.7 146.3 147.2 148 149 149.7 150.5 151.3 152.2 Retail Trade 329.6 330.9 331.7 332.6 332.5 332.1 331.4 331 330.7 329.7 329.4 329 328.8 Trans, Wrhsng, & Util 102.1 102.3 102.9 104 105.1 106.1 107.2 108.3 109.4 110.5 111.3 112.2 113 Information 47.2 47.9 47.2 47 46.8 46.8 47.9 48.4 48 48 48 47.9 47.7 Pct Chg Year Ago 1.7 3.2 1 0.6 -1 -2.4 1.3 3.1 2.6 2.6 0.3 -1.1 -0.5 Financial Activities 169.1 169.9 170 170.1 170 170.3 170.4 170.5 170.9 171.1 171 170.4 169.7 Pct Chg Year Ago 1.8 2.3 1.1 0.8 0.5 0.2 0.3 0.2 0.5 0.4 0.3 0 -0.7 Prof & Business Services 390.6 394.4 398.7 402.6 406.5 409.6 412.8 417.1 421.5 424.1 425.7 426.6 427.9 Pct Chg Year Ago 4.4 3.6 3.9 4.1 4.1 3.8 3.6 3.6 3.7 3.6 3.1 2.3 1.5 Educ & Health Services 354.8 357.3 361 362.4 363 365 367.7 369.1 371.2 371.7 372.6 373.1 373.4 Pct Chg Year Ago 1.5 1.7 2.3 2.4 2.3 2.2 1.9 1.8 2.2 1.8 1.3 1.1 0.6 Leisure & Hospitality 298.5 300.8 302.1 303.6 305.1 306.1 305.7 305.9 306.3 306.9 308 309.6 311.2 Pct Chg Year Ago 2.9 3.3 2.1 2.4 2.2 1.8 1.2 0.8 0.4 0.2 0.8 1.2 1.6 Other Services 116.2 116.6 116.8 117.1 117.4 117.7 118 118.3 118.6 118.9 119.2 119.4 119.7 Pct Chg Year Ago 2.7 2.2 1.6 1 1 0.9 1 1 1.1 1 1 1 0.9 Federal Government 32.6 32.6 32.5 32.5 32.4 32.3 32.2 32.1 32 32 31.9 31.8 31.6 Pct Chg Year Ago -2.2 -1.2 -1 -0.3 -0.8 -0.8 -1.1 -1.1 -1.1 -1.1 -1 -1.1 -1.3 State & Local Government 270.5 270.5 270.5 270.6 270.9 271.1 271.6 272.1 272.6 273.4 274.2 275.1 276.1 Pct Chg Year Ago 0.3 0.4 -0.1 0.1 0.2 0.2 0.4 0.5 0.6 0.8 1 1.1 1.3
Other Economic IndicatorsPopulation (Ths) 5929 5947.7 5966.5 5985.4 6004.2 6023.2 6042.1 6061.3 6080.7 6100.8 6121.3 6141.7 6162.3 Pct Chg Year Ago 1.2 1.2 1.2 1.3 1.3 1.3 1.3 1.3 1.3 1.3 1.3 1.3 1.3Labor Force (Ths) 3042 3061.6 3079.8 3095 3109.3 3123.9 3138.4 3153.4 3168.1 3181.7 3195 3207.3 3218.9 Pct Chg Year Ago 2.8 2.6 2.3 2.2 2.2 2 1.9 1.9 1.9 1.8 1.8 1.7 1.6Unemployment Rate (%) 5.8 5.7 5.6 5.5 5.5 5.6 5.6 5.6 5.6 5.6 5.6 5.6 5.6Total Housing Starts 16937 19089 21813 23858 25864 27879 28806 29912 32187 33111 33233 34083 34386 Single-Family 7834 9300 10541 11872 12593 13444 14259 15415 17097 17947 18365 18681 18812 Multifamily 9104 9789 11272 11986 13271 14435 14547 14497 15091 15163 14868 15402 15574

Institute for Economic Competitiveness 55
N A P L E S - M A R C O I S L A N D
O U T L O O K S U M M A R I E SThe Naples–Marco Island Metropolitan Statistical
Area (MSA) is expected to show strong growth in most of the economic indicators. The metro area shows the highest personal income growth among the studied MSAs at an average of 6.0 percent. Real per capita income level, which is expected to average $59,300, is also the highest of the MSAs. Average annual wage will be at a level of $51,300. The average annual wage is expected to grow at a rate of 3.6 percent. Population growth will average 2.4 percent, the highest in the studied areas, and the Gross Metro Product level will be an average of 15,934.43 million dollars.
Employment growth is expected to average 2.9 percent each year, the highest of the MSAs. The metro will see an average unemployment rate of 6.0 percent.
The Construction and Mining sector represents Naples’ fastest growing sector, growing at an average rate of 8.9 percent each year. The Professional and Business Services sector and Other Services sector follow with average growth rates of 4.2 and 4.0 percent respectively. None of the sectors are expected to decline.
M E T R O N E W S S U M M A R I E SFirst steps taken in construction of Golisano Children’s Hospital
• The first phase in the production of the $200-million Golisano Children’s Hospital, south of Fort Myers, is complete.
• From a financial viewpoint, the hospital foundation has $18 million left to raise toward a goal of raising $100 million, with the hospital system helping to finance the rest of the cost.
• The current Golisano hospital inside HealthPark currently has 98 beds. The new Golisano tower with seven stories will boast 128 beds and room to expand to 160 beds. The tower will encompass 300,000 square feet of space and will have the latest medical technology along with children and family-friendly features. The new Golisano hospital is scheduled to open in April 2017.
Source: Naples Daily News, November 14, 2014
P R O F I L E SThe Naples–Marco Island MSA is comprised of
Collier County only. Located on the southwest coast of Florida it is notable for numerous recreation and leisure activities. This region is sometimes referred to as the “Crown Jewel of Southwest Florida”.
QUICK FACTS:• Population estimate of 339,642 as of July 1, 2013
(U.S. Census Bureau).• A civilian labor force of 161,348 in October 2014
(Florida Research and Economic Database).• An unemployment rate of 5.7% as of October
2014, not seasonally adjusted. This amounts to 9,237 unemployed people (Florida Research and Economic Database).
TOP AREA EMPLOYERS:
• Naples Community Hospital – 4,000 • The Ritz-Carlton, Naples – 1,110• Gargiulo, Inc. – 1,110• Arthrex, Inc – 1,056• Collier County Sheriff ’s Office – 1,029• Hometown Inspection Svc. – 900• Publix – 800• Marriott – 700• Naples Grande Beach Resort – 700• Downing Frye Realty – 550
Source: Collier Business & Economic Development

56 Florida & Metro Forecast - December 2014
N A P L E S - M A R C O I S L A N D
Commission to vote on $2.5M Collier accelerator• Collier County commissioners will vote whether
or not to approve the conditions of a $2.5 million state grant to launch two business accelerators in the county.
• $2.5 million in grant money from the state has been put on the table, however not without strings attached. In the event that the accelerators do not meet certain conditions the county would have to return the $2.5 million grant to the state.
• The objective of these accelerators is to bring global and national companies to Florida, produce high caliber jobs, and help local businesses and entrepreneurs.
• It is estimated that Collier County will need to provide $1.3 million in public funds for the project, incorporating $500,000 of the amount from the public funds in 2015. It is also expected that there will be some contributions from the public sector.
Source: Naples Daily News, November 17, 2014
Grace Place breaks ground on expansion• For disadvantaged children and families in Golden
Gate city, the first phase of a campus expansion and infrastructure renovation at Grace Place for Children and Families is headed for completion in fall 2015.
• A large proportion of this community is said to be economically disadvantaged, with around 63 percent of elementary children reading below their grade level and a small proportion of adults having less than ninth grade education. The renovation will include a computer labs, a hospitality center, a nursery, a food pantry and playground.
• At the center of the 16,000-square-foot, $5.7 million expansion is a two-story classroom building at The Van Domelen Education Center, named after principal donors William and Julia Van Domelen.
Source: Naples Daily News, November 17, 2014
Seasonal hiring drives Collier, Lee unemployment rates down
• The Florida Department of Economic Opportunity reported that Collier and Lee counties saw noteworthy drops in their unemployment rates in October due to hiring for the winter holiday season.
• The two counties had 5.7 percent unemployment in October, which had fallen from 6.3 percent in Collier in September and 6.1 percent in Lee.
• Collier saw a noticeable jump in its labor force as more people become engaged in the workforce, adding 2,696 workers in October.
• The increase in jobs was most prevalent in the leisure and hospitality industry, which added over 2,000 positions in Collier County in October.
Source: Naples Daily News, November 21, 2014

Institute for Economic Competitiveness 57
N A P L E S - M A R C O I S L A N D
0 0.2 0.4 0.6 0.8 1 1.2 1.4 1.6 1.8 2
Total Nonagricultural Employment
Total Private
Goods Producing
Service Producing
Private Service Providing
Mining, Logging, and Construction
Manufacturing
Trade, Transportation, and Utilities
Wholesale Trade
Retail Trade
Transportation, Warehousing and Utilities
Information
Financial Activities
Professional and Business Services
Educational and Health Services
Leisure and Hospitality
Other Services
Government
Naples - Marco Island MSA
Industry Location Quotients
171615141312111009080706050403020100
140.0
130.0
120.0
110.0
100.0
90.0
Naples Payroll Employment(Thousands)
Naples Payroll Employment
171615141312111009080706050403020100
18000.0
16000.0
14000.0
12000.0
10000.0
Naples Real Gross Metro Product(Millions 2000 $)
Real Gross Metro Product
171615141312111009080706050403020100
21.0%18.0%15.0%12.0%9.0%6.0%3.0%0.0%
-3.0%-6.0%-9.0%
-12.0%-15.0%-18.0%
Naples Real Personal Income(percent change year ago)
Real Personal Income
171615141312111009080706050403020100
14.0%12.0%10.0%8.0%6.0%4.0%2.0%
Florida & Naples Unemployment Rate(percent)
FL Unemployment RateNaples Unemployment Rate

58 Florida & Metro Forecast - December 2014
N A P L E S - M A R C O I S L A N D
Annual Outlook for Naples-Marco Island, FL December 2014
2009 2010 2011 2012 2013 2014 2015 2016 2017Personal Income (Billions $)Total Personal Income 17.5 18.3 19.5 20.1 20.6 21.8 22.9 24.3 26.0 Pct Chg Year Ago -13.6 4.4 6.8 2.9 2.6 5.6 5.2 6.1 7.0 Wages and Salaries 5.0 5.1 5.3 5.6 5.8 6.2 6.6 7.1 7.5 Nonwage Income 12.5 13.2 14.2 14.5 14.8 15.5 16.3 17.2 18.5Real Personal Income (05$) 17.5 18.0 18.8 19.0 19.2 20.0 20.8 21.8 23.0 Pct Chg Year Ago -13.6 2.6 4.3 1.1 1.4 4.2 4.0 4.7 5.3Per Capita Income (Ths) 54.9 56.6 59.5 60.3 60.6 62.7 64.4 66.6 69.4Real Per Capita Income (05$) 54.9 55.7 57.1 56.8 56.4 57.6 58.6 59.8 61.3Average Annual Wage (Ths) 45.0 45.8 45.9 46.5 47.0 48.7 50.3 52.0 54.1 Pct Chg Year Ago -1.4 1.6 0.4 1.3 1.0 3.5 3.3 3.5 4.0Establishment Employment (Place of Work, Thousands, SA)Total Employment 111.3 111.2 114.9 118.7 123.4 127.7 131.2 135.1 138.6 Pct Chg Year Ago -8.4 -0.1 3.3 3.3 4.0 3.4 2.7 3.0 2.6Manufacturing 2.6 2.4 2.5 2.7 3.1 3.3 3.4 3.4 3.4 Pct Chg Year Ago -11.2 -6.7 1.4 8.1 14.1 6.9 3.2 -0.3 -0.1Nonmanufacturing 108.6 108.8 112.5 116.0 120.4 124.4 127.8 131.7 135.3 Pct Chg Year Ago -8.3 0.1 3.4 3.2 3.7 3.4 2.7 3.0 2.7 Construction & Mining 10.4 9.1 9.0 9.4 10.5 11.5 12.2 13.5 14.7 Pct Chg Year Ago -27.9 -12.9 -1.0 4.5 11.6 9.9 6.4 10.4 8.8 Trade, Trans, & Utilities 21.1 21.3 22.2 22.8 24.0 24.7 25.1 25.7 26.2 Pct Chg Year Ago -7.6 0.9 4.0 2.6 5.6 2.6 1.9 2.1 2.0 Wholesale Trade 2.8 2.8 2.9 3.0 3.4 3.7 3.8 4.0 4.2 Retail Trade 16.9 17.0 17.9 18.4 19.2 19.5 19.7 20.0 20.1 Trans, Wrhsng, & Util 1.5 1.5 1.4 1.4 1.4 1.5 1.5 1.6 1.7 Information 1.6 1.5 1.5 1.4 1.5 1.5 1.5 1.6 1.6 Pct Chg Year Ago -8.9 -4.1 -4.8 -2.2 4.2 -0.5 1.0 3.1 2.0 Financial Activities 6.6 6.5 6.5 6.7 7.0 7.2 7.3 7.4 7.5 Pct Chg Year Ago -9.8 -1.0 -1.0 4.3 4.0 2.3 2.0 1.8 1.4 Prof & Business Services 10.5 11.1 12.1 13.3 13.6 14.4 15.1 15.6 16.0 Pct Chg Year Ago -4.6 5.8 9.3 9.8 2.2 5.4 4.9 3.6 2.7 Educ & Health Services 16.6 17.1 17.9 18.0 18.3 18.5 18.8 19.3 19.8 Pct Chg Year Ago -1.3 3.0 4.7 0.4 1.7 0.9 1.9 2.7 2.3 Leisure & Hospitality 21.0 21.3 22.6 23.6 24.5 25.3 25.9 26.2 26.6 Pct Chg Year Ago -8.2 1.6 5.9 4.4 4.2 3.1 2.1 1.4 1.3 Other Services 7.2 7.3 7.3 7.5 7.9 8.4 8.8 9.0 9.3 Pct Chg Year Ago -3.1 0.8 -0.2 2.5 6.2 6.8 4.1 2.7 2.5 Federal Government 0.7 0.8 0.7 0.6 0.6 0.6 0.6 0.6 0.6 Pct Chg Year Ago 1.1 14.7 -10.6 -7.3 -7.4 -0.2 1.6 0.2 0.2 State & Local Government 12.9 12.7 12.7 12.7 12.4 12.4 12.5 12.7 13.0 Pct Chg Year Ago -2.8 -1.6 0.3 -0.2 -2.7 0.2 0.7 1.9 2.4Other Economic IndicatorsPopulation (Ths) 319.1 323.1 328.3 333.6 340.5 347.4 355.4 365.0 375.0 Pct Chg Year Ago 0.7 1.2 1.6 1.6 2.1 2.0 2.3 2.7 2.8Labor Force (Ths) 143.3 145.0 148.1 152.8 155.5 161.0 167.2 174.2 181.0 Pct Chg Year Ago -3.3 1.2 2.2 3.1 1.8 3.5 3.9 4.2 3.9Unemployment Rate (%) 11.0 11.6 10.2 8.5 6.9 5.7 5.7 6.2 6.5Total Housing Starts 832.8 1194.3 1210.8 1476.8 2307.9 3141.0 3976.4 4401.1 4819.0 Single-Family 633.5 803.9 922.6 1275.7 1671.9 2477.1 2615.3 2309.0 2611.8 Multifamily 199 390 288 201 636 664 1361 2092 2207

Institute for Economic Competitiveness 59
N A P L E S - M A R C O I S L A N D
Quarterly Outlook for Naples-Marco Island, FL December 2014
2014Q4 2015Q1 2015Q2 2015Q3 2015Q4 2016Q1 2016Q2 2016Q3 2016Q4 2017Q1 2017Q2 2017Q3 2017Q4
Personal Income (Billions $)Total Personal Income 22.2 22.5 22.8 23 23.3 23.7 24.1 24.5 24.9 25.4 25.8 26.2 26.6 Pct Chg Year Ago 5.7 5.6 5 4.9 5.1 5.4 5.9 6.4 6.8 7 7.2 7.1 6.9 Wages and Salaries 6.4 6.5 6.6 6.7 6.8 6.9 7 7.1 7.2 7.3 7.5 7.6 7.7 Nonwage Income 15.8 16 16.2 16.3 16.6 16.8 17.1 17.4 17.7 18 18.3 18.6 18.9Real Personal Income (05$) 20.3 20.6 20.7 20.9 21.1 21.4 21.7 21.9 22.3 22.6 22.8 23.1 23.4 Pct Chg Year Ago 4.4 4.4 4.1 3.8 3.8 4 4.5 5.1 5.4 5.5 5.5 5.4 5.1Per Capita Income (Ths) 63.4 63.9 64.2 64.6 65.1 65.7 66.2 66.9 67.6 68.4 69.1 69.7 70.3Real Per Capita Income (05$) 58.1 58.4 58.5 58.6 58.9 59.3 59.6 59.9 60.3 60.8 61.1 61.4 61.8Average Annual Wage (Ths) 49.4 49.7 50.1 50.4 50.9 51.3 51.8 52.3 52.8 53.3 53.8 54.4 54.9 Pct Chg Year Ago 4.7 3.6 3.5 3.1 3 3.2 3.4 3.7 3.7 3.9 3.9 4 4.1
Establishment Employment (Place of Work, Thousands, SA)Total Employment 128.3 129.5 130.7 131.8 132.7 133.6 134.5 135.6 136.6 137.4 138.2 139.1 139.9 Pct Chg Year Ago 1.1 1.5 2.6 3.4 3.4 3.2 2.9 2.8 2.9 2.8 2.8 2.6 2.4Manufacturing 3.4 3.4 3.4 3.4 3.4 3.4 3.4 3.4 3.4 3.4 3.4 3.4 3.4 Pct Chg Year Ago 6 5.3 5.5 1.4 0.8 0.2 -0.3 -0.4 -0.7 -0.4 -0.1 0 0Nonmanufacturing 125 126.1 127.3 128.5 129.3 130.2 131.2 132.2 133.2 134 134.9 135.7 136.5 Pct Chg Year Ago 1 1.4 2.5 3.5 3.5 3.3 3 2.9 3 2.9 2.8 2.7 2.5 Construction & Mining 11.5 11.8 12.1 12.4 12.7 13 13.3 13.7 14 14.3 14.6 14.8 15.1 Pct Chg Year Ago 3.9 2.9 3.9 8.3 10.5 10.5 10.4 10.4 10.4 10.3 9.4 8.2 7.5 Trade, Trans, & Utilities 24.6 24.9 25 25.2 25.4 25.5 25.6 25.7 25.8 26 26.1 26.2 26.4 Pct Chg Year Ago -0.6 0 1.4 3.4 2.9 2.5 2.1 1.8 1.9 1.9 2 2 2 Wholesale Trade 3.7 3.8 3.8 3.9 3.9 3.9 4 4 4.1 4.1 4.1 4.2 4.2 Retail Trade 19.4 19.5 19.7 19.8 19.8 19.9 19.9 20 20 20 20.1 20.1 20.2 Trans, Wrhsng, & Util 1.5 1.5 1.5 1.5 1.5 1.6 1.6 1.6 1.6 1.6 1.6 1.7 1.7 Information 1.5 1.5 1.5 1.5 1.5 1.5 1.6 1.6 1.6 1.6 1.6 1.6 1.6 Pct Chg Year Ago -1.5 0.6 0.4 2.2 0.9 -0.5 3.2 5.1 4.6 4.6 2.1 0.5 0.9 Financial Activities 7.2 7.2 7.3 7.3 7.4 7.4 7.4 7.4 7.5 7.5 7.5 7.6 7.5 Pct Chg Year Ago 0.5 0.9 2.4 2.4 2.2 2 1.8 1.6 1.8 1.7 1.7 1.5 0.7 Prof & Business Services 14.6 14.8 15 15.2 15.3 15.4 15.5 15.7 15.8 15.9 16 16.1 16.1 Pct Chg Year Ago 4.2 4.6 6 4.3 4.7 4.3 3.6 3.4 3.3 3.2 3.2 2.5 1.9 Educ & Health Services 18.5 18.6 18.8 18.9 19 19.1 19.3 19.4 19.6 19.6 19.8 19.8 19.9 Pct Chg Year Ago -0.6 0.4 1.6 3 2.7 2.6 2.4 2.6 3.2 2.8 2.5 2.1 1.7 Leisure & Hospitality 25.4 25.6 25.8 25.9 26.1 26.2 26.2 26.2 26.3 26.4 26.5 26.6 26.8 Pct Chg Year Ago -0.1 0.9 2.2 2.8 2.5 2.1 1.6 1.2 0.9 0.7 1.2 1.6 1.9 Other Services 8.6 8.7 8.8 8.8 8.9 8.9 9 9.1 9.1 9.2 9.2 9.3 9.3 Pct Chg Year Ago 5.6 5.8 4.9 2.8 2.9 2.6 2.7 2.7 2.9 2.8 2.6 2.4 2.2 Federal Government 0.6 0.6 0.6 0.6 0.6 0.6 0.6 0.6 0.6 0.6 0.6 0.6 0.6 Pct Chg Year Ago -0.7 1.5 3.4 1 0.5 0.4 0.2 0.1 0.1 0.2 0.3 0.1 0 State & Local Government 12.3 12.4 12.4 12.5 12.5 12.6 12.7 12.7 12.8 12.9 13 13 13.1 Pct Chg Year Ago -0.1 -0.6 0.1 1.6 1.7 1.7 1.8 2 2 2.2 2.3 2.4 2.6
Other Economic IndicatorsPopulation (Ths) 350.2 352.1 354.2 356.4 358.8 361.2 363.7 366.2 368.8 371.2 373.7 376.3 378.8 Pct Chg Year Ago 2.1 2.1 2.2 2.3 2.5 2.6 2.7 2.7 2.8 2.8 2.8 2.7 2.7Labor Force (Ths) 162.3 164.4 166.4 168.2 169.9 171.6 173.4 175.1 176.8 178.5 180.2 181.8 183.4 Pct Chg Year Ago 3.3 2.9 3.1 4.7 4.7 4.4 4.2 4.1 4 4 3.9 3.8 3.7Unemployment Rate (%) 5.4 5.6 5.6 5.7 5.8 6 6.2 6.3 6.4 6.4 6.5 6.5 6.5Total Housing Starts 3484 3680 3918 4100 4208 4323 4307 4336 4638 4739 4750 4875 4911 Single-Family 2666 2707 2661 2629 2465 2347 2247 2214 2428 2529 2595 2649 2674 Multifamily 818 974 1257 1471 1743 1976 2060 2122 2210 2210 2156 2227 2236

60 Florida & Metro Forecast - December 2014
O C A L A
O U T L O O K S U M M A R I E SThe Ocala Metropolitan Statistical Area (MSA) is
expected to show varying strengths and weaknesses in the economic indicators. Personal income growth is expected to average 5.3 percent annually, the fourth highest of the twelve metros. Real per capita income level is the second lowest of the twelve metros at an average of $32,700. Relative to other metro areas, Ocala will have the second lowest average annual wage level at $41,500. Average annual wage growth is expected to be 3.6 percent, the highest of the MSAs. The metro has an expected annual average population growth of 2.0 percent. The Gross Metro Product is expected to average 7,727.44 million dollars, which is the lowest of the studied areas.
Employment growth is expected to average a rate of 2.0 percent annually. The unemployment rate is estimated to average 7.1 percent, the highest of the researched areas.
The Construction and Mining Services sector is expected to be the fastest growing in Ocala, averaging an annual growth rate of 8.6 percent. This is followed by the Professional and Business Services sector with 4.0 percent average annual growth. Growth in the Information, Manufacturing, and Financial Activities sectors will be -0.8 percent, -0.1 percent, and -0.2 percent, respectively.
M E T R O N E W S S U M M A R I E S
Marion jobless rate is 6.9 in October• The unemployment rate for Marion County fell to
6.9 percent in October, down from 7.7 percent in October 2013.
• Data released by the Florida Department of Economic Opportunity shows Marion County’s jobless rolls shrank year over year by 1,018 to 9,124, while its labor force grew by 346 to 131,724.
• Rusty Skinner, CEO for CareerSource Citrus Levy Marion, noted the 6.9 percent mark for the three-county region his workforce development board serves, the lowest since April’s 6.7 percent. In October, Levy County’s jobless rate was 6.5 percent and Citrus County’s was 7.1.
• The Ocala metro area has definitely had the dubious distinction of being among the few in the state to post year-over-year job losses in non-farm
P R O F I L E SComprised of Marion County only, the Ocala MSA
is located northwest of the Orlando area and is in the center of the state. The second largest national forest in Florida, the Ocala National Forest, and Silver Springs are two main outdoor attractions in the area.
QUICK FACTS:• Population estimate of 337,362 as of July 1, 2013
(U.S. Census Bureau).• Civilian labor force of 131,724 in October 2014
(Florida Research and Economic Database).• An unemployment rate of 6.9% as of October
2014, not seasonally adjusted. This amounts to 9,124 unemployed people (Florida Research and Economic Database).
TOP AREA EMPLOYERS:• Marion County School Board – 6,071• Munroe Regional Medical Center – 2,648• State of Florida (all departments) – 2,600• Wal-Mart – 2,370• Ocala Regional Health System – 2,020• Publix Super Markets, Inc. – 1,488• Marion County Board of County Commissioners
– 1,462• AT&T – 1,000• City of Ocala – 994• Lockheed Martin Employees – 981
Source: Ocala/Marion County Chamber & Economic Partnership

Institute for Economic Competitiveness 61
O C A L A
unemployment, losing 1,000 jobs, a decrease of 1.1 percent. Job sectors in Marion showing year-over-year gains included manufacturing and education and health services.
Source: Ocala Star Banner, November 21, 2014
Hospital trustees give CHS new deadline• Marion County Hospital District trustees have
reaffirmed their prior choice not to advertise a plan to enhance Munroe Regional Medical Center arranged by the health care company that now rents the hospital.
• The trustees have composed a letter to Community Health Systems complaining that the organization’s “quickly put-together” change plan does not meet the district’s desires and would not be affirmed. The arrangement is a lease requirement, and the trustees need a worthy form by Dec. 31.
• The trustees’ executive director, Jon Kurtz, asked CHS to voluntarily provide a version of the new plan to the public that omits some details that competitors might use to their advantage.
• The lease requires CHS to make $150 million in hospital improvements amid the first five years.
Source: Ocala Star Banner, October 28, 2014
Lockheed Martin booming• During past five years, Lockheed Martin’s Ocala
plant has overturned the general trend among defense contractors. A report in August by Politico.com, on what was called “the incredible shrinking defense industry,” shows that contractors like Raytheon, Northrop Grumman and Boeing’s Defense Unit cut between 14 percent and 17 percent of jobs since 2008. Lockheed Martin cut employment 21 percent in that time frame.
• But the story at the Missile and Fire Control plant in Silver Springs Shores is rather different, Lockheed Martin officials say, due to improvements in employment.
• The plant has doubled their headcount in the last five years, from right at 450 to over 900, which is at a stable mark all through 2014. They plan on holding that number at least through 2016.
• Along with the job gains, Lockheed Martin has made “millions of dollars’ worth” of capital investments in the Ocala plant, according to Johnson.
Source: Ocala Star Banner, November 22, 2014
It’s a ($94M) hit• “Horse Shows in the Sun” Marion County, more
commonly known as HITS Ocala, boosted the local economy by $94 million.
• The Sport Management Research Institute, a statistical surveying consulting firm based in Southern California, led the late study.
• The studies showed that the total economic impact to Marion County from the event was $94,035,933, which directly created almost 850 jobs and indirectly created another 82 jobs. More than 85 percent of visitors said they plan to visit Marion County again in the coming year. Almost 20 percent of visitors surveyed said they have bought real estate in Marion County.
• Included in the economic impact, visitors booked more than 84,000 room nights at hotels, rented apartments, timeshares and RV campgrounds.
Source: Ocala Star Banner, October 10, 2014
Local drivers, businesses get a boost from lower gas prices
• Gas prices peaked to around $3.70 a gallon this year in Florida. Since then the price has fallen by about $1.
• Lower gas prices means that consumers don’t have to fill their tanks up so frequently, which would create more disposable income.
• Business owners are also enjoying lower prices, as it helps to cut down their operating costs. This will allow businesses to keep more employees on staff and will aid businesses in putting extra funds away for redevelopment.
• However, although businesses are enjoying this boost, experience has taught them that it may not last. There may be expectations that price will rise again as demand increases, leading to supplies being eventually cut down.
Source: Ocala Star Banner, December 10, 2014
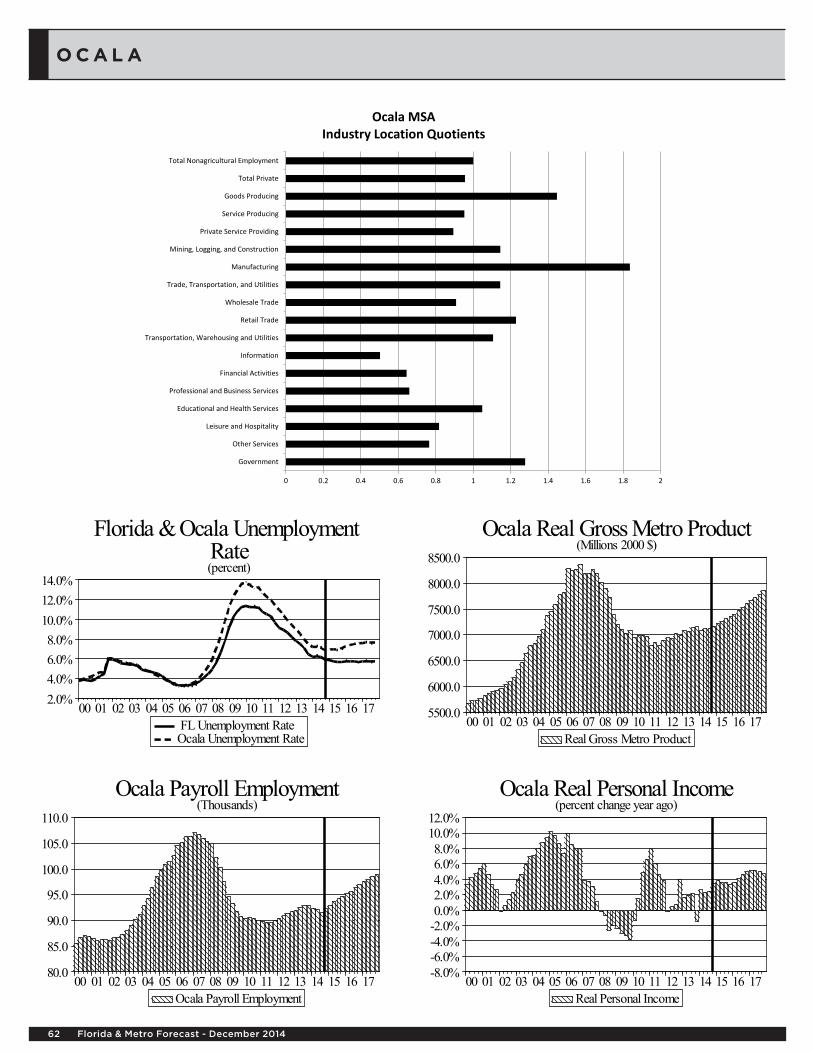
62 Florida & Metro Forecast - December 2014
O C A L A
0 0.2 0.4 0.6 0.8 1 1.2 1.4 1.6 1.8 2
Total Nonagricultural Employment
Total Private
Goods Producing
Service Producing
Private Service Providing
Mining, Logging, and Construction
Manufacturing
Trade, Transportation, and Utilities
Wholesale Trade
Retail Trade
Transportation, Warehousing and Utilities
Information
Financial Activities
Professional and Business Services
Educational and Health Services
Leisure and Hospitality
Other Services
Government
Ocala MSA
Industry Location Quotients
171615141312111009080706050403020100
110.0
105.0
100.0
95.0
90.0
85.0
80.0
Ocala Payroll Employment(Thousands)
Ocala Payroll Employment
171615141312111009080706050403020100
8500.0
8000.0
7500.0
7000.0
6500.0
6000.0
5500.0
Ocala Real Gross Metro Product(Millions 2000 $)
Real Gross Metro Product
171615141312111009080706050403020100
12.0%10.0%8.0%6.0%4.0%2.0%0.0%
-2.0%-4.0%-6.0%-8.0%
Ocala Real Personal Income(percent change year ago)
Real Personal Income
171615141312111009080706050403020100
14.0%12.0%10.0%8.0%6.0%4.0%2.0%
Florida & Ocala Unemployment Rate(percent)
FL Unemployment RateOcala Unemployment Rate

Institute for Economic Competitiveness 63
O C A L A
Annual Outlook for Ocala, FL December 2014
2009 2010 2011 2012 2013 2014 2015 2016 2017Personal Income (Billions $)Total Personal Income 10.2 10.7 11.6 11.9 12.2 12.7 13.3 14.0 15.0 Pct Chg Year Ago -3.2 4.5 8.2 3.1 2.2 4.1 4.7 5.7 6.6 Wages and Salaries 3.4 3.3 3.4 3.5 3.6 3.6 3.8 4.1 4.3 Nonwage Income 6.9 7.4 8.2 8.5 8.6 9.1 9.5 10.0 10.6Real Personal Income (05$) 10.2 10.5 11.1 11.3 11.4 11.7 12.1 12.6 13.2 Pct Chg Year Ago -3.1 2.8 5.6 1.2 1.0 2.7 3.6 4.3 4.9Per Capita Income (Ths) 30.9 32.2 34.8 35.6 36.1 37.2 38.4 39.9 41.6Real Per Capita Income (05$) 30.9 31.7 33.4 33.5 33.6 34.2 34.9 35.8 36.8Average Annual Wage (Ths) 36.1 36.4 37.1 37.7 38.1 39.3 40.6 42.1 43.9 Pct Chg Year Ago 0.3 0.9 1.8 1.6 1.1 3.1 3.4 3.7 4.1Establishment Employment (Place of Work, Thousands, SA)Total Employment 92.6 90.3 89.7 91.0 92.5 92.1 93.8 96.1 98.3 Pct Chg Year Ago -8.6 -2.4 -0.6 1.4 1.6 -0.5 1.9 2.4 2.3Manufacturing 6.7 6.4 6.4 6.7 6.9 7.0 7.1 7.0 6.9 Pct Chg Year Ago -19.3 -3.8 0.5 4.6 2.6 0.7 1.4 -1.0 -0.9Nonmanufacturing 85.9 83.9 83.3 84.3 85.6 85.1 86.8 89.1 91.3 Pct Chg Year Ago -7.7 -2.3 -0.7 1.2 1.6 -0.6 1.9 2.7 2.5 Construction & Mining 7.3 6.3 5.7 5.4 5.7 5.8 6.3 7.0 7.7 Pct Chg Year Ago -24.3 -13.7 -9.8 -5.8 7.0 0.6 8.6 11.2 10.2 Trade, Trans, & Utilities 20.2 19.8 20.3 20.9 21.5 21.8 22.3 22.6 23.0 Pct Chg Year Ago -9.9 -2.0 2.3 3.4 2.8 1.4 1.9 1.6 1.6 Wholesale Trade 3.5 3.4 3.3 3.4 3.4 3.5 3.5 3.6 3.7 Retail Trade 14.5 14.4 14.7 14.9 15.1 15.1 15.3 15.4 15.4 Trans, Wrhsng, & Util 2.1 2.1 2.3 2.7 3.0 3.2 3.4 3.5 3.7 Information 1.2 1.0 1.0 0.9 0.9 0.8 0.8 0.8 0.8 Pct Chg Year Ago -16.1 -14.9 0.1 -9.9 -3.7 -7.0 -0.6 2.3 1.2 Financial Activities 5.1 4.2 4.2 4.2 4.2 4.1 4.0 4.1 4.1 Pct Chg Year Ago -13.3 -18.6 0.8 -0.2 0.0 -3.6 -0.3 1.2 0.9 Prof & Business Services 8.3 7.9 7.9 8.6 9.0 9.0 9.4 9.8 10.2 Pct Chg Year Ago -4.3 -4.4 0.3 8.3 4.7 -0.3 4.2 4.9 3.8 Educ & Health Services 12.9 13.4 13.8 14.3 14.3 14.2 14.4 14.7 15.0 Pct Chg Year Ago -4.3 4.1 3.0 3.1 0.5 -1.2 1.4 2.4 2.0 Leisure & Hospitality 10.0 10.1 10.1 10.4 10.6 10.6 10.7 10.9 11.0 Pct Chg Year Ago -3.8 0.9 0.5 2.3 2.5 -0.1 1.2 1.4 1.4 Other Services 3.3 3.4 3.1 2.8 2.8 2.8 2.8 2.9 2.9 Pct Chg Year Ago -8.3 0.8 -6.1 -11.6 0.6 -0.1 1.3 2.1 1.9 Federal Government 0.7 0.9 0.7 0.7 0.7 0.7 0.7 0.7 0.7 Pct Chg Year Ago 1.1 27.6 -24.2 0.0 0.0 -0.1 0.1 -0.3 -0.3 State & Local Government 16.9 16.9 16.4 16.2 15.8 15.4 15.4 15.6 15.9 Pct Chg Year Ago 0.4 0.3 -3.0 -1.3 -2.3 -2.5 -0.1 1.2 1.8Other Economic IndicatorsPopulation (Ths) 331.1 332.1 333.0 335.4 337.8 341.4 345.9 352.3 359.9 Pct Chg Year Ago 0.3 0.3 0.3 0.7 0.7 1.1 1.3 1.8 2.2Labor Force (Ths) 135.2 134.7 133.9 133.1 132.3 131.8 132.7 134.5 136.9 Pct Chg Year Ago -2.2 -0.3 -0.6 -0.6 -0.6 -0.4 0.6 1.4 1.7Unemployment Rate (%) 12.6 13.4 12.1 10.2 8.3 7.1 7.0 7.4 7.7Total Housing Starts 408.6 494.1 359.0 404.3 595.5 792.0 1644.5 2502.5 3049.8 Single-Family 391.1 491.8 356.1 402.9 577.6 731.5 1516.6 2319.8 2861.7 Multifamily 18 2 3 1 18 60 128 183 188

64 Florida & Metro Forecast - December 2014
O C A L A
Quarterly Outlook for Ocala, FL December 2014
2014Q4 2015Q1 2015Q2 2015Q3 2015Q4 2016Q1 2016Q2 2016Q3 2016Q4 2017Q1 2017Q2 2017Q3 2017Q4
Personal Income (Billions $)Total Personal Income 12.9 13.1 13.2 13.3 13.5 13.7 13.9 14.1 14.4 14.6 14.9 15.1 15.3 Pct Chg Year Ago 4.8 5 4.5 4.5 4.6 5 5.5 6 6.4 6.6 6.8 6.7 6.5 Wages and Salaries 3.7 3.8 3.8 3.9 3.9 4 4 4.1 4.2 4.2 4.3 4.4 4.4 Nonwage Income 9.2 9.3 9.4 9.5 9.6 9.8 9.9 10 10.2 10.4 10.6 10.7 10.9Real Personal Income (05$) 11.8 12 12 12.1 12.2 12.4 12.5 12.7 12.8 13 13.2 13.3 13.4 Pct Chg Year Ago 3.5 3.8 3.6 3.5 3.3 3.6 4.1 4.6 5 5 5 5 4.7Per Capita Income (Ths) 37.7 38 38.3 38.5 38.9 39.3 39.6 40.1 40.5 41 41.4 41.8 42.2Real Per Capita Income (05$) 34.5 34.8 34.9 34.9 35.2 35.4 35.7 35.9 36.2 36.5 36.7 36.9 37.1Average Annual Wage (Ths) 39.9 40.2 40.5 40.8 41.2 41.5 41.9 42.3 42.8 43.2 43.6 44.1 44.6 Pct Chg Year Ago 4.2 3.6 3.5 3.3 3.2 3.4 3.6 3.8 3.9 4 4 4.2 4.3
Establishment Employment (Place of Work, Thousands, SA)Total Employment 92.3 92.9 93.5 94.1 94.6 95.2 95.7 96.4 97 97.5 98 98.5 99 Pct Chg Year Ago -0.6 0.5 1.5 2.9 2.5 2.4 2.3 2.4 2.5 2.5 2.4 2.2 2Manufacturing 7 7 7.1 7.1 7.1 7 7 7 6.9 6.9 6.9 6.9 6.9 Pct Chg Year Ago 2.1 2.7 2.1 0.7 0.1 -0.3 -0.9 -1.2 -1.5 -1.3 -0.9 -0.8 -0.8Nonmanufacturing 85.3 85.9 86.5 87.1 87.6 88.1 88.7 89.4 90.1 90.6 91.1 91.6 92.1 Pct Chg Year Ago -0.8 0.4 1.5 3 2.7 2.7 2.6 2.6 2.8 2.8 2.7 2.5 2.3 Construction & Mining 5.9 6 6.2 6.3 6.5 6.6 6.8 7.1 7.3 7.5 7.6 7.7 7.9 Pct Chg Year Ago 1.4 4.2 7.8 12.6 9.8 10.2 10.9 11.6 12.2 12.2 11.1 9.5 8.3 Trade, Trans, & Utilities 22 22.1 22.2 22.3 22.4 22.5 22.6 22.7 22.8 22.8 22.9 23 23.1 Pct Chg Year Ago 0.2 1.1 2.1 2.4 2.1 1.9 1.7 1.5 1.6 1.5 1.6 1.7 1.6 Wholesale Trade 3.5 3.5 3.5 3.5 3.6 3.6 3.6 3.6 3.7 3.7 3.7 3.8 3.8 Retail Trade 15.1 15.2 15.3 15.3 15.4 15.4 15.4 15.4 15.4 15.4 15.4 15.4 15.4 Trans, Wrhsng, & Util 3.3 3.3 3.3 3.4 3.4 3.5 3.5 3.5 3.6 3.6 3.6 3.7 3.7 Information 0.8 0.8 0.8 0.8 0.8 0.8 0.8 0.8 0.8 0.8 0.8 0.8 0.8 Pct Chg Year Ago -8.7 -1.8 -1.8 1.4 0.1 -1.3 2.5 4.3 3.9 3.8 1.3 -0.4 0 Financial Activities 4 4 4 4.1 4.1 4.1 4.1 4.1 4.1 4.1 4.1 4.1 4.1 Pct Chg Year Ago -4 -2.9 -1.3 1.6 1.4 1.3 1.2 1 1.2 1.2 1.1 0.9 0.2 Prof & Business Services 9 9.1 9.3 9.4 9.6 9.6 9.7 9.9 10 10.1 10.2 10.2 10.3 Pct Chg Year Ago 0.9 2.4 3.2 5.3 5.7 5.5 4.9 4.7 4.7 4.5 4.3 3.5 2.8 Educ & Health Services 14.2 14.2 14.4 14.4 14.5 14.5 14.7 14.8 14.9 14.9 15 15 15.1 Pct Chg Year Ago -1.7 -0.3 1.3 2.4 2.1 2.2 2 2.3 2.9 2.5 2.2 1.9 1.4 Leisure & Hospitality 10.6 10.7 10.7 10.8 10.8 10.9 10.9 10.9 10.9 10.9 11 11 11.1 Pct Chg Year Ago -1 -0.1 0.2 2.5 2.3 1.9 1.5 1.1 0.9 0.7 1.2 1.6 1.9 Other Services 2.8 2.8 2.8 2.8 2.9 2.9 2.9 2.9 2.9 2.9 2.9 3 3 Pct Chg Year Ago -0.4 0 1 2 2 1.9 2.1 2.1 2.3 2.3 2 1.8 1.6 Federal Government 0.7 0.7 0.7 0.7 0.7 0.7 0.7 0.7 0.7 0.7 0.7 0.7 0.7 Pct Chg Year Ago -0.1 0.2 0 0.3 -0.2 -0.2 -0.4 -0.4 -0.3 -0.2 -0.2 -0.3 -0.4 State & Local Government 15.3 15.4 15.4 15.4 15.5 15.5 15.6 15.6 15.7 15.8 15.8 15.9 16 Pct Chg Year Ago -1.7 -1.2 -0.7 0.8 0.8 1 1.2 1.4 1.5 1.6 1.7 1.9 2
Other Economic IndicatorsPopulation (Ths) 342.8 343.9 345.2 346.5 348 349.6 351.3 353.1 355 357 358.9 360.9 362.9 Pct Chg Year Ago 1.1 1.2 1.2 1.3 1.5 1.6 1.8 1.9 2 2.1 2.2 2.2 2.2Labor Force (Ths) 131.4 132 132.5 132.9 133.3 133.8 134.2 134.8 135.3 135.9 136.5 137.2 137.8 Pct Chg Year Ago 0 -0.1 0 1.3 1.5 1.4 1.3 1.4 1.5 1.6 1.7 1.8 1.9Unemployment Rate (%) 6.9 7 7 7 7.1 7.3 7.4 7.5 7.6 7.6 7.7 7.7 7.7Total Housing Starts 1007 1223 1526 1816 2014 2213 2376 2590 2831 2956 3025 3092 3127 Single-Family 919 1125 1404 1680 1858 2038 2196 2406 2639 2765 2840 2903 2938 Multifamily 87 98 122 136 156 176 180 184 191 190 185 189 189

Institute for Economic Competitiveness 65
O R L A N D O – K I S S I M M E E
O U T L O O K S U M M A R I E SThe Orlando–Kissimmee area is expected to show
varying strengths and weaknesses in the economic indicators. Personal income growth is expected to average 5.8 percent annually, the second highest of the twelve Metropolitan Statistical Areas (MSAs). The real per capita income level is expected to average $33,500. Average annual wage growth will be 3.1 percent. The average annual wage will be at a level of $48,300. The Orlando MSA will see an average population growth of 2.1 percent, the second highest of the studied MSAs. Gross Metro Product is expected to average at 117,258.12 million dollars, the third highest of the MSAs.
Employment growth is forecasted to average 3.0 percent annually, the second highest of the MSAs. The metro will see an average unemployment rate of 5.4 percent.
In the Orlando area, the fastest growing sector is expected to be the Construction and Mining sector with an average annual growth rate of 8.6 percent. This will be followed by the Professional and Business sector, with an average annual growth rate of 4.1 percent, and the Trade, Transportation, & Utilities sector at 2.4 percent. None of the sectors are expected to decline.
M E T R O N E W S S U M M A R I E S Metro Orlando home sales, median price up in October
• According to Florida Realtors, Orlando-Kissimmee-Sanford MSA single-family closed home sales were up 22.9 percent in October compared to the year-ago period. The median price increased to $179,000, up 2.4 percent compared to a year ago.
• Townhouse and condo sales increased 18.4 percent for the quarter, with median sales prices of $100,000, up 5.3 percent from a year ago.
• Florida’s housing market also reported more closed sales, higher median prices, and rising inventory in October. This is the 35th month in a row that statewide median sales prices rose year-over-year for both single-family and townhouse-condo properties.
Source: Orlando Business Journal, November 20, 2014
P R O F I L E SThe Orlando–Kissimmee MSA is comprised of Lake,
Orange, Osceola and Seminole Counties. Located in the southern center of the state, this area is home to numerous tourist attractions such as Walt Disney World, Universal Studios and Sea World. It is also home to the Orlando Magic and the Orlando City Soccer Club. Orlando hosts many conventions utilizing some of the biggest hotels in the country and America’s second largest convention center. The University of Central Florida, the nation’s second largest university, and many other places of higher education also reside in the MSA.
QUICK FACTS:
• MSA population estimate of 2,267,846 as of July 1, 2013 (U.S. Census Bureau).
• Lake County population estimate of 308,034 as of July 1, 2013 (Metro Orlando Economic Development Commission).
• Orange County population estimate of 1,224,267 as of July 1, 2013 (Metro Orlando Economic Development Commission).
• Osceola County population estimate of 298,504 as of July 1, 2013 (Metro Orlando Economic Development Commission).
• Seminole County population estimate of 436,041 as of July 1, 2013 (Metro Orlando Economic Development Commission).
• Civilian labor force of 1,215,768 in October 2014 (Florida Research and Economic Database).
• An unemployment rate of 5.4% as of October 2014, not seasonally adjusted. This amounts to 66,228 unemployed people (Florida Research and Economic Database).
TOP AREA EMPLOYERS:
• Walt Disney World Resort – 69,000• Orange County Public Schools – 22,000• Florida Hospital (Adventist Health) – 17,600• Universal Orlando (Comcast) – 17,300• Orlando Health – 14,310• University of Central Florida – 11,078• Seminole County Public Schools – 7,786• Orange County Government – 7,553• Darden Restaurants Inc. – 7,600• Osceola County Public Schools – 6,560 • SeaWorld Parks & Entertainment – 6,032• Lockheed Martin Corporation – 5,774
Source: Metro Orlando Economic Development Commission 2013

66 Florida & Metro Forecast - December 2014
O R L A N D O – K I S S I M M E E
Downtown Orlando to get 449 new luxury apartments• Charleston, South Carolina-based Greystar plans
to build a 449-unit, $70 million luxury apartment complex to be named Elan @ Audubon Park. The complex will occupy a vacant 19.5-acre site just south of Audubon Park and northwest of Orlando Fashion Square mall.
• The project will bring hundreds of temporary construction jobs to the local community and offer a new, upscale option for people looking to live close to downtown.
• The general contractor for the project is the developer’s related Greystar Development & Construction LP. First tenants are expected to move in fall 2015.
Source: Orlando Business Journal, October 28, 2014
Orlando awarded 1st, 2nd round games for 2017 NCAA Division I Men’s Basketball Championship
• The NCAA announced that Orlando and the Amway Center was awarded the opportunity to host first and second round games for the championship in 2017.
• The University of Central Florida, Stetson University, and the Central Florida Sports commission will host tournament games in partnership with the city of Orlando and Orange County.
• Orlando hosted the NCAA Division I Men’s Basketball Championship in 1993, 1996, 1999, and 2004 at the Amway Arena, and in 2014 hosted the second- and third-round games at the new Amway Center.
• The 2014 NCAA I Men’s Basketball Division attracted more than 16,000 visitors from across the U.S. and generated $13 million in economic impact.
Source: Orlando Business Journal, November 17, 2014
Downtown Orlando’s Lincoln Plaza, C. Fla. Research Park building sell for combined $94.5M
• Raleigh, North Carolina-based Highland properties bought the 253,951-square-foot Lincoln Plaza for $68.3 million ($286.96 per square foot) from 300 South Orange LLC. Highlands now owns 1.5 million square feet of office space in Orlando’s central business district.
• CIO Research Park LP, an entity related Vancouver, B.C.-based City Office REIT Inc., spent $26.5 million ($216.62 per square foot) to buy the 122,333-square-foot Kaplan University building in Central Florida Research Park from RT Ingenuity LLC.
• Office investment sales demonstrate investor interest and bring high-profile attention from other investors willing to spend on Orland-area real estates. These investors may also invest additional dollars into property renovations, creating local construction and vendor opportunities.
Source: Orlando Business Journal, December 4, 2014
Record Disney World attendance helps boost earnings• More visitors, higher ticket prices, and increased
food spending contributed for higher fourth quarter theme-park revenues, although MyMagic+ costs continue to have a negative effect on profit.
• For the quarter ending September 27, Walt Disney Co. reported a profit of $1.5 billion, a 7.5 percent increase on revenue of $12.4 billion. For the year profit was $7.5 billion on $48.8 billion in revenue. Fourth-quarter attendance was the highest ever in Walt Disney World history.
• Disney World continued to unveil new additions with the opening of the Seven Dwarfs Mine Train and the availability of MyMagic+ technology to all resort visitors.
Source: Orlando Sentinel, November 6, 2014

Institute for Economic Competitiveness 67
O R L A N D O – K I S S I M M E E
0 0.2 0.4 0.6 0.8 1 1.2 1.4 1.6 1.8
Total Nonagricultural Employment
Total Private
Goods Producing
Service Producing
Private Service Providing
Mining, Logging, and Construction
Manufacturing
Trade, Transportation, and Utilities
Wholesale Trade
Retail Trade
Transportation, Warehousing and Utilities
Information
Financial Activities
Professional and Business Services
Educational and Health Services
Leisure and Hospitality
Other Services
Government
Orlando - Kissimmee MSA
Industry Location Quotients
171615141312111009080706050403020100
1200.0
1150.0
1100.0
1050.0
1000.0
950.0
900.0
850.0
Orlando Payroll Employment(Thousands)
OrlandoPayroll Employment
171615141312111009080706050403020100
130000.0
120000.0
110000.0
100000.0
90000.0
80000.0
70000.0
Orlando Real Gross Metro Product(Millions 2000 $)
Real Gross Metro Product
171615141312111009080706050403020100
12.0%
9.0%
6.0%
3.0%
0.0%
-3.0%
-6.0%
-9.0%
Orlando Real Personal Income(percent change year ago)
Real Personal Income
171615141312111009080706050403020100
12.0%
10.0%
8.0%
6.0%
4.0%
2.0%
Florida & Orlando Unemployment Rate(percent)
FL Unemployment RateOrlando Unemployment Rate

68 Florida & Metro Forecast - December 2014
O R L A N D O – K I S S I M M E E
Annual Outlook for Orlando-Kissimmee, FL December 2014
2009 2010 2011 2012 2013 2014 2015 2016 2017Personal Income (Billions $)Total Personal Income 70.9 73.6 77.6 81.0 83.6 88.4 93.0 98.3 104.7 Pct Chg Year Ago -5.0 3.8 5.5 4.3 3.2 5.8 5.2 5.7 6.4 Wages and Salaries 42.0 42.3 43.7 46.2 48.0 51.1 54.0 57.0 60.3 Nonwage Income 28.9 31.3 33.9 34.8 35.5 37.3 39.0 41.4 44.3Real Personal Income (05$) 70.9 72.4 74.6 76.4 77.9 81.3 84.6 88.3 92.4 Pct Chg Year Ago -4.9 2.1 2.9 2.5 2.0 4.4 4.1 4.3 4.7Per Capita Income (Ths) 33.5 34.3 35.6 36.4 36.8 38.2 39.3 40.7 42.4Real Per Capita Income (05$) 33.5 33.8 34.2 34.3 34.3 35.1 35.8 36.5 37.4Average Annual Wage (Ths) 41.9 42.5 43.3 44.6 44.9 46.2 47.4 48.9 50.7 Pct Chg Year Ago -0.6 1.3 2.0 2.9 0.8 2.8 2.6 3.2 3.7Establishment Employment (Place of Work, Thousands, SA)Total Employment 997.5 992.3 1005.6 1031.9 1065.0 1102.8 1135.1 1161.0 1185.6 Pct Chg Year Ago -6.3 -0.5 1.3 2.6 3.2 3.5 2.9 2.3 2.1Manufacturing 38.7 38.0 38.0 38.0 38.1 39.5 40.1 40.0 39.9 Pct Chg Year Ago -9.6 -1.8 0.1 -0.1 0.4 3.6 1.4 -0.1 -0.3Nonmanufacturing 958.8 954.3 967.6 993.9 1026.9 1063.3 1095.1 1121.0 1145.7 Pct Chg Year Ago -6.2 -0.5 1.4 2.7 3.3 3.5 3.0 2.4 2.2 Construction & Mining 54.5 47.7 45.2 46.2 51.1 55.4 59.9 64.9 71.1 Pct Chg Year Ago -25.0 -12.5 -5.2 2.2 10.7 8.3 8.1 8.5 9.5 Trade, Trans, & Utilities 186.0 186.0 191.9 198.1 203.7 211.5 216.6 220.3 223.7 Pct Chg Year Ago -7.4 0.0 3.2 3.2 2.8 3.8 2.4 1.7 1.5 Wholesale Trade 40.4 38.4 38.4 39.0 40.0 41.6 42.7 44.0 45.3 Retail Trade 115.5 117.9 123.3 128.1 132.5 137.5 140.1 140.7 140.5 Trans, Wrhsng, & Util 30.1 29.7 30.2 30.9 31.2 32.3 33.3 34.6 35.9 Information 24.8 23.8 24.0 23.6 23.7 24.3 24.7 25.2 25.5 Pct Chg Year Ago -5.5 -4.0 0.9 -1.7 0.6 2.2 1.7 2.0 1.3 Financial Activities 65.9 65.1 65.9 67.2 69.6 69.7 69.9 70.5 70.8 Pct Chg Year Ago -5.3 -1.1 1.1 2.1 3.6 0.0 0.3 0.9 0.5 Prof & Business Services 164.1 161.1 161.9 169.3 175.6 184.7 193.4 200.5 206.4 Pct Chg Year Ago -7.0 -1.8 0.5 4.6 3.7 5.2 4.7 3.7 2.9 Educ & Health Services 118.4 120.8 123.5 128.2 131.2 133.0 136.3 140.1 142.9 Pct Chg Year Ago 1.7 2.0 2.2 3.7 2.4 1.3 2.5 2.8 2.0 Leisure & Hospitality 190.1 195.6 203.5 210.2 219.2 231.0 238.8 242.0 245.5 Pct Chg Year Ago -4.7 2.9 4.1 3.3 4.3 5.4 3.4 1.4 1.4 Other Services 39.4 38.5 36.6 34.8 35.6 36.3 37.0 37.7 38.3 Pct Chg Year Ago -9.0 -2.3 -5.1 -4.7 2.3 1.8 2.1 1.8 1.6 Federal Government 12.1 12.8 12.0 12.3 12.4 12.3 12.3 12.2 12.2 Pct Chg Year Ago 2.6 5.7 -6.0 2.7 0.4 -0.9 0.0 -0.2 -0.4 State & Local Government 103.6 102.9 103.1 104.0 104.7 105.3 106.2 107.5 109.4 Pct Chg Year Ago -1.5 -0.7 0.2 0.9 0.7 0.6 0.8 1.2 1.7Other Economic IndicatorsPopulation (Ths) 2115.7 2144.4 2181.3 2228.7 2273.0 2316.8 2365.5 2416.3 2469.0 Pct Chg Year Ago 1.2 1.4 1.7 2.2 2.0 1.9 2.1 2.1 2.2Labor Force (Ths) 1106.3 1116.8 1128.8 1142.6 1161.4 1198.6 1236.1 1268.1 1296.3 Pct Chg Year Ago -1.1 0.9 1.1 1.2 1.6 3.2 3.1 2.6 2.2Unemployment Rate (%) 10.3 11.2 10.2 8.7 6.9 5.8 5.3 5.2 5.2Total Housing Starts 4489.7 4986.6 5737.2 10921.4 14785.4 15671.3 18845.0 19732.5 21480.0 Single-Family 3763.4 4409.6 4481.1 7197.1 9338.2 10307.5 12017.3 13102.0 15237.6 Multifamily 726 577 1256 3724 5447 5364 6828 6631 6242

Institute for Economic Competitiveness 69
O R L A N D O – K I S S I M M E E
Quarterly Outlook for Orlando-Kissimmee, FL December 2014
2014Q4 2015Q1 2015Q2 2015Q3 2015Q4 2016Q1 2016Q2 2016Q3 2016Q4 2017Q1 2017Q2 2017Q3 2017Q4
Personal Income (Billions $)Total Personal Income 90.1 91.4 92.4 93.5 94.7 96.2 97.5 99 100.6 102.3 103.9 105.4 107 Pct Chg Year Ago 6.2 5.8 4.9 5 5.1 5.3 5.5 5.9 6.2 6.3 6.5 6.4 6.4 Wages and Salaries 52.1 52.9 53.6 54.3 55.1 55.8 56.6 57.3 58.2 59 59.9 60.8 61.7 Nonwage Income 38.1 38.5 38.8 39.2 39.7 40.4 40.9 41.7 42.4 43.3 44 44.6 45.3Real Personal Income (05$) 82.6 83.6 84.2 84.9 85.7 86.8 87.7 88.7 89.8 91 91.9 92.9 93.9 Pct Chg Year Ago 4.8 4.7 4 3.9 3.8 3.8 4.1 4.6 4.8 4.8 4.8 4.7 4.6Per Capita Income (Ths) 38.6 39 39.2 39.4 39.7 40.1 40.5 40.9 41.3 41.8 42.2 42.6 43Real Per Capita Income (05$) 35.4 35.6 35.7 35.8 35.9 36.2 36.4 36.6 36.9 37.2 37.3 37.5 37.7Average Annual Wage (Ths) 46.5 46.9 47.2 47.5 47.9 48.3 48.7 49.1 49.5 50 50.5 50.9 51.4 Pct Chg Year Ago 3.1 2.5 2.3 2.6 2.9 3 3.1 3.3 3.4 3.6 3.7 3.8 3.9
Establishment Employment (Place of Work, Thousands, SA)Total Employment 1114.9 1123.8 1131.7 1139.4 1145.5 1151.9 1157.7 1163.9 1170.7 1176.5 1182.8 1188.8 1194.5 Pct Chg Year Ago 3.4 3.3 2.7 2.9 2.7 2.5 2.3 2.1 2.2 2.1 2.2 2.1 2Manufacturing 39.9 39.9 40 40.1 40.2 40.1 40 40 39.9 39.9 39.9 39.9 39.9 Pct Chg Year Ago 3 2 1.6 1.2 0.7 0.5 -0.1 -0.3 -0.6 -0.5 -0.2 -0.1 -0.2Nonmanufacturing 1075 1083.9 1091.7 1099.3 1105.4 1111.8 1117.7 1123.9 1130.7 1136.6 1142.9 1148.9 1154.6 Pct Chg Year Ago 3.4 3.3 2.8 3 2.8 2.6 2.4 2.2 2.3 2.2 2.3 2.2 2.1 Construction & Mining 56.7 57.9 59.2 60.6 61.7 62.8 64.2 65.5 67.2 68.7 70.3 72 73.4 Pct Chg Year Ago 6.8 7.9 7.2 8.3 8.8 8.5 8.3 8.1 9 9.4 9.6 9.9 9.1 Trade, Trans, & Utilities 213.5 214.7 216 217.5 218.4 219.1 219.9 220.7 221.7 222.3 223.2 224.1 225.1 Pct Chg Year Ago 3.8 2.9 1.9 2.7 2.3 2 1.8 1.5 1.5 1.5 1.5 1.6 1.5 Wholesale Trade 41.8 42.1 42.5 42.9 43.2 43.5 43.9 44.2 44.5 44.8 45.1 45.5 45.8 Retail Trade 138.6 139.3 139.8 140.5 140.7 140.7 140.6 140.6 140.7 140.5 140.5 140.5 140.6 Trans, Wrhsng, & Util 32.8 32.8 33 33.4 33.7 34.1 34.4 34.7 35.1 35.4 35.7 36 36.3 Information 24.5 24.9 24.6 24.5 24.5 24.6 25.2 25.5 25.4 25.5 25.5 25.5 25.5 Pct Chg Year Ago 2.6 3.7 1.7 1.4 -0.1 -1.5 2.2 4 3.5 3.6 1.3 -0.2 0.4 Financial Activities 69.3 69.7 69.8 70 70 70.3 70.4 70.5 70.8 70.9 71 70.8 70.6 Pct Chg Year Ago -2.1 -0.9 -0.3 1.4 1.1 0.8 0.9 0.8 1 0.9 0.8 0.4 -0.2 Prof & Business Services 188.5 190.3 192.5 194.5 196.3 197.8 199.4 201.4 203.5 205.1 206.1 206.8 207.6 Pct Chg Year Ago 6.1 5.5 5.1 4.3 4.1 3.9 3.6 3.5 3.7 3.7 3.3 2.7 2 Educ & Health Services 133.3 134.6 136.2 137 137.4 138.5 139.8 140.6 141.6 142.1 142.8 143.2 143.7 Pct Chg Year Ago 1.1 1.4 2.4 3.2 3.1 2.9 2.7 2.6 3 2.6 2.1 1.9 1.5 Leisure & Hospitality 234.8 236.9 238 239.4 240.8 241.9 241.7 242 242.4 243.1 244.5 246.2 247.9 Pct Chg Year Ago 5 5 3.3 2.7 2.5 2.1 1.5 1.1 0.7 0.5 1.2 1.7 2.3 Other Services 36.5 36.8 37 37.1 37.3 37.5 37.7 37.8 37.9 38.1 38.3 38.4 38.5 Pct Chg Year Ago 1.7 1.8 2.4 2.2 2.1 2 1.9 1.7 1.7 1.6 1.6 1.6 1.6 Federal Government 12.3 12.3 12.3 12.3 12.3 12.3 12.2 12.2 12.2 12.2 12.2 12.2 12.2 Pct Chg Year Ago -0.3 0 -0.4 0.5 0 -0.1 -0.3 -0.3 -0.3 -0.4 -0.2 -0.4 -0.5 State & Local Government 105.6 105.8 106 106.3 106.7 106.9 107.3 107.7 108 108.5 109 109.6 110.2 Pct Chg Year Ago 0.8 0.9 0.5 1 1 1.1 1.2 1.3 1.3 1.5 1.6 1.8 2
Other Economic IndicatorsPopulation (Ths) 2334.1 2346.5 2359 2371.9 2384.7 2397.4 2410 2422.5 2435.2 2448.8 2462.3 2475.7 2489.1 Pct Chg Year Ago 2 2 2.1 2.1 2.2 2.2 2.2 2.1 2.1 2.1 2.2 2.2 2.2Labor Force (Ths) 1213.1 1222.6 1232.2 1240.9 1248.7 1256.4 1264.2 1272 1279.8 1286.7 1293.4 1299.6 1305.6 Pct Chg Year Ago 4.2 3.9 2.8 2.9 2.9 2.8 2.6 2.5 2.5 2.4 2.3 2.2 2Unemployment Rate (%) 5.5 5.4 5.3 5.2 5.2 5.2 5.3 5.3 5.2 5.2 5.2 5.2 5.3Total Housing Starts 17223 18022 18833 19226 19299 19482 19281 19511 20657 21112 21278 21712 21818 Single-Family 10885 11546 11897 12364 12263 12372 12566 13167 14303 14863 15179 15418 15490 Multifamily 6338 6476 6937 6862 7036 7109 6715 6344 6354 6249 6099 6294 6328

70 Florida & Metro Forecast - December 2014
PA L M B AY – M E L B O U R N E – T I T U S V I L L E
O U T L O O K S U M M A R I E SThe Palm Bay–Melbourne–Titusville Metropolitan
Statistical Area (MSA) is expected to see moderate growth in the economic indicators. Personal income growth is expected to average 4.9 percent each year. Real per capita income levels should average $35,800. Average annual wage growth is expected to be 3.4 percent. Average annual wage levels should be at $51,000. Population growth is expected to be an average of 1.1 percent, and the Gross Metro Product level is expected to average 18,821.29 million dollars.
Employment growth is forecasted to average 1.5 percent each year. The metro will see an average unemployment rate of 7.3 percent, the highest of the studied areas.
Construction and Mining is expected to be the fastest growing sector in the area, averaging 7.7 percent growth annually. The Professional and Business Services sector will see the second highest average annual growth rate at 3.1 percent, followed by the Other Services sector at 1.3 percent. Only the Federal Government sector will experience negative growth, at an average of -0.1 percent annually.
M E T R O N E W S S U M M A R I E S
Port CEO: Chances good for auto project• According to John Walsh, Port Canaveral’s chief
executive, the port has an extremely high chance (90%) of landing an auto import/export business that would create hundreds of local jobs.
• There are two other finalists for the project, which involves “a deal with an auto processor that would work with a major automaker to import cars to an East Coast port for distribution to dealerships in the Southeast.”
• Port Canaveral’s plans if it does win the deal include building a six-story, 7,500 vehicle parking garage and a 60,000-square-foot processing facility. This project could cost up to $74 million.
• Walsh asserts that 180 to 220 jobs could be created by the project at the port alone, in addition to 50 to 100 trucking jobs.
Source: Florida Today, October 29, 2014
P R O F I L E SThe Palm Bay–Melbourne–Titusville MSA is
comprised of Brevard County only. Typically known as “Florida’s Space Coast”, this area is home to the Kennedy Space Center. Located in the central part of Florida’s east coast, the region is home to Cape Canaveral Air Force Base, Patrick Air Force Base and government contractors such as Harris Corporation. Like much of Florida, this area is growing fast; Port Canaveral is now a leading cruise ship port.
QUICK FACTS:• Population estimate of 550,823 as of July 1, 2013
(U.S. Census Bureau).• Civilian labor force of 265,026 in October 2014
(Florida Research and Economic Database).• An unemployment rate of 6.3% as of October
2014, not seasonally adjusted. This amounts to 16,588 unemployed people (Florida Research and Economic Database).
TOP AREA EMPLOYERS:• Brevard County School Board – 9,520• Health First, Inc. – 7,800• Harris Corporation – 5,890• Brevard County Government – 2,380• Department of Defense – 2,170• NASA – 2,067 • Eastern Florida State College – 1,590 • Rockwell Collins Inc. – 1,410 • Florida Institute Of Technology – 1,280 • Northrop Grumman Corporation – 1,345 • Brevard County Sheriff Office – 1,175 • Parrish Medical Center – 1,075 • Wuesthoff Medical Center – 1,055
Source: Brevard Economic Development Council, 2011

Institute for Economic Competitiveness 71
P A L M B AY – M E L B O U R N E – T I T U S V I L L E
Absolutely Abby helps people find jobs• Abby Kohut (“Absolutely Abby”) has set out to
help Americans find jobs. Kohut’s national bus tour included a stop in Brevard for two days of free workshops on November 17 and 18.
• Kohut is so well-known for her articles on AbsolutelyAbby.com that she was named one of the top 100 influential people online by Fast Company Magazine. Her website has also been recognized on Forbes as one of the “Top 1,000 Websites for Your Career.”
• According to Kohut, “Things are absolutely getting better, but there are still millions of people who are unemployed and underemployed.”
Source: Florida Today, November 16, 2014
Orbital considers launching ISS cargo from Brevard• It is possible that some cargo previously launched
from Virginia may fly from Florida to the International Space Station while Orbital Sciences Corp’s Antares rocket is being repaired. Orbital is considering two American companies and one European company as potential launchers of Cygnus cargo spacecraft in 2015 and early 2016.
• After the explosion of the unmanned Antares rocket after liftoff from Wallops Island, Va. on October 28th, Orbital needs to complete launches on competitors’ rockets in order to fulfill its $1.9 billion contract with NASA.
• After 2016, Orbital will be among several competitors for new cargo contracts. Currently, NASA also has contracts with SpaceX, who launches its Falcon 9 rocket and Dragon capsule from Florida.
Source: Florida Today, November 5, 2014
Dramatic upswing in Brevard housing market• There was an over 17 percent increase in the year-
over-year number of sales of single-family homes within Brevard County. Home values have also been rising, with the median sales price growing more than 19.2 percent to $143,000.
• Real estate firms throughout Brevard have benefited
from this growth through increased profits.• The current growth in the real estate market is
allowing businesses to recover losses that occurred during the Great Recession to the point where many are considering expanding their businesses.
Source: Florida Today, November 24, 2014
Space Coast Credit Union’s plan may add 600 jobs• Space Coast Credit Union wants to expand its
Baytree-area corporate office complex (located off Wickham Road) through a project worth $30 million. This plan comes with the potential of creating 600 jobs in the future.
• The plan involves building three additional buildings, each of which would be three stories tall and would total 144,344 square feet in addition to a four-story, 500-vehicle employee parking garage.
• If the project is approved, construction would begin in the first quarter of 2015, starting with the parking garage. The community has concerns about the expansion, but Jake Wise, principal civil engineer of the project, argues that the credit union’s current building simply cannot accommodate additional staff.
Source: Florida Today, December 4, 2014
Port Canaveral needs more cruise terminals• It is estimated that cruise passenger counts will likely
grow by more than 100 percent within the next 30 years, which has the potential to put Port Canaveral ahead of its Port of Miami and Port Everglades competitors and make it a world leader.
• This growth would not only result in increased revenue from cruise lines, but would also provide more jobs in the Port Canaveral area, as well as increased tourism spending on local hotels, restaurants, retail shops and attractions.
• The expected increase in cruise operations means that Port Canaveral needs to add up to four new cruise terminals over the next 25 years. Doing so could cost as much as a half-billion dollars. The first of the four terminals opens in December 2014.
Source: Florida Today, November 23, 2014

72 Florida & Metro Forecast - December 2014
PA L M B AY – M E L B O U R N E – T I T U S V I L L E
0 0.5 1 1.5 2 2.5 3
Total Nonagricultural Employment
Total Private
Goods Producing
Service Producing
Private Service Providing
Mining, Logging, and Construction
Manufacturing
Trade, Transportation, and Utilities
Wholesale Trade
Retail Trade
Transportation, Warehousing and Utilities
Information
Financial Activities
Professional and Business Services
Educational and Health Services
Leisure and Hospitality
Other Services
Government
Palm Bay - Melbourne - Titusville MSA
Industry Location Quotients
171615141312111009080706050403020100
220.0215.0210.0205.0200.0195.0190.0185.0
Palm Bay-Melbourne-TitusvillePayroll Employment
(Thousands)
Palm Bay Payroll Employment
171615141312111009080706050403020100
20000.019000.018000.017000.016000.015000.014000.013000.0
Palm Bay-Melbourne-TitusvilleReal Gross Metro Product
(Millions 2000 $)
Real Gross Metro Product
171615141312111009080706050403020100
12.0%
9.0%
6.0%3.0%
0.0%
-3.0%
-6.0%
Palm Bay-Melbourne-TitusvilleReal Personal Income
(percent change year ago)
Real Personal Income
171615141312111009080706050403020100
12.0%
10.0%
8.0%
6.0%
4.0%
2.0%
Florida & Palm Bay-Melbourne-TitusvilleUnemployment Rate
(percent)
FL Unemployment RatePalm Bay Unemployment Rate

Institute for Economic Competitiveness 73
P A L M B AY – M E L B O U R N E – T I T U S V I L L E
Annual Outlook for Palm Bay-Melbourne-Titusville, FL December 2014
2009 2010 2011 2012 2013 2014 2015 2016 2017Personal Income (Billions $)Total Personal Income 20.1 20.4 21.4 21.8 22.0 22.7 23.7 25.0 26.6 Pct Chg Year Ago -2.8 1.5 5.1 1.8 0.9 3.4 4.5 5.5 6.2 Wages and Salaries 9.2 9.3 9.3 9.3 9.4 9.7 10.2 10.8 11.5 Nonwage Income 10.9 11.1 12.1 12.4 12.6 13.0 13.5 14.2 15.1Real Personal Income (05$) 20.1 20.0 20.6 20.5 20.5 20.9 21.6 22.5 23.5 Pct Chg Year Ago -2.7 -0.2 2.6 -0.1 -0.3 2.0 3.4 4.1 4.5Per Capita Income (Ths) 37.0 37.4 39.3 39.8 39.8 40.8 42.2 44.0 46.1Real Per Capita Income (05$) 37.0 36.8 37.7 37.5 37.1 37.5 38.3 39.5 40.7Average Annual Wage (Ths) 46.0 46.8 47.3 47.4 47.7 48.9 50.4 52.3 54.5 Pct Chg Year Ago 2.2 1.7 0.9 0.2 0.6 2.7 3.1 3.7 4.2Establishment Employment (Place of Work, Thousands, SA)Total Employment 196.4 194.8 194.6 194.6 194.2 194.9 199.5 204.2 207.9 Pct Chg Year Ago -5.1 -0.8 -0.1 0.0 -0.2 0.4 2.4 2.3 1.9Manufacturing 21.8 20.5 20.8 20.9 20.1 19.7 20.1 20.6 20.9 Pct Chg Year Ago -8.0 -5.9 1.1 0.7 -3.8 -2.1 2.1 2.6 1.4Nonmanufacturing 174.6 174.3 173.8 173.7 174.1 175.2 179.4 183.5 187.0 Pct Chg Year Ago -4.8 -0.2 -0.3 -0.1 0.2 0.7 2.4 2.3 1.9 Construction & Mining 9.9 8.7 8.2 8.4 9.2 9.8 10.7 11.9 13.0 Pct Chg Year Ago -23.8 -12.5 -5.9 3.0 9.0 7.3 9.3 10.9 9.4 Trade, Trans, & Utilities 33.3 33.0 34.4 34.9 35.0 35.0 35.5 35.9 36.1 Pct Chg Year Ago -6.8 -0.8 4.0 1.6 0.2 0.1 1.5 0.9 0.7 Wholesale Trade 5.2 5.0 5.2 5.2 5.5 5.6 5.8 6.0 6.2 Retail Trade 24.9 24.7 25.1 25.5 25.6 26.1 26.4 26.3 26.1 Trans, Wrhsng, & Util 3.2 3.3 4.1 4.2 3.9 3.3 3.3 3.5 3.6 Information 2.6 2.4 2.2 2.1 1.9 1.9 1.9 2.0 2.0 Pct Chg Year Ago 4.6 -8.8 -9.0 -5.0 -6.4 -2.3 1.3 2.2 1.1 Financial Activities 7.9 7.6 7.5 7.6 7.6 7.5 7.6 7.6 7.6 Pct Chg Year Ago -4.9 -3.5 -1.4 1.3 -0.4 -1.2 1.0 0.7 0.3 Prof & Business Services 32.3 32.5 31.6 29.4 28.7 28.1 29.2 30.8 32.0 Pct Chg Year Ago -6.4 0.7 -2.8 -7.0 -2.4 -2.0 3.9 5.3 3.9 Educ & Health Services 31.2 32.3 32.7 32.8 32.9 33.2 33.9 34.5 35.0 Pct Chg Year Ago 1.8 3.6 1.3 0.1 0.5 1.0 2.0 1.8 1.4 Leisure & Hospitality 21.3 21.2 21.6 22.7 22.9 23.6 24.0 24.2 24.3 Pct Chg Year Ago -4.0 -0.4 1.6 5.3 0.8 2.9 1.9 0.7 0.6 Other Services 6.9 7.1 7.3 7.4 7.4 7.8 8.1 8.2 8.3 Pct Chg Year Ago -6.2 2.7 2.7 0.9 0.7 5.2 3.7 1.4 1.2 Federal Government 6.3 6.7 6.4 6.2 6.2 6.0 6.0 5.9 5.8 Pct Chg Year Ago 1.3 7.4 -5.3 -2.1 -0.8 -2.8 -0.8 -1.2 -1.3 State & Local Government 22.8 22.6 22.0 22.1 22.3 22.2 22.4 22.5 22.8 Pct Chg Year Ago -0.1 -0.8 -2.8 0.7 0.6 -0.3 0.7 0.8 1.2Other Economic IndicatorsPopulation (Ths) 542.6 544.5 544.8 547.7 551.5 556.7 562.6 569.1 576.0 Pct Chg Year Ago 0.1 0.3 0.1 0.5 0.7 0.9 1.1 1.1 1.2Labor Force (Ths) 266.7 267.6 268.9 268.2 264.0 264.5 268.8 273.3 277.8 Pct Chg Year Ago -0.7 0.3 0.5 -0.3 -1.5 0.2 1.6 1.7 1.7Unemployment Rate (%) 10.3 11.1 10.8 9.3 7.9 6.6 6.2 6.3 6.3Total Housing Starts 975.3 1082.6 972.7 1111.1 1346.6 1388.8 2697.1 3947.5 4636.4 Single-Family 868.7 994.8 842.9 1107.0 1330.8 1304.2 2200.4 3017.7 3651.6 Multifamily 107 88 130 4 16 85 497 930 985

74 Florida & Metro Forecast - December 2014
PA L M B AY – M E L B O U R N E – T I T U S V I L L E
Quarterly Outlook for Palm Bay-Melbourne-Titusville, FL December 2014
2014Q4 2015Q1 2015Q2 2015Q3 2015Q4 2016Q1 2016Q2 2016Q3 2016Q4 2017Q1 2017Q2 2017Q3 2017Q4
Personal Income (Billions $)Total Personal Income 23.1 23.3 23.6 23.8 24.1 24.5 24.8 25.2 25.6 26 26.4 26.8 27.1 Pct Chg Year Ago 4.3 4.5 4.3 4.3 4.7 5 5.3 5.7 6 6.2 6.3 6.2 5.9 Wages and Salaries 9.8 10 10.1 10.3 10.4 10.6 10.7 10.9 11.1 11.2 11.4 11.6 11.7 Nonwage Income 13.2 13.4 13.4 13.5 13.7 13.9 14.1 14.3 14.5 14.8 15 15.2 15.4Real Personal Income (05$) 21.1 21.3 21.5 21.6 21.8 22.1 22.3 22.6 22.8 23.1 23.4 23.6 23.8 Pct Chg Year Ago 3 3.4 3.4 3.3 3.3 3.6 4 4.4 4.6 4.7 4.6 4.5 4.2Per Capita Income (Ths) 41.3 41.7 42 42.3 42.7 43.2 43.7 44.2 44.8 45.4 45.9 46.4 46.9Real Per Capita Income (05$) 37.8 38.1 38.2 38.4 38.6 39 39.3 39.6 40 40.4 40.6 40.9 41.1Average Annual Wage (Ths) 49.4 49.8 50.2 50.6 51.1 51.6 52.1 52.5 53.1 53.6 54.2 54.8 55.4 Pct Chg Year Ago 3.5 3 2.8 3.1 3.4 3.5 3.7 3.8 3.9 4 4.1 4.2 4.3
Establishment Employment (Place of Work, Thousands, SA)Total Employment 196.2 197.4 198.9 200.3 201.4 202.5 203.5 204.7 205.9 206.8 207.6 208.4 208.9 Pct Chg Year Ago 0.8 1.6 2.5 2.7 2.6 2.5 2.3 2.2 2.3 2.2 2 1.8 1.5Manufacturing 19.8 19.9 20 20.2 20.4 20.5 20.6 20.7 20.8 20.9 20.9 20.9 20.9 Pct Chg Year Ago 0 0.6 1.8 3.1 3 2.9 2.7 2.5 2.2 2.2 1.8 1.1 0.4Nonmanufacturing 176.4 177.6 178.9 180.1 181 182 182.9 184 185.1 185.9 186.7 187.4 188 Pct Chg Year Ago 0.9 1.7 2.6 2.6 2.6 2.5 2.3 2.2 2.3 2.2 2.1 1.8 1.6 Construction & Mining 10.1 10.3 10.6 10.9 11.1 11.4 11.7 12.1 12.4 12.7 12.9 13.1 13.4 Pct Chg Year Ago 7.1 7.8 8.5 10.3 10.4 10.5 10.8 11 11.3 11.2 10.2 8.8 7.7 Trade, Trans, & Utilities 35.2 35.3 35.5 35.7 35.7 35.8 35.8 35.9 36 36 36.1 36.1 36.2 Pct Chg Year Ago 0 0.6 1.8 2 1.6 1.3 0.9 0.6 0.7 0.6 0.7 0.8 0.7 Wholesale Trade 5.6 5.7 5.7 5.8 5.8 5.9 5.9 6 6 6.1 6.1 6.2 6.2 Retail Trade 26.2 26.3 26.3 26.4 26.4 26.4 26.3 26.3 26.2 26.1 26.1 26.1 26 Trans, Wrhsng, & Util 3.3 3.3 3.3 3.3 3.4 3.4 3.4 3.5 3.5 3.5 3.6 3.6 3.6 Information 1.9 1.9 1.9 1.9 1.9 1.9 2 2 2 2 2 2 2 Pct Chg Year Ago -0.3 2.2 2 1.2 0 -1.4 2.3 4.1 3.7 3.7 1.2 -0.4 0 Financial Activities 7.5 7.5 7.6 7.6 7.6 7.6 7.6 7.6 7.6 7.7 7.7 7.7 7.6 Pct Chg Year Ago -0.6 0.3 1.1 1.3 1.2 1 0.8 0.5 0.6 0.6 0.5 0.3 -0.3 Prof & Business Services 28.2 28.5 29 29.5 29.9 30.3 30.5 31 31.4 31.7 31.9 32.1 32.2 Pct Chg Year Ago -0.8 1.4 2.9 5.3 6 6.1 5.3 5 4.8 4.6 4.4 3.7 2.8 Educ & Health Services 33.5 33.6 33.9 34 34.1 34.2 34.5 34.6 34.8 34.9 35 35.1 35.1 Pct Chg Year Ago 0.9 1.8 2.5 2 1.8 1.8 1.5 1.8 2.3 1.9 1.5 1.2 0.8 Leisure & Hospitality 23.7 23.9 24 24.1 24.1 24.2 24.2 24.2 24.2 24.2 24.3 24.4 24.5 Pct Chg Year Ago 2.3 1.4 2.6 1.9 1.7 1.4 0.9 0.4 0.2 0 0.4 0.8 1.2 Other Services 8 8 8.1 8.1 8.1 8.2 8.2 8.2 8.3 8.3 8.3 8.3 8.3 Pct Chg Year Ago 5.8 6.9 5.3 1.5 1.5 1.4 1.4 1.4 1.6 1.5 1.2 1.1 0.9 Federal Government 6 6 6 6 6 5.9 5.9 5.9 5.9 5.9 5.8 5.8 5.8 Pct Chg Year Ago -2.2 -1.3 -0.4 -0.5 -1 -1 -1.2 -1.3 -1.3 -1.2 -1.2 -1.3 -1.4 State & Local Government 22.3 22.3 22.4 22.4 22.4 22.5 22.5 22.6 22.6 22.7 22.8 22.9 22.9 Pct Chg Year Ago 0.1 0.8 1 0.5 0.5 0.6 0.7 0.9 0.9 1 1.2 1.3 1.4
Other Economic IndicatorsPopulation (Ths) 558.7 560.3 561.8 563.4 565.1 566.7 568.3 569.9 571.6 573.3 575.1 576.9 578.7 Pct Chg Year Ago 1 1 1 1.1 1.1 1.1 1.2 1.2 1.2 1.2 1.2 1.2 1.2Labor Force (Ths) 265.1 266.8 268.2 269.5 270.6 271.6 272.7 273.9 275 276.1 277.3 278.4 279.5 Pct Chg Year Ago 1.3 1.2 1.1 2 2 1.8 1.7 1.6 1.6 1.7 1.7 1.7 1.7Unemployment Rate (%) 6.3 6.3 6.2 6.2 6.2 6.3 6.3 6.3 6.3 6.3 6.4 6.3 6.4Total Housing Starts 1748 2117 2523 2925 3224 3532 3767 4073 4418 4559 4604 4688 4694 Single-Family 1521 1833 2091 2366 2512 2684 2856 3113 3417 3561 3641 3698 3706 Multifamily 228 283 432 559 712 848 910 960 1001 998 963 990 988

Institute for Economic Competitiveness 75
P E N S A C O L A – F E R R Y P A S S – B R E N T
O U T L O O K S U M M A R I E SThe Pensacola–Ferry Pass–Brent Metropolitan
Statistical Area (MSA) is expected to see low levels of growth in the economic indicators, relative to the twelve other areas studied. Personal income growth is expected to average 4.1 percent each year, the lowest of the twelve studied MSAs. The real per capita income level is expected to average $34,200. The average annual wage growth rate should be 2.8 percent, while the average annual wage level is expected to be $45,600. Population growth will be at an average rate of 0.6 percent, the second lowest of the studied MSAs. The Gross Metro Product is expected to average 14,776.03 million dollars.
Employment growth is expected to average 1.3 percent each year, and the unemployment rate will average 5.6 percent.
Construction and Mining will be the fastest growing sector in Pensacola, with 7.6 percent average annual growth. The Professional and Business Services sector follow with an average growth rate of 2.6 percent. Both the Federal Government and the Manufacturing sectors are expected to experience declines, at -1.6 percent and -1.0 percent, respectively.
M E T R O N E W S S U M M A R I E S Pensacola’s economic future challenging
• Those in attendance at the Gulf Power Economic Symposium learned that Florida technical institutes graduates had higher beginning pay salaries than recently stamped college grads with bachelor’s degrees in recent years.
• The salary for tech school grads in around $3,000 higher than that of normal graduates with bachelor’s degrees, at around $49,422 in 2010-2011.
• Florida’s tech school graduates normally start at an annual pay that’s 3.3 times the minimum wage, compared with 3.0 times for those with bachelor’s degrees.
Source: Pensacola News Journal, October 14, 2014
P R O F I L E SThe Pensacola–Ferry Pass–Brent MSA is comprised
of Escambia County and Santa Rosa County. Located in the northwest corner of Florida bordering Alabama, the region is home to the Pensacola Naval Air Station, Blue Angels, and the National Museum of Naval Aviation. This area has been referred to as the “Cradle of Naval Aviation.”
QUICK FACTS:• Metro population estimate of 466,913 as of July 1,
2013 (U.S. Census Bureau).• Escambia County population estimate of 305,817
as of July 1, 2013 (U.S. Census Bureau).• Santa Rosa County population estimate of
161,096 as of July 1, 2013 (U.S. Census Bureau).• A civilian labor force of 215,873 in October 2014
(Florida Research and Economic Database).• An unemployment rate of 5.6% as of October
2014, not seasonally adjusted. This amounts to 12,123 unemployed people (Florida Research and Economic Database).
TOP AREA EMPLOYERS:
• Local Government – 13,857• Federal Government – 7,162• State Government – 5,253• Sacred Heart Health System – 5,000• Baptist Health Care – 3,163• Lakeview – 2,000• Ascend Performance Materials – 1,400• Gulf Power Company – 1,365• West Florida Regional Medical Center – 1,300• University of West Florida – 1,231• Navy Federal Credit Union – 1,200
Sources: Pensacola Chamber of Commerce, Agency for Workforece Innovation, Company web sites, Reference USA

76 Florida & Metro Forecast - December 2014
P E N S A C O L A – F E R R Y PA S S – B R E N T
Navy Federal announces 5,000 new jobs• Governor Scott announced an additional 5,000 jobs
for the Beulah area. Navy Federal now expects to have 10,000 employees in the Pensacola area by 2020.
• At the moment there are 3,800 current employees and 2,000 new jobs which were announced earlier this year. With this growth in mind, authorities are looking at making a requirement for new schools and wider roadways.
• Navy Federal is anticipated to grow to 800,000 members this year according to Navy Federal President and Chief Executive Officer Cutler Dawson.
• The Florida Department of Transportation will likewise begin plans in late 2015 and 2016 to expand Nine Mile Road to four paths from Beulah Road to U.S 29.
Source: Pensacola News Journal, October 30, 2014
Bayou Chico to enjoy $11M from oil spill fines• $11 million was given to Escambia County for the Bayou
Chico Watershed project. The money came from funds the National Fish and Wildlife Foundation has received from the Deepwater Horizon oil spill fines.
• The $11 million grant, one out of nine grants given to the county, will go a long way in the continued efforts to restore water quality in Pensacola Bay and Bayou Chico region.
• The grant will also help sort out old problems with pollution and removing debris from the Bayou Chico, as well as provide some upgrades.
• The most notable upgrade will be a treatment facility project, which will aim to improve the water treatment for inhabits of the Bayou.
Source: Pensacola News Journal, November 18, 2014
Old Racquet Club to become $16 million new development• A foreclosed racquet club is set to be reinvented into a
$16 million dollar development.• The project will create a senior living home in a
sheltered area to care for those that have some forms of Alzheimer’s and dementia. The development is to be named Summer Vista, will have 89 apartments, and will be placed near the Cordova Mall for ease for the residents.
• The project is much needed according to Pensacola City Councilman Larry B. Johnson, who also happens to be an investor into the project.
• The project is estimated to create 50-60 new jobs for the city.
Source: Pensacola News Journal, November 19, 2014
Economic incentives draw industry to Santa Rosa• The Santa Rosa County may see greater development
and new occupations in the near future as the Santa Rosa County Economic Development Office continues to solicit and bring new businesses to the area, particularly to the industrial parks.
• Though many of the projects are rather vague in their details and pending finalization, the Economic Development Office has met with more than 40 site consultants this year and has at least five dynamic activities underway that could bring new jobs to the region.
• The names of some of the companies have not been published yet, but some of the projects look to bring over 100 jobs to the area, which will do well not only for industry growth but also for the growth for the community.
Source: Pensacola News Journal, November 16, 2014
The fight for $15 minimum wage• Protestors met to call for the minimum wage to be raised
to $15, what they believe is a reasonable wage that an individual can live on. The minimum wage, which is $7.93 in Florida, is set to rise to $8.05 on Jan. 1.
• Those who want an increase in the minimum wage argue that the increase in wage will lead to an increase in consumer spending, thereby benefitting the economy.
• Those against raising the minimum wage point out an increase in the costs of any good or service that involves minimum wage labor will lead businesses that employ workers at the minimum wage starting to cut back on employment, limiting job creation.
• The U.S Department of Health and Human Services defines the poverty threshold for a single person as $11,670 a year or $19,790 for a family of three. A full-time job paying $15 would afford an annual salary of roughly $26,000 after taxes. A person earning $8.05 an hour will take home roughly $14,800 next year.
Source: Pensacola News Journal, December 4, 2014

Institute for Economic Competitiveness 77
P E N S A C O L A – F E R R Y P A S S – B R E N T
0 0.2 0.4 0.6 0.8 1 1.2 1.4
Total Nonagricultural Employment
Total Private
Goods Producing
Service Producing
Private Service Providing
Mining, Logging, and Construction
Manufacturing
Trade, Transportation, and Utilities
Wholesale Trade
Retail Trade
Transportation,Warehousing and Utilities
Information
Financial Activities
Professional and Business Services
Educational and Health Services
Leisure and Hospitality
Other Services
Government
Pensacola - Ferry Pass - Brent MSA
Industry Location Quotients
171615141312111009080706050403020100
175.0
170.0
165.0
160.0
155.0
150.0
145.0
Pensacola Payroll Employment(Thousands)
Pensacola Payroll Employment
171615141312111009080706050403020100
15500.0
15000.0
14500.0
14000.0
13500.0
13000.0
12500.0
12000.0
Pensacola Real Gross Metro Product(Millions 2000 $)
Real Gross Metro Product
171615141312111009080706050403020100
8.0%
6.0%
4.0%
2.0%
0.0%
-2.0%
-4.0%
-6.0%
Pensacola Real Personal Income(percent change year ago)
Real Personal Income
171615141312111009080706050403020100
12.0%
10.0%
8.0%
6.0%
4.0%
2.0%
Florida & Pensacola Unemployment Rate(percent)
FL Unemployment RatePensacola Unemployment Rate
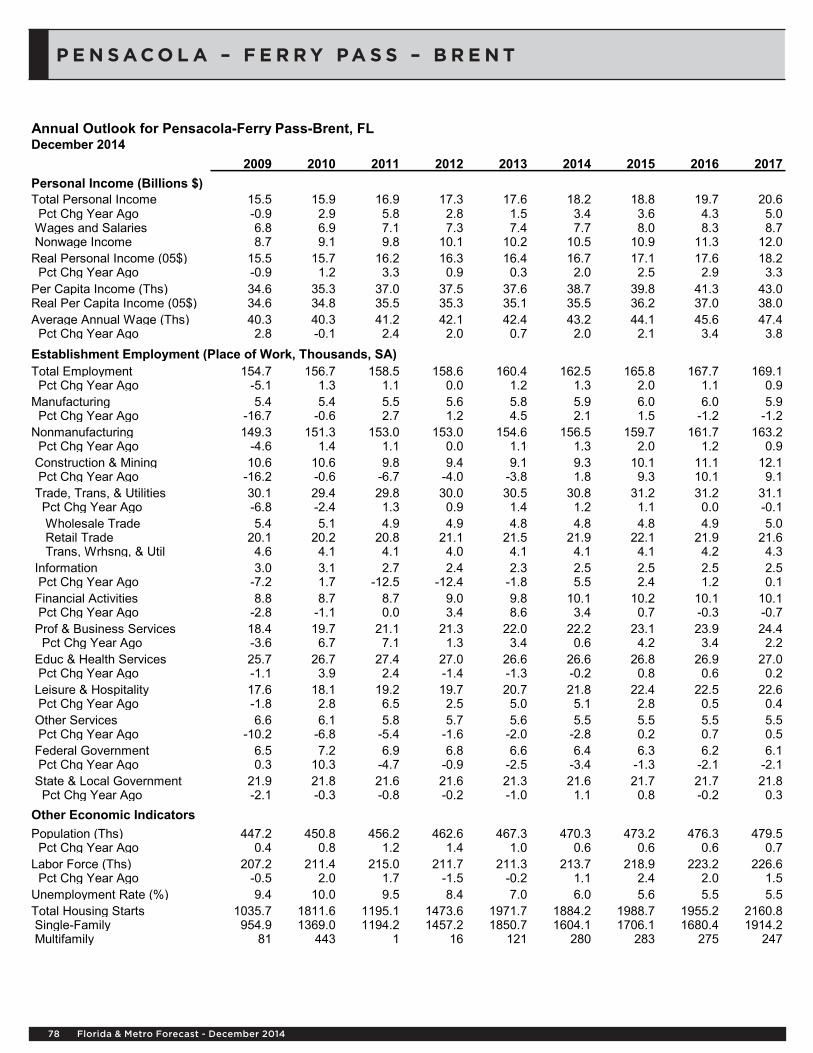
78 Florida & Metro Forecast - December 2014
P E N S A C O L A – F E R R Y PA S S – B R E N T
Annual Outlook for Pensacola-Ferry Pass-Brent, FL December 2014
2009 2010 2011 2012 2013 2014 2015 2016 2017Personal Income (Billions $)Total Personal Income 15.5 15.9 16.9 17.3 17.6 18.2 18.8 19.7 20.6 Pct Chg Year Ago -0.9 2.9 5.8 2.8 1.5 3.4 3.6 4.3 5.0 Wages and Salaries 6.8 6.9 7.1 7.3 7.4 7.7 8.0 8.3 8.7 Nonwage Income 8.7 9.1 9.8 10.1 10.2 10.5 10.9 11.3 12.0Real Personal Income (05$) 15.5 15.7 16.2 16.3 16.4 16.7 17.1 17.6 18.2 Pct Chg Year Ago -0.9 1.2 3.3 0.9 0.3 2.0 2.5 2.9 3.3Per Capita Income (Ths) 34.6 35.3 37.0 37.5 37.6 38.7 39.8 41.3 43.0Real Per Capita Income (05$) 34.6 34.8 35.5 35.3 35.1 35.5 36.2 37.0 38.0Average Annual Wage (Ths) 40.3 40.3 41.2 42.1 42.4 43.2 44.1 45.6 47.4 Pct Chg Year Ago 2.8 -0.1 2.4 2.0 0.7 2.0 2.1 3.4 3.8Establishment Employment (Place of Work, Thousands, SA)Total Employment 154.7 156.7 158.5 158.6 160.4 162.5 165.8 167.7 169.1 Pct Chg Year Ago -5.1 1.3 1.1 0.0 1.2 1.3 2.0 1.1 0.9Manufacturing 5.4 5.4 5.5 5.6 5.8 5.9 6.0 6.0 5.9 Pct Chg Year Ago -16.7 -0.6 2.7 1.2 4.5 2.1 1.5 -1.2 -1.2Nonmanufacturing 149.3 151.3 153.0 153.0 154.6 156.5 159.7 161.7 163.2 Pct Chg Year Ago -4.6 1.4 1.1 0.0 1.1 1.3 2.0 1.2 0.9 Construction & Mining 10.6 10.6 9.8 9.4 9.1 9.3 10.1 11.1 12.1 Pct Chg Year Ago -16.2 -0.6 -6.7 -4.0 -3.8 1.8 9.3 10.1 9.1 Trade, Trans, & Utilities 30.1 29.4 29.8 30.0 30.5 30.8 31.2 31.2 31.1 Pct Chg Year Ago -6.8 -2.4 1.3 0.9 1.4 1.2 1.1 0.0 -0.1 Wholesale Trade 5.4 5.1 4.9 4.9 4.8 4.8 4.8 4.9 5.0 Retail Trade 20.1 20.2 20.8 21.1 21.5 21.9 22.1 21.9 21.6 Trans, Wrhsng, & Util 4.6 4.1 4.1 4.0 4.1 4.1 4.1 4.2 4.3 Information 3.0 3.1 2.7 2.4 2.3 2.5 2.5 2.5 2.5 Pct Chg Year Ago -7.2 1.7 -12.5 -12.4 -1.8 5.5 2.4 1.2 0.1 Financial Activities 8.8 8.7 8.7 9.0 9.8 10.1 10.2 10.1 10.1 Pct Chg Year Ago -2.8 -1.1 0.0 3.4 8.6 3.4 0.7 -0.3 -0.7 Prof & Business Services 18.4 19.7 21.1 21.3 22.0 22.2 23.1 23.9 24.4 Pct Chg Year Ago -3.6 6.7 7.1 1.3 3.4 0.6 4.2 3.4 2.2 Educ & Health Services 25.7 26.7 27.4 27.0 26.6 26.6 26.8 26.9 27.0 Pct Chg Year Ago -1.1 3.9 2.4 -1.4 -1.3 -0.2 0.8 0.6 0.2 Leisure & Hospitality 17.6 18.1 19.2 19.7 20.7 21.8 22.4 22.5 22.6 Pct Chg Year Ago -1.8 2.8 6.5 2.5 5.0 5.1 2.8 0.5 0.4 Other Services 6.6 6.1 5.8 5.7 5.6 5.5 5.5 5.5 5.5 Pct Chg Year Ago -10.2 -6.8 -5.4 -1.6 -2.0 -2.8 0.2 0.7 0.5 Federal Government 6.5 7.2 6.9 6.8 6.6 6.4 6.3 6.2 6.1 Pct Chg Year Ago 0.3 10.3 -4.7 -0.9 -2.5 -3.4 -1.3 -2.1 -2.1 State & Local Government 21.9 21.8 21.6 21.6 21.3 21.6 21.7 21.7 21.8 Pct Chg Year Ago -2.1 -0.3 -0.8 -0.2 -1.0 1.1 0.8 -0.2 0.3Other Economic IndicatorsPopulation (Ths) 447.2 450.8 456.2 462.6 467.3 470.3 473.2 476.3 479.5 Pct Chg Year Ago 0.4 0.8 1.2 1.4 1.0 0.6 0.6 0.6 0.7Labor Force (Ths) 207.2 211.4 215.0 211.7 211.3 213.7 218.9 223.2 226.6 Pct Chg Year Ago -0.5 2.0 1.7 -1.5 -0.2 1.1 2.4 2.0 1.5Unemployment Rate (%) 9.4 10.0 9.5 8.4 7.0 6.0 5.6 5.5 5.5Total Housing Starts 1035.7 1811.6 1195.1 1473.6 1971.7 1884.2 1988.7 1955.2 2160.8 Single-Family 954.9 1369.0 1194.2 1457.2 1850.7 1604.1 1706.1 1680.4 1914.2 Multifamily 81 443 1 16 121 280 283 275 247

Institute for Economic Competitiveness 79
P E N S A C O L A – F E R R Y P A S S – B R E N T
Quarterly Outlook for Pensacola-Ferry Pass-Brent, FL December 2014
2014Q4 2015Q1 2015Q2 2015Q3 2015Q4 2016Q1 2016Q2 2016Q3 2016Q4 2017Q1 2017Q2 2017Q3 2017Q4
Personal Income (Billions $)Total Personal Income 18.4 18.6 18.8 18.9 19.1 19.3 19.5 19.7 20 20.3 20.5 20.7 21 Pct Chg Year Ago 4 4.1 3.3 3.3 3.6 3.8 4.1 4.5 4.8 5 5.1 5.1 4.8 Wages and Salaries 7.7 7.8 7.9 8 8.1 8.2 8.3 8.3 8.4 8.5 8.6 8.7 8.8 Nonwage Income 10.7 10.8 10.8 10.9 11 11.2 11.3 11.4 11.6 11.7 11.9 12 12.2Real Personal Income (05$) 16.9 17 17.1 17.1 17.3 17.4 17.6 17.7 17.9 18 18.2 18.3 18.4 Pct Chg Year Ago 2.6 3 2.4 2.3 2.3 2.4 2.8 3.2 3.4 3.5 3.4 3.4 3.1Per Capita Income (Ths) 39.1 39.4 39.7 39.9 40.2 40.7 41 41.4 41.9 42.4 42.8 43.2 43.6Real Per Capita Income (05$) 35.8 36 36.1 36.2 36.4 36.7 36.9 37.1 37.4 37.7 37.9 38.1 38.3Average Annual Wage (Ths) 43.3 43.7 44 44.3 44.6 45.1 45.5 45.8 46.2 46.7 47.2 47.6 48.1 Pct Chg Year Ago 1.9 1.4 1.6 2.3 3.1 3.2 3.4 3.5 3.6 3.7 3.7 3.9 3.9
Establishment Employment (Place of Work, Thousands, SA)Total Employment 164.2 164.9 165.6 166.2 166.5 166.9 167.3 167.9 168.4 168.8 169.1 169.3 169.4 Pct Chg Year Ago 2 2.8 2 1.8 1.4 1.3 1.1 1 1.1 1.1 1 0.8 0.6Manufacturing 6 6 6 6 6 6 6 6 5.9 5.9 5.9 5.9 5.9 Pct Chg Year Ago 3.1 4 1.9 0.4 -0.1 -0.6 -1.2 -1.4 -1.7 -1.5 -1.1 -1.1 -1.1Nonmanufacturing 158.1 158.8 159.5 160.1 160.5 160.9 161.4 161.9 162.5 162.8 163.2 163.4 163.5 Pct Chg Year Ago 2 2.7 2.1 1.9 1.5 1.3 1.2 1.1 1.2 1.2 1.1 0.9 0.6 Construction & Mining 9.6 9.8 10 10.2 10.4 10.7 11 11.3 11.6 11.9 12.1 12.2 12.4 Pct Chg Year Ago 5 6 10.4 12.4 8.6 9 9.8 10.4 11 11.1 10 8.3 7 Trade, Trans, & Utilities 31 31.1 31.1 31.2 31.2 31.2 31.2 31.1 31.2 31.1 31.1 31.1 31.1 Pct Chg Year Ago 0.8 1.4 1.2 1.2 0.7 0.4 0.1 -0.2 -0.2 -0.2 -0.1 -0.1 -0.1 Wholesale Trade 4.8 4.8 4.8 4.9 4.9 4.9 4.9 4.9 5 5 5 5 5 Retail Trade 22.1 22.1 22.1 22.1 22.1 22 21.9 21.8 21.8 21.7 21.6 21.5 21.5 Trans, Wrhsng, & Util 4.1 4.1 4.1 4.1 4.2 4.2 4.2 4.2 4.3 4.3 4.3 4.3 4.4 Information 2.5 2.5 2.5 2.5 2.5 2.5 2.5 2.6 2.6 2.6 2.6 2.5 2.5 Pct Chg Year Ago 10.8 6.8 3.3 0.6 -0.8 -2.3 1.4 3.2 2.7 2.7 0.2 -1.3 -1 Financial Activities 10.1 10.2 10.2 10.2 10.2 10.2 10.1 10.1 10.1 10.1 10.1 10.1 10 Pct Chg Year Ago 1.4 1.5 0.8 0.4 0.2 0 -0.2 -0.5 -0.3 -0.4 -0.4 -0.6 -1.3 Prof & Business Services 22.5 22.7 23 23.3 23.5 23.6 23.8 24 24.2 24.3 24.4 24.4 24.5 Pct Chg Year Ago 1.7 4.4 4 4 4.4 4.1 3.4 3.1 3 2.9 2.7 1.9 1.2 Educ & Health Services 26.6 26.7 26.9 26.8 26.8 26.8 26.9 27 27.1 27 27 27 27 Pct Chg Year Ago 0.2 1 0.9 0.9 0.6 0.5 0.3 0.5 1 0.7 0.4 0.1 -0.4 Leisure & Hospitality 22.1 22.3 22.3 22.4 22.5 22.5 22.5 22.5 22.5 22.5 22.5 22.6 22.7 Pct Chg Year Ago 6.2 5.6 2.3 1.8 1.6 1.2 0.6 0.2 0 -0.2 0.3 0.7 1 Other Services 5.4 5.4 5.5 5.5 5.5 5.5 5.5 5.5 5.5 5.5 5.5 5.5 5.5 Pct Chg Year Ago -2.4 -0.5 -0.4 0.9 0.9 0.6 0.7 0.7 0.9 0.8 0.6 0.5 0.3 Federal Government 6.4 6.4 6.3 6.3 6.3 6.3 6.2 6.2 6.1 6.1 6.1 6 6 Pct Chg Year Ago -2 -0.7 -1.6 -1.2 -1.8 -1.9 -2.1 -2.2 -2.2 -2.1 -2 -2.1 -2.3 State & Local Government 21.8 21.8 21.7 21.7 21.7 21.7 21.7 21.7 21.7 21.7 21.7 21.8 21.8 Pct Chg Year Ago 2.6 3 0.9 -0.3 -0.4 -0.4 -0.3 -0.1 -0.1 0.1 0.2 0.3 0.5
Other Economic IndicatorsPopulation (Ths) 471.3 472.2 472.9 473.6 474.3 475.1 475.8 476.7 477.5 478.3 479.1 479.9 480.7 Pct Chg Year Ago 0.6 0.6 0.7 0.6 0.6 0.6 0.6 0.7 0.7 0.7 0.7 0.7 0.7Labor Force (Ths) 215.1 216.8 218.3 219.6 220.7 221.7 222.7 223.7 224.6 225.5 226.3 227.1 227.7 Pct Chg Year Ago 2.3 2.4 2.1 2.6 2.6 2.3 2 1.9 1.8 1.7 1.6 1.5 1.4Unemployment Rate (%) 5.7 5.7 5.6 5.5 5.5 5.5 5.5 5.5 5.5 5.5 5.5 5.5 5.5Total Housing Starts 1891 1955 1996 2025 1979 1949 1902 1904 2065 2125 2151 2183 2185 Single-Family 1632 1700 1712 1736 1677 1647 1623 1649 1803 1874 1910 1935 1938 Multifamily 259 256 285 289 301 303 279 255 262 251 241 248 247

80 Florida & Metro Forecast - December 2014
TA L L A H A S S E E
O U T L O O K S U M M A R I E SThe Tallahassee Metropolitan Statistical Area (MSA)
is expected to show low growth in the economic indicators relative to other metro areas forecasted in the state. The area should see personal income growth averaging 4.7 percent each year. Real per capita income levels should average $34,600. Average annual wage growth is expected to be 3.5 percent. The average annual wage level will be $44,400. Population growth will average 0.8 percent, and the Gross Metro Product will average at a level of 13,927.35 million dollars.
Employment growth is expected to average 1.4 percent each year, the fourth lowest of the studied areas. However, the unemployment rate will average 5.0 percent, the second lowest of the twelve MSAs.
Construction and Mining will be the fastest growing sector in Tallahassee, averaging 8.3 percent annually. The Professional and Business Services sector follows with an average growth rate of 3.1 percent. The Federal Government is expected to decline by -1.6 percent and Manufacturing sectors decreasing by -1 percent.
M E T R O N E W S S U M M A R I E S Visit Tallahassee kicks off new marketing push for 2015
• Direct tourism spending in Leon County amounts to nearly $914 million. According to Lee Daniel, the Leon County Division of Tourism Department director, “If you use even a conservative multiplier of 1.4, it’s a billion-dollar industry for Tallahassee and Leon County.”
• The Tallahassee area saw 2.7 million visitors over the last year. According to Daniel, the daily average comes out to 7,397 visitors and $2.5 million in direct spending. Tourism is an important part of the Lean County economy as there are over 11,000 tourism-related jobs.
Source: Tallahassee Democrat, October 3, 2014
P R O F I L E SThe Tallahassee MSA is comprised of Gadsden,
Jefferson, Leon, and Wakulla Counties. It is located between Pensacola and Jacksonville. Tallahassee is the capital city of Florida and houses Florida State University and Florida A&M University.
QUICK FACTS:• Metro population estimate of 373,255 as of
July 1, 2013 (U.S. Census Bureau).• Gadsden County population estimate of
46,194 as of July 1, 2013 (U.S. Census Bureau).
• Jefferson County population estimate of 14,194 as of July 1, 2013 (U.S. Census Bureau).
• Leon County population estimate of 281,845 as of July 1, 2013 (U.S. Census Bureau).
• Wakulla County population estimate of 31,022 as of July 1, 2013 (U.S. Census Bureau).
• Civilian labor force of 197,543 in October 2014 (Florida Research and Economic Database).
• An unemployment rate of 5.2 % as of October 2014, not seasonally adjusted. This amounts to 10,370 unemployed people (Florida Research and Economic Database).
TOP AREA EMPLOYERS:• State of Florida – 24,599• Florida State University – 6,119• Leon County Schools – 4,550• Tallahassee Memorial HealthCare, Inc. – 3,190• City of Tallahassee – 2,736• Publix Supermarket – 2,102• Florida A&M University – 1,923• Leon County – 1,919• Walmart Stores Inc. – 1,300• Tallahassee Community College – 1,144
Source: Economic Development Council of Tallahassee, 2012

Institute for Economic Competitiveness 81
TA L L A H A S S E E
1-MW solar power project completed for Monticello plastics plant
• Vizco, the Visionary Company, a producer of plastic injection-molded drip pans, alarms, and pipe grips for water heaters, recently installed a solar power generator at their facility in Monticello. The installation consists of 3,280 photovoltaic panels that cover almost 4 acres.
• The installation has proven successful and is generating excess electric power for its production activity.
• Region Solar, a Sarasota-based company, completed the installation. They say that the equipment is expected to produce 1.45 million kWh of electricity every year.
• The owner of VizCo, Chris Cantolino, notes the economic advantages of sustainable energy. “Solar photovoltaic is a smart business choice. Reducing and controlling operational costs increases a business’s competitive edge.”
Source: Tallahassee Democrat, October 13, 2014
New Florida law a response to breaches in data security• The Florida Information Protection Act (FIPA) of
2014 was a law that was enacted on July 1 providing new requirements for companies and government agencies to protect personal electronic information.
• The law was in response to the many data breaches that have occurred throughout the past year. According to Attorney William Dillon, the law requires businesses to “take reasonable measures to protect and secure information that is in electronic format.”
• FIPA serves as a consumer protection measure, similar to the Privacy Rule of HIPAA, the federal government’s Health Insurance Portability and Accountability Act. The main concern of the state Attorney General’s Office is that in situations where there is a breach of consumer information, that victims are immediately notified so that they can avoid further harm.
Source: Tallahassee Democrat, October 15, 2014
Wild Wing Café is looking to expand in Tallahassee• The success of the restaurant chain Wild Wing
Café has caused the company to look to expand in Tallahassee. The company is currently seeking potential franchise owners.
• Wild Wing Café has many restaurant locations throughout the Southeast in addition to parts of California. Some of its restaurants are corporately owned and others are franchised.
• The franchise sees Tallahassee as an area with a lot of potential for growth due to the area’s attractive residential developments and growing commerce.
• The restaurant hopes to reach 100 locations by 2018 with special attention to certain markets throughout the Southeast.
Source: Tallahassee Democrat, December 3, 2014

82 Florida & Metro Forecast - December 2014
TA L L A H A S S E E
0 0.5 1 1.5 2 2.5 3
Total Nonagricultural Employment
Total Private
Goods Producing
Service Producing
Private Service Providing
Mining, Logging, and Construction
Manufacturing
Trade, Transportation, and Utilities
Wholesale Trade
Retail Trade
Transportation, Warehousing and Utilities
Information
Financial Activities
Professional and Business Services
Educational and Health Services
Leisure and Hospitality
Other Services
Government
Tallahassee MSA
Industry Location Quotients
171615141312111009080706050403020100
180.0
175.0
170.0
165.0
160.0
Tallahassee Payroll Employment(Thousands)
Tallahassee Payroll Employment
171615141312111009080706050403020100
14500.0
14000.0
13500.0
13000.0
12500.0
12000.0
11500.0
Tallahassee Real Gross Metro Product(Millions 2000 $)
Real Gross Metro Product
171615141312111009080706050403020100
8.0%
6.0%
4.0%
2.0%
0.0%
-2.0%
-4.0%
-6.0%
Tallahassee Real Personal Income(percent change year ago)
Real Personal Income
171615141312111009080706050403020100
12.0%
10.0%
8.0%
6.0%
4.0%
2.0%
Florida & Tallahassee Unemployment Rate(percent)
FL Unemployment RateTallahassee Unemployment Rate

Institute for Economic Competitiveness 83
TA L L A H A S S E E
Annual Outlook for Tallahassee, FL December 2014
2009 2010 2011 2012 2013 2014 2015 2016 2017Personal Income (Billions $)Total Personal Income 12.3 12.9 13.8 14.0 14.2 14.8 15.4 16.2 17.1 Pct Chg Year Ago -2.4 5.6 6.6 1.9 1.4 4.0 4.1 4.8 5.8 Wages and Salaries 6.8 6.8 6.8 6.8 7.0 7.3 7.6 8.0 8.4 Nonwage Income 5.5 6.2 7.0 7.2 7.3 7.5 7.8 8.1 8.7Real Personal Income (05$) 12.3 12.7 13.2 13.2 13.3 13.6 14.0 14.5 15.1 Pct Chg Year Ago -2.3 3.8 4.0 0.0 0.2 2.6 3.0 3.4 4.1Per Capita Income (Ths) 33.6 35.1 37.1 37.5 38.2 39.7 41.1 42.6 44.4Real Per Capita Income (05$) 33.6 34.5 35.6 35.3 35.5 36.5 37.4 38.2 39.2Average Annual Wage (Ths) 39.3 39.8 40.2 41.0 41.4 42.6 44.1 45.7 47.4 Pct Chg Year Ago 0.2 1.3 0.9 2.0 1.1 2.9 3.6 3.5 3.9Establishment Employment (Place of Work, Thousands, SA)Total Employment 171.1 169.2 168.0 166.3 167.4 169.9 172.4 174.7 177.2 Pct Chg Year Ago -2.8 -1.1 -0.7 -1.0 0.7 1.5 1.5 1.3 1.4Manufacturing 3.8 3.7 3.3 3.1 3.1 2.9 3.0 3.0 2.9 Pct Chg Year Ago -9.5 -4.1 -11.2 -3.9 -2.5 -4.5 1.0 -0.3 -0.3Nonmanufacturing 167.2 165.5 164.7 163.1 164.3 167.0 169.5 171.7 174.2 Pct Chg Year Ago -2.6 -1.0 -0.5 -1.0 0.7 1.6 1.5 1.4 1.4 Construction & Mining 7.0 6.4 6.1 5.9 6.2 6.4 7.0 7.7 8.5 Pct Chg Year Ago -18.0 -9.1 -4.5 -4.0 5.2 2.7 10.3 10.7 9.6 Trade, Trans, & Utilities 22.4 22.2 22.3 22.2 22.7 23.4 23.6 23.7 23.9 Pct Chg Year Ago -6.7 -0.9 0.7 -0.6 2.3 3.2 0.9 0.4 0.5 Wholesale Trade 3.4 3.3 3.3 3.2 3.3 3.4 3.5 3.6 3.7 Retail Trade 17.4 17.3 17.5 17.4 17.7 18.1 18.2 18.1 18.0 Trans, Wrhsng, & Util 1.6 1.6 1.6 1.6 1.7 1.9 1.9 2.0 2.1 Information 3.4 3.1 3.2 3.3 3.4 3.6 3.7 3.8 3.8 Pct Chg Year Ago -6.0 -9.1 3.5 3.6 1.9 6.1 4.0 2.0 1.0 Financial Activities 7.5 7.4 7.5 7.2 7.3 7.3 7.3 7.3 7.3 Pct Chg Year Ago -5.8 -1.1 0.9 -4.0 2.3 -0.5 -0.1 0.1 -0.1 Prof & Business Services 18.4 18.2 18.4 18.2 18.5 18.8 19.5 20.3 20.9 Pct Chg Year Ago -3.6 -1.6 1.4 -1.1 1.5 1.7 3.9 3.9 2.9 Educ & Health Services 19.5 19.6 19.9 19.7 19.6 19.6 19.8 20.0 20.2 Pct Chg Year Ago 1.4 0.4 1.4 -0.6 -0.5 0.0 0.7 1.3 1.1 Leisure & Hospitality 16.4 16.2 16.2 16.8 17.3 18.1 18.3 18.4 18.5 Pct Chg Year Ago -1.7 -1.3 0.0 3.5 3.0 5.0 1.1 0.5 0.6 Other Services 9.7 9.5 8.9 9.2 8.8 9.0 9.1 9.2 9.3 Pct Chg Year Ago 3.3 -2.2 -5.7 3.1 -3.9 1.4 1.4 1.5 1.4 Federal Government 2.0 2.1 1.9 1.9 2.0 1.9 1.9 1.9 1.8 Pct Chg Year Ago 1.2 5.1 -9.1 -0.5 3.2 -3.3 -0.9 -1.1 -1.0 State & Local Government 60.9 60.9 60.3 58.8 58.5 58.9 59.2 59.4 59.9 Pct Chg Year Ago -0.4 0.0 -1.1 -2.5 -0.4 0.7 0.5 0.2 0.9Other Economic IndicatorsPopulation (Ths) 365.2 368.6 371.7 374.7 373.1 372.7 374.8 379.5 385.0 Pct Chg Year Ago 1.0 0.9 0.8 0.8 -0.4 -0.1 0.6 1.2 1.4Labor Force (Ths) 192.0 192.4 190.5 191.0 190.1 193.9 199.7 205.0 209.3 Pct Chg Year Ago 0.5 0.2 -1.0 0.3 -0.5 2.0 3.0 2.6 2.1Unemployment Rate (%) 7.3 8.3 8.3 7.4 6.2 5.4 4.9 4.8 4.8Total Housing Starts 827.9 659.1 782.9 993.0 1225.0 1340.1 1764.6 2000.4 2167.6 Single-Family 613.2 603.0 563.3 494.3 606.5 724.8 1001.9 1219.3 1414.5 Multifamily 215 56 220 499 618 615 763 781 753

84 Florida & Metro Forecast - December 2014
TA L L A H A S S E E
Quarterly Outlook for Tallahassee, FLDecember 2014
2014Q4 2015Q1 2015Q2 2015Q3 2015Q4 2016Q1 2016Q2 2016Q3 2016Q4 2017Q1 2017Q2 2017Q3 2017Q4
Personal Income (Billions $)Total Personal Income 15.1 15.2 15.3 15.5 15.6 15.8 16 16.3 16.5 16.8 17 17.2 17.4 Pct Chg Year Ago 4.9 5.1 4.1 3.7 3.6 4 4.5 5.1 5.6 5.8 5.9 5.8 5.6 Wages and Salaries 7.4 7.5 7.6 7.7 7.8 7.9 8 8.1 8.2 8.3 8.4 8.5 8.6 Nonwage Income 7.6 7.7 7.7 7.8 7.9 8 8.1 8.2 8.3 8.5 8.6 8.7 8.8Real Personal Income (05$) 13.8 13.9 14 14 14.1 14.3 14.4 14.6 14.7 14.9 15 15.2 15.3 Pct Chg Year Ago 3.6 3.9 3.1 2.6 2.3 2.6 3.2 3.8 4.1 4.3 4.2 4.1 3.9Per Capita Income (Ths) 40.4 40.8 41 41.2 41.5 42 42.3 42.8 43.2 43.7 44.2 44.6 45Real Per Capita Income (05$) 37 37.3 37.3 37.4 37.6 37.9 38.1 38.3 38.6 38.9 39.1 39.3 39.5Average Annual Wage (Ths) 43.3 43.6 43.9 44.3 44.7 45 45.5 45.9 46.3 46.7 47.2 47.7 48.2 Pct Chg Year Ago 4.3 3.9 3.9 3.6 3.2 3.2 3.4 3.6 3.7 3.8 3.8 3.9 4
Establishment Employment (Place of Work, Thousands, SA)Total Employment 171.1 171.7 172.2 172.7 173.1 173.7 174.3 175.1 175.8 176.4 176.9 177.4 177.9 Pct Chg Year Ago 1.3 2 1.3 1.4 1.2 1.2 1.2 1.4 1.5 1.5 1.5 1.4 1.2Manufacturing 2.9 3 3 3 3 3 3 3 2.9 2.9 2.9 2.9 2.9 Pct Chg Year Ago -1 0.8 1.4 1.2 0.7 0.3 -0.3 -0.5 -0.8 -0.6 -0.2 -0.2 -0.1Nonmanufacturing 168.1 168.8 169.2 169.7 170.2 170.7 171.3 172.1 172.8 173.4 174 174.5 175 Pct Chg Year Ago 1.4 2.1 1.3 1.4 1.2 1.2 1.3 1.4 1.6 1.6 1.5 1.4 1.2 Construction & Mining 6.6 6.8 6.9 7.1 7.2 7.4 7.6 7.9 8.1 8.3 8.4 8.6 8.7 Pct Chg Year Ago 6.6 10.2 10.4 11.3 9.2 9.6 10.4 11 11.6 11.6 10.5 8.9 7.6 Trade, Trans, & Utilities 23.5 23.6 23.6 23.7 23.7 23.7 23.7 23.8 23.8 23.8 23.8 23.9 23.9 Pct Chg Year Ago 1.2 1.2 0.3 1.4 0.9 0.6 0.5 0.3 0.4 0.4 0.5 0.6 0.5 Wholesale Trade 3.4 3.5 3.5 3.5 3.5 3.5 3.6 3.6 3.6 3.6 3.7 3.7 3.7 Retail Trade 18.1 18.2 18.2 18.2 18.2 18.1 18.1 18.1 18.1 18 18 18 17.9 Trans, Wrhsng, & Util 1.9 1.9 1.9 1.9 2 2 2 2 2 2 2.1 2.1 2.1 Information 3.7 3.8 3.7 3.7 3.7 3.7 3.8 3.8 3.8 3.8 3.8 3.8 3.8 Pct Chg Year Ago 9.1 11.9 4.2 0.9 -0.4 -1.7 2.2 4 3.6 3.6 1.1 -0.5 -0.1 Financial Activities 7.3 7.3 7.3 7.3 7.3 7.3 7.3 7.3 7.3 7.3 7.3 7.3 7.3 Pct Chg Year Ago -1.1 -0.5 -0.5 0.5 0.3 0.2 0.1 0 0.2 0.2 0.2 -0.1 -0.7 Prof & Business Services 19 19.2 19.4 19.7 19.9 20 20.2 20.4 20.6 20.7 20.9 20.9 21 Pct Chg Year Ago 2.1 3 3.6 4.2 4.6 4.4 3.8 3.7 3.7 3.6 3.4 2.6 1.9 Educ & Health Services 19.6 19.7 19.8 19.8 19.8 19.9 20 20.1 20.2 20.2 20.2 20.3 20.3 Pct Chg Year Ago -0.5 0.1 0.5 1.2 1 1 0.9 1.3 1.9 1.6 1.3 0.9 0.5 Leisure & Hospitality 18.2 18.3 18.3 18.4 18.4 18.4 18.4 18.4 18.4 18.4 18.5 18.6 18.6 Pct Chg Year Ago 1.7 1.8 -0.2 1.4 1.2 1 0.6 0.3 0.1 0 0.5 0.9 1.2 Other Services 9 9 9.1 9.1 9.1 9.2 9.2 9.2 9.3 9.3 9.3 9.4 9.4 Pct Chg Year Ago 1.9 1.9 1 1.3 1.3 1.2 1.4 1.5 1.7 1.7 1.5 1.3 1.1 Federal Government 1.9 1.9 1.9 1.9 1.9 1.9 1.9 1.9 1.9 1.8 1.8 1.8 1.8 Pct Chg Year Ago -4.3 -1.1 -0.8 -0.6 -1.1 -1.1 -1.2 -1.1 -1 -0.9 -0.8 -1 -1.1 State & Local Government 59.4 59.3 59.2 59.1 59.2 59.3 59.3 59.4 59.5 59.7 59.8 60 60.2 Pct Chg Year Ago 1.1 1.8 0.9 -0.4 -0.3 -0.1 0.1 0.4 0.5 0.7 0.9 1 1.1
Other Economic IndicatorsPopulation (Ths) 373.1 373.6 374.3 375.2 376.2 377.4 378.8 380.2 381.6 383 384.3 385.7 387.1 Pct Chg Year Ago 0.1 0.3 0.5 0.7 0.8 1 1.2 1.3 1.4 1.5 1.4 1.4 1.4Labor Force (Ths) 195.4 197.3 199.1 200.6 202 203.2 204.4 205.6 206.8 207.8 208.9 209.8 210.6 Pct Chg Year Ago 2.9 2.6 2.7 3.5 3.4 3 2.7 2.5 2.4 2.3 2.2 2 1.9Unemployment Rate (%) 5.1 5.1 5 4.9 4.9 4.9 4.9 4.8 4.8 4.8 4.8 4.8 4.8Total Housing Starts 1413 1573 1734 1841 1910 1963 1954 1973 2112 2155 2152 2184 2178 Single-Family 793 896 972 1056 1083 1123 1165 1240 1350 1395 1415 1427 1421 Multifamily 620 677 762 785 827 839 789 734 762 761 737 757 758

Institute for Economic Competitiveness 85
TA M P A – S T . P E T E R S B U R G – C L E A R W AT E R
O U T L O O K S U M M A R I E SThe Tampa–St. Petersburg–Clearwater Metropolitan
Statistical Area (MSA) is expected to show moderate growth in the economic indicators. Personal income growth is expected to be 4.7 percent on average each year, and the real per capita income level will average $37,500. Average annual wage growth is expected to be 3.2 percent, the lowest of the studied MSAs. The average annual wage level will be $51,800. Population growth will average 1.2 percent, and Tampa is forecasted to have the second highest average Gross Metro Product in the studied areas, averaging a level of 122,562.57 million dollars.
Employment growth is expected to average 1.8 percent annually. The unemployment rate is expected to average a moderate 5.9 percent.
The fastest growing sector in the Tampa area will be the Construction and Mining sector with an average annual growth rate of 6.5 percent. This is followed by the Professional and Business Service sector and the Education and Health Service sector with average annual growth rates of 3.3 percent and 1.6 percent, respectively. The Federal Government sector will experience a decline of -0.4 percent.
M E T R O N E W S S U M M A R I E SBoutique hotel proposal latest sign of Ybor City’s evolution
• A five-story, 187-room “boutique” hotel was proposed for a 1.3-acre site on the 1400 block of E Seventh Avenue. The $46 million project is proposed by a partnership composed of several influential Tampa families.
• The project requires the approval of a 60-foot building height, which exceeds the city’s limit by 15 feet. The hotel would include a rooftop bar, pool and fitness center. With approval, construction could start in the spring, with the hopes of the hotel opening in fall 2016.
• This development represents progress in the evolution of Ybor City from an area suffering economically to an independent urban center. The trends of growth were supported by a survey of 262 Ybor City companies that concluded that over 80
P R O F I L E SThe Tampa–St. Petersburg–Clearwater MSA is
comprised of Hernando, Hillsborough, Pasco, and Pinellas counties. Located centrally on the west coast of Florida, this region includes Tarpon Springs, Sponge Docks, Ybor City, Bush Gardens, the University of South Florida and the University of Tampa. The Tampa Bay Buccaneers and the Tampa Bay Rays call this region home.
QUICK FACTS:• Metro population estimate of 2,870,569 as of
July 1, 2013 (U.S. Census Bureau).• Hernando County population estimate of
174,441 as of July 1, 2013 (U.S. Census Bureau).• Hillsborough County population estimate
of 1,291,578 as of July 1, 2013 (U.S. Census Bureau).
• Pasco County population estimate of 475,502 as of July 1, 2013 (U.S. Census Bureau).
• Pinellas County population estimate of 929,048 as of July 1, 2013 (U.S. Census Bureau).
• Civilian labor force of 1,361,463 in October 2014 (Florida Research and Economic Database).
• Unemployment rate of 6.0% as of October 2014, not seasonally adjusted. This amounts to 81,324 unemployed people (Florida Research and Economic Database).
TOP AREA EMPLOYERS:• Hillsborough County School board – 29,603• MacDill Air Force Base – 15,485• Pinellas County School District – 13,905• Hillsborough County Government – 9,328• Pasco County School District – 9,289• Verizon Communications, Inc. – 9,065• University of South Florida – 8,353• Tampa International Airport – 8,060• Tampa General Hospital – 6,900• Publix Food Centers – 5,823
Sources: Pasco County School District, Pinellas County School District, 2011 Comprehensive Annual Financial Report: Tampa Port Authority

86 Florida & Metro Forecast - December 2014
TA M PA – S T . P E T E R S B U R G – C L E A R WAT E R
percent of businesses were growing and expanding staff hires. Forty-one new businesses have opened in the area since 2013.
Source: Tampa Bay Times, November 1, 2014 Lantmannen Unibake looks to expand its St. Petersburg footprint
• St. Petersburg Mayor Rick Kriseman is willing to use $600,000 to provide incentive for Lantmannen Unibake, a Danish food processing company, to expand within Tampa.
• Lantmannen Unibake is currently located at 1927 Fourth Ave. S, but wants to expand by building a stand-alone pastry baking facility in order to bake pastries that are currently made exclusively in its European bakeries.
• The project would be worth $25 million and is expected to create about 150 jobs within Tampa. The wage for at least one-fifth of those jobs would be $15 per hour due to the location within an enterprise zone (defined by a state program that provides economic incentives for companies to hire local employees).
Source: Tampa Bay Times, November 17, 2014
As SeaWorld suffers ‘Blackfish’ impact, Busch Gardens suffers, too
• SeaWorld Entertainment is comprised of several SeaWorld and Busch Gardens parks, as well as a few smaller brand parks in the United States.
• Within the past year the share price of the company has dropped by almost 50 percent, destroying more than $1.4 billion in market value. The company has received substantial criticism after the release of Blackfish, a film that focuses on the death of three whale trainers throughout SeaWorld’s history.
• In its latest quarterly SEC filing, the company’s management attributed the struggles of its business in Florida to delays in opening a new ride at Busch Gardens Tampa and competition from competing parks. Slowing attendance and decreased revenues may provide challenges for SeaWorld to obtain new capital to work on new park projects.
Source: Tampa Bay Times, November 17, 2014
Lockheed Martin to join growing solar presence in Tampa Bay
• Lockheed Martin has plans to build a large solar power system at its Pinellas County facility. The project will consist of a canopy-style system that will cover the employee parking lot. Up to two megawatts of electricity are expected to be produced from this system.
• In combination with Great Bay Beer Distributors, Tampa International Airport, C.W. Bill Young VA Medical Center and James A. Haley VA Medical Center, 11 megawatts of electricity will be produced, which could power over 1,400 homes.
• The Lockheed facility boasts 380 employees, and provides systems engineering, software development and other services for the aerospace, technology and defense contractor.
• According to Curt Engel, Lockheed mission systems and training general manager, construction is expected to begin in early 2015 and become operational by 2016.
Source: Tampa Bay Times, November 14, 2014
Costco to join Pasco’s Cypress Creek Town Center• The Cypress Creek Town Center, a 540-acre
shopping center being built at the interchange of the I-75 and SR 56, recently welcomed Costco to its list of confirmed retailers.
• The Costco Wholesale store will be located on an 18-acre lot near a Sam’s Club and within driving distance to a B.J.’s Wholesale Club.
• The entire shopping center project will span 2 million square feet of space and include retailers, offices, hotels and residences. Also included in the project is a 1.1 million-square-foot Premium Outlets mall, which is being built by Simon and is expected to open in October 2015.
• Simon’s marketing effort points out the location near the highway interchange puts the project within a 30-mile drive of nearly 2.7 million people with an average household income of $64,000.
Source: Tampa Bay Times, December 3, 2014

Institute for Economic Competitiveness 87
TA M P A – S T . P E T E R S B U R G – C L E A R W AT E R
0 0.2 0.4 0.6 0.8 1 1.2 1.4
Total Nonagricultural Employment
Total Private
Goods Producing
Service Producing
Private Service Providing
Mining, Logging, and Construction
Manufacturing
Trade, Transportation, and Utilities
Wholesale Trade
Retail Trade
Transportation, Warehousing and Utilities
Information
Financial Activities
Professional and Business Services
Educational and Health Services
Leisure and Hospitality
Other Services
Government
Tampa - St. Petersburg - Clearwater
Industry Location Quotients
171615141312111009080706050403020100
1300.0
1250.0
1200.0
1150.0
1100.0
1050.0
Tampa Payroll Employment(Thousands)
Tampa Payroll Employment
171615141312111009080706050403020100
130000.0
120000.0
110000.0
100000.0
90000.0
Tampa Real Gross Metro Product(Millions 2000 $)
Real Gross Metro Product
171615141312111009080706050403020100
8.0%6.0%4.0%2.0%0.0%
-2.0%-4.0%-6.0%-8.0%
Tampa Real Personal Income(percent change year ago)
Real Personal Income
171615141312111009080706050403020100
14.0%12.0%10.0%8.0%6.0%4.0%2.0%
Florida & Tampa Unemployment Rate(percent)
FL Unemployment RateTampa Unemployment Rate

88 Florida & Metro Forecast - December 2014
TA M PA – S T . P E T E R S B U R G – C L E A R WAT E R
Annual Outlook for Tampa-St. Petersburg-Clearwater, FL December 2014
2009 2010 2011 2012 2013 2014 2015 2016 2017Personal Income (Billions $)Total Personal Income 100.4 106.7 112.2 116.3 118.9 124.0 129.1 135.4 143.1 Pct Chg Year Ago -3.8 6.3 5.2 3.6 2.3 4.3 4.1 4.8 5.7 Wages and Salaries 51.1 51.3 53.0 55.6 57.6 60.5 63.3 66.5 70.0 Nonwage Income 49.3 55.4 59.2 60.7 61.3 63.6 65.8 68.9 73.1Real Personal Income (05$) 100.4 104.9 107.7 109.6 110.8 114.0 117.4 121.5 126.4 Pct Chg Year Ago -3.7 4.5 2.7 1.8 1.1 2.9 3.0 3.5 4.0Per Capita Income (Ths) 36.3 38.2 39.7 40.8 41.4 42.8 44.1 45.6 47.4Real Per Capita Income (05$) 36.3 37.5 38.1 38.5 38.6 39.4 40.1 40.9 41.9Average Annual Wage (Ths) 45.2 45.8 46.6 47.9 48.4 49.9 51.3 53.0 54.9 Pct Chg Year Ago 1.7 1.3 1.7 2.7 1.0 3.1 2.9 3.2 3.7Establishment Employment (Place of Work, Thousands, SA)Total Employment 1117.2 1106.1 1123.8 1148.6 1177.1 1199.2 1221.1 1243.2 1262.5 Pct Chg Year Ago -6.0 -1.0 1.6 2.2 2.5 1.9 1.8 1.8 1.6Manufacturing 61.9 58.2 58.8 59.4 60.0 62.0 62.2 62.0 61.7 Pct Chg Year Ago -13.4 -6.0 1.1 1.1 1.0 3.2 0.3 -0.3 -0.5Nonmanufacturing 1055.3 1047.9 1065.0 1089.2 1117.1 1137.2 1158.9 1181.2 1200.8 Pct Chg Year Ago -5.5 -0.7 1.6 2.3 2.6 1.8 1.9 1.9 1.7 Construction & Mining 60.2 52.9 52.7 54.2 57.1 58.6 62.8 67.9 73.5 Pct Chg Year Ago -21.2 -12.1 -0.3 2.8 5.4 2.6 7.1 8.1 8.3 Trade, Trans, & Utilities 210.5 209.4 213.5 218.9 222.8 229.5 233.8 235.8 237.6 Pct Chg Year Ago -7.4 -0.5 1.9 2.6 1.8 3.0 1.9 0.8 0.8 Wholesale Trade 47.7 45.9 46.3 48.4 49.1 50.0 50.9 52.0 53.1 Retail Trade 137.1 138.3 141.4 143.9 146.5 151.7 153.9 153.4 152.5 Trans, Wrhsng, & Util 25.7 25.1 25.8 26.6 27.3 27.8 28.6 29.5 30.4 Information 27.5 25.7 25.9 25.7 26.2 26.0 26.3 26.6 26.8 Pct Chg Year Ago -9.0 -6.6 0.6 -0.6 2.0 -0.8 0.9 1.5 0.6 Financial Activities 93.2 89.4 91.6 95.5 99.6 101.1 101.7 102.3 102.5 Pct Chg Year Ago -5.5 -4.1 2.5 4.3 4.3 1.5 0.6 0.5 0.2 Prof & Business Services 169.9 174.2 182.6 190.9 199.6 207.0 213.3 221.1 227.2 Pct Chg Year Ago -7.1 2.5 4.8 4.5 4.5 3.7 3.1 3.6 2.8 Educ & Health Services 174.4 178.0 181.0 182.3 185.1 187.6 190.7 194.7 197.1 Pct Chg Year Ago 0.8 2.1 1.7 0.7 1.6 1.3 1.7 2.1 1.2 Leisure & Hospitality 122.1 121.4 123.0 128.3 132.5 133.8 136.2 137.8 139.5 Pct Chg Year Ago -4.8 -0.5 1.3 4.3 3.2 1.0 1.8 1.2 1.2 Other Services 43.1 42.0 41.3 41.1 42.0 41.9 42.1 42.6 43.1 Pct Chg Year Ago -8.0 -2.7 -1.6 -0.6 2.3 -0.2 0.6 1.1 1.1 Federal Government 22.7 24.0 22.9 22.6 22.7 22.8 22.8 22.6 22.4 Pct Chg Year Ago 3.7 5.6 -4.6 -1.3 0.5 0.4 -0.2 -0.8 -0.9 State & Local Government 131.7 131.0 130.5 129.7 129.4 128.9 129.1 129.8 131.1 Pct Chg Year Ago 0.5 -0.6 -0.4 -0.6 -0.2 -0.4 0.2 0.5 1.0Other Economic IndicatorsPopulation (Ths) 2767.9 2795.5 2828.5 2848.8 2873.0 2896.8 2930.8 2971.7 3016.7 Pct Chg Year Ago 0.7 1.0 1.2 0.7 0.8 0.8 1.2 1.4 1.5Labor Force (Ths) 1295.1 1292.9 1307.9 1321.4 1333.0 1357.1 1386.8 1413.0 1436.9 Pct Chg Year Ago -0.9 -0.2 1.2 1.0 0.9 1.8 2.2 1.9 1.7Unemployment Rate (%) 10.8 11.8 10.7 9.0 7.3 6.3 5.8 5.7 5.7Total Housing Starts 5902.7 6335.7 6942.4 9032.1 11614.8 12310.9 15402.6 17609.4 19879.8 Single-Family 3975.9 4510.7 4491.5 5893.2 7240.9 7422.5 10029.3 11834.8 14192.7 Multifamily 1927 1825 2451 3139 4374 4888 5373 5775 5687

Institute for Economic Competitiveness 89
TA M P A – S T . P E T E R S B U R G – C L E A R W AT E R
Quarterly Outlook for Tampa-St. Petersburg-Clearwater, FL December 2014
2014Q4 2015Q1 2015Q2 2015Q3 2015Q4 2016Q1 2016Q2 2016Q3 2016Q4 2017Q1 2017Q2 2017Q3 2017Q4
Personal Income (Billions $)Total Personal Income 126 127.5 128.5 129.7 130.9 132.8 134.4 136.2 138.1 140.3 142.2 144 145.9 Pct Chg Year Ago 4.7 4.7 4 4 3.9 4.2 4.6 5 5.5 5.6 5.8 5.8 5.6 Wages and Salaries 61.4 62.2 63 63.7 64.4 65.2 66 66.9 67.8 68.7 69.6 70.4 71.3 Nonwage Income 64.6 65.2 65.6 66 66.5 67.6 68.4 69.3 70.3 71.6 72.6 73.6 74.6Real Personal Income (05$) 115.4 116.6 117.1 117.7 118.4 119.8 120.9 122 123.3 124.8 125.8 126.9 128.1 Pct Chg Year Ago 3.4 3.6 3 2.9 2.6 2.8 3.2 3.7 4.1 4.1 4.1 4.1 3.9Per Capita Income (Ths) 43.3 43.7 43.9 44.2 44.5 44.9 45.3 45.7 46.2 46.8 47.2 47.7 48.1Real Per Capita Income (05$) 39.7 40 40 40.1 40.2 40.5 40.8 41 41.3 41.6 41.8 42 42.2Average Annual Wage (Ths) 50.4 50.8 51.1 51.5 51.9 52.3 52.7 53.2 53.6 54.1 54.6 55.2 55.7 Pct Chg Year Ago 3.6 3 2.8 2.8 2.9 2.9 3.1 3.3 3.3 3.5 3.6 3.8 3.9
Establishment Employment (Place of Work, Thousands, SA)Total Employment 1205.3 1212.5 1218.7 1224.2 1228.9 1234.3 1240 1245.9 1252.5 1256.8 1260.9 1264.5 1267.8 Pct Chg Year Ago 1.5 1.7 1.6 2.1 2 1.8 1.7 1.8 1.9 1.8 1.7 1.5 1.2Manufacturing 61.9 62 62.2 62.2 62.3 62.3 62 61.9 61.8 61.8 61.7 61.7 61.5 Pct Chg Year Ago 1.1 -1.2 0.5 1.3 0.7 0.4 -0.2 -0.5 -0.9 -0.8 -0.5 -0.4 -0.4Nonmanufacturing 1143.4 1150.5 1156.6 1162 1166.6 1172.1 1177.9 1184 1190.7 1195 1199.2 1202.8 1206.3 Pct Chg Year Ago 1.5 1.8 1.6 2.2 2 1.9 1.8 1.9 2.1 2 1.8 1.6 1.3 Construction & Mining 59.8 60.9 62.1 63.5 64.6 65.8 67.2 68.5 70 71.4 72.9 74.3 75.6 Pct Chg Year Ago 1.4 4.7 7.8 7.9 8.1 8.1 8.1 7.9 8.3 8.4 8.5 8.4 8 Trade, Trans, & Utilities 231.6 232.6 233.5 234.4 234.9 235.2 235.5 236 236.6 236.8 237.3 237.9 238.5 Pct Chg Year Ago 2.9 2.4 1.9 1.9 1.4 1.1 0.9 0.7 0.7 0.7 0.8 0.8 0.8 Wholesale Trade 50.2 50.4 50.7 51 51.3 51.5 51.8 52.1 52.5 52.7 52.9 53.2 53.5 Retail Trade 153.1 153.6 153.8 154.1 154 153.8 153.5 153.3 153.2 152.7 152.5 152.4 152.3 Trans, Wrhsng, & Util 28.1 28.2 28.4 28.7 28.9 29.2 29.4 29.6 29.9 30.1 30.3 30.5 30.7 Information 26.3 26.7 26.3 26.1 26 26.1 26.7 27 26.8 26.9 26.9 26.8 26.8 Pct Chg Year Ago 0.6 2.8 1 0.6 -0.9 -2.2 1.6 3.5 3 3 0.6 -0.8 -0.2 Financial Activities 101.1 101.7 101.7 101.8 101.8 102 102.2 102.3 102.6 102.8 102.7 102.5 102.1 Pct Chg Year Ago 0.6 1 -0.1 0.9 0.6 0.4 0.5 0.5 0.8 0.7 0.6 0.2 -0.5 Prof & Business Services 209.4 210.9 212.6 214 215.9 217.7 219.6 222.1 224.9 226.4 227 227.4 228 Pct Chg Year Ago 3.5 3.4 2.9 2.9 3.1 3.2 3.3 3.8 4.2 4 3.4 2.4 1.4 Educ & Health Services 187.3 188.7 190.7 191.5 191.8 192.9 194.4 195.2 196.3 196.5 197 197.3 197.4 Pct Chg Year Ago 0.1 0.5 1.2 2.6 2.4 2.2 2 1.9 2.3 1.9 1.3 1.1 0.6 Leisure & Hospitality 134.2 135.3 135.9 136.5 137.3 137.8 137.7 137.9 138.1 138.4 139 139.8 140.6 Pct Chg Year Ago 1.6 2 0.7 2.4 2.3 1.9 1.3 1 0.6 0.5 1 1.4 1.8 Other Services 41.9 42 42.1 42.2 42.3 42.4 42.5 42.7 42.8 42.9 43 43.1 43.3 Pct Chg Year Ago -0.7 0.3 0 1 1 1 1.1 1.1 1.2 1.1 1.1 1.1 1.1 Federal Government 22.8 22.8 22.8 22.8 22.7 22.7 22.6 22.6 22.5 22.5 22.4 22.4 22.3 Pct Chg Year Ago 0 -0.2 0.2 -0.1 -0.6 -0.6 -0.8 -0.9 -0.9 -0.9 -0.7 -0.9 -1 State & Local Government 128.9 129 129 129.1 129.3 129.4 129.6 129.9 130.1 130.5 130.9 131.3 131.8 Pct Chg Year Ago -0.2 -0.1 0.2 0.3 0.3 0.4 0.5 0.6 0.6 0.8 1 1.1 1.3
Other Economic IndicatorsPopulation (Ths) 2908 2916.8 2925.9 2935.3 2945.1 2955.5 2965.9 2977 2988.3 2999.2 3010.8 3022.5 3034.3 Pct Chg Year Ago 0.9 1 1.1 1.2 1.3 1.3 1.4 1.4 1.5 1.5 1.5 1.5 1.5Labor Force (Ths) 1365.9 1375.3 1383.7 1390.9 1397.2 1403.4 1409.7 1416.3 1422.7 1428.7 1434.4 1439.8 1444.9 Pct Chg Year Ago 2.5 2.3 1.8 2.4 2.3 2 1.9 1.8 1.8 1.8 1.8 1.7 1.6Unemployment Rate (%) 6 5.9 5.8 5.7 5.7 5.8 5.8 5.7 5.7 5.7 5.7 5.7 5.7Total Housing Starts 13236 14111 15173 15929 16398 16939 17094 17573 18832 19402 19654 20147 20316 Single-Family 8299 9177 9800 10488 10652 10957 11294 11969 13120 13728 14103 14404 14536 Multifamily 4937 4934 5373 5441 5746 5981 5801 5604 5712 5674 5552 5743 5780

I N D U S T R Y L O C AT I O N Q U O T I E N T
90 Florida & Metro Forecast - December 2014
E X P L A N AT I O N A N D I N T E R P R E TAT I O N
This technique compares the local economy to a reference economy; in this case, the local economy is the chosen MSA, and the reference economy is the state of Florida. An Industry Location Quotient (LQ) is calculated to determine if the local economy has a greater share of each industry’s employment than the reference economy. The LQ helps to identify specializations that exist in the local economy.
There are only three possible outcomes: 1. An LQ greater than one 2. An LQ equal to one and 3. An LQ less than one. An LQ that is greater than one means that the share of local employment in that particular industry is greater than the reference economy employment share in that same industry. This implies that some of the goods or services produced by that industry are exported for consumption elsewhere. An LQ of one means that local demand is met by the local industry. No goods/services are imported or exported from the local area in that industry. The share of local employment in that industry is equal to the share for that industry in the reference economy. An LQ less than one implies that the industry is not meeting local demand for that good or service, and in order to meet demand, that area must import that good or service. This also means that the share of local employment in that industry is less than the share of employment in that industry for the reference economy.
C A L C U L AT I O N
An industry location quotient is a calculated ratio of two ratios.
LQ = ((Local employment in industry A in year T / Total local employment in year T) / (Reference economy employment in industry A in year T) / (Total reference employment in year T))
For example:
Orlando MSA employment for Information is 27,400Total Orlando MSA nonagricultural employment is 1,104,100Florida employment for Information is 169,800Total Florida nonagricultural employment is 8,247,000
LQ = ((27,400 / 1,104,100) / (169,800 / 8,247,000)) = 1.2039
Source: Florida Regional Economic Database, Current Employment Statistics, December 2006

We would like to recognize the following organizations for their support of the Institute for Economic Competitiveness:
S E A N M . S N A I T H , P H . D .

U N I V E R S I T Y O F C E N T R A L F L O R I D AC o l l e g e o f B u s i n e s s A d m i n i s t r a t i o n
I n s t i t u t e f o r E c o n o m i c C o m p e t i t i v e n e s s
P. O . B o x 1 6 1 4 0 0 , O r l a n d o , F l o r i d a 3 2 8 1 6
P H 4 0 7. 8 2 3 . 1 4 5 3 FA X 4 0 7. 8 2 3 . 1 4 5 4 w w w . i e c . u c f . e d u