Embed Size (px)
Citation preview

AFRL-RH-WP-TR-2015-0089
SIMULATED LIDAR IMAGES OF HUMAN POSE USING A 3DS MAX VIRTUAL LABORATORY
Jeanne Smith Isiah Davenport
Infoscitex Corp. 4027 Col. Glenn Hwy, Suite 210
Dayton OH 45431
Huaining Cheng Human Signatures Branch
Human-Centered ISR Division
December 2015
INTERIM TECHNICAL REPORT
Distribution A: Approved for public release.
AIR FORCE RESEARCH LABORATORY 711TH HUMAN PERFORMANCE WING
HUMAN EFFECTIVENESS DIRECTORATE WRIGHT-PATTERSON AIR FORCE BASE, OH 45433
AIR FORCE MATERIEL COMMAND UNITED STATES AIR FORCE

NOTICE AND SIGNATURE PAGE
Using Government drawings, specifications, or other data included in this document for any purpose other than Government procurement does not in any way obligate the U.S. Government. The fact that the Government formulated or supplied the drawings, specifications, or other data does not license the holder or any other person or corporation; or convey any rights or permission to manufacture, use, or sell any patented invention that may relate to them.
Qualified requestors may obtain copies of this report from the Defense Technical Information Center (DTIC).
AFRL-RH-WP-TR-2015-0089 HAS BEEN REVIEWED AND IS APPROVED FOR PUBLICATION IN ACCORDANCE WITH ASSIGNED DISTRIBUTION STATEMENT.
______________________________________ ____________________________________ SHANE FERNADES, Work Unit Manager LOUISE A. CARTER, Ph. D., Chief Human Signature Branch Human-Centered ISR Division
Human Effectiveness Directorate 711th Human Performance Wing
Air Force Research Laboratory
This report is published in the interest of scientific and technical information exchange, and its publication does not constitute the Government’s approval or disapproval of its ideas or findings.
//signature// //signature//

i
REPORT DOCUMENTATION PAGE Form Approved OMB No. 0704-0188
Public reporting burden for this collection of information is estimated to average 1 hour per response, including the time for reviewing instructions, searching existing data sources, gathering and maintaining the data needed, and completing and reviewing this collection of information. Send comments regarding this burden estimate or any other aspect of this collection of information, including suggestions for reducing this burden to Department of Defense, Washington Headquarters Services, Directorate for Information Operations and Reports (0704-0188), 1215 Jefferson Davis Highway, Suite 1204, Arlington, VA 22202-4302. Respondents should be aware that notwithstanding any other provision of law, no person shall be subject to any penalty for failing to comply with a collection of information if it does not display a currently valid OMB control number. PLEASE DO NOT RETURN YOUR FORM TO THE ABOVE ADDRESS. 1. REPORT DATE (DD-MM-YYYY)
11-12-2015 2. REPORT TYPE
Interim 3. DATES COVERED (From - To)
March 2013 – April 2015
4. TITLE AND SUBTITLE Simulated LIDAR Images of Human Pose using a 3DS Max Virtual Laboratory
5a. CONTRACT NUMBER In-House 5b. GRANT NUMBER 5c. PROGRAM ELEMENT NUMBER 62202F
6. AUTHOR(S) Jeanne Smith* Isiah Davenport* Huaining Cheng**
5d. PROJECT NUMBER 5328 5e. TASK NUMBER B 5f. WORK UNIT NUMBER H0FQ 5328B009 7. PERFORMING ORGANIZATION NAME(S) AND ADDRESS(ES)
*Infoscitex Corp.
8. PERFORMING ORGANIZATION REPORT NUMBER
4027 Colonel Glenn Highway Suite 210 Dayton, OH 45431
9. SPONSORING / MONITORING AGENCY NAME(S) AND ADDRESS(ES) 10. SPONSOR/MONITOR’S ACRONYM(S) **Air Force Materiel Command Air Force Research Laboratory 711 Human Performance Wing Human Effectiveness Directorate Human-Centered ISR Division Human Signatures Branch Wright-Patterson AFB OH 45433
711 HPW/RHXB
11. SPONSOR/MONITOR’S REPORT NUMBER(S)
AFRL-RH-WP-TR-2015-0089 12. DISTRIBUTION / AVAILABILITY STATEMENT Distribution A: Approved for public release.
13. SUPPLEMENTARY NOTES Cleared: 88ABW-2016-0242, 25 January 2016 Report contains color 14. ABSTRACT Large sets of 3D Simulated LIDAR (Light Detection and Ranging) images in the form of partial point clouds of human poses shapes were created to support the investigation of activity recognition using machine learning techniques. To produce these large sets of point clouds in an efficient and repeatable manner, a virtual laboratory environment was developed in Autodesk 3DS Max, with an animated, biofidelic 3D human mesh biped character (avatar) as the subject. The biped animation modifies the digital human model through a time sequence of motion capture data representing an activity cycle. A point cloud is captured by ray tracing the sensor-facing side of the body model at each time frame. Currently, the entire collection of point clouds consists of 68 human subjects performing five actions — digging, jogging, picking up, throwing, and limping. 15. SUBJECT TERMS Light Detection And Ranging, Simulated LIDAR Image 16. SECURITY CLASSIFICATION OF:
17. LIMITATION OF ABSTRACT
18. NUMBER OF PAGES
19a. NAME OF RESPONSIBLE PERSON Huaining Cheng
a. REPORT U
b. ABSTRACT U
c. THIS PAGE U
SAR
25
19b. TELEPHONE NUMBER (include area code) NA Standard Form 298 (Rev. 8-98)
Prescribed by ANSI Std. 239.18
i

ii
THIS PAGE LEFT BLANK INTENTIONAL.

iii
TABLE OF CONTENTS
Section Page SUMMARY .................................................................................................................................... 1 1.0 INTRODUCTION .............................................................................................................. 2 2.0 METHODS AND PROCEDURES..................................................................................... 5
2.1 Ray Tracing in a Virtual Laboratory ................................................................................ 5 2.2 Subject Meshes and Motion Data..................................................................................... 6 2.3 Shadows v.1.5.2 MAXScript ........................................................................................... 8
3.0 Simulated LIDAR Images................................................................................................. 11 3.1 Full-Scale Simulated Captures from Multiple Viewing Angles .................................... 11 3.2 Vertex Density Variations for SLIs at Smaller Scales ................................................... 13 3.3 Public Available Datasets............................................................................................... 17
4.0 CONCLUSIONS............................................................................................................... 18 5.0 REFERENCES ................................................................................................................. 19 LIST OF ACRONYMS ................................................................................................................ 20
LIST OF FIGURES
Figure 1. Simulated LIDAR Point Clouds ..................................................................................... 3 Figure 2. Generation of Simulated LIDAR Data of Human Actions ............................................ 4 Figure 3. 3DS Max LIDAR Simulation Virtual Laboratory .......................................................... 5 Figure 4. Illustration of the Reference System in the 3DS MAX Virtual Laboratory ................... 6 Figure 5. Subject 3D Mesh ............................................................................................................ 7 Figure 6. Shadows v.1.5.2 User Interface ...................................................................................... 9 Figure 7. Subject at the Beginning of the Digging Activity ........................................................ 11 Figure 8. Image from Figure 7, as viewed from the side ............................................................. 11 Figure 9. 60° Azimuth, 0° Elevation at the Start of the Digging Activity ................................... 12 Figure 10. Resulting SLI from Figure 9 scene ............................................................................. 12 Figure 11. 0° Azimuth and 45° Elevation .................................................................................... 12 Figure 12. SLI of Subject in Figure 11 .................................................................................... 12 Figure 13. Three Poses in a Jogging Activity Cycle .................................................................... 13 Figure 14. SLI at 25% Reduced Vertex Density .......................................................................... 14 Figure 15. The Emitter Scaled for 25% Vertex Density Setup .................................................... 15 Figure 16. Relative Size of Emitter and Target Polygons for 100% Vertex Density .................. 15 Figure 17. Relative Size of Emitter and Target Polygons for 25% Vertex Density .................... 16 Figure 18. Examples of Simulated LIDAR Point Clouds at Reduced Scales .............................. 16 Figure 19. Low-resolution 3D Surface Model Used in Making the Point Clouds in Figure 18 .. 17 Figure 20. Depth Images Corresponding to the Point Clouds in Figure 18 ................................. 17

1 Distribution A: Approved for Public Release 88ABW-2016-0242, 25 January 2016
SUMMARY
Large sets of 3D Simulated LIDAR (Light Detection and Ranging) Images (SLI) in the form of partial point clouds of human poses during typical activities were created to support the investigation of activity recognition using machine learning techniques. To produce these large sets of point clouds in an efficient and repeatable manner, a virtual laboratory environment was developed in Autodesk 3DS Max, with an animated, biofidelic 3D human mesh biped character (avatar) as the subject. The biped animation modifies the digital human model through a time sequence of motion capture data representing an activity cycle. A point cloud is captured by ray tracing the sensor-facing side of the model at each time frame. Currently, the entire collection of point clouds consists of 68 human subjects performing five actions — digging, jogging, picking up, throwing, and limping. It can be requested from the Human Signature Branch, Human Centered ISR Division, Human Effectiveness Directorate, 711th Human Performance Wing at the Wright-Patterson AFB.
Mr. Isiah Davenport from Infoscitex Corp developed the method for creating the biofidelic avatars from laboratory data and 3DS Max code for generating simulated LIDAR images. Mr. Max Grattan and Mrs. Jeanne Smith from Infoscitex Corp. were responsible for generating the avatars and LIDAR images, respectively.

2 Distribution A: Approved for Public Release 88ABW-2016-0242, 25 January 2016
1.0 INTRODUCTION
LIDAR is a partial 3D standoff sensing method that illuminates a target with rotatory or flash laser beams, analyzes the reflected lights, and provides both the distance to the target’s surface and the target’s surface shape. An array of laser reflections can be used to map the facing-side surface of a target object as a partial point cloud. Unlike a 360° surface model generated by a traditional full body scanner, the partial point cloud from a LIDAR is a viewing angle dependent 3D representation of the target shape. The resolution of these maps depends on the density of the laser detector array; a good image of a human may require hundreds of detection pixels to capture enough detail to clearly detect changes in limb positions.
A LIDAR sensor capturing a series of human body poses over a period of time can provide clues as to the observed subject’s intent based on his/her activities. Human observers can often easily identify specific activities and sometimes make a reasonable guess regarding the subject’s intentions. However, computers do not as quickly nor as easily achieve the same results. Automated human activity recognition typically requires development of complex machine learning algorithms whose performance depends on the size and representativeness of available training datasets. A large 3D shape database of human pose images with multiple human subjects and viewing angles would help greatly in the development of activity recognition software. With the release of low-cost range cameras such as Kinect (Microsoft), new datasets in the form of 3D depth images were generated for the purpose of human action analysis and recognition. Some examples of public available ones are MSR action 3D [1] and MSR daily activity [2], LIRIS human activity [3], and UT Kinect action [4], etc. These depth images were acquired in much closer ranges (< 4m) than the typical operational range of low-grade commercial LIDARs (80~100m). Their resolutions are also higher than the ones offered by typical LIDARs. Therefore, they are not a close representative of LIDAR imagery. More importantly, they have a small pool of subjects around 10 and a few viewing angles, which result in limited variations on individual anthropometry, action style, and viewing angle.
Recording a large number of LIDAR images of various human activities with actual research subjects would be unnecessarily difficult and time-consuming. While subjects could certainly be recorded performing activities of interest in a laboratory setting, the variety of angles from which they would have to be recorded would require a large amount of time spent recreating and recapturing said activities, unless one deploys a LIDAR sensor at every viewing angle. However, multiple LIDARs not only are expensive to acquire but also can cause interference among each other. In addition to being time-consuming, working with live subjects carries the risk that subjects would not be able to replicate their poses consistently over numerous trials. Alternatively, if previously captured 3D body scan and motion capture data were available to recreate a human subject’s pose and activity for evaluation within a virtual LIDAR research environment, these limitations associated with live subject LIDAR research could be avoided, while preserving the authenticity of the poses and activities being studied.
A study completed in the AFRL 711 HPW/RHXB’s 3D Human Signatures Laboratory (3DHSL) facility recorded the needed sets of scan and motion capture data. A virtual laboratory was created in 3DS Max software (Autodesk, San Rafael, CA) wherein a 3D digital model of a human subject, animated based on his/her motion capture data, was introduced for synthetic LIDAR image generation. Since the original human subject’s shape and motion were both
3 Distribution A: Approved for Public Release 88ABW-2016-0242, 25 January 2016
captured in the 3D digital model, the virtual model can easily be rotated in increments through 360° to capture the simulated LIDAR images corresponding to different viewing angles. A software script called Shadows (version 1.5.2) developed under this effort automates the process so that after a brief setup, the computer runs the image data collection largely unattended. This is more efficient and repeatable than using a live human subject throughout the data collection. Moreover, if there are any errors in the data collection, it can be regenerated easily. The main mechanism of generating the simulated LIDAR image is based on the orthographic ray tracing which traces a ray along the path defined by a mesh vertex normal and stores an array comprising of the locations where (i.e., upon which polygon) the simulated ray “hits” the human model’s outer surface mesh. In this dataset, the resolution of the simulated LIDAR images is roughly 100-by-100 pixels, which is in the range of typical commercial flash LIDAR [5].
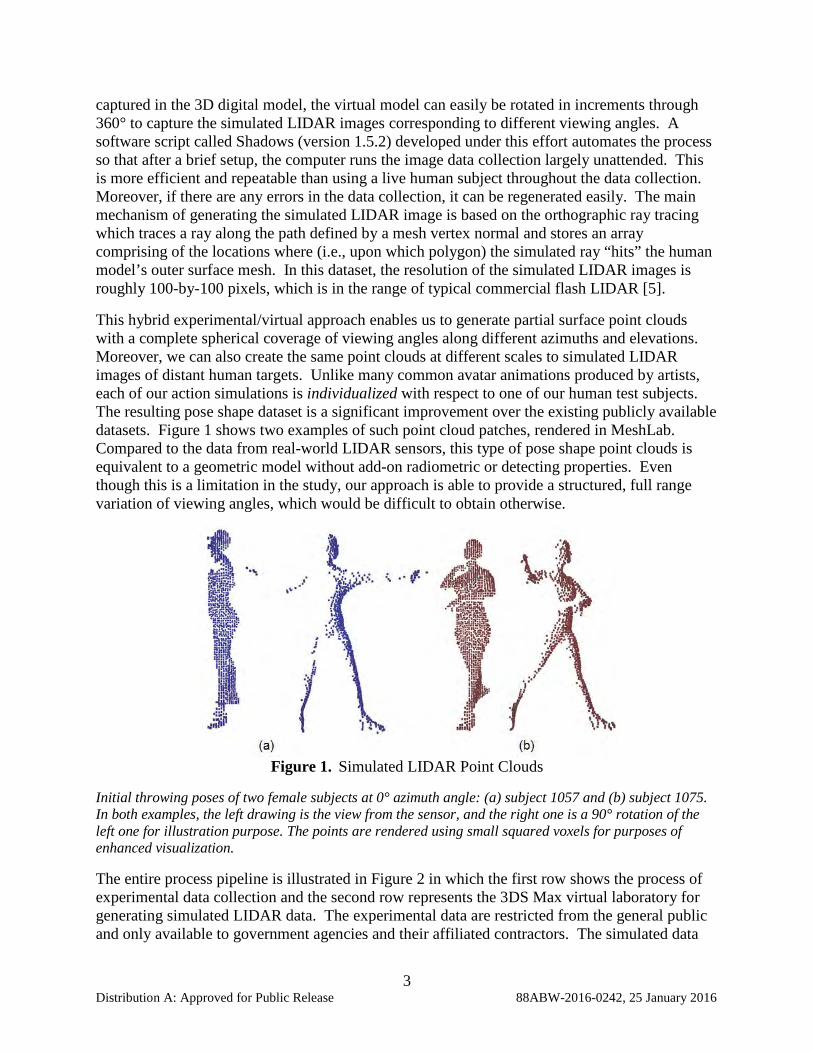
This hybrid experimental/virtual approach enables us to generate partial surface point clouds with a complete spherical coverage of viewing angles along different azimuths and elevations. Moreover, we can also create the same point clouds at different scales to simulated LIDAR images of distant human targets. Unlike many common avatar animations produced by artists, each of our action simulations is individualized with respect to one of our human test subjects. The resulting pose shape dataset is a significant improvement over the existing publicly available datasets. Figure 1 shows two examples of such point cloud patches, rendered in MeshLab. Compared to the data from real-world LIDAR sensors, this type of pose shape point clouds is equivalent to a geometric model without add-on radiometric or detecting properties. Even though this is a limitation in the study, our approach is able to provide a structured, full range variation of viewing angles, which would be difficult to obtain otherwise.
Figure 1. Simulated LIDAR Point Clouds
Initial throwing poses of two female subjects at 0° azimuth angle: (a) subject 1057 and (b) subject 1075. In both examples, the left drawing is the view from the sensor, and the right one is a 90° rotation of the left one for illustration purpose. The points are rendered using small squared voxels for purposes of enhanced visualization.
The entire process pipeline is illustrated in Figure 2 in which the first row shows the process of experimental data collection and the second row represents the 3DS Max virtual laboratory for generating simulated LIDAR data. The experimental data are restricted from the general public and only available to government agencies and their affiliated contractors. The simulated data

4 Distribution A: Approved for Public Release 88ABW-2016-0242, 25 January 2016
generated from 3DS Max virtual laboratory, which are not individually identifiable, are open for public research uses.
Figure 2. Generation of Simulated LIDAR Data of Human Actions

5 Distribution A: Approved for Public Release 88ABW-2016-0242, 25 January 2016
2.0 METHODS AND PROCEDURES
2.1 Ray Tracing in a Virtual Laboratory In this study, simulated LIDAR images are generated in a virtual laboratory space shown in Figure 3 for 68 subject scans, through the aforementioned Shadows script, with subject-matched animation files created from motion capture data of the subject. The virtual laboratory is a scene created and operated in 3DS Max. In this virtual laboratory, the target (a human subject's 3D scan mesh) is placed in the center of the virtual space. A simulated emitter, representing a LIDAR camera array, traces laser-like, straight-line rays toward the 3D mesh target. If an emitter ray (which is projected from a vertex of the emitter) intersects a given polygon on the mesh, that polygon's identifying number is recorded. These polygons are then used to create a 3D image of the viewable parts of the body in that particular pose and viewing angle. The virtual laboratory allows the subject's pose to be stepped through the frames of an activity (a sequence of usually 20 - 80 frames at 30 frames per second). The subject mesh is also rotated 360° around (azimuth) so that the image is obtained from all viewing angles of interest. Also, the body can be imaged at 0° elevation or at a 45° elevation to the LIDAR emitter, as illustrated in Figure 4. In practice, rather than elevating the emitter by 45°, the subject is rotated downward by 45° for the same effect for easier scripting in 3DS Max.
Figure 3. 3DS Max LIDAR Simulation Virtual Laboratory
The subject mesh is posed at the start of a digging activity. The Shadows MAXScript user interface can be seen in the upper left corner.

6 Distribution A: Approved for Public Release 88ABW-2016-0242, 25 January 2016
Figure 4. Illustration of the Reference System in the 3DS MAX Virtual Laboratory
Because the subject's pose is saved and re-played from an animation file, the process is repeatable. The animation is created from motion capture data of the same subject. When the above setup is complete and saved for a particular subject and activity, running Shadows v1.5.2 automatically creates the simulated LIDAR image files for each frame of the activity and each viewing angle, specified through their corresponding range filters displayed on the Shadow’s GUI (Graphical User Interface). A quick switch of elevation angle runs the same set of frames and azimuth angles. The Shadow’s automation features, including a file naming scheme, make the task of generating a large data set quick and robust.
Before running Shadow for ray tracing, the subject mesh needs to be positioned in the virtual laboratory space such that it is standing on the blue floor or slightly below, in order to keep all body parts in view of the emitter. The torso is centered in a green box throughout the cycle of the activity. The yellow tick-marked ring around the floor, with a pointer, indicates the azimuth angle of rotation for the subject. At 0°, the subject is facing the red emitter panel. All of the positioning tools, the ring, floor, and green box, are invisible to the emitter. The subject is linked to the green box so that when the box is rotated, the entire body rotates with it, for both azimuth and elevation rotations, and the body pose does not change.
The emitter is a square mesh of 100x100 quad polygons. For the 100% vertex density SLIs, it is scaled to measure a little more than the maximum height of a tall subject.
2.2 Subject Meshes and Motion Data Sixty-eight human subjects whose data were used for SLI generation were scanned and motions captured in the AFRL 711th HPW/RHXB 3DHSL facility. The raw data collection process consists of two parts – whole-body scans and optical marker-based motion capture. A 3dMD (Atlanta, GA) whole body scanner photometric system with nine camera pods is used to capture the subject’s shape in a standing pose. Each pod is comprised of two black and white cameras, one color camera, and one (or two) speckle pattern projectors. The data from each individual

7 Distribution A: Approved for Public Release 88ABW-2016-0242, 25 January 2016
pod is used to generate one continuous 3D point cloud which is then merged with the data from the other camera pods to create a textured high resolution 3D whole-body image. The subjects wear tight-fitting, stretchy clothing for a true body shape during scanning. Although the 3DHSL scanner records color images, the color information in the scans is not needed for this study. The pose shown in Figure 5 allows scan’s lighting to reach all parts of the body reasonably well, eliminating holes in the mesh as much as possible. A "T" pose with arms outstretched would seem to be better, but in fact raises the shoulder upper surfaces, and also may not include the hands of long-armed persons due to scan space limitations. Scan files are cleaned up in Polyworks (InnovMetric Software, Quebec, Canada), primarily to fill holes in the resulting body scan mesh. In 3DS Max, a rigged body template model is “skin-wrapped” to the shape of the scans. The model uses quad polygons wherever possible, and smaller polygons in areas that need to deform for joint motion, while keeping each subject's mesh at a consistent 56,064 polygons for almost all subjects used (a few early scans have 58,688 polygons).
The three-dimensional mocap data are gathered using a passive-optical motion capture system, which tracks a set of 68 retro-reflective markers affixed to a tight-fitting garment worn by the volunteer, based on a modified Helen Hayes type marker set. Marker trajectories are captured during the subject’s activity trials using 18 Motion Analysis Raptor-E cameras (Motion Analysis Corp., Santa Rosa, CA). The motion capture volume is approximately 20 feet long, 15 feet wide, and eight feet high.
Figure 5. Subject 3D Mesh

8 Distribution A: Approved for Public Release 88ABW-2016-0242, 25 January 2016
Displayed using Meshlab software (from meshlab.sourceforge.net). The orientation "ball" seen is part of the Meshlab display.
Subjects perform specified actions within the capture volume. The actions included in the mocap collection are:
a) Digging
b) Picking up and putting down an object
c) Throwing
d) Limping with weighted ankle brace
e) Running
The weighted ankle brace (five-percent body weight) is worn during the limping trials to elicit a uniform (across subjects) gait asymmetry that mimics a limping locomotion pattern.
The main mocap output files are TRC files, which are outputted directly from the Motion Analysis Cortex software. They correspond to the aforementioned actions and contain time histories of the XYZ positions for all markers over the duration of a mocap trial. These files have been cleaned up to fix any missing or bad marker data.
Some of the markers placed on the subject during a motion capture session correspond to the anthropometric landmarks during the scanning session. This means that the scan landmarks are in the same positions as the mocap markers. Software was written to automatically find the centroids of the anthropometric landmarks so that a skeleton can be derived from them. For the benefit of avatar creation, the skeleton derived in this way tends to be more accurate than the one from the mocap markers because the landmarks stay close to the surface. It is also pre-aligned with the scan automatically. The joint angles computed from the regular mocap files are placed together with their corresponding skeleton to form the BVH file (Biovision Hierarchical Data) that drives the avatar’s motion.
2.3 Shadows v.1.5.2 MAXScript MAXScript is the built-in scripting language for 3DS Max. The Shadows v.1.5.2 MAXScript is a compilation of several subtasks that were scripted, including the creation of a graphical user interface, shown in Figure 6. The Shadows script is run after the user completes four steps:
• Load the 3DS Max file containing the virtual laboratory scene;
• Load the subject body mesh and biped;
• Load the activity animation to the biped; and
• Position the subject properly in the scene for the cycle of animation frames.

9 Distribution A: Approved for Public Release 88ABW-2016-0242, 25 January 2016
Figure 6. Shadows v.1.5.2 User Interface
The Shadows script allows the selection of the emitter object and selection of the body mesh object ("Target"), the range and increment of frame numbers, and the range and increment of azimuth angles. Radio buttons allow selection of the elevation angle. There are several choices of output files, and a “Files” button to enter the output file name (some parts of the file name string are automatic to encode frame parameters, and some are user input). A “Start” button can be clicked when all choices have been made.
To create the simulated LIDAR image, the emitter array sequentially sends out a "ray" from each of its vertices, in a direction that is the average of the normals of the surrounding faces. Because the emitter mesh is a flat surface, these rays are all essentially perpendicular to the entire emitter surface. The viewport used is an orthographic projection so that there are no perspective considerations. If an emitted ray intersects or "hits" the face of a polygon of the target body, the index number of the target mesh polygon whose center is nearest to the ray intersection is recorded and added to a numerical array of polygon faces that have been "hit." The original target mesh for each frame is the full 3D body mesh, in a particular pose. In order to export an object that is just the subset of faces that have been hit, the faces of the target that have not been hit (the "shadow" polygons) are subtracted from the original target mesh using an inverse face selection, and the remaining faces become the object file that is exported as the SLI. In the case of a target pose where some body parts occlude other parts of the body, for instance an arm in front of the torso, there will be a hole in the image, or an image object file could include noncontiguous polygons.
Because of curved shape of human body, quadrilaterals in a body mesh model are not uniformly sized. The above ray tracing method may cause uneven spacing or missing of some points in the

10 Distribution A: Approved for Public Release 88ABW-2016-0242, 25 January 2016
point cloud. This actually is not a bad problem because real-world LIDAR data often do miss some points due to different material reflectivity and interference from the atmosphere. A uniform mesh size could have been achieved if a very refined mesh model was used. However, that would incur a significant and unnecessary computing cost.
11 Distribution A: Approved for Public Release 88ABW-2016-0242, 25 January 2016
3.0 SIMULATED LIDAR IMAGES
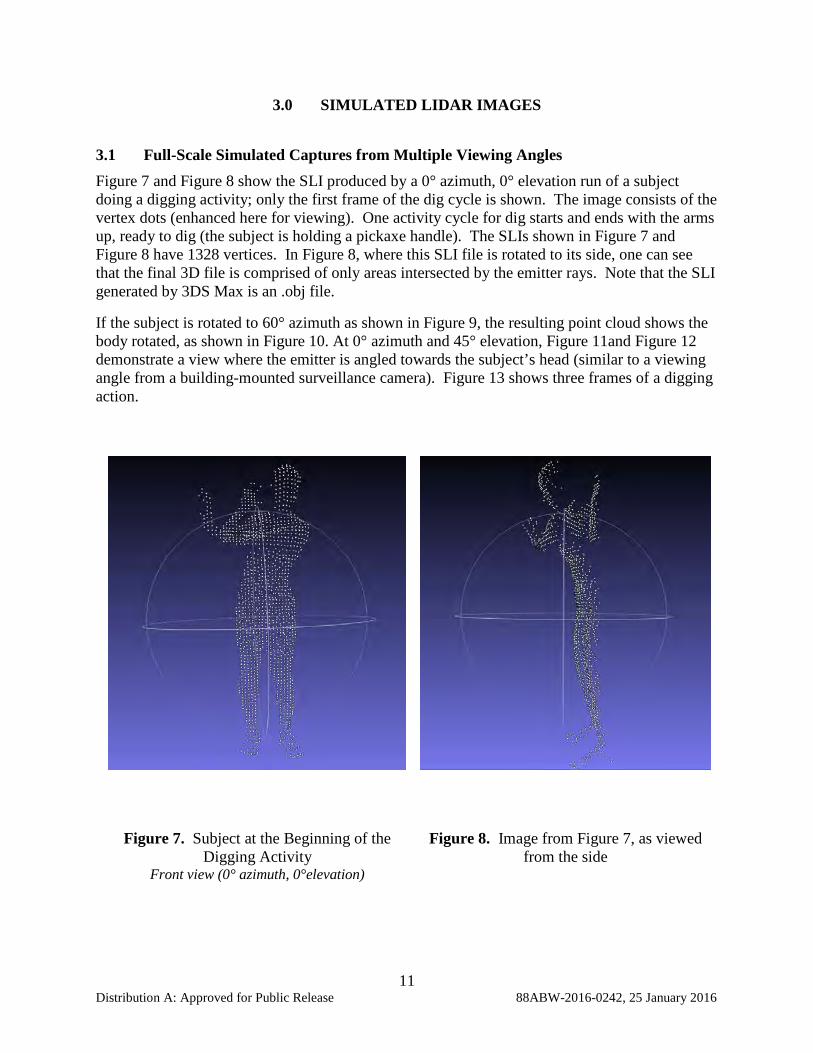
3.1 Full-Scale Simulated Captures from Multiple Viewing Angles Figure 7 and Figure 8 show the SLI produced by a 0° azimuth, 0° elevation run of a subject doing a digging activity; only the first frame of the dig cycle is shown. The image consists of the vertex dots (enhanced here for viewing). One activity cycle for dig starts and ends with the arms up, ready to dig (the subject is holding a pickaxe handle). The SLIs shown in Figure 7 and Figure 8 have 1328 vertices. In Figure 8, where this SLI file is rotated to its side, one can see that the final 3D file is comprised of only areas intersected by the emitter rays. Note that the SLI generated by 3DS Max is an .obj file.
If the subject is rotated to 60° azimuth as shown in Figure 9, the resulting point cloud shows the body rotated, as shown in Figure 10. At 0° azimuth and 45° elevation, Figure 11and Figure 12 demonstrate a view where the emitter is angled towards the subject’s head (similar to a viewing angle from a building-mounted surveillance camera). Figure 13 shows three frames of a digging action.
Figure 7. Subject at the Beginning of the Digging Activity
Front view (0° azimuth, 0°elevation)
Figure 8. Image from Figure 7, as viewed from the side

12 Distribution A: Approved for Public Release 88ABW-2016-0242, 25 January 2016
Figure 9. 60° Azimuth, 0° Elevation at the Start of the Digging Activity
Figure 10. Resulting SLI from Figure 9 scene
Figure 11. 0° Azimuth and 45° Elevation
The subject is rotated instead of the emitter.
Figure 12. SLI of Subject in Figure 11

13 Distribution A: Approved for Public Release 88ABW-2016-0242, 25 January 2016
Figure 13. Three Poses in a Jogging Activity Cycle
The top row shows the animated mesh model in 3DS Max. The bottom row shows the matching simulated LIDAR images.
3.2 Vertex Density Variations for SLIs at Smaller Scales Figure 7 through Figure 13 are all produced with the full 100% vertex density. To produce SLIs at reduced scales of 75%, 50%, 25%, and 6% of the full scale size (area), a two-step process is employed, ray-tracing at a reduced vertex density followed by decreasing point spacing proportionally. When the reduced vertex density is created, the image is similar to Figure 7, but with the vertices spaced farther apart, as shown in Figure 14. To do this, the emitter mesh is scaled up, effectively reducing the number of polygons needed to cover the view of the body. Vertex count information is available when the SLI is opened in Meshlab.
Figure 15 shows the view of a 25% vertex density setup, where the emitter is enlarged by doubling the height and width of the full-scale emitter shown in Figure 3. Figure 16 shows a close-up front view of the emitter mesh (white) in front of the body mesh (red) at the 100% vertex density. While the emitter polygons are somewhat bigger, they retain the same order of magnitude as the body polygons at the torso. In Figure 17, at 25% vertex density, the emitter polygons are much larger than the body polygons. Thus, the spacing of the emitter rays at the vertices will be larger, and not as many body polygons will be hit; some will be skipped,

14 Distribution A: Approved for Public Release 88ABW-2016-0242, 25 January 2016
reducing the vertex count of the SLI. Such SLI data will allow a study of whether vertex density and overall capture scale are factors in pose and action recognition.
Figure 14. SLI at 25% Reduced Vertex Density
This SLI has 339 vertices, versus 1,328 for 100% in Figure 7.

15 Distribution A: Approved for Public Release 88ABW-2016-0242, 25 January 2016
Figure 15. The Emitter Scaled for 25% Vertex Density Setup
Note the emitter is much larger than the subject height.
Figure 16. Relative Size of Emitter and Target Polygons for 100% Vertex Density
The white emitter mesh polygons are slightly larger than the body polygons in the torso region.
16 Distribution A: Approved for Public Release 88ABW-2016-0242, 25 January 2016
Figure 17. Relative Size of Emitter and Target Polygons for 25% Vertex Density
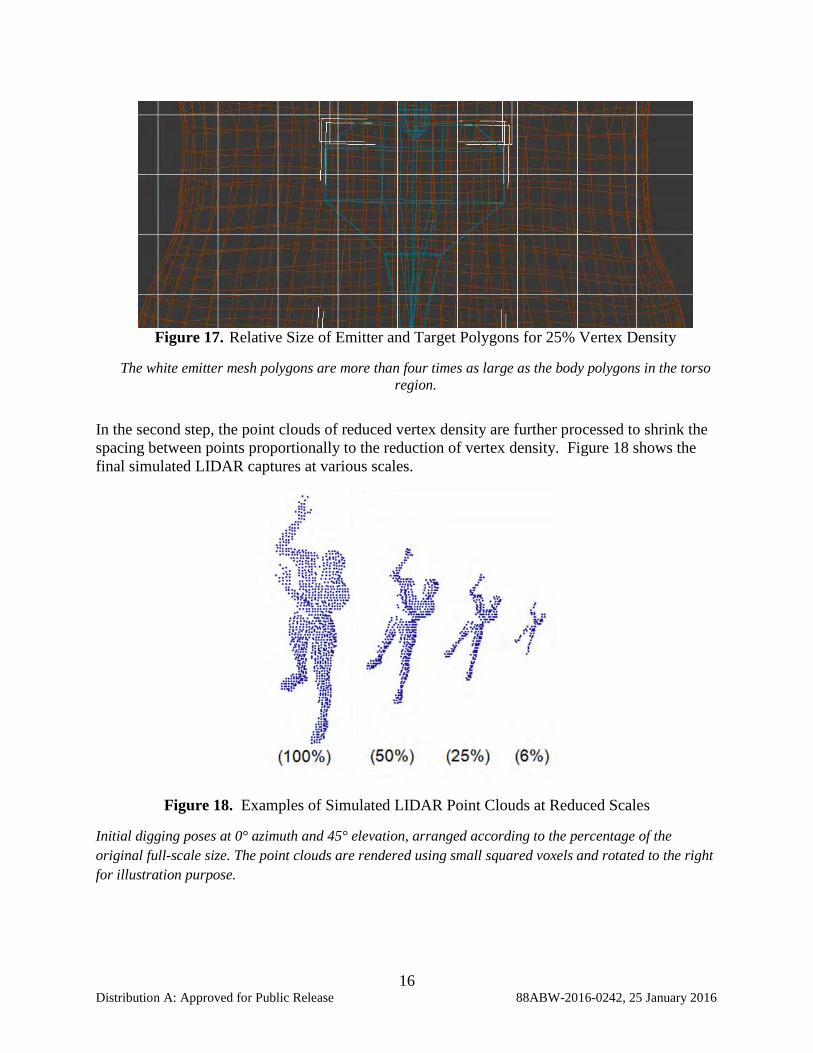
The white emitter mesh polygons are more than four times as large as the body polygons in the torso region.
In the second step, the point clouds of reduced vertex density are further processed to shrink the spacing between points proportionally to the reduction of vertex density. Figure 18 shows the final simulated LIDAR captures at various scales.
Figure 18. Examples of Simulated LIDAR Point Clouds at Reduced Scales
Initial digging poses at 0° azimuth and 45° elevation, arranged according to the percentage of the original full-scale size. The point clouds are rendered using small squared voxels and rotated to the right for illustration purpose.

17 Distribution A: Approved for Public Release 88ABW-2016-0242, 25 January 2016
3.3 Public Available Datasets The datasets produced from this effort consist of:
1. Biofidelic animated mesh models of 68 subjects performing five actions — digging, jogging, picking up, throwing, and limping, saved in 3DS MAX’s .max format.
2. Individual frames (.obj files) of low-resolution 3D surface models, output from the 68-subject, five-action animations at a frame rate of 15 Hz. They are used for LIDAR ray tracing at various viewing angles and scales. Figure 19 shows the 3D surface model that is used in generating the simulated LIDAR point clouds in Figure 18.
3. Two subsets of simulated LIDAR point clouds (e.g., Figure 18) and corresponding depth images (e.g. Figure 20) for elevation angles 0° and 45°, respectively.
Each subset has full-scale captures of 68 subjects and reduced-scale captures of 16 subjects, at evenly-spaced 30° of azimuth angle between 0 and 330°. The point clouds are saved as .obj files and the corresponding depth images are saved as JPEG images. Overall, there are more than 50,000 point clouds and corresponding depth images in each subset.
Upon request, the datasets 2 and 3, together with their anthropometric measurements, can be released to individual organizations for research use after signing a data use agreement with the Human Signatures Branch, Human Centered ISR Division, Human Effectiveness Directorate, 711th Human Performance Wing at the Wright-Patterson AFB. All other data and programs, such as but not limited to, scans, motion captures, animation models, and Shadows MAXScript, are only available to U.S. government agencies and their affiliated contractors.
Figure 19. Low-resolution 3D Surface Model Used in Making the Point Clouds in Figure 18
Figure 20. Depth Images Corresponding to the Point Clouds in Figure 18

18 Distribution A: Approved for Public Release 88ABW-2016-0242, 25 January 2016
4.0 CONCLUSIONS
3DS Max and its scripting language MAXScript can be used to create a virtual laboratory for generating biofidelic data of human pose imagery. Using 3D scans of the human shapes to create mesh models, followed by animating the models with motion capture data, could yield consistent and repeatable digital human avatars. Coupled with an automatic orthogonal ray-tracing script, the virtual laboratory allows simulating LIDAR point clouds of human actions quickly and consistently for different viewing angles and scales, as well as for a large number of subjects. The simulated data can then be used in research on human pose shape retrieval and action recognition from single-view 3D point clouds.

19 Distribution A: Approved for Public Release 88ABW-2016-0242, 25 January 2016
5.0 REFERENCES [1] W. Li, Z. Zhang, and Z. Liu, “Action Recognition Based on A Bag of 3D Points,” in
Computer Vision and Pattern Recognition Workshop, IEEE Computer Society Conference, 2010, pp. 9-14
[2] J. Wang, Z. Liu, Y. Wu, and J. Yuan, “Learning Actionlet Ensemble for 3D Human Action Recognition,” IEEE Trans. on Pattern Analysis and Machine Intelligence, 36(5), 2014, pp. 914-927
[3] C. Wolf, J. Mille, E. Lombardi, O. Celiktutan, M. B. Jiu, E. Dellandrea, C.E., Bichot, C. Garcia, and B. Sankur, “The LIRIS Human Activities Dataset and the ICPR 2012 Human Activities Recognition and Localization Competition,” Technical Report RR-LIRIS-2012-004, LIRIS Laboratory, University Claude Bernard Lyon 1, France
[4] L. Xia, C.C. Chen, and J. Aggarwal, “View Invariant Human Action Recognition Using Histograms of 3D Joints,” in Workshop of IEEE Conference on Computer Vision and Pattern Recognition, 2012, pp. 20–27
[5] http://www.advancedscientificconcepts.com/index.html

20 Distribution A: Approved for Public Release 88ABW-2016-0242, 25 January 2016
LIST OF ACRONYMS 2.5D 2.5 Dimensional 3D 3 Dimensional 3DHSL 3 Dimensional Human Signatures Laboratory 711 HPW 711th Human Performance Wing 711 HPW/RHXB 711th Human Performance Wing, Human-Centered ISR
Division, Human Signatures Branch AF Air Force AFB Air Force Base AFRL Air Force Research Laboratories DoD Department of Defense DTIC Defense Technical Information Center LIDAR Light Detection And Ranging SLI Simulated LIDAR Image v. version WPAFB Wright-Patterson AFB