Embed Size (px)
Citation preview
LSEE Papers on Decentralisation and Regional Policy
DECENTRALISATION AND INTER-MUNICIPAL
COMPETITION:
EVIDENCE FROM SERBIA
VASSILIS MONASTIRIOTIS
Research Paper Number 1, July 2011
The Joint LSEE-Ifri Research Programme on South Eastern
Europe was made possible by generous support from the John
S. Latsis Public Benefit Foundation
The LSEE Papers on Decentralisation and Regional Policy are part of the Joint LSEE-
Ifri Research Programme on South Eastern Europe, funded by the John S. Latsis
Public Benefit Foundation. The principle aim of the Programme was to develop high-
quality research across a number of academic disciplines resulting in original and
meaningful contributions to current policy debates. The Programme structure was
designed to foster the development of cooperative networks, both between the
participating institutions and with institutions and individuals in the region, serving
to build up relevant research capacities and educational capital. The focus of the
LSEE in-house projects was on processes of decentralisation and accompanying
developments in regional policy across the region. The LSEE Papers on
Decentralisation and Regional Policy seeks to disseminate the results of the LSEE
internal research projects to an audience encompassing those directly involved in
policy and planning in the region, scholars working on topics related to
decentralisation and others with an interest in South Eastern Europe.
Disclaimer: The views expressed in this paper are those of the author and do not necessarily reflect the views of LSEE – Research on South Eastern Europe or the London School of Economics and Political Science. By making reference to the name or territory of a geographical area, neither LSEE nor the London School of Economics and Political Science intend to make any judgements or lend any credence to the legal status or name of any territory or state. ©2011 The Authors July 2011
Decentralisation and Inter-Municipal Competition in SEE: evidence
from Serbia
Vassilis Monastiriotis*
Abstract
A process of administrative and fiscal decentralisation has been followed in virtually
all Southeast European countries since their transition from communism. In Serbia
this process, as with the process of transition itself, took off with some notable delay;
but it has progressed rather fast since. Decentralisation is said to serve a multitude of
objectives, from enhancing democratic representation and empowering local
constituencies to raising the growth potential nationally and attaining higher levels of
economic efficiency in the delivery of public policies. Economic efficiency outcomes
in particular are largely believed to operate through a process of enhanced inter-
municipal competition, whereby fiscally- and administratively-empowered local
authorities respond to developments in neighbouring jurisdictions in a way that seeks
to maximise the utility of their residents and the tax-revenues that the latter
generate. In this paper we examine the extent to which the process of
decentralisation in Serbia can be linked to enhanced inter-municipal competition, in
the form of rising interdependence in municipal spending, through the application of
spatial econometric techniques on data covering the period 1999-2008. We find
some limited evidence of increasing spatial interdependence in municipal
expenditures, which however is only partly consistent with the view of
decentralisation as an efficiency-enhancing process. We discuss possible explanations
for this, including the limited timeframe of our analysis and, perhaps more
importantly, limitations of the very process of decentralisation itself as well as
behavioural constraints that may not allow the mechanics of competition to operate
fully.
* European Institute, London School of Economics (email: [email protected]). This
paper has been written with financial support by the John S. Latsis Foundation, under a
research programme on ‘Decentralisation and Regional Policy in SEE’ at the LSE Research
unit on Southeast Europe (LSEE). I have benefited from useful comments and discussions
with Will Bartlett, research assistance by Maja Savic and help with data collection by Sanja
Avlijas. The usual disclaimer applies.
4
Over the last two decades the idea of municipal decentralisation has gained notable
prominence and is now well embedded in a variety of policy processes, both at the
national and supra-national levels (Rodríguez-Pose and Sandall 2008). Within
Europe, two are the main policy processes that express this most emphatically. On
the one hand, the EU’s process of multi-level governance (Leygues, 2001), aiming at
a more democratic and less hierarchical governance structure of EU policies and
institutions, thus seeking to empower local actors, including public administrations.
On the other, the Council of Europe’s Charter of Local Self-Government (CoE, 1985),
which has established “the right and the ability of local authorities, within the limits
of the law, to regulate and manage a substantial share of public affairs under their
own responsibility and in the interests of the local population” as a fundamental
European principle. This has represented a significant shift of political and economic
arguments in favour of decentralisation from a predominantly cultural / identity
basis to justifications on the basis of economic efficiency and quality of governance.
This shift has represented two ‘innovations’ in the literature of decentralisation.
First, the mainstreaming of the original ideas proposed in the public finance
literature (Musgrave, 1959; Oates, 1972) with an increasing attention to economic-
behavioural factors, such as local differences in preferences, information
asymmetries, monitoring costs, inverse incentives, etc (Besley and Case, 1995;
Aghion and Tirole, 1997; Oates, 1999; Brueckner, 2006). Second, an increasing
attention in both academia and policy on more socio-political factors, such as issues
of legitimacy, accountability and democratic representation (Burns et al, 1994; IIDEA,
2000; UN, 2000).
In the context of Southeast Europe (SEE), and of the Western Balkans in particular,
the calls for decentralisation have had an additional weight and justification. In the
early 1990s, as the countries were in their early stages of transition from
communism, administrative decentralisation in the form of local self-governance
(but with limited powers) prevailed as an efficient vehicle for democratisation and
especially for disbanding the powers of the central government that had for decades
remained highly concentrated and hierarchical (Brusis, 2002). In some cases,
5
instituting local self-governance at the very decentralised level also acted as a
vehicle for diluting real or potential secessionist pressures at wider geographical
scales. More recently, embedded in the process of pre-accession to the EU, the
decentralisation process has taken additionally a ‘Europeanisation’ dimension, in the
sense of a perceived link between legislatively enhancing local self-governance and
(being seen to be) addressing state-wide problems of corruption, administrative
efficiency and democratic representation (UNDP, 2009).
Despite such developments, the decentralisation process in Southeast Europe has
been rather limited, in both its extent and its scope. Until very recently,
administrative decentralisation has not been accompanied by similar moves in the
budgetary field (fiscal decentralisation), resulting in a rather superficial process of
de-concentration, whereby central governments transfer cumbersome
responsibilities to local authorities but without similar transfers of political authority
and financial resources (Konjhodzic and Suman, 2009; Avlijas and Bartlett, 2011). In
this sense, it is highly questionable whether processes of decentralisation in SEE
have in fact contributed to the attainment of the economic and political goals that
decentralisation is generally associated with (economic efficiency and democratic
representation). But there is an additional reason for this. In the public economics
literature, the benefits of decentralisation are materialised mainly through
increasing inter-municipal competition (Besley and Case, 1995; Revelli, 2002 and
2006; Brueckner, 2003; Sole-Olle, 2005; Stastna, 2009). The logic here is that with
decentralisation local authorities start competing for businesses and residents and
are thus forced to develop policies, and achieve combinations of taxes and
expenditures, that maximise the total income produced in their jurisdiction. This
clearly requires substantial degrees of mobility (of people and businesses) as well as
a ‘depoliticised’ polity, whereby citizens’ electoral behaviour is driven mainly by self-
interest and less so by party-political and ideological affiliations. It also requires
administrations that possess the capacity to compete (or simply to deliver local
public goods) and a relative absence of collective (supra-municipal) public goods
(Bardhan, 2002). Given the state of economic, infrastructural and administrative
development in the region, it is doubtful that any of these conditions could be said
6
to apply in the context of SEE. By implication, in this context, questions about the
efficacy of the process of decentralisation are intensified by questions about the
applicability and relevance of the very process itself.
In this paper we look at the case of Serbia, as an illustrative example of
developments in the field of decentralisation in the region, and seek to analyse the
extent to which the process of decentralisation has, or may in the future,
contributed to strengthening economic efficiency in the country. To examine this, we
rely on indirect evidence, as measuring (changes in) economic efficiency at the local
level is significantly obscured by lack of suitable data and by the fact that a variety of
other factors, that we cannot control for, may be influencing efficiency
simultaneously. Our approach is to examine the efficiency of municipal spending by
relying on estimates of the determinants of public expenditure at the municipal level
– and of its composition. Among other possible determinants, we examine the
influence exerted by spending in neighbouring municipalities: to the extent that
inter-municipal competition is present, local outcomes ought to be influenced by
neighbouring ones and evidence of spatial interdependence to be detectable. We
examine how the link between local outcomes and determinants (including external
influences) has shifted over time, as the country engaged increasingly in municipal
decentralisation. If this process has contributed significantly to enhancing efficiency,
we should find an intensifying link, over time, between local characteristics and
volume of local expenditures; as well as between the latter and expenditures in
neighbouring municipalities.
In the next section we briefly review the process of decentralisation and the
changing competencies of the municipal authorities in Serbia. Section 3 discusses the
theory and empirics of inter-municipal competition. Section 4 presents the data and
discusses the spatial and temporal patterns of municipal expenditures observed. The
results of the empirical analysis are presented, and their implications discussed, in
section 5; while section 6 summarises and places the results to their wider SEE
context.
7
Decentralisation in Serbia
Unlike other former communist countries, the states of former Yugoslavia had a
relatively decentralised administrative structure, including a significant degree of
local self-government, albeit within a framework of central-party control (Bartlett,
1985). Typically, municipal authorities had the ability to raise own revenues through
taxing commercial property at rates that could be determined locally. In return, they
were responsible for the provision of a number of local services (sewage, cleaning,
street lighting, etc), while they were also involved in the management of the
provision of social services (education, health, etc) (Levitas, 2005). Following the
dissolution of Yugoslavia, developments in government became more disparate and
were heavily influenced by the ethnic conflicts that ensued and the political situation
emerging in each of the successor states.
In Serbia, the immediate effect of the break up of the former Yugoslavia was a move
towards centralisation, with the consolidation of central-state power and the
stripping of municipalities of their tax-raising and social-provision responsibilities. It
was only in 2002, with the Law on Local Government that the process of
administrative decentralisation took any notable pace and form. Nevertheless, small
steps towards introducing aspects of local self-governance and fiscal responsibility
came much earlier, in 1994, with the Law on Financing Municipalities and Cities
(Stipanovic, 2009). Under this system, municipal budgets had two elements: one
financed through the central government from tax revenues generated locally and
one financed directly from municipal own revenues. Central government transfers
were based on a combination of fixed-share allocations, whereby each municipality
retained a fixed proportion of the tax revenues generated in its jurisdiction (the so-
called “unlimited shared revenues”), and municipality-specific allocations, which
were of course “limited” (i.e., not proportional to local tax revenues) and decided
centrally on an annual basis. Own revenues, the so-called “original revenues”, were
based on locally-determined fees, mainly on businesses. Interestingly, municipalities
had some discretion over determining the size of these fees but much less discretion
over the use of the revenues generated – as, often, these were earmarked
8
specifically for spending in the area in which the revenues were generated (Levitas,
2005).
Owing to intensifying problems with financing of local services, but mainly because
of the democratisation process that followed the fall of Milosevic in late 2000, an
important reform of the system of local governance and financing took place in
2001. The Laws on Public Revenues and Expenditures and on Local Government
altered significantly the structure of fiscal governance – although the changes they
introduced with regard to administrative aspects were much more modest. Both
provided municipalities with more discretion over their expenditures and a higher
allocation of funds, especially from own revenues, while adding little, if anything, in
terms of the tasks and responsibilities assigned to them. The new legislation raised
the share of local authorities in a number of tax categories1 and allowed them to
introduce new taxes on a number of other areas (most importantly, a payroll tax of
up to 3.5%), almost doubling their budget allocations in real terms in the space of
two-to-three years (Stipanovic, 2009). However, while the financing of local
authorities in this period can be considered fair in a vertical sense (i.e., in terms of
the share of national GDP directed to municipal authorities, relative to the amount
and type of tasks the latter were required to deliver), the weakening of the
discretionary and redistributive elements in the system (grant funds and other direct
transfers) led to rising disparities in the fiscal position of different municipalities
across the country (Levitas, 2005).
This system of local self-governance and financing was significantly modified in 2007
with the Local Self Government Finance Law, following the tax reforms of 2004-2005
which replaced the sales tax with VAT and reformed drastically wage and payroll
taxation (with the elimination of the local component of the payroll tax). The new
system maintained the ‘own’ and ‘shared’ revenues categories, but it increased the
underlying municipal shares and gave more powers to local authorities concerning
tax collection, thus resolving some important incentives problems that were built-in
1 Especially for property tax, the share retained by local authorities was increased from 25%
to 100%.
9
to the previous system (Avlijas and Bartlett, 2011). Further, the new system
introduced a more elaborate set of transfers, which for a first time included also
transfers earmarked for the financing of future competencies delegated to the local
level and of specific infrastructural and other projects (Stepanovic, 2009). The
system of non-earmarked transfers also became more elaborate and more targeted,
with an ‘equalisation transfers’ component, proportional to any potential shortfall in
locally-generated shared-tax revenues (leaving the own-revenues component
unaffected so as to avoid inverse incentives problems), a ‘general transfers’
component calculated on the basis of objective features of each municipality
(population, number of pupils, etc) and various compensation-based components
aiming at addressing temporary needs (transitional fund) or allocative imbalances
(reallocation fund). The new system also allows municipalities to borrow directly
from the markets by issuing debt for investment purposes. More importantly, the
new system transfers to local authorities administrative and fiscal (on the
expenditures side) responsibility in a number of areas, including primary health care,
pre-school education, selected aspects of primary and secondary education
(excluding payroll and curriculum issues), and the delivery of key social services such
as for children, the elderly and people with disabilities (but excluding cash transfers
and social assistance) (World Bank, 2008; Avlijas and Bartlett, 2011). The new system
has been further iterated with legislative changes in 2008/09, although the main
ingredients of the system remain unchanged.
With the recent changes in the system of local-governance and financing, Serbia has
in some respects completed a full circle: from the relative autonomy of the 1980s to
the recentralisation of the early 1990s, the limited financing of the late 1990s, the
reconstitution of financing in the early 2000s, and finally the reconstitution (and
modernisation) of important aspects of administrative and fiscal responsibilities after
2007. Still, as with other SEE countries, fiscal and administrative decentralisation is at
its early stages, with elements of genuine delegation (which includes discretion over
policies) still mixed with elements of pure de-concentration (where policy tasks and
objectives are defined centrally) – and very few signs of a devolution proper.
10
Nevertheless, these changes are sufficient to motivate – and allow – an examination
of the impact of decentralisation on municipal efficiency, as is discussed next.
Decentralisation and inter-municipal competition
In the literature of fiscal federalism decentralisation is seen as a factor enhancing
economic efficiency, for a variety of reasons. These include allowing local
administrations to cater for a more homogenous set of preferences, overcoming
transaction costs and information asymmetries, and resolving monitoring cost
problems and problems of incentives. Above all, however, decentralisation is
believed to increase efficiency by transferring responsibility and accountability to the
local level, thus on the one hand enabling local administrations to devise and
implement efficiency-enhancing policies and on the other hand incentivising them to
do so – by exposing them to relevant pressures and penalties.
Central in this incentives mechanism is the idea of inter-municipal competition.
Simple delegation of policy responsibilities to the local level, while undoubtedly
contributing to resolving information asymmetries and monitoring problems, is not
by itself sufficient to incentivise efficiency improvements by the local
administrations. In a closed system, even if inefficient administrations can be
penalised by their electorate, the absence of a reference point with which to
compare efficient outcomes (benchmarking) and the inability to exert influence on
policy outcomes through ‘exit’ could allow inefficiencies to persist. It follows that it is
the interaction (strategic or otherwise) of municipalities that creates the incentives
and informational flows that can allow efficiency gains to occur at the local level that
could not be attained in a centralised system.
Following this logic, an important test for the relevance and success of
decentralisation as an efficiency-enhancing process is the extent to which it
generates inter-municipal competition. The literature of public finance and fiscal
federalism has long recognised this and empirical studies examining the extent of tax
competition in federal systems have flourished (Brueckner and Saavedra, 2001;
Buettner, 2001; Revelli, 2001; Bordignon et al, 2003; Solé-Ollé, 2003; Hauptmeier et
11
al, 2009). More recently, this literature has extended this type of analysis to less
decentralised systems, where fiscal competencies remain centralised but discretion
over public expenditures, both in terms of their composition and their volume, are
delegated to lower tiers of government (Lundberg, 2001; Revelli, 2002; Sole-Olle,
2005; Brock et al, 2006; Foucault et al, 2008; Stastna, 2009).
Empirically, evidence of inter-municipal competition in public expenditures is
examined by testing the extent to which expenditures are spatially correlated, i.e.,
by testing the similarity of expenditures across neighbouring municipalities. A
municipality offering higher expenditures in any particular expenditure category of
public provision will be able to attract more businesses and residents for whom the
provision of the corresponding public good influences significantly their utility or
profitability. As a consequence, neighbouring municipalities will be under pressure to
increase their spending accordingly, so as to retain their revenue-generating
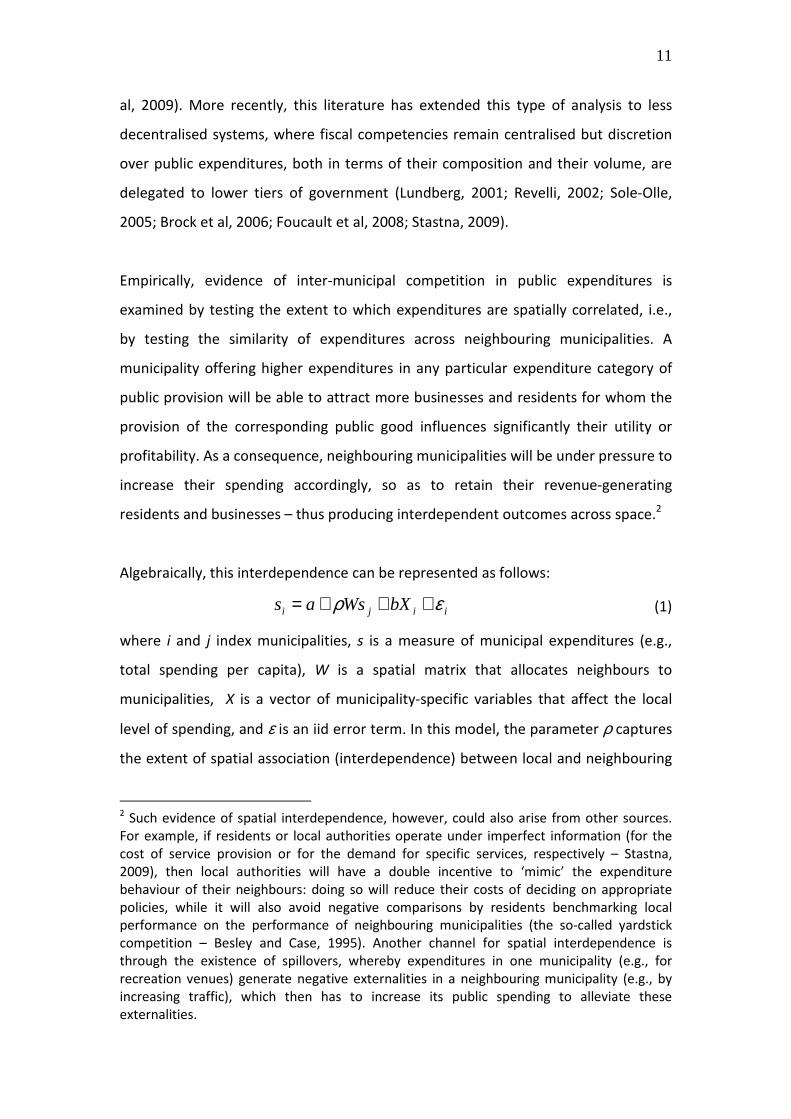
residents and businesses – thus producing interdependent outcomes across space.2
Algebraically, this interdependence can be represented as follows:
iiji bXWsas ερ +++= (1)
where i and j index municipalities, s is a measure of municipal expenditures (e.g.,
total spending per capita), W is a spatial matrix that allocates neighbours to
municipalities, X is a vector of municipality-specific variables that affect the local
level of spending, and ε is an iid error term. In this model, the parameter ρ captures
the extent of spatial association (interdependence) between local and neighbouring
2 Such evidence of spatial interdependence, however, could also arise from other sources.
For example, if residents or local authorities operate under imperfect information (for the
cost of service provision or for the demand for specific services, respectively – Stastna,
2009), then local authorities will have a double incentive to ‘mimic’ the expenditure
behaviour of their neighbours: doing so will reduce their costs of deciding on appropriate
policies, while it will also avoid negative comparisons by residents benchmarking local
performance on the performance of neighbouring municipalities (the so-called yardstick
competition – Besley and Case, 1995). Another channel for spatial interdependence is
through the existence of spillovers, whereby expenditures in one municipality (e.g., for
recreation venues) generate negative externalities in a neighbouring municipality (e.g., by
increasing traffic), which then has to increase its public spending to alleviate these
externalities.
12
outcomes. Positive estimates of ρ can be interpreted as evidence for spatial
competition or for mimicking; negative estimates would instead signal the presence
of a positive spillover effect, which allows local authorities to free-ride in the
provision of services.3
Relating this model to our earlier discussion about the process of decentralisation
and the prevailing system of local self-governance in Serbia, we can devise the
following hypotheses. First, the volume of municipal expenditures should depend on
a number of fixed area characteristics relating to the size and level of development
of each municipality. This is because, as we saw earlier, throughout the period under
consideration the allocation of resources at the municipal level follows objective
criteria such as the population of each area and the demand for specific services
(schools, old-age people, etc). Second, controlling for area characteristics, spatial
interdependence should be minimal in early periods and should increase significantly
after the 2004-05 and 2007 reforms, which provided municipalities with the
resources and incentives to engage in competition and optimisation strategies. Third,
for similar reasons, the influence of objective characteristics relative to that of more
contextual factors (e.g., political variables) should decline over time – as
decentralisation-empowered municipal authorities can adjust more effectively their
levels of spending to their own socio-political preferences and the preferences of
their residents. In what follows, we examine these hypotheses, as well as a number
of other arising issues, through both exploratory and econometric analysis, covering
the period 1999-2008.
Municipal expenditures in Serbia: data and descriptives
In our empirical investigation we use data on total municipal spending as well as
spending on social services (health, education, culture, etc) deriving from the
Municipalities Yearbook of Serbia. From the same source we have derived data on a
3 A negative effect could also be consistent with a ‘specialisation’ hypothesis whereby, due
to the presumed existence of positive spillovers, neighbouring administrations engage in
resource-sharing. In the context of our analysis (which focuses on aggregate measures of
expenditures) and given the limited degree of inter-municipal cooperation in the country
(Avlijas and Bartlett, 2011) this is a highly unlikely possibility.
13
number of complementary variables, as described in Table 1. We restrict our analysis
to 145 municipal and urban areas for which data are consistently available
throughout the period by aggregating the values for the municipalities of Belgrade,
Nis and Novi Sad to the city level and excluding municipalities located in areas which
seceded in following years (Montenegro and Kosovo). Our data cover four periods
that correspond to different phases in the development of the decentralisation
process in the country: 1999 (the centralisation phase), 2002 (the re-financing
phase), 2005 (the early decentralisation phase) and 2008 (the phase of greater fiscal
autonomy).
Table 1. Variables considered in the analysis
Variable Description Municipal spending Total municipal expenditures per resident Social spending Municipal per capita spending on health, education & social care Social share Share of social to total spending Population Number of residents in municipality (in logs) Density Residents per km2 (numbers) Care for poor Share of people in poverty under social protection Care for elderly Share of elderly receiving social care Inactivity Inactivity rate (share of inactive to working-age population) Youth Share of residents under the age of 24 Retirees Share of residents over 65 Road density Length of asphalt roads (Km) divided by total area (km2) Schools density Number of school classes per resident Universities Number of university schools in municipality Service orientation Ratio of service-sector over manufacturing wages Transfers Share of government transfers to total municipal revenues Debt burden Share of loan repayments to total municipal spending Right-wing Share of council seats controlled by right and centre-right parties4 Majority Single-party majority in local council Fragmentation Herfindahl index: sum of squares of party shares Strongest Share of seats controlled by the biggest party
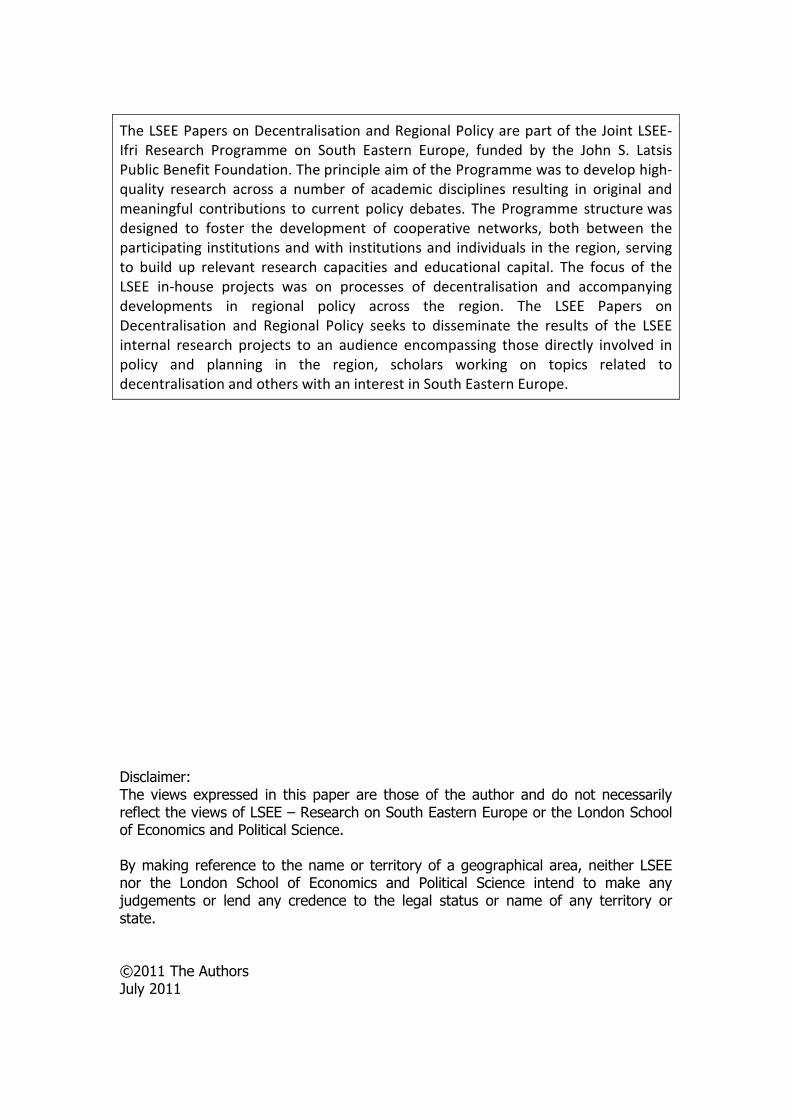
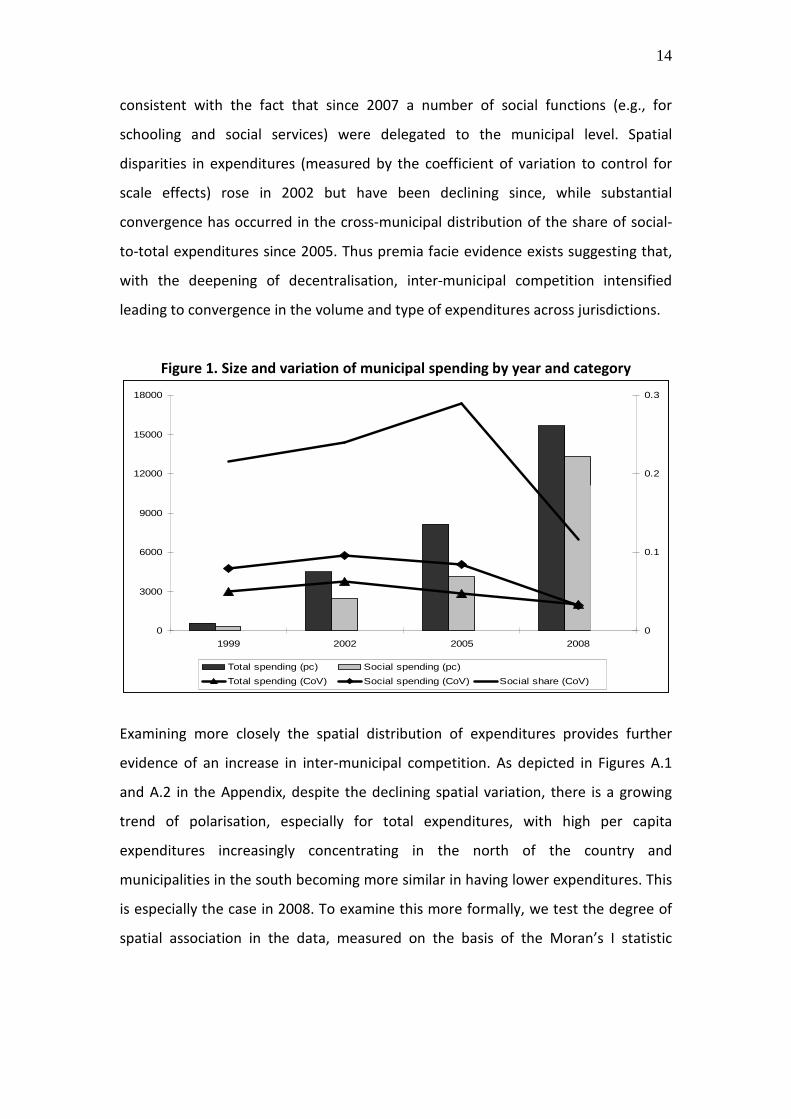
A first approach to examining municipal spending is by considering its size,
geographical distribution and temporal evolution. As depicted in Figure 1, per capita
expenditures have increased substantially in nominal terms (partly owing to
inflation), reaching a value of just over 15,000 dinars per inhabitant in 2008
(unweighted municipal average). The share of spending in the social category had
followed a slightly declining trend until 2005, but it increased substantially in 2008 –
4 These include the Serbian Radical Party, the Serbian Democratic Party, the Political
Movement "Power of Serbia", the G-17 plus, the Serbian Renewal Movement and ‘New
Serbia’.
14
consistent with the fact that since 2007 a number of social functions (e.g., for
schooling and social services) were delegated to the municipal level. Spatial
disparities in expenditures (measured by the coefficient of variation to control for
scale effects) rose in 2002 but have been declining since, while substantial
convergence has occurred in the cross-municipal distribution of the share of social-
to-total expenditures since 2005. Thus premia facie evidence exists suggesting that,
with the deepening of decentralisation, inter-municipal competition intensified
leading to convergence in the volume and type of expenditures across jurisdictions.
Figure 1. Size and variation of municipal spending by year and category
0
3000
6000
9000
12000
15000
18000
1999 2002 2005 2008
0
0.1
0.2
0.3
Total spending (pc) Social spending (pc)
Total spending (CoV) Social spending (CoV) Social share (CoV)
Examining more closely the spatial distribution of expenditures provides further
evidence of an increase in inter-municipal competition. As depicted in Figures A.1
and A.2 in the Appendix, despite the declining spatial variation, there is a growing
trend of polarisation, especially for total expenditures, with high per capita
expenditures increasingly concentrating in the north of the country and
municipalities in the south becoming more similar in having lower expenditures. This
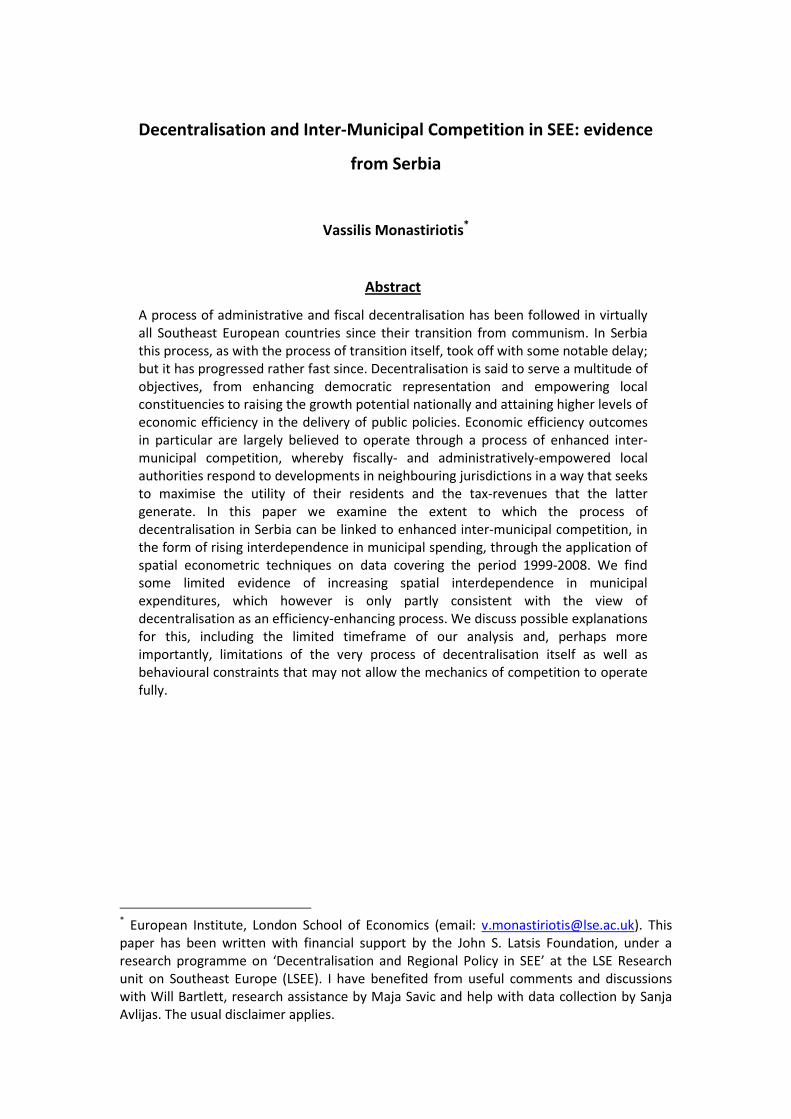
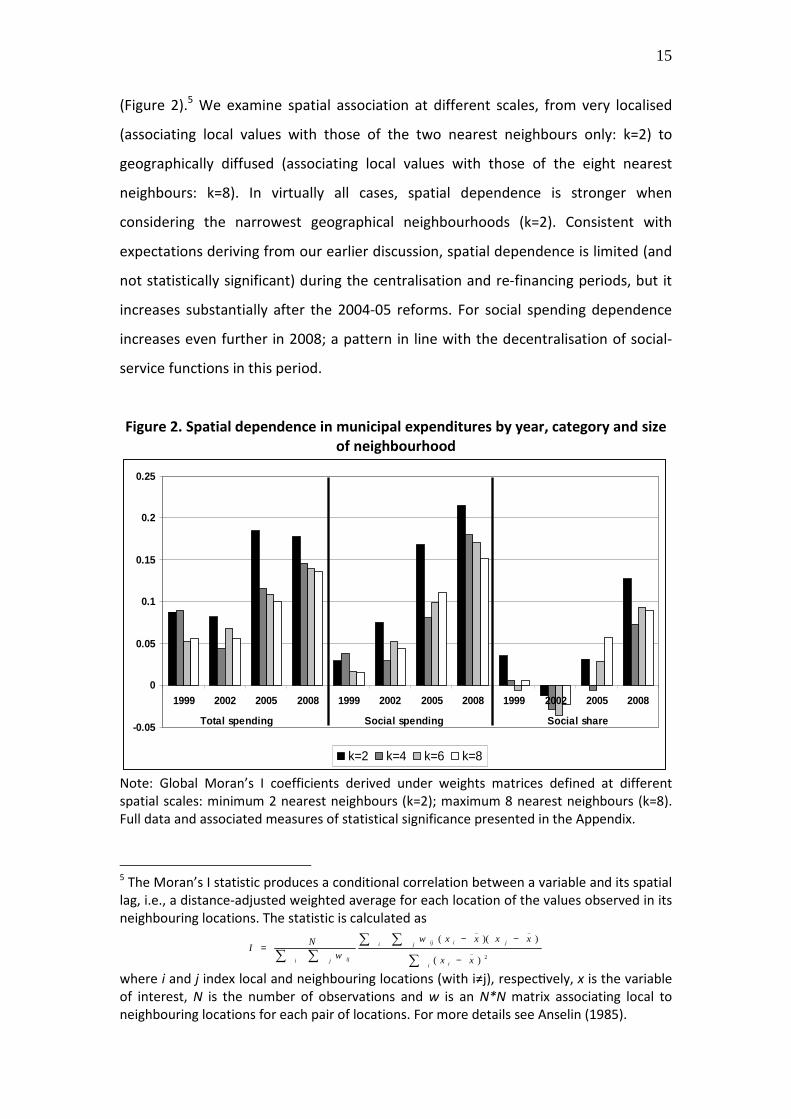
is especially the case in 2008. To examine this more formally, we test the degree of
spatial association in the data, measured on the basis of the Moran’s I statistic
15
(Figure 2).5 We examine spatial association at different scales, from very localised
(associating local values with those of the two nearest neighbours only: k=2) to
geographically diffused (associating local values with those of the eight nearest
neighbours: k=8). In virtually all cases, spatial dependence is stronger when
considering the narrowest geographical neighbourhoods (k=2). Consistent with
expectations deriving from our earlier discussion, spatial dependence is limited (and
not statistically significant) during the centralisation and re-financing periods, but it
increases substantially after the 2004-05 reforms. For social spending dependence
increases even further in 2008; a pattern in line with the decentralisation of social-
service functions in this period.
Figure 2. Spatial dependence in municipal expenditures by year, category and size
of neighbourhood
-0.05
0
0.05
0.1
0.15
0.2
0.25
1999 2002 2005 2008 1999 2002 2005 2008 1999 2002 2005 2008
k=2 k=4 k=6 k=8
Total spending Social spending Social share
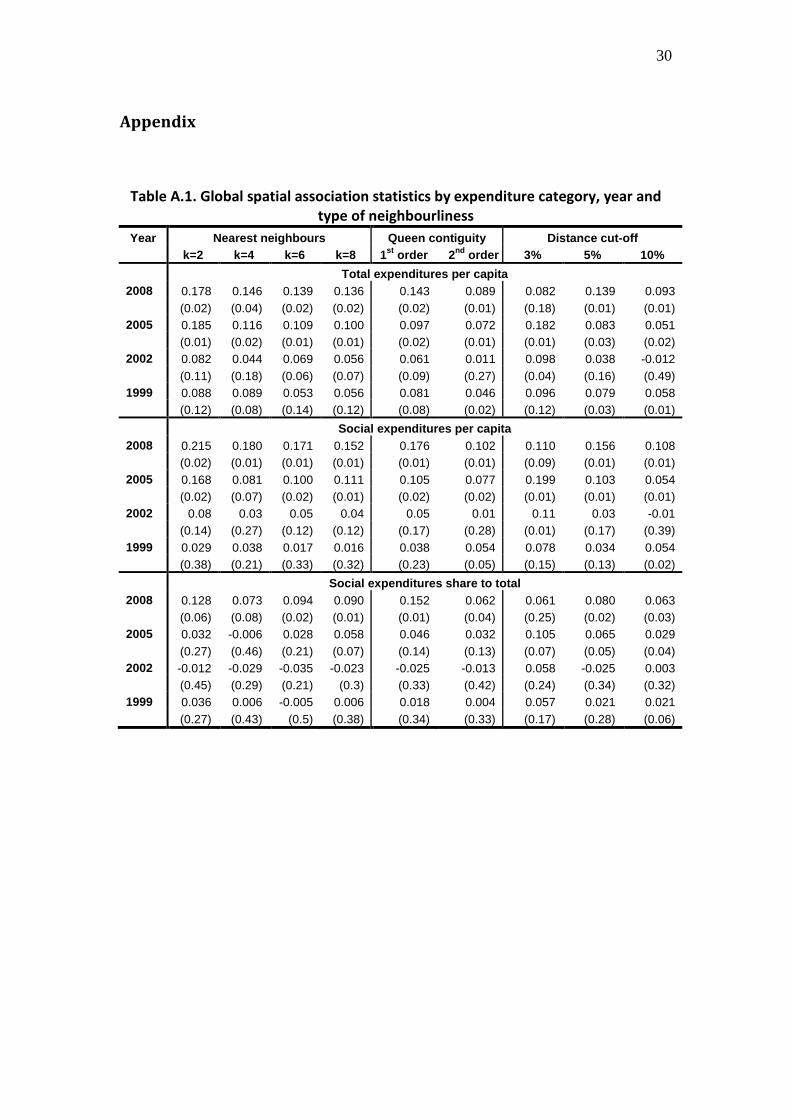
Note: Global Moran’s I coefficients derived under weights matrices defined at different
spatial scales: minimum 2 nearest neighbours (k=2); maximum 8 nearest neighbours (k=8).
Full data and associated measures of statistical significance presented in the Appendix.
5 The Moran’s I statistic produces a conditional correlation between a variable and its spatial
lag, i.e., a distance-adjusted weighted average for each location of the values observed in its
neighbouring locations. The statistic is calculated as
∑
∑∑
∑∑ −
−−=
i i
jij iji
j iji xx
xxxxw
w
NI
2_
__
)(
))((
where i and j index local and neighbouring locations (with i≠j), respecRvely, x is the variable
of interest, N is the number of observations and w is an N*N matrix associating local to
neighbouring locations for each pair of locations. For more details see Anselin (1985).
16
Despite this supportive evidence, however, the overall strength of spatial
dependence does not appear particularly high. Even in 2008, levels of municipal
spending in Serbia are rather poorly correlated across space (the Moran’s I value
never exceeds 0.22 even at the most localised level). We can look closer at the
reasons for this by examining the geographical incidence of spatial dependence, with
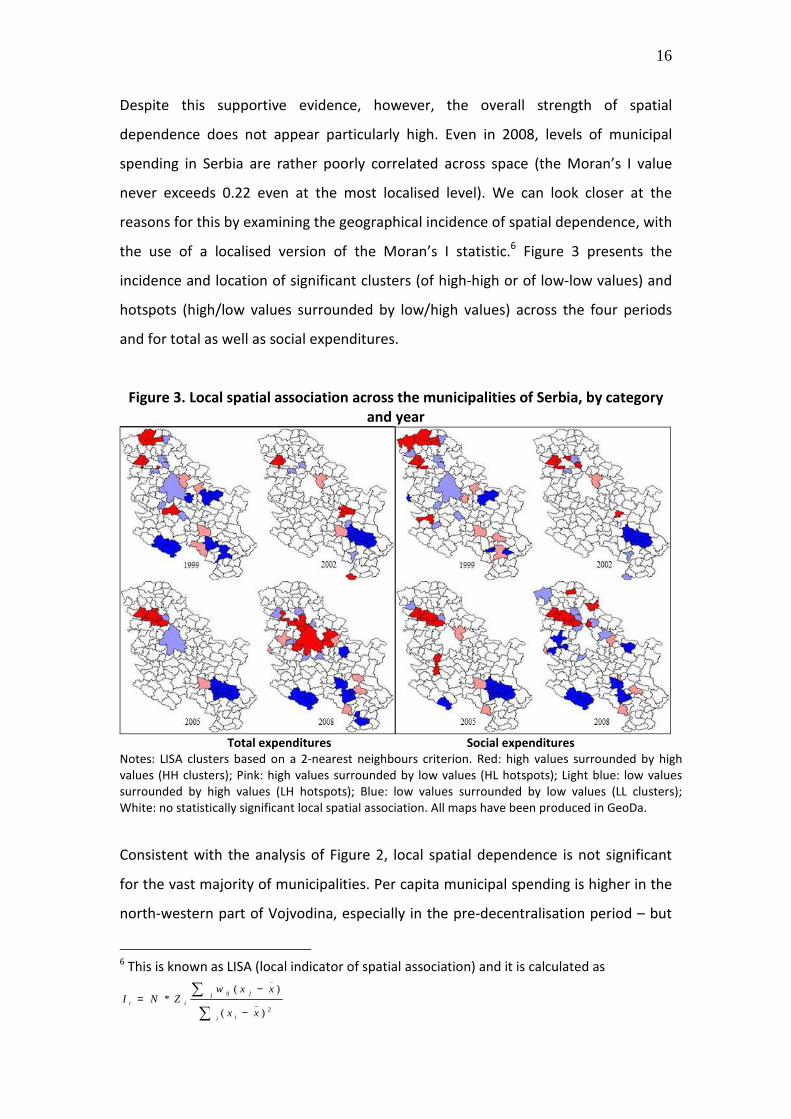
the use of a localised version of the Moran’s I statistic.6 Figure 3 presents the
incidence and location of significant clusters (of high-high or of low-low values) and
hotspots (high/low values surrounded by low/high values) across the four periods
and for total as well as social expenditures.
Figure 3. Local spatial association across the municipalities of Serbia, by category
and year
Total expenditures Social expenditures
Notes: LISA clusters based on a 2-nearest neighbours criterion. Red: high values surrounded by high
values (HH clusters); Pink: high values surrounded by low values (HL hotspots); Light blue: low values
surrounded by high values (LH hotspots); Blue: low values surrounded by low values (LL clusters);
White: no statistically significant local spatial association. All maps have been produced in GeoDa.
Consistent with the analysis of Figure 2, local spatial dependence is not significant
for the vast majority of municipalities. Per capita municipal spending is higher in the
north-western part of Vojvodina, especially in the pre-decentralisation period – but
6 This is known as LISA (local indicator of spatial association) and it is calculated as
∑
∑
−
−=
i i
jj ij
ii
xx
xxwZNI
2_
_
)(
)(*
17
this suggests perhaps more a needs-based allocation (especially for social
expenditures) than any evidence of municipal interdependence as such. Similarly, a
cluster of low expenditures is found in the south-west of the country, which appears
to be stronger in the intermediate periods but to have weakened notably in 2008.
Given this trend, it is also difficult to attribute this cluster to some underlying form of
municipal competition / interdependence. Perhaps the only significant development
in 2008, which can be attributed to some inter-municipal dynamic, is the formation
of a significant cluster for high expenditures (total and social) around Novi Sad
which, for total expenditures, extends clearly to the area in and around Belgrade.
Irrespective of this, however, the number of areas for which local spatial association
is significant increases substantially between 2005 and 2008, suggesting that
decentralisation may have played a role in this (consistent also with the evidence
provided in Figure 2). We thus turn to the econometric investigation to examine
more formally the evidence for intensifying municipal competition /
interdependence as the decentralisation process evolved over time.
Local and spatial determinants of municipal spending: regression
analysis
In this section we employ regression analysis to estimate the contribution of various
social, economic and political variables on the size and distribution of municipal
expenditures in each of the four periods considered in our analysis. We also examine
formally the municipal competition hypothesis, by introducing a spatial lag of the
expenditure variable in our model and assessing its contribution to explaining local
levels of municipal spending. Our strategy is to start with a simple (non-spatial)
model which accounts for the local determinants of municipal spending and
examine, through this, the presence of spatial influences in the determination of
municipal expenditures. Then, we perform a number of spatial regressions to
estimate the direct effect of neighbouring expenditures on local levels of spending.
Local determinants
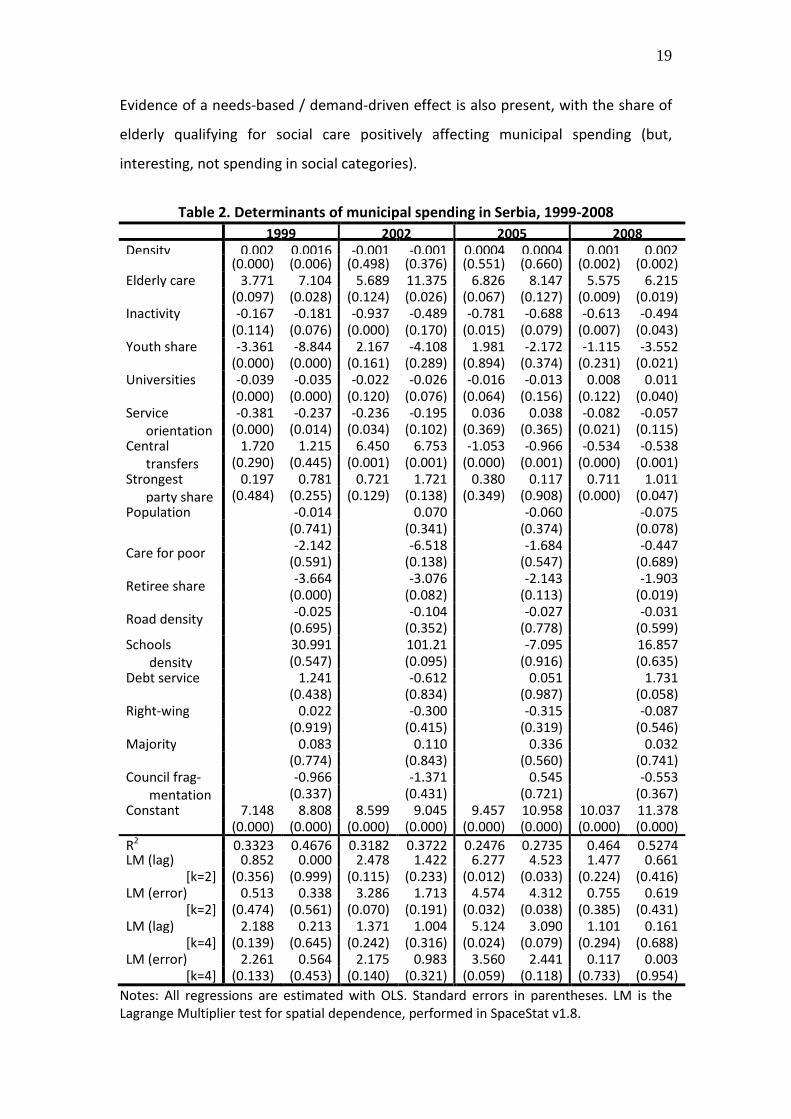
Table 2 presents a set of regressions for the total volume of municipal spending in
per capita terms. For each year we report two sets of results: a ‘parsimonious’
18
model, specified on the basis of a stepwise regression analysis (with backward
deletion), which includes all variables that are significant at the 1% level in at least
one of the years; and an ‘extended’ model, which includes a full list of demographic,
economic, social and political variables. The performance of the two models is
broadly speaking consistent for each of the years, suggesting that our estimates are
generally not affected significantly by multi-collinearity. With few exceptions
(density, transfers), the results are also broadly consistent across years – although,
as expected, the exact magnitude and significance of each of the regressors changes
notably over time.
A number of interesting findings are worth discussing. First, the size of the
municipalities (in population terms) does not seem to have played an important role
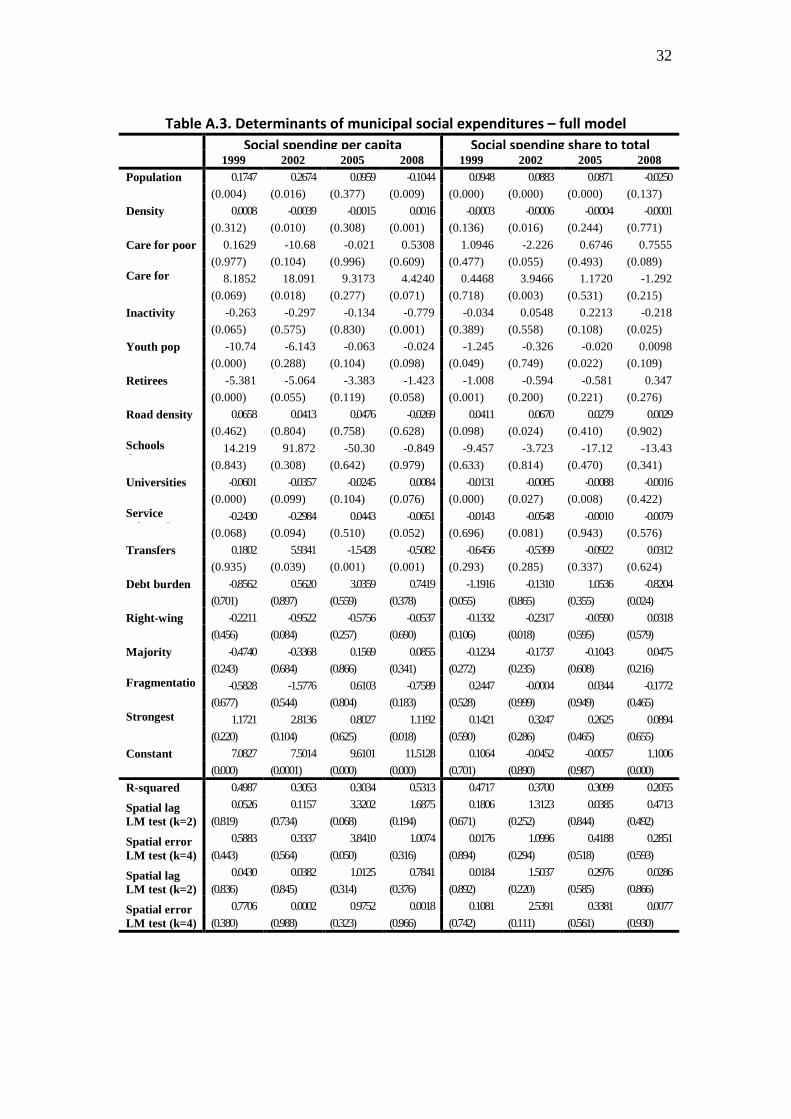
on municipal spending. This is also true in the case of social expenditures (Table A.3).
By implication, there seems to be very little in terms of a ‘market size’ or an
‘economies of scale’ effect (whereby larger municipalities can afford savings in the
delivery of local public goods, thus being able to reduce their per capita
expenditures). In contrast, population density returns a very strong effect,
statistically, in 1999 and 2008 but not in the intermediate years. The 1999 finding is
consistent with the view that during the period of limited resourcing, allocations
from the central government were favouring disproportionately the more urban
areas. For 2008, however, the result suggests rather a specific role for
decentralisation – as, presumably, more urban/agglomerated areas have been able
to increase disproportionately the amount of resources allocated to both total and
social expenditures (see also Table A.2). The influence of resource constraints is
captured perhaps by the shares of youth (below 24 years of age) and retirees (over
65), both of which return negative and mostly significant coefficients (except for
2005). Similarly, inactivity also produces a negative effect for both total and social
spending, consistently across the years – and perhaps increasingly so (in terms of
statistical significance) with decentralisation. Interestingly, in 1999 and 2008
inactivity was associated with lower levels of social expenditures more so than for
total spending (see the right-hand panel of Table A.2).
19
Evidence of a needs-based / demand-driven effect is also present, with the share of
elderly qualifying for social care positively affecting municipal spending (but,
interesting, not spending in social categories).
Table 2. Determinants of municipal spending in Serbia, 1999-2008
1999 2002 2005 2008
Density 0.002 0.0016 -0.001 -0.001 0.0004 0.0004 0.001 0.002 (0.000) (0.006) (0.498) (0.376) (0.551) (0.660) (0.002) (0.002)
Elderly care 3.771 7.104 5.689 11.375 6.826 8.147 5.575 6.215
(0.097) (0.028) (0.124) (0.026) (0.067) (0.127) (0.009) (0.019)
Inactivity -0.167 -0.181 -0.937 -0.489 -0.781 -0.688 -0.613 -0.494
(0.114) (0.076) (0.000) (0.170) (0.015) (0.079) (0.007) (0.043)
Youth share -3.361 -8.844 2.167 -4.108 1.981 -2.172 -1.115 -3.552
(0.000) (0.000) (0.161) (0.289) (0.894) (0.374) (0.231) (0.021)
Universities -0.039 -0.035 -0.022 -0.026 -0.016 -0.013 0.008 0.011
(0.000) (0.000) (0.120) (0.076) (0.064) (0.156) (0.122) (0.040)
Service
orientation
-0.381 -0.237 -0.236 -0.195 0.036 0.038 -0.082 -0.057
(0.000) (0.014) (0.034) (0.102) (0.369) (0.365) (0.021) (0.115)
Central
transfers
1.720 1.215 6.450 6.753 -1.053 -0.966 -0.534 -0.538
(0.290) (0.445) (0.001) (0.001) (0.000) (0.001) (0.000) (0.001)
Strongest
party share
0.197 0.781 0.721 1.721 0.380 0.117 0.711 1.011
(0.484) (0.255) (0.129) (0.138) (0.349) (0.908) (0.000) (0.047)
Population -0.014 0.070 -0.060 -0.075
(0.741) (0.341) (0.374) (0.078)
Care for poor -2.142 -6.518 -1.684 -0.447
(0.591) (0.138) (0.547) (0.689)
Retiree share -3.664 -3.076 -2.143 -1.903
(0.000) (0.082) (0.113) (0.019)
Road density -0.025 -0.104 -0.027 -0.031
(0.695) (0.352) (0.778) (0.599)
Schools
density
30.991 101.21 -7.095 16.857
(0.547) (0.095) (0.916) (0.635)
Debt service 1.241 -0.612 0.051 1.731
(0.438) (0.834) (0.987) (0.058)
Right-wing 0.022 -0.300 -0.315 -0.087
(0.919) (0.415) (0.319) (0.546)
Majority 0.083 0.110 0.336 0.032
(0.774) (0.843) (0.560) (0.741)
Council frag-
mentation
-0.966 -1.371 0.545 -0.553
(0.337) (0.431) (0.721) (0.367)
Constant 7.148 8.808 8.599 9.045 9.457 10.958 10.037 11.378
(0.000) (0.000) (0.000) (0.000) (0.000) (0.000) (0.000) (0.000)
R2 0.3323 0.4676 0.3182 0.3722 0.2476 0.2735 0.464 0.5274
LM (lag) 0.852 0.000 2.478 1.422 6.277 4.523 1.477 0.661
[k=2] (0.356) (0.999) (0.115) (0.233) (0.012) (0.033) (0.224) (0.416)
LM (error) 0.513 0.338 3.286 1.713 4.574 4.312 0.755 0.619
[k=2] (0.474) (0.561) (0.070) (0.191) (0.032) (0.038) (0.385) (0.431)
LM (lag) 2.188 0.213 1.371 1.004 5.124 3.090 1.101 0.161
[k=4] (0.139) (0.645) (0.242) (0.316) (0.024) (0.079) (0.294) (0.688)
LM (error) 2.261 0.564 2.175 0.983 3.560 2.441 0.117 0.003
[k=4] (0.133) (0.453) (0.140) (0.321) (0.059) (0.118) (0.733) (0.954)
Notes: All regressions are estimated with OLS. Standard errors in parentheses. LM is the
Lagrange Multiplier test for spatial dependence, performed in SpaceStat v1.8.
20
On the other hand, the share of people in poverty qualifying for care seems to play
no role – perhaps because it captures both a (positive) demand-driven and a
(negative) resource-constraint effect; or because discretion on this policy by
municipal authorities is in fact rather limited (Avlijas and Bartlett, 2011). The same is
true for the schools density (classrooms per capita) and road density variables (the
latter capturing the amount of infrastructure already available in each municipal
area).
Quite surprisingly, service-orientation (measured as the productivity differential
between services and industry in each municipality) appears to be inversely linked to
municipal spending – implying that municipalities with dynamic industrial sectors
manage to source and commit a greater volume of per capita expenditures.7
Spending has also been lower, in the past, in municipalities with greater numbers of
university faculties – although with a declining trend and by 2008 a positive
association between the universities variable and the level of per capita spending
(total and social, but less so in the case of the latter) is observed.
Concerning the policy variables, in line with our earlier discussion, central-state
transfers seemed to have played no role for either total or social expenditures in the
1990s but to have contributed substantially to total expenditures in 2002 (the
‘refinancing’ period) – although this seems to have affected much less social
expenditures. From 2005 onwards, however, state transfers obtain a much more
redistributive role, thus returning a negative association with levels of per capita
spending, although our results also confirm that in 2008 the redistributive role of
transfers has weakened. Instead, in 2008 spending seems to be positively driven by
debt (but at the expense of social expenditures as a share to total) – while the latter
has had no influence on spending in previous periods. Last, our results indicate that
stronger local governments are associated with higher per capita spending, but the
7 Although for total expenditures this may be interpreted as evidence suggesting a greater
allocation of spending for environmental services and hard infrastructure in industrial areas,
the fact that social expenditures are also negatively affected (and more strongly so) makes
this interpretation rather unconvincing.
21
result is statistically significant only in 2008. Majority and centre-left governments
also seem to have a positive effect (albeit not statistically significant in our
regressions). Thus, municipal spending does not seem to follow a pork-barrel logic
under political competition (see Costa-Font et al, 2003) but rather to be more
related to a municipal authority’s ability to tax, implement policies and/or extract
centre-state resources.
Spatial interdependence
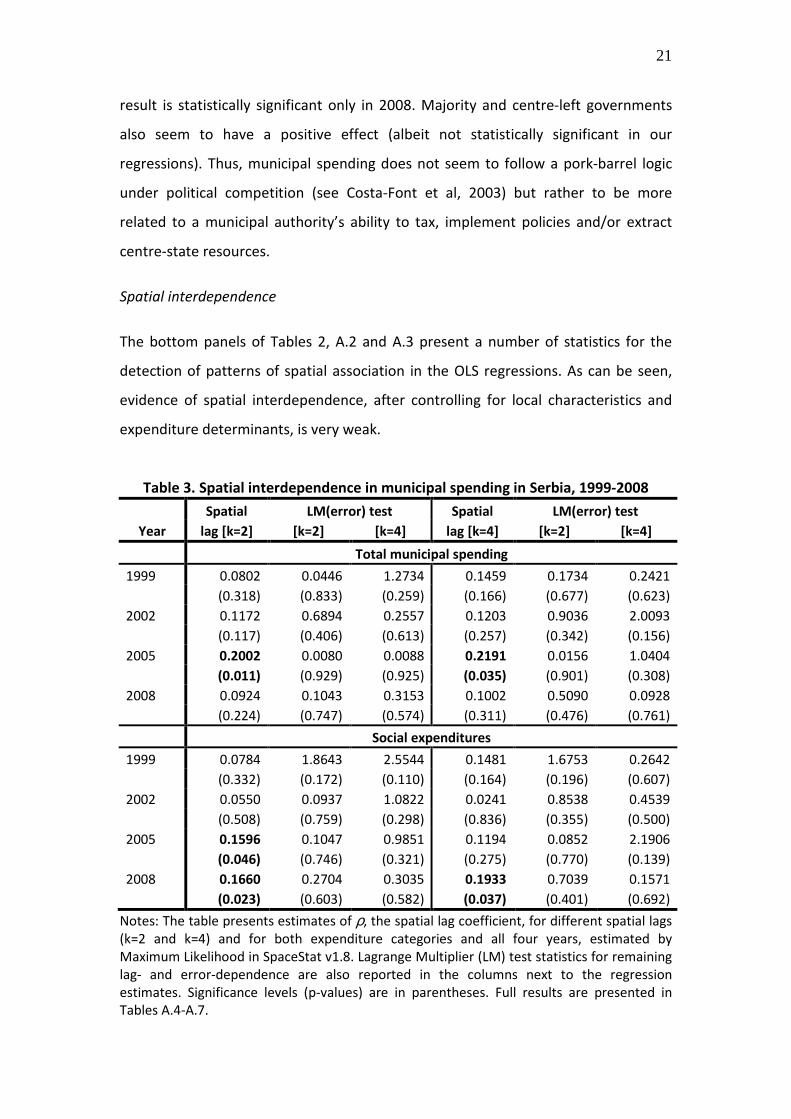
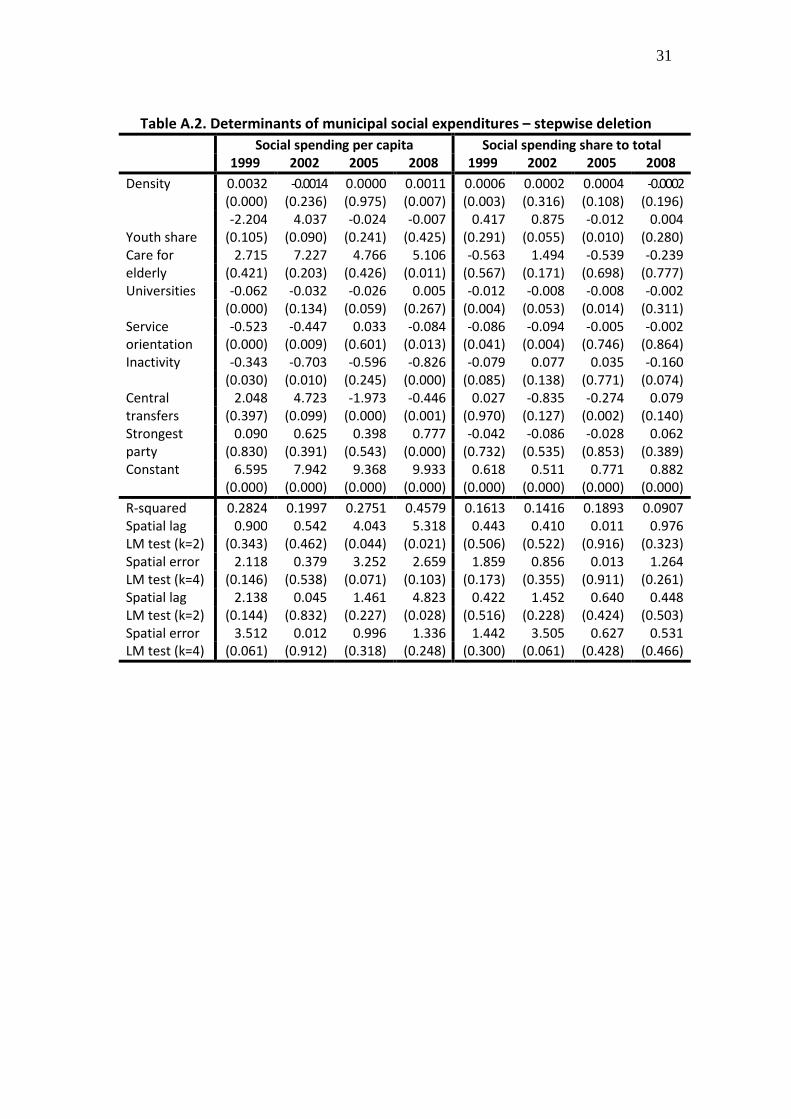
The bottom panels of Tables 2, A.2 and A.3 present a number of statistics for the
detection of patterns of spatial association in the OLS regressions. As can be seen,
evidence of spatial interdependence, after controlling for local characteristics and
expenditure determinants, is very weak.
Table 3. Spatial interdependence in municipal spending in Serbia, 1999-2008
Spatial LM(error) test Spatial LM(error) test
Year lag [k=2] [k=2] [k=4] lag [k=4] [k=2] [k=4]
Total municipal spending
1999 0.0802 0.0446 1.2734 0.1459 0.1734 0.2421
(0.318) (0.833) (0.259) (0.166) (0.677) (0.623)
2002 0.1172 0.6894 0.2557 0.1203 0.9036 2.0093
(0.117) (0.406) (0.613) (0.257) (0.342) (0.156)
2005 0.2002 0.0080 0.0088 0.2191 0.0156 1.0404
(0.011) (0.929) (0.925) (0.035) (0.901) (0.308)
2008 0.0924 0.1043 0.3153 0.1002 0.5090 0.0928
(0.224) (0.747) (0.574) (0.311) (0.476) (0.761)
Social expenditures
1999 0.0784 1.8643 2.5544 0.1481 1.6753 0.2642
(0.332) (0.172) (0.110) (0.164) (0.196) (0.607)
2002 0.0550 0.0937 1.0822 0.0241 0.8538 0.4539
(0.508) (0.759) (0.298) (0.836) (0.355) (0.500)
2005 0.1596 0.1047 0.9851 0.1194 0.0852 2.1906
(0.046) (0.746) (0.321) (0.275) (0.770) (0.139)
2008 0.1660 0.2704 0.3035 0.1933 0.7039 0.1571
(0.023) (0.603) (0.582) (0.037) (0.401) (0.692)
Notes: The table presents estimates of ρ, the spatial lag coefficient, for different spatial lags
(k=2 and k=4) and for both expenditure categories and all four years, estimated by
Maximum Likelihood in SpaceStat v1.8. Lagrange Multiplier (LM) test statistics for remaining
lag- and error-dependence are also reported in the columns next to the regression
estimates. Significance levels (p-values) are in parentheses. Full results are presented in
Tables A.4-A.7.
22
For total expenditures, evidence of such dependence is limited to the regressions
corresponding to 2005 (with the exception of the statistic for localised spatial-error
dependence in the ‘parsimonious’ model of 2002). For social spending, evidence of
spatial dependence (again, localised and present for both the lag and the residuals)
is also found for 2008 (Table A.2), but this does not survive when we include the full
list of local determinants (Table A.3). This is somewhat surprising, as the descriptive
evidence presented earlier indicated continuous increases in spatial association over
time, with highest values observed for 2008 for both categories of spending.
We can explore this further by means of a spatial regression analysis on the basis of
the model presented in equation (1). Specifically, we amend the models examined in
the previous sub-section adding a spatial lag of the expenditures variable (i.e., a
weighted measure of distance-adjusted neighbouring values) and estimating its
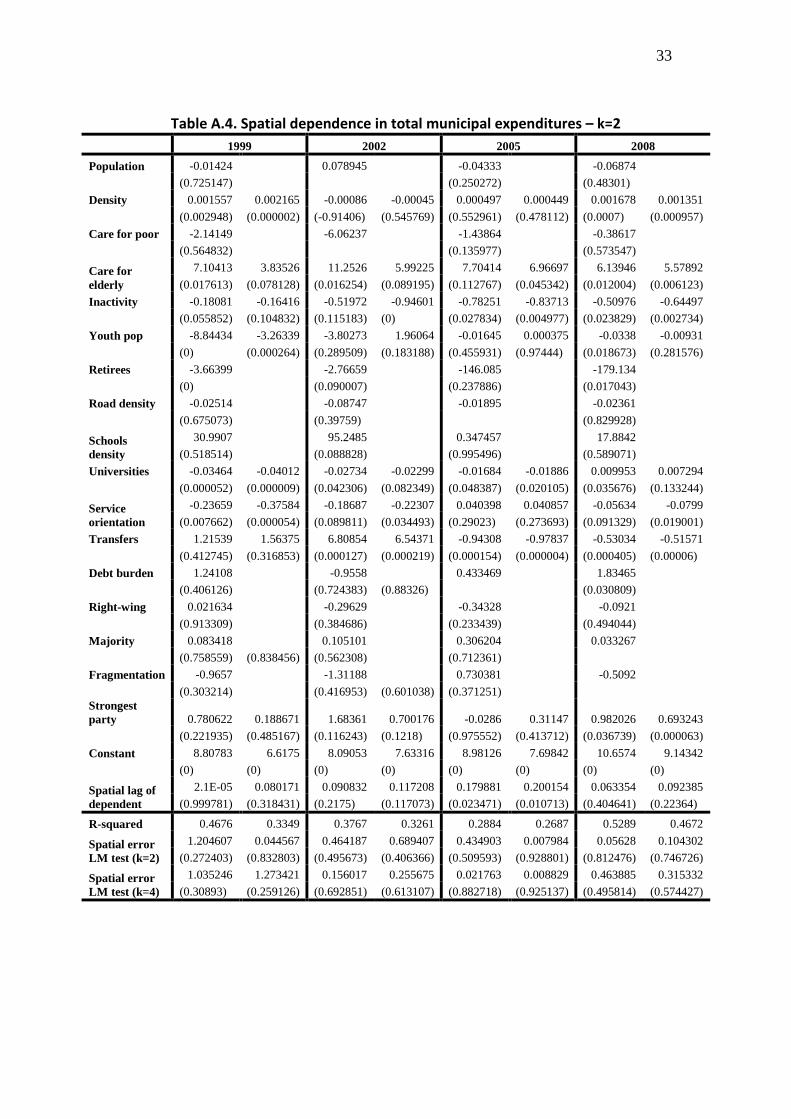
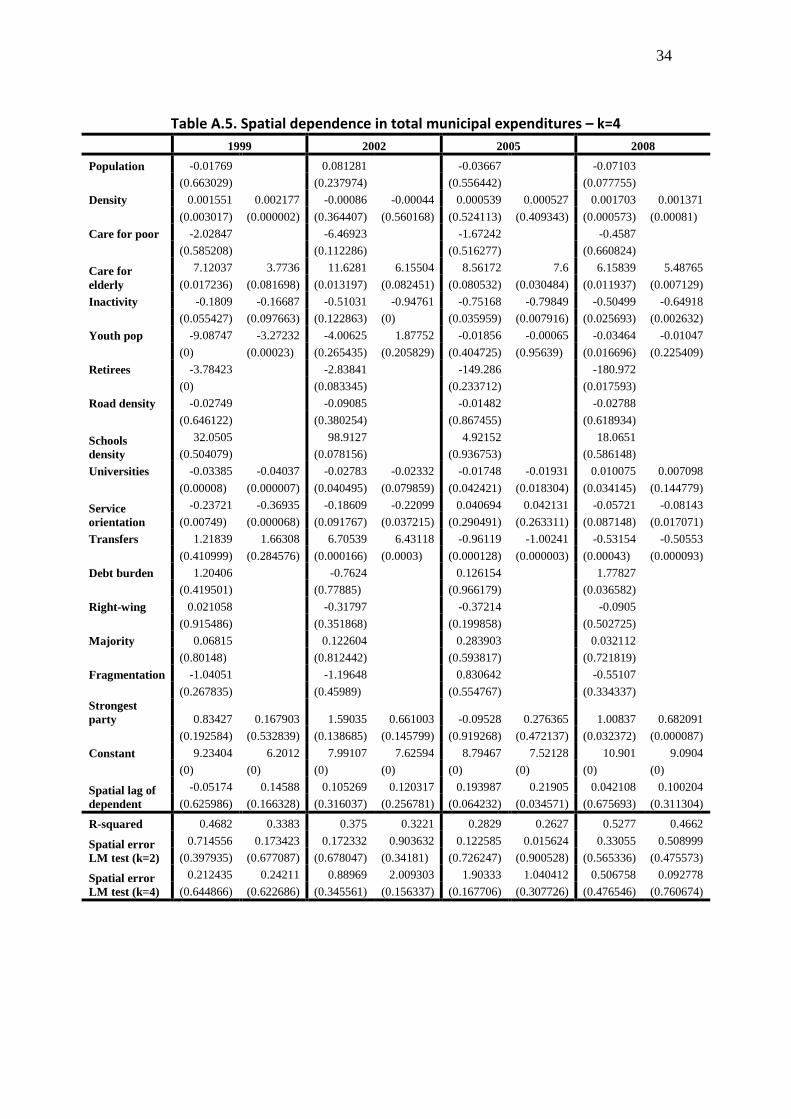
effect on local expenditures using Maximum Likelihood.8 Table 3 presents a subset of
the results from this analysis (full results are presented in Tables A.4-A.7 in the
Appendix). Given the previously obtained evidence of spatial association declining
fast with distance, we restrict our analysis here to spatial lags generated on the basis
of weights matrices for 2 and 4 nearest neighbours only.
Consistent with all evidence discussed previously, the spatial lag coefficients are
rarely statistically significant. In the parsimonious model, for which estimates of the
spatial lag effect are reported in Table 3, spatial dependence in total municipal
expenditures appears significant only in 2005, where a 1% rise in average
neighbours’ per capita expenditures is found to increase local expenditures by 0.2%.
For social expenditures the effect is slightly smaller (closer to 0.16% and significant
only at 5%), but it applies to both 2005 and 2008 – and it is in fact stronger in the
latter year. The results are consistent also at the immediately wider spatial scale
(k=4). When we consider, however, the full model (see Appendix), evidence of
spatial dependence for the social expenditures category in 2008 disappears – and
8 Results produced using the GMM and S2SLS methods, where the spatial lag of municipal
spending has been instrumented with past values of spending, produced qualitatively
identical results and are thus not reported here.
23
the remaining spatial dependence for this category (in 2005) is very localised
(significant for k=2 only). For total expenditures the results remain as in the
parsimonious model reported in Table 3. In all cases, the inclusion of the spatial lag
removes any evidence of spatial dependence in the residuals (see the LM(error) tests
reported in Table 3).
Overall, our results provide some evidence in favour of the hypothesis of increasing
municipal interdependence / competition with the advent of decentralisation. This
evidence, however, is rather weak, in at least two ways. First, because despite what
is observed in the descriptive patterns, when conditioning this spatial association on
a number of local determinants of municipal spending the evidence of spatial
interdependence is limited mainly to the year 2005 – a year too close to the very
beginning of the decentralisation process – while in 2008, at least for total
expenditures, this evidence disappears. Second, because the results are consistently
stronger in the case of very localised interdependencies (for cases considering only
the two nearest neighbours) and become insignificant very fast thereafter. With the
typical municipality having 5 contiguous neighbours and only 10 municipalities
having two or less immediate neighbours, it is in a way difficult to see why evidence
of spatial dependence, if substantively driven by inter-municipal competition or
mimicking, should decline so fast as we move to neighbourliness scales wider than
those defined by the 2 nearest neighbours.
Still, it should be acknowledged that the scant evidence of spatial dependence that
we have obtained cannot be easily dismissed. On the one hand, as is shown in Table
3, there is no evidence of residual spatial dependence in the models and thus there
is very little to support the idea that municipal spending is further driven by pure
spillovers (in socio-economic or political variables). On the other hand, spatial
dependence in 2008 appears stronger exactly in the category that one would expect
to find it, i.e., in social expenditures. We discuss the overall message deriving from
these results in the concluding section, next.
24
Conclusions
Municipal decentralisation has emerged in Southeast Europe (SEE) as both a model
for democratisation and a means for attaining economic efficiency and growth. In
recent years, legislative moves towards administrative, political and fiscal
decentralisation have taken place, to different degrees, in practically all SEE
countries. Although the reasons for this trend have not been solely, or
predominantly, economic, in many respects the usefulness, efficacy and viability of
this process is largely to be evaluated on economic grounds.
In the context of SEE, however, pressing questions can be asked about the relevance
of a decentralisation process that takes place amidst on-going and significant
transformations at the national level, which not only require centralised decision-
making and strong policy control but also affect the very institutions and
administrative capacities of the central state. With relatively weak local
administrations and still-developing institutional capacities, delegation of policy
responsibilities to the local level may in fact hinder, rather than empower, the
matching between local needs and local policy responses. Economic weaknesses add
to this, as significant inequalities exist in resources, capacities and levels of
development at the local level, and as equilibration mechanisms, including capital
mobility and migration, are not yet fully in place.
Nevertheless, even under these circumstances, Serbia, as most other SEE countries,
has engaged in an increasingly intensive process of decentralisation, moving from
simple de-concentration since the early 2000s to firm steps towards fiscal
decentralisation, with substantive delegation of a number of functions and
responsibilities. While this can potentially enable local administrations to allocate
resources more efficiently and deliver better policies matching more closely local
preferences and needs, it also risks increasing disparities across municipalities not
only in the quality and resourcing of public services but also, by implication, in local
economic and social outcomes.
25
The evidence presented in this paper suggests that the outcome of the recent
decentralisation measures in the country have not yet produced strong results in
either direction. On the face of it, patterns of municipal spending seem to have
become more similar since the second half of the 2000s and more correlated across
space – thus supporting the idea of processes of yardstick competition and
mimicking. Closer examination, however, suggests that spatial interdependencies are
weak, with the econometric evidence in support of these being rather marginal and
stronger in the early period of decentralisation than more recently. Among the local
determinants of municipal spending, evidence of increasing relative importance of
contextual factors, such as local needs and politics, is also weak. Economic
constraints, as evidenced from the results obtained for inactivity and central-state
transfers, play an increasingly important role; while the influence of socio-
demographic conditions, although increasing in some variables, is not becoming any
more significant in others. Evidence of an increasing role of political factors also
seems to be restricted to a few variables only.
Overall, then, the evidence obtained in our analysis is rather inconclusive and surely
less than overwhelming. Spatial interdependence of municipal spending appears to
have increased recently in Serbia. But while it is tempting to associate this increase
to the decentralisation process that has been followed, the evidence is not strong
enough to support such a conclusion. Naturally, it could be claimed that the real
changes in local self-governance in the country, especially on the fiscal field, are too
recent for their results to be fully manifested in the data examined here. This is
undoubtedly a valid critique, which calls, by implication, for further research to be
conducted on the issue in the future. But besides this, it is also possible that the
absence of strong and conclusive evidence in favour of a competition effect
following decentralisation may have more to do with the very quality of the process
of decentralisation itself, as well as with the extent to which local administrations
and local communities are ready to respond to the decentralisation challenge. As we
noted earlier, inter-municipal competition, and thus efficiency gains from
decentralisation, depends to a large degree on the capacity of local administrations
to deliver efficient policies and of local populations to exercise their control over

26
these administrations (through ‘exit’ and ‘voice’). It appears that thus far, in the case
of Serbia, the decentralisation process as it has been implemented, and the actual
conditions characterising the municipal space in the country, have not allowed this
to happen to any substantial extent.
27
References
Aghion P. and Tirole J. (1997), Formal and real authority in organizations, Journal of
Political Economy 105(1), pp.1–29.
Anselin L. (1985), Spatial Econometrics: methods and model, Studies in Operational
Regional Science, Kluwer Academic Publishers, Holland.
Avlijas S. and Bartlett W. (2011), Decentralisation and regional policy in Serbia, Paper
presented at the LSEE/IFRI Conference “South-East Europe: Regional Co-operation,
Institutional Change and the Challenge of European Integration” Brussels, 2nd
December, 2010
Bartlett W. (1985), Social services and local democracy in Yugoslavia, Community
Development Journal, pp.18-23.
Besley T. and Case A. (1995), Incumbent’s behavior: vote seeking, tax-setting and
yardstick competition, American Economic Review 85, pp.25-45.
Borck R., Caliendo M. and Steiner V. (2006), Fiscal Competition and the Composition
of Public Spending: theory and evidence, Discussion Paper No2428, Institute for
the Study of Labor, Bonn.
Bordignon M., Cerniglia F. and Revelli F. (2003), In search of yardstick competition: a
spatial analysis of Italian municipality property tax setting, Journal of Urban
Economics 54, pp.199-217.
Brueckner J. (2003), Strategic Interaction Among Governments: an overview of
empirical studies, International Regional Science Review 25, pp.175-188.
Brueckner J. (2006), Fiscal federalism and economic growth, Journal of Public
Economics 90(10/11), pp.2107-2120.
Brueckner J. and Saavedra L. (2001), Do local governments engage in strategic
property-tax competition?, National Tax Journal 54, pp.203-229.
Brusis M. (2002), Between EU requirements, competitive politics, and national
traditions: re-creating regions in the accession countries of Central and Eastern
Europe, Governance: International Journal of Policy, Administration and
Institutions 15(4), pp.531-559.
Buettner T. (2001), Local business taxation and competition for capital: the choice of
the tax rate, Regional Science and Urban Economics 31, pp.215-245.
Burns D., Hambleton R. and Hoggett P. (1994), The Politics of Decentralization:
Revitalising Local Democracy, MacMillan, London.
Canel E. (2001), Municipal Decentralization and Participatory Democracy: Building a
New Mode of Urban Politics in Montevideo City?, European Review of Latin
American and Caribbean Studies 71, pp.25-46.
CoE (1985), European Charter of Local Self-Government, Strasburg.
28
Costa-Font J., Rodriguez-Oreggia E. and Lunapla D. (2003), Political Competition and
Pork-Barrel Politics in the Allocation of Public Investment in Mexico, Public Choice
116(1/2), pp.185-204.
Foucault M., Madies T. and Paty S. (2008), Public spending interactions and local
politics: empirical evidence from French municipalities, Public Choice 137, pp.57-
80.
IIDEA (2000), Advancing democracy in Slovakia through local self-governance:
lessons learned from other European countries, International Institute for
Democracy and Electoral Assistance, Stockholm.
Konjhodzic H. and Suman T. (2009), fiscal Decentralization in Croatia: reform process
or political rhetoric, EKON. MISAO PRAKSA DBK 18(2), pp.233-258.
Levitas A. (2005), Reforming Serbia’s Local Government Finance System, Journal of
Public Administration 28, pp.147-178.
Leygues J. (2001), Multi-level Governance: linking and networking the various
regional and local levels, Report by the Working Group on Multi-level Governance,
Brussels.
Lundberg J. (2001), A Spatial Interaction Model of Benefit Spillovers from Locally
Provided Public Services, Working Paper No31, Umea, CERUM.
Musgrave R. (1959), The Theory of Public Finance, McGraw Hill, New York.
Oates W. (1972), Fiscal Federalism, McGraw Hill, New York.
Oates W. (1999), An essay on fiscal federalism, Journal of Economic Literature 37(3),
pp.1120-1149.
Revelli F. (2001), Spatial patterns in local taxation: tax mimicking or error
mimicking?, Applied Economics 33, pp.1101-1107.
Revelli F. (2002), Testing the tax mimicking versus expenditure spill-over hypotheses
using English data, Applied Economics 34, pp.1723-1731.
Revelli F. (2006), Performance rating and yardstick competition in social service
provision, Journal of Public Economics 90, pp.459-475.
Rodríguez-Pose A. and Sandall R. (2008), From identity to the economy: analysing
the evolution of the decentralisation discourse, Environment and Planning C:
Government and Policy 26(1), pp.54-72.
Solé-Ollé A. (2003), Electoral accountability and tax mimicking: the effects of
electoral margins, coalition government, and ideology, European Journal of
Political Economy 19(4), pp.685-713.
Solé-Ollé A. (2005), Expenditure Spillovers and Fiscal Interactions: empirical evidence
from local governments in Spain, Working Paper No3, Institut d’Economica de
Barcelona, Barcelona.
Stastna S. (2009), Spatial Interdependence of Local Public Expenditures: selected
evidence from the Czech Republic, AUCO Czech Economic Review 3(1), pp.7-25.

29
Stipanovic B. (2009), Local Government Finance System and Fiscal Equalization in the
Republic of Serbia, The Fiscal Decentralization Initiative for Central and Eastern
Europe.
UN (2000), Decentralization: conditions for success: lessons from Central and Eastern
Europe and the Commonwealth of Independent States, Conference Proceedings,
United Nations Division for Public Economics and Public Administration, New York.
UNDP (2009), Capacity Development for Quality Public Service Delivery at the Local
Level in the Western Balkans, United Nations Development Programme, Bratislava.
World Bank (2008), Serbia – Delivery of Improved Local Service Project, Project
Appraisal Document, Report No: 38921-YF, The World Bank, Washington DC.
30
Appendix
Table A.1. Global spatial association statistics by expenditure category, year and
type of neighbourliness
Year Nearest neighbours Queen contiguity Distance cut-off k=2 k=4 k=6 k=8 1st order 2nd order 3% 5% 10%
Total expenditures per capita 2008 0.178 0.146 0.139 0.136 0.143 0.089 0.082 0.139 0.093 (0.02) (0.04) (0.02) (0.02) (0.02) (0.01) (0.18) (0.01) (0.01) 2005 0.185 0.116 0.109 0.100 0.097 0.072 0.182 0.083 0.051 (0.01) (0.02) (0.01) (0.01) (0.02) (0.01) (0.01) (0.03) (0.02) 2002 0.082 0.044 0.069 0.056 0.061 0.011 0.098 0.038 -0.012 (0.11) (0.18) (0.06) (0.07) (0.09) (0.27) (0.04) (0.16) (0.49) 1999 0.088 0.089 0.053 0.056 0.081 0.046 0.096 0.079 0.058 (0.12) (0.08) (0.14) (0.12) (0.08) (0.02) (0.12) (0.03) (0.01)
Social expenditures per capita 2008 0.215 0.180 0.171 0.152 0.176 0.102 0.110 0.156 0.108 (0.02) (0.01) (0.01) (0.01) (0.01) (0.01) (0.09) (0.01) (0.01) 2005 0.168 0.081 0.100 0.111 0.105 0.077 0.199 0.103 0.054 (0.02) (0.07) (0.02) (0.01) (0.02) (0.02) (0.01) (0.01) (0.01) 2002 0.08 0.03 0.05 0.04 0.05 0.01 0.11 0.03 -0.01 (0.14) (0.27) (0.12) (0.12) (0.17) (0.28) (0.01) (0.17) (0.39) 1999 0.029 0.038 0.017 0.016 0.038 0.054 0.078 0.034 0.054 (0.38) (0.21) (0.33) (0.32) (0.23) (0.05) (0.15) (0.13) (0.02)
Social expenditures share to total 2008 0.128 0.073 0.094 0.090 0.152 0.062 0.061 0.080 0.063 (0.06) (0.08) (0.02) (0.01) (0.01) (0.04) (0.25) (0.02) (0.03) 2005 0.032 -0.006 0.028 0.058 0.046 0.032 0.105 0.065 0.029 (0.27) (0.46) (0.21) (0.07) (0.14) (0.13) (0.07) (0.05) (0.04) 2002 -0.012 -0.029 -0.035 -0.023 -0.025 -0.013 0.058 -0.025 0.003 (0.45) (0.29) (0.21) (0.3) (0.33) (0.42) (0.24) (0.34) (0.32) 1999 0.036 0.006 -0.005 0.006 0.018 0.004 0.057 0.021 0.021 (0.27) (0.43) (0.5) (0.38) (0.34) (0.33) (0.17) (0.28) (0.06)
31
Table A.2. Determinants of municipal social expenditures – stepwise deletion
Social spending per capita Social spending share to total
1999 2002 2005 2008 1999 2002 2005 2008
Density 0.0032 -0.0014 0.0000 0.0011 0.0006 0.0002 0.0004 -0.0002
(0.000) (0.236) (0.975) (0.007) (0.003) (0.316) (0.108) (0.196)
Youth share
-2.204 4.037 -0.024 -0.007 0.417 0.875 -0.012 0.004
(0.105) (0.090) (0.241) (0.425) (0.291) (0.055) (0.010) (0.280)
Care for
elderly
2.715 7.227 4.766 5.106 -0.563 1.494 -0.539 -0.239
(0.421) (0.203) (0.426) (0.011) (0.567) (0.171) (0.698) (0.777)
Universities -0.062 -0.032 -0.026 0.005 -0.012 -0.008 -0.008 -0.002
(0.000) (0.134) (0.059) (0.267) (0.004) (0.053) (0.014) (0.311)
Service
orientation
-0.523 -0.447 0.033 -0.084 -0.086 -0.094 -0.005 -0.002
(0.000) (0.009) (0.601) (0.013) (0.041) (0.004) (0.746) (0.864)
Inactivity -0.343 -0.703 -0.596 -0.826 -0.079 0.077 0.035 -0.160
(0.030) (0.010) (0.245) (0.000) (0.085) (0.138) (0.771) (0.074)
Central
transfers
2.048 4.723 -1.973 -0.446 0.027 -0.835 -0.274 0.079
(0.397) (0.099) (0.000) (0.001) (0.970) (0.127) (0.002) (0.140)
Strongest
party
0.090 0.625 0.398 0.777 -0.042 -0.086 -0.028 0.062
(0.830) (0.391) (0.543) (0.000) (0.732) (0.535) (0.853) (0.389)
Constant 6.595 7.942 9.368 9.933 0.618 0.511 0.771 0.882
(0.000) (0.000) (0.000) (0.000) (0.000) (0.000) (0.000) (0.000)
R-squared 0.2824 0.1997 0.2751 0.4579 0.1613 0.1416 0.1893 0.0907
Spatial lag
LM test (k=2)
0.900 0.542 4.043 5.318 0.443 0.410 0.011 0.976
(0.343) (0.462) (0.044) (0.021) (0.506) (0.522) (0.916) (0.323)
Spatial error
LM test (k=4)
2.118 0.379 3.252 2.659 1.859 0.856 0.013 1.264
(0.146) (0.538) (0.071) (0.103) (0.173) (0.355) (0.911) (0.261)
Spatial lag
LM test (k=2)
2.138 0.045 1.461 4.823 0.422 1.452 0.640 0.448
(0.144) (0.832) (0.227) (0.028) (0.516) (0.228) (0.424) (0.503)
Spatial error
LM test (k=4)
3.512 0.012 0.996 1.336 1.442 3.505 0.627 0.531
(0.061) (0.912) (0.318) (0.248) (0.300) (0.061) (0.428) (0.466)
32
Table A.3. Determinants of municipal social expenditures – full model
Social spending per capita Social spending share to total 1999 2002 2005 2008 1999 2002 2005 2008
Population 0.1747 0.2674 0.0959 -0.1044 0.0948 0.0883 0.0871 -0.0250
(0.004) (0.016) (0.377) (0.009) (0.000) (0.000) (0.000) (0.137)
Density 0.0008 -0.0039 -0.0015 0.0016 -0.0003 -0.0006 -0.0004 -0.0001
(0.312) (0.010) (0.308) (0.001) (0.136) (0.016) (0.244) (0.771)
Care for poor 0.1629 -10.68 -0.021 0.5308 1.0946 -2.226 0.6746 0.7555
(0.977) (0.104) (0.996) (0.609) (0.477) (0.055) (0.493) (0.089) Care for elderly
8.1852 18.091 9.3173 4.4240 0.4468 3.9466 1.1720 -1.292
(0.069) (0.018) (0.277) (0.071) (0.718) (0.003) (0.531) (0.215)
Inactivity -0.263 -0.297 -0.134 -0.779 -0.034 0.0548 0.2213 -0.218
(0.065) (0.575) (0.830) (0.001) (0.389) (0.558) (0.108) (0.025)
Youth pop -10.74 -6.143 -0.063 -0.024 -1.245 -0.326 -0.020 0.0098
(0.000) (0.288) (0.104) (0.098) (0.049) (0.749) (0.022) (0.109)
Retirees -5.381 -5.064 -3.383 -1.423 -1.008 -0.594 -0.581 0.347
(0.000) (0.055) (0.119) (0.058) (0.001) (0.200) (0.221) (0.276)
Road density 0.0658 0.0413 0.0476 -0.0269 0.0411 0.0670 0.0279 0.0029
(0.462) (0.804) (0.758) (0.628) (0.098) (0.024) (0.410) (0.902) Schools density
14.219 91.872 -50.30 -0.849 -9.457 -3.723 -17.12 -13.43
(0.843) (0.308) (0.642) (0.979) (0.633) (0.814) (0.470) (0.341)
Universities -0.0601 -0.0357 -0.0245 0.0084 -0.0131 -0.0085 -0.0088 -0.0016
(0.000) (0.099) (0.104) (0.076) (0.000) (0.027) (0.008) (0.422) Service orientation
-0.2430 -0.2984 0.0443 -0.0651 -0.0143 -0.0548 -0.0010 -0.0079
(0.068) (0.094) (0.510) (0.052) (0.696) (0.081) (0.943) (0.576)
Transfers 0.1802 5.9341 -1.5428 -0.5082 -0.6456 -0.5399 -0.0922 0.0312
(0.935) (0.039) (0.001) (0.001) (0.293) (0.285) (0.337) (0.624)
Debt burden -0.8562 0.5620 3.0359 0.7419 -1.1916 -0.1310 1.0536 -0.8204
(0.701) (0.897) (0.559) (0.378) (0.055) (0.865) (0.355) (0.024)
Right-wing -0.2211 -0.9522 -0.5756 -0.0537 -0.1332 -0.2317 -0.0590 0.0318
(0.456) (0.084) (0.257) (0.690) (0.106) (0.018) (0.595) (0.579)
Majority -0.4740 -0.3368 0.1569 0.0855 -0.1234 -0.1737 -0.1043 0.0475
(0.243) (0.684) (0.866) (0.341) (0.272) (0.235) (0.608) (0.216) Fragmentation
-0.5828 -1.5776 0.6103 -0.7589 0.2447 -0.0004 0.0344 -0.1772
(0.677) (0.544) (0.804) (0.183) (0.528) (0.999) (0.949) (0.465) Strongest party
1.1721 2.8136 0.8027 1.1192 0.1421 0.3247 0.2625 0.0894
(0.220) (0.104) (0.625) (0.018) (0.590) (0.286) (0.465) (0.655)
Constant 7.0827 7.5014 9.6101 11.5128 0.1064 -0.0452 -0.0057 1.1006
(0.000) (0.0001) (0.000) (0.000) (0.701) (0.890) (0.987) (0.000)
R-squared 0.4987 0.3053 0.3034 0.5313 0.4717 0.3700 0.3099 0.2055
Spatial lag LM test (k=2)
0.0526 0.1157 3.3202 1.6875 0.1806 1.3123 0.0385 0.4713
(0.819) (0.734) (0.068) (0.194) (0.671) (0.252) (0.844) (0.492)
Spatial error LM test (k=4)
0.5883 0.3337 3.8410 1.0074 0.0176 1.0996 0.4188 0.2851
(0.443) (0.564) (0.050) (0.316) (0.894) (0.294) (0.518) (0.593)
Spatial lag LM test (k=2)
0.0430 0.0382 1.0125 0.7841 0.0184 1.5037 0.2976 0.0286
(0.836) (0.845) (0.314) (0.376) (0.892) (0.220) (0.585) (0.866)
Spatial error LM test (k=4)
0.7706 0.0002 0.9752 0.0018 0.1081 2.5391 0.3381 0.0077
(0.380) (0.988) (0.323) (0.966) (0.742) (0.111) (0.561) (0.930)
33
Table A.4. Spatial dependence in total municipal expenditures – k=2
1999 2002 2005 2008
Population -0.01424 0.078945 -0.04333 -0.06874
(0.725147) (0.250272) (0.48301)
Density 0.001557 0.002165 -0.00086 -0.00045 0.000497 0.000449 0.001678 0.001351
(0.002948) (0.000002) (-0.91406) (0.545769) (0.552961) (0.478112) (0.0007) (0.000957)
Care for poor -2.14149 -6.06237 -1.43864 -0.38617
(0.564832) (0.135977) (0.573547)
Care for elderly
7.10413 3.83526 11.2526 5.99225 7.70414 6.96697 6.13946 5.57892
(0.017613) (0.078128) (0.016254) (0.089195) (0.112767) (0.045342) (0.012004) (0.006123)
Inactivity -0.18081 -0.16416 -0.51972 -0.94601 -0.78251 -0.83713 -0.50976 -0.64497
(0.055852) (0.104832) (0.115183) (0) (0.027834) (0.004977) (0.023829) (0.002734)
Youth pop -8.84434 -3.26339 -3.80273 1.96064 -0.01645 0.000375 -0.0338 -0.00931
(0) (0.000264) (0.289509) (0.183188) (0.455931) (0.97444) (0.018673) (0.281576)
Retirees -3.66399 -2.76659 -146.085 -179.134
(0) (0.090007) (0.237886) (0.017043)
Road density -0.02514 -0.08747 -0.01895 -0.02361
(0.675073) (0.39759) (0.829928)
Schools density
30.9907 95.2485 0.347457 17.8842
(0.518514) (0.088828) (0.995496) (0.589071)
Universities -0.03464 -0.04012 -0.02734 -0.02299 -0.01684 -0.01886 0.009953 0.007294
(0.000052) (0.000009) (0.042306) (0.082349) (0.048387) (0.020105) (0.035676) (0.133244)
Service orientation
-0.23659 -0.37584 -0.18687 -0.22307 0.040398 0.040857 -0.05634 -0.0799
(0.007662) (0.000054) (0.089811) (0.034493) (0.29023) (0.273693) (0.091329) (0.019001)
Transfers 1.21539 1.56375 6.80854 6.54371 -0.94308 -0.97837 -0.53034 -0.51571
(0.412745) (0.316853) (0.000127) (0.000219) (0.000154) (0.000004) (0.000405) (0.00006)
Debt burden 1.24108 -0.9558 0.433469 1.83465
(0.406126) (0.724383) (0.88326) (0.030809)
Right-wing 0.021634 -0.29629 -0.34328 -0.0921
(0.913309) (0.384686) (0.233439) (0.494044)
Majority 0.083418 0.105101 0.306204 0.033267
(0.758559) (0.838456) (0.562308) (0.712361)
Fragmentation -0.9657 -1.31188 0.730381 -0.5092
(0.303214) (0.416953) (0.601038) (0.371251)
Strongest party 0.780622 0.188671 1.68361 0.700176 -0.0286 0.31147 0.982026 0.693243
(0.221935) (0.485167) (0.116243) (0.1218) (0.975552) (0.413712) (0.036739) (0.000063)
Constant 8.80783 6.6175 8.09053 7.63316 8.98126 7.69842 10.6574 9.14342
(0) (0) (0) (0) (0) (0) (0) (0)
Spatial lag of dependent
2.1E-05 0.080171 0.090832 0.117208 0.179881 0.200154 0.063354 0.092385
(0.999781) (0.318431) (0.2175) (0.117073) (0.023471) (0.010713) (0.404641) (0.22364)
R-squared 0.4676 0.3349 0.3767 0.3261 0.2884 0.2687 0.5289 0.4672
Spatial error LM test (k=2)
1.204607 0.044567 0.464187 0.689407 0.434903 0.007984 0.05628 0.104302
(0.272403) (0.832803) (0.495673) (0.406366) (0.509593) (0.928801) (0.812476) (0.746726)
Spatial error LM test (k=4)
1.035246 1.273421 0.156017 0.255675 0.021763 0.008829 0.463885 0.315332
(0.30893) (0.259126) (0.692851) (0.613107) (0.882718) (0.925137) (0.495814) (0.574427)
34
Table A.5. Spatial dependence in total municipal expenditures – k=4
1999 2002 2005 2008
Population -0.01769 0.081281 -0.03667 -0.07103
(0.663029) (0.237974) (0.556442) (0.077755)
Density 0.001551 0.002177 -0.00086 -0.00044 0.000539 0.000527 0.001703 0.001371
(0.003017) (0.000002) (0.364407) (0.560168) (0.524113) (0.409343) (0.000573) (0.00081)
Care for poor -2.02847 -6.46923 -1.67242 -0.4587
(0.585208) (0.112286) (0.516277) (0.660824)
Care for elderly
7.12037 3.7736 11.6281 6.15504 8.56172 7.6 6.15839 5.48765
(0.017236) (0.081698) (0.013197) (0.082451) (0.080532) (0.030484) (0.011937) (0.007129)
Inactivity -0.1809 -0.16687 -0.51031 -0.94761 -0.75168 -0.79849 -0.50499 -0.64918
(0.055427) (0.097663) (0.122863) (0) (0.035959) (0.007916) (0.025693) (0.002632)
Youth pop -9.08747 -3.27232 -4.00625 1.87752 -0.01856 -0.00065 -0.03464 -0.01047
(0) (0.00023) (0.265435) (0.205829) (0.404725) (0.95639) (0.016696) (0.225409)
Retirees -3.78423 -2.83841 -149.286 -180.972
(0) (0.083345) (0.233712) (0.017593)
Road density -0.02749 -0.09085 -0.01482 -0.02788
(0.646122) (0.380254) (0.867455) (0.618934)
Schools density
32.0505 98.9127 4.92152 18.0651
(0.504079) (0.078156) (0.936753) (0.586148)
Universities -0.03385 -0.04037 -0.02783 -0.02332 -0.01748 -0.01931 0.010075 0.007098
(0.00008) (0.000007) (0.040495) (0.079859) (0.042421) (0.018304) (0.034145) (0.144779)
Service orientation
-0.23721 -0.36935 -0.18609 -0.22099 0.040694 0.042131 -0.05721 -0.08143
(0.00749) (0.000068) (0.091767) (0.037215) (0.290491) (0.263311) (0.087148) (0.017071)
Transfers 1.21839 1.66308 6.70539 6.43118 -0.96119 -1.00241 -0.53154 -0.50553
(0.410999) (0.284576) (0.000166) (0.0003) (0.000128) (0.000003) (0.00043) (0.000093)
Debt burden 1.20406 -0.7624 0.126154 1.77827
(0.419501) (0.77885) (0.966179) (0.036582)
Right-wing 0.021058 -0.31797 -0.37214 -0.0905
(0.915486) (0.351868) (0.199858) (0.502725)
Majority 0.06815 0.122604 0.283903 0.032112
(0.80148) (0.812442) (0.593817) (0.721819)
Fragmentation -1.04051 -1.19648 0.830642 -0.55107
(0.267835) (0.45989) (0.554767) (0.334337) Strongest party 0.83427 0.167903 1.59035 0.661003 -0.09528 0.276365 1.00837 0.682091
(0.192584) (0.532839) (0.138685) (0.145799) (0.919268) (0.472137) (0.032372) (0.000087)
Constant 9.23404 6.2012 7.99107 7.62594 8.79467 7.52128 10.901 9.0904
(0) (0) (0) (0) (0) (0) (0) (0)
Spatial lag of dependent
-0.05174 0.14588 0.105269 0.120317 0.193987 0.21905 0.042108 0.100204
(0.625986) (0.166328) (0.316037) (0.256781) (0.064232) (0.034571) (0.675693) (0.311304)
R-squared 0.4682 0.3383 0.375 0.3221 0.2829 0.2627 0.5277 0.4662
Spatial error LM test (k=2)
0.714556 0.173423 0.172332 0.903632 0.122585 0.015624 0.33055 0.508999
(0.397935) (0.677087) (0.678047) (0.34181) (0.726247) (0.900528) (0.565336) (0.475573)
Spatial error LM test (k=4)
0.212435 0.24211 0.88969 2.009303 1.90333 1.040412 0.506758 0.092778
(0.644866) (0.622686) (0.345561) (0.156337) (0.167706) (0.307726) (0.476546) (0.760674)
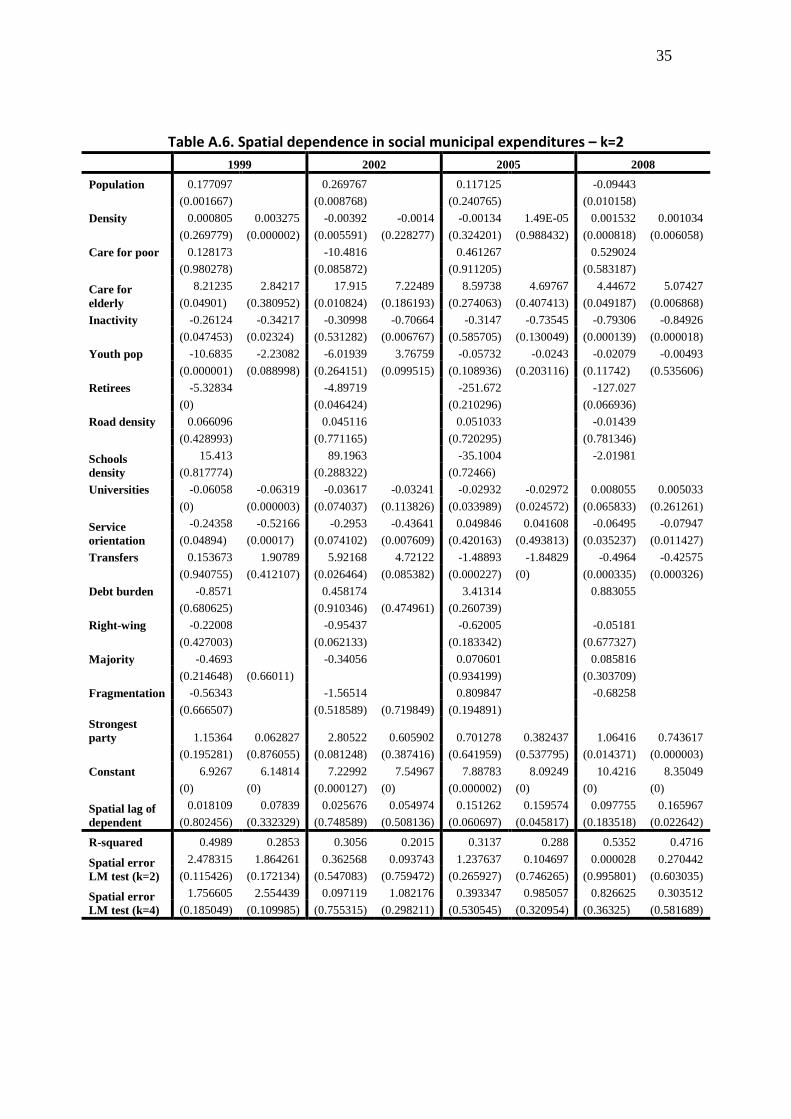
35
Table A.6. Spatial dependence in social municipal expenditures – k=2
1999 2002 2005 2008
Population 0.177097 0.269767 0.117125 -0.09443
(0.001667) (0.008768) (0.240765) (0.010158)
Density 0.000805 0.003275 -0.00392 -0.0014 -0.00134 1.49E-05 0.001532 0.001034
(0.269779) (0.000002) (0.005591) (0.228277) (0.324201) (0.988432) (0.000818) (0.006058)
Care for poor 0.128173 -10.4816 0.461267 0.529024
(0.980278) (0.085872) (0.911205) (0.583187)
Care for elderly
8.21235 2.84217 17.915 7.22489 8.59738 4.69767 4.44672 5.07427
(0.04901) (0.380952) (0.010824) (0.186193) (0.274063) (0.407413) (0.049187) (0.006868)
Inactivity -0.26124 -0.34217 -0.30998 -0.70664 -0.3147 -0.73545 -0.79306 -0.84926
(0.047453) (0.02324) (0.531282) (0.006767) (0.585705) (0.130049) (0.000139) (0.000018)
Youth pop -10.6835 -2.23082 -6.01939 3.76759 -0.05732 -0.0243 -0.02079 -0.00493
(0.000001) (0.088998) (0.264151) (0.099515) (0.108936) (0.203116) (0.11742) (0.535606)
Retirees -5.32834 -4.89719 -251.672 -127.027
(0) (0.046424) (0.210296) (0.066936)
Road density 0.066096 0.045116 0.051033 -0.01439
(0.428993) (0.771165) (0.720295) (0.781346)
Schools density
15.413 89.1963 -35.1004 -2.01981
(0.817774) (0.288322) (0.72466)
Universities -0.06058 -0.06319 -0.03617 -0.03241 -0.02932 -0.02972 0.008055 0.005033
(0) (0.000003) (0.074037) (0.113826) (0.033989) (0.024572) (0.065833) (0.261261)
Service orientation
-0.24358 -0.52166 -0.2953 -0.43641 0.049846 0.041608 -0.06495 -0.07947
(0.04894) (0.00017) (0.074102) (0.007609) (0.420163) (0.493813) (0.035237) (0.011427)
Transfers 0.153673 1.90789 5.92168 4.72122 -1.48893 -1.84829 -0.4964 -0.42575
(0.940755) (0.412107) (0.026464) (0.085382) (0.000227) (0) (0.000335) (0.000326)
Debt burden -0.8571 0.458174 3.41314 0.883055
(0.680625) (0.910346) (0.474961) (0.260739)
Right-wing -0.22008 -0.95437 -0.62005 -0.05181
(0.427003) (0.062133) (0.183342) (0.677327)
Majority -0.4693 -0.34056 0.070601 0.085816
(0.214648) (0.66011) (0.934199) (0.303709)
Fragmentation -0.56343 -1.56514 0.809847 -0.68258
(0.666507) (0.518589) (0.719849) (0.194891)
Strongest party 1.15364 0.062827 2.80522 0.605902 0.701278 0.382437 1.06416 0.743617
(0.195281) (0.876055) (0.081248) (0.387416) (0.641959) (0.537795) (0.014371) (0.000003)
Constant 6.9267 6.14814 7.22992 7.54967 7.88783 8.09249 10.4216 8.35049
(0) (0) (0.000127) (0) (0.000002) (0) (0) (0)
Spatial lag of dependent
0.018109 0.07839 0.025676 0.054974 0.151262 0.159574 0.097755 0.165967
(0.802456) (0.332329) (0.748589) (0.508136) (0.060697) (0.045817) (0.183518) (0.022642)
R-squared 0.4989 0.2853 0.3056 0.2015 0.3137 0.288 0.5352 0.4716
Spatial error LM test (k=2)
2.478315 1.864261 0.362568 0.093743 1.237637 0.104697 0.000028 0.270442
(0.115426) (0.172134) (0.547083) (0.759472) (0.265927) (0.746265) (0.995801) (0.603035)
Spatial error LM test (k=4)
1.756605 2.554439 0.097119 1.082176 0.393347 0.985057 0.826625 0.303512
(0.185049) (0.109985) (0.755315) (0.298211) (0.530545) (0.320954) (0.36325) (0.581689)
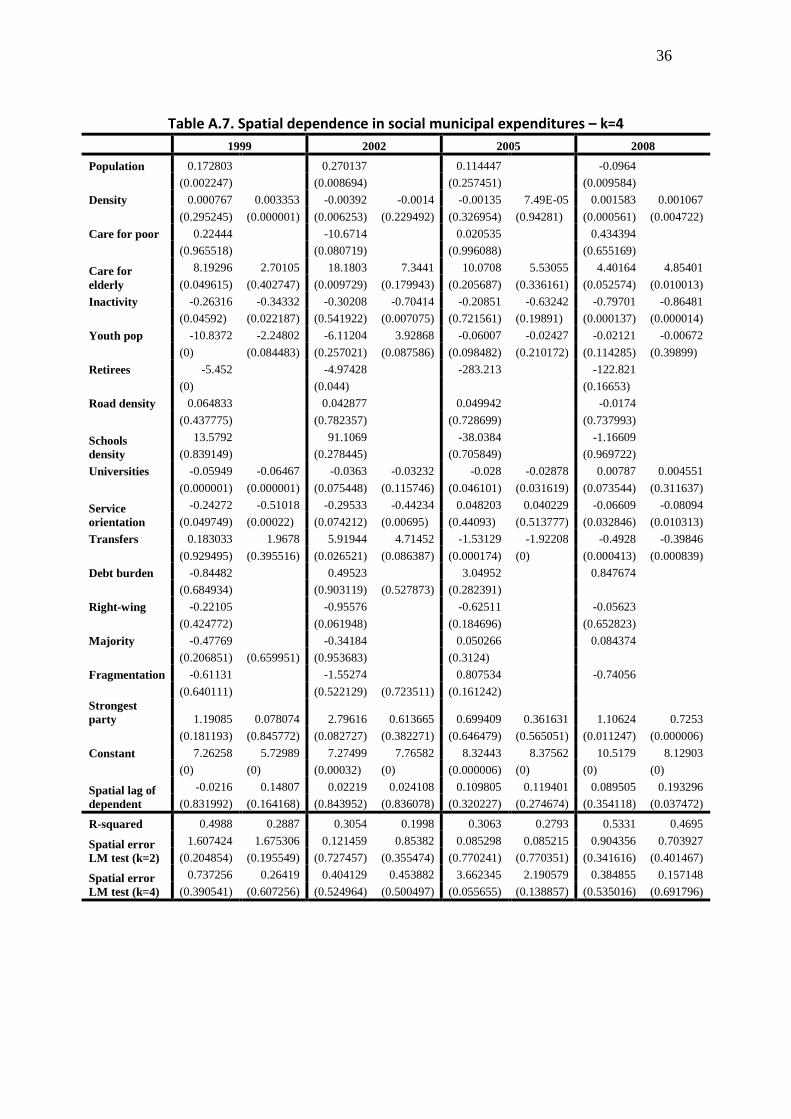
36
Table A.7. Spatial dependence in social municipal expenditures – k=4
1999 2002 2005 2008
Population 0.172803 0.270137 0.114447 -0.0964
(0.002247) (0.008694) (0.257451) (0.009584)
Density 0.000767 0.003353 -0.00392 -0.0014 -0.00135 7.49E-05 0.001583 0.001067
(0.295245) (0.000001) (0.006253) (0.229492) (0.326954) (0.94281) (0.000561) (0.004722)
Care for poor 0.22444 -10.6714 0.020535 0.434394
(0.965518) (0.080719) (0.996088) (0.655169)
Care for elderly
8.19296 2.70105 18.1803 7.3441 10.0708 5.53055 4.40164 4.85401
(0.049615) (0.402747) (0.009729) (0.179943) (0.205687) (0.336161) (0.052574) (0.010013)
Inactivity -0.26316 -0.34332 -0.30208 -0.70414 -0.20851 -0.63242 -0.79701 -0.86481
(0.04592) (0.022187) (0.541922) (0.007075) (0.721561) (0.19891) (0.000137) (0.000014)
Youth pop -10.8372 -2.24802 -6.11204 3.92868 -0.06007 -0.02427 -0.02121 -0.00672
(0) (0.084483) (0.257021) (0.087586) (0.098482) (0.210172) (0.114285) (0.39899)
Retirees -5.452 -4.97428 -283.213 -122.821
(0) (0.044) (0.16653)
Road density 0.064833 0.042877 0.049942 -0.0174
(0.437775) (0.782357) (0.728699) (0.737993)
Schools density
13.5792 91.1069 -38.0384 -1.16609
(0.839149) (0.278445) (0.705849) (0.969722)
Universities -0.05949 -0.06467 -0.0363 -0.03232 -0.028 -0.02878 0.00787 0.004551
(0.000001) (0.000001) (0.075448) (0.115746) (0.046101) (0.031619) (0.073544) (0.311637)
Service orientation
-0.24272 -0.51018 -0.29533 -0.44234 0.048203 0.040229 -0.06609 -0.08094
(0.049749) (0.00022) (0.074212) (0.00695) (0.44093) (0.513777) (0.032846) (0.010313)
Transfers 0.183033 1.9678 5.91944 4.71452 -1.53129 -1.92208 -0.4928 -0.39846
(0.929495) (0.395516) (0.026521) (0.086387) (0.000174) (0) (0.000413) (0.000839)
Debt burden -0.84482 0.49523 3.04952 0.847674
(0.684934) (0.903119) (0.527873) (0.282391)
Right-wing -0.22105 -0.95576 -0.62511 -0.05623
(0.424772) (0.061948) (0.184696) (0.652823)
Majority -0.47769 -0.34184 0.050266 0.084374
(0.206851) (0.659951) (0.953683) (0.3124)
Fragmentation -0.61131 -1.55274 0.807534 -0.74056
(0.640111) (0.522129) (0.723511) (0.161242)
Strongest party 1.19085 0.078074 2.79616 0.613665 0.699409 0.361631 1.10624 0.7253
(0.181193) (0.845772) (0.082727) (0.382271) (0.646479) (0.565051) (0.011247) (0.000006)
Constant 7.26258 5.72989 7.27499 7.76582 8.32443 8.37562 10.5179 8.12903
(0) (0) (0.00032) (0) (0.000006) (0) (0) (0)
Spatial lag of dependent
-0.0216 0.14807 0.02219 0.024108 0.109805 0.119401 0.089505 0.193296
(0.831992) (0.164168) (0.843952) (0.836078) (0.320227) (0.274674) (0.354118) (0.037472)
R-squared 0.4988 0.2887 0.3054 0.1998 0.3063 0.2793 0.5331 0.4695
Spatial error LM test (k=2)
1.607424 1.675306 0.121459 0.85382 0.085298 0.085215 0.904356 0.703927
(0.204854) (0.195549) (0.727457) (0.355474) (0.770241) (0.770351) (0.341616) (0.401467)
Spatial error LM test (k=4)
0.737256 0.26419 0.404129 0.453882 3.662345 2.190579 0.384855 0.157148
(0.390541) (0.607256) (0.524964) (0.500497) (0.055655) (0.138857) (0.535016) (0.691796)
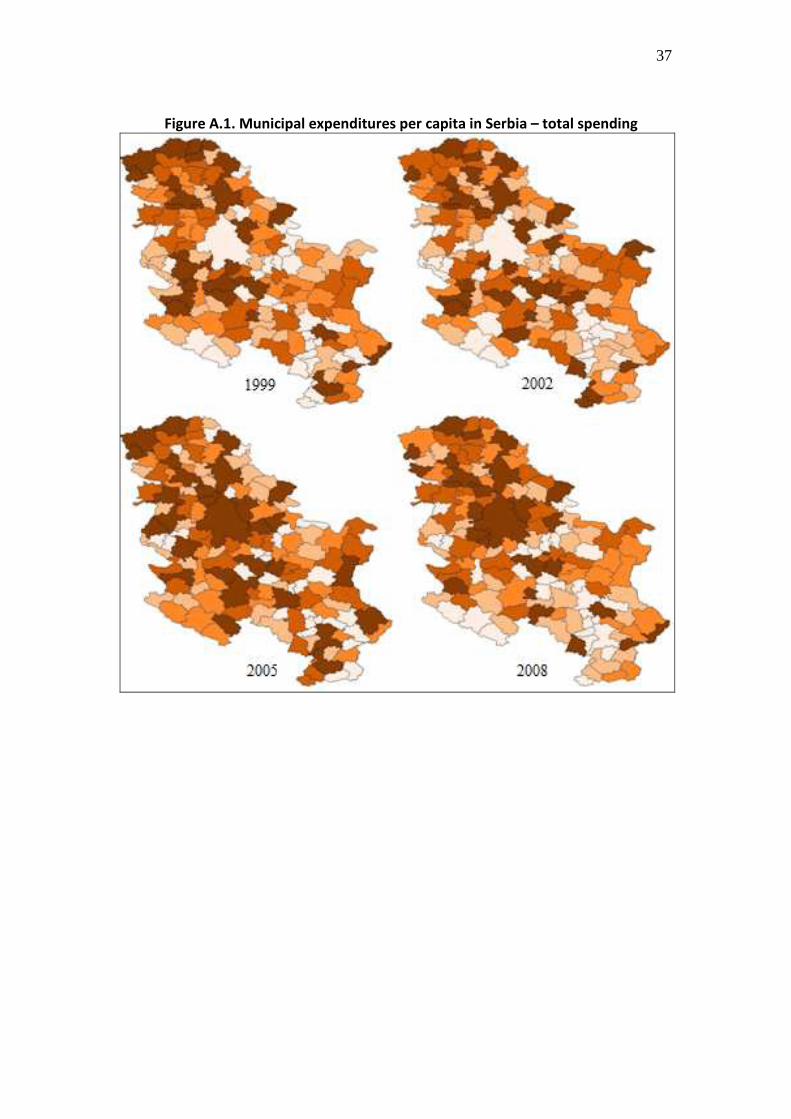
37
Figure A.1. Municipal expenditures per capita in Serbia – total spending
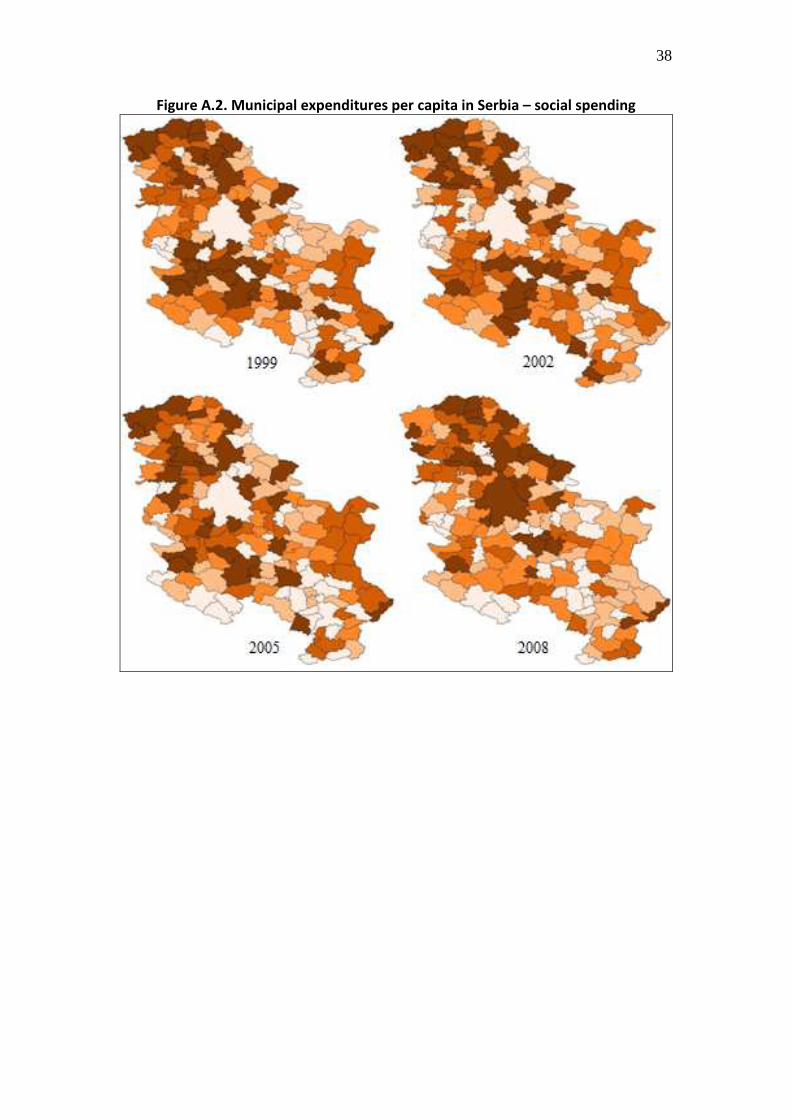
38
Figure A.2. Municipal expenditures per capita in Serbia – social spending