Embed Size (px)
Citation preview

Decentralized Energy Revolution
Implications for electricity supply industry
UNSW Seminar 22 October 2013
Kensington, NSW
Fereidoon P. Sioshansi
Menlo Energy Economics San Francisco CA
www.menloenergy.com

Pleased to be here, again
Annual pilgrimage to UNSW
Pleased to see familiar faces
Thanks to Iain MacGill & colleagues
Enjoy continued collaboration

This seminar?
Embarking on 8th book since 2006 Flavor of the book
Australia at the forefront

Sequel book, 2008


Smart Grid
Nov 2011

Energy Efficiency: Towards the end of demand growth

June 2013

Volume 8, July 2014
The rise of decentralized energy: What is at stake for the electricity supply industry?
Mostly focused on decentralized generation
Variety of perspectives
Global coverage with 3 key regions Germany
CA
Australia

Main message
ESI approaching a significant tipping point End of demand growth in sight?
For the first time in history, consumers may be able to generate cheaper than ESI can
Traditional business model “unsustainable”
Implications? For industry?
For consumers/prosumers?
For policymakers/politicians?

Limited so far
Currently applies to regions with High & rising retail tariffs
High & rising renewable targets
Generous/supportive self-generation policies
Germany, California & Australia
Speculation Trend will spread …
… and accelerate
It may be too late to do much about it
Disruptive technology

Outline
Electricity consumption
Renewables
Distributed energy resources
Rethinking business model
Discussion

1st
Electricity consumption falling
Why? Structural change
Demand approaching saturation
Negawatts cheaper than megawatts
Retail rates high/rising
Everything getting more efficient
Codes & standards matter
ZNE-type mandates prevalent

Structural reasons Economic growth sustained w minimal electricity growth
Source: U.S. Energy Information Administration, Annual Energy Outlook 2013 Early
Release
U.S. electricity use and economic growth, 1950-2040, percent
growth (3-year compound annual growth rate) and trend lines

Demand saturation How much more soda can Americans possibly drink?
Source: The Wall Street Journal, 19 Jan 2013

More cars than licensed drivers Vehicle ownership per 1,000 people, 1970-2030
Source: BP Energy Outlook 2030, Jan 2012

Negawatts cheaper than megawatts
* Includes current federal & state level incentives, natural gas price is assumed at $4.50/MMBTU
Source: US Renewable Energy Quarterly Report, ACORE, Oct 2010

Rising Residential Australian electricity prices
Source: ISF, NEM Report Card, 2011

More efficient Avg. US refrigerator is 3 times larger yet uses less electricity

Codes & standards matter Per Capita Electricity Consumption
0
2,000
4,000
6,000
8,000
10,000
12,000
14,000
16,000
1960
1962
1964
1966
1968
1970
1972
1974
1976
1978
1980
1982
1984
1986
1988
1990
1992
1994
1996
1998
2000
year
kW
h/p
ers
on
Red States 2004 Election
United States
Blue States 2004 Election
California
21 JOHN HOLGREN

Zero Net Energy How would it work? Consuming less, generating more
on-side electricity demand
zero net energy
distributed renewable generation

End of US demand growth? Energy efficiency “feasible & cost-effective”
Source: IEE white paper, May 2011

End of Oz demand growth? Elect. consumption in Australia’s NEM, 2005-12, in TWhrs
Source: AEMO data; graph courtesy of
greenmarkets.com.au

2nd
Renewables
Inevitable growth
Result: Depressing wholesale and rising retail prices
Growing headache for grid operators

Who’ll get there first? Renewable targets for selected countries*, current, 2020 and
2050 target as % of total generation
Source: New Scientist, 22 June 2013

Renewable Portfolio Standards
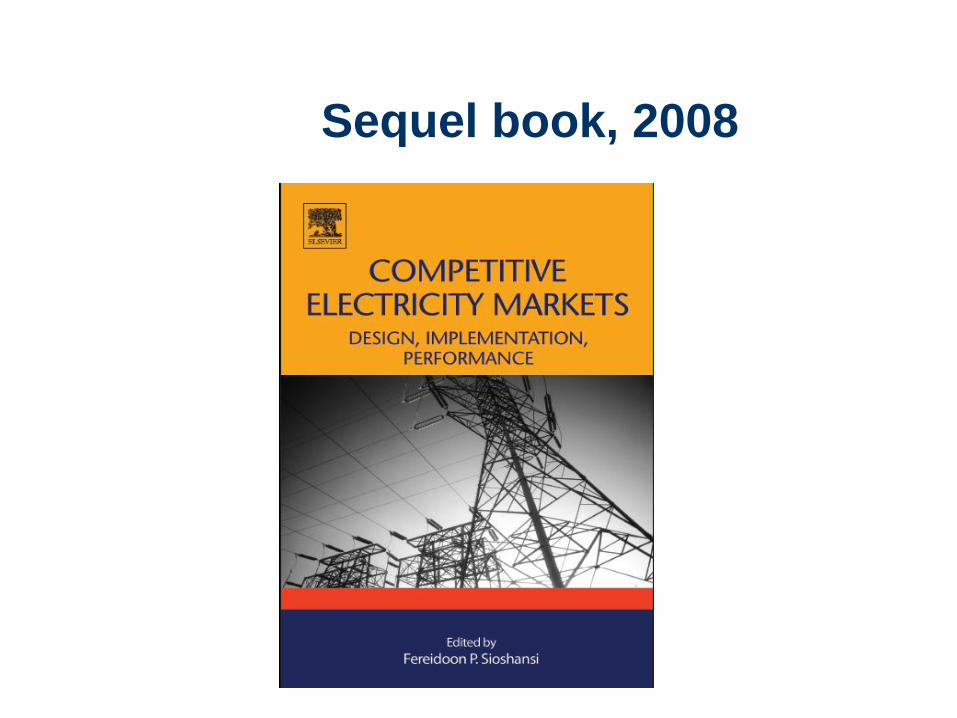
Rise of renewables New US capacity additions, 2006-12, in GW
Source: Energy Information Administration, Annual Electric Generator Report, Form
EIA-860
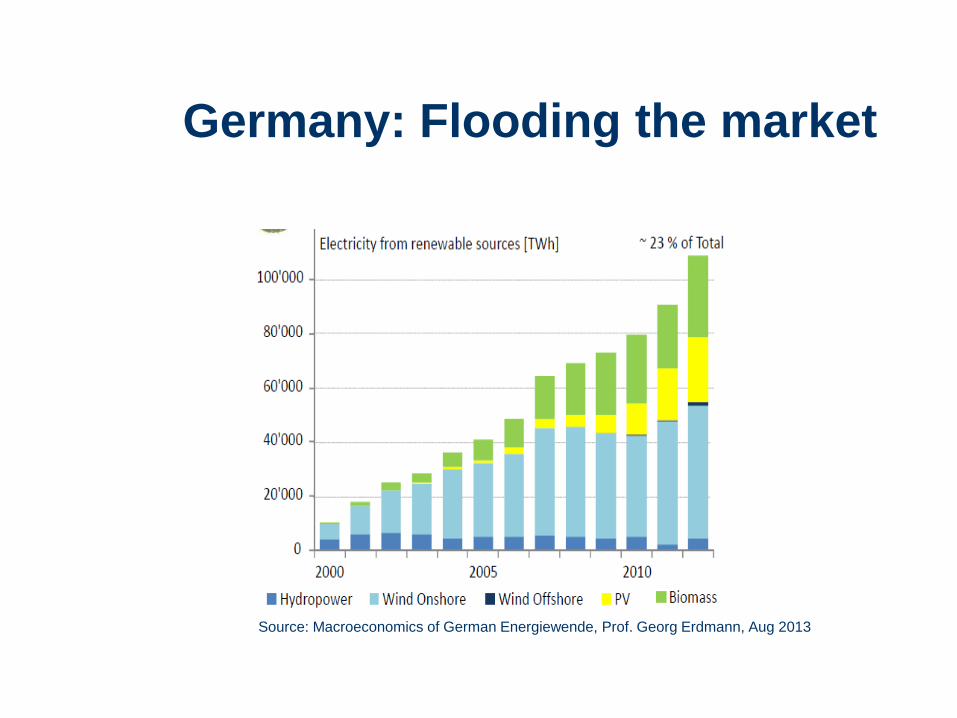
Germany: Flooding the market
Source: Macroeconomics of German Energiewende, Prof. Georg Erdmann, Aug 2013

Too much capacity
Source: Bundesnetzagentur

German renewable drag
Source: BDEW January 2013, preisvergleich, de, BDEW Emeuerbare Energien und
das EEG: Zahlen, Falden, Grafiken (2013)

3rd Distributed Energy Resources
e
First Customers don’t want/need energy but energy services
Second DER two sided coin
One side: energy efficiency
Other side: distributed generation
Third Sales fall if consumers use less &/or generate more

Why use less/generate more?
Why use less? Already covered
Why generate more? Grid parity is near or already here
Cost of self generation keeps falling
Retail tariffs high/rising
May become mandatory (e.g., city ordinances)

Solar PV prices keep falling Price of solar PVs, 1977-2013, in $/W

German solar grid parity
Source: Renewables: A rising power, Financial Times, 8 Aug 2013 based on data
from IHS Solar Demand Tracker

Solar PV installations
Source: Renewables: A rising power, Financial Times, 8 Aug 2013 based
on data from IHS Solar Demand Tracker

Doubled in 5 years Components of annual electricity bill in NSW, 2008 and 2013
Source: IPART, Review of regulated retail prices and charges for electricity 2013 to 2016, (2012).

14% penetration in QLD Cumulative installed capacity of solar PVs in Australia, 2001-2012, in MW
Source: Clean Energy Council of Australia

High cost states at parity

What makes DERs attractive? CA’s tiered rates
* SDG&E has slightly different rates for summer and winter, making it more complicated for consumers
** PG&E shows 5 tiers but the price for the top 2 tiers is shown as the same
Source: Utility websites
This is California: High consumption, rising rates CA’s current tiered residential rates, in cents/kWh

Sunny California
California Gov. envisions 12 GW of DG by 2025

California: More than half
Of 976 MW of new solar PV installations in 2nd Qtr. 2013, 53% was in California
Source: NPD Solarbuzz North America PV Markets Quarterly report

Net Energy Metering The battleground
Source: DSIRE USA
Net metering spreading across the land

US grid parity Energy Potential from Unsubsidized $3/W
Commercial Solar (Capacity and % of Sales)
Source Commercial Rooftop Revolution, Institute for Local Self-Reliance (ILSR), Dec 2012

Promise of solar grid parity?
Source: John Farrell, Renewable Energy World.com, 9 July 2013

Plenty of flat roofs for solar PVs Top 10 solar users in US, current installed capacity in MW
Source Wall Street Journal, 18 Sept 2013 based on data from Solar Energy Industries Assoc. (SEIA)

High & rising in EU Avg. residential electricity prices including taxes, 2012
Source VaasaETT

Going off-grid, one village at a time German “bio energy” villages
Source Utilities: Powerhouses of innovation, Eurelectric, May 2013

Disruptive technology?
Another Kodak analogy
Fight NEM laws tooth & nail
May not succeed
Reconsider rate design to accommodate growing DERs
Introduce dynamic prices for off-take/injection to grid
Will help, but may not be enough
Regulatory barriers, consumer resistance
Expand definition of service to include DERs
Industry not known for innovative thinking, decisive moves
It may be too late
“We did not get ahead of the game, it may be too late” EPRI’s Clark Gellings

Thank you
Happy to take questions