Embed Size (px)
Citation preview

Vol.:(0123456789)
Journal of Business Economics (2021) 91:253–282https://doi.org/10.1007/s11573-020-00999-7
1 3
ORIGINAL PAPER
Decentralized master production and recycling scheduling of lithium‑ion batteries: a techno‑economic optimization model
Christian Scheller1 · Kerstin Schmidt1 · Thomas Stefan Spengler1
Published online: 11 July 2020 © The Author(s) 2020
AbstractDue to the rapid growth of e-mobility, increasing amounts of lithium-ion batteries are produced and returned after their lifetime. However, these returns will lead to new challenges for manufacturers and recyclers, considering the end-of-life. Espe-cially the increasing interaction between forward and reverse supply chain and the related decision on the end-of-life options (e.g., recycling, remanufacturing, and reuse) need to be planned and executed in a sophisticated way. Therefore, we focus on the interactions between recycler and manufacturer as two of the major actors of each supply chain. We formulate optimization models for the master recycling scheduling and the master production scheduling. To analyze current decentralized decisions of the recycler and remanufacturer, we further formulate an integrated master production and recycling scheduling model. In the following, we describe the production and recycling of lithium-ion batteries in a case study. Here, we exam-ine five different scenarios. We find that for all scenarios, manufacturer and recycler achieve positive contribution margins. However, inefficiencies always occur due to opportunistic behavior. As a result, reuse is performed only in case of centralized planning. Hence, coordination is needed between the forward and reverse supply chain to achieve the maximal contribution margin.
Keywords Closed-loop supply chain · Production planning · Recycling planning · Master production scheduling · Lithium-ion battery
JEL Classification M11 · Q53 · C61
* Christian Scheller [email protected]
1 Chair of Production and Logistics, Institute of Automotive Management and Industrial Production, Technische Universität Braunschweig, Braunschweig, Germany

254 C. Scheller et al.
1 3
1 Introduction
The recycling of lithium-ion batteries (LIBs) is an essential step towards sus-tainable mobility as it can recover the scarce resources used in LIBs of electric vehicles (EVs), such as lithium, nickel, and cobalt. Hence, recycling is capable of reducing the economic, ecological, and social impacts caused by the mining of raw materials and the production of the LIBs. Since take-back and recycling of LIBs are not always economically beneficial, the European Union passed the DIRECTIVE 2006/66/EC to ensure a battery recycling. The directive obliges manufacturers to ensure a cost-free take-back of spent LIBs as well as the best available treatment and recycling considering minimum recycling efficiency. Manufacturers transfer the operations and obligations to third party recyclers, who provide the take-back, treatment, and recycling. Therefore, these recyclers operate independently, and complex networks with specialized actors for the dif-ferent tasks result.
Shortly, manufacturers and recyclers will face three main challenges. First, stricter requirements for the recycling are likely since experts request for changes in the DIRECTIVE 2006/66/EC regarding increasing minimum recycling effi-ciency as well as material specific obligations (Öko-Institut 2018). These obliga-tions will require the recyclers to improve their current recycling efficiency of at least 50% up to 65–75% and ensure material specific recycling efficiencies for lithium and other materials. Similar obligations already exist for lead-acid and nickel–cadmium batteries. This will also result in uncertainties regarding the technologies and achievable recycling yields. Second, demand and therefore return quantities are rising quickly as can be observed in the increase of new reg-istrations of EVs in Europe by 3.128% between 2011 and 2019 (European Alter-native Fuels Observatory 2020). Regional law likely intensifies this trend. For example, the Lower Saxony climate protection law will require public governance to achieve zero-emission vehicle fleets until 2030 (Mlodoch 2019). This law will increase regional demands for EVs and hence local return quantities. Third, man-ufacturers face uncertain raw material prices and supply risks for battery mate-rial, especially cobalt and natural graphite (European Union 2017).
Against this background, recyclers, as well as manufactures, show a further interest and necessity in the recycling of LIBs. This results in increased interac-tions between forward and reverse supply chains, such as the transfer of recy-cled battery materials towards the manufacturer for the production of new battery cells. Therefore, improved coordination between the independent actors of for-ward and reverse supply chain, especially the recycler and manufacturer, is gain-ing importance to ensure efficient recycling of LIBs. Affected planning tasks in short- to mid-term planning are the master production (and recycling) scheduling and the lot-sizing and scheduling (Stadtler et al. 2015).
In the master scheduling, the recycler needs to decide which products they create using the returns as an input to their processes. The variety of fabricable products increases with the opportunity of remanufacturing spent LIBs. For LIBs, demand and achievable prices of the created products are the primary influence
255
1 3
Decentralized master production and recycling scheduling…
on this decision. Hence, the related end-of-life (EOL) options, such as disassem-bly, recycling, and remanufacturing, are highly influenced (Mayyas et al. 2019). Since the recycler usually has no direct connection to customers, the manufactur-ers are the source of demand for recycled materials and remanufactured products. Based on the demand for batteries, the manufacturer decides which products they produce and if they use secondary products from the recycler or primary products from other suppliers. Each independent actor carries out master recycling and production scheduling individually. Such decentralized, uncoordinated planning in supply chains usually leads to inefficiencies due to a lack of consideration of the decision making of the other companies (Voigt and Inderfurth 2011).
For the adequate master recycling and production scheduling of LIBs, we for-mulate mathematical optimization models, which consider the special requirements such as minimum recycling efficiency. Based on these models, this contribution aims to answer the following questions in the context of LIBs:
1. How can legal requirements like minimum recycling efficiency and multiple end-of-life options for spent lithium-ion batteries be integrated into optimization models for the master production and recycling scheduling?
2. How do different developments of material prices, demand, and technology influ-ence the recycling and production planning of lithium-ion batteries?
3. What effect does the decentralization of decisions have on the production and recycling plans?
The remainder of this paper is structured as follows: In Sect. 2, approaches for master recycling and production scheduling from the literature are analyzed. In Sect. 3, the planning models for decentralized and centralized master production and recycling scheduling of lithium-ion batteries are formulated. In Sect. 4, deficits in decentralized planning are shown based on a case study. The centralized planning case serves as a benchmark. In Sect. 5, a conclusion, as well as an outlook on further research, are given.
2 Literature review
The master production scheduling (MPS) defines production plans for product fam-ilies or products regarding fluctuating demands (Stadtler et al. 2015). The aim is the optimal use of the available capacities, which were planned and implemented in strategic and, thus, long-term planning. Since the MPS aims to balance the demand and available capacities, the results of demand planning and forecasting influence the MPS. In return, the resulting plans determine purchased parts for the materials requirement planning and the production volume for the lot sizing. For the MPS, different mathematical optimization models can be found in the literature of which most contribute to linear programming, integer linear programming, and mixed-inte-ger linear programming (Díaz-Madroñero et al. 2014).
256 C. Scheller et al.
1 3
Basic models for the MPS, such as the model of Bichler (1970), consider a sin-gle-period single-stage case. Since practical examples usually contain many differ-ent stages with a planning horizon from a few months up to one year, many exten-sions exist. Hence, contributions consider multi-period multi-stage models (e.g., Akhoondi and Lotfi 2016). Furthermore, the integration of capacity restrictions is the state of the art of MPS models. In this context, the decision on the amount of stored products needs to be made in order to be able to meet demand (e.g., Engl-berger et al. 2016). Additional adjustments, such as quality issues, rework, and uncertain demand, can be found in different models. For example, Caner Taşkın und Tamer Ünal (2009) describe an MPS model for the float glass industry in which they face the problem of different product qualities and the downgrade substitution of higher qualities to meet demand. Inderfurth et al. (2005) integrate the aspect of the rework of rejects into the MPS. Currently, many models focus on existing uncer-tainties in tactical and operational planning. Especially, uncertainties regarding the demand are in focus. Further aspects of different approaches can be found in Díaz-Madroñero et al. (2014).
Considering the EOL, the planning task of master scheduling differs from the production for three main reasons. First, the quantity of input (returns) is usually finite and sometimes predefined by (legal) requirements. Therefore, the input influ-ences the decisions much more than in the MPS. Second, the variety of processes increases rapidly since many different options occur in the EOL. These include dis-assembly, recycling, refurbishment, remanufacturing, reuse, and disposal. This vari-ety results in further decisions to be made regarding the assignment of options to returned products. Third, the processes of disassembly and recycling are diverging. Such process structures only occur in joint production. In the following, we regard these planning tasks as master recycling scheduling (MRS).
In this context, a variety of approaches exists, usually referring only to a selection of different EOL options. One of the first approaches was the integrated disassem-bly and recycling planning by Spengler (1994). A variety of approaches consider the integrated manufacturing and remanufacturing planning (e.g., Chang et al. 2015; Liu et al. 2019). Han et al. (2016) extend these approaches by adding the disassem-bly of returns in advance of the remanufacturing, although no decision on the disas-sembly activity is made. An explicit consideration of disassembly, remanufacturing, and manufacturing with external recycling can be found in Steinborn (2011).
Since quality has a significant influence on the disassembly, recycling, remanu-facturing, and refurbishment processes as well as the demand for products, different approaches include the quality of products. Nevertheless, some approaches do not take the quality into account, because there is a negligible influence for the applica-tion (e.g., Polotski et al. 2017; Subulan and Tasan 2013; Sun et al. 2017). Widely spread is the differentiation into two quality levels: Liu et al. (2019), as well as Wang et al. (2017), describe models which consider a different demand for new and reman-ufactured products. Kwak and Kim (2017) take into account that returns can either be of good or poor quality. A few models integrate discrete quality levels. Niknejad and Petrovic (2014) formulate a model with two phases. In the first phase, an inspec-tion of the returns is carried out using different quality levels to assign the returns to either disposal or remanufacturing. In the second phase of remanufacturing, quality
257
1 3
Decentralized master production and recycling scheduling…
issues are no longer taken into account. A special case is given by Steinborn (2011), since discrete quality levels are introduced over the whole process, affecting returns, operations, and demand.
Due to quality dependent demand, substitution between qualities is needed because it may be beneficial to meet the demand, although the available quality out-performs the required quality. Therefore, Wang et al. (2017) describe the substitution of new products for remanufactured products. Steinborn (2011) considers a discrete number of qualities. Hence, a discrete number of substitution activities is described.
Since some industries face take-back requirements and uncertain product life-times, return quantity, return quality, and return time, returns can be fixed or vari-able as well as certain or uncertain. Chang et al. (2015), as well as Polotski et al. (2017), describe fixed (externally given) returns, which are considered to be certain. Different approaches also regard fixed returns but assume them to be uncertain (e.g., Niknejad and Petrovic 2014; Xu et al. 2012). Furthermore, various contributions use variable returns with a certain or uncertain outcome (e.g., Chen and Abrishami 2014; Han et al. 2016).
At least the required recycling efficiency is one of the primary reasons for recy-cling. Therefore, some approaches integrate it in the planning. Walther et al. (2009) describe the coordination of the MRS in recycling networks of waste electric and electronic equipment under minimum recycling quotes. Hoyer et al. (2015) formu-late a technology and capacity planning model for the recycling of lithium-ion bat-teries influenced by recycling efficiencies.
Additionally to the planning problem of MPS and MRS, coordination will be needed, because presumably, a decentralized, uncoordinated planning will show inefficiencies due to opportunistic behavior. Different approaches already contribute to this problem focusing mostly on a simple, two-tier supply chain (e.g., Krapp and Kraus 2017). As shown, various contributions to the problem of MPS and MRS can be found in the literature. In terms of the master production and recycling schedul-ing of LIBs, none of them include all necessary constituents (integration of all pos-sible EOL options; return, processes, and demand effected by the product quality; substitution between quality levels; external given return; consideration of recycling efficiencies). Therefore, in the next section, we present new models for MPS and MRS.
3 Problem formulation
3.1 Setting
Since manufacturer and recycler are independent actors, each of them carries out the MPS, respectively MRS individually, facing different internal and external restric-tions. To create optimal production or recycling plans, we develop different linear programming models for the MPS and MRS. For the modeling of the material flows regarding multiple products p ∈ P , we use the activity analysis of Koopmans et al. (1951) and Debreu (1959). It enables a generic modeling, which makes the model feasible for multiple applications. Our modelling approach of multi-product material

258 C. Scheller et al.
1 3
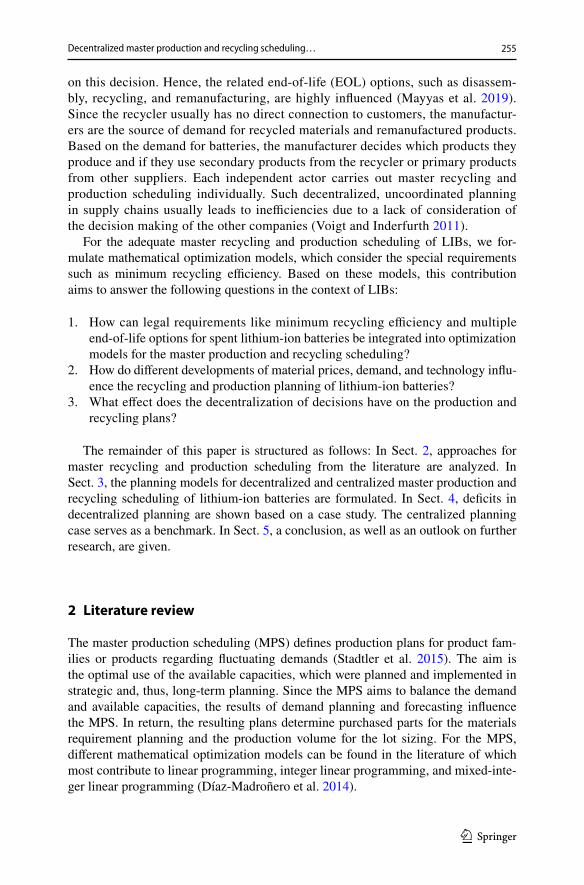
flows using the activity analysis are based on different approaches, e.g., Hoyer et al. (2015), Walther et al. (2009), and Spengler (1994). In the following, we will formu-late the concept of the decentralized master production and recycling scheduling, focusing on the decisions to be made. We start with inter-company connections/con-nections between MPS and MRS (see Fig. 1).
The demand for each product and quality is forecasted in the demand planning. The results of this planning task serve as input for the master scheduling. There-fore, in each period t ∈ T , the manufacturer faces a deterministic demand yN
tpq for
final products p ∈ PP of sales quality q ∈ QQV . However, sales yPtpq
do not need to meet demand because some demand may result in low revenues or even loss (e.g., demand for low-quality products) and thus is not beneficial from an economic per-spective. To meet demand, a manufacturer has two options to gain raw material p ∈ PR , components p ∈ PC , or even final products p ∈ PP . First, they can procure raw material and components from a primary supplier yZ
tpq . Second, they can procure
raw material, components, or even final products from a secondary supplier (recy-cler) y2
tpq . Using the procured raw materials and components, they can then fabricate
the products on their own by the production activities n ∈ N . Since the manufac-turer can produce or buy the final products, they face a make-or-buy decision. Fur-thermore, they can substitute between quality levels by substitution activity s ∈ S in order to meet low quality demand with high quality products.
According to the manufacturer, the recycler faces deterministic demand yNtpq
and deterministic returns yG
tpq . The demand of the recycler yN
tpq is mainly influenced by
the secondary supply of the manufacturer y2tpq
but also by external customers (e.g., other recyclers). Thus, the recycler faces the challenge to balance deterministic returns and demand under consideration of legal obligations regarding minimum recycling efficiency rmin and disposal prohibition. To provide the products for sale
Sour
ce: r
etur
ns, s
uppl
ies
Manufacturer
Sink: sales (customers and further recyclers), disposal
Recycler
System boundary: centralized planning case
Produc�on ac�vity
Remanufacturing ac�vity
Recycling ac�vity Disassembly ac�vity returns
supply
supply
recycler:sales
manufacturer:supply EoL
recycler:supply
manufacturer:sales
sales
sales
disposal
Fig. 1 Inter-company connections between manufacturer and recycler as well as their suppliers and cus-tomers
259
1 3
Decentralized master production and recycling scheduling…
yPtpq
and fulfill the obligations, the recycler has a variety of options to gain, process, and hand over products. To gain products, the recycler must accept the returned products yG
tpq in return qualities q ∈ QQG . Additionally, they can procure raw materi-
als and components from the primary suppliers (manufacturer and further suppli-ers) yZ
tpq . For processing, the recycler can disassemble, recycle, remanufacture, and
substitute products. Disassembly activities j ∈ J are needed to either regain com-ponents for the remanufacturing or as preparation for the recycling. After the disas-sembly, recycling activities u ∈ U can regain raw materials p ∈ PR and recycling residues p ∈ PRR from the battery packs. Additionally to disassembly and recycling, the recycler can remanufacture returned products by activities l ∈ L . In order to reuse components or products of return qualities q ∈ QQG , they can substitute prod-ucts in between certain qualities by activities s ∈ S . For the handover of products, the recycler can either sell products to the manufacturer and further recyclers or dis-pose products.
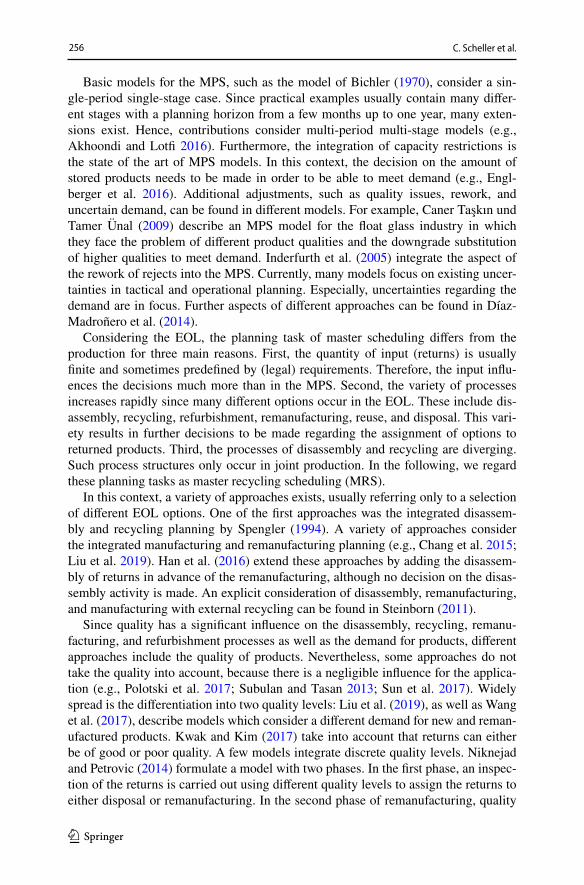
On the intra-company level, further decisions need to be made regarding the exe-cution of activities. The manufacturer as well as recycler divide their production sys-tem, respectively recycling system, into different segments i ∈ I . In each segment, different activities are executable. Since the structure of a segment is mostly the same, the following generic segment (see Fig. 2) fits both manufacturer and recycler. Each segment has different outputs and inputs. Furthermore, the different activities can transform products in a segment.
To fulfill customers’ or segments’ demands, different activities, such as disassem-bly, recycling, remanufacturing, and substitution, are executable in each segment. The segments of the producer can execute different manufacturing activities of which only a discrete set n ∈ Ni is executable in a segment i . The quantity of manu-facturing activity executions �tqn is only limited by the technical capacity of a seg-ment CT
it . On the other hand, the segments of the recycler can execute disassembly,
recycling, and remanufacturing activities of which only a discrete set is executable in the segment i ( j ∈ Ji, u ∈ Ui, l ∈ Li ). According to manufacturing, the number of activity executions ( �tj, �tu, �tl ) is limited by the technical capacity. Furthermore, in a segment i of the producer or recycler substitution between quality levels can be exe-cuted by the executable activities s ∈ Si in an unbounded quantity of executions �tps . Besides, each segment can store products yL
itpq until the inventory capacity CL
it is
reached.
Segment
supplies
transportation
returns transportation
supplies EoL
disposal
sales stock
executable ac�vi�es in segment
number of ac�vity execu�ons
Fig. 2 Input, activities, and outputs of the considered generic segment

260 C. Scheller et al.
1 3
Each segment has four kinds of input and three kinds of output at the most. Trans-portation between the segments can be an input but also output and is realized by the transportation activities w ∈ W . In doing so, each transportation activity connects one segment to another. Hence, each transportation activity is one-way. Further-more, the number of transported products �tpqw is unbounded. Finally, each intra-company connection needs to be allocated to a segment. Therefore, returns, primary supplies, and secondary supplies are split down into segment-specific inputs ( yGS
itpq, yZS
itpq, y2S
itpq ). The same process needs to be conducted for disposal and sales
( ySEitpq
, ySPitpq
), which serve as outputs.Regarding the connections between the companies, we assume the following
sequence of events:
1. The manufacturer executes their MPS, considering an infinite supply. Afterward, they transfer the requested quantity of secondary products y2
tpq to the recycler.
2. The recycler then executes their MRS, considering the demand by the manufac-turer as well as further demand for recycling residues and materials of low quality ( q ≠ new ). Afterward, they transfer information about available products to the manufacturer.
3. The manufacturer executes their MPS again, considering limited secondary sup-ply.
According to the concept, we formulate the models under consideration of the assumptions and notation, which are given in Sect. 3.2.
3.2 Assumptions and notation
For the model formulation, we make the following assumptions.
1. Only products in return qualities q ∈ QQG can be recycled.2. By disassembling a product in return quality q ∈ QQG only products in return
qualities q ∈ QQG are recovered. This principle also counts for products of sales quality q ∈ QQV.
3. A product of sales quality q ∈ QQV cannot reach return quality q ∈ QQG by any activity.
For the model formulation of the MPS, MRS, and the integrated master produc-tion and recycling scheduling (IMPRS), we will use the following notation:
1 Sets and indices
t Periods ( t = 1,… , T).p Products ( p = 1,… ,P).q Quality ( q ∈ QQG ∪ QQV).

261
1 3
Decentralized master production and recycling scheduling…
i Segments ( i = 1,… , I).n Production activities ( n = 1,… ,N).j Disassembly activities ( j = 1,… , J).u Recycling activities ( u = 1,… ,U).l Remanufacturing activities ( l = 1,… , L).s Substitution activities ( s = 1,… , S).w Transportation activities between two segments i ( w = 1,… ,W).Ni, Ji,Ui, Li, Si Sets of executable activities in segment i.PC Components ( p ∈ PC).PR Raw materials ( p ∈ PR).PBG Products, which may not be disposed of due to legal obligations
( p ∈ PBG).PZ Components, which may be procured by the recycling company
( p ∈ PZ).QQG Return qualities ( q ∈ QQG).QQV Sales qualities ( q ∈ QQV).
1 Parameter
yNtpq
Demand for product p of quality q in period t.yGtpq
Return of product p of quality q in period t.y2,maxtpq Maximal quantity of secondary supply of product p of quality q in
period t.hpn Production activity vector h : consumption and creation of products p
by production activity n.vpqj Disassembly activity vector v : consumption and creation of products
p of quality q by disassembly activity j.opqu Recycling activity vector o : consumption and creation of products p
of quality q by recycling activity u.rpql Remanufacturing activity vector r : consumption and creation of
products p of quality q by remanufacturing activity l.eqs Substitution activity vector e : substitution from a quality q to another
quality q by substitution activity s.aiw Transportation activity vector a : transportation between two seg-
ments i by transportation activity w.aepq Sales revenues per product p of quality q.kZtpq
Material costs in period t for product p of quality q from the primary supply.
k2tpq
Material costs in period t for product p of quality q from the second-ary supply.
kEtpq
Disposal costs in period t for product p in quality qkLitpq
Inventory holding cost in segment i in period t for product p in qual-ity q

262 C. Scheller et al.
1 3
kHtn
Production costs in period t per production activity n.kDtj
Disassembly costs in period t per disassembly activity j.kRtu
Recycling costs in period t per recycling activity u.kAtl Remanufacturing costs in period t per remanufacturing activity l.
CTit Available technical capacity of segment i in period t.
CLit Available inventory capacity of segment i in period t.
cMn, c
D
j, cR
u, cA
l Technical capacity coefficients of the activities ( n, j, u, l).
cLipq
Inventory capacity coefficients of product p of quality q in segment i.rmin Minimum recycling efficiency.AFp Share of a recycled product p approved to be recycled.
1 Variables
yGSitpq
Products p of quality q allocated from the return into segment i in period t.yGEtpq
Products p of quality q allocated from the return directly to disposal.ySPitpq
Products p of quality q provided in period t from segment i for demand service.
yZSitpq
Products p of quality q allocated in period t from the primary supply into segment i.
y2Sitpq
Products p of quality q allocated in period t from the secondary supply into segment i.
ySEitpq
Products p of quality q allocated from segment i to disposal in period t.yLitpq
Products p of quality q stored in period t in segment i.yPtpq
Total products p of quality q provided in period t for demand service.yZtpq
Total products p of quality q procured in period t from the primary supply.y2tpq
Total products p of quality q procured in period t from the secondary supply.yEtpq
Total products p of quality q disposed of in period t.�tqn Number of executions of production activity n of quality q in period t.�tj Number of executions of disassembly activity j in period t.�tu Number of executions of recycling activity u in period t.�tl Number of executions of remanufacturing activity l in period t.�tps Number of executions of substitution activity s for product p in period t.�tpqw Number of executions of transportation activity w for product p of quality q
in period t.
3.3 Model formulation
3.3.1 Decentralized master production scheduling
In the following, we formulate the optimization model for the decentralized MPS. The objective of the producer is to maximize their contribution margin because both reve-nues and costs are variable and are influenced by the planning. The related objective

263
1 3
Decentralized master production and recycling scheduling…
function (1) consists of the revenues and four different categories of costs over all seg-ments, periods, products, qualities, and production activities. First, revenues arise from sold products yP
tpq evaluated by the corresponding revenue aetpq . Second, material
costs from primary supply arise from the procured products yZtpq
evaluated by the cor-responding procurement cost yZ
tpq . Third, material costs from secondary supply arise
from the procured products y2tpq
evaluated by the corresponding procurement cost y2tpq
. Fourth, inventory holding costs arise from the stored products yL
itpq evaluated by the
corresponding inventory holding cost kLitpq
. Fifth, production costs arise from the exe-cuted production activities �tqn evaluated by the corresponding production cost kH
tn.
Since different internal and external restrictions need to be considered in the MPS, the following constraints limit the solution space:
Transformation and inventory restriction (2): all inputs, transformation, and out-puts in each segment i of each product p of quality q in period t need to be balanced. Inputs are the inventory of the previous period yL
it−1pq as well as the segment specific
primary and secondary supplies ( yZSitpq
, y2Sitpq
). Outputs are the segment specific sales yZSitpq
and the inventory at the end of the period yLitpq
. Activities serve as both input and output. We consider the production of products, the substitution between quali-ties, and transportation between segments. Inputs and outputs of activities are calcu-lated by multiplying the activity vector ( hpn, eqs, aiw ) with the number of executions ( �tqn,�tqs, �tpqw ). However, only a discrete set of production and substitution activi-ties ( n ∈ Ni, s ∈ Si ) can be executed in each segment i.
Primary supply assignment restriction (3): each product procured from the primary supply needs to be allocated to exactly one segment. Therefore, the quantity of total pri-mary supply yZ
tpq needs to be equal to the sum of segment-specific primary supply yZS
itpq.
Primary supply product restriction (4): since manufacturers produce the final products themselves, they do not buy final products from the primary supply. Fur-thermore, they are not allowed to handle recycling residues due to legal regula-tions. Therefore, primary supplies yZ
tpq except for components and raw materials
p ∉ PC ∪ PR must be zero.
Primary supply quality restriction (5): only new products ( q = 1) can be procured from the primary supply yZ
tpq because all low-quality products ( q ≠ 1) are procured
from the secondary supply.
(1)
Max∑
i
∑
t
∑
p
∑
q
∑
n
(
aetpq ⋅ yPtpq
− kZtpq
⋅ yZtpq
− k2tpq
⋅ y2tpq
− kLitpq
⋅ yLitpq
− kHtn⋅ �tqn
)
(2)yLitpq
= yLit−1pq
+ yZSitpq
+ y2Sitpq
− ySPitpq
+∑
n∈Ni
hpn ⋅ �tqn +∑
s∈Si
eqs ⋅ �tps + ∀ i, t, p, q
(3)yZtpq
=∑
i
yZSitpq
∀ t, p, q
(4)yZtpq
= 0 ∀ t, p ∉ PC⋃
PR, q

264 C. Scheller et al.
1 3
Secondary supply assignment restriction (6): according to the primary supply, each product procured from the secondary supply (recycler) is assigned to exactly one segment. Hence, secondary supply y2
tpq needs to be equal to the sum of segment-
specific secondary supply y2Sitpq
.
Secondary supply product restriction (7): the product variety, which can be pro-duced from the secondary supply is limited.”New” final products and components cannot be procured from the secondary supply. However, raw materials from the recycling might achieve battery grade, and hence the quality level “new”. Therefore, all products except raw materials p ∉ PR cannot be procured from the secondary supply y2
tpq in the quality “new” ( q = 1).
Secondary supply quantity restriction (8): the secondary supply is limited after the answer from the recycling containing the deliverable products. Hence, only a finite quantity of products y2,maxtpq can be procured from the secondary supply y2
tpq.
Sales quantity restriction (9): all products to be sold yPtpq
need to be allocated from a segment i into sales ySP
itpq.
Demand quantity restriction (10): since demand may outreach the capacity or some demand results in a loss, the sales do not need to meet demand entirely. How-ever, sales also must not outreach demand. Therefore, the sales yP
tpq must be less or
equal to the demand yNtpq
.
Technical capacity restriction (11): each segment i is only able to execute activi-ties to a certain capacity CT
it . Hence, each execution loads the capacity of a segment.
The capacity of a segment displays the bottleneck resource of a segment. We assume that precisely one bottleneck resource limits the executable activities in a segment (e.g., disassembly specialists). The used capacity is calculated by multiplying the capacity load factor cH
n with the decision variable for the number of manufacturing
activity executions �tqn . Again, only a discrete set of production activities n ∈ Ni can be executed in each segment i and hence, load on the capacity.
(5)yZtpq
= 0 ∀ t, p, q ≠ 1
(6)y2tpq
=∑
i
y2Sitpq
∀ t, p, q
(7)y2tpq
= 0∀ t, p ∉ PR, q = 1
(8)y2tpq
≤ y2,maxtpq
∀ t, p, q
(9)yPtpq
=∑
i
ySPitpq
∀ t, p, q
(10)yPtpq
≤ yNtpq
∀ t, p, q

265
1 3
Decentralized master production and recycling scheduling…
Inventory capacity restriction (12): the inventory capacity limits the inventory of a segment CL
it . According to the inventory capacity coefficient cL
ipq , each product in
the inventory yLitpq
has a different load on the inventory capacity.
Non-negativity restriction (13): All decision variables, including material flows and activities, are non-negative.
3.3.2 Decentralized master recycling scheduling
According to the MPS, the objective of the MRS is the maximization of the contri-bution margin over all segments, periods, products, qualities, disassembly activities, recycling activities, and remanufacturing activities. The objective function (14) is divided into revenues and different categories of costs. First, revenues, material costs from primary supply, and inventory holding costs are calculated according to the contribution margin in the MPS (1). Second, disposal costs arise from the dis-posed products yE
tpq evaluated by the corresponding disposal cost kE
tp . Third, disas-
sembly costs arise from the executed disassembly activities �tj evaluated by the cor-responding disassembly cost kD
tj . Fourth, recycling costs arise from the executed
recycling activities �tu evaluated by the corresponding recycling cost kRtu
. Fifth, remanufacturing costs arise from the executed remanufacturing activities �tl evalu-ated by the corresponding remanufacturing cost kA
tl.
Transformation and inventory restriction (15): the inventory of segment i in period t of product p of quality q consists of the inputs, outputs, and transformation of products by the activities. According to the MPS, the inventory of the previous period yL
it−1pq ,
segment specific primary supplies yZSitpq
, inventory at the end of the previous period yLit−1pq
, and transportation between the segments ( aiw ⋅ �tpqw ) serves as inputs and out-puts of a segment. The differentiation is necessary because of returns, disposal, and dif-ferent activities. Returns allocated from return into the segment yGS
itpq serve as input, dis-
posed products from a segment ySEitpq
serve as output. Further, disassembly, recycling, remanufacturing (includes refurbishment), and substitution are considered. Inputs and outputs of activities are calculated by multiplying the activity vector ( vpqj, otpqu, rpql, eqs ) with the number of executions of each activity ( �tj, �tu, �tl,�tps ). We cumulate over the activities which are executable in a segment ( j ∈ Ji, u ∈ Ui, l ∈ Li, s ∈ Si).
(11)CTit≥∑
q
∑
n∈Ni
cHn⋅ �tqn ∀ i, t
(12)CLit≥∑
p
∑
q
cLipq
⋅ yLitpq
∀ i, t
(13)yPtpq, yZ
tpq, y2
tpq, ySP
itpq, yZS
itpq, y2
itpq, yL
itpq, �tpqw,�tps, �tqn ≥ 0 ∀ i, t, p, q,w, n
(14)
Max∑
i
∑
t
∑
p
∑
q
∑
j
∑
u
∑
l
(
aetpq ⋅ yPtpq
− kZtpq
⋅ yZtpq
− kLitpq
⋅ yLitpq
− kEtp⋅ yE
tpq− kD
tj⋅ �tj − kR
tu⋅ �tu − kA
tl⋅ �tl
)

266 C. Scheller et al.
1 3
Return assignment restriction (16): since recyclers need to take back all returns, they only decide whether to handle or dispose of them. Therefore, each returned product yG
tpq is allocated to a segment yGS
itpq or gets directly disposed of yGE
tpq.
The primary supply assignment restriction for the MRS is formulated according to the restriction of the MPS (3).
Primary supply product restriction (17): as described, only some products, which are necessary for either recycling or remanufacturing, can be procured. Therefore, only a set of products p ∈ PZ can be procured from the primary supply.
The primary supply quality restriction, sales quantity restriction, and demand quantity restriction for the MRS are formulated according to the restrictions of the MPS (5), (9), and (10).
Disposal quantity restriction (18): to evaluate the disposal costs, all disposed products are added up. Hence, the sum of disposed products yE
tpq must equal the sum
of products allocated from a segment to disposal ySEitpq
and the directly disposed prod-ucts yGE
tpq.
Disposal prohibition restriction (19): according to European law some prod-ucts p ∈ PBG may not be disposed of. For example, according to the DIRECTIVE 2006/66/EC, recyclable LIBs may not be disposed of, although this might have a negative economic impact.
Technical capacity restriction (20): according to the MPS, each segment has a specific bottleneck resource, which limits the output of a segment. However, differ-ent activities load on the technical capacity CT
it . Therefore, each execution loads the
capacity of a segment. The used capacity is calculated by multiplying the capacity load factor for disassembly, recycling, and remanufacturing ( cD
j, cR
u, cA
l ) with the
decision variable for the corresponding activity executions ( �tj, �tu, �tl ). According to the MPS, only a discrete set of activities ( j ∈ Ji, u ∈ Ui, l ∈ Li ) can be executed in each segment i and load on the capacity.
(15)
yLitpq
= yLit−1pq
+ yGSitpq
+ yZSitpq
− ySPitpq
− ySEitpq
+∑
j∈Ji
vpqj ⋅ �tj +∑
u∈Ui
otpqu ⋅ �tu
+∑
l∈Li
rpql ⋅ �tl +∑
s∈Si
eqs ⋅ �tps +∑
w
aiw ⋅ �tpqw ∀ i, t, p, q
(16)yGtpq
=∑
i
yGSitpq
+ yGEtpq
∀ t, p, q
(17)yZtpq
= 0 ∀ t, p ∉ PZ, q
(18)yEtpq
=∑
i
ySEitpq
+ yGEtpq
∀ t, p, q
(19)yEtpq
= 0 ∀ t, p ∈ PBG, q

267
1 3
Decentralized master production and recycling scheduling…
Inventory capacity restriction for the MRS is formulated according to the restric-tion of the MPS (11).
Recycling efficiency (21): to ensure recycling complies to current law, a mini-mal recycling efficiency rmin needs to be achieved when recycling a product. For a better understanding, the restriction is separated into two parts. The recycling input yInputRecycling
t describes the total mass per period, which is transferred into recycling. The recycling output yOutputRecyclingt describes the mass which is regained by the recy-cling and approved to be recycled in terms of the DIRECTIVE 2006/66/EC.
Since disassembly might also contribute to recycling by regaining recycling residues (e.g., aluminum casing), which are then transferred to other recyclers, the recycling input contains the mass of not disposed returns without the mass of reused and remanufactured products (22). The mass of returned products is calcu-lated by multiplication of the quantity of returned products yGS
itpq with the product
mass bp . For the mass of the reused and remanufactured products, the quality of a product is taken into account. By multiplying the activity vector ( eqs, rpql ) and the number of executions ( �zps, �tl ), the quantity of substituted and remanufactured products is built. Using the product-specific mass bp , the total mass of the prod-ucts is taken into account. To make sure that only reused and remanufactured returns contribute to the recycling input, only products of return quality q ∈ QQG are considered. Therefore, when substituting in between sales qualities q ∈ QQV , the mass is not taken into account. When substituting in between return qualities q ∈ QQG , input and output are the same and, therefore, do not contribute to the recycling input. When substituting from a return quality q ∈ QQG to a sales qual-ity q ∈ QQV , which means to reuse a product, only the returns are considered, which decreases the mass of products to be recycled. For the remanufacturing, only the input and output of returns are taken into account.
The output of the recycling is separated into two parts (23). First, recycling residues and products, which are sold to other recyclers for further treatment, contribute to the output. Only products in return quality q ∈ QQG contribute to the recycling output. Hence, the mass of sold products contributing to the recy-cling output is calculated by a multiplication of the sales yP
tpq of return quality
q ∈ QQG with the mass of product bp . Additionally, only a part of the product mass is approved to be recycled. This part is taken into account because additives and other materials increase the mass of the output, but only the part of a product, which is regained from the original returned product, contributes to the recycling output. When selling products, the factor AFp describes the share of the product, which is regained at the very end of the recycling process. Therefore, the factor
(20)CTit≥∑
j∈Ji
cDj⋅ �tj +
∑
u∈Ui
cRu⋅ �tu +
∑
l∈Li
cAl⋅ �tl ∀ i, t
(21)yInputRecycling
t ⋅ rmin ≤ yOutputRecycling
t ∀ t
(22)yInputRecyclingt =
∑
i
∑
p
∑
q
yGSitpq
⋅ bp +∑
i
∑
s∈Si
∑
p
∑
q∈QQG
eqs ⋅ �tps ⋅ bp +∑
i
∑
l∈Li
∑
p
∑
q∈QQG
rpql ⋅ �tl ⋅ bp ∀ t

268 C. Scheller et al.
1 3
needs to be calculated across company boundaries. Second, similar to the sold products, the output of the recycling in the form of raw materials is calculated by multiplication of the number of raw materials (activity vector times quantity of executions), the mass of the product, and the share factor AFp.
Non-negativity restriction (24): all decision variables, including materials flows and activities, are non-negative.
3.3.3 Centralized, integrated master production and recycling scheduling
For IMPRS, the possibilities and restrictions of MPS and MRS are integrated. Therefore, the objective function (25) consists of all previous revenues and catego-ries of costs of the MPS (1) and MRS (14) except the procurement cost for the sec-ondary supply.
Transformation and inventory restriction (26): the inventory consists of all inputs, outputs, and transformation of products by the activities of the MPS (2) and MRS (15). Only the secondary supply of the MPS is not considered individually. Connec-tions between recycling and production segments are addressed by transportation activities. Therefore, a connection via demand and secondary supply is no longer necessary.
Primary supply assignment restriction, primary supply quantity restriction, pri-mary supply quality restriction, sales quantity restriction, and the demand quantity restriction for the IMPRS are formulated according to the restrictions of the MPS and MRS (3)–(5), (9), and (10). Furthermore, the return assignment restriction, dis-posal quantity restriction, and disposal prohibition restriction for the IMPRS are for-mulated according to the restrictions of the MRS (16), (18), and (19).
Technical capacity restriction (27): the technical capacity is loaded by disassem-bly, recycling, remanufacturing, and manufacturing, according to MPS (11) and MRS (20).
(23)
yOutputRecycling
t =∑
i
∑
p
∑
q∈QQG
ySPitpq
⋅ bp ⋅ AFp +∑
i
∑
u∈Ui
∑
p∈PR
∑
q
opqu ⋅ �tu ⋅ bp ⋅ AFp ∀ t
yGEtpq, yP
tpq, yE
tpq, yZ
tpq, yGS
itpq, ySP
itpq, yZS
itpq, ySE
itpq, yL
itpq,
(24)�tpqw, �tj, �tl,�tps, �tu ≥ 0 ∀ i, t, p, q,w, j, l, u
(25)
Max∑
i
∑
t
∑
p
∑
q
∑
j
∑
l
∑
u
∑
n
(
aetpq ⋅ yPtpq
− kZtpq
⋅ yZtpq
− kLitpq
⋅ yLitpq
− kEtp⋅ yE
tpq− kH
tn⋅ �tqn − kD
tj⋅ �tj − kR
tu⋅ �tu − kA
tl⋅ �tl
)
(26)
yLitpq
= yLit−1pq
+ yGSitpq
+ yZSitpq
− ySPitpq
− ySEitpq
+∑
n∈Ni
hpn ⋅ �tqn +∑
j∈Ji
vpqj ⋅ �tj
+∑
u∈Ui
otpqu ⋅ �tu +∑
l∈Li
rpql ⋅ �tl +∑
s∈Si
eqs ⋅ �tps +∑
w
aiw ⋅ �tpqw ∀ i, t, p, q

269
1 3
Decentralized master production and recycling scheduling…
The inventory capacity restriction for the IMPRS is equal to the restriction of the MPS and MRS (12). The recycling efficiency restriction for the IMPRS is equal to the restriction of the MRS (21).
Non-negativity restriction (28): all decision variables, including materials flows and activities, are non-negative.
The models are implemented in the commercial modelling system AIMMS and solved with GUROBI 8.1 using a 4.00 GHz CPU and 16 GB RAM. Considering the case study in Sect. 4, the model for the centralized planning case contains 101,928 decision variables. Under consideration of additional symmetry-breaking con-straints, the optimal solution is found within 1 s. The short solving time makes the models suitable for large-scale practical applications.
4 Case study
4.1 General structure and processes
The case study aims at the evaluation of the optimization models and the analysis of the effects of different developments for material prices, demand, and technologies as well as the decentralization of the decisions. In practical applications, closed-loop supply chains for LIBs consist of a variety of different actors, such as raw material producers, cell producers, OEMs, and recyclers. Furthermore, each of these actors might be represented multiple times in a supply chain, e.g., the OEM buys battery cells from multiple suppliers. However, for the analysis of the general effects, a two-stage supply chain is considered. This assumption reduces the complexity of the practical application, but for the analysis of the general effects, this is feasible. Nevertheless, negative effects, such as inefficiencies due to decentralized decision making, will increase in practical applications.
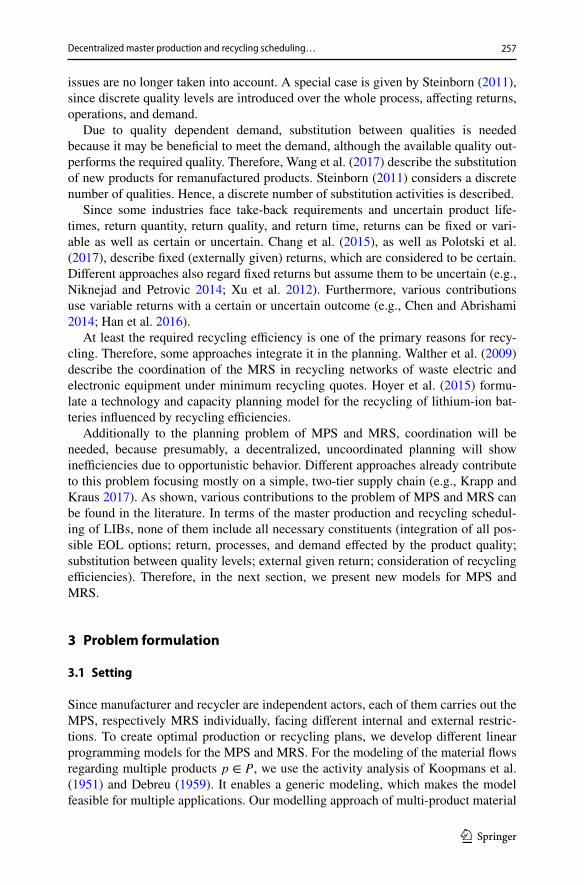
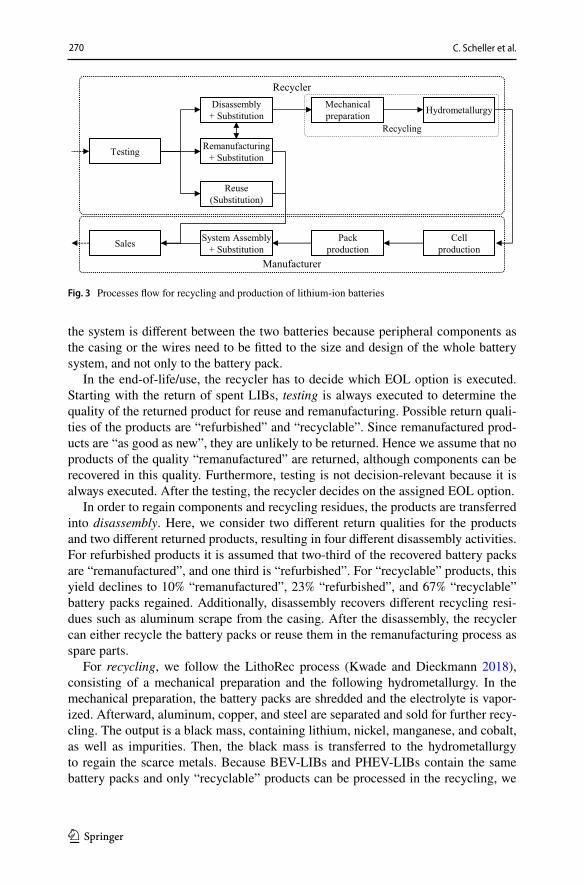
One manufacturer and one recycler are considered to execute all possible activi-ties for the production and recycling of LIBs (see Fig. 3). These include the pro-duction, recycling, and remanufacturing of two different Nickel-Manganese-Cobalt-(NMC)-LIBs with a distribution between these metals of 1-1-1. The composition of the LIBs corresponds to the generic NMC-111-LIB of Diekmann et al. (2017). The first battery type is a large version for battery electric vehicles (BEVs), and the second battery type is a smaller version for plugin hybrid electric vehicles (PHEVs). Both LIBs contain the same battery packs. However, the needed capacity for a BEV is larger compared to a PHEV, since there is only one drive system. Also, the rest of
(27)CTit≥∑
j∈Ji
cDj⋅ �tj +
∑
u∈Ui
cRu⋅ �tu +
∑
l∈Li
cAl⋅ �tl +
∑
q
∑
n∈Ni
cMn⋅ �tqn ∀ i, t
yGEtpq, yP
tpq, yE
tpq, yZ
tpq, yGS
itpq, ySP
itpq, yZS
itpq, ySE
itpq, yL
itpq,
(28)�tpqw, �tj, �tl,�tps, �tqn, �tu ≥ 0 ∀ i, t, p, q,w, j, k, n
270 C. Scheller et al.
1 3
the system is different between the two batteries because peripheral components as the casing or the wires need to be fitted to the size and design of the whole battery system, and not only to the battery pack.
In the end-of-life/use, the recycler has to decide which EOL option is executed. Starting with the return of spent LIBs, testing is always executed to determine the quality of the returned product for reuse and remanufacturing. Possible return quali-ties of the products are “refurbished” and “recyclable”. Since remanufactured prod-ucts are “as good as new”, they are unlikely to be returned. Hence we assume that no products of the quality “remanufactured” are returned, although components can be recovered in this quality. Furthermore, testing is not decision-relevant because it is always executed. After the testing, the recycler decides on the assigned EOL option.
In order to regain components and recycling residues, the products are transferred into disassembly. Here, we consider two different return qualities for the products and two different returned products, resulting in four different disassembly activities. For refurbished products it is assumed that two-third of the recovered battery packs are “remanufactured”, and one third is “refurbished”. For “recyclable” products, this yield declines to 10% “remanufactured”, 23% “refurbished”, and 67% “recyclable” battery packs regained. Additionally, disassembly recovers different recycling resi-dues such as aluminum scrape from the casing. After the disassembly, the recycler can either recycle the battery packs or reuse them in the remanufacturing process as spare parts.
For recycling, we follow the LithoRec process (Kwade and Dieckmann 2018), consisting of a mechanical preparation and the following hydrometallurgy. In the mechanical preparation, the battery packs are shredded and the electrolyte is vapor-ized. Afterward, aluminum, copper, and steel are separated and sold for further recy-cling. The output is a black mass, containing lithium, nickel, manganese, and cobalt, as well as impurities. Then, the black mass is transferred to the hydrometallurgy to regain the scarce metals. Because BEV-LIBs and PHEV-LIBs contain the same battery packs and only “recyclable” products can be processed in the recycling, we
Remanufacturing
+ Substitution
Reuse
(Substitution)
Testing
Mechanical
preparation
Disassembly
+ SubstitutionHydrometallurgy
Cell
production
Pack
production
System Assembly
+ SubstitutionSales
Recycler
Manufacturer
Recycling
Fig. 3 Processes flow for recycling and production of lithium-ion batteries

271
1 3
Decentralized master production and recycling scheduling…
consider two different recycling activities, one for the battery packs (mechanical preparation), and one for the black mass (hydrometallurgy).
For the remanufacturing of “refurbished” products, it is assumed that one-third of the battery packs needs to be replaced to achieve the “remanufactured” quality. Therefore, battery packs which were regained in the disassembly can be used. The wear of “recyclable” products is assumed to be too high for the remanufacturing. Consequently, for each product of quality “refurbished”, one remanufacturing activ-ity is carried out.
Furthermore, substitution activities are performed to achieve three different out-comes. First, the recycler needs to substitute products into quality “recyclable”, if they want to recycle “remanufactured” or “refurbished” products. Second, in order to reuse products, the quality needs to be substituted from return quality to the cor-responding sales quality. Third, products might need to be downgraded from “new” to “remanufactured”, and from “remanufactured” to “refurbished”, to meet the demand for low-quality products with high-quality products. Therefore, six substitu-tion activities are considered, of which four can be executed by the recycler and two by the manufacturer.
For battery production, we considered a three-stage production system. First, one type of battery cell is produced. Second, several battery cells, casing, and electronics are assembled to a battery module. In the third stage, the system assembly differs for BEVs and PHEVs. Therefore, we consider two different system assembly processes. Overall, four manufacturing activities are considered.
To connect the segments, we consider two transportation activities for the manu-facturer. The first connects the cell production and pack assembly and the second the pack assembly and system assembly. For the recycler, four transportation activi-ties can be executed. They connect the disassembly and the remanufacturing in both directions, as well as the disassembly with the mechanical preparation and the mechanical preparation with the hydrometallurgy. In the centralized planning case, we consider two more allocations activities, which replace the connection between recycler and manufacturer.
Technical capacities are fitted to the forecasted returns and demand. We assume a capacity utilization in the base case between 95 and 99%. Further developments of the technical capacity occur regarding the scenario in Sect. 4.2. For the inventory capacity, an average time in the inventory of 1.5 days is assumed.
Overall, two products, 13 components, eight raw materials, and seven recycling residues (including waste), are considered in this case study. Furthermore, prod-ucts are divided into one of six qualities. Return qualities contain three qualities (“remanufactured”, “refurbished” and “recyclable”), while sales qualities contain the three qualities (“new”, “remanufactured”, and “refurbished”). The return quali-ties “remanufactured” and “refurbished” are equal to the corresponding sales quali-ties. The differentiation between return and sales quality is necessary for the correct evaluation of the recycling efficiency.
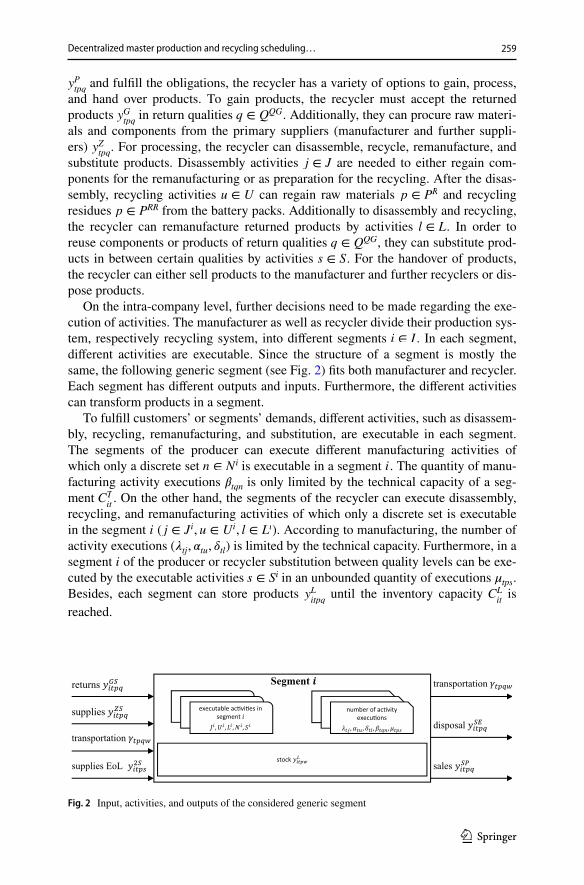
Besides the processes, the market has a significant influence on the planning. We, therefore, describe the demand, return, and price situation of the case study. Demand and returns of LIBs follow the new registrations of BEVs and PHEVs in Germany. We assume that the manufacturer has a market share of 10%, of which

272 C. Scheller et al.
1 3
10% is for “remanufactured” and 5% for “refurbished” LIBs. “New” LIBs make up the main share of the demand with 85%. We forecast the demand in 2025, according to Hoyer et al. (2015), considering the new registrations in Germany from 2009 to 2018 (Kraftfahrt-Bundesamt 2019a) (see Fig. 4). For the demand in 2019, the new registrations in the first half of 2019 are considered (Kraftfahrt-Bundesamt 2019b). Regarding the returns, we assume an average lifetime of the LIB of 8 years. Hence, the returns in 2019 or 2025 derive from the new registrations in 2011 or 2017, respectivly. Since few recyclers of LIBs compete in the German market, the recycler has a market share of 25%. We assume 75% of the returned LIBs as “recyclable” and 25% as “refurbished”. However, the quality of a product is always determined by the component with the lowest quality. Hence, many components of a “recyclable” LIB can be of the quality “refurbished” or even “remanufactured”.
Besides demand and returns, raw material prices have a significant influence on both the cost structure of the manufacturer as well as the revenues of the recycler. For cobalt, nickel, aluminum, and copper prices of the exchange market are used according to the London Metal Exchange on the 1st August 2019 (LME 2019). Fur-ther prices, e.g., for lithium and aluminum scraps, are taken from DERA and BGR (2019). However, prices for battery materials are highly uncertain, e.g., in 2019, the prices for cobalt fluctuated from 25,000 USD to 45,000 USD per ton (LME 2019). Therefore, these prices only serve as the base case, and further developments are considered later on. Secondary materials usually achieve lower prices. Hence, we assume secondary materials to achieve only 80% of the corresponding primary material prices. Considering recycling cost and yields, we use data from LithoRec (Hoyer et al. 2015; Kwade and Dieckmann 2018). For different developments of bat-tery material prices, demand, and long-term developments, we formulate five sce-narios in the following Section.
4.2 Scenarios
Since the development of LIBs is highly uncertain and many different scenarios are conceivable, we formulate a base case with constant prices, demand, and costs over the planning horizon of a year, which serves as a comparative value for fur-ther scenarios. On the foundation of the base case, different developments of a spe-cific parameter or general conditions are analyzed. However, one parameter may
0
20,000
40,000
60,000
80,000
Forecast BEV Actual BEV
0
1,00,000
2,00,000
3,00,000
20
08
20
09
20
10
20
11
20
12
20
13
20
14
20
15
20
16
20
17
20
18
20
19
Forecast PHEV Actual PHEV
Fig. 4 Forecasted and actual new registrations per year of BEVs (left) and PHEVs (right) in Germany between 2008 and 2019

273
1 3
Decentralized master production and recycling scheduling…
influence other parameters, e.g. the demand influences the activity costs due to the economy of scales.
Current registrations of EVs indicate a fast increase in sales of about 50% in Europe (European Alternative Fuels Observatory 2020) and even up to 70% in Ger-many (Kraftfahrt-Bundesamt 2019a). Hence, one crucial scenario for the future is a “high battery demand” compared to the constant base case. In this scenario, demand will increase by 5% each month, which results in an increase of about 80% in one year.
Since material prices, especially for battery materials, tend to fluctuate drastically, see the cobalt prices between June 2017 and June 2019 (DERA and BGR 2019), two scenarios are formulated. First, a scenario is considered with “high battery material prices” in which the price is increasing each month by 1%. Similar developments can be observed in the cobalt and lithium prices in 2017 (DERA and BGR 2019). Furthermore, the prices also tend to fluctuate quickly, as did the cobalt price in 2018 (DERA and BGR 2019). Therefore, we formulate a scenario with “fluctuating mate-rial prices”.
Last, we aim to analyze the development of the influences of decentralization in the future. Hence, a scenario is formulated which displays an “anticipated develop-ment” for the year 2025. Therefore, the forecast described in Sect. 4.1 is considered. Furthermore, activity costs and LIB prices decrease by an estimated 30% due to economy of scales (Berckmans et al. 2017). However, the prices for remanufactured products are assumed to be stable compared to 2019 because of the quality of the remanufacturing processes as well as the acceptance for used products increase. The described scenarios with the corresponding parameters are shown in Table 1.
4.3 Results
In the following, the case study is executed as a decentralized planning case running the sequence of events described in Sect. 3.1. Furthermore, the IMPRS serves as a benchmark for the maximal combined contribution margin as well as for optimal decisions.
The manufacturer and the recycler achieve positive contribution margins in all scenarios (see Fig. 5). Hence, there is always an incentive for the actors to execute production or recycling, respectively. Compared to the base case, high battery demand leads to an increase in the contribution margin for the manufacturer and recycler. The recycler profits from increasing secondary battery material prices. Although the primary and secondary supply is more expensive than in the base case and contribution margins per product decrease, the manufacturer can overcompen-sate this by increasing sales.
High battery material prices lead to a slightly decreasing contribution mar-gin (< 1%) for the manufacturer as well as in the centralized planning case. Fol-lowing the “high battery demand” scenario, the contribution margin of the recycler increases by 2.1% due to the increasing material prices. Due to the cost structure of both manufacturer and recycler, the impact of material prices is relatively small compared to the increase (on average 5.5%) of the material prices. The manufacturer

274 C. Scheller et al.
1 3
Tabl
e 1
Sce
nario
s with
a p
lann
ing
horiz
on o
f 1 y
ear
a See
Tab
le 2
in th
e “A
ppen
dix”
Para
met
erSc
enar
io
2019
Bas
e ca
se20
19H
igh
batte
ry d
eman
d20
19H
igh
raw
mat
eria
l pric
es20
19Fl
uctu
atin
g m
ater
ial
pric
es
2025
Ant
icip
ated
dev
elop
men
t
Bat
tery
dem
and
Con
stan
t (e.
g. 5
19 B
EVs
per m
onth
)In
crea
sing
(+ 5%
per
m
onth
)C
onst
ant (
see
base
cas
e)C
onst
ant (
see
base
cas
e)C
onst
ant (
e.g.
6,0
19 B
EVs
per m
onth
)Re
turn
qua
ntiti
esC
onst
ant (
e.g.
46
BEV
s pe
r mon
th)
Con
stan
t (se
e ba
se c
ase)
Con
stan
t (se
e ba
se c
ase)
Con
stan
t (se
e ba
se c
ase)
Con
stan
t (e.
g. 5
23 B
EVs
per m
onth
)Sa
les r
even
ues p
er p
rodu
ctC
onst
ant (
e.g.
4,0
00 E
UR
pe
r BEV
)C
onst
ant (
see
base
cas
e)C
onst
ant (
see
base
cas
e)C
onst
ant (
see
base
cas
e)C
onst
ant (
−30
% fo
r new
an
d 0%
for o
ther
LIB
s)Pr
imar
y su
pply
bat
tery
m
ater
ial c
osts
Con
stan
t (e.
g. 2
8,00
0 EU
R p
er to
n co
balt)
Mod
erat
ely
incr
easi
ng
(+ 0,
5% p
er m
onth
)In
crea
sing
(+ 1%
per
m
onth
)Fl
uctu
atin
ga (± 10
% c
om-
pare
d to
the
base
cas
e)C
onst
ant (
see
base
cas
e)
Prim
ary
supp
ly c
ompo
-ne
nts c
osts
Con
stan
t (e.
g. 1
50 E
UR
pe
r BEV
-BM
S)C
onst
ant (
see
base
cas
e)C
onst
ant (
see
base
cas
e)C
onst
ant (
see
base
cas
e)C
onst
ant (
−30
% c
ompa
red
to th
e ba
se c
ase)
Seco
ndar
y su
pply
mat
eria
l co
stsC
onst
ant (
~ 15
% lo
wer
th
an p
rimar
y m
ater
ials
)M
oder
atel
y in
crea
sing
(+
0,5%
per
mon
th)
Mod
erat
ely
incr
easi
ng
(+ 0,
5% p
er m
onth
)Fl
uctu
atin
g (±
10%
com
-pa
red
to th
e ba
se c
ase)
Con
stan
t (~
10%
low
er th
an
prim
ary
mat
eria
ls)
Act
ivity
rela
ted
costs
Con
stan
t (e.
g. 5
00 E
UR
pe
r sys
tem
ass
embl
y)M
oder
atel
y de
crea
sing
(o
nly
prod
uctio
n: -1
%
per m
onth
)
Con
stan
t (se
e ba
se c
ase)
Con
stan
t (se
e ba
se c
ase)
Con
stan
t (al
l pro
cess
es:
−30
% c
ompa
red
to th
e ba
se c
ase)
Ach
ieve
d re
cycl
ing
rate
Con
stan
t (e.
g. 7
5% fo
r co
balt)
Con
stan
t (se
e ba
se c
ase)
Con
stan
t (se
e ba
se c
ase)
Con
stan
t (se
e ba
se c
ase)
Con
stan
t (e.
g. 8
2% fo
r co
balt)

275
1 3
Decentralized master production and recycling scheduling…
also faces production costs and costs for components, which remain stable. For the recycler, the high share of the recycling cost compared to the revenues prevents a more drastically increase.
Fluctuating material prices lead to increasing contribution margins of about 4% for the manufacturer and centralized planning case. Since the prices fluctuate above and below the base scenario, storing battery materials in low-price periods results in decreasing costs. However, this opportunistic behavior leads to a decreasing contri-bution margin for the recycler by 5.5%. Nevertheless, the recycler also shows oppor-tunistic behavior. They store cobalt since it is the most expensive material up to the inventory limit in low-price periods and sell it in the middle- and high-price periods.
Last, considering the anticipated development until 2025, all contribution mar-gins increase drastically. The manufacturer can increase their contribution margin by 344% in 2025. In the centralized planning case, the contribution margin increases even more by 384%. The recycler can achieve the highest increase of about 981%. The main reason for the disproportional increase of the recycler is that relative returns increase more rapidly than the demand. Hence, the recycler can increase their sales relatively faster than the manufacturer.
Also, by analyzing the executed EOL options (see Fig. 6), we formulate three main findings. First, in decentralized planning for the year 2019, only recycling is executed. Reuse and remanufacturing are not executed because the input for the recycler is limited, and the recycling of a LIB results in a higher contribution margin. Further, the decisions for the year 2019 vary only regarding the execution time of the recycling. Due to the increasing secondary supply material costs, some products (such as returns and cobalt) are stored to the maximal inventory capacity to achieve higher prices in the next period. Considering fluctuating secondary supply material costs, inventory is used to sell materials in high-price periods. Second, reuse is per-formed in all centralized planning cases. In the scenarios for 2019, all refurbished returns are assigned to reuse to meet the demand for refurbished products. Third,
2019Base case
2019High ba�ery demand
2019High ba�ery material
prices
2019Fluctua�ng ba�ery
material prices
2025An�cipated
developementCentralized Manufacturer Recycler
50%
100%
150%
300%
350%
950%
1000%
0%
400%
Fig. 5 Combined contribution margin in the centralized planning and individual contribution margins for recycler and manufacturer in the decentralized planning compared to the base case per scenario (%)

276 C. Scheller et al.
1 3
remanufacturing is only performed in the “2025 anticipated development” scenario. In the decentralized planning case, the decreasing remanufacturing costs result in a higher contribution margin per product compared to reuse. Due to high costs for the remanufacturing of returned products, reuse is preferred in the centralized planning case. Nevertheless, refurbished products, which are not reused, are remanufactured. We also observe that all EOL options are performed. Hence, the integration of all EOL options in the models is necessary and leads to a benefit in the MRS.
Due to opportunistic behavior and information asymmetries between manufac-turer and recycler, inefficiencies occur in all scenarios (see Fig. 7). In the context of this paper, inefficiencies are defined as the difference in the sum of the contribution margins of the recycler and producer in the decentralized planning case compared to the centralized planning case. Since no returned product is assigned to reuse in the decentralized planning cases, inefficiencies always occur. The inefficiencies
0%
10%
20%
30%
40%
50%
60%
70%
80%
90%
100%
Cen
tral
ized
Dec
entr
aliz
ed
Cen
tral
ized
Dec
entr
aliz
ed
Cen
tral
ized
Dec
entr
aliz
ed
Cen
tral
ized
Dec
entr
aliz
ed
Cen
tral
ized
Dec
entr
aliz
ed
2019
Base case
2019
High battery demand
2019
High battery material
prices
2019
Fluctuating battery
material prices
2025
Anticipated
developement
BEV Reused BEV Remanufactured BEV Recycled
PHEV Reused PHEV Remanufactured PHEV Recycled
Fig. 6 Share of each executed end-of-life options for centralized and decentralized planning per scenario (%)
0%
1%
2%
3%
4%
5%
2019
Base case
2019
High battery demand
2019
High battery material
prices
2019
Fluctuating battery
material prices
2025
Anticipated
developement
Inefficiency compared the contribution margin of the centralized planning case
Fig. 7 Inefficiencies compared to the maximal contribution margin per scenario (%)
277
1 3
Decentralized master production and recycling scheduling…
compared to the contribution margin in the centralized planning case occur within a range between 2.5 and 3.7%. However, increasing demand (and returns) raises the inefficiencies due to an intensified impact of non-optimal decisions on the EOL options. Hence, inefficiencies have a significant impact and are likely to increase in the future.
Following the problem solution, we evaluate the optimization models as well as the case study based on three main findings. First, the cost structure for battery pro-duction is consistent with the study of Berckmans et al. (2017). In our case study, material costs make up 71–73%, depending on the scenario. Furthermore, produc-tion and material costs compared to the revenues make up 65–70%. Second, the regained value per ton of LIBs by recycling is within a realistic range. According to Thies et al. (2018), the material value of an NMC-LIB is about 2,300 €/t. Due to inefficiencies and lower prices for secondary materials, the recycler can regain between 1,943.8 € and 2,026.3 €/t depending on the scenario. Hence, the regained value per ton is within a realistic range. Third, recycling is the dominant EOL option for decentralized planning of recycling and production in current practical applica-tions LIBs (Olivetti et al. 2017). Only a few remanufacturing and second life appli-cations can be found in practice (Audi 2019; Nissan 2018). The results indicate that our approach, as well as the case study, is within a realistic range according to cur-rent literature.
5 Limitations, conclusion, and outlook
The results indicate that the model formulation displays the decision situation of the setting correctly. However, the reduction to a two-stage supply chain limits the conclusions for practical applications to the general effects. For specific values, such as the amount of inefficiencies in an existing supply chain, the supply chain must be expanded to include multiple stages and multiple actors per stage. A multi-stage approach will necessitate an advanced sequence of events and most likely, a sim-ple coordination approach. Furthermore, the integration of multiple actors per stage results in additional decisions, e.g., from which supplier should the battery cell be procured. Nevertheless, the assumed setting is suitable for the aim to analyze the general effects of different scenarios and decentralized decision making.
The results of the case study state recycling to be economically beneficial in the short-term. However, centralized planning always outperforms decentralized planning. Therefore, potentials to improve the supply chain performance exist in the current planning. Further conclusions and results refer to the questions formulated in Sect. 1.
1. How can legal requirements like minimum recycling efficiency and multiple end-of-life options for spent lithium-ion batteries be integrated into optimization models for the master production and recycling scheduling?

278 C. Scheller et al.
1 3
Based on the five primary requirements for the master production scheduling of lithium-ion batteries, which are the integration of all end-of-life options (e.g., recy-cling), quality dependency, substitution between qualities, take-back requirements, and recycling efficiency, we formulate a new approach. In Sect. 4, we observe that all requirements have an impact on the master recycling scheduling. First, all end-of-life options are executed in at least one scenario. Second, the quality dependency of returns and demand leads to the different assigned end-of-life options. Hence, quality dependency needs to be considered when deciding on the assignment of end-of-life options. Due to the quality dependency, substitution between qualities needs to be considered. Third, take-back requirements and recycling efficiency need to be fulfilled due to legal requirements. Overall, each requirement shows an influence on master recycling scheduling and needs to be considered. Hence, our approach is suitable for the recycling planning of lithium-ion batteries and extends the current master recycling scheduling approaches.
2. How do different developments of material prices, demand, and technology influ-ence the recycling and production planning of lithium-ion batteries?
We formulate five different scenarios to analyze the influence on planning based on different developments of material prices, demand, and technology. Increasing battery demand always results in increasing contribution margins for both the manu-facturer and the recycler. Further, higher raw material prices lead to increasing con-tribution margins of the recycler because the revenues are mainly achieved by selling recycled battery materials. For the year 2025, both manufacturer and recycler will increase the contribution margin rapidly. The recycler can profit even more because their revenues are not only bounded by demand but also by the quantity of returned products, which will increase rapidly. Also, remanufacturing is likely to become a beneficial end-of-life option for lithium-ion batteries in the upcoming years.
3. What effect does the decentralization of decisions have on the production and recycling plans?
The decentralization of production and recycling planning leads to inefficiencies in all considered scenarios. They occur due to the opportunistic behavior of the manu-facturer and recycler. In the case study, the result of the opportunistic behavior is the storage of products by the recycler and manufacturer to sell in high-price and buy in low-price periods. Furthermore, reuse is missing in the decentralized planning case. We find two main reasons for the inefficiencies. First, independent actors optimize their local contribution margin. Hence, they act opportunistically. Second, informa-tion asymmetries occur in decentralized planning. For example, the recycler has no information about the cost structure of the manufacturer, which leads to non-optimal pricing of “refurbished” lithium-ion batteries. In this case, the selling price is too high to be beneficial for the manufacturer. Therefore, the manufacturer always decides to buy “remanufactured” lithium-ion batteries. However, “refurbished” lithium-ion bat-teries result in the highest contribution margin in terms of the entire supply chain.

279
1 3
Decentralized master production and recycling scheduling…
To overcome or at least reduce inefficiencies, coordination mechanisms need to be applied. Different approaches for different planning problems exist. Contracts or nego-tiation can achieve optimal decisions (Schmidt et al. 2014; Walther et al. 2009). Non-optimal but large-scale, multi-stage coordination can be achieved by using multi-agent systems (e.g., Ogier et al. 2013). Furthermore, digitization can help to gain and trans-fer information between the actors and hence reduce the information asymmetry.
Additional research is needed regarding the analysis of the effects of real-life cooperation in the closed-loop supply chain of lithium-ion batteries. Therefore, the models should be extended by multiple stages and multiple actors per stage as described in the limitations. Furthermore, uncertainties are a significant problem for both recycler and manufacturer. In the case of lithium-ion batteries, technol-ogy uncertainties of the product (e.g. NMC vs NCA vs LFP) and the processes (e.g. pyrometallurgy vs mechanical preparation), as well as return uncertainties (e.g., quantity and quality), have significant influences. Furthermore, these uncertainties are driven by external factors, such as increased obligations. These uncertainties will influence the planning and likely increase inefficiencies, as known from the bull-whip effect. Hence, research needs to integrate of uncertainties into the master recy-cling scheduling of lithium-ion batteries. Furthermore, the existing inefficiencies and future supply risks (e.g. of cobalt and lithium) will necessitate a closed-loop supply chain management. Especially coordination will be needed to overcome the inefficiencies and enable the end-of-life options with high ecologic value, e.g. reuse. Therefore, further research needs to be done regarding the coordination mechanism for the closed-loop planning of lithium-ion batteries.
Acknowledgements Open Access funding provided by Projekt DEAL. This work is part of the research project Recycling 4.0 (EFRE | ZW 6-85018080), which is funded by the European Regional Development Fund and the development bank for the German federal state of Lower Saxony (NBank). The authors would like to thank for the support.
Open Access This article is licensed under a Creative Commons Attribution 4.0 International License, which permits use, sharing, adaptation, distribution and reproduction in any medium or format, as long as you give appropriate credit to the original author(s) and the source, provide a link to the Creative Com-mons licence, and indicate if changes were made. The images or other third party material in this article are included in the article’s Creative Commons licence, unless indicated otherwise in a credit line to the material. If material is not included in the article’s Creative Commons licence and your intended use is not permitted by statutory regulation or exceeds the permitted use, you will need to obtain permission directly from the copyright holder. To view a copy of this licence, visit http://creat iveco mmons .org/licen ses/by/4.0/.
Appendix
References
Akhoondi F, Lotfi MM (2016) A heuristic algorithm for master production scheduling problem with con-trollable processing times and scenario-based demands. Int J Prod Res 54:3659–3676. https ://doi.org/10.1080/00207 543.2015.11250 32
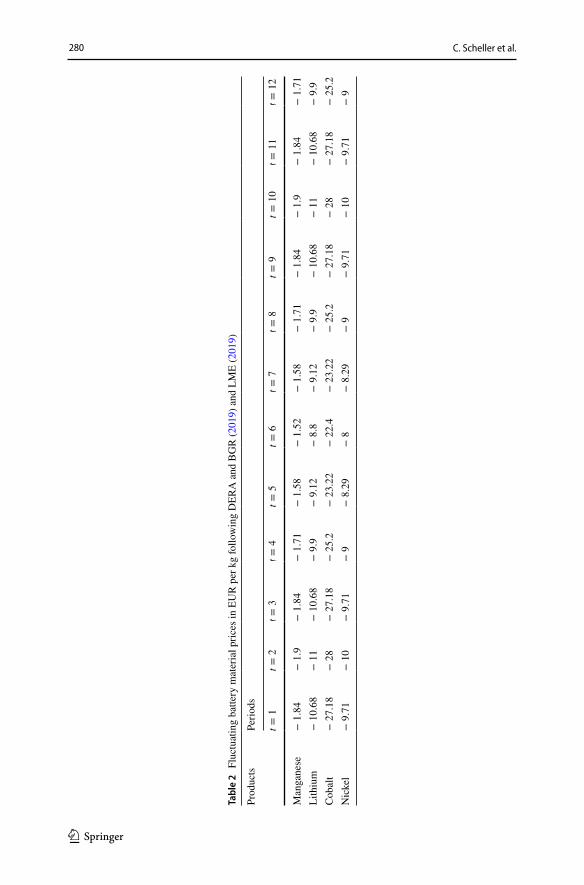
280 C. Scheller et al.
1 3
Tabl
e 2
Flu
ctua
ting
batte
ry m
ater
ial p
rices
in E
UR
per
kg
follo
win
g D
ERA
and
BG
R (2
019)
and
LM
E (2
019)
Prod
ucts
Perio
ds
t=1
t=2
t=3
t=4
t=5
t=6
t=7
t=8
t=9
t=10
t=11
t=12
Man
gane
se−
1.8
4−
1.9
− 1
.84
− 1
.71
− 1
.58
− 1
.52
− 1
.58
− 1
.71
− 1
.84
− 1
.9−
1.8
4−
1.7
1Li
thiu
m−
10.
68−
11
− 1
0.68
− 9
.9−
9.1
2−
8.8
− 9
.12
− 9
.9−
10.
68−
11
− 1
0.68
− 9
.9C
obal
t−
27.
18−
28
− 2
7.18
− 2
5.2
− 2
3.22
− 2
2.4
− 2
3.22
− 2
5.2
− 2
7.18
− 2
8−
27.
18−
25.
2N
icke
l−
9.7
1−
10
− 9
.71
− 9
− 8
.29
− 8
− 8
.29
− 9
− 9
.71
− 1
0−
9.7
1−
9

281
1 3
Decentralized master production and recycling scheduling…
Audi (2019) Audi eröffnet Batteriespeicher auf Berliner EUREF-CampusBerckmans G, Messagie M, Smekens J, Omar N, Vanhaverbeke L, van Mierlo J (2017) Cost projection of
state of the art lithium-ion batteries for electric vehicles up to 2030. Energies 10:1314. https ://doi.org/10.3390/en100 91314
Bichler K (1970) Verbesserung der betrieblichen Produktionsplanung durch lineare Programmierung. Zugl.: Freiburg, Schw., Univ., Diss., 1969 u.d.T.: Bichler: Lineare Programmierung und die Theorie der Produktion. Schriftenreihe des Instituts für Automation und Unternehmensforschung der Uni-versität Freiburg, Schweiz, vol 9. Decker, Hamburg, Berlin
Caner Taşkın Z, Tamer Ünal A (2009) Tactical level planning in float glass manufacturing with co-production, random yields and substitutable products. Eur J Oper Res 199:252–261. https ://doi.org/10.1016/j.ejor.2008.11.024
Chang X, Xia H, Zhu H, Fan T, Zhao H (2015) Production decisions in a hybrid manufacturing–remanu-facturing system with carbon cap and trade mechanism. Int J Prod Econ 162:160–173. https ://doi.org/10.1016/j.ijpe.2015.01.020
Chen M, Abrishami P (2014) A mathematical model for production planning in hybrid manufacturing–remanufacturing systems. Int J Adv Manuf Technol 71:1187–1196. https ://doi.org/10.1007/s0017 0-013-5538-0
Debreu G (1959) Theory of value: an axiomatic analysis of economic equilibrium. Cowles Foundation for Research in Economics at Yale University. Monograph, vol 17. Wiley, New York
DERA, BGR (2019) Preismonitor Juni 2019: Deutsche Rohstoffagentur und Bundesanstalt für Geowis-senschaften und Rohstoffe
Díaz-Madroñero M, Mula J, Peidro D (2014) A review of discrete-time optimization models for tactical production planning. Int J Prod Res 52:5171–5205. https ://doi.org/10.1080/00207 543.2014.89972 1
Diekmann J, Hanisch C, Froboese L, Schaelicke G, Loellhoeffel T, Foelster A-S, Kwade A (2017) Eco-logical recycling of lithium-ion batteries from electric vehicles with focus on mechanical processes. J Electrochem Soc. https ://doi.org/10.1149/2.02717 01jes
Englberger J, Herrmann F, Manitz M (2016) Two-stage stochastic master production scheduling under demand uncertainty in a rolling planning environment. Int J Prod Res 54:6192–6215. https ://doi.org/10.1080/00207 543.2016.11629 17
European Alternative Fuels Observatory (2020) Passenger cars. https ://www.eafo.eu/vehic les-and-fleet /m1. Accessed 28 Feb 2020
European Union (2017) Study on the review of the list of critical raw materials: criticality assessments. Publications Office of the European Union, Luxembourg. https ://doi.org/10.2873/87664 4
Han S, Ma W, Zhao L, Zhang X, Lim MK, Yang S, Leung S (2016) A robust optimisation model for hybrid remanufacturing and manufacturing systems under uncertain return quality and market demand. Int J Prod Res 54:5056–5072. https ://doi.org/10.1080/00207 543.2016.11458 15
Hoyer C, Kieckhäfer K, Spengler TS (2015) Technology and capacity planning for the recycling of lithium-ion electric vehicle batteries in Germany. J Bus Econ 85:505–544. https ://doi.org/10.1007/s1157 3-014-0744-2
Inderfurth K, Lindner G, Rachaniotis NP (2005) Lot sizing in a production system with rework and prod-uct deterioration. Int J Prod Res. https ://doi.org/10.1080/00207 54042 00029 8539
Koopmans TC, Alchian AA, Dantzig GB, Georgescu-Roegen N, Samuelson PA, Tucker AW (eds) (1951) Activity analysis of production and allocation. In: Proceedings of a conference. Cowles Commission monographs, vol 13. Wiley, New York
Kraftfahrt-Bundesamt (2019a) Neuzulassungen von Pkw in den Jahren 2009 bis 2018 nach ausgewählten Kraftstoffarten. https ://www.kba.de/DE/Stati stik/Fahrz euge/Neuzu lassu ngen/Umwel t/n_umwel t_z.html?nn=65232 6. Accessed 10 Sept 2019
Kraftfahrt-Bundesamt (2019b) Pressemitteilung 15/2019: Fahrzeugzulassungen im Juni 2019—Halbjah-resbilanz. https ://www.kba.de/Share dDocs /Press emitt eilun gen/DE/2019/pm_15_2019_fahrz eugzu lassu ngen_06_2019_pdf.html
Krapp M, Kraus JB (2017) Coordination contracts for reverse supply chains: a state-of-the-art review. J Bus Econ 19:37. https ://doi.org/10.1007/s1157 3-017-0887-z
Kwade A, Dieckmann J (eds) (2018) The recycling of lithium-ion batteries: The LithoRec Way. Sustain-able Production, Life Cycle Engineering and Management. Springer International Publishing, Cham
Kwak M, Kim H (2017) Green profit maximization through integrated pricing and production plan-ning for a line of new and remanufactured products. J Clean Prod 142:3454–3470. https ://doi.org/10.1016/j.jclep ro.2016.10.121

282 C. Scheller et al.
1 3
Liu W, Ma W, Hu Y, Jin M, Li K, Chang X, Yu X (2019) Production planning for stochastic manufactur-ing/remanufacturing system with demand substitution using a hybrid ant colony system algorithm. J Clean Prod 213:999–1010. https ://doi.org/10.1016/j.jclep ro.2018.12.205
LME (2019) Reports by metal: London Metal Exchange. https ://www.lme.com/Marke t-Data/Repor ts-and-data/Repor ts-by-metal . Accessed 1 Aug 2019
Mayyas A, Steward D, Mann M (2019) The case for recycling: overview and challenges in the mate-rial supply chain for automotive li-ion batteries. Sustain Mater Technol 19:e00087. https ://doi.org/10.1016/j.susma t.2018.e0008 7
Mlodoch P (2019) Klimaschutzgesetz: Umweltminister drückt aufs Tempo. https ://www.weser -kurie r.de/regio n/niede rsach sen_artik el,-klima schut zgese tz-umwel tmini ster-druec kt-aufs-tempo -_arid,18224 13.html. Accessed 20 Aug 2019
Niknejad A, Petrovic D (2014) Optimisation of integrated reverse logistics networks with different prod-uct recovery routes. Eur J Oper Res 238:143–154. https ://doi.org/10.1016/j.ejor.2014.03.034
Nissan (2018) Zweites Leben: Nissan recycelt Lithium-Ionen-Batterien in neuem WerkOgier M, Cung V-D, Boissière J, Chung SH (2013) Decentralised planning coordination with quan-
tity discount contract in a divergent supply chain. Int J Prod Res 51:2776–2789. https ://doi.org/10.1080/00207 543.2012.73795 1
Olivetti EA, Ceder G, Gaustad GG, Fu X (2017) Lithium-ion battery supply chain considerations: analy-sis of potential bottlenecks in critical metals. Joule 1:229–243
Polotski V, Kenne J-P, Gharbi A (2017) Production and setup policy optimization for hybrid manu-facturing–remanufacturing systems. Int J Prod Econ 183:322–333. https ://doi.org/10.1016/j.ijpe.2016.06.026
Schmidt K, Volling T, Spengler TS (2014) Towards contract based coordination of distributed product development processes with complete substitution. J Bus Econ 84:665–714. https ://doi.org/10.1007/s1157 3-014-0727-3
Spengler TS (1994) Industrielle Demontage- und Recyclingkonzepte: Betriebswirtschaftliche Pla-nungsmodelle zur ökonomisch effizienten Umsetzung abfallrechtlicher Rücknahme- und Verwer-tungspflichten. Abfallwirtschaft in Forschung und Praxis, vol 67. Schmidt, Berlin
Stadtler H, Kilger C, Meyr H (eds) (2015) Supply chain management and advanced planning: Concepts, models, software, and case studies, 5th edn. Springer Texts in Business and Economics, Springer, Berlin
Steinborn J (2011) Integrierte Produktions- und Produktrecyclingprogrammplanung in der Elektronikin-dustrie. Logos, Berlin
Subulan K, Tasan AS (2013) Taguchi method for analyzing the tactical planning model in a closed-loop supply chain considering remanufacturing option. Int J Adv Manuf Technol 66:251–269. https ://doi.org/10.1007/s0017 0-012-4322-x
Sun H, Chen W, Ren Z, Liu B (2017) Optimal policy in a hybrid manufacturing/remanufacturing system with financial hedging. Int J Prod Res 55:5728–5742. https ://doi.org/10.1080/00207 543.2017.13305 70
Thies C, Kieckhäfer K, Hoyer C, Spengler TS (2018) Economic Assessment of the LithoRec Process. In: Kwade A, Dieckmann J (eds) The recycling of lithium-ion batteries: the LithoRec Way. Springer International Publishing, Cham
Voigt G, Inderfurth K (2011) Supply chain coordination and setup cost reduction in case of asymmetric information. OR Spectr 33:99–122. https ://doi.org/10.1007/s0029 1-009-0173-8
Walther G, Schmid E, Spengler TS (2009) Dezentrale Koordination von Stoffströmen in Recyclingnet-zwerken. Zeitschrift für Betriebswirtschaft 79:717–749. https ://doi.org/10.1007/s1157 3-009-0257-6
Wang Y, Chen W, Liu B (2017) Manufacturing/remanufacturing decisions for a capital-constrained manufacturer considering carbon emission cap and trade. J Clean Prod 140:1118–1128. https ://doi.org/10.1016/j.jclep ro.2016.10.058
Xu X, Li Y, Cai X (2012) Optimal policies in hybrid manufacturing/remanufacturing systems with ran-dom price-sensitive product returns. Int J Prod Res 50:6978–6998. https ://doi.org/10.1080/00207 543.2011.64095 6
Publisher’s Note Springer Nature remains neutral with regard to jurisdictional claims in published maps and institutional affiliations.


![Decentralized Task-Aware Scheduling for Data Center Networks...also integrated the popular in-memory caching application, Memcached [2], with Baraat. We compare Baraat against the](https://img.pdfslide.net/doc/110x75/601eb37a2cf99a036c789e5c/decentralized-task-aware-scheduling-for-data-center-networks-also-integrated.jpg)


![ARiA: A Protocol for Dynamic Fully Distributed Grid Meta-scheduling · 2011. 8. 16. · distributed load-balancing solutions [12], and decentralized meta-scheduling algorithms [13]](https://img.pdfslide.net/doc/110x75/6045b1a539c2246c641e0ad4/aria-a-protocol-for-dynamic-fully-distributed-grid-meta-scheduling-2011-8-16.jpg)