Embed Size (px)
Citation preview
Decided or undecided: An investigation of
individual’s (in)decision to Catalan independence
Xavier Fernandez-i-Marın∗ Toni Rodon† Ivan Serrano‡
September 10, 2013
Abstract
This article investigates whether individual responses on Catalan in-dependence are congruent with what would be expected according to hisor her profile. Previous research has pointed out that responses to thisquestion are affected by different biases, especially by the social desirabil-ity bias and the spiral of silence bias. Therefore, individuals choose ananswer that would not have been the chosen answer in other social orpolitical circumstances. This lack of congruence between observed indi-vidual responses and predicted responses are analysed by predicting eachrespondent answer through multiple imputation. This ‘blind’ imputationallows for controlling individuals’ uncertainty and for comparing observedand predicted results. Findings show that lack of congruence especiallyaffects those that choose “No”, “Abstention” or are undecided but thereare not systematic evidences that hiding prefereces bias the “Yes” results.Conclusions of this paper are important in order to understand and anal-yse how indecision operates in surveys.
1 Introduccio
Due to recent events in Catalan politics, literature on support for catalan seces-sion has experienced a recent revival (Serrano, 2013). In general, these worksare dedicated to investigate why catalans decided to start supporting secessionat the end of 2008 or which would be the reasons of their vote in a hypothet-ical referendum. Although some works are more sophisticated and are basedon survey experiments (Munoz, 2012), the majority of academic articles employsurveys that include different instruments in order to tackle individual’s seces-sionist claims or territorial preferences. Despite calls for secession came to thefore a few years ago, a close look at the literature reveals that there is alreadyaccumulated evidence about why some Catalans want to secede from Spain orwhy they want to retain the current political status.
The political relevance behind the “Yes” or “No” answer has pushed scholarsto investigate why some profiles are more likely to choose one of these answers.
∗ESADEgeo (Center for Global Economy and Geopolitics). Email: xavier.fernandez3@
esade.edu. Webpage: http://xavier-fim.net†UPFEmail: [email protected]. Webpage: http://www.tonirodon.cat‡IN3-UOC. Email: [email protected]
1
However, previous works have normally put aside those citizens that do notknow what they would do if a referendum took place or did not answer thequestion during the interview. These answers are generally excluded from theanalysis or even grouped together with the “I will abstain” category. Previousliterature has tended to conceptualise individuals that do not answer or donot know relevant questions as “undecided”, either because they do not havea strong opinion about the issue or because they do not have enough politicalknowledge to correctly answer the question. This is why the “do not know”or the “not answer” category in the referendum question is often treated asmissing.
This article takes another perspective and tries to capture what those citizensthat chose the “dk/na” category in survey would do if a referendum took place.This group, the “undecided”, represents a small category, so it has been assumedthat its exclusion does not affect the final results. For instance, in the latestOpinion Poll published by the Centre d’Estudis d’Opinio1 3.8% of interviewedindividuals answered “I don’t know” and 1.3% did not answer the question2.
Even though the percentage of citizens that choose these options in thisparticular question is rather small, we take another perspective and we arguethat indecision is not restricted to individuals that opt for the “dk/na” category.More concretely, this article considers that all individuals (those who answeredand those who did not answer) have a latent probability of indecision which issometimes expressed in the survey as such, whereas in other occasions it is notdirectly expressed because individuals end up choosing a different answer thanthe “dk/na”. This is clearly illustrated with the “I will abstain” category. Whenfacing the question about what he or she would do in an eventual referendum,there can be some degree of uncertainty of what the final action would be.Instead of choosing a “Yes” or a “No” option, some individuals finally choosethe “I will abstain category”, although they are certain that they would vote forone of the options. In the aforementioned survey, 15.3% of individuals mentionedthat they would abstain if a referendum to decide the independence of Cataloniawas held. This figure has been considered by journalists or electoral punditsas too high and as a way for some individuals to avoid revealing their truepreferences. In other words, although individuals choose an option in the survey,there is a certain degree of uncertainty that this answer best represent his orher view. Uncertainty is sometimes expressed by choosing a concrete answerand others by choosing the option “dk/na”. Finally, this effect may not behomogeneous across individuals: some citizens may have higher incentives toavoid answering the question than others or even to choose an answer that isnot his or her preferred one.
Support for Catalan secession provides a good example to investigate in-dividual’s underlying uncertainty and how this is translated in questionnaires.Firstly, attitudes towards secession are “expressive” and refer to a political re-ality that has not taken place yet. The possibility to organise a referendumon Catalanonia’s political status has been on the political agenda for the lasttwo years, but the referendum has not been called yet and there are serious
1Centre d’Estudis d’Opinio (CEO) is a public opinion surveys institute that carries out aregular barometer every three months.
2The question was the following: “If tomorrow a referendum to decide the independenceof Catalonia was held, what would you vote?” The options were: “I would vote in favour ofindependence”, “I would vote against independence”, “I would abstain”.
2
doubts that it will ever take place. The answer about a hypothetical vote in areferendum that has not even been called has therefore a certain degree of un-certainty, which may change according to the political debate. Secondly, thereare different theoretical reasons that have been invoked to argue that people an-swer randomly or even lie when answering the question about the referendum.Furthermore, the theoretical expectation is that the contradiction between in-dividual’s answer and what would have been his or her expected answer indifferent circumstances affects some people at a higher degree. That is, accord-ing to theory certain profiles tend to avoid his or her true answer more thanothers. Thirdly, the Catalan case has caused a vivid debate among citizensand politicians. This has encouraged the production of a lot of surveys thatinclude a hypothetical vote in a referendum for catalan secession, which allowsresearchers to have both a large N and to study the temporal dimension.
To study the congruence between individual’s factual answer and what wouldhave been his or her answer according to his or her characteristics we developan imputation model. This model is built by employing different indicatorsthat have been shown to be relevent in order to explain support for secession.The model shows that congruence is high for those that answered “Yes” in thereferendum question and, to a lower extent, for those than aswered “No”. Con-versely, expected and observe outcome differ substantially for the “Abstention”and “Undecided” category.
2 Theoretical background
The theoretical section is divided into two parts: Firstly, we discuss how indeci-sion is translated into surveys and which are the factors that increase congruencebetween individuals’ attitudes and feelings and his or her response in surveys.Secondly, we explain the Catalan case and we stress how some categories couldbe infrarrepresented due to the interaction between individual characteristicsand social factors.
2.1 Indecision and congruence in surveys
Unwillingness to answer items in a survey that are perceived as highly sensi-tive has been a question of major concern on behavioural research (Deming,1944; Biemer et al., 2011). In Political Science, item nonresponse3 or howto get sincere answers have preoccupied methodologists and researchers alike.Nonresponse occurs when an interviewed individual does not answer all of thequestions included in the survey. This bias represents a problem as long asnonresponse is not random: some individuals are more likely to not answersome questions than others, which results in biased estimates and an over-representation of those that answer the question. The typical example is theincome question, included in several surveys. When income data is collectedthrough surveys, they have been associated with a large amount of missing
3We consider ‘nonresponse’ to occur when an individual does not want to answer a partic-ular question included in the survey. This is normally referred as to item nonresponse. Thereis also another type of nonresponse, which occurs when a sampled unit does not respond therequest to be surveyed. The later is a different potential error in surveys, along with coverage,measurement error or sampling errors (Groves et al., 2002). Throughout the article when weuse nonresponse we refer to the first type, that is, item nonresponse.
3
data. The reason is that some individuals are not willing to reveal his or herpersonal income due to the lack of confidenciality and trust towards the sur-vey or the interviewer. The result is that the typical item nonresponse rateto income questions is between 20-40% (Yan, Curtin and Jans, 2010). Itemnonresponse is therefore more likely to occur under certain circumstances, suchas for questions involving some psychological threat. Questions about sexualbehaviour, drinking of alcoholic beverages, and violations of law are more likelyto elicit item nonresponses in most surveys. All in all, the refusal to answer aparticular question (the “dk/na” category) may be the expression of two things:lack of knowledge about the topic or unwillingness to answer the question.
Beyond item nonresponse, individuals may decide to answer the questionbut without revealing his or her true preference or with a certain degree of un-certainty. For instance, individuals can reject to choose a socially undesirableanswer and instead select an uncommitted or neutral option. This has beenobserved in several fields, for instance when investigating extreme right-wingvoting or attitudes: in the recall vote question extreme right-wing voters aremore likely to say that they abstained or that they did not remember which partythey voted for (Hooghe and Reeskens, 2007). Similar evidences have also beenfound on the left-right self-positioning. In some countries, some individuals withright-wing attitudes, instead of placing themselves on the right of the left-rightscale, tend to choose the centre as an uncommitted and neutral position (Knut-sen, 1998). Therefore, even if individuals choose a concrete answer among theoptions offerred to them, there may be a degree of uncertainty, that is, the cho-sen option may not be congruent with what the individual thinks or believes. Inother words, individuals have an underlying probability of uncertainty towardssome issues which equals zero when the chosen answer is congruent with whatthey think. However, even when the option in the survey is deemed as correct,individuals may still be uncertain. For instance, in the vote intention questionsome individuals choose a party because, at that moment, they feel they wouldvote for that particular party, although they are not entirely convinced thatthis will be his or her option. This is why sometimes, in political behaviour,researchers prefer to use the Probability To Vote questoin as an alternative ofthe intention to vote question.
Uncertainty can be expressed by choosing a different answer than the “dk/na”option but one that contains a high degree of ambiguity. For instance, by choos-ing the “I will abstain” category individuals may hide their real preference with-out providing a committed answer. As a consequence, interviewed individualsmay choose another category in the questionnaire which is not his or her mostpreferred option4, but they choose it because some factors drive their option.This also happens, for instance, when some individuals choose the centrist cat-egory but they are rightist, a category that they try to avoid because in somecontexts it is socially sensitive (Weber, 2013). In both cases, the final option hasa very high degree of uncertainty, since the individual that chooses the optionwould have chosen another category if the interview had taken place in anothercircumstances.
Apart from respondent’s individual traits, such as low level of attitude
4Literature has identified factors that increase measurement error, such as survey admin-istration, question difficulty, interviewer effects or responden attributes. It is no the goal ofthis paper to investigate these factors but to consider the role they play when investigatingcatalans support for secession.
4
strength, self-eficacy or political knowledge (Bartels, 1996; Gordon and Segura,1997), the failure to choose the “real” answer is due to two groups of factors:Firstly, survey design and survey administration can generate several errors formultiple reasons, such as a badly written question, the mode of administration(face-to-face versus phone surveys) or a lack of skills by the interviewer to gen-erate a confident environment (Leggett et al., 2003; Podsakoff, 2003; Bowling,2005; Groves, 2005; Chang and Krosnick, 2010).
Secondly, other sources of errors come from factors related to the interac-tion between individuals and their social contexts. These factors are nomallymentioned to explain the occurrence of misestimating in polls in contexts wherepolitical issues are salient. According to Coakley (2008), existing theoretical ex-planations about individuals’ willingness to express their opinions include twoconcepts: social conformity and social ambivalence. Social conformity refers tothe way individuals choose to express themselves. They might elect to do so(1) in neutral form based on their desire to appear polite (also understood as“self-censorship” or “interviewer effect”) (Bradburn et al., 1979), (2) in positiveform based on their pursuit of approval (understood as the “social desirabilitybias,” suggesting that voters experiencing certain kinds of social pressure tendto give false answers in polls) (Nederhof, 1985; Fisher, 1993), or (3) in negativeform based on their fear of isolation (also known as the “spiral-of-silence” effect)(Noelle-Neumann, 1993; Neuwirth, Frederick and Mayo, 2007).
Social ambivalence refers to the level of cross-pressure individuals observe orperceive within their daily lives. Cross-pressure occurs when people experiencenetworks that have different opionions or attitudes. It can also occur when indi-viduals have contradictory feelings or oppinions towards an issue with differentdimensions. Its effects are well-known in political science. For instance, it hasbeen shown that people whose networks involve greater political disagreementare less likely to participate in politics (Mutz, 2002). Behind the cross-pressuremechanism two social psychological processes are suggested to account for thiseffect. First, those embedded in cross-cutting social and political networks aremore likely to hold ambivalent political opinions, which in turn discouragespolitical participation. Second, social accountability pressures in cross-cuttingnetworks can also discourage political involvement.
In conclusion, few works have tried to analyse who is behind the “dk/na”category or whether individuals grouped on it behave differently (Poe, 1988;Calle, 2010). At the same time, individuals have a certain degree of uncertaintywhen choosing
nonresponse can, but need not, incude nonresponse bias in survey estimates(Curtin, Presser and Singer, 2005; Groves, 2006). On the other hand,
2.2 Support for secession. True preferences?
Over the past few years, support for secession in Catalonia has skyrocketed.Most Catalans has traditionally favored greater autonomy over outright seces-sion and support for independence from Spain has been relatively low for gen-erations. As late as 2010, a poll conducted by CEO found that only 25.2% ofthe population favored independence. That number had more than doubled inits latest survey (July 2013) which found a historic high of 55.6% wanting oufof Spain.
Available survey evidence consistently points to an increase in the support
5
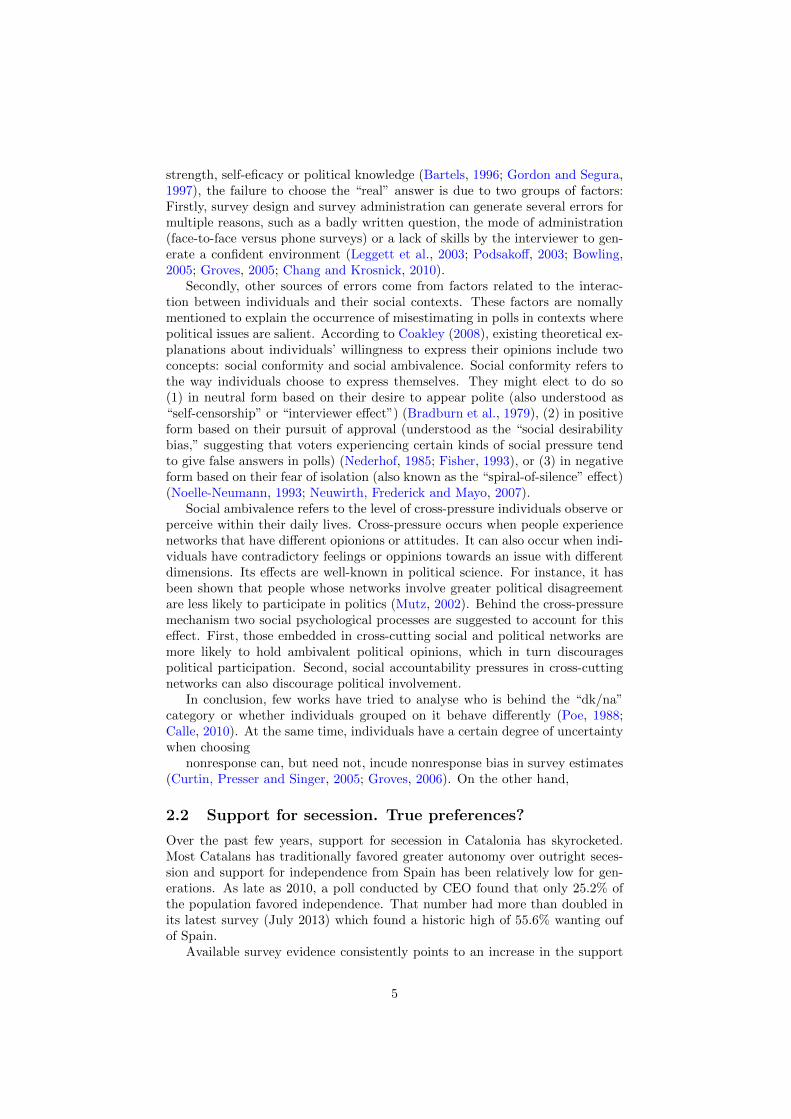
for secession among Catalan population in the last years. Two approaches havebeen traditionally employed to tackle individuals’ secessionist orientations insurveys: territorial preferences and vote in a referendum. In the first approachpeople ask whether they would like Catalonia to be a region of a centralizedSpain, an autonomous comunity of Spain (i.e. the status quo), a state withina federal Spain or the independence for Catalonia. This question has beennormally used to measure Catalans’ support to independence, although there areserious doubts that this indicator is measuring preferences for secession (Munozand Tormos, 2012; Serrano, 2013). This figure shows how the preference fora “State” has notably increased since 2008-20105 until reaching about 47% ofCatalans that want an independent State. 22.8% want to stay in the status quosituation and 21.2% would like to live in a state within a federal Spain.
Figure 1: Evolution of Preferred Constitutional arrangement in Catalonia (1996-2013)
0.0
0.2
0.4
0.6
1995 2000 2005 2010date
p
answer
Autonomous Communities with less competences
Autonomous Community with more competences
Autonomous Community within Spain
Don't know
Other
Region of Spain
State
State within federal Spain
Constitutional preference
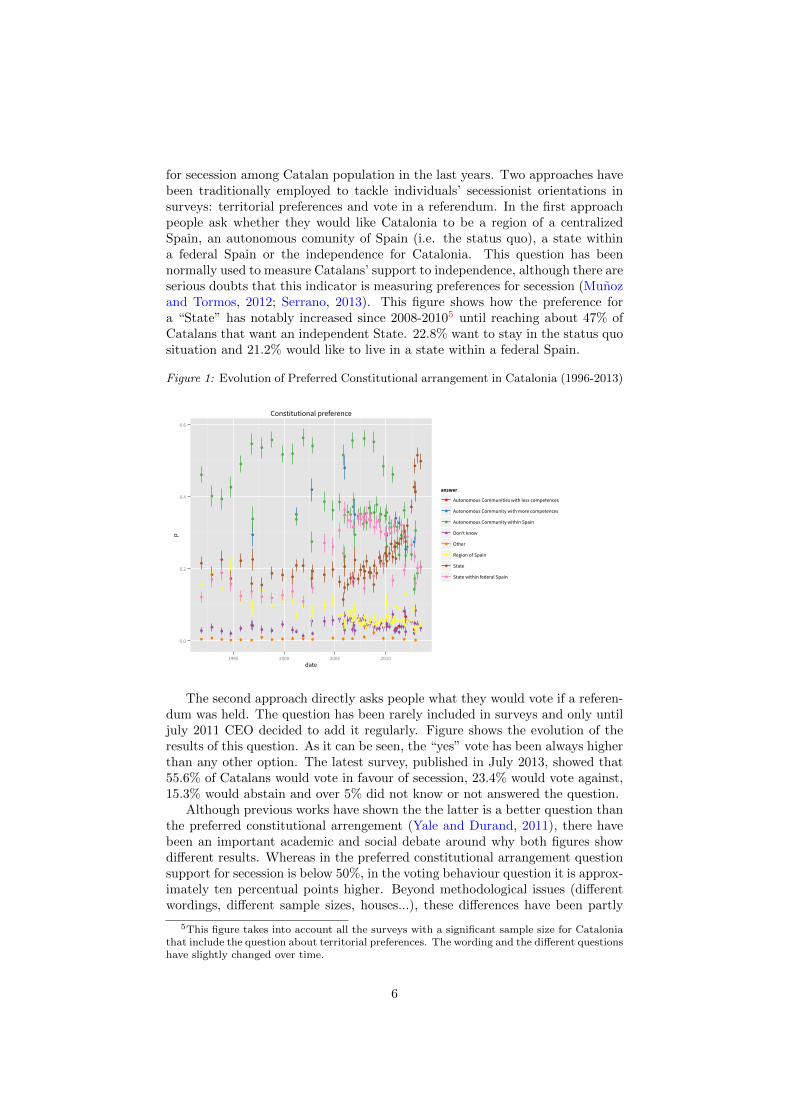
The second approach directly asks people what they would vote if a referen-dum was held. The question has been rarely included in surveys and only untiljuly 2011 CEO decided to add it regularly. Figure shows the evolution of theresults of this question. As it can be seen, the “yes” vote has been always higherthan any other option. The latest survey, published in July 2013, showed that55.6% of Catalans would vote in favour of secession, 23.4% would vote against,15.3% would abstain and over 5% did not know or not answered the question.
Although previous works have shown the the latter is a better question thanthe preferred constitutional arrengement (Yale and Durand, 2011), there havebeen an important academic and social debate around why both figures showdifferent results. Whereas in the preferred constitutional arrangement questionsupport for secession is below 50%, in the voting behaviour question it is approx-imately ten percentual points higher. Beyond methodological issues (differentwordings, different sample sizes, houses...), these differences have been partly
5This figure takes into account all the surveys with a significant sample size for Cataloniathat include the question about territorial preferences. The wording and the different questionshave slightly changed over time.
6

Figure 2: Evolution of Voting Behaviour in a hypothetical referendum of independence(2008-2013)
0.0
0.2
0.4
0.6
2008 2009 2010 2011 2012 2013date
p
answer
Abstention
Blank
Don't know
No
Yes
Vote on referendum
attributed to the incapacity of surveys to tackle individuals’ true preferencestowards secession. In other words, beyond measurement error produced by sur-vey administration and individual’s lack of political sophistication to answerthe question, two sources of errors have been identified and considered whenanalysing the quality of the data produced by these questions. Both ideas sus-tain their claims based on the low support that the “No” vote would receive,according to surveys, if a referendum was held. Surveys indicate that the “No”would be around 30%. The idea, they argue, is that a great amount of Catalancitizens do not express their real preferences and choose instead the “Absten-tion” or the “dk/na” category”.
Firstly, it is argued by some researchers that catalans choose the most so-cially desirable option. This would create a social desirability bias, that is, atendency of respondents to answer questions in a manner that will be viewed fa-vorably by others. This idea is normally sustained by appealing to the existenceof an spiral of silence. According to this theory, Catalan elites have driven Cata-lan citizens preferences (or even identity) to preserve their political and economicinterests and, by doing so, they have alienated citizens whose mental frameworkis Spain (Martınez-Herrera, 2002; Garcia, 2010; Martınez-Herrera, 2010). Thus,the political discourse of the major Catalan parties, mostly focused on identityissues, would have generated alienation among these strata of the population.Therefore, in line with this theory, individuals would be “forced” to hide theirtrue preferences (i.e. mantain the Spanish unity) or to answer ambiguously (forinstance, choosing the option “Abstention”). This effect would be heteroge-neous, as those citizens that feel more Spanish than the average would be morelikely to hide their real preferences than the rest6.
6This hypothesis has not only been analysed by the Academia, but it is a common argumentemployed by some political parties in Catalonia, such as the Partit Popular (PP) or Ciutadans(C’s)
7
The second idea is that some individuals are cross-pressured and, as a result,tend not to reveal his or her true opinion. Cross-pressure would occur whenindividuals live in an environment where opinions towards Catalan secessionare at the opposite extreme of his or her own opinion. An example would bea catalan-speaking citizen that supports secession but lives in a neighbourhoodwhere the majority of the population is against it. In this case, this individualwould not be confident enough to express their real preference. At the sametime, cross-pressure means that some people are under conflicting influences,they have “a combination of characteristics which, in a given context, wouldtend to lead the individual to vote on both sides of a contest” (Berelson, 1986).This process has been observed in different fields, for instance, in individual’sideology. There are individuals that hold rightist views on some issues andleftist on others. When locating themselves on the left-right scale, they feelcross-pressured by these contradicting issues and therefore they are more likelyto choose the central point, seen as a neutral and uncomitted option. Preferencesfor secession can also experience a similar process. For instance, an individualthat is in favour of secession but considers that Catalan politicians are corruptmay end up choosing “Abstention” in the referendum question, although his/herdecision would be “Yes” if the referendum is ever held. Similary, a citizen thatfeels and speaks Spanish in his/her every-day life but favours secession maychoose the “dk/na” or “Abstain” category in the referendum question if, atthat time, the debate is too radical around the identity issue.
Overall, support for secession among the Catalan population has been some-times depicted as an example of item nonresponse and of hidden preferences.Some researchers argue that a great amount of catalan citizens in surveys are notcongruent: they choose a category that would not have been chosen if they hadnot been “forced” by the social circumstances. Since surveys indicate that inde-pendence is majoritarian and recent events have brought many pro-secessionistsupporters into the streets, it is consequentially logical for these researchersthat lack of congruence especially affects those that want to answer “No” in thereferendum question.
3 Research Design
Is support for secession congruent with individuals’ characteristics? Is uncer-tainty distributed equally among Catalan citizens? To answer these questionswe need to develop a model that predict the outcome of a referendum for se-cession for each individual. Thus, the most basic element of the process is theprediction of what would actually do an individual for those surveys that wehave the micro-data. In all the cases we have the observed answer (“yes”, “No”,“Abstain”, “dk/na”) but, as explained above, we consider that all the answerhave a degree of uncertainty. Therefore, this analysis differs from previous im-putation techniques as we are not trying to predict what the individuals that donot answer the question (“dk/na”) would do, but rather what is the predictedoutcome of all individuals in the survey. In other words, regardless of theiranswer in the referendum question, we assume that there is a certain degree ofuncertainty that this answer might be incongruent.
Our empirical analysis is based on all the surveys carried out by CEO thatinclude a referendum question (seven in total). The reason to use all of them is
8
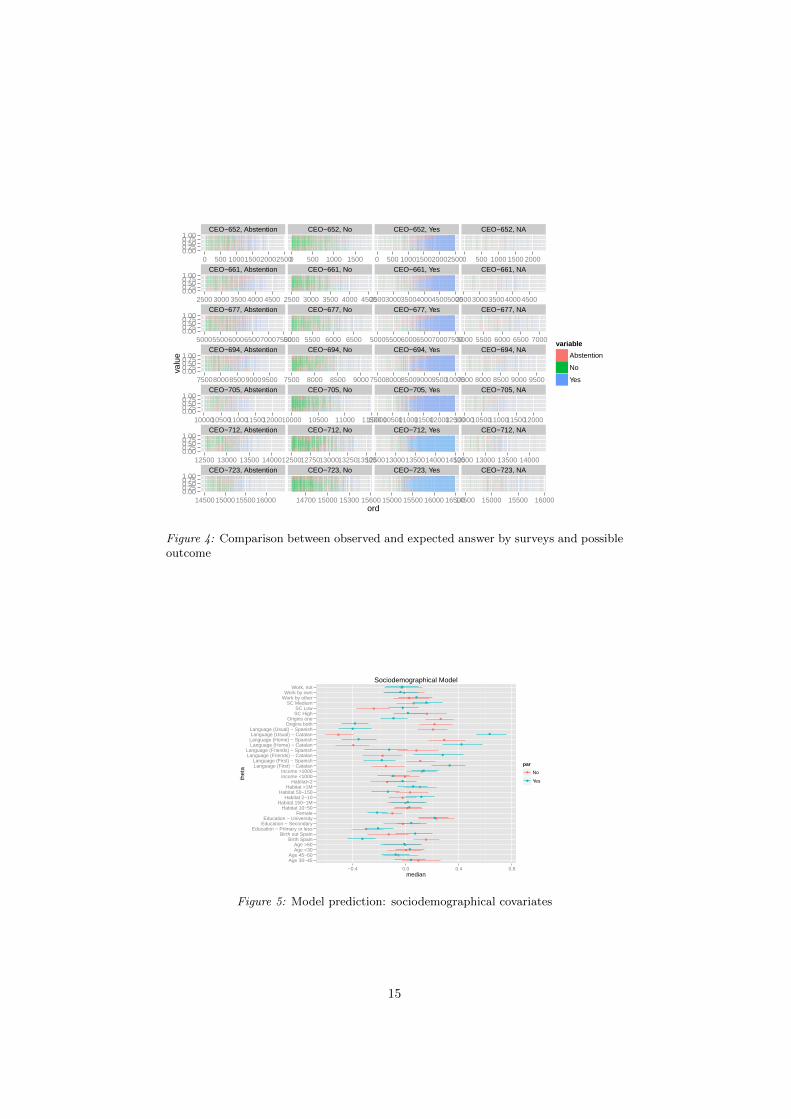
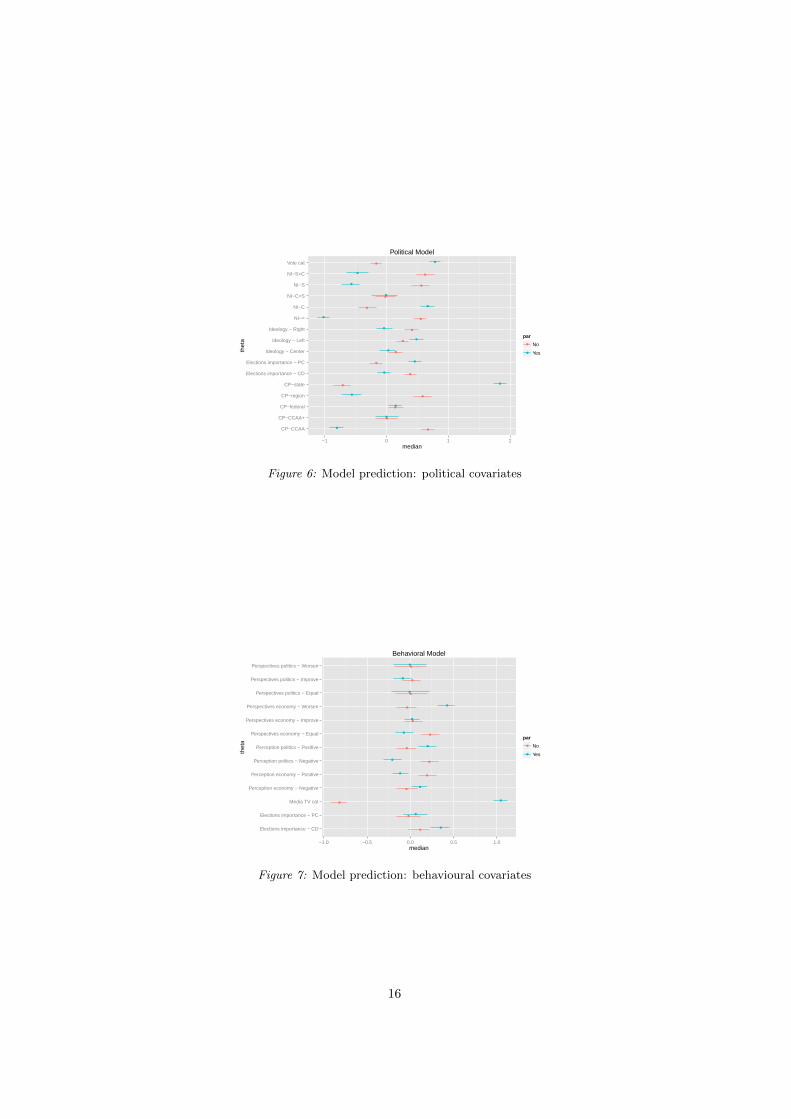
that we can control for temporal diferences, as well as it increases the numberof cases, especially of those that chose the ‘dk/na’ category. Statistical analysisis based on imputation techniques (Huisman, 2000; King et al., 2001). Thismethodology allows for imputing values to individuals on the basis of the infor-mation provided by other individuals who share a similar profile. In order topredict the behavior of individuals in a hypothetical referendum we employ amultinomial logit model. Again, the purpose is not to explain what is associ-ated with the different outcomes, but to predict the missing values (in our case,to predict all the answers in the survey). Following previous literature (Arge-laguet, 2006; Munoz and Tormos, 2012; Sorens, 2012; Serrano, 2013), the modelincludes covariates that are associated with the expected vote in a referendum.Variables included in the imputation model are divided into sociodemographical,political and behavioural.
Sociodemographical variables include age, whether the individual was bornin or out of Spain, education, sex, size of town, income, language (identificationlanguage, language used with friends, language used at home, and language usu-ally spoken), parental origins, self-identified social class and work status. Polit-ical variables are the following: constitutional preference (‘region’, ‘autonomouscommunity’, ‘state within a federal state’ and ‘independence’), importance ofregional or national elections, individuals’ left-right self-placement, subjectivenational identity and whether the individual voted for a Non-State Wide Cata-lan Party. Finally, the behavioural model includes several variables that tapindividuals’ perceptions towards different political issues. This includes whetherindividual watches catalan tv channels, perception of the current situation ofthe economy and of politics, and perspectives of future economy and politics.
By using these variables, we are able to capture the association between theformer questions and the expected vote in a referendum. Inference is done viaMarkov Chain Monte Carlo Methods using weakly informative priors on theeffects of the covariates in the outcomes. Once captured, the model itself is ableto generate, in a pre-specified number of simulations, responses for each of the(missing) individuals.
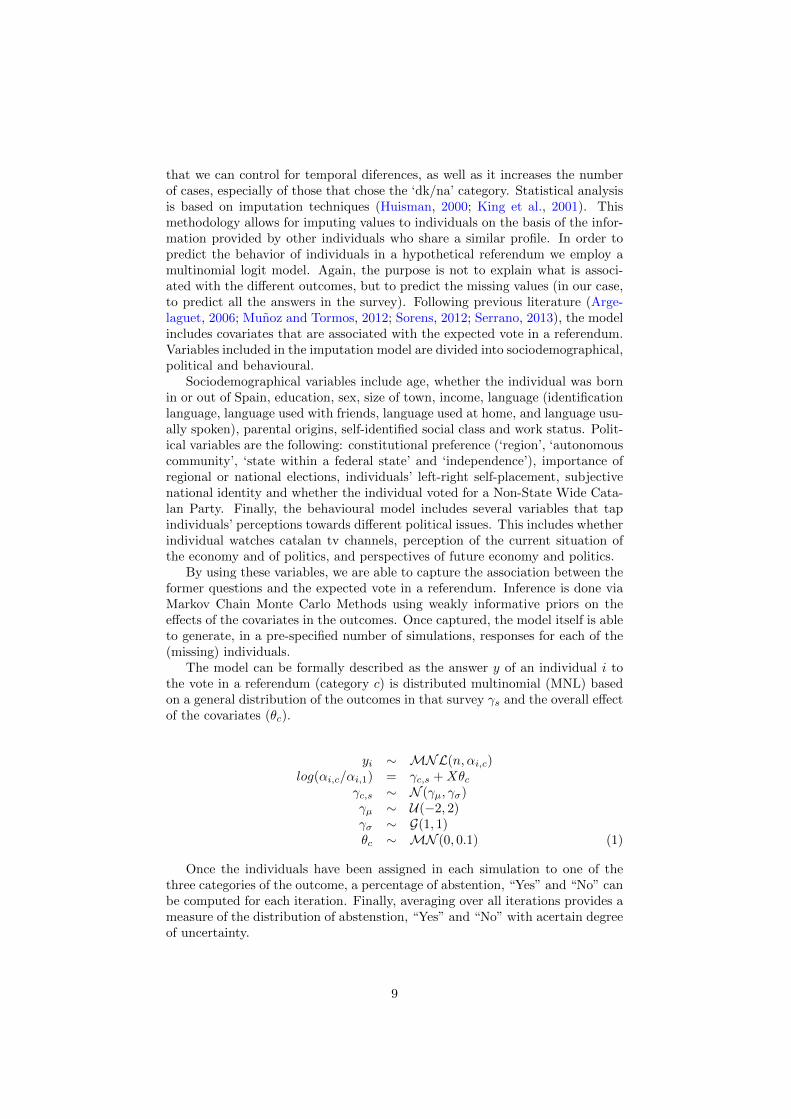
The model can be formally described as the answer y of an individual i tothe vote in a referendum (category c) is distributed multinomial (MNL) basedon a general distribution of the outcomes in that survey γs and the overall effectof the covariates (θc).
yi ∼ MNL(n, αi,c)log(αi,c/αi,1) = γc,s +Xθc
γc,s ∼ N (γµ, γσ)γµ ∼ U(−2, 2)γσ ∼ G(1, 1)θc ∼ MN (0, 0.1) (1)
Once the individuals have been assigned in each simulation to one of thethree categories of the outcome, a percentage of abstention, “Yes” and “No” canbe computed for each iteration. Finally, averaging over all iterations provides ameasure of the distribution of abstenstion, “Yes” and “No” with acertain degreeof uncertainty.
9
4 Results
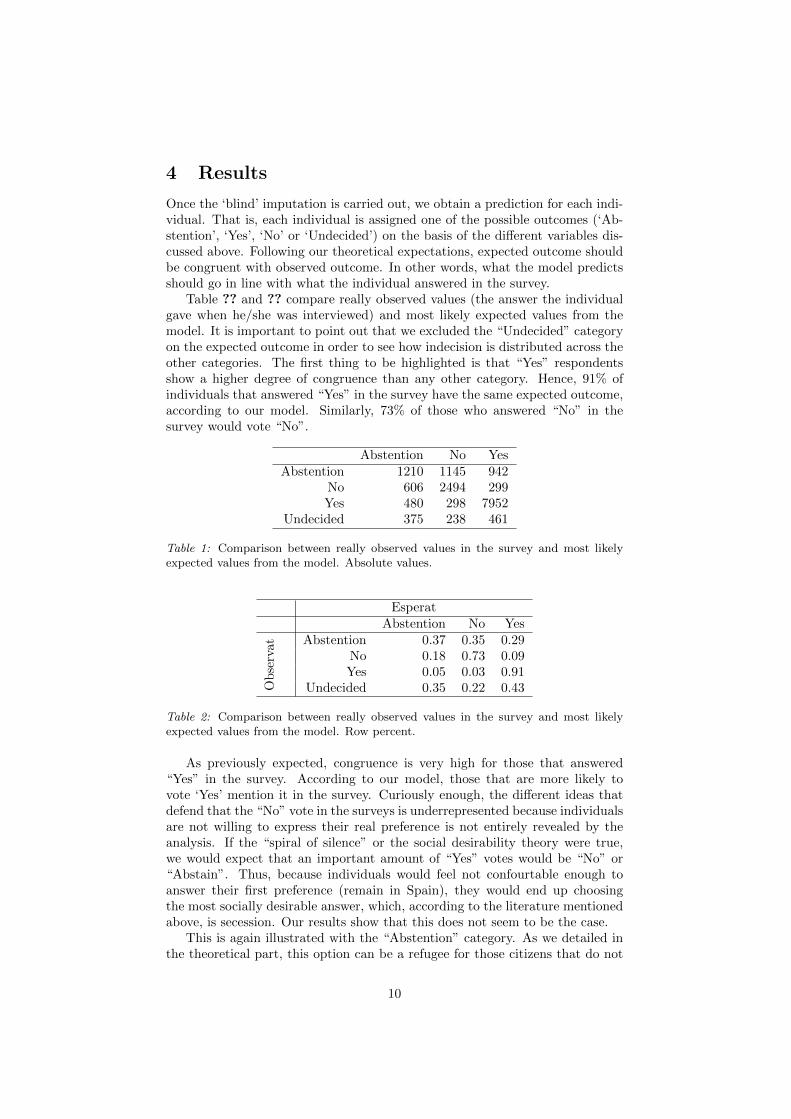
Once the ‘blind’ imputation is carried out, we obtain a prediction for each indi-vidual. That is, each individual is assigned one of the possible outcomes (‘Ab-stention’, ‘Yes’, ‘No’ or ‘Undecided’) on the basis of the different variables dis-cussed above. Following our theoretical expectations, expected outcome shouldbe congruent with observed outcome. In other words, what the model predictsshould go in line with what the individual answered in the survey.
Table ?? and ?? compare really observed values (the answer the individualgave when he/she was interviewed) and most likely expected values from themodel. It is important to point out that we excluded the “Undecided” categoryon the expected outcome in order to see how indecision is distributed across theother categories. The first thing to be highlighted is that “Yes” respondentsshow a higher degree of congruence than any other category. Hence, 91% ofindividuals that answered “Yes” in the survey have the same expected outcome,according to our model. Similarly, 73% of those who answered “No” in thesurvey would vote “No”.
Abstention No YesAbstention 1210 1145 942
No 606 2494 299Yes 480 298 7952
Undecided 375 238 461
Table 1: Comparison between really observed values in the survey and most likelyexpected values from the model. Absolute values.
EsperatAbstention No Yes
Ob
serv
at Abstention 0.37 0.35 0.29No 0.18 0.73 0.09Yes 0.05 0.03 0.91
Undecided 0.35 0.22 0.43
Table 2: Comparison between really observed values in the survey and most likelyexpected values from the model. Row percent.
As previously expected, congruence is very high for those that answered“Yes” in the survey. According to our model, those that are more likely tovote ‘Yes’ mention it in the survey. Curiously enough, the different ideas thatdefend that the “No” vote in the surveys is underrepresented because individualsare not willing to express their real preference is not entirely revealed by theanalysis. If the “spiral of silence” or the social desirability theory were true,we would expect that an important amount of “Yes” votes would be “No” or“Abstain”. Thus, because individuals would feel not confourtable enough toanswer their first preference (remain in Spain), they would end up choosingthe most socially desirable answer, which, according to the literature mentionedabove, is secession. Our results show that this does not seem to be the case.
This is again illustrated with the “Abstention” category. As we detailed inthe theoretical part, this option can be a refugee for those citizens that do not
10
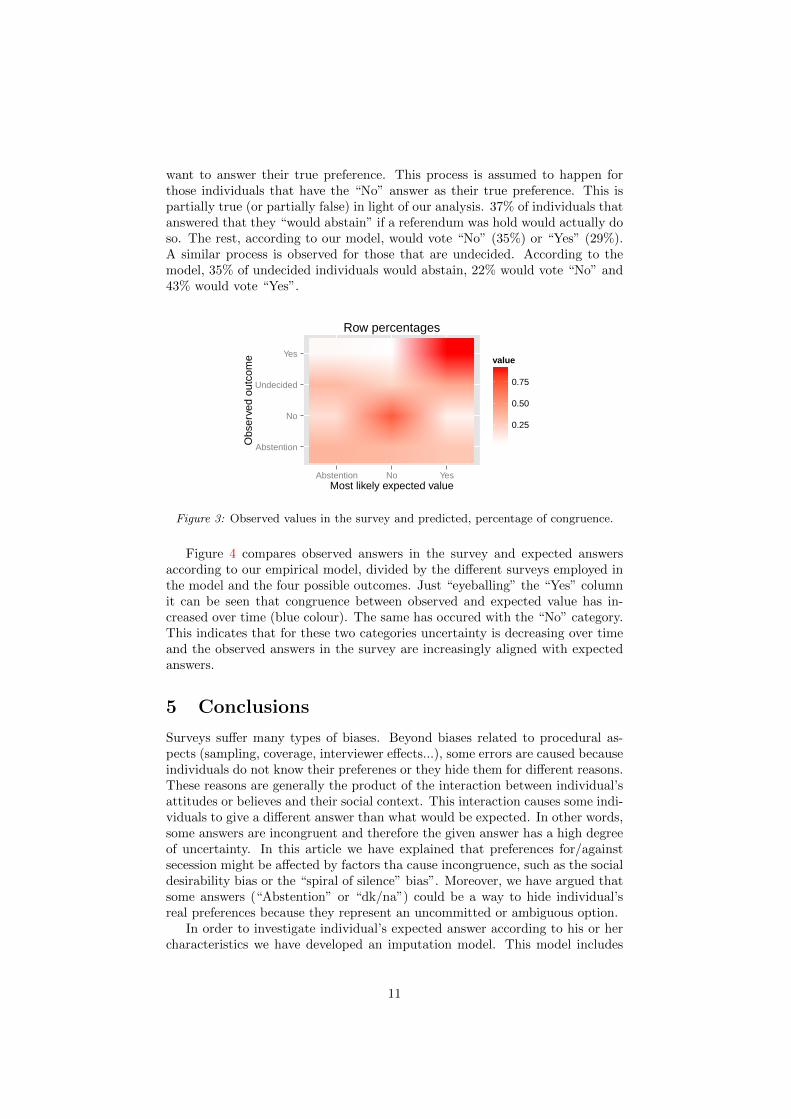
want to answer their true preference. This process is assumed to happen forthose individuals that have the “No” answer as their true preference. This ispartially true (or partially false) in light of our analysis. 37% of individuals thatanswered that they “would abstain” if a referendum was hold would actually doso. The rest, according to our model, would vote “No” (35%) or “Yes” (29%).A similar process is observed for those that are undecided. According to themodel, 35% of undecided individuals would abstain, 22% would vote “No” and43% would vote “Yes”.
Abstention
No
Undecided
Yes
Abstention No YesMost likely expected value
Obs
erve
d ou
tcom
e
0.25
0.50
0.75
value
Row percentages
Figure 3: Observed values in the survey and predicted, percentage of congruence.
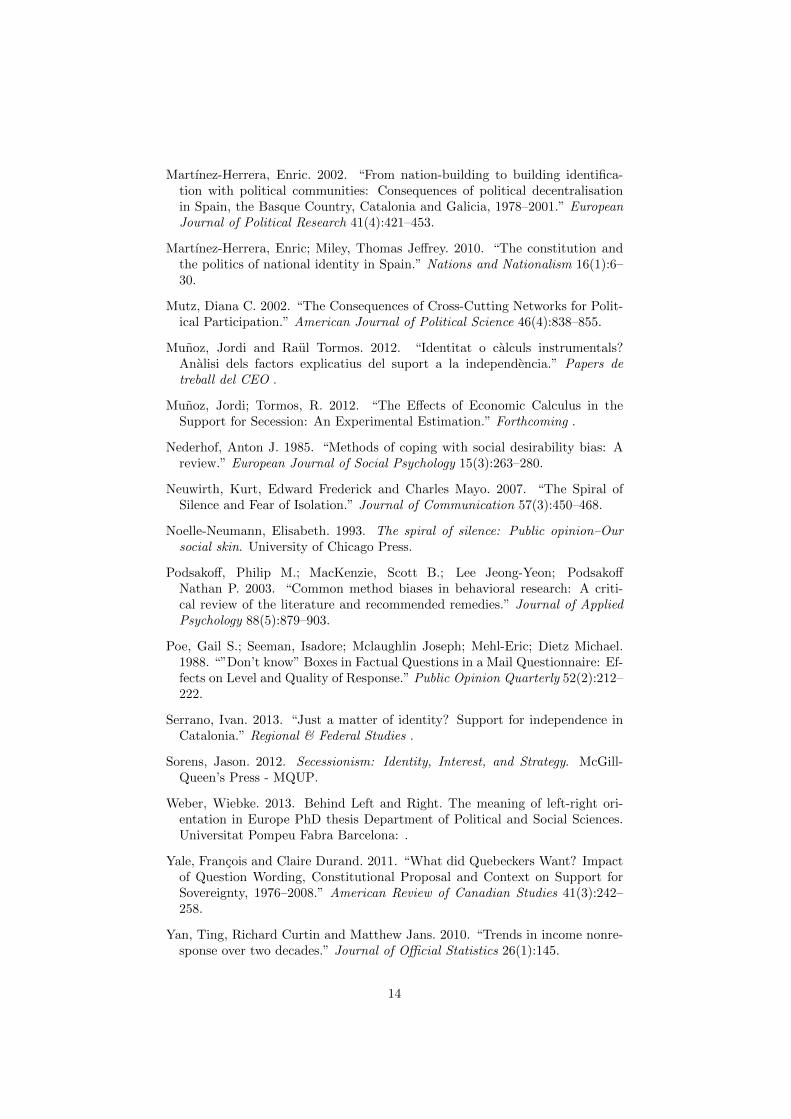
Figure 4 compares observed answers in the survey and expected answersaccording to our empirical model, divided by the different surveys employed inthe model and the four possible outcomes. Just “eyeballing” the “Yes” columnit can be seen that congruence between observed and expected value has in-creased over time (blue colour). The same has occured with the “No” category.This indicates that for these two categories uncertainty is decreasing over timeand the observed answers in the survey are increasingly aligned with expectedanswers.
5 Conclusions
Surveys suffer many types of biases. Beyond biases related to procedural as-pects (sampling, coverage, interviewer effects...), some errors are caused becauseindividuals do not know their preferenes or they hide them for different reasons.These reasons are generally the product of the interaction between individual’sattitudes or believes and their social context. This interaction causes some indi-viduals to give a different answer than what would be expected. In other words,some answers are incongruent and therefore the given answer has a high degreeof uncertainty. In this article we have explained that preferences for/againstsecession might be affected by factors tha cause incongruence, such as the socialdesirability bias or the “spiral of silence” bias”. Moreover, we have argued thatsome answers (“Abstention” or “dk/na”) could be a way to hide individual’sreal preferences because they represent an uncommitted or ambiguous option.
In order to investigate individual’s expected answer according to his or hercharacteristics we have developed an imputation model. This model includes
11
several sociodemographic, political or behavioural variables and impute the mostlikely answer to all individuals in the survey. Observed and expected answersare then compared in order to check whether they are congruent.
Findings show that the “Yes” category shows a high degree of congruency.Thus, those that answer the “Yes” category in the survey do what would havebeen expected according to his/her profile. The “No” category also shows a highdegree of congruent results, although a significant part would be more likely toabstain. Finally, those that choose the “Abstention” and the “dk/na” categorywould be, according to our model, likely to behave differently. More concretely,a third of the “observed” abstainers would be likely to vote “No” and almosthalf of the “observed” undecided would be likely to vote “Yes”.
In conclusion, this article sheds light on the idea of congruence betweenobserved answers in a survey and expected answers. This has been an issuethat has occupied the Catalan political debate in the last two years. Spmeresearchers have insisted that this question cannot be trusted because of the lackof congruence between individual’s profile and his or her answer and because ofthe existence of a social desirability bias or an spiral of silence. We show thatthere are little evidences that these processes are at play. Errors might indeedbe produced, among others, by measurement error, interviewer’s effect or otherprocedural aspects, factors that have little to do with all the other processesinvestigated here.
Appendix
References
Argelaguet, Jordi. 2006. “Subjective National Identities in Catalonia.” Nation-alism and Ethnic Politics 12(3-4):431–454.
Bartels, Larry M. 1996. “Uninformed Votes: Information Effects in PresidentialElections.” American Journal of Political Science 40(1):1.
Berelson, Bernard R. 1986. Voting: A study of opinion formation in a presi-dential campaign. University of Chicago Press.
Biemer, Paul P, Robert M Groves, Lars E Lyberg, Nancy A Mathiowetz andSeymour Sudman. 2011. Measurement errors in surveys. Vol. 173 Wiley. com.
Bowling, Ann. 2005. “Mode of questionnaire administration can have seriouseffects on data quality.” Journal of Public Health 27(3):281–291.
Bradburn, Norman M, Seymour Sudman, E Blair, W Locander, C Miles, ESinger and C Stocking. 1979. Improving interview method and questionnairedesign: Response effects to threatening questions in survey research. Jossey-Bass San Francisco, CA.
Calle, Luis de la; Martınez, Alvaro; Orriols Lluis. 2010. “Voting without ideol-ogy. Evidence from Spain (1979-2008).” Revista Espanola de InvestigacionesSociologicas 129:107–129.
12
Chang, Linchiat and Jon A. Krosnick. 2010. “Comparing Oral Interviewingwith Self-Administered Computerized QuestionnairesAn Experiment.” PublicOpinion Quarterly 74(1):154–167.
Coakley, Johns. 2008. “Militant Nationalist Electoral Support: A MeasurementDilemma.” International Journal of Public Opinion Research 20(2):224–236.
Curtin, Richard, Stanley Presser and Eleanor Singer. 2005. “Changes in Tele-phone Survey Nonresponse over the Past Quarter Century.” Public OpinionQuarterly 69(1):87–98.
Deming, W. Edwards. 1944. “On Errors in Surveys.” American SociologicalReview 9(4):4.
Fisher, Robert J. 1993. “Social Desirability Bias and the Validity of IndirectQuestioning.” Journal of Consumer Research 20(2):303–315.
Garcia, Cesar. 2010. “Nationalism and Public Opinion in Contemporary Spain:The Demobilization of the Working Class in Catalonia.” Global Media Journal10(17).
Gordon, Stacy B. and Gary M. Segura. 1997. “Cross–National Variation in thePolitical Sophistication of Individuals: Capability or Choice?” The Journalof Politics 59:126–147.
Groves, R.M. 2005. Survey Errors and Survey Costs. Wiley Series in Probabilityand Statistics Wiley.
Groves, Robert M. 2006. “Nonresponse Rates and Nonresponse Bias in House-hold Surveys.” Public Opinion Quarterly 70(5):646–675.
Groves, Robert M, Don Dillman, John L Eltinge and Roderick JA Little. 2002.Survey nonresponse. Wiley New York.
Hooghe, Marc and Tim Reeskens. 2007. “Are cross-national surveys the best wayto study the extreme-right vote in Europe?” Patterns of prejudice 41(2):177–196.
Huisman, Mark. 2000. “Imputation of Missing Item Responses: Some SimpleTechniques.” Quality and Quantity 34(4):331–351.
King, Gary, James Honaker, Anne Joseph and Kenneth Scheve. 2001. “Analyz-ing Incomplete Political Science Data: An Alternative Algorithm for MultipleImputation.” American Political Science Review null:49–69.
Knutsen, Oddbjørn. 1998. “Europeans move towards the center: a comparativelongitudinal study of left-right self-placement in Western Europe.” Interna-tional Journal of Public Opinion Research 10(4):292–316.
Leggett, Christopher G., Naomi S. Kleckner, Kevin J. Boyle, John W. Dufieldand Robert Cameron Mitchell. 2003. “Social Desirability Bias in Contin-gent Valuation Surveys Administered Through In-Person Interviews.” LandEconomics 79(4):561–575.
13
Martınez-Herrera, Enric. 2002. “From nation-building to building identifica-tion with political communities: Consequences of political decentralisationin Spain, the Basque Country, Catalonia and Galicia, 1978–2001.” EuropeanJournal of Political Research 41(4):421–453.
Martınez-Herrera, Enric; Miley, Thomas Jeffrey. 2010. “The constitution andthe politics of national identity in Spain.” Nations and Nationalism 16(1):6–30.
Mutz, Diana C. 2002. “The Consequences of Cross-Cutting Networks for Polit-ical Participation.” American Journal of Political Science 46(4):838–855.
Munoz, Jordi and Raul Tormos. 2012. “Identitat o calculs instrumentals?Analisi dels factors explicatius del suport a la independencia.” Papers detreball del CEO .
Munoz, Jordi; Tormos, R. 2012. “The Effects of Economic Calculus in theSupport for Secession: An Experimental Estimation.” Forthcoming .
Nederhof, Anton J. 1985. “Methods of coping with social desirability bias: Areview.” European Journal of Social Psychology 15(3):263–280.
Neuwirth, Kurt, Edward Frederick and Charles Mayo. 2007. “The Spiral ofSilence and Fear of Isolation.” Journal of Communication 57(3):450–468.
Noelle-Neumann, Elisabeth. 1993. The spiral of silence: Public opinion–Oursocial skin. University of Chicago Press.
Podsakoff, Philip M.; MacKenzie, Scott B.; Lee Jeong-Yeon; PodsakoffNathan P. 2003. “Common method biases in behavioral research: A criti-cal review of the literature and recommended remedies.” Journal of AppliedPsychology 88(5):879–903.
Poe, Gail S.; Seeman, Isadore; Mclaughlin Joseph; Mehl-Eric; Dietz Michael.1988. “”Don’t know” Boxes in Factual Questions in a Mail Questionnaire: Ef-fects on Level and Quality of Response.” Public Opinion Quarterly 52(2):212–222.
Serrano, Ivan. 2013. “Just a matter of identity? Support for independence inCatalonia.” Regional & Federal Studies .
Sorens, Jason. 2012. Secessionism: Identity, Interest, and Strategy. McGill-Queen’s Press - MQUP.
Weber, Wiebke. 2013. Behind Left and Right. The meaning of left-right ori-entation in Europe PhD thesis Department of Political and Social Sciences.Universitat Pompeu Fabra Barcelona: .
Yale, Francois and Claire Durand. 2011. “What did Quebeckers Want? Impactof Question Wording, Constitutional Proposal and Context on Support forSovereignty, 1976–2008.” American Review of Canadian Studies 41(3):242–258.
Yan, Ting, Richard Curtin and Matthew Jans. 2010. “Trends in income nonre-sponse over two decades.” Journal of Official Statistics 26(1):145.
14
CEO−652, Abstention CEO−652, No CEO−652, Yes CEO−652, NA
CEO−661, Abstention CEO−661, No CEO−661, Yes CEO−661, NA
CEO−677, Abstention CEO−677, No CEO−677, Yes CEO−677, NA
CEO−694, Abstention CEO−694, No CEO−694, Yes CEO−694, NA
CEO−705, Abstention CEO−705, No CEO−705, Yes CEO−705, NA
CEO−712, Abstention CEO−712, No CEO−712, Yes CEO−712, NA
CEO−723, Abstention CEO−723, No CEO−723, Yes CEO−723, NA
0.000.250.500.751.00
0.000.250.500.751.00
0.000.250.500.751.00
0.000.250.500.751.00
0.000.250.500.751.00
0.000.250.500.751.00
0.000.250.500.751.00
0 500 10001500200025000 500 1000 1500 0 500 10001500200025000 500 1000 1500 2000
2500 3000 3500 4000 4500 2500 3000 3500 4000 450025003000350040004500500025003000350040004500
5000550060006500700075005000 5500 6000 6500 5000550060006500700075005000 5500 6000 6500 7000
75008000850090009500 7500 8000 8500 9000 75008000850090009500100007500 8000 8500 9000 9500
100001050011000115001200010000 10500 11000 115001000010500110001150012000125001000010500110001150012000
12500 13000 13500 140001250012750130001325013500125001300013500140001450012500 13000 13500 14000
14500150001550016000 14700 15000 15300 15600 15000 15500 16000 1650014500 15000 15500 16000ord
valu
e
variable
Abstention
No
Yes
Figure 4: Comparison between observed and expected answer by surveys and possibleoutcome
●●
●●
● ●
●●
●●
● ●
● ●
● ●
●●
●●
●●
●●
● ●
●●
●●
● ●
●●
●●
● ●
●●
● ●
●●
● ●
●●
● ●
●●
●●
●●
●●
● ●
● ●
● ●
●●
●●
Age 30−45Age 45−60
Age <30Age >60
Birth SpainBirth out Spain
Education − Primary or lessEducation − SecondaryEducation − University
FemaleHabitat 10−50
Habitat 150−1MHabitat 2−10
Habitat 50−150Habitat >1M
Habitat<2Income <1000Income >1000
Language (First) − CatalanLanguage (First) − Spanish
Language (Friends) − CatalanLanguage (Friends) − Spanish
Language (Home) − CatalanLanguage (Home) − SpanishLanguage (Usual) − CatalanLanguage (Usual) − Spanish
Origins bothOrigins one
SC HighSC Low
SC MediumWork by otherWork by own
Work, not
−0.4 0.0 0.4 0.8median
thet
a
par
●
●
No
Yes
Sociodemographical Model
Figure 5: Model prediction: sociodemographical covariates
15
●●
●●
●●
●●
●●
●●
●●
●●
●●
●●
●●
●●
●●
●●
●●
●●
CP−CCAA
CP−CCAA+
CP−federal
CP−region
CP−state
Elections importance − CD
Elections importance − PC
Ideology − Center
Ideology − Left
Ideology − Right
NI−=
NI−C
NI−C>S
NI−S
NI−S>C
Vote cat
−1 0 1 2median
thet
a
par
●
●
No
Yes
Political Model
Figure 6: Model prediction: political covariates
●●
●●
●●
●●
●●
●●
●●
●●
●●
●●
●●
●●
●●
Elections importance − CD
Elections importance − PC
Media TV cat
Perception economy − Negative
Perception economy − Positive
Perception politics − Negative
Perception politics − Positive
Perspectives economy − Equal
Perspectives economy − Improve
Perspectives economy − Worsen
Perspectives politics − Equal
Perspectives politics − Improve
Perspectives politics − Worsen
−1.0 −0.5 0.0 0.5 1.0median
thet
a
par
●
●
No
Yes
Behavioral Model
Figure 7: Model prediction: behavioural covariates
16


![Undecided Past – National Identities and Politics of Diversity: The … · 2019. 2. 25. · Undecided Past [217] ments of the state to design an ‘exclusionary closure’ with](https://img.pdfslide.net/doc/110x75/5fcd771884c05c62001a50e7/undecided-past-a-national-identities-and-politics-of-diversity-the-2019-2-25.jpg)