Embed Size (px)
Citation preview
Decision Analysis and Resolution Guidelines
Version: 2.0
Adaptive Processes Consulting Pvt. Ltd.
An ISO 9001:2000 Certified Company
#51, 3rd Cross, Church Street, Koramangala 6th Block Annex, Bangalore - 560047
e-mail: [email protected]
www.AdaptiveProcesses.com
This document is the property of and proprietary to Adaptive Processes Consulting Pvt. Ltd. Contents of this document should not be disclosed to any unauthorized person. This document may not, in whole or in part, be reduced, reproduced, stored in a retrieval system, translated, or transmitted in any form or by any means, electronic or mechanical.

DAR Guidelines
Version 2.0 © Adaptive Processes Consulting Pvt Ltd Page 2 of 16
1. Introduction .................................................................................................................................... 3
2. When Can We Apply Dar? ............................................................................................................ 3
3. Basic Dar Approach ....................................................................................................................... 3
4. Dar Tools ......................................................................................................................................... 4
4.1. Pareto Analysis ............................................................................................................................... 4
4.2. Paired Comparison Analysis ......................................................................................................... 5
4.3. Pugh Matrix .................................................................................................................................... 6
4.4. Decision Tree Analysis ................................................................................................................... 8
4.5. Cost/ Benefit Analysis .................................................................................................................. 13
5. Document Details .......................................................................................................................... 16
6. Revision History ........................................................................................................................... 16

DAR Guidelines
Version 2.0 © Adaptive Processes Consulting Pvt Ltd Page 3 of 16
1. Introduction
DAR techniques help to make best decisions possible with the information that we have. With the tools that are
mentioned here, we will be able to map out the likely consequences of decisions, work out the importance of
individual factors and choose the best course of action to take.
2. When Can We Apply Dar?
Some examples
Technical Decisions Project Management Decisions
Architecture Risk Management Approaches
Designs, Platforms Risk Mitigation Plans
Process Tailoring (including Life Cycle Selection)
Technical Solution
Testing Approaches
3. Basic Dar Approach
DAR Guidelines
Version 2.0 © Adaptive Processes Consulting Pvt Ltd Page 4 of 16
4. Dar Tools
While there are multiple tools and techniques to carry out DAR, some of the common ones are listed here.
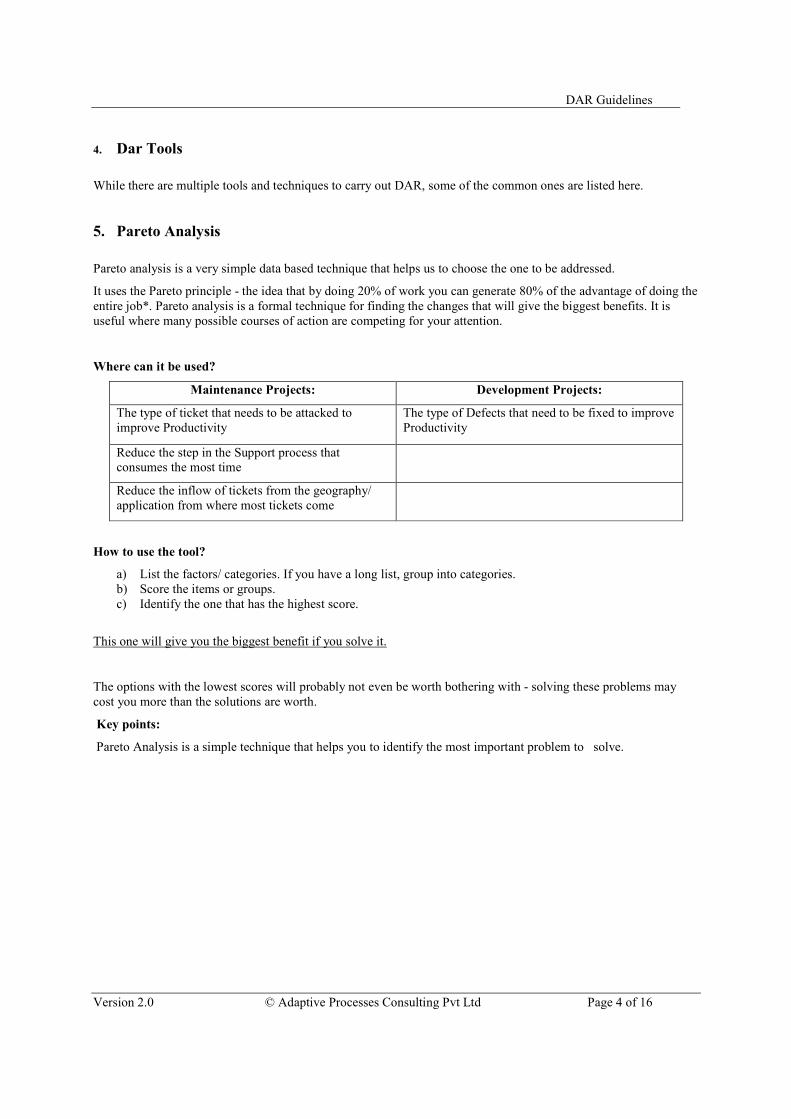
5. Pareto Analysis
Pareto analysis is a very simple data based technique that helps us to choose the one to be addressed.
It uses the Pareto principle - the idea that by doing 20% of work you can generate 80% of the advantage of doing the entire job*. Pareto analysis is a formal technique for finding the changes that will give the biggest benefits. It is useful where many possible courses of action are competing for your attention.
Where can it be used?
Maintenance Projects: Development Projects:
The type of ticket that needs to be attacked to improve Productivity
The type of Defects that need to be fixed to improve Productivity
Reduce the step in the Support process that consumes the most time
Reduce the inflow of tickets from the geography/ application from where most tickets come
How to use the tool?
a) List the factors/ categories. If you have a long list, group into categories. b) Score the items or groups. c) Identify the one that has the highest score.
This one will give you the biggest benefit if you solve it.
The options with the lowest scores will probably not even be worth bothering with - solving these problems may cost you more than the solutions are worth.
Key points:
Pareto Analysis is a simple technique that helps you to identify the most important problem to solve.

DAR Guidelines
Version 2.0 © Adaptive Processes Consulting Pvt Ltd Page 5 of 16
6. Paired Comparison Analysis (Working Out the Relative Importance of Different Options)
Paired Comparison Analysis helps to work out the importance of a number of options relative to each other. It is particularly useful when we do not have objective data to base this on.
This makes it easy to choose the most important problem to solve, or select the solution that will give the greatest advantage. Paired Comparison Analysis helps to set priorities where there are conflicting demands on resources.
How to use tool?
1. List all options 2. Draw up a grid with each option as both a row and a column header 3. Compare each option with each other option, one-by-one. For each comparison, decide which of the two
options is most important, and then assign a score to show how much more important it is. 4. Consolidate the comparisons so that each option is given a percentage importance.
Example:
As a simple example, a Project Manager is looking at ways to improve the skill level of the Team. The options are available are:
a) Have a classroom training (A) b) Provide sample projects and have teams work on them (B) c) Assign team to other Projects and allow them to work as shadow resources (C) d) Allow team members to study and work and come out with presentations and share their knowledge to
others (D)
The Paired Comparison Analysis table (not filled up) for this example is:
(A) (B) (C) (D)
(A)
(B)
(C)
(D)
Writes down the letter of the most important option, and the relative difference in their importance. An example of how this might look is shown in the next table:

DAR Guidelines
Version 2.0 © Adaptive Processes Consulting Pvt Ltd Page 6 of 16
Example Paired Comparison Analysis Table (filled in):
(A) (B) (C) (D)
(A) A,2 C,1 A,1
(B) C,1 B,1
(C) C,2
(D)
Add up the A, B, C and D values, and convert each into a percentage of the total.
This gives these totals:
A = 3 (37.5%)
B = 1 (12.5%)
C = 4 (50%)
D = 0.
Here, it is most beneficial to assign team to other Projects (C) and then to provide sample Projects. Key points:
Paired Comparison Analysis is a good way of weighing up the relative importance of different courses of action. It is useful where priorities are not clear, or are competing in importance. The tool provides a framework for comparing each course of action against all others, and helps to show the difference in importance between factors.
7. Pugh Matrix (Making a Choice Where Many Factors Must be balanced)
Pugh Matrix is a useful technique to use for making a decision. It is most effective when we have a number of good alternatives and many factors to take into account.
How to use tool?
Please refer the Pugh Matrix Template in the QMS
Step 1: Please list all parameters/ criteria in Column B from Row 8 downwards
Step 2: Please mention in Column C under "Importance", the weightage that the parameters carries in taking the decision. It is suggested that the weightage range from 1 to 10, 1 being the lowest and 10 being the highest
Step 3: Please list in Row 7, Column D Onwards, all the possible solutions/ approaches to solve the problem on hand
Step 4: In Column D, against each parameter mention the value of "0"
Step 5: For every possible solution/ approach listed from Column E onwards, provide a value between -2 and +2, relative to the solution/ approach mentioned in Column D. If the solution being evaluated is significantly better than the one in Column D for that parameter, provide a value of +2 and if it is slightly better, provide a value of +1. If the solution being evaluated is worse than that in Column D for the parameter in consideration, provide a value of -1 if is slightly worse and -2 if it is significantly worse. If both the solutions are similar for that parameter, provide value of 0.

DAR Guidelines
Version 2.0 © Adaptive Processes Consulting Pvt Ltd Page 7 of 16
Step 6: If you have not inserted additional rows, please ensure that the formula currently mentioned in Row 18 considers them. If you have inserted additional columns, please copy the formula to Row 18 of that column as well.
Step 7: The formula in Row 18 computes the weightage average reckoning the importance of each parameter and the associated value against each parameter
Step 8: Please choose the solution/ approach that has the highest weighted average value
Example:
A team wants to implement user entry validations in a Web Application.
In that scenario, the available options are:
a) Front End Validations b) Database level validations
The factors and their importance (on a scale of 1 to 10, 10 indicating that it is of high importance) that the team felt appropriate to consider in the scenario are:
Factor Importance
1. Support different Browsers/Versions 09 2. Response Time (Performance) 10 3. Support different front ends/devices 10 4. Business rule related validations 08
First, draw up the table shown in Figure 1, and score each option by how well it satisfies each factor:
Figure 1: Example Pugh Matrix showing Assessment of how each solution fares against the factors
Possible Alternatives
Importance Front end
Validations Database Level
Validations
Support different Browsers/Versions 9 -1 2
Response Time (Performance) 10 2 -2
Support different front ends/devices 10 -2 2
Business rule related validations 8 -1 2
Figure 2: Example Pugh Matrix showing Weighted Average Assessment of each solution
Possible Alternatives
Importance Front end
Validations Database Level
Validations
Support different Browsers/Versions 9 -1 2
Response Time (Performance) 10 2 -2
Support different front ends/devices 10 -2 2
Business rule related validations 8 -1 2
Weighted Average -0.4595 0.9189

DAR Guidelines
Version 2.0 © Adaptive Processes Consulting Pvt Ltd Page 8 of 16
Database level validations are the obvious choice in the current context. Key points:
Pugh Matrix helps to decide between several options, while taking many different factors into account
8. Decision Tree Analysis (Choosing between Options by projecting likely outcomes)
Decision Trees are excellent tools for helping to choose between several courses of action. They provide a highly effective structure within which we can lay out options and investigate the possible outcomes of choosing those options. They also help to form a balanced picture of the risks and rewards associated with each possible course of action.
How to use tool:
1. Start a Decision Tree with a decision that you need to make. Draw a small square to represent this towards the left of a large piece of paper.
2. From this box draw out lines towards the right for each possible solution, and write that solution along the line. Keep the lines apart as far as possible so that we can expand our thoughts.
3. At the end of each line, consider the results. 4. If the result of taking that decision is uncertain, draw a small circle. 5. If the result is another decision that we need to make, draw another square. 6. (Squares represent decisions, and circles represent uncertain outcomes. Write the decision or factor
above the square or circle.) 7. If you have completed the solution at the end of the line, just leave it blank. 8. Starting from the new decision squares on the diagram, draw out lines representing the options that you
could select. 9. From the circles draw lines representing possible outcomes. Again make a brief note on the line saying
what it means. Keep on doing this until you have drawn out as many of the possible outcomes and decisions as you can see leading on from the original decisions. An example of the sort of thing you will end up with is shown in Figure 1:

DAR Guidelines
Version 2.0 © Adaptive Processes Consulting Pvt Ltd Page 9 of 16
Once you have done this, review your tree diagram. Challenge each square and circle to see if there are any solutions or outcomes you have not considered. If there are, draw them in. If necessary, redraft your tree if parts of it are too congested or untidy. You should now have a good understanding of the range of possible outcomes of your decisions. Evaluating the Decision Tree
This is where we can work out which option has the greatest worth.
1. Start by assigning a cash value or score to each possible outcome. 2. Estimate how much it would be worth if that outcome came about. 3. Look at each circle (representing an uncertainty point) and estimate the probability of each outcome. If
you use percentages, the total must come to 100% at each circle. If you use fractions, these must add up to 1. If you have data on past events you may be able to make rigorous estimates of the probabilities. Otherwise write down your best guess.

DAR Guidelines
Version 2.0 © Adaptive Processes Consulting Pvt Ltd Page 10 of 16
This will give you a tree like the one in fig 2
Calculating Tree Values
Once you have worked out the value of the outcomes, and have assessed the probability of the outcomes of uncertainty, it is time to start calculating the values that will help to make our decision.
1. Start on the right hand side of the decision tree, and work back towards the left. 2. As you complete a set of calculations on a node (decision square or uncertainty circle), all you need
to do is to record the result. You can ignore all the calculations that lead to that result from then on.
Calculating the Value of Uncertain Outcome Nodes
Where you are calculating the value of uncertain outcomes (circles on the diagram), do this by multiplying the value of the outcomes by their probability. The total for that node of the tree is the total of these values. In the example in Figure 2, the value for 'new product, thorough development' is:
0.4 (probability good outcome) x £500,000 (value) = £200,000

DAR Guidelines
Version 2.0 © Adaptive Processes Consulting Pvt Ltd Page 11 of 16
0.4 (probability moderate outcome) x £25,000 (value) = £10,000
0.2 (probability poor outcome) x £1,000 (value) = £200
+ £210,200
Figure 3 shows the calculation of uncertain outcome nodes:
Note that the values calculated for each node are shown in the boxes.
Calculating the Value of Decision Nodes

DAR Guidelines
Version 2.0 © Adaptive Processes Consulting Pvt Ltd Page 12 of 16
When you are evaluating a decision node, write down the cost of each option along each decision line. Then subtract the cost from the outcome value that you have already calculated. This will give you a value that represents the benefit of that decision. Note that amounts already spent do not count for this analysis - these are 'sunk costs' and (despite emotional counter-arguments) should not be factored into the decision. When you have calculated these decision benefits, choose the option that has the largest benefit, and take that as the decision made. This is the value of that decision node. Figure 4 shows this calculation of decision nodes in our example:
In this example, the benefit we previously calculated for 'new product, thorough development' was £210,000. We
estimate the future cost of this approach as £75,000. This gives a net benefit of £135,000.

DAR Guidelines
Version 2.0 © Adaptive Processes Consulting Pvt Ltd Page 13 of 16
The net benefit of 'new product, rapid development' was £15,700. On this branch we therefore choose the most
valuable option, 'new product, thorough development', and allocate this value to the decision node.
Result
By applying this technique we can see that the best option is to develop a new product. It is worth much more to us
to take our time and get the product right, than to rush the product to market. It is better just to improve our existing
products than to botch a new product, even though it costs us less.
Key points:
Decision trees provide an effective method of Decision Making because they:
Clearly lay out the problem so that all options can be challenged
Allow us to analyze fully the possible consequences of a decision
Provide a framework to quantify the values of outcomes and the probabilities of achieving them
Help us to make the best decisions on the basis of existing information and best guesses.
As with all Decision Making methods, decision tree analysis should be used in conjunction with common sense -
decision trees are just one important part of our Decision Making tool kit.
9. Cost/ Benefit Analysis (Evaluating Quantitatively Whether to Follow a Course of Action)
Cost/Benefit Analysis is a relatively* simple and widely used technique for deciding whether to make a change. As
its name suggests, to use the technique simply add up the value of the benefits of a course of action, and subtract the
costs associated with it.
Costs are either one-off, or may be ongoing. Benefits are most often received over time. We build this effect of time
into our analysis by calculating a payback period. This is the time it takes for the benefits of a change to repay its
costs. Many companies look for payback over a specified period of time - e.g. three years.
In its simple form, cost/benefit analysis is carried out using only financial costs and financial benefits.
How to use tool?
You may have been intensely creative in generating solutions to a problem, and rigorous in your selection of the best
one available. This solution may still not be worth implementing, as you may invest a lot of time and money in
solving a problem that is not worthy of this effort.

DAR Guidelines
Version 2.0 © Adaptive Processes Consulting Pvt Ltd Page 14 of 16
For example, a simple cost/benefit analysis of a road scheme would measure the cost of building the road, and
subtract this from the economic benefit of improving transport links. It would not measure either the cost of
environmental damage or the benefit of quicker and easier travel to work.
A more sophisticated approach to cost/benefit analysis is to try to put a financial value on these intangible costs and
benefits. This can be highly subjective - is, for example, a historic water meadow worth $25,000, or is it worth
$500,000 because if it’s environmental importance? What is the value of stress-free travel to work in the morning?
These are all questions that people have to answer, and answers that people have to defend.
The version of cost/benefit analysis we explain here is necessarily simple. Where large sums of money are involved
(for example, in financial market transactions), project evaluation can become an extremely complex and
sophisticated art. The fundamentals of this are explained in Principles of Corporate Finance by Richard Brealey and
Stewart Myers - this is something of a 'bible' on the subject.
Example:
A sales director is deciding whether to implement a new computer-based contact management and sales processing
system. His department has only a few computers, and his salespeople are not computer literate. He is aware that
computerized sales forces are able to contact more customers and give a higher quality of reliability and service to
those customers. They are more able to meet commitments, and can work more efficiently with fulfillment and
delivery staff.
His financial cost/benefit analysis is shown below:
Costs: New computer equipment:
10 network-ready PCs with supporting software @ $1,225 each
1 server @ $1,750
3 printers @ $600 each
Cabling & Installation @ $2300
Sales Support Software @ $7500
Training costs:
Computer introduction - 8 people @ $ 200 each
Keyboard skills - 8 people @ $ 200 each
Sales Support System - 12 people @ $350 each
Other costs:
Lost time: 40 man days @ $ 100 / day
Lost sales through disruption: estimate: $10,000
Lost sales through inefficiency during first months: estimate: $10,000
Total cost: $55,800

DAR Guidelines
Version 2.0 © Adaptive Processes Consulting Pvt Ltd Page 15 of 16
Benefits:
Tripling of mail shot capacity: estimate: $20,000 / year
Ability to sustain telesales campaigns: estimate: $10,000 / year
Improved efficiency and reliability of follow-up: estimate: $25,000 / year
Improved customer service and retention: estimate: $15,000 / year
Improved accuracy of customer information: estimate: $5,000 / year
More ability to manage sales effort: $15,000 / year
Total Benefit: $90,000/year
Payback time: $55,800 / $90,000 = 0.62 of a year = approx. 8 months
Inevitably the estimates of the benefit given by the new system are quite subjective. Despite this, the Sales Director is very likely to introduce it, given the short payback time.
Key points:
Cost/Benefit Analysis is a powerful, widely used and relatively easy tool for deciding whether to make a change.
To use the tool, firstly work out how much the change will cost to make. Then calculate the benefit you will from it.
Where costs or benefits are paid or received over time, work out the time it will take for the benefits to repay the costs.
Cost/Benefit Analysis can be carried out using only financial costs and financial benefits. You may, however, decide
to include intangible items within the analysis. As you must estimate a value for these, this inevitably brings an
element of subjectivity into the process.

DAR Guidelines
Version 2.0 © Adaptive Processes Consulting Pvt Ltd Page 16 of 16
10. DOCUMENT DETAILS
Prepared by/Modified by Role Date of preparation
Reviewed by Role Date of Review
Approved by Role Date of Approval
Circulation List Version Number
11. REVISION HISTORY
# Date Version #
Section Changed Details of changes made
Approved By


![Home - ALCCommissioner Gordon McCallum concurs with the decision. Commissioner Satwinder Bains concurs with the decision. [22] Decision recorded as Resolution # 254/2016. A decision](https://img.pdfslide.net/doc/110x75/5f10da997e708231d44b2275/home-commissioner-gordon-mccallum-concurs-with-the-decision-commissioner-satwinder.jpg)