Embed Size (px)
Citation preview
FOCUS ON TECHNOLOGY Section Edtor: James Linder
Decision Analysis in Cytopathology Stephen S. Raab, M.D., Patricia A. Thomas, M.D., and Michael B. Cohen, M.D.
Cytology is an important diagnostic test that provides critical information used in patient evaluation. However, the information contained in a cytologic diagnosis often can be obtained in other ways and the role of cytology in the work-up of patients has not been rigorously evaluated. Likewise, the proper evaluation of a cytologic specimen, such as number of slides to be prepared, the use of special stains, or the adequate amount of screening time, also has not been extensively investigated. The quantitative method for investigating alternative strategies to solve these problems is referred to as decision analysis. I-’ With decision analysis, the physician enumerates the possible consequences of each action, estimates the probability and utility of each possible outcome and makes a calculation to select the best possible course of action. Although deci- sion analysis has been used to examine the utility of some cytologic tests, most cytologists know little of decision analysis techniques and the significance of decision analy- sis results. In this report, we discuss decision analysis methods, provide an example of the application of deci- sion analysis to diagnostic cytology and give indications of future uses.
Decision Analysis Methods Because clinical findings often are not pathognomonic of a single disease, one or several diagnostic tests may be utilized to exclude or confirm various disease entities. Im- plicit in this patient work-up are three probabilities: 1) the probability of a disease before the result of a test is known (prior probability); 2) the probability that a test result can be observed in each possible disease (conditional probabil- ity); and 3) the probability of a disease after a test result is known (posterior probability). The prior and condi- tional probabilities can be used to calculate the posterior
Received July 5 , 1994. Accepted August 11, 1994. From the Department of Pathology, University of Iowa, Iowa City,
IA. Address reprint requests to Stephen S. Raab, M.D., Department of
Pathology, University of Iowa Hospitals and Clinics, 200 Hawkins Drive, 6235 RCP, Iowa City, IA 52242-1009.
probability and this relationship is known as Bayes’ rule, which forms the basis of decision analysis. 3,7-10
An example of the application of Bayes’ rule to a clini- cal problem is shown in Table I, which depicts the ficti- tious work-up of a 65-yr-old man with a peripheral pulmo- nary mass. After three negative sputums, the man underwent a trans-thoracic fine-needle aspiration biopsy (FNAB) and the cytopathologist rendered a benign diag- nosis. The first column shows the differential diagnosis and the clinical (prior) probabilities of each diagnosis. The prior probabilities usually are obtained from the medical literature and are determined by many factors, such as smoking history, family history, and radiographic appear- ance. Because cancer has a high prevalence in this patient population, cancer also has a high prior probability. The conditional probability of each condition is the probability a benign FNAB diagnosis can be made in that condition. For cancer, the conditional probability is the false negative rate of transthoracic FNAB. For the benign conditions, the conditional probability is the true negative rate of a transthoracic FNAB. The posterior probabilities are derived from the combination of the prior and conditional probabilities. The posterior probability of a disease is the probability of that disease given the clinical likelihood of disease and the test results. If either of these has a low likelihood of occurrence, the posterior probability will be low. The posterior probability can be calculated by the formula:
Posterior probability = (Prior probability x Conditional probability)/sum.
As shown in the last column, even with a benign FNAB diagnosis, cancer still has the highest posterior probabil- ity. The posterior probability of each benign disease is raised above the prior probability, indicating that these conditions are more likely to be present. The FNAB does not “prove” or “exclude” any condition; it only increases or decreases the likelihood of a particular disease being present.
334 Diagnostic Cytopathology, Vol 12, No 4 @ 1995 WILEY-LISS. INC.
DECISION ANALYSIS
Table I.
Disease Prior probability Conditional probability Prior x conditional Posterior probability
Cancer 0.85 0.15 0.1275 0.47 Granulomatous disease 0.10 0.95 0.0950 0.35 Infarct 0.04 0.95 0.0380 0.14 Hamartoma 0.01 0.95 0.0095 0.03
Bayes' Rule to Interpret a Negative Trans-Thoracic Fine-Needle Aspiration Biopsy
Sum 0.2700
Based on the likelihood and utility of establishing an accurate diagnosis with a diagnostic test, a decision is made as to whether that test should be ordered. A similar decision making process occurs in the work-up of a cyto- logic specimen. For example, a cytologist evaluates the likelihood and utility of a positive or negative result using special stains or ancillary studies, such as immunocyto- chemistry or electron microscopy, in making a definitive diagnosis. Decision analysis, however, often involves the evaluation of a number of different tests to determine the optimal patient work-up.
As described by Pauker and Kassirer, decision analysis involves six steps. 1,6 For illustration, decision analysis will be applied to the work-up of a fictitious 67-yr-old women with painless jaundice and a mass in the head of the pan- creas. Each step will be discussed separately. Clinically, the differential diagnosis might include pancreatic adeno- carcinoma, pancreatitis with fibrosis, and infectious dis- ease. The clinician has the option to perform one of several
diagnostic tests to rule in or out these various entities, and particularly to confirm or exclude the diagnosis of adeno- carcinoma.
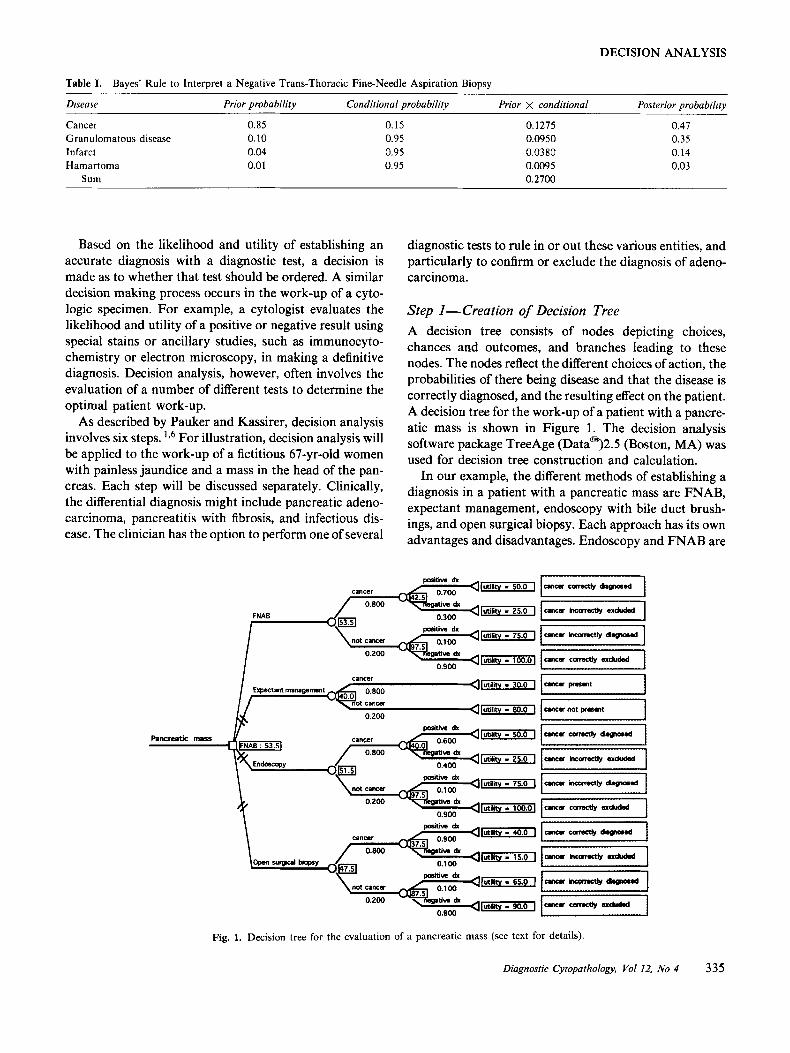
Step I-Creation of Decision Tree A decision tree consists of nodes depicting choices, chances and outcomes, and branches leading to these nodes. The nodes reflect the different choices of action, the probabilities of there being disease and that the disease is correctly diagnosed, and the resulting effect on the patient. A decision tree for the work-up of a patient with a pancre- atic mass is shown in Figure 1. The decision analysis software package TreeAge (Datam)2.5 (Boston, MA) was used for decision tree construction and calculation.
In our example, the different methods of establishing a diagnosis in a patient with a pancreatic mass are FNAB, expectant management, endoscopy with bile duct brush- ings, and open surgical biopsy. Each approach has its own advantages and disadvantages. Endoscopy and FNAB are
Pancreatic mass -
y,".I., - .. 0.900 I
lutility - 30.0 1 Expectnt mana@xncnt I ,
'ig. 1. Decision tree for
utility - 40.0 I
(utility .I 15.0 ]
0.900
the evaluation of a pancreatic mass (see text fc
1 7 1
C 1
)r details).
Diagnostic Cytopathology, Yo1 12, No 4 335
RAAB ET AL.
less expensive and invasive than surgical biopsy, but ex- hibit a lower diagnostic accuracy. Expectant management has the advantage of being neither invasive nor expensive, but is not “accurate” in immediately assessing if the pa- tient has cancer. As shown in the decision tree, the choice or decision of which diagnostic work-up to utilize is de- picted by a box and is called a decision node.
A chance node is depicted by a circle and is beyond the control of the clinician or the patient. Chance events are of two types: 1) the patient has or does not have the target disorder (cancer); and 2) the test result is positive or nega- tive. These events are dependent upon the probability of the patient having cancer and the probability of the dis- ease having been accurately diagnosed by a particular diagnostic test.
Each branch of the tree leads to a clinical outcome that is depicted by a triangle and is called a terminal node. The outcomes are shown in the dotted boxes following the terminal nodes. For each diagnostic test (FNAB, endos- copy, and surgical biopsy) there are four possible clinical outcomes: cancer correctly diagnosed (true positive, TP), cancer correctly excluded (true negative, TN), cancer in- correctly excluded (false negative, FN), and cancer incor- rectly diagnosed (false positive, FP). The choice event of expectant management has two possible outcomes: the patient having or not having cancer. With expectant man- agement, a diagnostic test is not performed, so there are no false diagnoses.
Step 2-assign men t of Probabilities The probabilities used in decision trees are derived from either the literature or from selected patient populations. Often probabilities of particular scenarios are not known. For example, epidemiologic studies have indicated that pancreatic carcinoma accounts for approximately 5% of all cancer deaths in the United States and that these tu- mors most often occur in the elderly.” Although the pancreatic head is the most common site of cancer, the probability that a mass lesion in the pancreatic head is cancer is not reported in the pathology literature. Proba- bilities such as these must be estimated. For our decision tree, we estimated that the probability of cancer was 80%.
The probability that a particular diagnosis will be ren- dered, in other words the diagnostic accuracy of a test, usually is obtained in large series of cases that include a variety of patients. Consequently, these numbers may be biased toward different patient populations or target dis- orders. The accuracies (TP, FP, TN, FN) may exhibit a range in the literature and either a single value or several values (sensitivity analysis) can be used in the decision tree. 3 7 7 Theoretical accuracies of the procedures are shown beneath the branches labeled “positive dx” or “negative dx.”
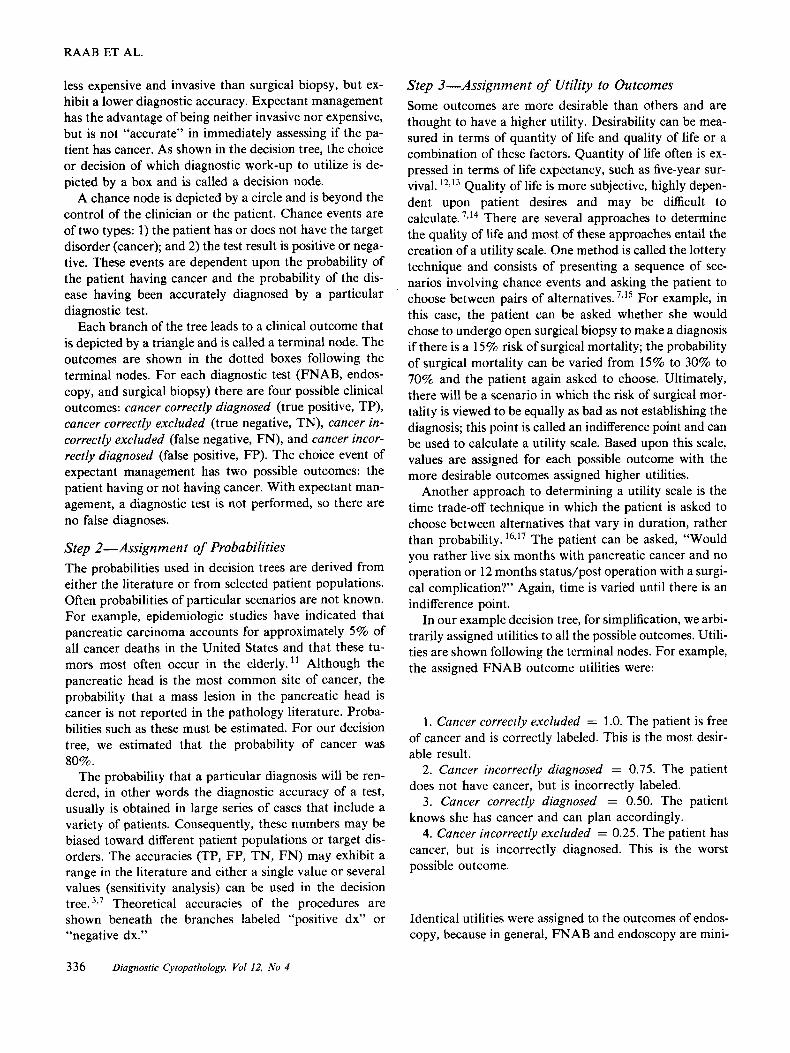
Step 3-Assignment of Utility to Outcomes Some outcomes are more desirable than others and are thought to have a higher utility. Desirability can be mea- sured in terms of quantity of life and quality of life or a combination of these factors. Quantity of life often is ex- pressed in terms of life expectancy, such as five-year sur- vival. ‘*,13 Quality of life is more subjective, highly depen- dent upon patient desires and may be difficult to calculate. ’ 3 1 4 There are several approaches to determine the quality of life and most of these approaches entail the creation of a utility scale. One method is called the lottery technique and consists of presenting a sequence of sce- narios involving chance events and asking the patient to choose between pairs of alternatives. ’,15 For example, in this case, the patient can be asked whether she would chose to undergo open surgical biopsy to make a diagnosis if there is a 15% risk of surgical mortality; the probability of surgical mortality can be varied from 15% to 30% to 70% and the patient again asked to choose. Ultimately, there will be a scenario in which the risk of surgical mor- tality is viewed to be equally as bad as not establishing the diagnosis; this point is called an indifference point and can be used to calculate a utility scale. Based upon this scale, values are assigned for each possible outcome with the more desirable outcomes assigned higher utilities.
Another approach to determining a utility scale is the time trade-off technique in which the patient is asked to choose between alternatives that vary in duration, rather than probability. 16,17 The patient can be asked, “Would you rather live six months with pancreatic cancer and no operation or 12 months status/post operation with a surgi- cal complication?” Again, time is varied until there is an indifference point.
In our example decision tree, for simplification, we arbi- trarily assigned utilities to all the possible outcomes. Utili- ties are shown following the terminal nodes. For example, the assigned FNAB outcome utilities were:
1. Cancer correctly excluded = 1 .O. The patient is free of cancer and is correctly labeled. This is the most desir- able result.
2. Cancer incorrectly diagnosed = 0.75. The patient does not have cancer, but is incorrectly labeled.
3 . Cancer correctly diagnosed = 0.50. The patient knows she has cancer and can plan accordingly.
4. Cancer incorrectly excluded = 0.25. The patient has cancer, but is incorrectly diagnosed. This is the worst possible outcome.
Identical utilities were assigned to the outcomes of endos- copy, because in general, FNAB and endoscopy are mini-
336 Diagnostic Cytopathology, Vol 12, No 4
DECISION ANALYSIS
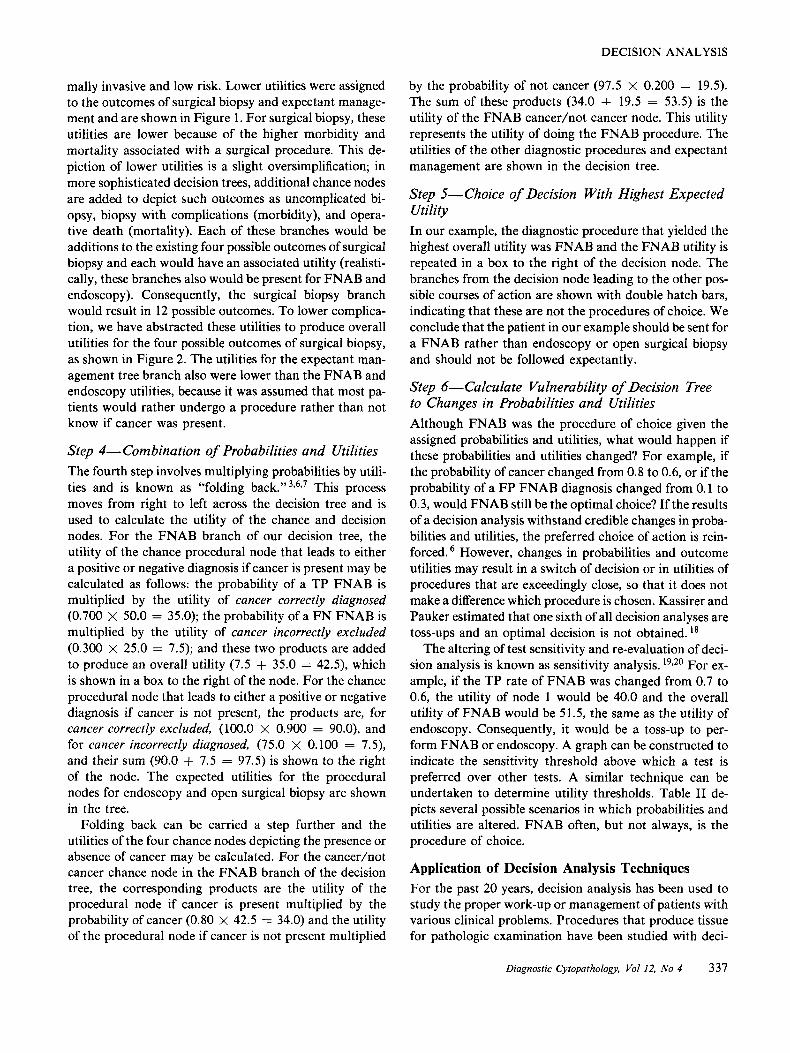
mally invasive and low risk. Lower utilities were assigned to the outcomes of surgical biopsy and expectant manage- ment and are shown in Figure 1. For surgical biopsy, these utilities are lower because of the higher morbidity and mortality associated with a surgical procedure. This de- piction of lower utilities is a slight oversimplification; in more sophisticated decision trees, additional chance nodes are added to depict such outcomes as uncomplicated bi- opsy, biopsy with complications (morbidity), and opera- tive death (mortality). Each of these branches would be additions to the existing four possible outcomes of surgical biopsy and each would have an associated utility (realisti- cally, these branches also would be present for FNAB and endoscopy). Consequently, the surgical biopsy branch would result in 12 possible outcomes. To lower complica- tion, we have abstracted these utilities to produce overall utilities for the four possible outcomes of surgical biopsy, as shown in Figure 2. The utilities for the expectant man- agement tree branch also were lower than the FNAB and endoscopy utilities, because it was assumed that most pa- tients would rather undergo a procedure rather than not know if cancer was present.
Step 4-Combination of Probabilities and Utilities The fourth step involves multiplying probabilities by utili- ties and is known as “folding b a ~ k . ” ~ , ~ , ’ This process moves from right to left across the decision tree and is used to calculate the utility of the chance and decision nodes. For the FNAB branch of our decision tree, the utility of the chance procedural node that leads to either a positive or negative diagnosis if cancer is present may be calculated as follows: the probability of a TP FNAB is multiplied by the utility of cancer correctly diagnosed (0.700 X 50.0 = 35.0); the probability of a FN FNAB is multiplied by the utility of cancer incorrectly excluded (0.300 X 25.0 = 7.5); and these two products are added to produce an overall utility (7.5 + 35.0 = 42.5), which is shown in a box to the right of the node. For the chance procedural node that leads to either a positive or negative diagnosis if cancer is not present, the products are, for cancer correctly excluded, (100.0 X 0.900 = 90.0), and for cancer incorrectly diagnosed, (75.0 X 0.100 = 7.9, and their sum (90.0 + 7.5 = 97.5) is shown to the right of the node. The expected utilities for the procedural nodes for endoscopy and open surgical biopsy are shown in the tree.
Folding back can be carried a step further and the utilities of the four chance nodes depicting the presence or absence of cancer may be calculated. For the cancerhot cancer chance node in the FNAB branch of the decision tree, the corresponding products are the utility of the procedural node if cancer is present multiplied by the probability of cancer (0.80 x 42.5 = 34.0) and the utility of the procedural node if cancer is not present multiplied
by the probability of not cancer (97.5 X 0.200 = 19.5). The sum of these products (34.0 + 19.5 = 53.5) is the utility of the FNAB cancerhot cancer node. This utility represents the utility of doing the FNAB procedure. The utilities of the other diagnostic procedures and expectant management are shown in the decision tree.
Step 5- Choice of Decision With Highest Expected Utility In our example, the diagnostic procedure that yielded the highest overall utility was FNAB and the FNAB utility is repeated in a box to the right of the decision node. The branches from the decision node leading to the other pos- sible courses of action are shown with double hatch bars, indicating that these are not the procedures of choice. We conclude that the patient in our example should be sent for a FNAB rather than endoscopy or open surgical biopsy and should not be followed expectantly.
Step 6-Calculate Vulnerability of Decision Tree to Changes in Probabilities and Utilities Although FNAB was the procedure of choice given the assigned probabilities and utilities, what would happen if these probabilities and utilities changed? For example, if the probability of cancer changed from 0.8 to 0.6, or if the probability of a FP FNAB diagnosis changed from 0.1 to 0.3, would FNAB still be the optimal choice? If the results of a decision analysis withstand credible changes in proba- bilities and utilities, the preferred choice of action is rein- forced. However, changes in probabilities and outcome utilities may result in a switch of decision or in utilities of procedures that are exceedingly close, so that it does not make a difference which procedure is chosen. Kassirer and Pauker estimated that one sixth of all decision analyses are toss-ups and an optimal decision is not obtained. l 8
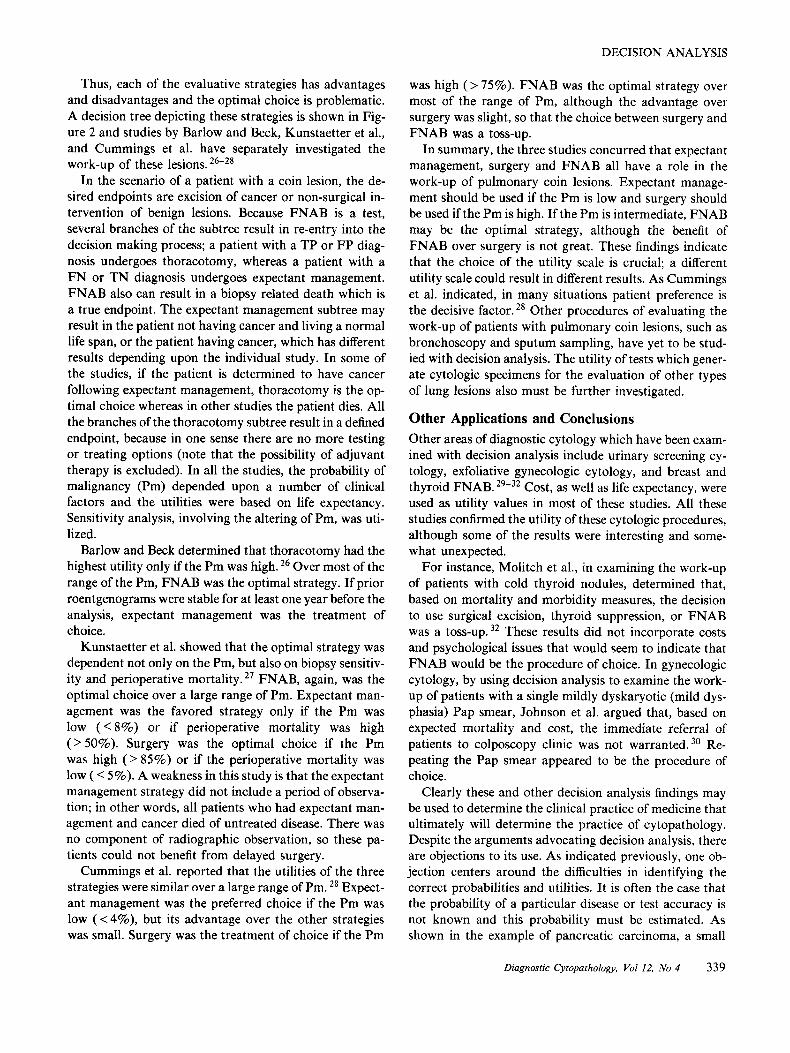
The altering of test sensitivity and re-evaluation of deci- sion analysis is known as sensitivity analysis. 1 9 g 2 0 For ex- ample, if the TP rate of FNAB was changed from 0.7 to 0.6, the utility of node 1 would be 40.0 and the overall utility of FNAB would be 51.5, the same as the utility of endoscopy. Consequently, it would be a toss-up to per- form FNAB or endoscopy. A graph can be constructed to indicate the sensitivity threshold above which a test is preferred over other tests. A similar technique can be undertaken to determine utility thresholds. Table I1 de- picts several possible scenarios in which probabilities and utilities are altered. FNAB often, but not always, is the procedure of choice.
Application of Decision Analysis Techniques For the past 20 years, decision analysis has been used to study the proper work-up or management of patients with various clinical problems. Procedures that produce tissue for pathologic examination have been studied with deci-
Diagnostic Cytopathology, Val 12, No 4 337
RAAB ET AL.
Table 11. Changes in Probabilities and Utilities in the Work-Up of a Patient With a Pancreatic Massa
Chonge Result (utility) Choice
1) TP open biopsy = 1.0 2) Utility of cancer diagnosed by open biopsy = 60.0 3) Utility of cancer followed by expectant management = 50.0 4) T N endoscopy = 0.990 Endoscopy = 52.0 FNAB 5) Probability of cancer = 0.400 FNAB = 75.5 FNAB
Open biopsy = 53.5 Open biopsy = 61.9 Expectant management = 56.0
FNAB or open biopsy Open biopsy Expectant management
Endoscopy = 74.5 Open biopsy = 67.5 Expectant management = 60.0
Endoscopy = 75.8 Open biopsy = 67.5 Expectant management = 60.0
6) Probability of cancer = 0.400 FNAB = 75.5 Endoscopy and TN endoscopy = 0.990
aTP = true positive; TN = true negative; FNAB = fine-needle aspiration biopsy.
sion analysis, although these results are more likely seen in the medical and surgical literature, rather than in the general pathology or cytology literature. Pulmonary med- icine is one area in clinical medicine that has used decision analysis to evaluate the utility of a cytologic procedure, and the research in this area will be briefly summarized to illustrate decision analysis techniques.
The differential diagnosis and work-up of radiograph- ically detected uncalcified pulmonary nodules, or coin le- sions, has been extensively discussed in the medical and surgical literature. 21-25 These lesions are a relatively com- mon finding and may be due to a number of benign or
malignant conditions. Separation of benign from malig- nant is important because a certain percentage of the ma- lignant lesions are low stage and can be surgically excised with good prognosis. Because excision of all lesions may lead to unnecessary morbidity and mortality, tests may be utilized to determine if the lesions are malignant. FNAB and expectant management, in which the lesions are fol- lowed radiographically, are two of these tests. A difficulty which may preclude the use of these tests is the possibility of establishing a false positive or false negative diagnosis. An additional problem with expectant management is that it cannot be used for immediate cancer diagnosis.
positive dx lhoracotomy 0 cancer
negalive dx expeclanl managemenl
I positive dx thoracotomy 0
no cancer
negative dx expectant management
cancer untreated cancer
Coin Lesion expectanl management
no cancer normal life span
\ operative death
I a
operative dealh
no cancer a a
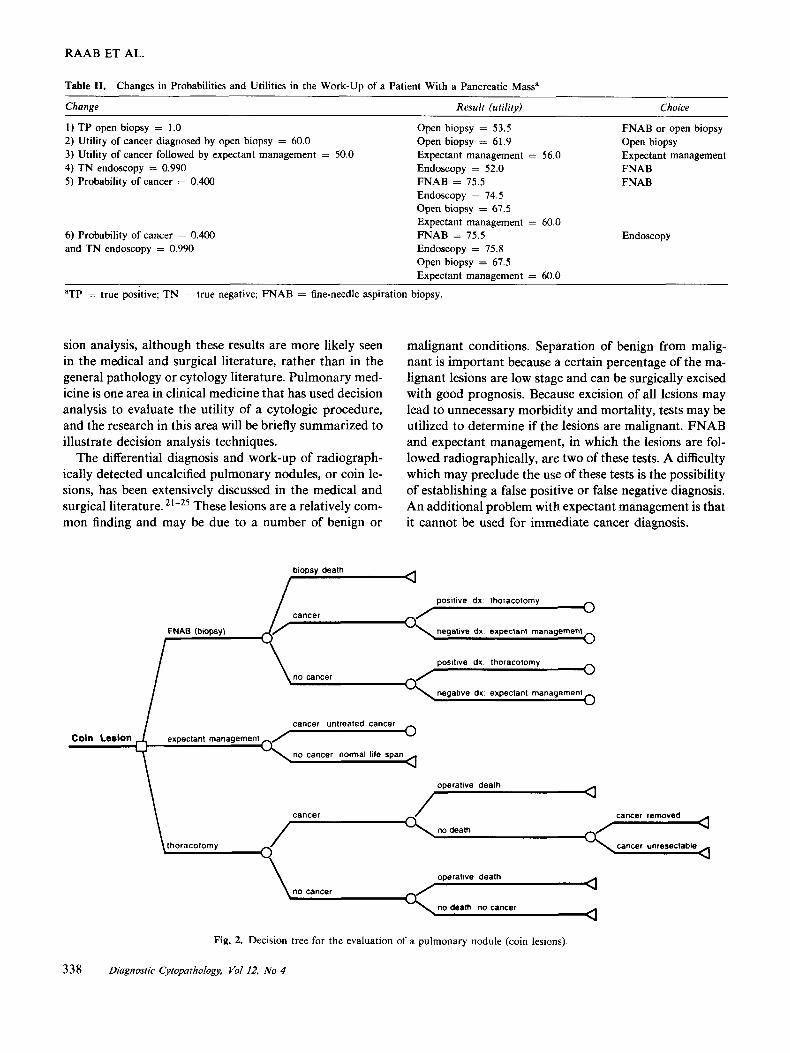
Fig. 2. Decision tree for the evaluation of a pulmonary nodule (coin lesions)
338 Diagnostic Cyiopatfiology, Vol 12, No 4
DECISION ANALYSIS
Thus, each of the evaluative strategies has advantages and disadvantages and the optimal choice is problematic. A decision tree depicting these strategies is shown in Fig- ure 2 and studies by Barlow and Beck, Kunstaetter et al., and Cummings et al. have separately investigated the work-up of these lesions. 26-28
In the scenario of a patient with a coin lesion, the de- sired endpoints are excision of cancer or non-surgical in- tervention of benign lesions. Because FNAB is a test, several branches of the subtree result in re-entry into the decision making process; a patient with a TP or FP diag- nosis undergoes thoracotomy, whereas a patient with a FN or TN diagnosis undergoes expectant management. FNAB also can result in a biopsy related death which is a true endpoint. The expectant management subtree may result in the patient not having cancer and living a normal life span, or the patient having cancer, which has different results depending upon the individual study. In some of the studies, if the patient is determined to have cancer following expectant management, thoracotomy is the op- timal choice whereas in other studies the patient dies. All the branches of the thoracotomy subtree result in a defined endpoint, because in one sense there are no more testing or treating options (note that the possibility of adjuvant therapy is excluded). In all the studies, the probability of malignancy (Pm) depended upon a number of clinical factors and the utilities were based on life expectancy. Sensitivity analysis, involving the altering of Pm, was uti- lized.
Barlow and Beck determined that thoracotomy had the highest utility only if the Pm was high. 26 Over most of the range of the Pm, FNAB was the optimal strategy. If prior roentgenograms were stable for at least one year before the analysis, expectant management was the treatment of choice.
Kunstaetter et al. showed that the optimal strategy was dependent not only on the Pm, but also on biopsy sensitiv- ity and perioperative mortality. 27 FNAB, again, was the optimal choice over a large range of Pm. Expectant man- agement was the favored strategy only if the Pm was low (<8%) or if perioperative mortality was high (>SO%). Surgery was the optimal choice if the Pm was high (> 85%) or if the perioperative mortality was low ( < 5%). A weakness in this study is that the expectant management strategy did not include a period of observa- tion; in other words, all patients who had expectant man- agement and cancer died of untreated disease. There was no component of radiographic observation, so these pa- tients could not benefit from delayed surgery.
Cummings et al. reported that the utilities of the three strategies were similar over a large range of Pm. 28 Expect- ant management was the preferred choice if the Pm was low ( < 4%), but its advantage over the other strategies was small. Surgery was the treatment of choice if the Pm
was high (> 75%). FNAB was the optimal strategy over most of the range of Pm, although the advantage over surgery was slight, so that the choice between surgery and FNAB was a toss-up.
In summary, the three studies concurred that expectant management, surgery and FNAB all have a role in the work-up of pulmonary coin lesions. Expectant manage- ment should be used if the Pm is low and surgery should be used if the Pm is high. If the Pm is intermediate, FNAB may be the optimal strategy, although the benefit of FNAB over surgery is not great. These findings indicate that the choice of the utility scale is crucial; a different utility scale could result in different results. As Cummings et al. indicated, in many situations patient preference is the decisive factor. 28 Other procedures of evaluating the work-up of patients with pulmonary coin lesions, such as bronchoscopy and sputum sampling, have yet to be stud- ied with decision analysis. The utility of tests which gener- ate cytologic specimens for the evaluation of other types of lung lesions also must be further investigated.
Other Applications and Conclusions Other areas of diagnostic cytology which have been exam- ined with decision analysis include urinary screening cy- tology, exfoliative gynecologic cytology, and breast and thyroid FNAB. 29-32 Cost, as well as life expectancy, were used as utility values in most of these studies. All these studies confirmed the utility of these cytologic procedures, although some of the results were interesting and some- what unexpected.
For instance, Molitch et al., in examining the work-up of patients with cold thyroid nodules, determined that, based on mortality and morbidity measures, the decision to use surgical excision, thyroid suppression, or FNAB was a toss-up.32 These results did not incorporate costs and psychological issues that would seem to indicate that FNAB would be the procedure of choice. In gynecologic cytology, by using decision analysis to examine the work- up of patients with a single mildly dyskaryotic (mild dys- phasia) Pap smear, Johnson et al. argued that, based on expected mortality and cost, the immediate referral of patients to colposcopy clinic was not warranted.30 Re- peating the Pap smear appeared to be the procedure of choice.
Clearly these and other decision analysis findings may be used to determine the clinical practice of medicine that ultimately will determine the practice of cytopathology. Despite the arguments advocating decision analysis, there are objections to its use. As indicated previously, one ob- jection centers around the difficulties in identifying the correct probabilities and utilities. It is often the case that the probability of a particular disease or test accuracy is not known and this probability must be estimated. As shown in the example of pancreatic carcinoma, a small
Diagnostic Cytopathology, Vol 12, No 4 339
RAAB ET AL.
change in the probability of cancer or in correctly diagnos- ing that cancer, can result in a switch in the optimal strategy. This finding leaves the clinician at a loss for which strategy to choose. The difficulty in assigning the correct utility is a result of individual subjectivity. LaPuma and Lawlor showed that different people may assign different utilities to the same outcome. 33 In addi- tion, Tversky and Kahneman indicated that, at different times, the same person may assign different values to the same clinical outcome. 34 As a result of these difficulties, it is argued that the results of a decision analysis may apply only to narrow patient populations and should not be generalized.
To counter these objections, proponents of decision analysis argue that the failure of decision analysis to con- clusively indicate an optimal strategy is the exception rather than the rule. Further research is needed in evaluat- ing utilities and determining probabilities instead of es- chewing decision analysis studies. This research and the application of decision analysis largely has been con- ducted in clinical medicine and only has involved cytology in so much as a cytologic procedure affects patient work- up. In the current climate of health care reform, the appli- cation of decision analysis will become increasingly im- portant because decision analysis results involve issues such as cost, test evaluation, and patient preferences. De- cision analysis will be applied to anatomic pathology and diagnostic cytology and the results of decision analysis rersearch will have an influence on how cytopathology will be practiced.
References 1. Pauker SG, Kassirer JP. Clinical application of decision analysis: a
detailed illustration. Sem Nucl Med 1978;13:324-335. 2. Pauker SG, Kassirer JP. The threshold approach to clinical decision
making. N Engl J Med 1980;302:1109-1117. 3. Weinstein MC, Fineberg HV. Clinical decision analysis. Philadel-
phia: WB Saunders, 1980;12-36. 4. Galen RS, Gambino SR. Beyond normality: the predictive value and
efficiency of medical diagnoses. New York: John Wiley & Sons, 1975.
5 . McNeil BJ, Pauker SG. The patient’s role in assessing the value of diagnostic tests. Radiology 1979; 132:605-610.
6. Sackett DL, Haynes RB, Tugwell P. Clinical epidemiology: a basic science for clinical medicine. Boston: Little, Brown, 1985.
7. Pauker SG, Kassirer JP. Decision analysis. N Engl J Med 1981;316: 250-258.
8. Griner PF, Mayewski RJ, Mushlin AJ, Greenland P. Selection and interpretation of diagnostic tests and procedures: principles and ap- plications. Ann Intern Med 1981;94:553-600.
9. Gorry GA, Pauker SG, Schwartz WB. The diagnostic importance of the normal finding. N Engl J Med 1978;298:486-489.
10. Schwartz WB, Wolfe HJ, Pauker SG. Pathology and probabilities: a new approach to interpreting and reporting biopsies. N Engl J Med 1981;305:917-923,
11. Levin DL, Connelly RR, Devesa SS. Demographic characteristics of cancer of the pancreas: mortality, incidence and survival. Cancer 1981;47:1456-1468.
12. Beck JR, Pauker SG, Gottlieb JE, Klein K, Kassirer JP. A conve- nient approximation of life expectancy (the “DEALE’)). 11. Use in medical decision-making. Am J Med 1982;73:889-897.
13. Pliskin JS, Shepard DS, Weinstein MC. Utility functions for life years and health status. Oper Res 1980;28:206-224.
14. Kassirer JP. Adding insult to injury: “usurping patients” preroga- tives. N Engl J Med 1983;308:898-901.
15. Pauker SP, Pauker SG. The amniocentesis decision: an explicit guide for parents. In: Epstein CJ, Curry CJR, Packman SM, Sherman S, Hall BD, eds. Risk, communication and decision making in genetic counseling. Part C. Annual review of birth defects, 1978. New York: Alan R. Liss, 1979;289-324.
16. Sackett DL, Torrance GW. The utility of different health states as perceived by the general public. J Chronic Dis 1978;31:697- 704.
17. McNeil BJ, Weichselbaum R, Pauker SG. Speech and survival: tradeoffs between quality and quantity of life in laryngeal cancer. N Engl J Med 1981;305:982-987,
18. Kassirer JP, Pauker SG. The toss-up. N Engl J Med 1981;305: 1467.
19. Pauker SG, Kassirer JP. Therapeutic decision making: a cost-benefit analysis. N Engl J Med 1975;293:229-234.
20. Pauker SG, Kassirer JP. The threshold approach to clinical decision making. N Engl J Med 1980;302:1109-1117.
21. Lillington GA. Pulmonary nodules: solitary and multiple. Clin Chest Med 1982;3:361-367.
22. Fraser RG, Pare JAP, Pare PD, et al. The solitary pulmonary nodule. Diagnosis of diseases of the chest. Philadelphia: WB Saun- ders, 1989;1383-1411.
23. Hood RT, Good C, Allen C, et al. Solitary circumscribed lesions of the lung. JAMA 1985;152:1185-1191.
24. Siegelman SS, Khouri NF, Fishman EK, et al. Solitary pulmonary nodules: CT assessment. Radiology 1986;160:307-312.
25. Lillington GA, Cummings SR. Decision analysis approaches in soli- tary pulmonary nodules. Sem Respir Med 1989;10:227-231.
26. Barlow PB, Beck JR. The solitary pulmonary nodule: a decision analysis. Chest 1985;88:455.
27. Kunstaetter R, Wolkove N, Kreisman H, Cohen C, Frank H. The solitary pulmonary nodule: decision analysis. Med Deck Making 1985;5:61-75.
28. Cummings SR, Lillington GA, Richards RJ. Managing solitary pul- monary nodules: the choice of strategy is a “close call.” Am Rev Respir Dis 1986;134:453-460.
29. Ellwein LB, Farrow GM. Urinary cytology screening: the decision facing the asymptomatic patient. Med Decis Making 1988;8:110- 119.
30. Johnson N, Sutton J, Thornton JG, Lilford RJ, Johnson VA, Peel KR. Decision analysis for best management of mildly dyskaryotic smear. Lancet 1993;342:91-96.
31. Layfield LJ, Chrischilles EA, Cohen MB, Bottles K. The palpable breast nodule: a cost-effectiveness analysis of alternate diagnostic approaches. Cancer 1993;72:1742- 175 1.
32. Molitch ME, Beck JR, Dreisman M, Gottlieb JE, Pauker SG. The cold thyroid nodule: an analysis of diagnostic and therapeutic op- tions. Endocr Rev 1984;5:185-199.
33. LaPuma J, Lawlor EF. Quality-adjusted life years. JAMA 1990;63: 29 17-301 2.
34. Tversky A, Kahneman D. The framing of decisions and the psychol- ogy of choice. Science 1981;11:453-458.
340 Diagnostic Cytopathology, Vol 12, No 4