Embed Size (px)
Citation preview
Water Resour Manage (2007) 21:663–676
DOI 10.1007/s11269-006-9031-5
ORIGINAL ART ICLE
Decision making of oil spill contingency optionswith fuzzy comprehensive evaluation
X. Liu · K. W. Wirtz
Received: 2 August 2005 / Accepted: 8 May 2006C© Springer Science + Business Media B.V. 2006
Abstract Accidental oil spills are one of major sources to affect ecologically and econom-
ically sensitive marine areas and shorelines. The aim of decision making during oil spill
response management is to minimize pollution effects in coastal areas, once spills occur.
However, not all coastal areas at risk can be saved due to a limitation of equipments or
options. Thus, often preferences between different coastal areas or uses, respectively, have to
be made in an operational way. Such a management issue is here taken as a multi-group multi-
criteria decision making problem involving a variety of stakeholders and natural dynamic
environments. For solving such a complex problem, this paper targets efforts to integrate
a second order fuzzy comprehensive evaluation (FCE) method and consensus facilitating
techniques into computerized group decision support system. Such a DSS takes into account
the influence of multiple criteria and the knowledge of different interested groups and sim-
ulates a consensus based decision process. Through a case study of the Prestige accident
off the Spanish coast in 2002, it is demonstrated that the model provides a simple, effec-
tive and adaptable method to solve operational management problems related to complex
human nature interactions as realized during oil spill management. Moreover, a series of
analyses explore potentials and limitations of the FCE for further applications in the field of
multi-group multi-criteria decision-making.
Keywords Decision making . Oil spill . Fuzzy comprehensive evaluation . Multi-criteria .
Group consensus
1. Introduction
An ongoing concern of an integrated coastal zone management (ICZM) in many areas around
the globe is related to the preparedness against accidental oil spills. It is estimated that tankers
X. Liu (�)ICBM, Carl von Ossietzky University, 26111 Oldenburg, Germanye-mail: [email protected]
K. W. WirtzInstitute for Coastal Research, GKSS, 21501 Geesthacht, Germany
Springer
664 Water Resour Manage (2007) 21:663–676
release up to 420,000 tons of oil in 2003 throughout the world (ITOPF) and the major oil
spills still occur at irregular intervals (European Environmental Agency, 2001), although
counter acting environmental programs and policies have been strengthened. Among others,
their effectiveness is constrained by, firstly, the dramatic increase of oil-related production
and transportation; secondly, some prevention measures only partially stop oil spills. For
example, both ship owners and environmentalists argue that yet almost invariably spills are
caused not by collisions but by running aground so that a rush to decommission old hulls
alone is not sufficient as evident from the Exxon Valdez and the Erika tanker accidents
(Rowe, 2004). Thus, responding to an emergency related to spilled oil or chemicals in an
effective way turns out to be a more critical concern in the domain of integrated coastal zone
management than ever. An oil and chemical spill and its long lived consequences can pose a
major impact on sensible coastal areas. A golden rule of oil spill contingency management
is, therefore, to remove as much oil as possible from the sea surface in order to minimize
the onshore impact. Traditional responses consist of mechanical (e.g., booms and skimmer)
and chemical methods (e.g., dispersants). However, both the relative impact and feasibility
of these response methods depend on the circumstance of the oil spill, the weather condition
and the time window. Except of these methods, an effective alternative is to tow the spilled
vessel towards the open sea or to an isolated harbour. Since the generally limited applicability
of counter-measures necessitates the set-up of operational preferences as it is not feasible
to save all areas under risk with the same reliability. This alternative aims to redistribute
less oil into sensitive habitats and can be carried out alone or simultaneously with other
response methods. A highly debated and recent example is the Prestige accident off the coast
of Spain in November, 2002. This accident caused a serious public anger due to the fact that
the break-up of spill cargo resulted from an abrupt change in towing direction as made by
the Spanish government. After the Prestige emitted its first emergency call, a right selection
among several options, such as towing it towards the open sea and to harbours should have
been done immediately to minimize oil impacts on the coastal zone.
1.1. Multi-group multi-criteria decision making problem
The decision making, such as a ruling destination of a spilling ship, is a typical example of a
complex problem involving a variety of stakeholder interests and complex dynamic environ-
ments. Therefore, an oil spill contingency management can be interpreted as a multi-group
multi-criteria decision making problem. In response to a priori existing legislation and local
interests, a sound decision should not only be based on the viewpoint of decision makers,
but also reflect opinions of groups such as fishermen and environmentalists emphasizing the
conservation of already protected marine or coastal environments. The situation becomes
more complicated since the diverse ecological or economic functioning of areas under risk
and several incomplete information layers exist. Thus, the decision making process should
incorporate two main integration aspects: (1) integration between human and the natural en-
vironments (vertical integration), that is, putting human knowledge into the natural resource
management, and (2) integration across interested stakeholders (horizontal integration). The
vertical integration focuses on the relationship between human resource use and natural envi-
ronments. To realize the vertical integration, Wirtz et al. (2004) have used a straightforward
weighted sum model (WSM) for the oil spill contingency problem, which aids individuals
to find their own preferred solutions. It also ensures that individuals have confidence in the
provided solutions by carrying out an uncertainty analysis. But there exist two weaknesses in
WSM with regard to the vertical integration. One is related to its capacity to deal with impre-
cise data. Normally the collected data contains both robust information and uncertainties. A
Springer
Water Resour Manage (2007) 21:663–676 665
satisfactory outcome from WSM highly depends on a pretty good quality of the collected data
in which uncertainties are low. The second weakness derives from its incapacity to deal with
lexical data, for example, when stakeholders express their opinion about the importance of
each criterion in a qualitative way. In this paper, we hence adopted a method based on fuzzy
logic theory. Many experts (e.g., Carlsson, 1999; Triantaphyllou, 2000) argued that fuzzy
logic techniques provide a powerful mathematical and methodological basis for dealing with
the representation of complex physical world problem (e.g., an environmental impact of a
human action) and lexically imprecise and incomplete knowledge. Based on such benefits, a
two step fuzzy multi-criteria decision making (MCDM) method, called a second order fuzzy
comprehensive evaluation model (FCE), is expected to provide a high level of confidence
for the selection of the optimal towing direction, particularly when data are imprecise and
stakeholders’ opinion are described qualitatively. Many successful examples verify the appli-
cation of the fuzzy MCDM method into the field of coastal and environmental management.
William et al. (2004) used multi-attribute analysis with fuzzy set theory to evaluate the coastal
landscapes. Yu et al. (2004) used the fuzzy decision making model to analyse alternatives for
the reservoir flood operation. In making a sediment management plan, Stansbury et al. (1999)
found an optimal option by using fuzzy method. Gurocak and Whittlesey (1998) developed a
fuzzy method for fishery management. An evaluation of alternative wastewater systems with
fuzzy technique proposed by van Moeffaert (2002) has been used in Surahammar, Sweden.
The horizontal integration pays more attention to the interaction between different groups
involved. It aims to build a consensus in which a variety of stakeholders are involved to
settle multiparty disputes. A number of methods including voting, negotiation, mediation
and arbitration can, in principle, be used to develop a mutually acceptable solution. In this
paper, stakeholders with different interests are simulated, which participate in reaching a
consensus through a voting system. This additional feature of participation consensus building
was missing in the previous work done by Wirtz et al. (2006) and here is developed to
minimize potential political conflicts related to operational responses in a pre-emptive mode.
Furthermore, it helps to identify appropriate strategies in compliance with an ICZM process
involving local stakeholders before the eventual onset of a crisis.
1.2. Outline of the methodology
The FCE method used in this paper can be seen as an integral part of a computerized group de-
cision support system (CGDSS) to aid users to make a structured decision. This study focuses
on the multi-criteria evaluation with an involvement of fuzzy knowledge and consensus
making mechanisms employed, and how the combined method applied. A brief methodol-
ogy scheme is outlined in Figure 1. Response alternatives and impacts of oil pollution are
retrieved from an environmental simulation model. To assess the performance of each alter-
native option, a second order fuzzy comprehensive evaluation (FCE) is proposed. Through
such an evaluation, a ranking by each interested group is taken into account. To reach an
agreement that represents a majority view, consensus building mechanism and stakeholders
are involved. Finally, a comparison with an application of a WSM to the same problem is
made and rankings resulting from different weighting schemes are statistically analysed.
2. Some notes on FCE and consensus building mechanism
Like previous studies using different WSM evaluation methods by Wirtz et al. (2006) also
Wirtz et al. (2004), this paper sets the focus on the accident of Prestige, which carried 77,000
tons of oil split in half off the northwest coast of Spain. At the initial Prestige spill site
Springer

666 Water Resour Manage (2007) 21:663–676
Fig. 1 Main components of a computerized group decision support system
we define five different contingency alternatives of towing the spilling vessel: direction NE,
NW, W, SW and E (Wirtz et al., 2006). As explained in more detail by Wirtz et al. (2006),
towing was the only feasible response to the imminent break-up of the tanker. Among these
five alternatives, option NW, W and SW denote a strategy where the vessel is transported
offshore. Option NE and E, on the other hand, stand for towing the ship into one of the
local harbours (La Coruna or Fisterra). For each of the contingency options, a simulation
model called OSCAR (Oil Spill Contingency and Response) developed by SINTEF Norway
(Aamo et al., 1997; Reed et al., 1996), is applied to calculate and record the distribution
of the oil pollution reaching the coastal regions and the residual oil in the open sea. As
simulation results depended on incomplete information associated to hydrodynamic and other
factors, forecasts bear general uncertainties which, to some extent, result in imprecise data.
A detailed description of the simulation set-up can be found in Wirtz et al. (2004, 2006) and
Wirtz et al. (2004). Simulation results (see Appendix 1) show that there exist conflicts in the
selection of alternatives between hypothetical stakeholders. For example, option E, the route
to the harbour of Fisterra, is preferred according to the interest of environmentalists, since it
redistributes a less amount of oil entering into the local protected area, while option NW is
the best choice for the local fishery and tourism. To choose the best one among a discrete set
of alternatives, multi-criteria decision making (MCDM), a widely used technique, provides
decision makers a practical solution. In the field of MCDM, a fuzzy MCDM is often verified
to be capable of dealing with imprecise data and lexical information. Thus, a second order
FCE proposed by Ji et al. (2000a, b) is applied to evaluate the performance of each alternative.
The second order FCE proceeds along three main steps which are summarised as follows, (1)
defining a fuzzy set; (2) the 1st order fuzzy evaluation and (3) the 2nd order fuzzy evaluation.
2.1. Defining a fuzzy set
The five alternatives are assessed with respect to a set of common criteria. These can be
regarded as representative for many coastal regions around the world with their specific
economic uses (mostly fishery and traffic harbours) and ecological value. They reflect existing
interests as well as existing background information at the Galician coast. With special regard
paid to oil pollution, the following criteria are defined: the fishery (F), the tourism (To), the
transportation (Tr), the mariculture (M), the residual risk (RR), the reproduction (RA), the
Springer
Water Resour Manage (2007) 21:663–676 667
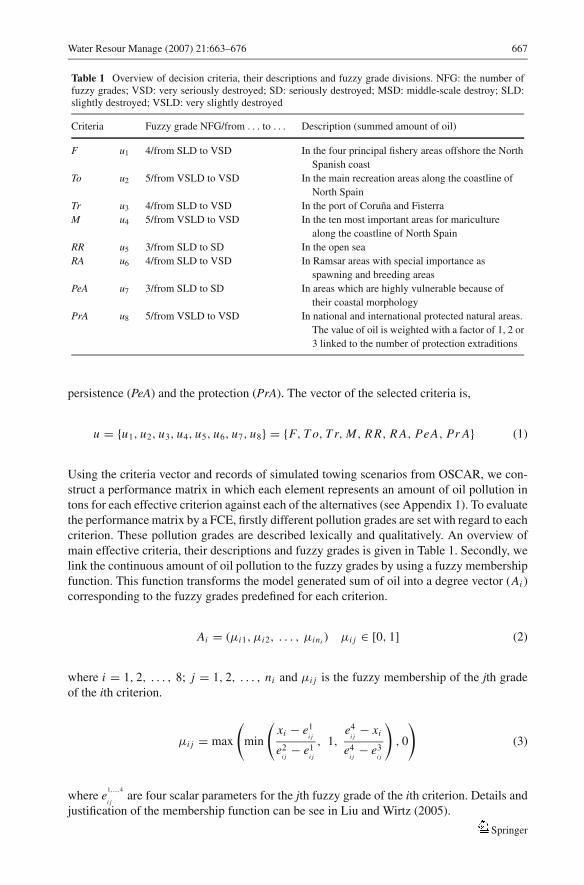
Table 1 Overview of decision criteria, their descriptions and fuzzy grade divisions. NFG: the number offuzzy grades; VSD: very seriously destroyed; SD: seriously destroyed; MSD: middle-scale destroy; SLD:slightly destroyed; VSLD: very slightly destroyed
Criteria Fuzzy grade NFG/from . . . to . . . Description (summed amount of oil)
F u1 4/from SLD to VSD In the four principal fishery areas offshore the North
Spanish coast
To u2 5/from VSLD to VSD In the main recreation areas along the coastline of
North Spain
Tr u3 4/from SLD to VSD In the port of Coruna and Fisterra
M u4 5/from VSLD to VSD In the ten most important areas for mariculture
along the coastline of North Spain
RR u5 3/from SLD to SD In the open sea
RA u6 4/from SLD to VSD In Ramsar areas with special importance as
spawning and breeding areas
PeA u7 3/from SLD to SD In areas which are highly vulnerable because of
their coastal morphology
PrA u8 5/from VSLD to VSD In national and international protected natural areas.
The value of oil is weighted with a factor of 1, 2 or
3 linked to the number of protection extraditions
persistence (PeA) and the protection (PrA). The vector of the selected criteria is,
u = {u1, u2, u3, u4, u5, u6, u7, u8} = {F, T o, T r, M, R R, R A, PeA, Pr A} (1)
Using the criteria vector and records of simulated towing scenarios from OSCAR, we con-
struct a performance matrix in which each element represents an amount of oil pollution in
tons for each effective criterion against each of the alternatives (see Appendix 1). To evaluate
the performance matrix by a FCE, firstly different pollution grades are set with regard to each
criterion. These pollution grades are described lexically and qualitatively. An overview of
main effective criteria, their descriptions and fuzzy grades is given in Table 1. Secondly, we
link the continuous amount of oil pollution to the fuzzy grades by using a fuzzy membership
function. This function transforms the model generated sum of oil into a degree vector (Ai )
corresponding to the fuzzy grades predefined for each criterion.
Ai = (μi1, μi2, . . . , μini ) μi j ∈ [0, 1] (2)
where i = 1, 2, . . . , 8; j = 1, 2, . . . , ni and μi j is the fuzzy membership of the jth grade
of the ith criterion.
μi j = max
(min
(xi − e1
i j
e2i j
− e1i j
, 1,e4
i j− xi
e4i j
− e3i j
), 0
)(3)
where e1,...,4
i jare four scalar parameters for the jth fuzzy grade of the ith criterion. Details and
justification of the membership function can be see in Liu and Wirtz (2005).
Springer
668 Water Resour Manage (2007) 21:663–676
2.2. First-order fuzzy evaluation
Coastal areas are not damaged in a uniform way, as oil strands onshore. To aid decision
makers to identify the damage degree, equally spaced damage levels ranging from 0 to 1 are
predefined, which imposes a numeric measure on the performance of alternatives.
ς = {ς1, ς2, . . . , ς11} = {0, 0.1, . . . , 0.9, 1.0} (4)
where 0 represents no damage, while 1.0 denotes a completely destroyed coastal area. For
any criterion i, a first order fuzzy degree assignment matrix (Ri ) is constructed, in which each
element represents a fuzzy degree of each kind of damage grade against each of these 11
coastal damage levels. Their values are somewhat empirical and can be modified for a specific
application. An intuitive example can be seen in the Appendix 2, in which the predefined
first order fuzzy degree assignment matrix for fishery (R1) is shown.
After combining the pre-defined first order fuzzy degree assignment matrix (Ri ) and the
fuzzy degree vector (Ai ), the first-order FCE set for criterion i can be obtained through the
following formula:
Bi = Ai × Ri = (bi1, bi2, . . . , bind) (5)
where nd = 11, i ∈ [1, 8], Bi represents a fuzzy coastal impact performance with respect to
the ith criterion.
2.3. Second-order fuzzy evaluation
In practice, not all the criteria (i.e. F, To, Tr, M, RR, RA, PeA and PrA) are equally important.
Hence, a weighting vector W is used to adjust the importance of the criteria,
W = (w1, w2, . . . , wm) (6)
where W denotes the degree of importance of each criterion. W can be expressed quantitatively
or qualitatively by representatives of different interested groups such as policy makers and
fishermen. It is difficult to ask stakeholders from different backgrounds to assign a numeric
value for each criterion. Thus, in this study stakeholders are supposed to present their opinions
for importance of each criterion lexically. The following equation is used to transfer the lexical
information to numeric weight value:
W = C × M (7)
Where C = [0, 0.1, 1] and M is a weighting matrix (see Appendix 3). Through this calcula-
tion, the qualitative description of importance for each criterion is transformed to numerical
numbers of weight values. An example of calculating the weight value is given in Appendix 3.
Then, by multiplying W by B, one gets the second order FCE set (K),
K = W × B = (k1, k2, . . . , kp) (8)
Springer
Water Resour Manage (2007) 21:663–676 669
Finally, by combining Equation (4) and (8), then by dividing by the sum of K, the overall
coastal impact performance (CIP) can be determined:
CIP =nd∑
p=1
kpςp
/nd∑
p=1
kp (9)
2.4. Making a consensus
It is evident that building a consensus constitutes a central process within an integrated
coastal management (Poitras et al., 2003; Vasseur et al., 1997). However, time scale of oil
spill requires a rapid decision and limits the use of a participation process for stakeholders.
One suggestion is to survey the preferences of stakeholders in a priori. Stated preferences
are then tested in a virtual case. Due to the simple structure of a voting system and its fair,
i.e., democratic nature, we carry out the group choice mechanism of voting to build a model
consensus among different interested groups. In addition, within a voting system there are
many algorithms used to aggregate group members’ preferences into a group consensus.
There exist three approaches: (a) Borda-Kendall method (B-K), where ranks are averaged;
(b) approval method where deriving a group consensus is to define the alternative with the
highest number of the top two as a winner; and (c) Cook and Seiford distance method, where
the smallest distance is examined which an ordering can offer with respect to any ordering
of the alternatives (Massam, 1993). In order to produce a widely accepted consensus and
minimize uncertainties introduced by the consensus algorithms, these three approaches are
carried out in parallel and correlations between their results are examined as well.
3. Results and discussions
3.1. Comparison with non-fuzzy method
The three aggregation methods produce different group consensuses. According to correlation
analysis, it is observed that the B-K method yields similar outcomes by comparison with the
other two methods, although the consensus results produced by Approval and Cook-Seiford
distance slightly differ from each other. The high positive correlation between B-K method
and others allowed us to produce a group consensus without introducing much uncertainty.
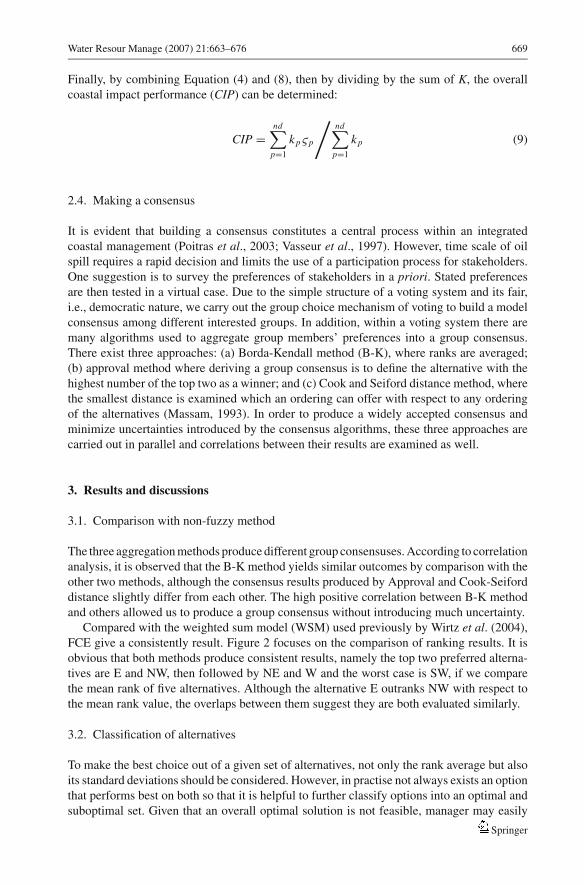
Compared with the weighted sum model (WSM) used previously by Wirtz et al. (2004),
FCE give a consistently result. Figure 2 focuses on the comparison of ranking results. It is
obvious that both methods produce consistent results, namely the top two preferred alterna-
tives are E and NW, then followed by NE and W and the worst case is SW, if we compare
the mean rank of five alternatives. Although the alternative E outranks NW with respect to
the mean rank value, the overlaps between them suggest they are both evaluated similarly.
3.2. Classification of alternatives
To make the best choice out of a given set of alternatives, not only the rank average but also
its standard deviations should be considered. However, in practise not always exists an option
that performs best on both so that it is helpful to further classify options into an optimal and
suboptimal set. Given that an overall optimal solution is not feasible, manager may easily
Springer
670 Water Resour Manage (2007) 21:663–676
Fig. 2 Ranking results derived from FCE and WSM by Wirtz et al. (2006). For each option mean rank isrepresented by histograms and again uncertainty is indicated by the standard deviation of ranks associatedwith each mean rank value
find a substitute in its original group. If we treat mean ranks and standard deviations equally
important an Euclidean metric can be employed to calculate the difference between options
oi and o j ,
d(oi , o j ) =(
2∑m=1
(o
m
i− o
m
j
)2
) 12
(10)
where o1i refers to the mean rank and o2
i to the standard deviation of option oi . Options can
be classified into one group, if their distance is minimal in a set of distances between them
and other options, such that groups with one, two or more members will emerge as shown in
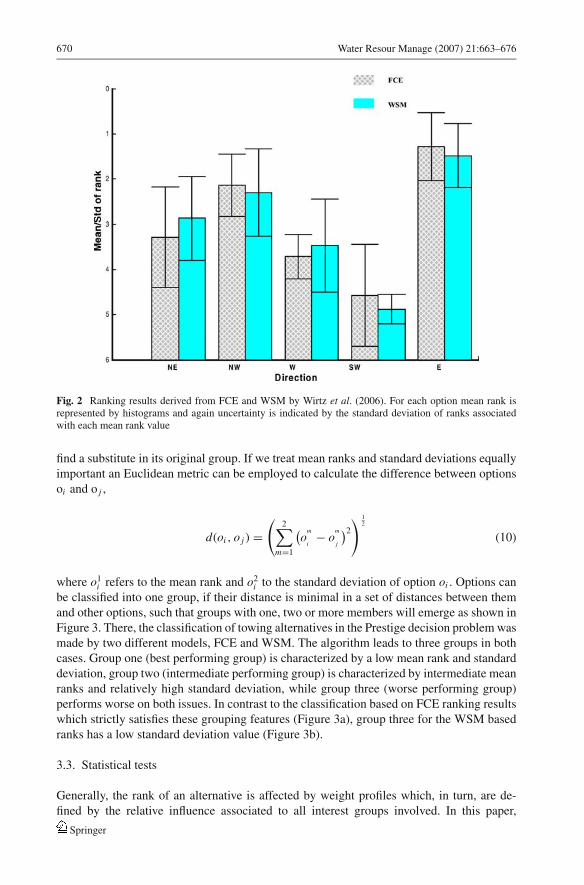
Figure 3. There, the classification of towing alternatives in the Prestige decision problem was
made by two different models, FCE and WSM. The algorithm leads to three groups in both
cases. Group one (best performing group) is characterized by a low mean rank and standard
deviation, group two (intermediate performing group) is characterized by intermediate mean
ranks and relatively high standard deviation, while group three (worse performing group)
performs worse on both issues. In contrast to the classification based on FCE ranking results
which strictly satisfies these grouping features (Figure 3a), group three for the WSM based
ranks has a low standard deviation value (Figure 3b).
3.3. Statistical tests
Generally, the rank of an alternative is affected by weight profiles which, in turn, are de-
fined by the relative influence associated to all interest groups involved. In this paper,
Springer
Water Resour Manage (2007) 21:663–676 671
Fig. 3 Classification of alternatives, (a) is based on the result from FCE. (b) is based on the resultfrom WSM. BG: best performing group; IG: intermediate performing group; WG: worse performinggroup
the importance level of each criterion can be described in three levels: important, rele-
vant and unimportant. If the importance level of one criterion is fixed, there are 2187
(3∧7) possible combinations of the remaining seven criteria. In our experiments, we cal-
culated the mean rank of 2187 scenarios for each alternative and for each importance
level of the selected criterion. During the statistical tests, the following definitions are
used:
(1) Positive criterion/Negative criterion (PC/NC): if a selected criterion whose importance
level ranging from unimportant to important may promote/degrade the mean rank of an
alternative, such a criterion is defined as a positive/negative criterion for this alternative.
(2) Null hypothesis (Ho): for a certain alternative, the importance level of one selected
criterion (ui ) ranging from important to unimportant will not lead to a change of its mean
rank (e.g. there is no ranking effect due to prevalence changes).
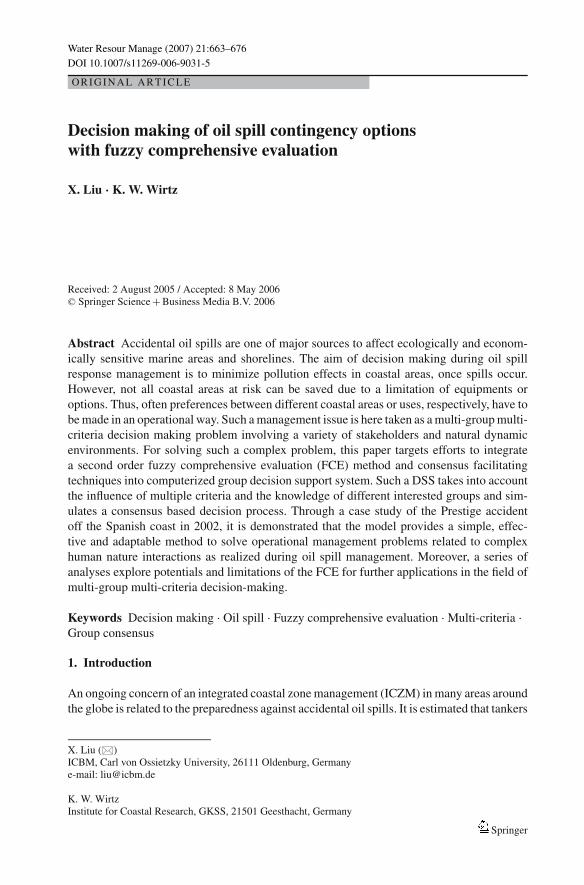
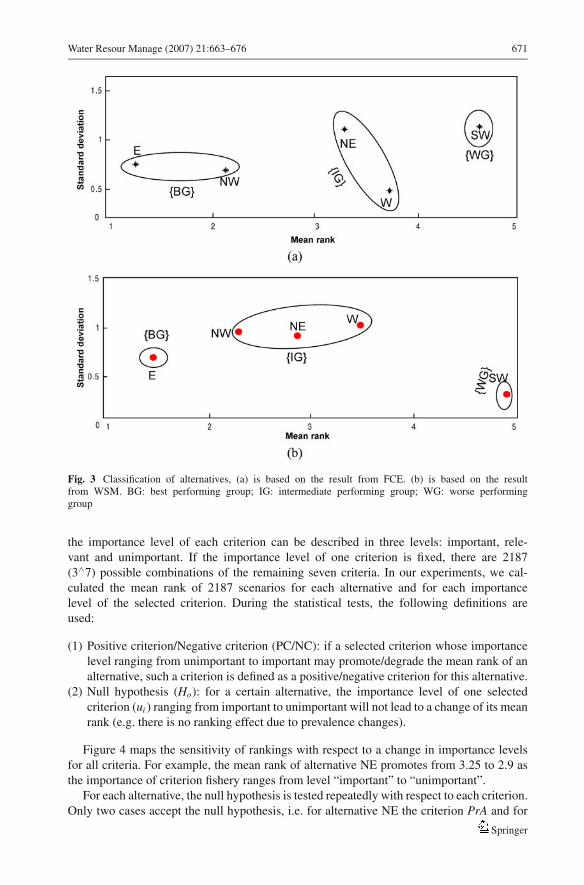
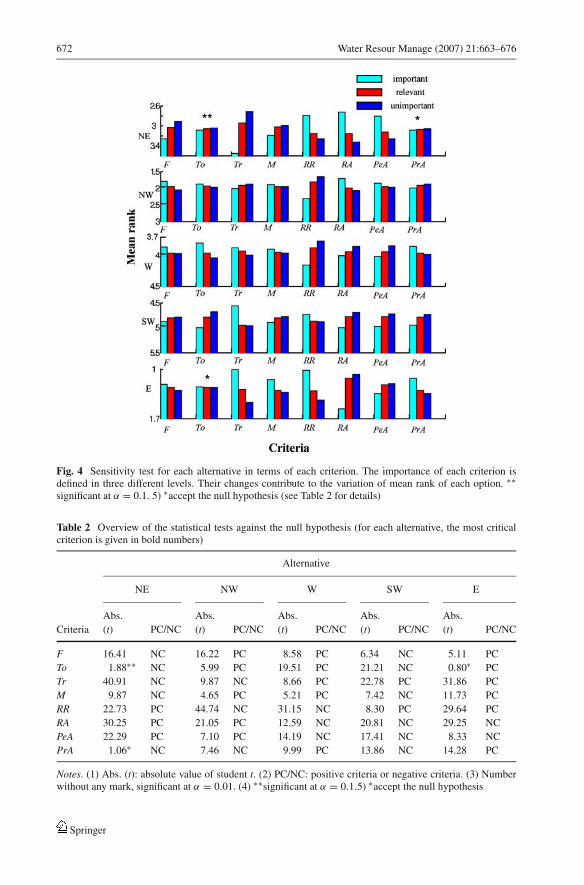
Figure 4 maps the sensitivity of rankings with respect to a change in importance levels
for all criteria. For example, the mean rank of alternative NE promotes from 3.25 to 2.9 as
the importance of criterion fishery ranges from level “important” to “unimportant”.
For each alternative, the null hypothesis is tested repeatedly with respect to each criterion.
Only two cases accept the null hypothesis, i.e. for alternative NE the criterion PrA and for
Springer
672 Water Resour Manage (2007) 21:663–676
Fig. 4 Sensitivity test for each alternative in terms of each criterion. The importance of each criterion isdefined in three different levels. Their changes contribute to the variation of mean rank of each option. ∗∗significant at α = 0.1. 5) ∗accept the null hypothesis (see Table 2 for details)
Table 2 Overview of the statistical tests against the null hypothesis (for each alternative, the most criticalcriterion is given in bold numbers)
Alternative
NE NW W SW E
Abs. Abs. Abs. Abs. Abs.
Criteria (t) PC/NC (t) PC/NC (t) PC/NC (t) PC/NC (t) PC/NC
F 16.41 NC 16.22 PC 8.58 PC 6.34 NC 5.11 PC
To 1.88∗∗ NC 5.99 PC 19.51 PC 21.21 NC 0.80∗ PC
Tr 40.91 NC 9.87 NC 8.66 PC 22.78 PC 31.86 PC
M 9.87 NC 4.65 PC 5.21 PC 7.42 NC 11.73 PC
RR 22.73 PC 44.74 NC 31.15 NC 8.30 PC 29.64 PC
RA 30.25 PC 21.05 PC 12.59 NC 20.81 NC 29.25 NC
PeA 22.29 PC 7.10 PC 14.19 NC 17.41 NC 8.33 NC
PrA 1.06∗ NC 7.46 NC 9.99 PC 13.86 NC 14.28 PC
Notes. (1) Abs. (t): absolute value of student t. (2) PC/NC: positive criteria or negative criteria. (3) Numberwithout any mark, significant at α = 0.01. (4) ∗∗significant at α = 0.1.5) ∗accept the null hypothesis
Springer
Water Resour Manage (2007) 21:663–676 673
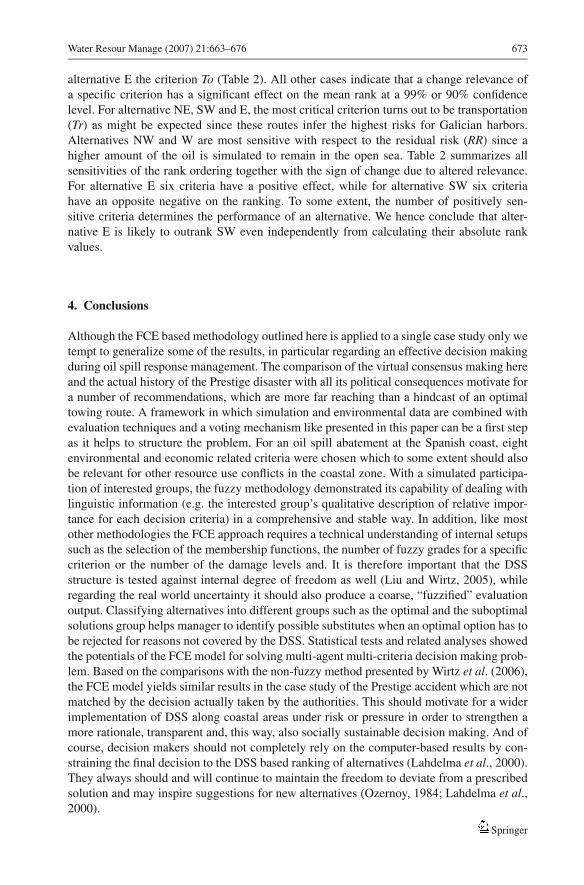
alternative E the criterion To (Table 2). All other cases indicate that a change relevance of
a specific criterion has a significant effect on the mean rank at a 99% or 90% confidence
level. For alternative NE, SW and E, the most critical criterion turns out to be transportation
(Tr) as might be expected since these routes infer the highest risks for Galician harbors.
Alternatives NW and W are most sensitive with respect to the residual risk (RR) since a
higher amount of the oil is simulated to remain in the open sea. Table 2 summarizes all
sensitivities of the rank ordering together with the sign of change due to altered relevance.
For alternative E six criteria have a positive effect, while for alternative SW six criteria
have an opposite negative on the ranking. To some extent, the number of positively sen-
sitive criteria determines the performance of an alternative. We hence conclude that alter-
native E is likely to outrank SW even independently from calculating their absolute rank
values.
4. Conclusions
Although the FCE based methodology outlined here is applied to a single case study only we
tempt to generalize some of the results, in particular regarding an effective decision making
during oil spill response management. The comparison of the virtual consensus making here
and the actual history of the Prestige disaster with all its political consequences motivate for
a number of recommendations, which are more far reaching than a hindcast of an optimal
towing route. A framework in which simulation and environmental data are combined with
evaluation techniques and a voting mechanism like presented in this paper can be a first step
as it helps to structure the problem. For an oil spill abatement at the Spanish coast, eight
environmental and economic related criteria were chosen which to some extent should also
be relevant for other resource use conflicts in the coastal zone. With a simulated participa-
tion of interested groups, the fuzzy methodology demonstrated its capability of dealing with
linguistic information (e.g. the interested group’s qualitative description of relative impor-
tance for each decision criteria) in a comprehensive and stable way. In addition, like most
other methodologies the FCE approach requires a technical understanding of internal setups
such as the selection of the membership functions, the number of fuzzy grades for a specific
criterion or the number of the damage levels and. It is therefore important that the DSS
structure is tested against internal degree of freedom as well (Liu and Wirtz, 2005), while
regarding the real world uncertainty it should also produce a coarse, “fuzzified” evaluation
output. Classifying alternatives into different groups such as the optimal and the suboptimal
solutions group helps manager to identify possible substitutes when an optimal option has to
be rejected for reasons not covered by the DSS. Statistical tests and related analyses showed
the potentials of the FCE model for solving multi-agent multi-criteria decision making prob-
lem. Based on the comparisons with the non-fuzzy method presented by Wirtz et al. (2006),
the FCE model yields similar results in the case study of the Prestige accident which are not
matched by the decision actually taken by the authorities. This should motivate for a wider
implementation of DSS along coastal areas under risk or pressure in order to strengthen a
more rationale, transparent and, this way, also socially sustainable decision making. And of
course, decision makers should not completely rely on the computer-based results by con-
straining the final decision to the DSS based ranking of alternatives (Lahdelma et al., 2000).
They always should and will continue to maintain the freedom to deviate from a prescribed
solution and may inspire suggestions for new alternatives (Ozernoy, 1984; Lahdelma et al.,2000).
Springer
674 Water Resour Manage (2007) 21:663–676
Appendices
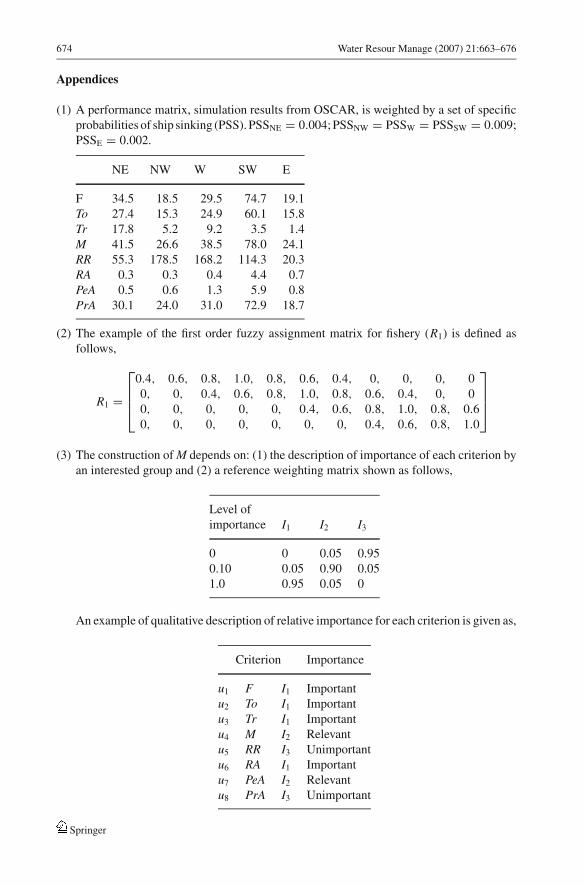
(1) A performance matrix, simulation results from OSCAR, is weighted by a set of specific
probabilities of ship sinking (PSS). PSSNE = 0.004; PSSNW = PSSW = PSSSW = 0.009;
PSSE = 0.002.
NE NW W SW E
F 34.5 18.5 29.5 74.7 19.1
To 27.4 15.3 24.9 60.1 15.8
Tr 17.8 5.2 9.2 3.5 1.4
M 41.5 26.6 38.5 78.0 24.1
RR 55.3 178.5 168.2 114.3 20.3
RA 0.3 0.3 0.4 4.4 0.7
PeA 0.5 0.6 1.3 5.9 0.8
PrA 30.1 24.0 31.0 72.9 18.7
(2) The example of the first order fuzzy assignment matrix for fishery (R1) is defined as
follows,
R1 =
⎡⎢⎢⎣0.4, 0.6, 0.8, 1.0, 0.8, 0.6, 0.4, 0, 0, 0, 0
0, 0, 0.4, 0.6, 0.8, 1.0, 0.8, 0.6, 0.4, 0, 0
0, 0, 0, 0, 0, 0.4, 0.6, 0.8, 1.0, 0.8, 0.6
0, 0, 0, 0, 0, 0, 0, 0.4, 0.6, 0.8, 1.0
⎤⎥⎥⎦(3) The construction of M depends on: (1) the description of importance of each criterion by
an interested group and (2) a reference weighting matrix shown as follows,
Level of
importance I1 I2 I3
0 0 0.05 0.95
0.10 0.05 0.90 0.05
1.0 0.95 0.05 0
An example of qualitative description of relative importance for each criterion is given as,
Criterion Importance
u1 F I1 Important
u2 To I1 Important
u3 Tr I1 Important
u4 M I2 Relevant
u5 RR I3 Unimportant
u6 RA I1 Important
u7 PeA I2 Relevant
u8 PrA I3 Unimportant
Springer
Water Resour Manage (2007) 21:663–676 675
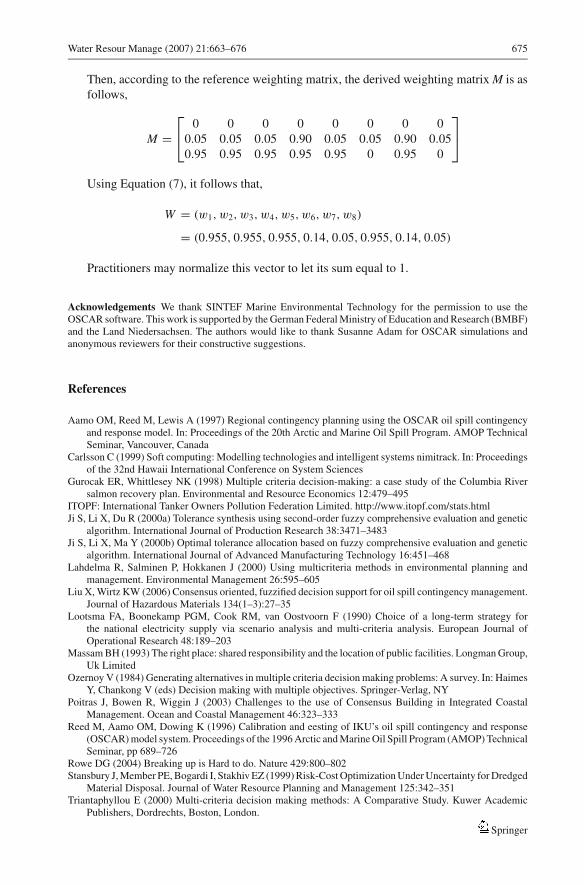
Then, according to the reference weighting matrix, the derived weighting matrix M is as
follows,
M =⎡⎣ 0 0 0 0 0 0 0 0
0.05 0.05 0.05 0.90 0.05 0.05 0.90 0.05
0.95 0.95 0.95 0.95 0.95 0 0.95 0
⎤⎦Using Equation (7), it follows that,
W = (w1, w2, w3, w4, w5, w6, w7, w8)
= (0.955, 0.955, 0.955, 0.14, 0.05, 0.955, 0.14, 0.05)
Practitioners may normalize this vector to let its sum equal to 1.
Acknowledgements We thank SINTEF Marine Environmental Technology for the permission to use theOSCAR software. This work is supported by the German Federal Ministry of Education and Research (BMBF)and the Land Niedersachsen. The authors would like to thank Susanne Adam for OSCAR simulations andanonymous reviewers for their constructive suggestions.
References
Aamo OM, Reed M, Lewis A (1997) Regional contingency planning using the OSCAR oil spill contingencyand response model. In: Proceedings of the 20th Arctic and Marine Oil Spill Program. AMOP TechnicalSeminar, Vancouver, Canada
Carlsson C (1999) Soft computing: Modelling technologies and intelligent systems nimitrack. In: Proceedingsof the 32nd Hawaii International Conference on System Sciences
Gurocak ER, Whittlesey NK (1998) Multiple criteria decision-making: a case study of the Columbia Riversalmon recovery plan. Environmental and Resource Economics 12:479–495
ITOPF: International Tanker Owners Pollution Federation Limited. http://www.itopf.com/stats.htmlJi S, Li X, Du R (2000a) Tolerance synthesis using second-order fuzzy comprehensive evaluation and genetic
algorithm. International Journal of Production Research 38:3471–3483Ji S, Li X, Ma Y (2000b) Optimal tolerance allocation based on fuzzy comprehensive evaluation and genetic
algorithm. International Journal of Advanced Manufacturing Technology 16:451–468Lahdelma R, Salminen P, Hokkanen J (2000) Using multicriteria methods in environmental planning and
management. Environmental Management 26:595–605Liu X, Wirtz KW (2006) Consensus oriented, fuzzified decision support for oil spill contingency management.
Journal of Hazardous Materials 134(1–3):27–35Lootsma FA, Boonekamp PGM, Cook RM, van Oostvoorn F (1990) Choice of a long-term strategy for
the national electricity supply via scenario analysis and multi-criteria analysis. European Journal ofOperational Research 48:189–203
Massam BH (1993) The right place: shared responsibility and the location of public facilities. Longman Group,Uk Limited
Ozernoy V (1984) Generating alternatives in multiple criteria decision making problems: A survey. In: HaimesY, Chankong V (eds) Decision making with multiple objectives. Springer-Verlag, NY
Poitras J, Bowen R, Wiggin J (2003) Challenges to the use of Consensus Building in Integrated CoastalManagement. Ocean and Coastal Management 46:323–333
Reed M, Aamo OM, Dowing K (1996) Calibration and eesting of IKU’s oil spill contingency and response(OSCAR) model system. Proceedings of the 1996 Arctic and Marine Oil Spill Program (AMOP) TechnicalSeminar, pp 689–726
Rowe DG (2004) Breaking up is Hard to do. Nature 429:800–802Stansbury J, Member PE, Bogardi I, Stakhiv EZ (1999) Risk-Cost Optimization Under Uncertainty for Dredged
Material Disposal. Journal of Water Resource Planning and Management 125:342–351Triantaphyllou E (2000) Multi-criteria decision making methods: A Comparative Study. Kuwer Academic
Publishers, Dordrechts, Boston, London.
Springer
676 Water Resour Manage (2007) 21:663–676
van Moeffaert D (2002) Multi-criteria decision aid in sustainable urban water management. Master Thesis.Royal Institute of Technology, Stockholm, Sweden
Vasseur L, Lafrance L, Ansseau C, Renaud D, Morin D, Audet T (1997) Advisory committee: a powerful toolfor helping decision makers in environmental issues. Environmental Management 21:359–365
William AT, Ergin A, Micallef A, Phillips MR (2004) South Wales Coastal Scenery: An Innovative Methodof Evaluation. In: Proceeding of the Littoral 2004, A Joined EUCC and EUUROCOAST Conference,Aberdeen, UK.
Wirtz KW, Adam S, Liu X, Baumburger N (2004) Robustness Against Different Implementation of Uncertaintyin a Contingency DSS: the Prestige oil spill accident revised. In: Pahl-Wostl C (Hrsg.) Proceeding of theInt. Environmental Modelling and Software Society Conference 2004. Osnabruek
Wirtz KW, Baumberger N, Adam S, Liu X (2006) Oil spill impact minimization under uncertainty: EvaluatingContingency Simulations of the Prestige Accident. Ecological Economics (in press).
Yu Y, Wang B, Wang G, Li W (2004) Multi-person multiobjective fuzzy decision-making model for reservoirflood control operation. Water Resources Management 18:111–124
Springer