Embed Size (px)
Citation preview
Decision Support System for Vendor Managed Inventory
Supply Chain: A Case Study
Vendor-managed inventory (VMI) is a widely used collaborative inventory
management policy in which manufacturers manages the inventory of retailers
and takes responsibility for making decisions related to the timing and extent of
inventory replenishment. VMI partnerships help organizations to reduce demand
variability, inventory holding and distribution costs. This study provides
empirical evidence that significant economic benefits can be achieved with the
use of a genetic algorithm (GA) based decision support system (DSS) in a VMI
supply chain. A two-stage serial supply chain in which retailers and their supplier
are operating VMI in an uncertain demand environment is studied. Performance
was measured in terms of cost, profit, stock-outs and service levels. The results
generated from GA-based model were compared to traditional alternatives. The
study found that the GA-based approach outperformed traditional methods and its
use can be economically justified in small and medium sized enterprises (SMEs).
.
Keywords: Vendor managed inventory, decision support system, genetic
algorithm, case study
1. Introduction
Many recent developments in the supply chain management (SCM) field are
related to the need for more effective information sharing among supply chain
members. The rapid rate of development in information technology has made it
possible to share information more effectively and for supply chain actors to
cooperate in improving supply chain performance. Vendor managed inventory
(VMI) is one of the established supply chain strategies aimed at enhancing
competitive advantage through more effective management of supply chain
operations (Jung et al., 2005).
Numerous channel partners engaging in collaboration and information sharing in
SCM via a VMI system allows vendors to harness the latest retailer sales data to
better forecast demand, control supply chain variability, reduce inventory, smooth
production, accelerate inventory replenishment, improve customer service, and
increase profit. The VMI system has been widely applied by vendors and buyers
in the grocery, household appliance, and hardware and related industries, as well
as in the general merchandise industry (Chen and Wei, 2012).
VMI represents a move away from the traditional concept of allocation of
responsibility in the replenishment process. As opposed to traditional purchases
where the customer makes the replenishment decision, the VMI concept implies
that the supplier makes this decision on the customer’s behalf based on
information about customer demand (Vigtil, 2007). These situations lead to a
specific kind of replenishment problem known as the inventory routing problem
(IRP), which combines transportation and inventory decisions. IRP assists in the
achievement of the objective of VMI, i.e. to optimize total inventory cost
(Abdelmaguid and Dessouky, 2006). It involves calculation of inventory
distribution frequency, inventory distribution quantity and the design of vehicle
routes. The main concern is to maintain an adequate level of inventory for all
customers and to avoid stock-outs. In IRPs, the delivery company (i.e. not the
customer) decides how much to deliver to which customers each day. Each day
the delivery company makes decisions about which customers to visit and how
much to deliver to each of them, while keeping in mind that decision made today
impact what has to be done in the future (Campbell et al., 2002).
Most studies agree in relation to the positive effects of VMI on supply chain
operations. However, its specific adoption in small and medium enterprises
(SMEs) appears to be rare. It is observed in the literature that the decision
problem is solved by deploying operational research (OR) or artificial intelligence
(AI) tools. Application of the genetic algorithm (GA) has been advocated by
researchers for supply chain optimization and efficiency improvement.
Discussions between the authors and supply chain managers in number of SMEs
motivated us to explore this issue in detail, as well as providing us with a real
problem to explore. This in turn provided an opportunity to develop a model that
integrates a small manufacturer and its customers using VMI and to explore the
use of a GA-based approach to improve performance. The first hypothesis of this
study is that VMI could be usefully adopted by supply chain managers in SMEs.
The second hypothesis is that in the presence of specific constraints, a GA
approach helps to improve the performance. This study developed a GA-based
decision support system (DSS) for inventory related decision making. The study
considers a single supplier, a single product and multiple retailers. It specifically
addresses the situation where customer demand is higher than production
capacity. The primary objective is to minimize the total number of vehicles,
individual and total supply chain cost and the distance travelled by the vehicles, in
addition to maximizing profits and customer satisfaction.
The remainder of this paper is organized as follows. The literature review in
section 2 discusses those studies that are relevant to VMI, IRP and GA in the
management of supply chain operations. Problem formulation and the solution
methodology that was used are presented in sections 3 and 4 respectively. The
results of the study are presented and discussed in section 5. Finally, some key
conclusions are drawn in section 6.
2. Literature Review
2.1 Vendor Managed Inventory studies
A great deal of literature is available in the VMI field. Various forms of VMI have
been adopted in different industries. In fully fledged implementations more
significant information and communication technology (ICT) support capability is
required and the majority of inventory management functions of manufacturers
are managed by vendors. Partial VMI requires less ICT support and some of the
commonly agreed functions are handled by vendor. We are dealing with a case
study where partial VMI is adopted. In this study, the decision problem is solved
by considering it as an IRP, which uses a GA approach to develop a solution. In
this literature review, therefore, studies that cover VMI, inventory routing and the
applicability of GA-based approaches are discussed.
Coordination is the key element of VMI. The different forms of coordination
within the supply chain are observed in the literature. Chen and Wei (2012)
discussed multi-period channel coordination in VMI of deteriorating goods. Three
arrangements, namely price-only contracts, revenue-sharing contracts, and
revenue-sharing plus linear rebate and side-payment contracts for channel
coordination, were developed under the retailer-managed inventory (RMI) and
vendor-managed inventory (VMI) systems, respectively. The analysis revealed
that the proposed policy under the VMI system with the revenue-sharing plus
linear rebate and side-payment contract tends to obtain low retail prices and large
demand quantities. The advantages of partial coordination could also be studied
by modeling a game. Yugang et al. (2006) studied a VMI supply chain, where a
manufacturer and multiple retailers played a game with each other under partial
co-operation in inventory control with VMI policies. The study helped to
determine optimal product marketing and inventory policies by maximizing the
individual net profits of retailers and manufacturers. Kannan et al. (2013) also
analyzed the benefits of a VMI agreement in a single supplier and multiple
customer setting. Traditional supply chain and VMI were studied and compared
for the same organization. The analysis was based on the economic order quantity
(EOQ) formula and its related total cost. VMI yielded better results in the two
specific cases that were studied. Similar results were observed by Wang (2009)
when traditional supply chain and VMI arrangements were compared.
Song and Dinwoodie (2008) compared an integrated inventory management (IIM)
policy with two pull-type VMI policies (VMI-1 and VMI-2) and a traditional
retailer-managed inventory (RMI) policy for certain replenishment lead times and
uncertain demands. Computational results showed that in such stochastic supply
chains, VMI policies were better than RMI. Daya and Nasar (2008) contended
that inventories across the entire supply chain could be more efficiently managed
through greater co-operation and better co-ordination. A cost minimization model
and its solution procedure were derived for a co-ordination problem in a three-
layer supply chain involving suppliers, manufacturers and retailers. The policy led
to considerable savings as compared to the scheme that allowed shipments after
complete lot production. VMI requires supply chain entities to unite as a team for
logistical planning. With this motivation, Uster et al. (2008) provided an
analytical model, aimed at providing efficient solution methodologies for
integrated decision making problems associated with location and inventory.
Bookbinder et al. (2010) argued that disputes over the benefits of VMI arise
because few quantitative analyses are available. Their research focused on the
costs incurred by the vendor and the customer in various settings and analyzed
tradeoffs between independent versus co-ordinated decision making. The study
helped to develop a better understanding of VMI, and in what circumstances it is
likely to succeed or fail.
Bersani et al. (2010), proposed a different approach to sustainable transportation
with the specific goal of decreasing the frequency of deliveries of petroleum
products. In their study, VMI is proposed for solving the problem. Inventory and
routing costs were included in the mathematical formulation of the problem.
Savasaneril and Erkip (2010) argue that vendor-managed availability (VMA) is an
improvement that exploits advantages beyond VMI. It ensures the availability of
material to suppliers at any cost. This study showed that such vendor-managed
systems provide increased flexibility in the manufacturer’s operations and may
bring additional benefits. Marques et al. (2010) presented a literature review,
based on the conceptual elements and suggested a macro-process that summarized
both operational and collaborative elements of VMI. From the above literature, it
is quite clear that VMI is a win-win situation for the manufacturer and retailer. Its
adoption helps to improve flexibility, improve profits, reduce costs, improve
customer service and optimize inventory.
The contribution of recent papers dealing with VMI, information sharing and
inventory routing problem is also noted. For instance, Choudhary and Shankar
(2014 b) realized that the extent and intensity of competitive advantage gained
from VMI above and beyond IS varies from company to company depending on
the demand process and business environment in which a supply chain operated.
Authors carried out numerical study considering a large number of business
settings and determined the incremental value offered by VMI beyond that of IS
alone under non-stationary stochastic demand with service-level constraints. In
other sudy, Dong et al. (2014) studied impact of VMI after controlling for its
information-sharing component. The study included 52 weeks data that allowed
investigation of firm-level heterogeneity. The sample included a control group of
non-VMI distributors to isolate the effects of the decision-transfer component of
VMI from the information-sharing component (i.e. EDI). It was observed that
VMI affected both cost and service components of distributor performance and
that manufacturers’ bullwhip was related to inventory variability. In their study,
Salzarulo and Jacobs (2014) considered a two-echelon serial supply chain where a
single manufacturer replenishes a single downstream customer who faces random,
stationary and discrete demand. The performance of a traditional supply chain
having no information sharing to one where the customer shares demand and
inventory information with the manufacturer was compared. The case of central
control where the manufacturer has full control over replenishment was also
analyzed. Renewal theory was applied to develop probability models to measure
the performance of these three supply chain scenarios. A computational analysis
of central control setting offered an improvement over the no-information sharing
setting. In the era of cut throat competition, increased cost pressure and more
demanding customers have forced companies to move ahead of IS to improve
supply chain competitiveness with new forms of retailer–supplier collaboration.
Chaudhary et al. (2014) applied an integer linear programming models to quantify
the benefits that can be accrued with a shift in inventory ownership or shift in
decision-making power under deterministic time-varying demand conditions. It
was found that higher levels of collaboration between the supplier and the retailer
leads to greater implementation difficulties and increases in operational costs.
Chaudhary and Shankar (2014 a) extended above work to investigate the value of
VMI above and beyond IS considering time-varying stochastic demand with
service-level constraints. Authors applied mixed integer linear programming
model to determine optimal timings and replenishment quantities of the retailer
under ‘static uncertainty’ strategy.
Joint replenishment and inventory control of perishable products was discussed
by Cohelo and Laporte (2014). The problem was modelled and solved by
applying priority policies, where in retailer assigns higher priority to older and
fresher items. The model remained linear even when the product revenue
decreased in a non-linear or even in anon-convex fashion over time. The model
identified products of different ages independently from each other in a multi-
product environment. The model also optimally determined which items to sell at
each period based on the trade-off between cost and revenue. The algorithm
effectively computed optimal joint replenishment and delivery decisions for
perishable products.
Our study is similar to the study conducted by Archetti et al. (2007). A
distribution problem in which a product has to be shipped from a supplier to
several retailers over a given time horizon was considered. The supplier monitors
the inventory of each retailer and determines its replenishment policy,
guaranteeing that no stockout occurs at the retailer (i.e. a VMI policy). Every time
a retailer is visited, the quantity delivered by the supplier has to be such that the
maximum inventory level is reached (i.e. deterministic order-up-to level policy).
Shipments from the supplier to the retailers are performed by a vehicle of given
capacity. The problem was to determine for each discrete time period the quantity
to ship to each retailer and the vehicle route. A mixed-integer linear programming
model and branch-and-cut algorithm was applied to solve the problem optimally.
The optimal solution of the problem with the solution of two problems obtained
by relaxing the deterministic order-up-to level policy was compared.
2.2 Inventory routing and genetic algorithm approaches
The genetic algorithm (GA) is a randomized search technique that is based on
ideas from the natural selection process. Starting from an initial set of solutions,
generations of new solutions are obtained through applying neighborhood search
operators. These operators are applied to randomly selected solutions from the
current set of solutions, where the selection probability is proportional to the
solution’s objective function value. GAs have been successfully implemented for
a wide range of combinatorial optimization problems (Gen and Cheng 1997, cited
in Abdelmaguid and Dessouky, 2006). The authors also reviewed the literature on
inventory routing and G.A. based studies in VMI. Nacchpan et al. (2006)
presented an information technology (IT)-driven normative model of the VMI
system in a two-echelon supply chain comprising m vendors and n buyers, A
knowledge management system (KMS) using a GA was proposed to solve
supply chain problems. The proposed model delivered better results than
traditional models. Kim et al. (2009) studied the multi-period capacitated vehicle
routing problem (CVRP) aimed at determining a service combination for each
customer, as well as the vehicle routes in each period while satisfying the
restrictions on vehicle capacity and travel distance/time. The problem was solved
using a two-stage heuristic, where an initial solution was obtained by assigning a
service combination to each collection point. The solution was then improved by
changing the service combination assigned to each collection point.
Computational experimentation was carried out on the case data and significant
improvements over conventional methods are reported. Tarantilis et al. (2002)
described a new stochastic search meta-heuristic algorithm referred to as the list-
based threshold accepting (LBTA) algorithm for solving the CVRP. The proposed
algorithm produced satisfactory solutions in a reasonable amount of time by
tuning only one parameter of the algorithm thus making it a reliable and practical
tool for decision support systems designed for solving real world vehicle routing
problems. Lee et al. (2010) studied the supply chain network design problem,
which involves the location of facilities, allocation of facilities, and routing
decisions. The study proposed two mixed integer programming models, one
without routing and one with routing. A heuristic algorithm based on LP-
relaxation method was used to solve the routing model. The results show that a
heuristic algorithm could find a better solution in a reasonable time. Thangiah and
Salhi (2001) proposed a generalized clustering method using a GA-based
approach. The Genetic Clustering (GenClust) method was used for solving the
multi-depot vehicle routing problem. The genetic clustering method found 11 new
best known solutions from the 23 problems in the literature set. Chakroborty and
Mandal (2005) proposed an optimization algorithm for the general vehicle routing
problem. The algorithm used mutation based genetic algorithms (or asexual GAs).
The algorithm gave optimal or near-optimal solutions with minimal computational
effort. Prins et al. (2009) used tour splitting heuristics for capacitated vehicle
routing problems. This involves building one giant tour that visits all customers
and then spliting this tour into capacity-feasible vehicle trips. Numerical tests on
the capacitated arc routing problem (CARP) and the CVRP showed that
randomized versions outperform classical constructive heuristics. Jabaliet al.
(2009) presented a model that optimizes the relevant costs taking into account
unplanned delays. Experiments using a tabu search (TS) heuristic on a large
number of data sets were provided. The trade-off between routing schedules that
are and those that are not protected against delays was examined.
From the literature it is gauged that each researcher has dealt a specific problem
and attempted to find a solution thereof. In few cases, where certain multi-
objective decision making criteria/optimization techniques are adapted, the
attempts were to find a global solution from a local solution. Each supply chain
problem is unique in nature and there cannot be a specific or one fix solution.
Some techniques may prove useful in some instances and may not provide
optimal solution in other situations. It is the onus of researchers to judge the
characteristics of the inventory problem and find the optimal or near optimal
solution. Ours is a case study of a small enterprise where focus is on achieving
maximum profit. Since genetic algorithm is naturally suited for maximization
problems it became our first choice to develop decision support system. We
would also compare the results with other traditional techniques.
2.3 Hypotheses development
From the above mentioned studies it is clear that VMI in its various forms has
been applied effectively to inventory decision making. In most of the studies,
either a mathematical modeling approach or computer program is used to find the
optimal solution. The AI tools are also used effectively for this purpose. From the
literature review, it is further observed that the problem is addressed in quite a
piecemeal and fragmented manner. In some cases the schedule is important, with
some cases focusing on building routes. Some try to fit in a delivery window,
while others estimate the optimum inventory to be supplied. The solutions are not
compared to the traditional solutions typically applied by SMEs. This study
considers the problem in a holistic and integrated manner and decides the
retailer’s inventory, vehicle routes and vehicle utilizations for each vehicle, as
well as optimizing profit for retailers and the supplier using a GA-based approach.
In this way, the literature reviewed by the authors as summarized above leads to
the development of the following hypotheses:
H1 - In the presence of specific constraints, a GA-based approach helps to
improve performance; and,
H2 - VMI could be usefully adopted by supply chain managers in SMEs.
3. Problem description and methodology
3.1 Problem description
We consider a case study involving a manufacturer that produces bread and
supplies to multiple retailers. The retailers are geographically dispersed and have
different demands each day. The product is fast moving and perishable in nature;
therefore, the problem needs to be addressed carefully. Initially, there was no
agreement between the manufacturer and the retailers about supply of product.
Retailers used to place orders with the manufacturer to satisfy the demand of end
users. With increasing demand for the product, it became essential for the
manufacturer to revise the replenishment and distribution strategy. Literature
shows that in such circumstances, VMI partnerships help organizations to reduce
demand variability, inventory holding and distribution costs. IRP in VMI finds a
distribution strategy that minimizes long-term distribution costs (Savelsbergh and
Song, 2007). IRP is generally solved using dynamic programming, linear
programming, mixed integer programming, meta-heuristics, fuzzy logic and
genetic operators. (Kim et al., 2009; Lee et al., 2010; Thangiah and Salhi, 2001;
Jabaliet al., 2009; Chakroborty and Mandal, 2005; Prins et al., 2009). We
undertook an IRP in the case company aimed at taking inventory and
replenishment related decisions. Based on the results of the above mentioned
studies we felt that the multiple objectives could be effectively solved using our
proposed GA-based approach.
This study is an extension of Borade and Bansod (2011), which applied a fuzzy
logic approach for IRP. In their study, it was found that many retailers were not
served with any quantity. In the present study, we aim to solve the same problem
with genetic operators. Some of the assumptions and objectives are also similar.
However in this study, by adopting genetic operators, we will not be able to serve
all the retailers, but we could avoid zero allocation and allot at least some quantity
to every retailer. Using genetic operators relative importances are assigned to the
retailers. Since the demand is higher than production capacity, retailers have to be
chosen such that profits for suppliers and retailers improve. The supply chain
manager has to plan the detailed logistics of supplying the demand of retailers.
Finally routes are decided. The results are then compared with various
approaches. For these comparisons, this study used the multi-criteria decision
making tool MAPPAC.
The specific objectives of the study are:
(1) To decide the number of retailers to be served;
(2) To decide the inventory to be supplied at each retail outlet;
(3) To decide the number of vehicles taking into account vehicle capacity;
(4) To decide the route that minimizes retailer cost, manufacturer cost and the
system-wide cost;
(5) To maximize retailer and supplier profit;
(6) To maximize delivery volume per mile;
(7) To minimize the bullwhip effect;
(8) To improve customer service levels;
(9) To maximize the number of retailers to be served; and,
(10) To improve the total delivery volume.
Formulation of a simulation or mathematical model of any real-world problem
requires that certain assumptions are made. The main assumptions made during
the detailed formulation of this study are shown in table A. While formulating the
problem certain notations are used - these are shown in table B.
3.2 Methodology
In this paper, we adopt a GA-based approach for inventory replenishment
decisions. The entire program was developed and executed in Matlab (see Figure
1 for screenshot). The number of retailers, their locations, various associated
costs and vehicle details were fed into the program. Since the ultimate objective is
to decide the daily inventory for retailers based on GAs, demand over the previous
four weeks for each retailer was also fed into the program. As noted earlier, we
are dealing with a case study where total demand is higher than manufacturing
capacity. Traditional methods such as simple heuristics, maximum usage, LIFO,
FIFO and equal priority were also used for deciding supply quantities for each
retailer. The results of the fuzzy-based approach which was developed in Borade
and Bansod (2010) were also taken for comparison.
Results obtained using the GA-based approach were then compared with those
obtained from the more traditional methods. Lastly, using the swap and single
point insertion method the routes were decided. An outline of research is shown in
figure 1, and the GA module process flow is shown in figure 2.
In section 3.3, the various criteria that are used for choosing customers are
explained. A detailed discussion of the genetic operators is provided in section
3.4. The following step - i.e. determining the routes of customer who are chosen
for service - is discussed in section 3.5
3.3 Prioritizing and serving customers
Our objectives are: to decide the number of retailers to be served; the inventory to
be supplied at each retailer’s outlet; and the number of vehicles required by taking
into account vehicle capacity. In the first phase of our study, retailers are
prioritized and served by applying various criteria as discussed below.
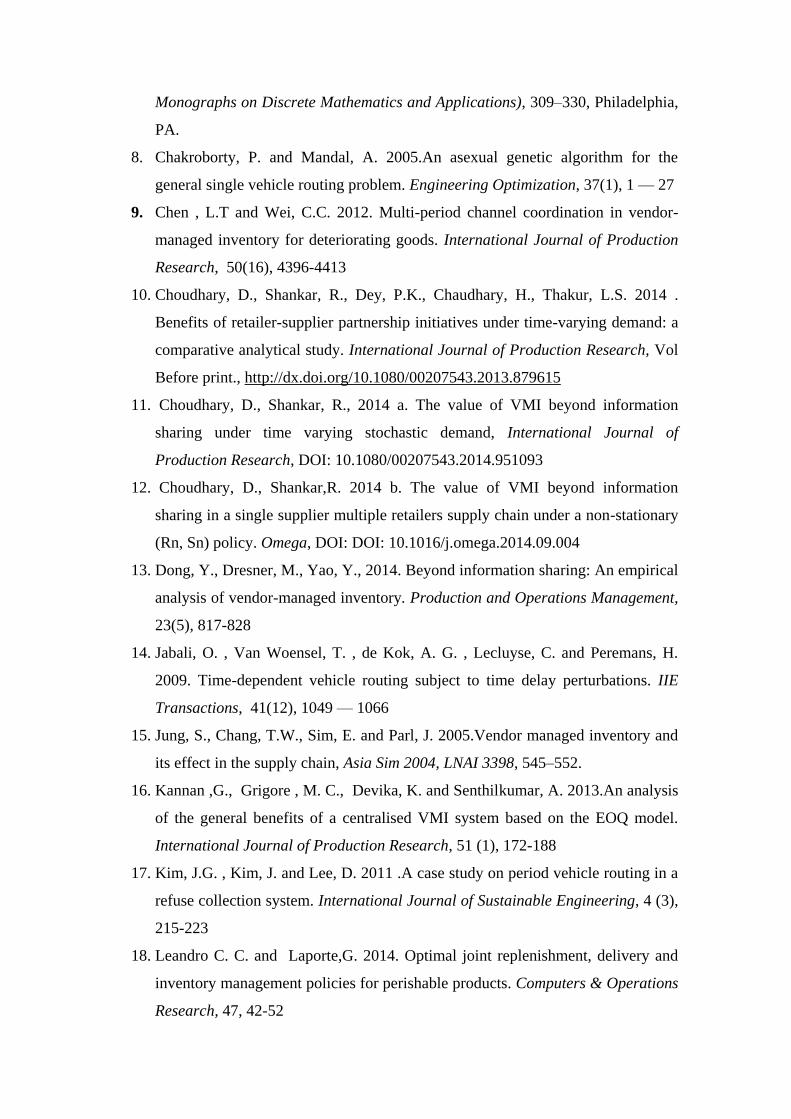
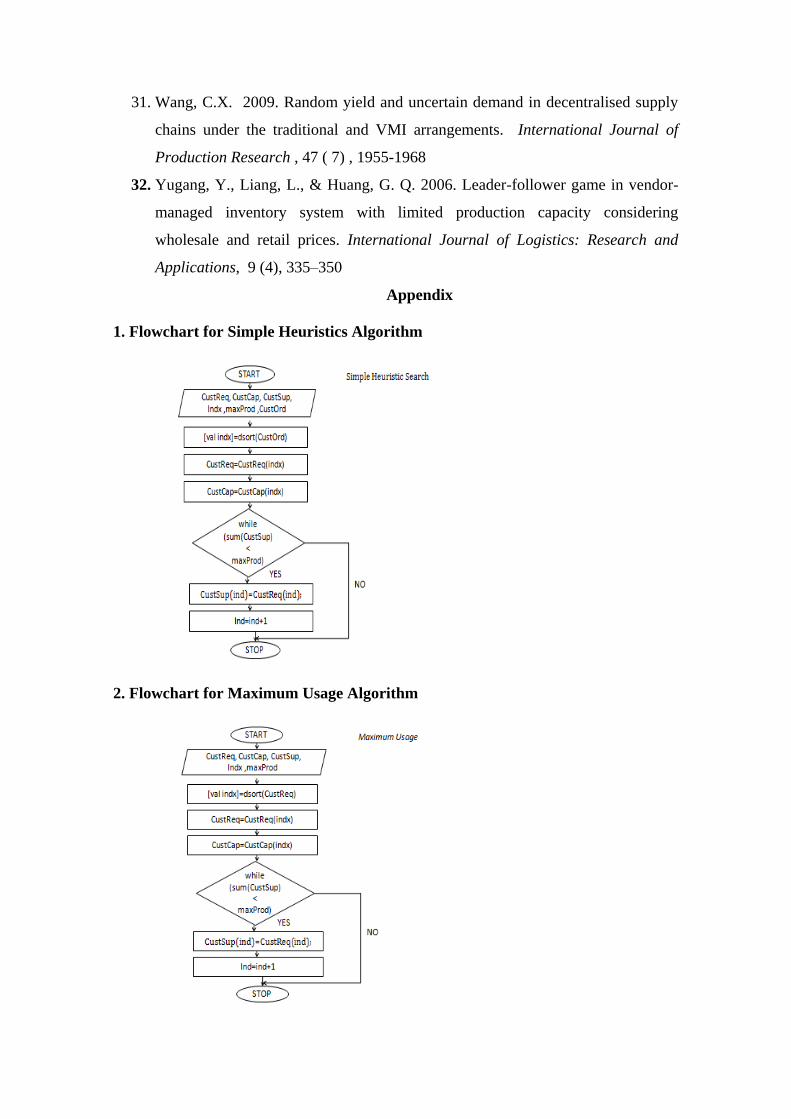
3.3.1 Simple Heuristics.
The application of this criterion involves trying to supply whatever is demanded
from the given order-log. . No priority is accorded to any retailer. The set of
customers whose total demand quantity is closest to total production capacity is
chosen for service using the flowchart shown in Appendix:
3.3.2 Maximum Usage.
Using this criterion, retailers are served based on their usage on the particular day.
Thus, the retailer with the highest daily demand quantity is chosen for
replenishment first. The second to be replenished would be the one with the
second highest demand and so on. The retailer with the lowest demand would be
served last. The set of customers whose total demand quantity is closest to total
production capacity is chosen for service using the flowchart shown in the
Appendix.
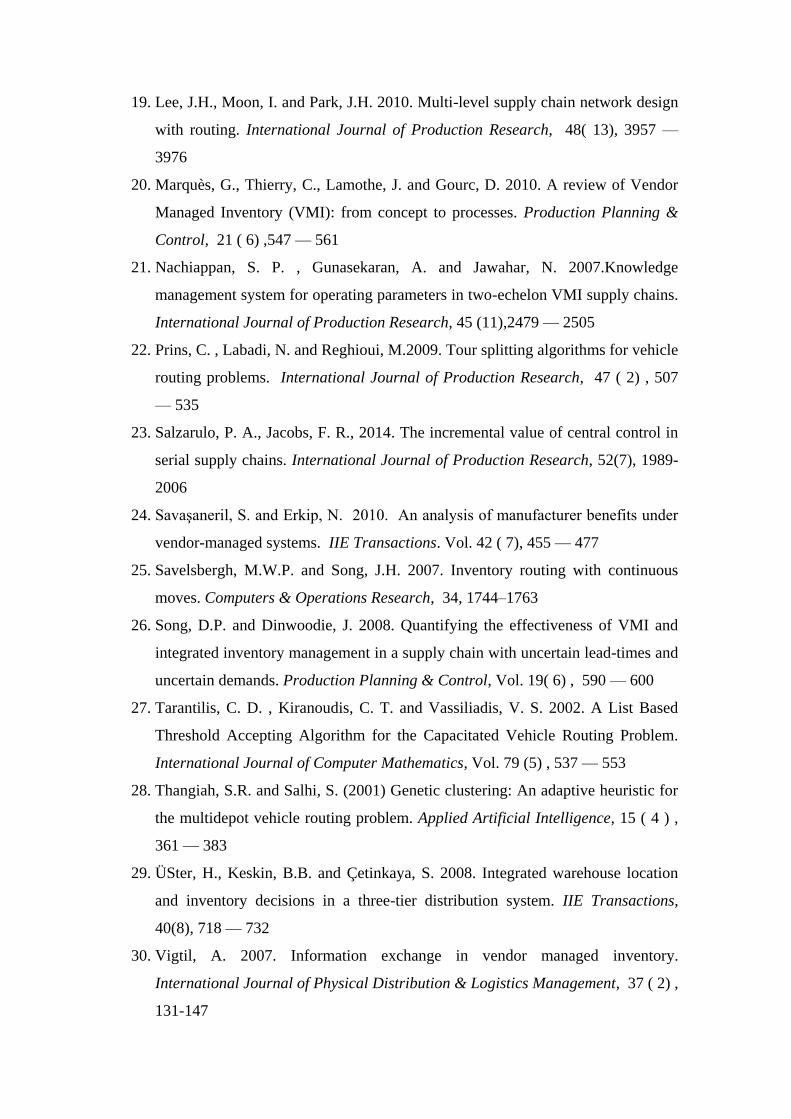
3.3.3 Last-In-First-Out (LIFO).
With this policy, the retailer who placed the most recent order is served first with
retailers who placed earlier orders given lower priority. The set of customers
whose total demand quantity is closest to total production capacity is chosen for
service using the flowchart shown in the Appendix.
3.3.4 First-In-First-Out (FIFO).
With this policy, the retailer who places the earliest order is served first with the
retailers who place later orders given lower priority. The set of customers whose
total demand quantity is closest to total production capacity is chosen for service
using the flowchart shown in the Appendix.
3.3.5 Equal Priority.
In this policy, all retailers are considered as equal. The difference in total actual
demand and maximum production is distributed equally to every retailer. The
replenishment is done irrespective of order pattern. For example, if total demand
is 25000 for 50 retailers, and maximum production is 20000 units, then the
difference (i.e. 5000 units) is equally distributed among the 50 retailers. Thus, 100
units would be deducted from the demand of each retailer. As with the other
criteria, the set of customers whose total demand quantity is closest to total
production capacity is chosen for service using the flowchart shown in the
Appendix.
3.3.6 Fuzzy Approach.
A fuzzy min-max neural (FMMN) technique was adopted to solve the problem.
This FMMN clustering technique uses a hyperbox (HB) fuzzy set concept. In the
FMMN algorithm, a pair of min-max points defines HBs and a membership
function is defined with respect to these points. The membership function for each
HB fuzzy set describes the degree to which the pattern fits within a HB. The
FMMN learning algorithm has three steps - expansion, overlap and contraction of
the HBs, respectively. The retailer weightings, demand variation and various costs
were used as training data for HBs. As discussed in Borade and Bansod (2010) the
procedure adopted for training the HBs was as follows:
Step 1 - Functions were defined.
Step 2 - Customer weightings, demand variation, order processing cost,
transportation cost, inventory handling cost, manufacturing cost and stock-out
cost were loaded.
Step 3 - Feature matrix was normalized.
Step 4 - Class index was appended.
Step 5 - HBs were initialized with min and max points.
Step 6 - Learning of fuzzy min-max neural network was achieved.
Step 7 - Vectors containing indices of HB corresponding to the class of applied
pattern and length were found.
Step 8 - HB index belonging to the same class was stored.
Step 9 - Membership function of HB was found.
Step 10 - Min-max points were created using equations (3) and (4).
Step 11 - Overlapping was checked using the contraction process.
Step 12 - Finally, a trained set of HBs was found.
3.4 Genetic Algorithm Based Approach.
The algorithm uses one population only, which may contain both feasible and
infeasible individuals. The algorithm calculates the number of retailers to be
served and their allocation as well as the route for each day. The process is
adopted from Bhagwat et al. (2010).
3.4.1 Generation of Initial Chromosomes.
The methodology is initialized by generating chromosomes X, each of length Nr.
1. Prior to generating the initial chromosomes, a set {S} is generated, which
comprises the set of suppliers which are to be served.
2. By considering the above determined sets, the initial chromosomes are
generated as follows :
[ Xk = { X0 , X1, X2 , Xnr -1 } ; 0 =<k =< N p-1 ]
3. Each gene of the chromosome is an arbitrary integer generated within the
interval [0,| |i −1]
We used a grouping representation of a tour for total number of retailers denoted as
follows.
𝑆 =⋃𝑇𝑘
𝑘
𝑘=1
Where, S-Solution and Tk= ⋃ 𝑇𝑘𝑖𝑣𝑛𝑣𝑛=1
Tk indicates tour containing (1 to 50) retailers. And the number of retailers is denoted
by k. Tki is subgroup of tour allotted to exact number of chosen retailers corresponding
to Vn vhehicles.
3.4.2 Fitness Evaluation.
Once the chromosomes and the corresponding status set are generated, then they
are subjected to the determination of fitness value. The fitness of the generated
chromosome is evaluated by a fitness function which is developed for the
particular problem. Here, the fitness function is given by
tk=∑1NsRt-{ Rt (xk(i,j))}t*Rno(Sinv)+ ∑Prodc
1min{ Sinv * Rno }
We have used two sets of chromosomes Ns and Prodc. Ns has maximum limit of 50,
and Prodc which has maximum limit of 18000. { Rt (xk(i,j))}tis the instant of path or
optimal tour in the xK , min{ Sinv * Rno } indicated by the Prodc generated with k
chromosome. Among the Ns chromosomes, the Sinv chromosomes have maximum
fitness and suitable path xk as the best chromosomes.
3.4.3 Crossover.
Crossover is one of the genetic operators that mates two chromosomes so as to produce
an offspring. In the proposed methodology, a single point crossover operation is
performed to mate the parent chromosomes (i.e. the best chromosomes). The crossover
is performed with a crossover rate of Cr. Based on Cr, the crossover point Cp is
selected in the parent chromosomes and the genes of theparent chromosomes that are
beyond the Cp are interchanged between the two parent chromosomes.Usingthis
crossover operation, an offspring is obtained for two parent chromosomes and the
resulting offspring has, therefore, the genes of both the parent chromosomes. In this
manner, Np / 2 offspring is obtained while mating the Np / 2 parent chromosomes. The
offspring obtained from crossover operations aresubjected to mutation to produce new
offspring.
3.4.4 Mutation.
The mutation operator is responsible for producing a new generation from the best
initial chromosomes. Among several mutation operators, random mutations were
performed at a mutation rate of Mr. Based on Mr, the number of the mutation
points are determined as Nm = Mr .Nr.
3.4.5 Termination Criteria.
The chromosomes present in the population pool are evaluated by the fitness
function as already performed and the same process is repeated iteratively. The
process is repeated until it reaches a maximum number of iterations (Ng). Once it
has been terminated, a final best chromosome is obtained fromthe population pool
based on its fitness value. In the final best chromosome, each gene indicates the
suppliers who can supply the corresponding inventory in a cost effective manner.
3.5 Routing.
From the given set of locations of retailers, the retailer with minimum distance was
chosen as an arbitrary point to start the routing procedure. After the initial solution, a
‘swap’ operator was applied for improving the solution. The ‘swap’ operator calculates
the minimum distance and alters the retailer’s service order so as to get the optimum
route (i.e. that which minimizes travelling distance) using the flowchart shown in the
Appendix.
The solution obtained is further improved by applying a single point insertion method
where the insertion heuristic inserts new customer to the route. It tries all possible
insertions in the routes for a specified vehicle using following algorithm:
swpt1=floor(npts*rand)+1;
swpt2=floor((npts-1)*rand)+1;
order=1:npts;
order(swpt1)=[];
order=[order(1:swpt2) swpt1 order((swpt2+1):(npts-1))];
pnew = p(order);
lennew=LocalPathLength(pnew,distmatrix);
if lennew<len,
p=pnew;
len=lennew;
drawFlag=1;
end
From the given data retailers and routes are chosen such that total supply does not
exceed total production and vehicle capacity (i.e. R1+ R2+ R3+…Rn.< Max.
Production). The group of these retailers is assigned to each vehicle and a route
such that R1+R2+R3+… < Vc1. If the supplying quantity exceeds vehicle
capacity then another group of retailers is formed and allocated to the next vehicle
and to another route (i.e. R5+R6+R7+… < Vc2 ). The process is repeated until the
total truck load is less than or equal to total production capacity.
4. Performance Measures
In order to identify the optimum approach, the results obtained were evaluated
using various performance measures. The VMI approach adopted in this study
affects the balance of the cost burden for retailers and suppliers as discussed
below.
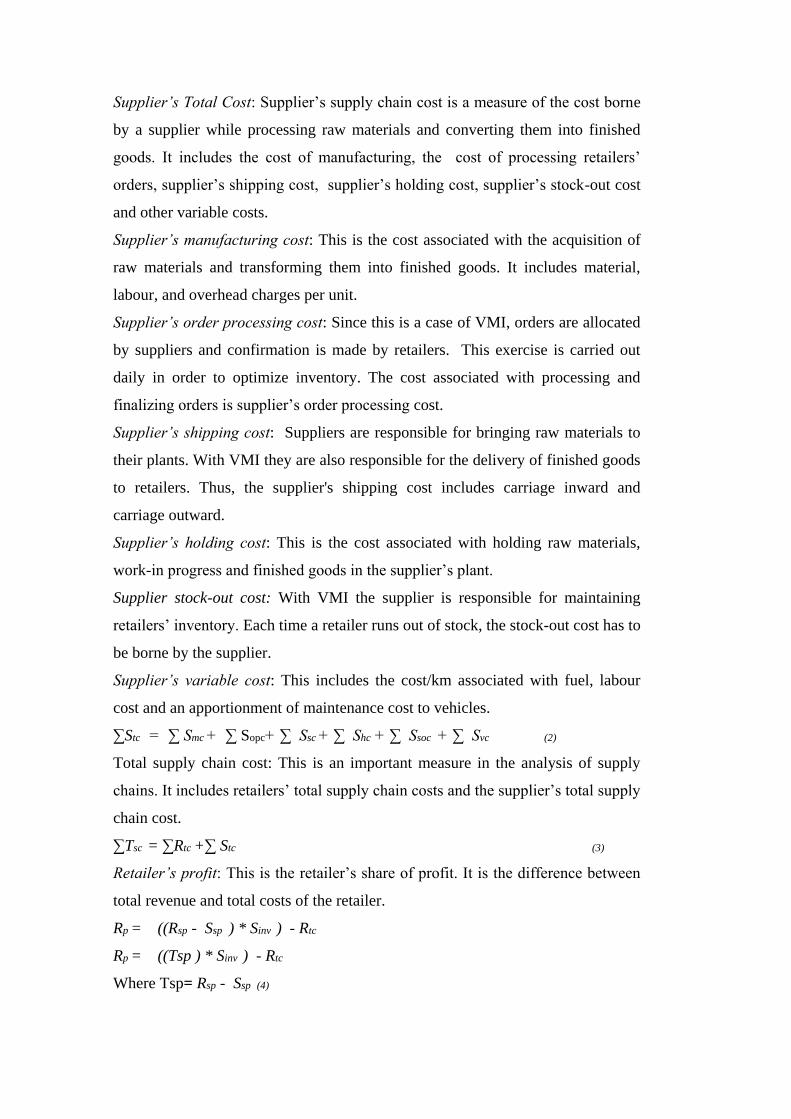
Retailer’s Total Cost: Retailer’s supply chain cost is a measure of the cost borne
by a retailer while maintaining finished goods inventory. Each time an order is
placed, there is some associated cost (ordering cost). Similarly, after receipt of
finished goods at the store until they are sold, the retailer has to bear the holding
cost. In this study, the sum of a retailer’s ordering cost and holding cost is the
retailer’s total cost:
Rtc = Roc + Rhc (1)
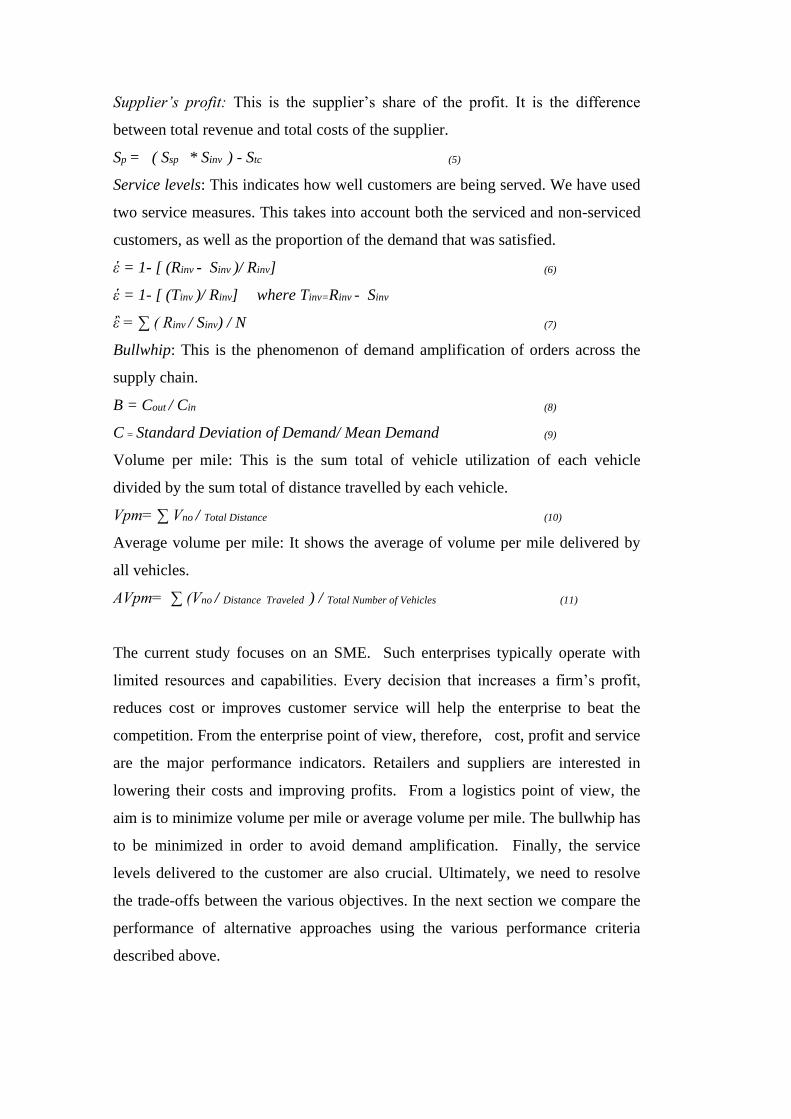
Supplier’s Total Cost: Supplier’s supply chain cost is a measure of the cost borne
by a supplier while processing raw materials and converting them into finished
goods. It includes the cost of manufacturing, the cost of processing retailers’
orders, supplier’s shipping cost, supplier’s holding cost, supplier’s stock-out cost
and other variable costs.
Supplier’s manufacturing cost: This is the cost associated with the acquisition of
raw materials and transforming them into finished goods. It includes material,
labour, and overhead charges per unit.
Supplier’s order processing cost: Since this is a case of VMI, orders are allocated
by suppliers and confirmation is made by retailers. This exercise is carried out
daily in order to optimize inventory. The cost associated with processing and
finalizing orders is supplier’s order processing cost.
Supplier’s shipping cost: Suppliers are responsible for bringing raw materials to
their plants. With VMI they are also responsible for the delivery of finished goods
to retailers. Thus, the supplier's shipping cost includes carriage inward and
carriage outward.
Supplier’s holding cost: This is the cost associated with holding raw materials,
work-in progress and finished goods in the supplier’s plant.
Supplier stock-out cost: With VMI the supplier is responsible for maintaining
retailers’ inventory. Each time a retailer runs out of stock, the stock-out cost has to
be borne by the supplier.
Supplier’s variable cost: This includes the cost/km associated with fuel, labour
cost and an apportionment of maintenance cost to vehicles.
∑Stc = ∑ Smc + ∑ Sopc+ ∑ Ssc + ∑ Shc + ∑ Ssoc + ∑ Svc (2)
Total supply chain cost: This is an important measure in the analysis of supply
chains. It includes retailers’ total supply chain costs and the supplier’s total supply
chain cost.
∑Tsc = ∑Rtc +∑ Stc (3)
Retailer’s profit: This is the retailer’s share of profit. It is the difference between
total revenue and total costs of the retailer.
Rp = ((Rsp - Ssp ) * Sinv ) - Rtc
Rp = ((Tsp ) * Sinv ) - Rtc
Where Tsp= Rsp - Ssp (4)
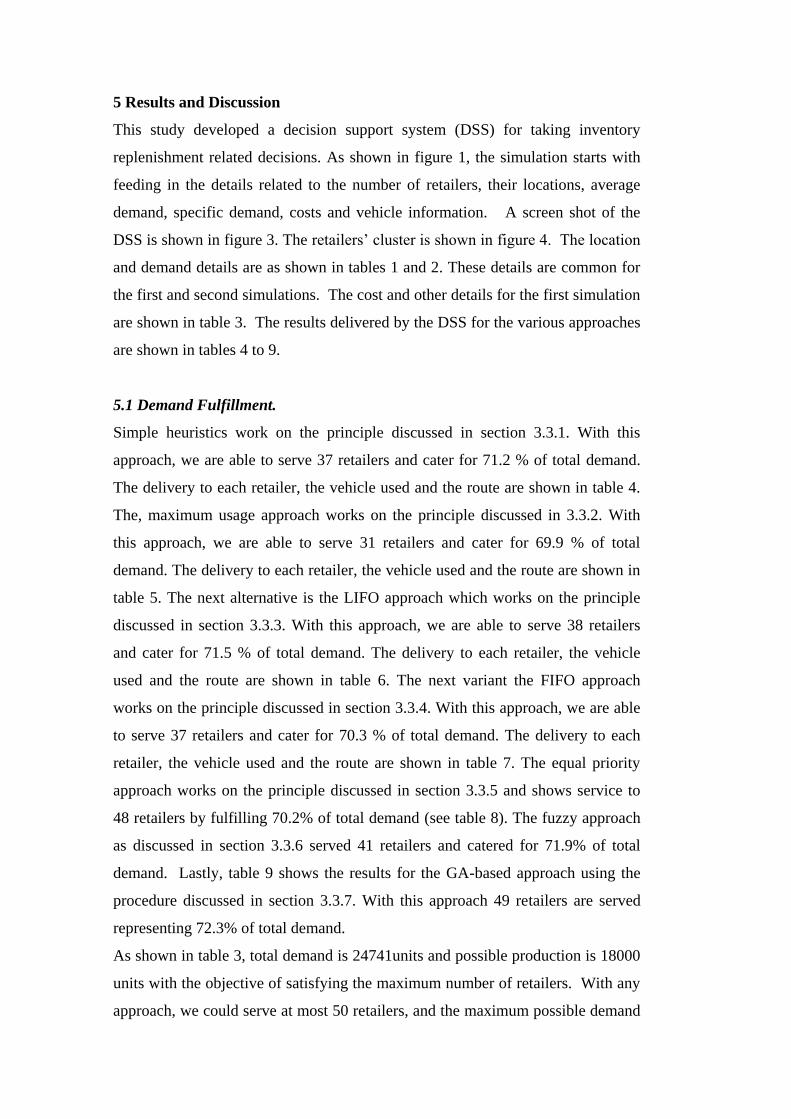
Supplier’s profit: This is the supplier’s share of the profit. It is the difference
between total revenue and total costs of the supplier.
Sp = ( Ssp * Sinv ) - Stc (5)
Service levels: This indicates how well customers are being served. We have used
two service measures. This takes into account both the serviced and non-serviced
customers, as well as the proportion of the demand that was satisfied.
ἑ = 1- [ (Rinv - Sinv )/ Rinv] (6)
ἑ = 1- [ (Tinv )/ Rinv] where Tinv=Rinv - Sinv
ἒ = ∑ ( Rinv / Sinv) / N (7)
Bullwhip: This is the phenomenon of demand amplification of orders across the
supply chain.
B = Cout / Cin (8)
C = Standard Deviation of Demand/ Mean Demand (9)
Volume per mile: This is the sum total of vehicle utilization of each vehicle
divided by the sum total of distance travelled by each vehicle.
Vpm= ∑ Vno / Total Distance (10)
Average volume per mile: It shows the average of volume per mile delivered by
all vehicles.
AVpm= ∑ (Vno / Distance Traveled ) / Total Number of Vehicles (11)
The current study focuses on an SME. Such enterprises typically operate with
limited resources and capabilities. Every decision that increases a firm’s profit,
reduces cost or improves customer service will help the enterprise to beat the
competition. From the enterprise point of view, therefore, cost, profit and service
are the major performance indicators. Retailers and suppliers are interested in
lowering their costs and improving profits. From a logistics point of view, the
aim is to minimize volume per mile or average volume per mile. The bullwhip has
to be minimized in order to avoid demand amplification. Finally, the service
levels delivered to the customer are also crucial. Ultimately, we need to resolve
the trade-offs between the various objectives. In the next section we compare the
performance of alternative approaches using the various performance criteria
described above.
5 Results and Discussion
This study developed a decision support system (DSS) for taking inventory
replenishment related decisions. As shown in figure 1, the simulation starts with
feeding in the details related to the number of retailers, their locations, average
demand, specific demand, costs and vehicle information. A screen shot of the
DSS is shown in figure 3. The retailers’ cluster is shown in figure 4. The location
and demand details are as shown in tables 1 and 2. These details are common for
the first and second simulations. The cost and other details for the first simulation
are shown in table 3. The results delivered by the DSS for the various approaches
are shown in tables 4 to 9.
5.1 Demand Fulfillment.
Simple heuristics work on the principle discussed in section 3.3.1. With this
approach, we are able to serve 37 retailers and cater for 71.2 % of total demand.
The delivery to each retailer, the vehicle used and the route are shown in table 4.
The, maximum usage approach works on the principle discussed in 3.3.2. With
this approach, we are able to serve 31 retailers and cater for 69.9 % of total
demand. The delivery to each retailer, the vehicle used and the route are shown in
table 5. The next alternative is the LIFO approach which works on the principle
discussed in section 3.3.3. With this approach, we are able to serve 38 retailers
and cater for 71.5 % of total demand. The delivery to each retailer, the vehicle
used and the route are shown in table 6. The next variant the FIFO approach
works on the principle discussed in section 3.3.4. With this approach, we are able
to serve 37 retailers and cater for 70.3 % of total demand. The delivery to each
retailer, the vehicle used and the route are shown in table 7. The equal priority
approach works on the principle discussed in section 3.3.5 and shows service to
48 retailers by fulfilling 70.2% of total demand (see table 8). The fuzzy approach
as discussed in section 3.3.6 served 41 retailers and catered for 71.9% of total
demand. Lastly, table 9 shows the results for the GA-based approach using the
procedure discussed in section 3.3.7. With this approach 49 retailers are served
representing 72.3% of total demand.
As shown in table 3, total demand is 24741units and possible production is 18000
units with the objective of satisfying the maximum number of retailers. With any
approach, we could serve at most 50 retailers, and the maximum possible demand
fulfillment is 72.7 %. From the above results it is quite clear that traditional
approaches perform relatively poorly. The fuzzy approach shows an improvement
with more retailers served and a higher percentage of total demand fulfilled.
However, best results are obtained with the GA-based approach, which serves the
highest number of retailers and fulfills the highest percentage of total demand.
The parameters adopted for this approach are provided in table 10.
In this study we adopted service, profit and bullwhip as system performance
measures. The results are shown in tables 12, 13 and 14.
5.2 Customer Service.
The objective is to maximize the number of retailers served. From table 12, it is
clear that the maximum deviation of supply and actual demand occurs with the
maximum usage approach, with the minimum deviation for the GA approach. The
service levels and vehicle utilization are also best with the GA-based approach.
However total distance travelled is minimum for the maximum usage approach,
and maximum using the equal priority approach. Volume per mile is best for the
maximum usage approach and poorest with the equal priority model. Thus, with
the GA approach, we were able to achieve high service levels and vehicle
utilization.
5.3 Profit.
Profit is a major performance indicator in any business. The supply chain
manager has to decide how profit can be improved whilst keeping all other factors
constant. The VMI strategy is successful if it delivers reasonable profit to
retailers and suppliers. In this study we have considered stock-out costs incurred
by the manufacturer. Increases in stock-outs may erode profit margins; hence, we
expect minimum stock-outs. From table 13, it is clear that the GA approach helps
to achieve maximum profit and minimum stock-outs. Results from the fuzzy
approach are also positive. However, the worst performance is found with the
maximum usage approach.
5.4 Bullwhip.
VMI represents an effective inventory sharing mechanism which mitigates the
problem of information distortion with minimum investment. The relative
bullwhip effect associated with the various approaches used by the authors is
compared in table 14. Maximum bullwhip is found for the maximum usage
approach, with minimum for the fuzzy and GA approaches. It also shows a
comparison of the patterns of demand fulfillment. This demonstrates that with
simple heuristics, maximum usage, LIFO and FIFO approaches, the manufacturer
can serve 31 to 38 retailers. On the one hand, the positive thing is that these
retailers are served 100% but, on the other hand, the remaining retailers are not
served at all. The pattern of demand fulfillment is slightly improved using the
equal priority and fuzzy approaches. With the equal priority approach 48 retailers
are served but none is fully served. With the fuzzy approach three retailers are
served fully, 38 partially served and nine not served at all. The results are better
using the GA-based approach. It serves 32 retailers fully and 17 partially. This
pattern would likely help with long term customer retention.
5.5 Verifying of results.
The results were corroborated using a second simulation. The cost and service
parameters for the second simulation are shown in table 15, and the results for the
GA-based approach are shown in table 16. From tables 17, 18 and 19, it is clear
that the GA approach performs better on most of the performance measures. In the
second simulation run, the GA approach does not yield the minimum stockout as
in the first run; however, it does give the maximum service levels, vehicle
utilizations, profit and retailers served, as well as the minimum bullwhip. From
the above results, it is observed that minimum distance is achieved using the
maximum usage approach in the first simulation and the equal priority approach
in the second simulation. Volume per mile is best for the equal priority
approaches in both simulation runs. However, for other parameters the GA-based
approach shows better results. Using a multi-criterion analysis of preferences by
means of pairwise actions and criterion comparisons (MAPPAC) we can assign
relative importance to the various performance parameters and identify the
optimum approach for the system. From tables 20, 21, 22 and 23 and from the
results obtained using the MAPPAC analysis, our proposition that the GA-based
approach provides best results is clearly supported.
6 Conclusions
Higher levels of supply chain integration requires better information sharing to
align operational activities (e.g. ordering and payment systems, production and
replenishment planning) between suppliers and customers as well as improved
co-ordination of strategic activities (e.g. relationship building, joint improvement
activities) which create customer–supplier intimacy (Swink et al., 2007). An
information sharing mechanism like VMI fosters coordination among supply
chain members and improves the overall performance of the supply chain
network.
We know genetic algorithm is naturally suited for maximization problem. The
proposed genetic algorithm based model has shown the best results. The model
helped us to incorporate maximum number of retailers as compared to traditional
approaches. It also improved the inventory allotment to retailers in such a way
that maximum production capacity is fully utilized. In this problem single
product, multiple retailers with fixed location were considered. The routes were
formed later according to the cluster formed. Further attempts would try to
develop an algorithm which can consider multiple retailers, multiple products,
without fixed locations. Attempts are also required to form routs considering time
window for replenishment. Many day to day life problems exhibit similar problem
characteristics. Under varying demand, limited production and higher demand
conditions decision support system may prove useful. Never the less, the results of
this study could be utilized by the SMEs to improve the decision making and by
researchers for further analysis.
The study presented in this paper provides an example of where a simulation-
based decision support system was adopted in a VMI supply chain. The supply
chain of a bread manufacturing company was selected to successfully validate and
demonstrate the proposition. The GA-based approach helps to improve profit,
vehicle utilization and service levels as well as reducing the bullwhip effect. The
results show that the GA-based approach outperformed not only the traditional
approaches but also the fuzzy-based approach. The study shows that performance
enhancement can be achieved under the specified circumstances, and that
implementation of simulation-based DSS for VMI decisions can yield positive
results, even in a small enterprise such as the focal company in the current study.
Although, we have adopted a novel approach, further work should focus on
developing alternative optimization techniques which may give improved results
in terms of minimizing the bullwhip effect, minimizing distance, increasing profit
and improving service levels. The work could be extended by adding more
parameters such as travel time, time for pickup and delivery operations at each
point, driver capability, number of retailers and multiple products. Potentially
fruitful future research could also focus on the development of hybrid fuzzy-GA
approaches.
References:
1. Abdelmaguid, T. F., and Dessouky, M.M. 2006. A genetic algorithm
approach to the integrated inventory-distribution problem. International
Journal of Production Research, 44 (21) , 4445–4464
2. Archetti, C., Bertazzi, L., Laporte, G., Speranza, M. G. 2007. A branch-and-cut
algorithm for a vendor-managed inventory-routing problem. Transportation
Science, 41(3), 382-391.
3. Ben-Daya, M. and Al-Nassar, A. 2008. An integrated inventory production
system in a three-layer supply chain. Production Planning & Control, 19 ( 2 ),
97 — 104
4. Bersani, C., Minciardi, R. and Sacile, R. 2010. Economic and Risk Implications
in the Distribution of Petrol Products to Service Stations under Retailer Managed
and Vendor Managed Inventories. International Journal of Sustainable
Transportation, 4(3), 129 — 153
5. Bookbinder, J.H., Gümüş, M. and Jewkes, E.M. 2010.Calculating the benefits of
vendor managed inventory in a manufacturer-retailer system. International
Journal of Production Research, 48(19), 5549 — 5571
6. Borade, A.B. and Bansod, S.V. 2010.An approach for inventory routing under
vendor managed inventory system. International Journal of Services Sciences,
3(4),293–318
7. Campbell, A., Clarke, L. and Savelsbergh, M.W.P. 2002.Inventory routing in
practice’, in P. Toth and D. Vigo (Eds.): The Vehicle Routing Problem (SIAM
Monographs on Discrete Mathematics and Applications), 309–330, Philadelphia,
PA.
8. Chakroborty, P. and Mandal, A. 2005.An asexual genetic algorithm for the
general single vehicle routing problem. Engineering Optimization, 37(1), 1 — 27
9. Chen , L.T and Wei, C.C. 2012. Multi-period channel coordination in vendor-
managed inventory for deteriorating goods. International Journal of Production
Research, 50(16), 4396-4413
10. Choudhary, D., Shankar, R., Dey, P.K., Chaudhary, H., Thakur, L.S. 2014 .
Benefits of retailer-supplier partnership initiatives under time-varying demand: a
comparative analytical study. International Journal of Production Research, Vol
Before print., http://dx.doi.org/10.1080/00207543.2013.879615
11. Choudhary, D., Shankar, R., 2014 a. The value of VMI beyond information
sharing under time varying stochastic demand, International Journal of
Production Research, DOI: 10.1080/00207543.2014.951093
12. Choudhary, D., Shankar,R. 2014 b. The value of VMI beyond information
sharing in a single supplier multiple retailers supply chain under a non-stationary
(Rn, Sn) policy. Omega, DOI: DOI: 10.1016/j.omega.2014.09.004
13. Dong, Y., Dresner, M., Yao, Y., 2014. Beyond information sharing: An empirical
analysis of vendor-managed inventory. Production and Operations Management,
23(5), 817-828
14. Jabali, O. , Van Woensel, T. , de Kok, A. G. , Lecluyse, C. and Peremans, H.
2009. Time-dependent vehicle routing subject to time delay perturbations. IIE
Transactions, 41(12), 1049 — 1066
15. Jung, S., Chang, T.W., Sim, E. and Parl, J. 2005.Vendor managed inventory and
its effect in the supply chain, Asia Sim 2004, LNAI 3398, 545–552.
16. Kannan ,G., Grigore , M. C., Devika, K. and Senthilkumar, A. 2013.An analysis
of the general benefits of a centralised VMI system based on the EOQ model.
International Journal of Production Research, 51 (1), 172-188
17. Kim, J.G. , Kim, J. and Lee, D. 2011 .A case study on period vehicle routing in a
refuse collection system. International Journal of Sustainable Engineering, 4 (3),
215-223
18. Leandro C. C. and Laporte,G. 2014. Optimal joint replenishment, delivery and
inventory management policies for perishable products. Computers & Operations
Research, 47, 42-52
19. Lee, J.H., Moon, I. and Park, J.H. 2010. Multi-level supply chain network design
with routing. International Journal of Production Research, 48( 13), 3957 —
3976
20. Marquès, G., Thierry, C., Lamothe, J. and Gourc, D. 2010. A review of Vendor
Managed Inventory (VMI): from concept to processes. Production Planning &
Control, 21 ( 6) ,547 — 561
21. Nachiappan, S. P. , Gunasekaran, A. and Jawahar, N. 2007.Knowledge
management system for operating parameters in two-echelon VMI supply chains.
International Journal of Production Research, 45 (11),2479 — 2505
22. Prins, C. , Labadi, N. and Reghioui, M.2009. Tour splitting algorithms for vehicle
routing problems. International Journal of Production Research, 47 ( 2) , 507
— 535
23. Salzarulo, P. A., Jacobs, F. R., 2014. The incremental value of central control in
serial supply chains. International Journal of Production Research, 52(7), 1989-
2006
24. Savaşaneril, S. and Erkip, N. 2010. An analysis of manufacturer benefits under
vendor-managed systems. IIE Transactions. Vol. 42 ( 7), 455 — 477
25. Savelsbergh, M.W.P. and Song, J.H. 2007. Inventory routing with continuous
moves. Computers & Operations Research, 34, 1744–1763
26. Song, D.P. and Dinwoodie, J. 2008. Quantifying the effectiveness of VMI and
integrated inventory management in a supply chain with uncertain lead-times and
uncertain demands. Production Planning & Control, Vol. 19( 6) , 590 — 600
27. Tarantilis, C. D. , Kiranoudis, C. T. and Vassiliadis, V. S. 2002. A List Based
Threshold Accepting Algorithm for the Capacitated Vehicle Routing Problem.
International Journal of Computer Mathematics, Vol. 79 (5) , 537 — 553
28. Thangiah, S.R. and Salhi, S. (2001) Genetic clustering: An adaptive heuristic for
the multidepot vehicle routing problem. Applied Artificial Intelligence, 15 ( 4 ) ,
361 — 383
29. ÜSter, H., Keskin, B.B. and Çetinkaya, S. 2008. Integrated warehouse location
and inventory decisions in a three-tier distribution system. IIE Transactions,
40(8), 718 — 732
30. Vigtil, A. 2007. Information exchange in vendor managed inventory.
International Journal of Physical Distribution & Logistics Management, 37 ( 2) ,
131-147
31. Wang, C.X. 2009. Random yield and uncertain demand in decentralised supply
chains under the traditional and VMI arrangements. International Journal of
Production Research , 47 ( 7) , 1955-1968
32. Yugang, Y., Liang, L., & Huang, G. Q. 2006. Leader-follower game in vendor-
managed inventory system with limited production capacity considering
wholesale and retail prices. International Journal of Logistics: Research and
Applications, 9 (4), 335–350
Appendix
1. Flowchart for Simple Heuristics Algorithm
2. Flowchart for Maximum Usage Algorithm
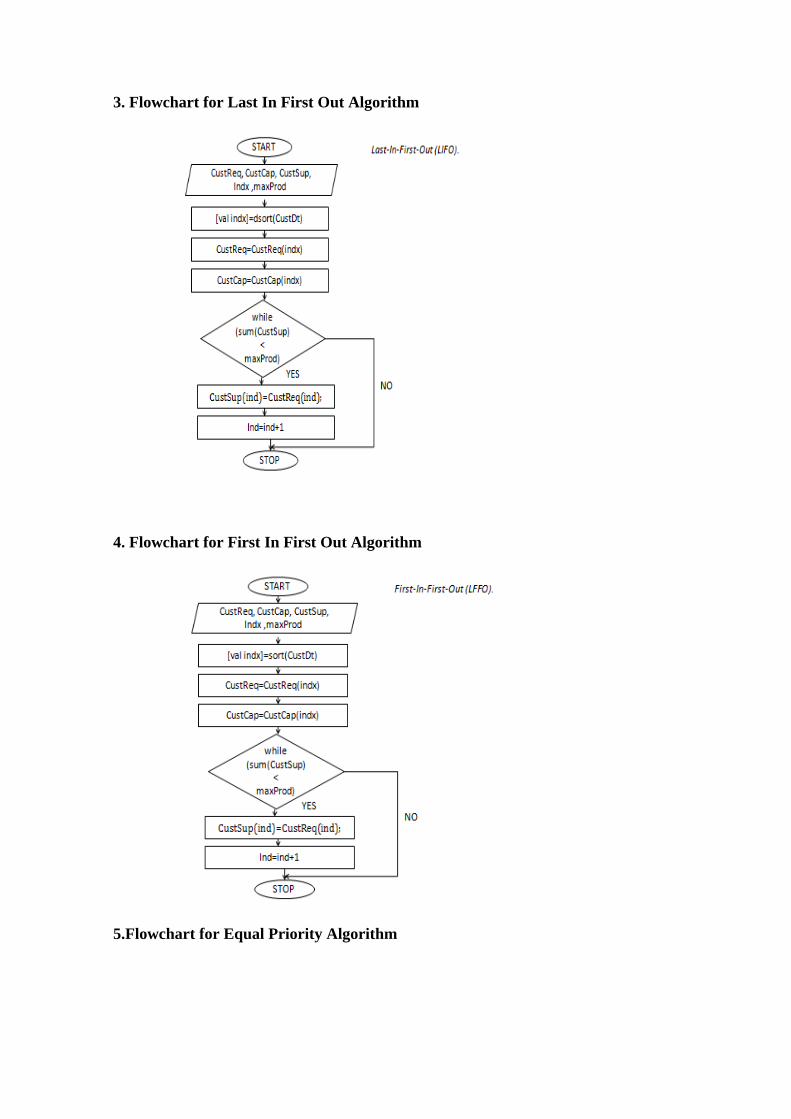
3. Flowchart for Last In First Out Algorithm
4. Flowchart for First In First Out Algorithm
5.Flowchart for Equal Priority Algorithm
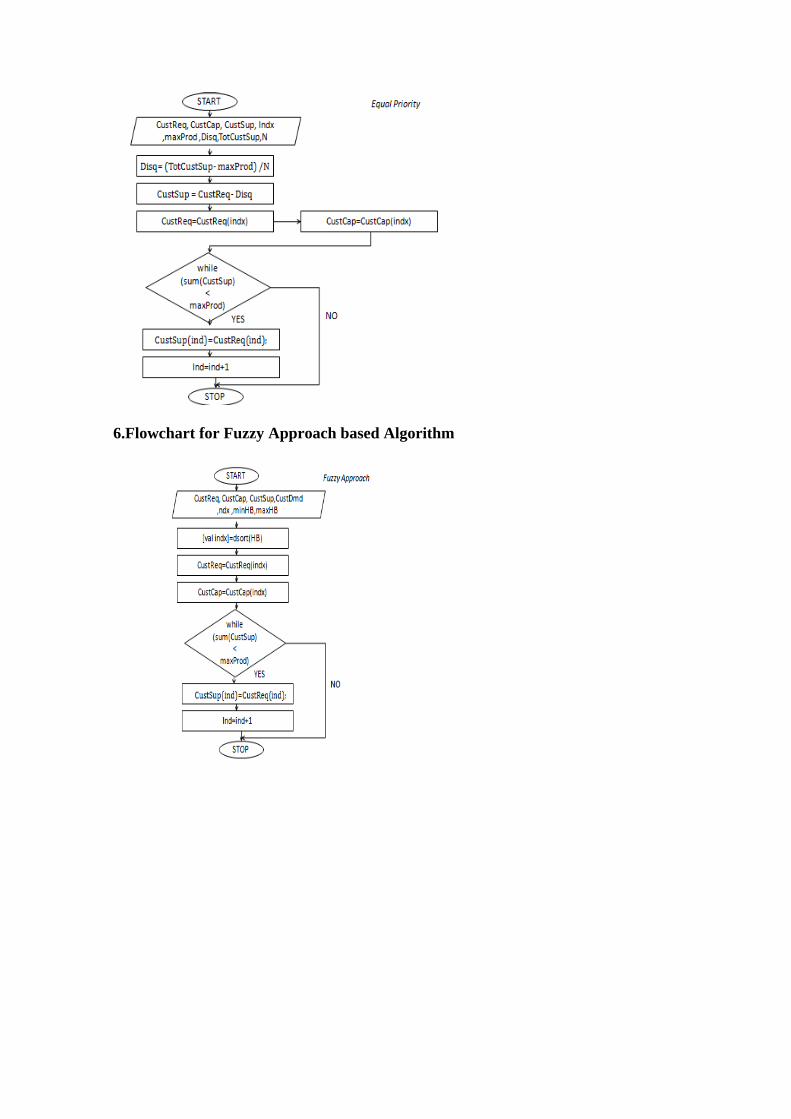
6.Flowchart for Fuzzy Approach based Algorithm
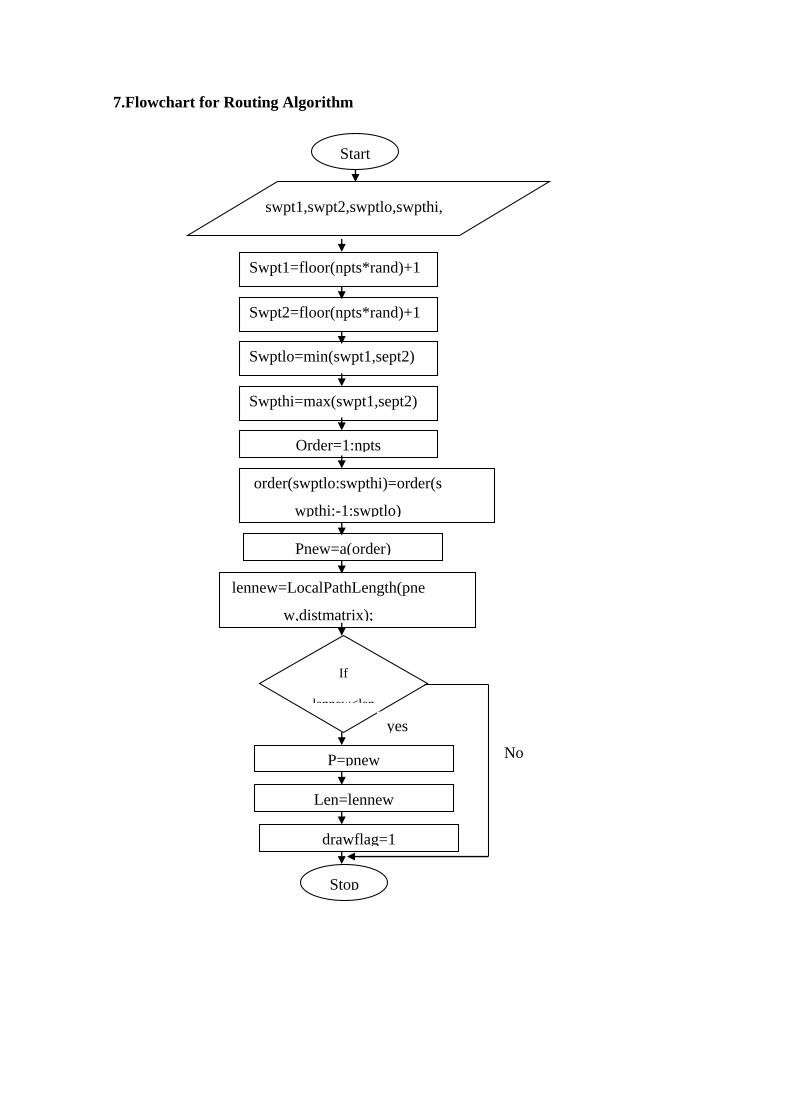
7.Flowchart for Routing Algorithm
Start
swpt1,swpt2,swptlo,swpthi,
Swpt1=floor(npts*rand)+1
Swpt2=floor(npts*rand)+1
Swptlo=min(swpt1,sept2)
Swpthi=max(swpt1,sept2)
Order=1:npts
order(swptlo:swpthi)=order(s
wpthi:-1:swptlo)
Pnew=a(order)
lennew=LocalPathLength(pne
w,distmatrix);
If
lennew<len
P=pnew
Len=lennew
drawflag=1
Stop
yes
No