Embed Size (px)
Citation preview
RESEARCH ARTICLE
Decision Support System to Improve the Effectivenessof Chemical Control Against Cutworms in Sugar Beet
Magdalena Jakubowska1 • Jan Bocianowski2 • Kamila Nowosad3 •
Jolanta Kowalska4
Received: 21 October 2019 / Accepted: 3 March 2020 / Published online: 21 April 2020
� The Author(s) 2020
Abstract The aim of this research was to create an advi-
sory system for commodity services and sugar beet growers
to support their decisions about the use of chemical control
against the cutworms. Consequently, two forecasting
models for determining the chemical control time were
compared: one based on a signaling method and the other
based on average of [effective] temperatures necessary for
caterpillars to achieve the desired L2 stage. The date of first
flights and the total number of pests on plantations were
determined. The usefulness of monitoring cutworm catches
was also compared with systematic observations of sugar
beet fields at the moment when the mass flight of cutworm
moths was identified. The beginning of oviposition,
hatching of the first caterpillars and the caterpillars’ growth
to 10–12 mm was observed, and optimal date of chemical
treatment against cutworms was forecasted. During the
study, the time for insecticidal treatments against cutworms
was determined by the signaling method between the 29th
and the 41st day following the onset of the cutworm moths’
mass flight. The time of treatments was determined phe-
nologically by obtaining the sum of heat which ranged
from 300.7 to 696.4 �C with an average of 523.17 �C and
the sum of effective temperatures which ranged from 120.2
to 260.5 �C with an average of 180.1 �C.
Keywords Cutworms � Monitoring �Integrated pest management �Sums of effective temperatures � Decision support systems
Introduction
Sugar is produced in over 100 countries worldwide. In
most years, over 70% of world sugar production is con-
sumed domestically which allowed the development of a
large export market. However, a significant share of this
trade takes place under bilateral long-term agreements or
on preferential terms. The main producers of sugar beet in
the European Union are France, Germany, Poland, UK and
Czech Republic (Rezbova et al. 2014). In 2018, sugar beet
yields were lower in nearly all countries of the EU-28 than
1 year previously. The dry summer of 2018 had a relatively
large impact on arable crop yields in the Netherlands. In
nearly all 28 EU countries, sugar beet yields per hectare
were down in 2018. The average yield across the EU
amounted to 69.1 thousand kg per hectare. Spain was the
EU country with the highest yield. On average, almost 87
tonnes of sugar beets were harvested per hectare there last
year. With 76.4 tonnes per hectare, the Netherlands per-
formed better than most countries in Europe, although the
yield was 18% down relative to 2017. In 2018, the total
sugar beet harvest in the EU amounted to nearly 120 billion
kg, over 23 billion kg. The largest producer in Europe is
France with 39.6 billion kg. The Netherlands ranks fifth
with a production of 6.5 billion kg; Spanish arable farmers
harvested 3 billion kg of sugar beets. Polish and German
& Magdalena Jakubowska
1 Department of Monitoring and Signalling of Agrophages,
Institute of Plant Protection – National Research Institute,
Poznan, Poland
2 Department of Mathematical and Statistical Methods, Poznan
University of Life Sciences, Poznan, Poland
3 Department of Genetics, Plant Breeding and Seed Production,
Wrocław University of Environmental and Life Sciences,
Wrocław, Poland
4 Department of Biological Methods and Ecological
Agricultural, Institute of Plant Protection – National Research
Institute, Poznan, Poland
123
Sugar Tech (Sept-Oct 2020) 22(5):911–922
https://doi.org/10.1007/s12355-020-00808-z
arable farmers achieved the lowest results compared to
other European countries: 50.7 and 63.3 thousand kg per
hectare, respectively. In 2018, sugar beets were cultivated
on 1.73 million hectares of land in the EU-28. With an area
of 490 thousand hectares, France also had the largest cul-
tivation area for sugar beets. Last year, France contributed
28% of the total EU crop production area. The second-
largest producer was Germany with 414 thousand hectares.
Both countries occupied more than half of the sugar beet
production area in the EU, while the Netherlands con-
tributed 5% (Eurostat 2018).
Sugar beet is attacked by many pests which may cause
direct injury or may introduce virus diseases to the plant,
causing severe economic loss. In most parts of the world
virus diseases and nematodes appear to be the principal
problem, and generally speaking, the same pests and dis-
eases occur wherever sugar beet is grown, although the
predominant ones of Europe and neighboring countries
differ from those in America. Cutworms, or surface
caterpillars, are the larvae of various noctuid moths (e.g.,
Agrotis spp.), Euxoa spp. and Xestia c – nigrum (L.) in
central and northern Europe and the USA, Peridroma
saucia (Hubner), Crymodes devastator (Brace) and Feltia
ducens (Walker) in the USA; several species are known to
damage sugar beet, usually feeding on stem bases or
crowns. Larvae of many other moths (e.g., Hydraecia
micacea, Loxastega sticticalis (L.), Scrobipalpa ocellatella
Boyd, Spodoptera spp. and Pseudaletia unipunctata (Ha-
worth) can also cause damage to foliage or crowns of beet
plants very brief accounts are given of some of the most
important species (Camprag 1973; Cooke and Scott 1995;
Draycott 2006; Perveen et al. 2018). Scrobipalpa ocel-
latella is shown to be growing problem in sugar beet
production in neighboring countries (Serbia) as well as in
some years in Croatia and Hungary (Camprag 1973).
Does it seem necessary to monitor sugar factories? In
this article, the authors will try to answer the question by
referring to their research on sugar beets.
Widespread use of chemical pesticides has made it
easier to control pests, and thus to improve the quality of
the crop. However, excessive, and not always justified, use
of chemicals causes numerous adverse environmental
changes, including the most important ones: pressure on
the environment that results in limiting the biodiversity and
increasingly frequent resistance of pests to chemicals that
are meant to control them. New or improved solutions
would make it possible to develop pest control methods at
an appropriate level, while maintaining production prof-
itability and limiting adverse effects of pesticides. As a
result of these recommendations, it is currently obligatory
in Poland to use plant protection products in accordance
with integrated plant protection (IPP) principles. Integrated
plant protection (IPP) involves proper monitoring of the
occurrence and population size of pests. In order to be the
most efficient, it must be conducted on each crop and in all
locations. Monitoring of harmful organisms is carried out
for purposes of signaling crop protection treatments (Ol-
szak 1999; Walczak 1999; Dabrowski 2007). Signaling of
threats to crops from pests for agricultural plant protection
has been limited to only a few studies and phytophagous
species (Walczak et al. 2010; Jakubowska et al. 2012).
When determining the optimal time for controlling agro-
phages, appropriate monitoring of them must be carried out
(Walczak 1999). Such monitoring involves systematic
observation of pests in order to determine the severity of
the disease or its stage of development as well as the
population size of the pests or the percentage of affected
plants. When the threshold of economic harmfulness is
exceeded, a decision must be made concerning pesticide
treatment (Matyjaszczyk et al. 2010; Walczak et al. 2010).
Therefore, it is very important to develop, modernize and
improve methods of monitoring crop pests. This informa-
tion needs to be published as instructions, methodologies
and guides (Walczak 2010). The occurrence of pests and
their stages of development can be observed on specific
sugar beet fields at different times, not only across the
country but also across a province, county or locality.
Monitoring small areas and even specific plantations for
harmful organisms for short-term forecasting is often
underestimated by manufacturers or consultants, but it is of
great importance in the integrated plant protection system.
A study on soil pests is a good example in support of this
hypothesis. Research on the assessment of the practical
application of methods and techniques used in monitoring
cutworms has resulted from numerous reports on the
growing population size of these pests on plantations in
recent years by manufacturers, farmers as well as plant and
seed protection inspectors (Jakubowska and Walczak
2007, 2008, 2009). IPM methods to control soil pests,
especially the cutworm, are being researched. Determina-
tion of the optimum treatment date by systematic inspec-
tion of the fields is an important element of restricting the
damage caused by cutworms on the crops with a concurrent
elimination of excessive and unnecessary use of plant
protection products (Garnis and Dabrowski 2008).
The cultivation of sugar beet in Poland is of great eco-
nomic importance, resulting from sugar production for
domestic needs and exports. This plant leaves a very good
position for follow-up plants. This is mainly due to the use
of organic fertilization usually used for root crops. The
decline in livestock after 1989 caused that manure pro-
duction decreased and the use of catch crops, straw and
sugar beet leaves as organic mass. The use of beet leaves in
this way changed in the twenty-first century—they are
more often used for green manure than for fodder (silage).
The introduction of a sugar beet by-product to the soil
912 Sugar Tech (Sept-Oct 2020) 22(5):911–922
123
allows limiting the use of mineral fertilizers (Wacławowicz
2013). The economic significance of sugar beet is evi-
denced by the area of its cultivation and root crop. The area
of sugar beet cultivation in Poland in 2018 was 240 thous.
ha., and the yield of sugar beet roots in 2019 was about
60.0 thousand kg per hectare in Poland. Root harvest
reached 14.6 million tons. The average technological sugar
yield was about 9 tons per ha (GUS 2019).
In Poland, many species of cutworms affect sugar beets
every year, including numerous Agrotis segetum Den. et
Schiff. and A. exclamationis L. (Jakubowska and Walczak
2009). These species belong to the family of owlet moths
(Noctuidae), popularly known as cutworms. Owlet moths
are soil pests causing considerable damage to many crops,
including plantations of root crops, vegetables, cereals and
ornamental plants in nurseries (Małachowska 1987). The
both species produce one generation in Poland. However, it
is possible for the Turnip moth to have an incomplete
second generation. Even in years with a very warm vege-
tative period, only specimens of pupae and larvae of a
second generation of Heart and dart moths have been
found. The annual quantity and quality changes in specific
seasons result from differences in the biotic cycles of the
species (Jakubowska and Ławinski 2011; Jakubowska and
Bocianowski 2013). Caterpillars are the harmful stage.
Their control is very difficult due to their hidden mode of
life. Successful reduction in their harmfulness depends
largely on the accurate determination of the best time of
chemical control. For this reason, the aim of this research
was to determine the relationship between the rate of
development and the air temperature and humidity in order
to determine the optimum time for pest control. Cutworms
are harmful primarily due to their large population size,
which is heavily influenced by weather conditions and the
extended time of incubation and development of voracious
caterpillars. Cold winters, warm and dry springs and
summers, and then dry autumns are particularly favorable
for cutworms (Walczak and Jakubowska 2001; Beres
2011).
This research was carried out with the counseling
Department of the Pfeifer & Langen Polska sugar mills. Its
aim was to evaluate the use of monitoring results of the
Turnip moth and the Heart and dart moth for short-term
forecasting according to integrated plant protection
principles.
Materials and Methods
The study was conducted from 2009 to 2015 by the Insti-
tute of Plant Protection—National Research Institute (IOR-
PIB) (Department of Forecasting Methods for Pests and
Plant Protection Economics) and Pfeifer & Langen Polska
S.A., on 13 selected sugar beet plantations in Wielkopolska
and Lower Silesia. The mean size of the plantations on
which the monitoring of cutworm was conducted ranged
from three to five hectares. Altogether, throughout the
entire study period (2009–2015), the Turnip moth (A.
segetum) and Heart and dart moth (A. exclamationis) were
monitored in 28 localities (see Table 1). One light trap was
mounted in each monitored location. Observations on
catches of moths of the pest were carried out 1–2 times a
week, from the end of April to the end July. The sugar
beets were at growth stage BBCH 12–30. Adult cutworm
moths were caught using light traps—one light trap on each
sugar beet plantation (Jakubowska 2009; Jakubowska and
Ławinski 2011; Jakubowska et al. 2012; Jakubowska and
Bocianowski 2013a, b). The light traps had a glow tube
(250 W mercury lamp Mix) supplied from an AC source.
Moths were caught in light traps at night, from dusk until
early morning (a time clock regulated the operation of the
light traps from 9:00 pm to 6:00 am the next morning).
Moths removed from the light traps were systematically
segregated and marked. Then they were identified and
separated according to species. Quantitative analysis was
performed. Analysis of the studied moth family was done,
and a quality-quantitative structure of Noctuidae ‘‘com-
munities’’ was determined. These structures were com-
pared in the different types of agricultural landscapes
(Fibiger and Hacker 1991).
In the years of research (2009–2015), sugar beet sowing
fell on average in mid-April. Depending on meteorological
conditions, the earliest beets hay April 8 (2010), and the
latest April 18 (2013). The cast was from 85,000 up to 95
thousand per hectare, with an average sowing standard of
1.25 seed units per hectare of seed obtained in the case of
sowing density every 18 cm and row distribution 45 cm.
Throughout the moth catching period, from May to late
September, the temperature and relative humidity of the air
were recorded using data from field meteorological stations
owned by the Experimental Field Station of the Institute of
Plant Protection—National Research Institute (Winna
Gora), the Research Centre for Cultivar Testing
(COBORU) (Turew, Szelejewo, Leszno, Koscielna Wies)
and GlaxoSmithKline (GSK-Poznan).
From these observations, the date of the moths’ first
flights and the total number of pests on plantations were
determined. The usefulness of monitoring cutworm catches
was also compared with the systematic control observa-
tions of the plantation from the moment of the moths’ mass
flight.
Observations were made of the beginning of egg laying,
the hatching of the first caterpillars and the caterpillars’
growth to 10–12 mm to determine the optimal date of
chemical treatment. The date of pest control treatment was
based on the moths’ flight (Zacha 1966) and
Sugar Tech (Sept-Oct 2020) 22(5):911–922 913
123
simultaneously on the sum of the heat and the sum of
effective temperatures, which have a highly significant
impact on the length of cutworm development until the
desired developmental stage—L2 (Jakubowska 2009). For
short-term forecasting in the 4-year period of study under
controlled and field conditions, the sum of heat was
501.1 �C and the sum of effective temperatures was
230.0 �C for the examined period of the cutworm devel-
opment (Jakubowska 2009). The results of these studies
were used to establish the optimal date of chemical control
against cutworms by phenological criterion. It uses the
calculated sum of the heat and the sum of effective tem-
peratures of the harmful stages. The date of the treatment
was determined phenologically by adding the average day
temperatures (a minimum of 30 days) from the day
following the initial moth mass flight (for each of the
localities analyzed). Observed sugar beet plants were in the
BBCH phase 31–35.
The monitoring results, i.e., population sizes of the
Turnip moth and the Heart and dart moth, were analyzed
statistically. Firstly, the normality of the traits was tested
using Shapiro–Wilk’s normality test (Shapiro and Wilk
1965). Two-way analysis of variance (ANOVA) was per-
formed to verify hypothesis that years and months as well
as years 9 months interaction do not affect the population
size of the Turnip moth and the Heart and dart moth. One-
way analysis of variance (one-way ANOVA) was used to
verify a hypothesis about the lack of effect of location on
the population size of the Turnip moth and the Heart and
dart moth. The significance of differences in the occurrence
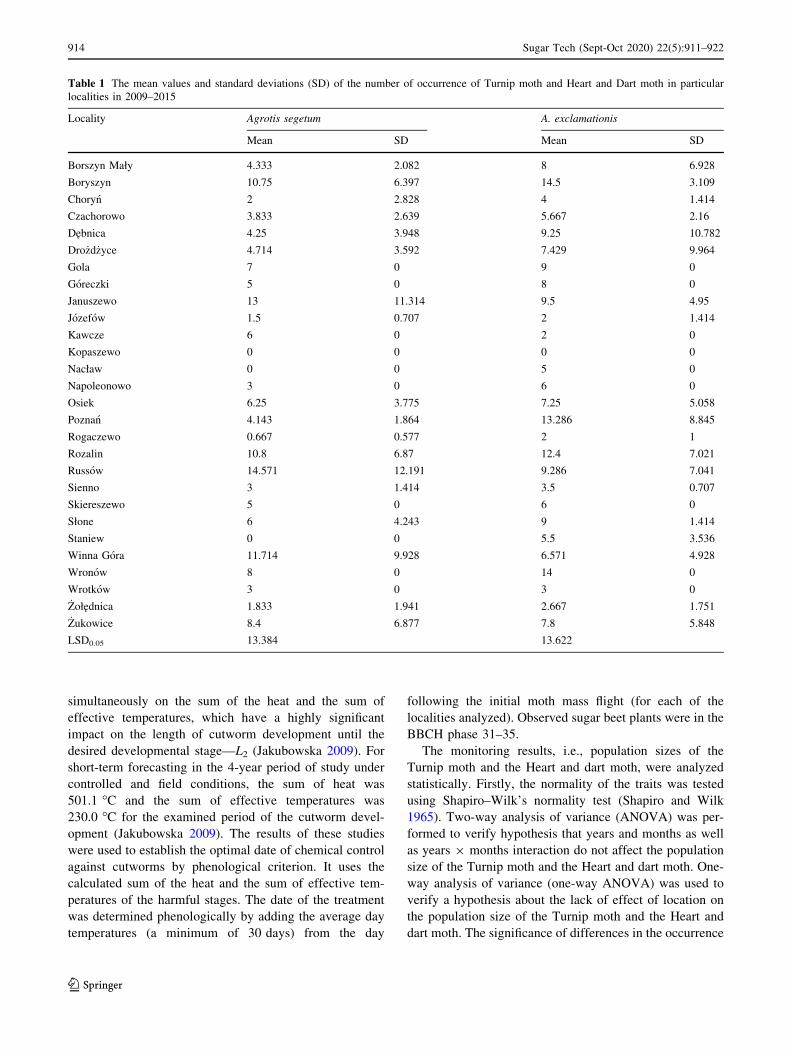
Table 1 The mean values and standard deviations (SD) of the number of occurrence of Turnip moth and Heart and Dart moth in particular
localities in 2009–2015
Locality Agrotis segetum A. exclamationis
Mean SD Mean SD
Borszyn Mały 4.333 2.082 8 6.928
Boryszyn 10.75 6.397 14.5 3.109
Choryn 2 2.828 4 1.414
Czachorowo 3.833 2.639 5.667 2.16
Debnica 4.25 3.948 9.25 10.782
Dro _zd _zyce 4.714 3.592 7.429 9.964
Gola 7 0 9 0
Goreczki 5 0 8 0
Januszewo 13 11.314 9.5 4.95
Jozefow 1.5 0.707 2 1.414
Kawcze 6 0 2 0
Kopaszewo 0 0 0 0
Nacław 0 0 5 0
Napoleonowo 3 0 6 0
Osiek 6.25 3.775 7.25 5.058
Poznan 4.143 1.864 13.286 8.845
Rogaczewo 0.667 0.577 2 1
Rozalin 10.8 6.87 12.4 7.021
Russow 14.571 12.191 9.286 7.041
Sienno 3 1.414 3.5 0.707
Skiereszewo 5 0 6 0
Słone 6 4.243 9 1.414
Staniew 0 0 5.5 3.536
Winna Gora 11.714 9.928 6.571 4.928
Wronow 8 0 14 0
Wrotkow 3 0 3 0
_Zołednica 1.833 1.941 2.667 1.751
_Zukowice 8.4 6.877 7.8 5.848
LSD0.05 13.384 13.622
914 Sugar Tech (Sept-Oct 2020) 22(5):911–922
123
of the Turnip moth and the Heart and dart moth in the
provinces of Lower Silesia and Wielkopolska was tested by
the Student’s t test. A simple linear regression model was
used to analyze the impact of the sum of the heat and the
sum of effective temperatures on the population size of the
Turnip moth and the Heart and dart moth. The relationship
between the population size of A. segetum and A. excla-
mationis moths was evaluated using the Pearson product-
moment correlation coefficient (Kozak et al. 2010). All
calculations for statistical analyses were performed using
the GenStat 17 statistical package.
Results
In 2013 the first Turnip moths were caught at the end of the
second half of May, i.e., on 19 May in Słone, then on 23
May in Winna Gora, on 24 May in Poznan and on 30 May
in Boryszyn Mały. The last flight of the Turnip moth was
observed in Debnica on 19 June (Table 2).
The other species—the Heart and dart moth—was
caught the earliest, on 23 and 24 May in Winna Gora and
Poznan. Throughout the growing season, when the moths
were caught, the catches of adult insects of both species
were most numerous in Winna Gora, Rozalin, Poznan and
Dro _zd _zyce. Mass oviposition was observed in late May and
early June and lasted until the end of June. The initial L1
stage of caterpillars was observed on plantations in mid-
June. At the end of the month, due to meteorological
conditions that were favorable for pest development, dif-
ferent developmental stages of the cutworm caterpillars
from L2 to L3 were reported on the monitored plantations.
The average forecast date for chemical control of the cut-
worm in 2013 for the monitored localities fell on the 30th
day (between 19 and 41 days).
Monitoring of the plantation and the use of chemical
control were used to observe the beginning of egg laying
by the cutworm. On average in 2014, it was observed on:
June 10 th, and the first hatching of young caterpillars—18
to 22 June. The mean temperature for June and July was
18.7 �C, which was not favorable for the development of
caterpillars. On several monitored plantations, there were
no stage L2 caterpillars. Also, there were no harmful pests
exceeding the economic threshold; therefore, it was not
necessary to use chemical control on all monitored objects.
Furthermore, six field observations were made after plan-
tations had been monitored in order to verify the prediction
date of chemical control against cutworm.
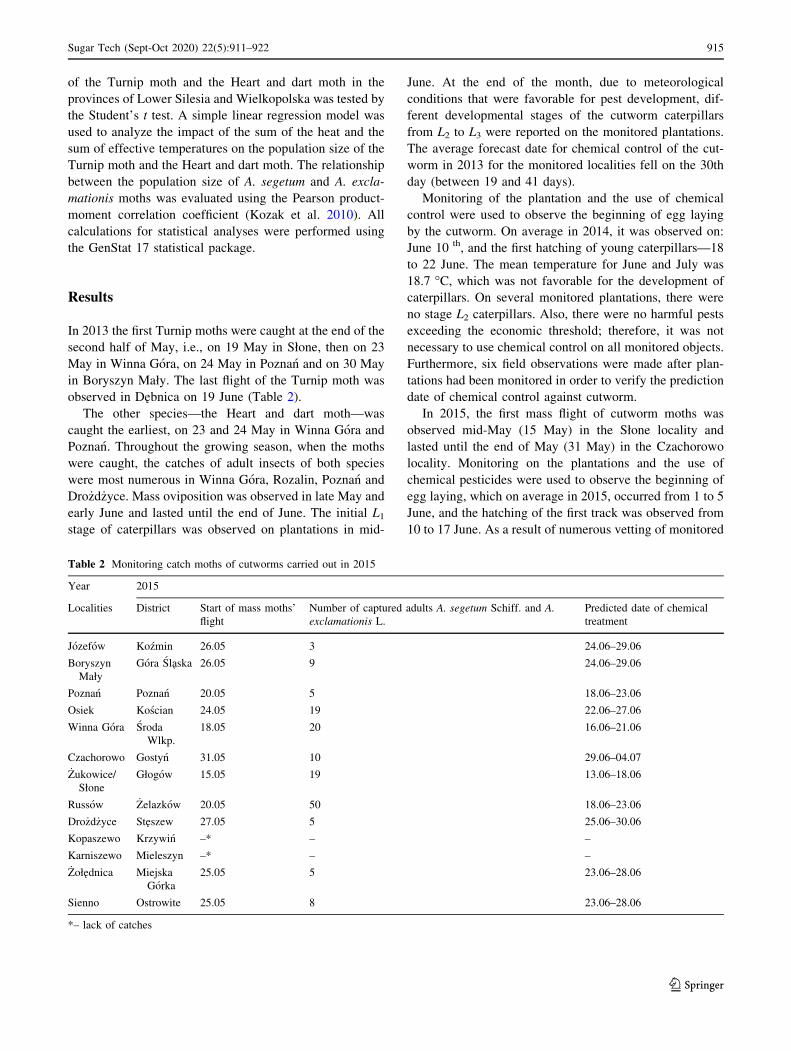
In 2015, the first mass flight of cutworm moths was
observed mid-May (15 May) in the Słone locality and
lasted until the end of May (31 May) in the Czachorowo
locality. Monitoring on the plantations and the use of
chemical pesticides were used to observe the beginning of
egg laying, which on average in 2015, occurred from 1 to 5
June, and the hatching of the first track was observed from
10 to 17 June. As a result of numerous vetting of monitored
Table 2 Monitoring catch moths of cutworms carried out in 2015
Year 2015
Localities District Start of mass moths’
flight
Number of captured adults A. segetum Schiff. and A.
exclamationis L.
Predicted date of chemical
treatment
Jozefow Kozmin 26.05 3 24.06–29.06
Boryszyn
Mały
Gora Slaska 26.05 9 24.06–29.06
Poznan Poznan 20.05 5 18.06–23.06
Osiek Koscian 24.05 19 22.06–27.06
Winna Gora Sroda
Wlkp.
18.05 20 16.06–21.06
Czachorowo Gostyn 31.05 10 29.06–04.07
_Zukowice/
Słone
Głogow 15.05 19 13.06–18.06
Russow _Zelazkow 20.05 50 18.06–23.06
Dro _zd _zyce Steszew 27.05 5 25.06–30.06
Kopaszewo Krzywin –* – –
Karniszewo Mieleszyn –* – –
_Zołednica Miejska
Gorka
25.05 5 23.06–28.06
Sienno Ostrowite 25.05 8 23.06–28.06
*– lack of catches
Sugar Tech (Sept-Oct 2020) 22(5):911–922 915
123
plantations caterpillars grew to be 10–12 mm long (desired
for control). Control treatments, depending on weather
conditions and monitored fields, were made in late June
(18, 24 or 30 June). The average forecast date for the
chemical control of the cutworm in 2015 for the monitored
localities fell on the 31st day (29th–35th day).
All studied traits had a normal distribution. In 2013,
using the signaling method, the date of the chemical
treatment was set for 28 June, 8 and 15 July, i.e., between
the 27th and 41st day following the initial date of the mass
flight of cutworm moths. The average sum of heat that was
recorded for the locality of Słone (642.1 �C), Winna Gora
(608.13 �C) and Poznan (619.2 �C) was 623.1 �C (the
insecticide treatment was performed on 28 June). Due to
technical reasons, in Boryszyn Mały (700.4 �C), Cza-
chorowo (639.0 �C), Rozalin (643.8 �C), Dro _zd _zyce
(694.3 �C), Kawcze (430.2 �C), Osiek (539.7 �C) and
Russow (635.1 �C) the crops were sprayed on 8 July. The
average sum of heat was 611.8 �C. In the other localities,
the treatment was applied on 15 July when the heat sum
amounted to 569.2 �C in Rogaczewo, Debnica and
Wrotkow.
For comparison, in 2015, protective signaling was per-
formed on 13 and 18 June and 24 and 29 June, i.e., between
30 and 34 days after the initial mass flight of adult moths.
The sum of heat recorded for each monitored field ranged
from 470.65 �C (Boryszyn Mały and Jozefow) to 622.4 �C(Dro _zd _zyce). The average sum of heat that was recorded in
the monitored fields, which were subject to monitoring,
performed in the 13–18 June was 485.15 �C. In other
places was performed between 24 and 29 June the sum of
heat averaged 501.1 �C.
In general, there were no statistically significant differ-
ences between the localities in the incidence of the A.
segetum (F29;59 = 1.44; P = 0.116) and the A. exclama-
tionis (F29;59 = 1.04; P = 0.439). The Turnip moth occur-
red in far greater numbers in Lower Silesia than in
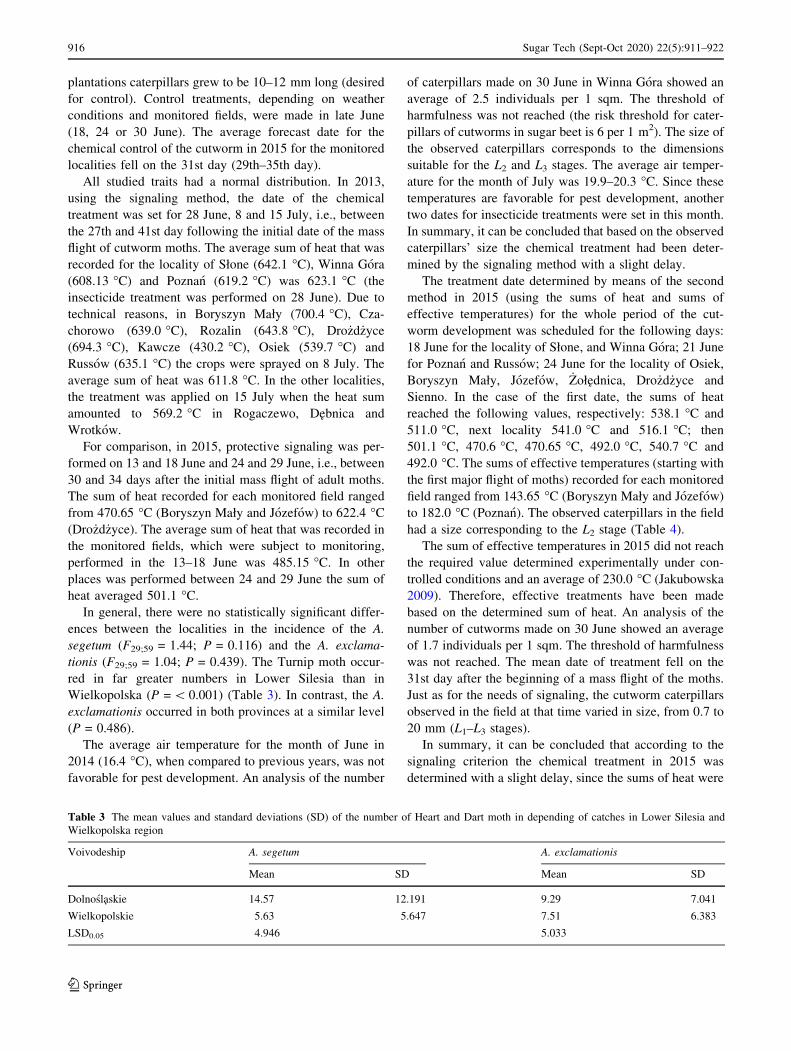
Wielkopolska (P =\ 0.001) (Table 3). In contrast, the A.
exclamationis occurred in both provinces at a similar level
(P = 0.486).
The average air temperature for the month of June in
2014 (16.4 �C), when compared to previous years, was not
favorable for pest development. An analysis of the number
of caterpillars made on 30 June in Winna Gora showed an
average of 2.5 individuals per 1 sqm. The threshold of
harmfulness was not reached (the risk threshold for cater-
pillars of cutworms in sugar beet is 6 per 1 m2). The size of
the observed caterpillars corresponds to the dimensions
suitable for the L2 and L3 stages. The average air temper-
ature for the month of July was 19.9–20.3 �C. Since these
temperatures are favorable for pest development, another
two dates for insecticide treatments were set in this month.
In summary, it can be concluded that based on the observed
caterpillars’ size the chemical treatment had been deter-
mined by the signaling method with a slight delay.
The treatment date determined by means of the second
method in 2015 (using the sums of heat and sums of
effective temperatures) for the whole period of the cut-
worm development was scheduled for the following days:
18 June for the locality of Słone, and Winna Gora; 21 June
for Poznan and Russow; 24 June for the locality of Osiek,
Boryszyn Mały, Jozefow, _Zołednica, Dro _zd _zyce and
Sienno. In the case of the first date, the sums of heat
reached the following values, respectively: 538.1 �C and
511.0 �C, next locality 541.0 �C and 516.1 �C; then
501.1 �C, 470.6 �C, 470.65 �C, 492.0 �C, 540.7 �C and
492.0 �C. The sums of effective temperatures (starting with
the first major flight of moths) recorded for each monitored
field ranged from 143.65 �C (Boryszyn Mały and Jozefow)
to 182.0 �C (Poznan). The observed caterpillars in the field
had a size corresponding to the L2 stage (Table 4).
The sum of effective temperatures in 2015 did not reach
the required value determined experimentally under con-
trolled conditions and an average of 230.0 �C (Jakubowska
2009). Therefore, effective treatments have been made
based on the determined sum of heat. An analysis of the
number of cutworms made on 30 June showed an average
of 1.7 individuals per 1 sqm. The threshold of harmfulness
was not reached. The mean date of treatment fell on the
31st day after the beginning of a mass flight of the moths.
Just as for the needs of signaling, the cutworm caterpillars
observed in the field at that time varied in size, from 0.7 to
20 mm (L1–L3 stages).
In summary, it can be concluded that according to the
signaling criterion the chemical treatment in 2015 was
determined with a slight delay, since the sums of heat were
Table 3 The mean values and standard deviations (SD) of the number of Heart and Dart moth in depending of catches in Lower Silesia and
Wielkopolska region
Voivodeship A. segetum A. exclamationis
Mean SD Mean SD
Dolnoslaskie 14.57 12.191 9.29 7.041
Wielkopolskie 5.63 5.647 7.51 6.383
LSD0.05 4.946 5.033
916 Sugar Tech (Sept-Oct 2020) 22(5):911–922
123
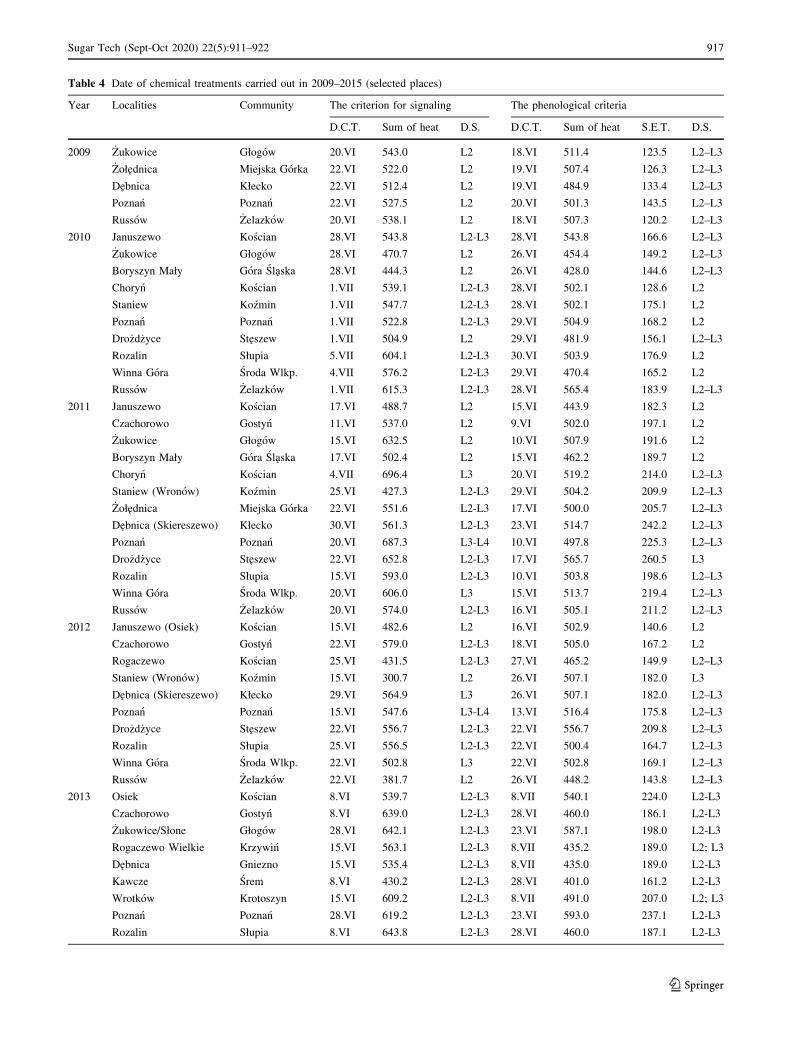
Table 4 Date of chemical treatments carried out in 2009–2015 (selected places)
Year Localities Community The criterion for signaling The phenological criteria
D.C.T. Sum of heat D.S. D.C.T. Sum of heat S.E.T. D.S.
2009 _Zukowice Głogow 20.VI 543.0 L2 18.VI 511.4 123.5 L2–L3
_Zołednica Miejska Gorka 22.VI 522.0 L2 19.VI 507.4 126.3 L2–L3
Debnica Kłecko 22.VI 512.4 L2 19.VI 484.9 133.4 L2–L3
Poznan Poznan 22.VI 527.5 L2 20.VI 501.3 143.5 L2–L3
Russow _Zelazkow 20.VI 538.1 L2 18.VI 507.3 120.2 L2–L3
2010 Januszewo Koscian 28.VI 543.8 L2-L3 28.VI 543.8 166.6 L2–L3
_Zukowice Głogow 28.VI 470.7 L2 26.VI 454.4 149.2 L2–L3
Boryszyn Mały Gora Slaska 28.VI 444.3 L2 26.VI 428.0 144.6 L2–L3
Choryn Koscian 1.VII 539.1 L2-L3 28.VI 502.1 128.6 L2
Staniew Kozmin 1.VII 547.7 L2-L3 28.VI 502.1 175.1 L2
Poznan Poznan 1.VII 522.8 L2-L3 29.VI 504.9 168.2 L2
Dro _zd _zyce Steszew 1.VII 504.9 L2 29.VI 481.9 156.1 L2–L3
Rozalin Słupia 5.VII 604.1 L2-L3 30.VI 503.9 176.9 L2
Winna Gora Sroda Wlkp. 4.VII 576.2 L2-L3 29.VI 470.4 165.2 L2
Russow _Zelazkow 1.VII 615.3 L2-L3 28.VI 565.4 183.9 L2–L3
2011 Januszewo Koscian 17.VI 488.7 L2 15.VI 443.9 182.3 L2
Czachorowo Gostyn 11.VI 537.0 L2 9.VI 502.0 197.1 L2
_Zukowice Głogow 15.VI 632.5 L2 10.VI 507.9 191.6 L2
Boryszyn Mały Gora Slaska 17.VI 502.4 L2 15.VI 462.2 189.7 L2
Choryn Koscian 4.VII 696.4 L3 20.VI 519.2 214.0 L2–L3
Staniew (Wronow) Kozmin 25.VI 427.3 L2-L3 29.VI 504.2 209.9 L2–L3
_Zołednica Miejska Gorka 22.VI 551.6 L2-L3 17.VI 500.0 205.7 L2–L3
Debnica (Skiereszewo) Kłecko 30.VI 561.3 L2-L3 23.VI 514.7 242.2 L2–L3
Poznan Poznan 20.VI 687.3 L3-L4 10.VI 497.8 225.3 L2–L3
Dro _zd _zyce Steszew 22.VI 652.8 L2-L3 17.VI 565.7 260.5 L3
Rozalin Słupia 15.VI 593.0 L2-L3 10.VI 503.8 198.6 L2–L3
Winna Gora Sroda Wlkp. 20.VI 606.0 L3 15.VI 513.7 219.4 L2–L3
Russow _Zelazkow 20.VI 574.0 L2-L3 16.VI 505.1 211.2 L2–L3
2012 Januszewo (Osiek) Koscian 15.VI 482.6 L2 16.VI 502.9 140.6 L2
Czachorowo Gostyn 22.VI 579.0 L2-L3 18.VI 505.0 167.2 L2
Rogaczewo Koscian 25.VI 431.5 L2-L3 27.VI 465.2 149.9 L2–L3
Staniew (Wronow) Kozmin 15.VI 300.7 L2 26.VI 507.1 182.0 L3
Debnica (Skiereszewo) Kłecko 29.VI 564.9 L3 26.VI 507.1 182.0 L2–L3
Poznan Poznan 15.VI 547.6 L3-L4 13.VI 516.4 175.8 L2–L3
Dro _zd _zyce Steszew 22.VI 556.7 L2-L3 22.VI 556.7 209.8 L2–L3
Rozalin Słupia 25.VI 556.5 L2-L3 22.VI 500.4 164.7 L2–L3
Winna Gora Sroda Wlkp. 22.VI 502.8 L3 22.VI 502.8 169.1 L2–L3
Russow _Zelazkow 22.VI 381.7 L2 26.VI 448.2 143.8 L2–L3
2013 Osiek Koscian 8.VI 539.7 L2-L3 8.VII 540.1 224.0 L2-L3
Czachorowo Gostyn 8.VI 639.0 L2-L3 28.VI 460.0 186.1 L2-L3
_Zukowice/Słone Głogow 28.VI 642.1 L2-L3 23.VI 587.1 198.0 L2-L3
Rogaczewo Wielkie Krzywin 15.VI 563.1 L2-L3 8.VII 435.2 189.0 L2; L3
Debnica Gniezno 15.VI 535.4 L2-L3 8.VII 435.0 189.0 L2-L3
Kawcze Srem 8.VI 430.2 L2-L3 28.VI 401.0 161.2 L2-L3
Wrotkow Krotoszyn 15.VI 609.2 L2-L3 8.VII 491.0 207.0 L2; L3
Poznan Poznan 28.VI 619.2 L2-L3 23.VI 593.0 237.1 L2-L3
Rozalin Słupia 8.VI 643.8 L2-L3 28.VI 460.0 187.1 L2-L3
Sugar Tech (Sept-Oct 2020) 22(5):911–922 917
123
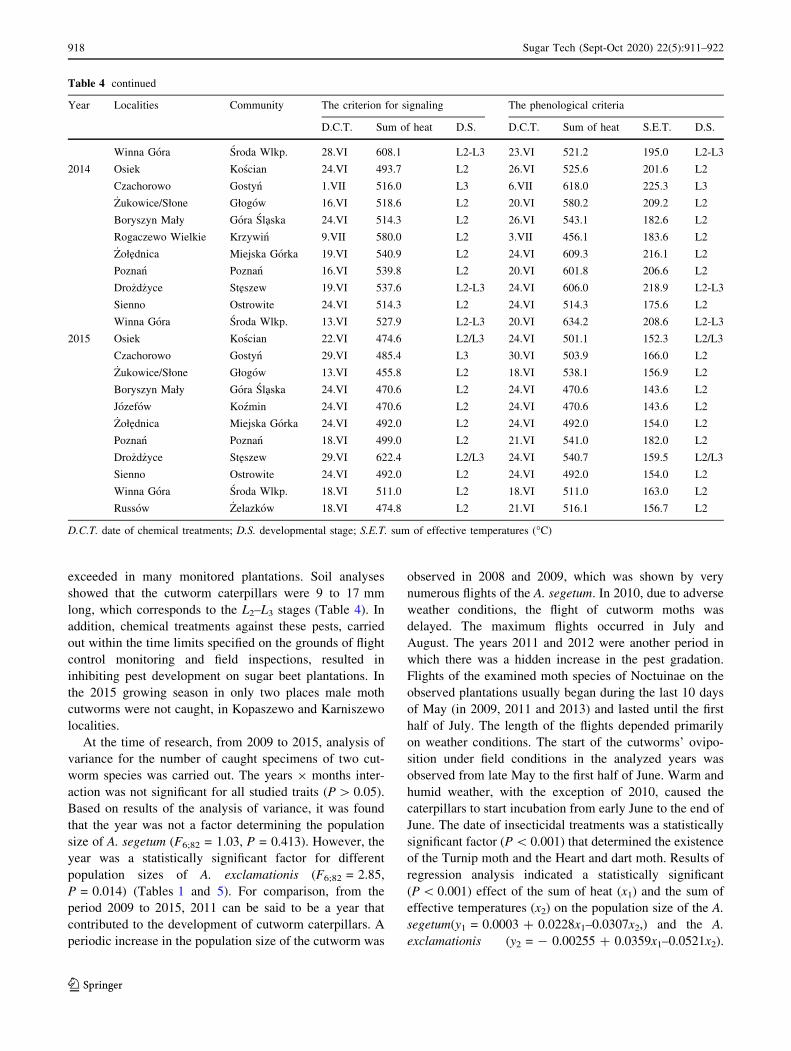
exceeded in many monitored plantations. Soil analyses
showed that the cutworm caterpillars were 9 to 17 mm
long, which corresponds to the L2–L3 stages (Table 4). In
addition, chemical treatments against these pests, carried
out within the time limits specified on the grounds of flight
control monitoring and field inspections, resulted in
inhibiting pest development on sugar beet plantations. In
the 2015 growing season in only two places male moth
cutworms were not caught, in Kopaszewo and Karniszewo
localities.
At the time of research, from 2009 to 2015, analysis of
variance for the number of caught specimens of two cut-
worm species was carried out. The years 9 months inter-
action was not significant for all studied traits (P[ 0.05).
Based on results of the analysis of variance, it was found
that the year was not a factor determining the population
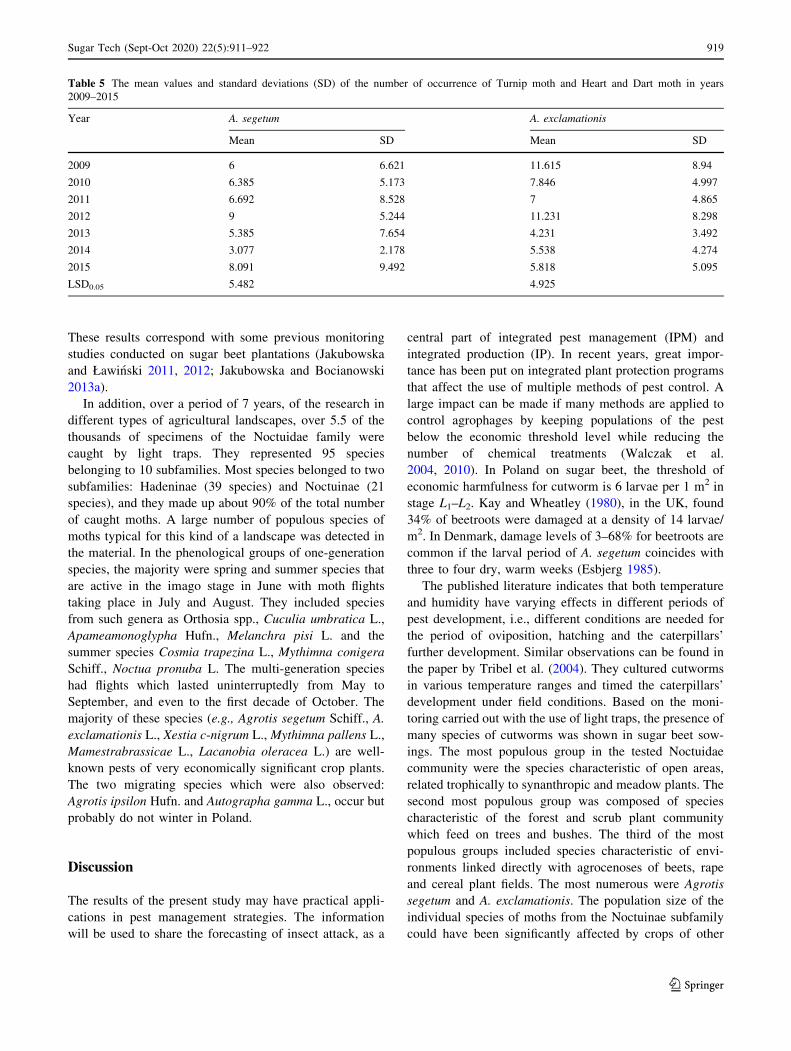
size of A. segetum (F6;82 = 1.03, P = 0.413). However, the
year was a statistically significant factor for different
population sizes of A. exclamationis (F6;82 = 2.85,
P = 0.014) (Tables 1 and 5). For comparison, from the
period 2009 to 2015, 2011 can be said to be a year that
contributed to the development of cutworm caterpillars. A
periodic increase in the population size of the cutworm was
observed in 2008 and 2009, which was shown by very
numerous flights of the A. segetum. In 2010, due to adverse
weather conditions, the flight of cutworm moths was
delayed. The maximum flights occurred in July and
August. The years 2011 and 2012 were another period in
which there was a hidden increase in the pest gradation.
Flights of the examined moth species of Noctuinae on the
observed plantations usually began during the last 10 days
of May (in 2009, 2011 and 2013) and lasted until the first
half of July. The length of the flights depended primarily
on weather conditions. The start of the cutworms’ ovipo-
sition under field conditions in the analyzed years was
observed from late May to the first half of June. Warm and
humid weather, with the exception of 2010, caused the
caterpillars to start incubation from early June to the end of
June. The date of insecticidal treatments was a statistically
significant factor (P\ 0.001) that determined the existence
of the Turnip moth and the Heart and dart moth. Results of
regression analysis indicated a statistically significant
(P\ 0.001) effect of the sum of heat (x1) and the sum of
effective temperatures (x2) on the population size of the A.
segetum(y1 = 0.0003 ? 0.0228x1–0.0307x2,) and the A.
exclamationis (y2 = - 0.00255 ? 0.0359x1–0.0521x2).
Table 4 continued
Year Localities Community The criterion for signaling The phenological criteria
D.C.T. Sum of heat D.S. D.C.T. Sum of heat S.E.T. D.S.
Winna Gora Sroda Wlkp. 28.VI 608.1 L2-L3 23.VI 521.2 195.0 L2-L3
2014 Osiek Koscian 24.VI 493.7 L2 26.VI 525.6 201.6 L2
Czachorowo Gostyn 1.VII 516.0 L3 6.VII 618.0 225.3 L3
_Zukowice/Słone Głogow 16.VI 518.6 L2 20.VI 580.2 209.2 L2
Boryszyn Mały Gora Slaska 24.VI 514.3 L2 26.VI 543.1 182.6 L2
Rogaczewo Wielkie Krzywin 9.VII 580.0 L2 3.VII 456.1 183.6 L2
_Zołednica Miejska Gorka 19.VI 540.9 L2 24.VI 609.3 216.1 L2
Poznan Poznan 16.VI 539.8 L2 20.VI 601.8 206.6 L2
Dro _zd _zyce Steszew 19.VI 537.6 L2-L3 24.VI 606.0 218.9 L2-L3
Sienno Ostrowite 24.VI 514.3 L2 24.VI 514.3 175.6 L2
Winna Gora Sroda Wlkp. 13.VI 527.9 L2-L3 20.VI 634.2 208.6 L2-L3
2015 Osiek Koscian 22.VI 474.6 L2/L3 24.VI 501.1 152.3 L2/L3
Czachorowo Gostyn 29.VI 485.4 L3 30.VI 503.9 166.0 L2
_Zukowice/Słone Głogow 13.VI 455.8 L2 18.VI 538.1 156.9 L2
Boryszyn Mały Gora Slaska 24.VI 470.6 L2 24.VI 470.6 143.6 L2
Jozefow Kozmin 24.VI 470.6 L2 24.VI 470.6 143.6 L2
_Zołednica Miejska Gorka 24.VI 492.0 L2 24.VI 492.0 154.0 L2
Poznan Poznan 18.VI 499.0 L2 21.VI 541.0 182.0 L2
Dro _zd _zyce Steszew 29.VI 622.4 L2/L3 24.VI 540.7 159.5 L2/L3
Sienno Ostrowite 24.VI 492.0 L2 24.VI 492.0 154.0 L2
Winna Gora Sroda Wlkp. 18.VI 511.0 L2 18.VI 511.0 163.0 L2
Russow _Zelazkow 18.VI 474.8 L2 21.VI 516.1 156.7 L2
D.C.T. date of chemical treatments; D.S. developmental stage; S.E.T. sum of effective temperatures (�C)
918 Sugar Tech (Sept-Oct 2020) 22(5):911–922
123
These results correspond with some previous monitoring
studies conducted on sugar beet plantations (Jakubowska
and Ławinski 2011, 2012; Jakubowska and Bocianowski
2013a).
In addition, over a period of 7 years, of the research in
different types of agricultural landscapes, over 5.5 of the
thousands of specimens of the Noctuidae family were
caught by light traps. They represented 95 species
belonging to 10 subfamilies. Most species belonged to two
subfamilies: Hadeninae (39 species) and Noctuinae (21
species), and they made up about 90% of the total number
of caught moths. A large number of populous species of
moths typical for this kind of a landscape was detected in
the material. In the phenological groups of one-generation
species, the majority were spring and summer species that
are active in the imago stage in June with moth flights
taking place in July and August. They included species
from such genera as Orthosia spp., Cuculia umbratica L.,
Apameamonoglypha Hufn., Melanchra pisi L. and the
summer species Cosmia trapezina L., Mythimna conigera
Schiff., Noctua pronuba L. The multi-generation species
had flights which lasted uninterruptedly from May to
September, and even to the first decade of October. The
majority of these species (e.g., Agrotis segetum Schiff., A.
exclamationis L., Xestia c-nigrum L., Mythimna pallens L.,
Mamestrabrassicae L., Lacanobia oleracea L.) are well-
known pests of very economically significant crop plants.
The two migrating species which were also observed:
Agrotis ipsilon Hufn. and Autographa gamma L., occur but
probably do not winter in Poland.
Discussion
The results of the present study may have practical appli-
cations in pest management strategies. The information
will be used to share the forecasting of insect attack, as a
central part of integrated pest management (IPM) and
integrated production (IP). In recent years, great impor-
tance has been put on integrated plant protection programs
that affect the use of multiple methods of pest control. A
large impact can be made if many methods are applied to
control agrophages by keeping populations of the pest
below the economic threshold level while reducing the
number of chemical treatments (Walczak et al.
2004, 2010). In Poland on sugar beet, the threshold of
economic harmfulness for cutworm is 6 larvae per 1 m2 in
stage L1–L2. Kay and Wheatley (1980), in the UK, found
34% of beetroots were damaged at a density of 14 larvae/
m2. In Denmark, damage levels of 3–68% for beetroots are
common if the larval period of A. segetum coincides with
three to four dry, warm weeks (Esbjerg 1985).
The published literature indicates that both temperature
and humidity have varying effects in different periods of
pest development, i.e., different conditions are needed for
the period of oviposition, hatching and the caterpillars’
further development. Similar observations can be found in
the paper by Tribel et al. (2004). They cultured cutworms
in various temperature ranges and timed the caterpillars’
development under field conditions. Based on the moni-
toring carried out with the use of light traps, the presence of
many species of cutworms was shown in sugar beet sow-
ings. The most populous group in the tested Noctuidae
community were the species characteristic of open areas,
related trophically to synanthropic and meadow plants. The
second most populous group was composed of species
characteristic of the forest and scrub plant community
which feed on trees and bushes. The third of the most
populous groups included species characteristic of envi-
ronments linked directly with agrocenoses of beets, rape
and cereal plant fields. The most numerous were Agrotis
segetum and A. exclamationis. The population size of the
individual species of moths from the Noctuinae subfamily
could have been significantly affected by crops of other
Table 5 The mean values and standard deviations (SD) of the number of occurrence of Turnip moth and Heart and Dart moth in years
2009–2015
Year A. segetum A. exclamationis
Mean SD Mean SD
2009 6 6.621 11.615 8.94
2010 6.385 5.173 7.846 4.997
2011 6.692 8.528 7 4.865
2012 9 5.244 11.231 8.298
2013 5.385 7.654 4.231 3.492
2014 3.077 2.178 5.538 4.274
2015 8.091 9.492 5.818 5.095
LSD0.05 5.482 4.925
Sugar Tech (Sept-Oct 2020) 22(5):911–922 919
123
host plants surrounding the monitored sugar beet planta-
tions. This issue has also been confirmed by other authors
dealing with cutworms (Walczak and Jakubowska 2001;
Garnis and Dabrowski 2008; Beres 2011; Jakubowska and
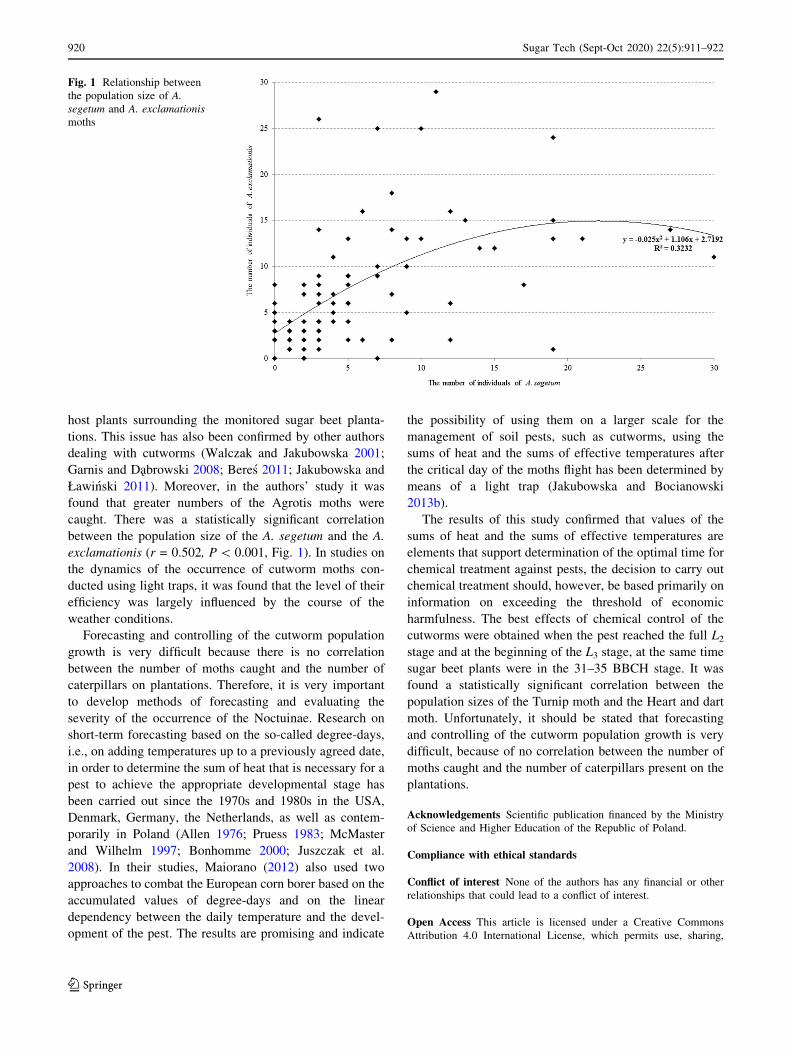
Ławinski 2011). Moreover, in the authors’ study it was
found that greater numbers of the Agrotis moths were
caught. There was a statistically significant correlation
between the population size of the A. segetum and the A.
exclamationis (r = 0.502, P\ 0.001, Fig. 1). In studies on
the dynamics of the occurrence of cutworm moths con-
ducted using light traps, it was found that the level of their
efficiency was largely influenced by the course of the
weather conditions.
Forecasting and controlling of the cutworm population
growth is very difficult because there is no correlation
between the number of moths caught and the number of
caterpillars on plantations. Therefore, it is very important
to develop methods of forecasting and evaluating the
severity of the occurrence of the Noctuinae. Research on
short-term forecasting based on the so-called degree-days,
i.e., on adding temperatures up to a previously agreed date,
in order to determine the sum of heat that is necessary for a
pest to achieve the appropriate developmental stage has
been carried out since the 1970s and 1980s in the USA,
Denmark, Germany, the Netherlands, as well as contem-
porarily in Poland (Allen 1976; Pruess 1983; McMaster
and Wilhelm 1997; Bonhomme 2000; Juszczak et al.
2008). In their studies, Maiorano (2012) also used two
approaches to combat the European corn borer based on the
accumulated values of degree-days and on the linear
dependency between the daily temperature and the devel-
opment of the pest. The results are promising and indicate
the possibility of using them on a larger scale for the
management of soil pests, such as cutworms, using the
sums of heat and the sums of effective temperatures after
the critical day of the moths flight has been determined by
means of a light trap (Jakubowska and Bocianowski
2013b).
The results of this study confirmed that values of the
sums of heat and the sums of effective temperatures are
elements that support determination of the optimal time for
chemical treatment against pests, the decision to carry out
chemical treatment should, however, be based primarily on
information on exceeding the threshold of economic
harmfulness. The best effects of chemical control of the
cutworms were obtained when the pest reached the full L2
stage and at the beginning of the L3 stage, at the same time
sugar beet plants were in the 31–35 BBCH stage. It was
found a statistically significant correlation between the
population sizes of the Turnip moth and the Heart and dart
moth. Unfortunately, it should be stated that forecasting
and controlling of the cutworm population growth is very
difficult, because of no correlation between the number of
moths caught and the number of caterpillars present on the
plantations.
Acknowledgements Scientific publication financed by the Ministry
of Science and Higher Education of the Republic of Poland.
Compliance with ethical standards
Conflict of interest None of the authors has any financial or other
relationships that could lead to a conflict of interest.
Open Access This article is licensed under a Creative Commons
Attribution 4.0 International License, which permits use, sharing,
Fig. 1 Relationship between
the population size of A.
segetum and A. exclamationis
moths
920 Sugar Tech (Sept-Oct 2020) 22(5):911–922
123
adaptation, distribution and reproduction in any medium or format, as
long as you give appropriate credit to the original author(s) and the
source, provide a link to the Creative Commons licence, and indicate
if changes were made. The images or other third party material in this
article are included in the article’s Creative Commons licence, unless
indicated otherwise in a credit line to the material. If material is not
included in the article’s Creative Commons licence and your intended
use is not permitted by statutory regulation or exceeds the permitted
use, you will need to obtain permission directly from the copyright
holder. To view a copy of this licence, visit
http://creativecommons.org/licenses/by/4.0/.
References
Allen, J.C. 1976. A modified sine wale method for calculating degree
days. Environmental Entomology 5: 388–396.
Beres, P. 2011. Occurrence and harmfulness of cutworms (Agrotinae)
on maize (Zea mays L.) in south-east Poland in 2004–2010.
Progress in Plant Protection 51(2): 593–598.
Bonhomme, R. 2000. Bases and limits to using ‘degree-day’ units.
European Journal of Agronomy 13: 1–10.
Camprag, D. 1973. Stetocine secerne repe u Jugoslaviji, Madarskoj,
Rumuniji i Bugarskoj sa posebnim osvrtom na vaznije stetne
vrste. Forum, Novi Sad 363(16): 343–352.
Cooke, D.A., and J.E. Scott. 1995. The sugar beet crop technology
and engineering, 456. London: Chapman & Hall.
https://doi.org/10.1007/978-94-009-0373-9.
Dabrowski, Z. T. 2007. Forecasting methods, signaling and monitor-
ing the occurrence of pests and thresholds of risk and economic
harmful. In Integrated production of plants. The selected Issues
(Editor J. Podlesny). IUNG Puławy, 33–41.
Draycott D. P. 2006. Sugar beet. Blackwell Publishing Ltd, 1–465.
ISBN: 10: 1-4051-1911-x.
Esbjerg, P. 1985. Cutworms (Agrotis segetum)—forecasting and
damages in 1983 and 1984. Second Danish plant protection
conference, 249–260.
Eurostat. 2018. Crop production, yield, sugar beet. http://apsso.
eurostat.ec.europa.eu/niu/show.do?query=BOOKMARK.
Fibiger, M., and H. Hacker. 1991. Systematic list of the Noctuidae of
Europe. Esperiance 2: 1–109.
Garnis, J., and Z.T. Dabrowski. 2008. Practical evaluation of methods
and techniques used in monitoring cutworm (Agrotis segetum
L.). Progress in Plant Protection 48(2): 836–840.
Głowny Urzad Statystyczny. 2019. Wynikowy szacunek głownych
ziemiopłodow rolnych i ogrodniczych w 2019 roku.
https://stat.gov.pl/obszary-tematyczne/rolnictwo-lesnictwo/
uprawy-rolne-i-ogrodnicze/wynikowy-szacunek-glownych-
ziemioplodow-rolnych-i-ogrodniczych-w-2019-roku,5,18.html.
Jakubowska, M. 2009. Improving the forecasting of short-term
chemical protection of sugar beet against Agrotis segetum (Den.
et Schiff.) and Agrotis exclamationis (L.) (Lepidoptera: Noctu-
inae). PhD thesis, Institute of Plant Protection—National
Research Institute. Poznan, 176.
Jakubowska, M., and J. Bocianowski. 2013a. Ocena wykorzystania
wynikow monitoringu rolnicy zbo _zowki (Agrotis segetum Den.
et Schiff.) na plantacjach buraka cukrowego w latach 2009-2012.
Progress in Plant Protection 53(4): 683–690.
Jakubowska, M., and J. Bocianowski. 2013b. The effectiveness of
catching cutworm (Lepidoptera: Noctuidae: Noctuinae)
(= Agrotinae) in pheromone traps and light traps, for short-term
forecasting. Journal of Plant Protection 53(3): 215–221.
Jakubowska, M., and H. Ławinski. 2011. The usefulness of the results
of monitoring cutworm (Agrotis sp.) on the plantations of sugar
beet for the protection of plants. Progress in Plant Protection
51(2): 570–576.
Jakubowska, M., H. Ławinski, and A. Bandyk. 2012. Monitoring
rolnic (Noctuinae) jako element integrowanej ochrony buraka
cukrowego. Progress in Plant Protection 52(2): 229–234.
Jakubowska, M., and F. Walczak. 2007. Determination of optimum
timing for chemical control of cutworms using light traps and
pheromone traps. Progress in Plant Protection 47(1): 238–243.
Jakubowska, M., and F. Walczak. 2008. Influence of temperature and
relative humidity on chosen development stages of Agrotis
segetum Den. et Schiff. for requirements of short-term forecast-
ing. Progress in Plant Protection 48(3): 859–863.
Jakubowska, M., and F. Walczak. 2009. Current problems of sugar
beet plants against Turnip moth and Heart and Dart moth.
Progress in Plant Protection 49(1): 116–121.
Juszczak, R., J. Lesny, and J. Olejnik. 2008. Suma temperatur
efektywnych jako element prognozy agrometeorologicznej
Wielkopolskiego Internetowego Serwisu Informacji Agromete-
orologicznej. Acta Agrophysica 12(3): 409–426.
Kay R. H., and G. A. Wheatley. 1980. Some observations on the
biology of the turnip moth (Agrotis segetum) relevant to its
control with insecticides. British Crop Protection Council:
Proceedings of the 1979 British Crop Protection Conference—
Pests and diseases (10th British Insecticide and Fungicide
Conference) 19 th to 22 nd, November 1979, vol. 1,2 and 3
British Crop Protection Council Craydon, Surrey UK, 215–222.
Kozak, M., J. Bocianowski, S. Sawkojc, and A. Wnuk. 2010. Call for
more graphical elements in statistical teaching and consultancy.
Biometrical Letters 47(1): 57–68.
Maiorano, A. 2012. A physiologically based approach for degree-day
calculation in pest phenology models: the case of the European
Corn Borer (Ostrinia nubilalis Hbn.) in Northern Italy. Interna-
tional Journal of Biometeorology 56: 653–659.
Małachowska, D. 1987. Metody sygnalizacji terminu zwalczania
rolnicy zbo _zowki w Polsce. Gazeta Cukrownicza 2: 41–42.
Matyjaszczyk, E., A. Tratwal, and F. Walczak. 2010. Wybrane
Zagadnienia Ochrony Roslin w Rolnictwie Ekologicznym i
Integrowanej Ochronie Roslin. Inst. Ochr. Roslin—PIB. Poznan,
103.
McMaster, G.S., and W.W. Wilhelm. 1997. Growing degree-days:
one equation, two interpretations. Agricultural and Forest
Meteorology 87: 291–300.
Olszak, R.W. 1999. Monitoring jako zasada racjonalnej ochrony
roslin sadowniczych. Progress in Plant Protection 39(1):
298–304.
Perveen, F. K. ed. 2018. Moths. Pests of potato, maize and sugar
beet. ISBN 978-1-78984-704-8. http://dx.doi.org/10.5772/
intechopen.73423.
Pruess, K.P. 1983. Day-degree methods for pest management.
Environmental Entomology 12: 613–619.
Rezbova, H., L. Smutka, J. Pulkrabek, and I. Benesova. 2014.
European sugar factories, sugar companies and their alliances:
Who is in control of European sugar market? Listy cukrovar-
nicke a reparske 130(11): 365.
Shapiro, S.S., and M.B. Wilk. 1965. An analysis of variance test for
normality (complete samples). Biometrika 52: 591–611.
Tribel, S. O., W. P. Fedorenko, and O. M. Lapa. 2004. Sowki.
Najposzireni v Ukraini Vidy. Kii. Kolobig, 77.
Wacławowicz, P. 2013. Siedliskowe i produkcyjne skutki polowego
zagospodarowania lisci buraka cukrowego. Wydawnictwo Uni-
wersytetu Przyrodniczego we Wrocławiu. ISBN 978-83-7717-
142-4.
Walczak, F. 1999. Znaczenie monitoringu agrofagow roslin upraw-
nych dla ochrony roslin. Progress in Plant Protection 39(1):
284–288.
Sugar Tech (Sept-Oct 2020) 22(5):911–922 921
123
Walczak, F. 2010. Monitoring agrofagow dla potrzeb integrowanej
ochrony roslin uprawnych. Fragmenta Agronomica 27(4):
147–154.
Walczak, F., and M. Jakubowska. 2001. Wzrost szkodliwosci rolnic
(Agrotinae) w Polsce. Progress in Plant Protection 41(2):
386–390.
Walczak, F., A. Tratwal, and T. Krasinski. 2010. Kierunki rozwoju
prognozowania i sygnalizacji agrofagow w ochronie roslin
rolniczych. Progress in Plant Protection 50(1): 81–86.
Walczak, F., M. Jakubowska, and H. Banaszak. 2004. Rolnice—
gospodarczo wa _zne szkodniki roslin uprawnych w Polsce.
Progress in Plant Protection 44(2): 486–495.
Zacha, J.M. 1966. Prognoza a Signalizace u Ochrane Rastnin, 10.
Praha: Stani.
Publisher’s Note Springer Nature remains neutral with regard to
jurisdictional claims in published maps and institutional affiliations.
922 Sugar Tech (Sept-Oct 2020) 22(5):911–922
123