Embed Size (px)
Citation preview

2
Declaration:
I do not have a compelling reason against the use of this school work within the intention of §60
of the Act No. 121/2000 Coll., on Copyright and Rights Related to Copyright and on Amendment
to Certain Acts (Copyright Act).
Hereby I declare that I have elaborated this thesis independently under the supervision of my
supervisor, using information sources listed in the bibliography in accordance with Ethical
guidelines for writing the master's theses.
In Prague ___________________ Name _____________

3
Acknowledgement:
I would like to highlight my gratitude to my supervisor doc. Ing. Zdenek Lokaj, Ph.D. for his
invaluable help, useful comments, good practice share and engagement through the learning
process of this master thesis. Also, I would like to thank my family and friends for their support
during my study.
In Prague ____________________ Name ______________

4
NÁZEV:
Pre/On-trip optimalizace tras nákladních vozidel v city logistice
AUTOR:
Bc. Tetiana Nadutenko
KATEDRA (ÚSTAV):
Ústav dopravní telematiky, K620
VEDOUCÍ PRÁCE:
doc. Ing. Zdenek Lokaj, Ph.D.
Abstrakt:
Hlavním cílem dané diplomové práce je vypracovat doporučení pro zlepšení logistických
procesů skladové a dopravní logistiky JSC "Khlibodar" na základě hluboké analýzy a identifikaci
hlavních problémů a nevýhod podniku. Je navržená realizace RS.TMS ASTOR spolu s
posouzením navrhovaného řešení. Byli také vytvořeny příklady výkonnostní schopnosti RS.
TMS ASTOR v případě plánování a řízení trasy.
Klíčová slova:
Doprava, logistika, management, systém, implementace, analýza, JSC "Khabardar", dodávka,
zákazník, náklady, rozvoj, výpočet, společnost, průměr, příklad, cesta, plánování, bod.

5
TITLE:
Optimization of Trucks Pre/On-trip Route Planning in City Logistics
AUTHOR:
Bc. Tetiana Nadutenko
DEPARTMENT:
Department of Transport Telematics, K620
SUPERVISOR:
doc. Ing. Zdenek Lokaj, Ph.D.
Abstract:
The main aim of the master thesis is to develop recommendations on improving logistics
processes in the warehouse logistics and transportations logistics of JSC “Khlibodar” based on
the deep analysis and identification of main problems and disadvantages of the enterprise. It this
work, it was proposed to implement RS.TMS ASTOR as well as it was performed the
assessment of the proposed solution. The exemplification of the RS. TMS ASTOR performance
capabilities in case of route planning and management was created.
Keywords:
Transport, logistics, management, system, implementation, analysis, JSC “Khlibodar”, delivery,
customer, cost, develop, calculation, company, average, example, route, planning, point.

6
List of abbreviations
Abbreviation Definition
JSC Joint Stock Company
HoReCa Hotel, Restaurant, Cafe/Catering
RS Routing System
TMS Transportation Management System
WMS Warehouse Management System
CIS Commonwealth of Independent States
JIT Just-In-Time
B2C Business-to-Consumer
B2B Business-to-Business
GPS Global Positioning System
7
Content
List of abbreviations……………………………………………………………………………………..6
Content……………………………………………………………………………………………..…….7
1. Introduction…………..………………………………………………………………………………8
2. Theoretical Part…………………………………………..……...…………..…………………….11
2.1. Concept, goals, tasks, and the significance of logistics for modern
company………...………………………………………………………………………..………….....11
2.2. Trends, problems and prospects of transport and warehouse logistics development…….19
3. Practical Part………….……………………………………………………………………………..27
3.1. Business model and the logistics of the JSC "Khlibodar"…………………………………….27
3.2. Complex analysis of the JSC "Khlibodar" logistics system, its effectiveness…….……......36
3.3. Optimization of transportation logistics and assessment of the proposed measures
effectiveness…………………………………………………………………………………………...48
3.4. RS. TMS ASTOR performance capabilities exemplification in case of route planning and
management………………………………………………………………………………………......59
3.5. Implementation of an automated transport logistics and management system…….….....69
4. Conclusion………………………………………………………………………………..…….…..75
Bibliography……………………………………………………………………………………….......77
List of figures……………………………………………………………………………...………......79
List of tables…………………………………………………………………………….……………..81

8
1. Introduction
The relevance of research topic. A typical phenomenon in the modern economy are frequent
changes in customer demand, which has a huge impact on the manufacturer, which supplies its
products to different geographical regions. Providing transportation needs, rental storage space,
constant monitoring of material flow and delivery of products "just-in-time" are typical operations
in the logistics business, the implementation of which is now much more complicated than ever
before.
Currently, there is a fundamental change in case of transport and warehouse logistics roles and
importance in the functioning of a modern company. The arising logistics processes of the
facilities inventory flows at the enterprises turn into an effective tool for the formation of
competitive advantage and increase business performance as a whole. At the same time,
alignment of an efficient logistics system is of particular role in the company.
In my case, JSC "Khlibodar" company is taken for the diploma research. The company strives to
strength its logistics processes at the bakery business market in Ukraine. Thus, the main activity
of JSC “Khlibodar” takes place at the bread market in Zaporizhia, Dnipropetrovsk regions,
where, it is based on the maintenance of a wide range of consumers, which is necessary to
provide a diverse range of fresh bakery products in the shortest possible time - with a view of the
critical requirements for fresh bread products. The company is big player at the mentioned
market and it’s number of customers growing but the transport logistics activities are very poor
and manually based, therefore, it leads to the crash in the delivery processes and customers
satisfaction. Consequently, the company needs dramatic change in the logistics area and this is
possible with the introduction of the automated system.
In this case of JSC “Khlibodar”, it is important not only to provide customers with attractive
delivery terms, for example, in terms of timeliness and scope of the supplied party, but also to
make them cost-effective for itself by reducing the share of logistics costs in the structure of their
operating costs.
In view of the above, I can note that the problem of developing a set of measures in order to
improve the logistic processes is extremely important not only theoretically, but also from a
practical point of view for the company of JSC “Khlibodar”. In this regard, I can formulate the
goals, objectives, object and subject of research.

9
The main aim of the diploma work – is to develop recommendations on improving logistics
processes in the warehouse logistics and transport logistics of JSC “Khlibodar” based on the
deep analysis and identification of main problems and disadvantages of the enterprise.
In order to achieve this goal, it was formed the following basic objectives of research:
1) To perform research on the essence of logistics processes and approaches of logistics
management;
2) To characterize the trends, problems and prospect of transport logistics and warehouse
logistics development;
3) To present the business-model and description of logistics processes at JSC “Khlibodar”
company.
4) To carry out a comprehensive analysis of logistics system at JSC “Khlibodar” and
evaluate its effectiveness;
5) To develop proposals of transport logistics system’s optimization and to evaluate the cost-
effectiveness of the proposed measures implementation.
6) To develop exemplification of the proposed system RS. TMS ASTOR performance
capabilities in case of the route planning and management
7) To create the costs and procedure assessment of the automated transport logistics and
management system implementation.
The object of research in my work is logistics sphere of JSC “Khlibodar”, which is running
business in the field of bakery products.
The subject of research are the main problems in logistics processes of JSC “Khlibodar” and
possible variants of its elimination.
The structure of the master's thesis is conditioned by the subject, objectives and separate tasks
and consists of four chapters.
The first chapter represents introduction, where there is general information about the relevance
of the paper research, including the subject of the investigation, object, defined objectives,
current problems and opportunities of the object of research.
In the second chapter, the theoretical part of the part is presented, which includes general
information about logistics itself, its growing significance globally and at individual companies as
well as its goals, tasks. Further, it was described the trends, problems and prospects of the
transportation and warehouse logistics.

10
The third part consisted of the business model description and the current state of the JSC
“Khlidodar” logistics. Then, the complex analysis of the logistics system and its effectiveness
were developed. Next step was to introduce transport logistics optimization and assess the
proposed measures effectiveness. Therefore, the proposed system performance capabilities
exemplification in case of route planning and management was created. In the end, there was
made mine assumption of system introduction plan, duration and its spending.
Finally, the fourth chapter consists of the conclusion based on the described and introduced
measures of logistics processes improvements.
Moreover, the master's thesis include list of sources, list of tables and figures as well as list of
abbreviations.

11
2. Theoretical part
2.1. Concept, goals, tasks, and the significance of
logistics for modern company
Due to constant changes in internal and external environment, the management of modern
enterprise needs high efficiency in decision-making processes. At the same time, the
fundamental difference of logistics approach to material flow management from traditional one
(fragmented management) is that in logistical approach, the management is provided by
integrating individual links of supply chain and product distribution into a single system, which is
able to adequate respond to the environment. Moreover, this integration includes all the links -
organization, technology, planning and monitoring of trade, informational and financial flows in
all the way of their movement [21].
Accurate and well-coordinated activity of logistics channels is the key of successful development
for economy of any country. The task of forming an effective logistics system has the primary
importance for the CIS countries which have a small historical experience in the infrastructure
development [1].
From Litvinenko V.A. and Rodnikovoj A.N. point of views: "Logistics is a complex area of
science, covering the material and information flow management problems in their interaction".
"Logistics is a scientific discipline, which studies the flow of control systems" - said Plotkin B.K.
Most of the authors in their definitions use the terms "material flow" or "material resource flows",
highlighting the main object of logistics as a scientific and practical direction. Many CIS authors
also mention the "information flow" and its interaction with the material and financial flows, but
none of the definitions does not contain the term "service flow" or "flow of services", which
narrows the object of logistics [15].
In my opinion, the most accurate and more capacious definition should be considered by V.I.
Sergeyev, who described the logistics from the academic and business perspectives: "Logistics
is the science of managing and optimizing material flow, service flow and related information and
financial flows in certain micro -, meso - or macro system to achieve its goals". From a business
point of view V.I. Sergeev describes logistics as the following: "Logistics is an integrated
management tool which is contributing to the achievement of strategic, tactical and operational
business goals of the organization through effective reduction of the overall costs and to meet
12
the requirements of end-users by the quality of products and material management services and
(or) service flows and attendant information flows and financial resources" [32, p.608].
To take into account the variety of logistics definitions and expressions, I have concluded my
own definition, which is the following: “Logistics is a scientific and practical management tool of
material, information, services and financial flows, based on the integrating role of flows in
economic systems and it is used to minimize overall costs and to maximize quality and
completeness of customer satisfaction goods and services“.
Dr. Johnson in his work “Modern Logistics” notes that logistics has been successful in the
corporate planning and its role over the years has increased significantly [18, p. 624]. Logistics,
depending on its current level of development, is a complex systematic method of strategies
development and mechanism of optimization economic relation on the basis of inter-companies
or cross-functional economic compromises [14].
Publications of western authors concerning logistics emphasize its independent (from both
marketing and sales) character [8]. In Ukraine, there is an absence of the general established
statements considering this direction of knowledge and logistics is out of scope as an
autonomous science [2]. However, undoubted fact that competitiveness of any company
depends on the quality of entire supply chain. Especially, if some companies use modern
methods to achieve that level of goods production, which can release a significant part of current
assets, to synchronize operation of companies production units and logistic structures, to ensure
security of deliveries, to reach proper speed and efficiency of transportation and to keep
corresponding number of consignment of cargo delivery.
In modern conditions, there are two levels of logistics: Macro-logistics, whose goal is to examine
the global issues of material and information management processes, and miсro-logistics
studying local issues concerning management of material and information flows management at
individual companies.
Micro-logistics is intra-logistics associated with a normal functioning of particular company.
The logistics is distinguished as:
o a business-economical processes;
o a management functions;
o a science.
Micro-logistics is divided into 3 different types:
o logistics associated with procuring provisions or the goods purchase;

13
o production logistics;
o logistics, specializing in the sale of products (distribution logistics).
All these types of logistics necessarily presuppose the existence of logistics flow, including the
availability of material flow data, its distribution, processing and systematization with the
subsequent issuance of the final analytical information. If within the logistics system, logistics
functions, production, marketing, distribution and transportation, consumption and markets are
integrated, the system is so-called as an integrated enterprise logistics system. All possible
spheres and functions of micro-logistics could be described as follows [20], [8].
o Manufacturing – planning of production tasks with a detailed schedule of product release,
the distribution of output plan by production sectors of enterprise, quality assurance,
handling and reprocessing of transported goods;
o Inventory management - displacement, communication, information flows organization,
product packaging, storage, warehousing, cargo handling operations;
o Marketing – research of market and organization of supply service processes, financing
and monetary benefits.
o Demand planning – transport planning of orders, storage of stocks, customer
procurement, financing of orders.
Essentially, logistics is viewed through the prism of achieving the strategic goals and
optimization of key operational processes at individual company, such as transportation and
storage of goods. Therefore, the targets of logistics business processes can be divided into
three groups:
o Global;
o Common;
o Local.
General or global challenge of the logistics is a complex provision and transportation
management of all commodity flows in an individual enterprise (outside, inside a warehouse, in
production, outgoing), which is achieved at the lowest cost [19].
One of the common goals of logistics also consists the creation of an effective integrated
regulation system and the control of material and information flows that would ensure a high
quality product delivery [11]. This task is closely related with the problems such as [12]:
14
1) the ensuring cross liability of material and information flows;
2) the control of the material flow and the central passing data;
3) the definition of the strategies and technologies for the physical movement of goods;
4) the development of the operations management methods of the movement of goods;
5) the establishment of the form standardization of the semi-finished products and
packaging;
6) the definition of the production level;
7) the transportation and storage, the elimination of the differences between the needs and
the purchasing and production possibility.
The general objectives of logistics include:
1) the creation of an integrated control system of the material and information flows;
2) the movement control of the material flows;
3) the definition of the strategies and technologies for the physical movement of goods;
4) the development of the distribution management methods;
5) the forecast of the production, transport, warehousing volume;
6) the balancing the marketing needs with the possibilities of the purchase and production;
7) the forecasting the demand for goods produced or transported within the logistics system;
8) the allocation of vehicles;
9) the organization of the pre-sale and after-sales customer service.
The goals of modern logistics are the following [22]:
o Timely delivery of the appropriate quantity, quality and variety of all the materials to the
place of consumption;
o stock change of materials according to the information about the availability of their fast
acquisition;
o coordination of goods selling and production policies;
o decreasing of the shipment and processing to 1 item;
o filling of orders at a high quality in short-term;
The conceptual approach to the development of the logistics system assumes that the logistics
function is considered as a very important subsystem of the firm-wide system. This means that
the creation and managing of the logistics system should be based on a common goal in order

15
to maximize the efficiency of the entire company. The set of objectives that are pursued are an
ideal, and the desire to reach the ideal of is a strategic goal of a business. Than the level of
production and infrastructure will be higher, than the easier it will be to make. In case of
realization this concept of logistics, it is necessary to include the establishment of unshakable
standards in the system of operational delivery to the undeniable success of individual
companies. For example, in Germany it means that orders for the required materials and
products are processed in 24 hours. Orders, taking into account the individual customer
requirements, carried out for 14 days.
Supply chain is the way in which the supplier to the consumer holds product and information
flows. In other words, it is a figure representation of the way in which they carry. There are the
following main units: suppliers of materials, raw materials and semi-finished products;
warehouses for storage of products in the purchase stage, the production of goods and their
sales & distribution, including dispatch from a warehouse of finished goods; consumers of
finished products [13], [8].
Due to constant changes in internal and external environment, the management of modern
enterprise needs high efficiency in decision-making processes. At the same time, the
fundamental difference of logistics approach to material flow management from traditional one
(fragmented management) is that in logistical approach, the management is provided by
integrating individual links of supply chain and product distribution into a single system, which is
able to adequate respond to the environment. Moreover, this integration includes all the links -
organization, technology, planning and monitoring of trade, informational and financial flows in
all the way of their movement
Accurate and well-coordinated activity of logistics channels is the key of successful development
for economy of any country. The task of forming an effective logistics system has the primary
importance for the CIS countries which have a small historical experience of infrastructure
development.

16
Figure 2.1.: Supply Chain of Enterprise [22].
In supply chain (Figure 2.1.), it can be identified the following main units:
o supply of materials, raw materials and semi-finished products;
o storage of products and raw materials;
o production of goods;
o distribution, including the shipment of goods from the warehouse of finished products;
o consumption of finished products.
Each link in the logistics chain includes its elements, which together form the material basis of
logistics. A transport means, warehouse management, communications and storage are relating
to the material elements. The logistic system, of course, covers the personnel, those workers
who perform all sequence operations. The supply chains form depend on the amount of the
above links and freight flow schemes, the size of the enterprise management concepts,
materials consumption of the production and sectors of the economy. The logistics system
contains the facilities for the movement of goods in the supply chain (storage, loading and
unloading machinery, vehicles) the production stock and all the chain links of the controls.
Organizational design of supply chain can be different and depends on:
Enterprisesеs
S
u
p
p
l
i
e
r
Supplies
Storage
Storage of
raw
materials
Manufact
ure
Storage of
the
products
Storage in
Sales &
Distribution
C
o
n
s
u
m
e
r
Intermediate
warehousing spare
parts and hubs
Purchasing
logistics
Production
logistics
Sales
logistics

17
1) Size of enterprises;
2) Scope of their activities;
3) Management concept;
4) Material consumption;
5) Economy sectors;
In addition, the organizational structure is influenced by such groups of problems as:
a. Boundaries of the sphere of logistics concepts competence in the organizational structure
of the enterprise;
b. Material and functional disintegration by spheres of logistics;
c. Centralized or decentralized form of management organization of equipment and material
procurement.
The formulation of the basic provisions of the logistics concept:
1) A system approach principle execution. The material flow optimization can occur in both
the whole enterprise and its individual divisions. However, to achieve the maximum effect
it can only be optimized or the total material flow from the primary source of raw materials
to the final consumer, or some of its major sites. At the same time all parts of the material
chain, i.e. all the macro-logistical and micro-logistical systems, it must work as a single
coherent mechanism [8].
2) Failure to use a universal process and handling equipment and the use of the equipment,
which corresponds to the specific challenges and conditions. Flow optimization by using
the appropriate equipment is possible only because of the release and mass use of a
wide range of different production means. In other words, to apply logistic approach to
management of the material flows a company must have a high scientific level and
technological development [8].
3) Possibility of the flexible production, the most adaptive to the market needs. In this case, it
is necessary that the length of the production cycle, from the moment of the acquisition of
the material resources to the shipment of finished products to the consumer is minimal.
Therefore, there is a high need of the shorten process of material processing as well as
all of the processes associated with the purchase of raw materials [8].
4) Humanization of technological processes, the establishment of the appropriate working
conditions in all sectors of the logistics system. One of the logistics system elements is a

18
personnel , i.e. specially trained personnel who have a degree of responsibility required to
fulfill its functionю Logistic approach strengthens the social importance of the activities in
the field of management materials, creates the objective prerequisites for attracting
logistics personnel with higher employment potential. At the same time, the working
conditions should be improved adequately [8].
5) Calculation of logistics costs throughout the supply chain. One of the main tasks is to
minimize logistics costs associated with bringing the material flow from the primary source
to the end user. The solution to this problem is possible only if the counting system allows
determining the logistics costs objectively. Thus, there is an important criterion for the
selection of the optimal variant of the logistics system - a minimum total costs throughout
the supply chain [8]
6) The service development at the modern level. These days the possibility of a radical
improvement of the quality of products are objectively limited at the most manufacturers.
Therefore, there is a growing number of the companies looking to logistical services as a
means to enhance their competitiveness and achieve competitive advantage. When in the
market there are several providers of identical goods is roughly equal quality, the
significant competitive advantages are awarded to the one who is able to offer customers
a high-quality logistics services (terms and conditions of delivery, lot sizes, order
management flexibility, etc.) [8], [13].
7) Ability of the logistics systems to adapt to the market conditions. The emergence of a
large variety of goods and services leads to the demand uncertainty causes the sharp
fluctuations of the qualitative and quantitative characteristics of the material flow passing
through the logistics system. Under these conditions, the logistics systems’ ability to
adapt, caused by changes in the environment, is an important factor in a stable position in
the market. [8].
Table 2.1.: Comparing analysis of the traditional and logistics control systems [8].
Features of the traditional control
system
Features of the logistics control system
1. The low level of production
integration
2. Increase of the output
3. Optimization of the production
functions
1. A high level of production integration
2. The satisfaction of effective/consumer demand
3. Optimization of material flow movement
4. Getting information about the imminent
purchasing of materials

19
Table 2.1.: Comparing analysis of the traditional and logistics control systems [8].
4. Creation of stocks
5. The elongated cycle of dispositions
6. The use of universal equipment in
the production
7. Large-scale or mass manufacturing
8. Reduction of production costs
9. Making a profit by increasing sales
5. Reduced disposition cycle
6. Use the equipment for the production of product
placement.
7. Individual based and small-scale manufacturing
8. Reduction of production costs
9. Making a profit by providing services
2.2. Trends, problems and prospects of transport and
warehouse logistics development
The main trend in modern logistics, the appearance of which is largely due to the rapid
development of e-commerce - is a complication of the architecture logistics networks, the
growing level of integration of logistics flows, a clear separation between the functions of the
actual product distribution (marketing aspect), and delivery (logistic aspect).
At the moment, there is a clear transition from single lines along which trade flows are
moving in the direction of the user, to an entire logistics web, which brings together producers
and consumers from around the world. Currently, the nodal elements World Wide Web are the
logistics distribution centers at the appropriate level (mainly presented modern warehouse
complex class "A" and "B"). They are provided with the appropriate infrastructure, have all the
necessary equipment to perform the functions of a full range of warehouse logistics and
maintained the leading logistics operators in the world.
The main purpose of the distribution centers is integrated management of commodity
flows, including their reception, organization of temporary and long-term storage, operation of
cargo equipment (LCL), cross-docking operation, and other. At the same time, depending on the
size and destination can be identified distribution centers at various levels: at the level of macro-
regions, at the level of individual countries or groups of countries, at the level of territories within
countries.
Thus, the distribution centers of the macro - regional level serves the global commodity
flows, following between different regions of the world - between Europe and Asia; between
Europe and North America; between Africa and Australia. Except the immense proportions, the

20
characteristic feature of these distribution centers is the possibility of a combination of several
types of transport because usually the intercontinental movement of goods provides for their
transfer from one vehicle to another.
As a rule, a combination of air and rail transport and maritime and rail transport applies
here. Intercontinental distribution centers service the huge flows of goods and, as a rule, do not
provide for the execution of any additional operations of warehouse logistics (sorting, packaging,
re-stocking), but mainly work with multimodal transport.
Accordingly, the distribution centers at the level of individual countries or regions are the
centers of the lower scale that, in addition to performing freight forwarding function is also
carried out and the operation of the additional storage processing (segregating, cross docking).
In particular, at the regional warehouses are formed parties of cargoes (equipment within one
cargo of goods from many suppliers, which in future will be directed to one customer - for
example, on the operating warehouse of Internet - shop) .
In addition to a clear synchronization and routing of trade flows, an important function of
distribution centers in favor manufacturers reduce costs for delivery and transportation of goods.
By controlling the huge flows of goods within the modern logistic distribution centers produced
economies of scale and synergy whereby the share of the transport and storage costs in the
total cost of production is reduced systematically.
In particular, according to Research Company Deloitte, before the advent of modern
distribution centers the proportion of storage and transport costs in the structure of the final price
of the product manufacturers achieved 25%, but with the advent of this indicator decreased to
the level of 10-15% [14].
Another direction of development of modern logistics system, due to the rising dynamics of
the global e-commerce, growth in demand for combined transport of goods by several modes of
transport. In particular, e-trade development has significantly expanded the boundaries for
producers from around the world. As a result, production of Asian countries due to e-commerce
is actively marketed in Europe and the United States; Europeans are fighting for the US and
Japan markets, while Japanese themselves are trying to find its niche in the dynamic and
promising markets of China and Southeast Asian countries. That is, as a result of the flow of
these processes are growing by leaps and bounds the volume intercontinental transport of
goods, which are known to require the use of combined transport by air, sea, rail and road. As a
result, the increasing popularity start to use multi-modal international transportation, carried out
simultaneously in several modes of transport, but served by a single logistics operator on the
route.

21
Another trend in the development of the sphere of logistics at this stage is a clear distinction
between the concepts of distribution of goods, in the proper sense of marketing, which includes
market segmentation, selection and maintenance of target segments, and delivery and
transportation of goods in the logistics sense. Actually, the latter gradually stands out more
clearly in the sphere of logistics outsourcing, in which the dominant position begin to occupy
several dozen logistics operators world-wide.
According to the analytical conclusions of Armstrong & Associates, the global logistics industry
now form about 100 participants, among which should be accented as large companies with the
large assets as especially agency operators, almost without the assets. First of them at the
same time are engaged in cargo operations while others mediate between the shippers and
transport companies. The leading logistics companies in the world are the Exel (UK), Kuchne
und Nagel international (Switzerland), Schenker (Germany), DHL Danzas Air & Ocean North
America (US), D & O Nedlloyd (UK - Netherlands), TPG/TNT (Netherlands) , Panalpina
(Switzerland), UPS Supply Chain Solutions (US), Nippon Express (UK) and other [14].
A special place in the search for improving ways for the efficiency of logistics now occupies the
cost assessment on the formation of industrial store. The expenses on the formation and storage
of stocks are the costs that are relating to [14]:
o diversion of circulating assets in stocks of raw materials, etc.;
o current inventory service, including the costs for carrying out inventories, bank loan
interest rates, etc.;
o storage costs, which vary in the range of 10-40% of the value of stocks;
o value of inventories of damage risks.
A positive aspect of the existence of large reserves is to ensure a high level of service
production needs, as well as customers' needs when it comes to the formation of stocks of
finished products. It becomes possible to avoid the problems associated with time deliveries and
other obstacles that affect the efficiency of production. Negative aspects of the large size of the
reserves are to reduce their level of quality and increase product distribution period [] -
production and operating cycles.
The cost of any product is made up of the cost of manufacturing and the cost to perform all the
work, from the moment of purchase of materials to the date of purchase by the end user of the
goods. A significant part of the cost of the so-called "transfer price", i.e. the margins of each link
in the chain "producer - the final buyer." The price of such a transition can be approximately 15-

22
40%. In recent years, the delivery of goods as well as are the costs of their transportation,
decreased for almost all companies [9].
One of the most famous and effective concepts of transport logistics is the concept of "just in
time"(JIT), the appearance of which dates from the end of the 1950s [14]. It is based on a simple
binary inventory management logic in which material resources flows carefully synchronized with
the need for them. Such synchronization is none other than the co-ordination of supply and
production management. In the future, the concept has been successfully applied in the
distribution, marketing systems, finished products, and today - and macro-logistical systems.
Ideally, the material resources or finished products should be delivered at a specific point of the
logistics chain (channel) at the very moment when they are needed (not earlier or later) that
eliminates excess inventory both in production and in distribution. Many modern logistics
systems, based on this approach, focused on short cycles components of logistics; it requires a
rapid response units of the logistics system to changes in demand and, consequently, the
production program.
In the concept of "Just-In-Time”, demand plays a significant role which determines further
movement of raw materials (ingredients), semi-finished and finished products. Short components
of logistics cycles in systems that use this approach contribute to the concentration of the main
suppliers of the material resources close to the main company engaged in the process of
production or assembly of the finished products. The company tries to choose a small number of
suppliers, a high degree of reliability of supply as any disruption in supply could disrupt a
production schedule. According to this concept, vendors are essentially becoming partners with
the manufacturers of finished products in their business [10].
For the effective implementation of JIT technology companies need to work with reliable
telecommunication systems and information computer support. A classic example of the
implementation of the described concept is the Chrysler Corporation [10]. The Chrysler decided
to use the JIT system in the delivery of raw materials to the enterprises of the corporation.
Between the suppliers and enterprises of the corporation carried out a large volume of cargo
transportation. Cars for a trip had to do a large number of stops, since the trucks chartered by
several companies at once. In the carriage of cargo from the origin to the destination it could be
confused, the percentage of loss and damage to the goods was very high. The recipients until
the arrival of cars did not know anything about the nature of the cargo and its quantity. It was
clear that such a transportation system is not justified. In 1984, Chrysler Corporation began to
implement in the transport of cargo of the small corporations’ delivery program "Just-In-Time".
Until 1988, almost 80% of the volume of transported goods carried out by the system. It is
23
possible to reduce freight costs by almost 15% while delivering increased reliability,
approximately 2 times decreased transit times, reduced inventories of raw materials.
To improve the system and the possibility of the number of traffic forecasting Chrysler
subsequent introduced the electronic data exchange system between all providers and has
developed an automated system planning material requirements. The new system is called
Supplier Diversity Program (SDP) and stands for a "guaranteed supply". The basic position of
the system was planning a closed transport chain. The system ensured the loading of the certain
material from suppliers and delivery of the material to the corporation factory in accordance with
a predetermined schedule. In addition to transport materials, was occurred the return of reusable
packaging and containers [20].
When using the SDP system each of the partners is imposed the stringent obligations. Every
morning the transportation services and supply of information transmitted the information about
requirements for materials and order delivery to suppliers on a given day and ten-day forecast.
Forecast data can be changed but they give an idea of the perspective volume of traffic allowing
them to plan. The routes developed by the transport services were subjected to the agreement
with the Corporation. Changes to the route required a preliminary agreement with all of its
partners. If you have any problems, the transport services should be sufficiently flexible
approach to their solution [20].
The second aspect of the assessment of the logistics impact on the business efficiency
associated with the logistics of distribution. In the new conditions of managing, the process of
realization of production management is becoming increasingly complex and dynamic nature
and goes far beyond the actual sales spreading too many other aspects of the organization.
When choosing a channel of distribution the main condition for it is an availability. To achieve
commercial success with the use of a particular product distribution channel is necessary to
analyze all financial matters carefully, to conduct a comparative description of the company’s
expenses on the possible distribution channels. These costs include the costs of recruiting and
training sales force; administrative expenses, the cost of advertising and sales promotion, in the
organization of movement of goods, including transport costs, warehousing, and the level of
commission payments. It should be kept in mind that at the initial stage of the enterprise,
marketing costs are increasing, but they are not of a permanent nature.
The comparative cost characterization of the individual channels must also be coordinated with
the prospects of goods sale growth. It is important to note that the choice of the distribution
channel is usually associated with the conclusion of the long-term agreements between the
partners so that the wrong choice of the distribution channels can cause the cancellation of the

24
legal agreements, which, of course, affects the enterprise outcome, and the intermediaries
involved in this agreement. For the products sales the following distribution channels can be
selected (Figure 2.2).
The choice of the channels and the marketing practice in the market is almost entirely
dependent on the nature of the goods. The answer to this question largely determines the
construction of an organizational sales structure. From this point of view in the classification
have identified a number of business – models [4]:
1) Model В2С (Business - to - Consumer)
2) Model В2B (Business - to - Business)
Unlike B2C consumer markets, in industrial B2B markets are used primarily short distribution
channels. It should also be noted that since most industrial products during its further use and
operation needs servicing (moreover, frequently crucial importance in selecting of supplier
companies in B2B markets has a value of up-sales quality services), correspondingly, successful
activities in industrial markets in most cases is simply not possible without effectively organized
and after sales service.
Figure 2.2. Basic distribution of goods channels [3]

25
The Saykonski Association (USA) was conducted large-scale study of the employee’s views,
which are involved in procurement and sales companies representing a variety of sectors of the
US economy [5]. The purpose of this research was their distributors arranging and the exposure
of the priority factors that determine the value and the perspective of the cooperation with one or
another distributor. Also, during the researches there were found some factors that the most can
exert the negative influence on the managers’ decisions that particularly lead to the cooperation
gap with the manufacturers. The results of the research are presented on the Figure 2.3., which
shows typical mistakes in the manufacturers’ promotion. As we see on the Figure 2.3., the failure
to comply with delivery dates, which is a related element to the sphere of the logistic customer
service, is mentioned as the main defect of the manufacturers’ work by the 44% interviewed
managers.
Figure 2.3.: The relative importance of the logistic services’ elements, % [16]
In turn, it should be noted that the mediators are often unable to organize a proper level of
technical service, and therefore the direct marketing channels are becoming more relevant
In general, it must be said that the characteristics of the end-users of the goods, the company
and its competitors and unified logistics network influence the choice of the structure of
distribution channels. This structure is characterized by the following three parameters [5]:
1) The length of the distribution channel. Specifies the number of units or levels which the
goods will take place before reaching the final consumer. Long distribution channels, as a
Disruption supply44%
Deficiency in goods quality …
Damaged goods 12%
Frequent devaluation of
goods 6% Other 7%

26
rule, provide a high market’s saturation of the company's products but increase its final cost
to the consumer because of higher trade margins at all levels of distribution.
2) The width of the distribution channels. Specifies the number of resellers at each
distribution level. The wider the channel is the greater the market’s saturation will provide it
but at the same time the greater number of the customers has to be served and the more
likely the emergence of the conflicts in the distribution structure between its members will
definitely affect the company's operations.
3) The number of the distribution channels.
In case, the products of the organization are additional or assortment the participants of the
channels of these industries can also act as a distribution channel of the organization. Similarly,
it is necessary to consider such alternative distribution channels as trade by mail, over the
Internet, and others.
A large number of distribution channels ensures widespread product in the market but leads to
the dissipation of commodity flows through all of the channels which may be undesirable from
the convenience customer service’s standpoint (equipment, shipping, warehousing). In addition,
you may experience conflicts (for markets) between the various distribution channels.
To conclude, the theoretical part includes general information about logistics itself, its growing
significance globally and at individual companies. It was highlighted the current comprehensive
tasks and goals of logistics. Further, it was described the different modern trends in logistics,
problems it faces, also it contains deep description of goods distribution channels.

27
3. Practical part
3.1. Business model and the logistics of the JSC
"Khlibodar"
JSC "Khlibodar" is a branch leader of baked and confectionary products manufacturing in
Zaporizhia region. The main goal of the company providing the people of Zaporizhia,
Dnipropetrovsk regions with world class quality products by introducing latest technologies in
manufacturing and management. At the centre of attention for the company is people with their
interests, aspirations and needs. Since over a century, "Khlibodar" products have been a
constant companion for the people of southern regions of Ukraine on everyday as well as on
special occasions. The company’s range of goods has about 400 items of backery and
confectionery products. Since 1998, JSC "Khlibodar" produces confectionery products in
accordance with European quality standards and using foreign technologies. The company
employs over 800 people in all it’s departments. At the core of manufacturing, there are
traditional as well as modern baking technologies with the use of natural products and best raw
materials. The company manufactures over 75 tonnes of product daily. The factory has it’s own
production laboratory carrying out chemical, biological and organoleptic tests of incoming raw
materials and the final product. All company produce is certified in accordance with international
ISO 9001 and ISO 22000 standards [6].
The continuous work at improving of production and management allows the company not only
to keep leading positions in the range and quality of goods but constantly develop new
technologies and open up new markets. The company’s products are presented in Zaporizhia,
Dnipropetrovsk regions.
JSC "Khlibodar" is a unique brand tightly connected with local life of Zaporizhia and
Dnipropetrovsk regions. Preserving old baking traditions, JSC "Khlibodar" keeps striving
forwards.
Analyses of baked products market tendencies shows a systematic production and consumption
decrease in this branch. For example, in the end of 2006-2008 yearly, baked goods consumption
in Ukraine was estimated at the level of 6,6-7,0 million tonnes. By the end of 2014, it decreased
to 5,01 million tonnes. That is a 25 % to 30 % decrease compared to the level of 7 or 8 years
ago, it is shown in Figure 3.1.[2].

28
Figure 3.1.: Dynamics of bread production and bakery products in Ukraine,
thousands of tones [6].
However, official baked products market decline does not mean the absence of niches for new
promising projects. Production and consumption decline of these products is obvious though
connected with consumption decline of basic baking products among the poorest population.
Along with other, more attractively marketed baked products are taking the vacated market
niche. In particular, there can be underlined several tendencies:
1) Small bakeries are developing fairly well introducing original traditional and foreign
recipes and using whole wheat and other types of grains.
2) Also actively developing is the format of baked goods production in retail chains
positioning themselves in the category “above average”.
3) Another tendency – demand growth for so-called “conceptual” bread produced by big
chains as well as small bakeries.
4) Finally another tendency that just been forming but has received big spread in the west is
production of ecologically clean (organic) bread by using latest technology – not from flour
but whole grain.
In line with the business concept of JSC "Khlibodar", company’s baked products are aimed at
two goal segments: consumer (B2C- group) and corporate (B2B – group). Basic model of market
segmentation is shown on Figure 3.2.
0
1000
2000
3000
4000
5000
6000
7000
8000
2007 2008 2009 2010 2011 2012 2013 2014
MLN
TO
NES
OF
GO
OD
S
YEARS

29
Consumer market is a part of southern regions, all age groups, mainly of middle class. Main
sales channels of baked products for this group are:
1) Retail grocery chains in “economy”, “middle” and above market segments of federal and
regional calibre.
2) Small grocery stores.
3) Stalls, markets, big bakery chains.
Figure 3.2: The basic model of the target market segmentation for JSC "Khlibodar" [6]
Aside from bread sales on consumer market, JSC "Khlibodar" works with corporate (B2B)
market segment. Whereby, among corporate market consumers there can be pointed out two
targeted groups:
1) Targeted group represented by companies of HoReCa field – cafes and restaurants,
hotels, catering sector, etc.
2) Second targeted group in B2B market segment is represented by mainly private
healthcare organizations. These are private hospitals, recreational organizations, which
provide healthy and nourishing food for their patients.
In the short term, which is 1-2 years, B2C audience will consume the primary sales of bread - it
covers 98-99% of total sales, while in the B2B audience consists of only 1-2%.
The target audience of JSC
"Khlibodar" products
Consumer (B2C) segment of the market Corporate (B2B) segment of the market
Companies
sector HoReCa
(cafes,
restaurants,
hotels, catering)
Sales
through
retailers
Sales
through
linear retail
Kiosks,
markets,
proprietary
trading
networks of
bread
Healthcare
Establishment
(hospitals, health
and recreation
resorts)

30
In the long term, in line with the development of HoReCa sphere, the sales share in B2B market
segment will increase to 10 % in 5 years term.
Figure 3.3.: The target audience of consumers of bread JSC "Khlibodar" in the short (1-2
years) and medium term (3-5 years) term.
Taking into the account the JSC "Khlibodar" business activity in the bakery products market, the
value of model chain will be as follows:
Figure 3.4.: The value creation model for JSC "Khlibodar" on the bakery market [6]
98,00%
90,00%
2,00%
10,00%
SHORT-TERM (1-2 YEARS) PERSPECTIVE
LONG-TERM (3-5 YEARS) PERSPECTIVE
B2B-segment B2C-segment
Purchases of raw
materials and
components from
suppliers
Production and logistics
operations: transportation,
warehousing, storage,
production, creation of stocks
for finished products
Shipments of
finished bakery
products to
consumers
Management of marketing and sales at the bakery market
Company personnel management system
Total management system of a company
The fin
ancia
l re
sult o
f th
e c
om
pa
ny -
sale
s, in
com
e, pro
fit

31
Figure 3.5.: The operational business model of JSC "Khlibodar" in the bakery market
Thus, the financial results of the company JSC "Khlibodar", income from sales and profits, are
formed of three main processes: purchase of raw materials, industrial materials and components
from suppliers;
1) purchase of raw materials, industrial materials and components from suppliers;

32
2) logistics operations with raw materials (transport, warehousing and storage),
maintenance of the production process and acceptance of finished bakery products in the
transit warehouse for batching orders and sending them to consumers;
3) The sales of products to customers, which are presented as the large national grocery
chains, linear retail, kiosks, branded networks selling bakery products, the company
HoReCa and medicine.
At the moment, about 85% of required bakery products for the production, the company buys
raw materials from local producers and about 15% of the products are purchased from resellers
(dealers or distributors), which involved in the delivery of related production components to
Zaporizhia [16]. In recent years, JSC "Khlibodar" radically changed the principles of its work with
suppliers, in particular – 100% purchasing of local raw materials directly from producers. It was
possible due to:
1) Production capacity increased from 50-60 tons per day to 75-85 tons of bread products
per day, i.e. the need of raw materials purchases increased by more than 50%. In this
regard, JSC "Khlibodar" became a major player at the commodities market, therefore, it
benefited from direct cooperation with the enterprise for the producers themselves [16];
2) JSC "Khlibodar" has invested a significant amount in the development of its own storage
infrastructure, expanding direct area of the main warehouse premises and acquiring
additional storage equipment. That, in turn, made it possible to ensure reliable storage of
large quantities of industrial raw materials.
Direct supply’s establishing of necessary raw materials for JSC "Khlibodar" provides an
enterprise with a number of tangible benefits:
1) due to the exclusion of the external intermediate cost element supply for the purchase of
raw material from the delivery chain decreased by 7-10% [16];
2) The supply of necessary raw materials have become more predictable and rhythmic
(making it possible to minimize the need for industrial stocks) besides this JSC
"Khlibodar" got confidence in stable quality of supplied products.
Next, I am going to consider the functioning figure of the distribution logistics of JSC "Khlibodar"
in which management there are issues of the marketing and delivery of products to consumers.

33
Speaking in general about the target market of JSC "Khlibodar" on which the production of the
enterprise focused its audience forms as shown on Figure 3.6. Currently, bakery products of
JSC "Khlibodar" split among the several possible channels:
1) Direct delivery from the warehouse of JSC "Khlibodar" in Zaporizhia to the major networks
regardless of their place of location. The area covering the direct deliveries is served by
the enterprise in Zaporizhia, Dnipropetrovsk regions. With the large networks JSC
"Khlibodar" works directly and the volume and frequency of the products‘ orders make the
supply of products commercially reasonable even for long distances (up to 150 km).
2) Direct deliveries of bakery products in the linear retail (ordinary food shops) as well as
corporate customers (the HoReCa, health facilities). Area coverage is Zaporizhia,
Dnipropetrovsk regions (within 100 km). The possibility of the direct delivery of orders
depends on the stability of orders and the volume of order bread series.
3) Direct supply of bakery products to the small private entrepreneurs who sell bread at its
sales outlets in the stalls and markets. With the smallest customers JSC "Khlibodar"
works directly only in Zaporizhia as well as within a 30 km coverage. Over long distances,
the delivery of products to the small retail stores is not carried out [16].
4) Indirect supply of products to intermediaries – distributors, the delivery to warehouse or
Distribution Center agent), who works with small and medium-sized customers at more
distant markets (on a distance up to 150 km from the JSC "Khlibodar" factory). Due to the
remoteness of the consumers and the small size of the orders, the direct delivery from the
warehouse of JSC "Khlibodar" is impractical. At the same time, intermediaries provide not
only with the bakery products but also with other products (groceries, drinks, candy, etc.)
perform the function of supply more efficiently with small and medium-sized customers.
Figure 3.6. The target audience of JSC "Khlibodar" and specifics of goods distribution [6]
JSC "Khlibodar" - a manufacturer of bakery products
Deliveries products through
intermediaries, distance up to 150 km
Direct delivery of products to consumers,
distance within 100 km
Non-networked regional retail
Small retail outlets, corporate networks
Retail Network as supermarkets and
minimarkets. Linear Retail, small stores,
B2B

34
At present, around 85 % of JSC "Khlibodar" products are targeted for direct consumers
(including 50 % of store chains on local level), another 15 % of sales provided by dealers and
distributers working on the remote markets of Zaporizhia, Dnipropetrovsk regions.
Figure 3.7.: Structure of products sales at JSC "Khlibodar" company, in the context of the
target audience in 2015, % [6]
Logistical management at JSC "Khlibodar", starting from suppliers and coordinating delivery of
raw materials and up to distribution of final product (including delivery to customers) selections
performed by commercial service department. Organizational system of JSC "Khlibodar"
commercial service is shown on Figure 3.8. This department is dealing with development
strategies of JSC "Khlibodar" at the commercial director level. In particular, it is responsible for
the following:
1) Determining general development strategy of JSC "Khlibodar" establishing strategic
goals and tasks for the subdivisions.
2) Choice of competitive strategy for JSC "Khlibodar" – establishing goods and market
specialization of the company (defining product groups and market niches optimal for the
company) and choice of competing methods (basis for pricing strategy and customer
service strategies);
3) Designing of purchase and sales net of JSC "Khlibodar", establishing product supply and
sales channels, development of differential bonus system and partner support for key
customers.
Direct delivery to grocery networks
50,0%
Direct delivery to the linear
retail21,0%
Direct supply to small retail
sellers12,0%
Direct supply to В2В2,0%
Deliveries to intermediaries
15,0%

35
4) Personnel management of the commercial department, defining of the main and bonus
salary parts for the employees, development of order formation system, motivation and
employees’ development.
Figure 3.8.: The structure of the commercial department at JSC "Khlibodar"[6]
In one’s turn the decision-making in operational activity of JSC "Khlibodar" is given to logistics
and sales groups, their employees are direct subordinates of commercial director. In particular,
the logistics group that includes managers working with suppliers, logistics specialist, warehouse
employees and driver-forwarders, is dealing with controlling of the completely logistical chain
“arrival – storage – delivery to customer”. In fact, logistics group of JSC "Khlibodar" is working at
physical product movement that has arrived from the suppliers, goes through main warehouse
and pops out in production workshop and then comes out as final baked products and is being
delivered to customers.
In it’s own turn the function of management of sales logistics is performed by marketing and
sales group of JSC "Khlibodar" In particular, main targets for sales managers are:
o Systematic search for direct and wholesale customers of baked products, motivation of
the above to cooperate with OJS “Khlibodar”,

36
o Carrying out daily work with clientele base of the company – sales orders formation,
compiling calendar plans and graphics of sales, shipment and counteragents payments
controls.
o Maintaining of continuous contact with the customers, analyses of customer satisfaction,
customers’ motivation for future cooperation with JSC "Khlibodar”, information and
customer service.
3.2. Complex analysis of the JSC "Khlibodar" logistics system, its effectiveness
The growing production and market activity lead to the expansion of the production volume and
realization of the bakery products, further the saturation range, the circuit increase of the
commercial interaction with the market, increasing the number of the customers and the average
volume increase of orders what accordingly affected the transport logistics system.
Table 3.1: Cooperation indicators of JSC "Khlibodar" with customers in 2013 [6]
N Indicators 2013 year 2014 year 2015 year
1 Number of company’s customers, units 359 478 562
2 Annual-average order per one customer, tones 27,4 28,5 29,6
3 Average selling price per 1 ton, thousands of UAH 7,7 8,5 9,3
4 Annual turnover in production sales, thousands of ton 9,83 13,61 16,62
5 Annual turnover for the sale of bakery products, mln of UAH 70 100,6 140,8
Thus, in accordance with Table 3.1., for the period from 2013 to 2015, the customers’ number of
the JSC "Khlibodar" bakery products have successively increased from 359 to 478 and further to
562 customers in 2015. At the same time, the average order volume also rose up to 27.4 ton of
goods per one customer to 29.6 ton in a year, in 2015, what is against the background of the
increase in the average selling price of a ton of bread has led to the turnover increase of JSC
"Khlibodar" more than 2 times from 70 million of UAH in 2013 to 140.8 million of UAH in 2015.
37
The growing volume of the enterprise business operations led to the requirements’ growth to the
transport logistics, in particular has increased the need for the fleet. Taking into account, that the
bakery products are classified as the perishable goods for which the delivery speed and
operability are the key factors of the business success; creation of the finished goods storage in
a warehouse for a period of more than 0.5-1 hour is meaningless; JSC "Khlibodar" has no
alternative of its own fleet and own logistics system. Transfer of the logistics management
function in the case of JSC "Khlibodar" outsourcing is economically and technically impossible.
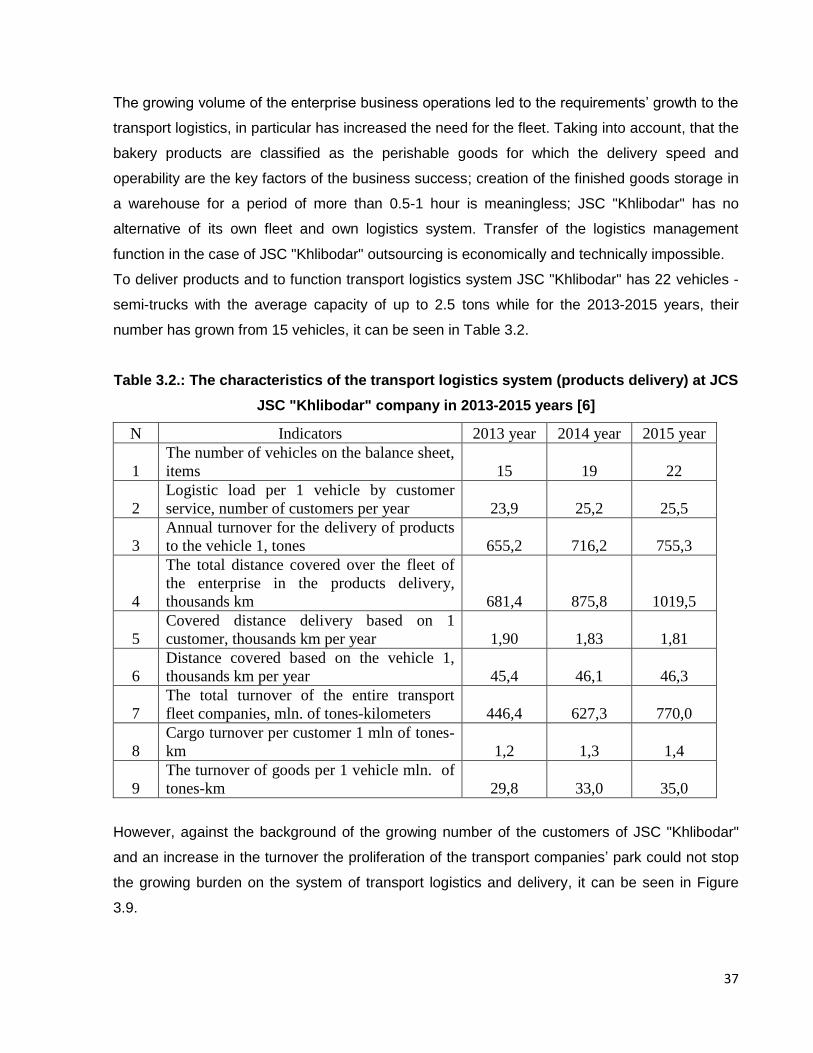
To deliver products and to function transport logistics system JSC "Khlibodar" has 22 vehicles -
semi-trucks with the average capacity of up to 2.5 tons while for the 2013-2015 years, their
number has grown from 15 vehicles, it can be seen in Table 3.2.
Table 3.2.: The characteristics of the transport logistics system (products delivery) at JCS
JSC "Khlibodar" company in 2013-2015 years [6]
N Indicators 2013 year 2014 year 2015 year
1
The number of vehicles on the balance sheet,
items 15 19 22
2
Logistic load per 1 vehicle by customer
service, number of customers per year 23,9 25,2 25,5
3
Annual turnover for the delivery of products
to the vehicle 1, tones 655,2 716,2 755,3
4
The total distance covered over the fleet of
the enterprise in the products delivery,
thousands km 681,4 875,8 1019,5
5
Covered distance delivery based on 1
customer, thousands km per year 1,90 1,83 1,81
6
Distance covered based on the vehicle 1,
thousands km per year 45,4 46,1 46,3
7
The total turnover of the entire transport
fleet companies, mln. of tones-kilometers 446,4 627,3 770,0
8
Cargo turnover per customer 1 mln of tones-
km 1,2 1,3 1,4
9
The turnover of goods per 1 vehicle mln. of
tones-km 29,8 33,0 35,0
However, against the background of the growing number of the customers of JSC "Khlibodar"
and an increase in the turnover the proliferation of the transport companies’ park could not stop
the growing burden on the system of transport logistics and delivery, it can be seen in Figure
3.9.

38
Figure 3.9.: Load on the transport logistics of JSC "Khlibodar" in 2013-2015
It should be noted, the growth of the cargo traffic (in tons) was greater than the rate of customer
service growth in the transport logistics system of JSC "Khlibodar" in 2013-2015. As the data in
Figure 3.9, the logistics burden on the one customer’s service vehicle has increased over the
past three years: in 2013 year, it amounted to an average of 24 customers per one vehicle, and
then in 2015 this figure increased to 26 customers. The turnover of goods has increased
attributable to the one vehicle: if in 2013 year each machine delivered 655.2 tons of bread then
in 2015 it was transported 755.3 tons of products.
It should be noted that the attempts of the management of "Khlibodar" more or less evenly
distribute the load on the vehicle fleet and rationalize vehicle traffic routes led to the fact that the
distance (in kilometers), covering every car for a year, has not changed. If in 2013 the figure was
45.5 thousands of km. per year for 1 vehicle, in 2015 it increased to 46.3 thousands of km. 1
year in a vehicle.
At the same time it should be pointed out, that all the work of planning routes, drawing up the
vehicle’s working schedules with the drivers, load distribution on the vehicle fleet carried by the
Logistics managers of JSC "Khlibodar" in manual mode without the use of specialized TMS-
systems, optimization models and procedures allow to make an optimum delivery and order
schedules, optimize the vehicles’ loading and ensure an efficient use of resources.
24
25
26
655,2
716,2
755,3
600,0
620,0
640,0
660,0
680,0
700,0
720,0
740,0
760,0
780,0
23
24
24
25
25
26
26
27
2013 year 2014 year 2015 year
tonnes p
er
year
Custo
mers
per
1 tra
nsport
mean
Logistics load per 1 transport mean
Delivery turnover of goods per 1 transport mean, tonnes
39
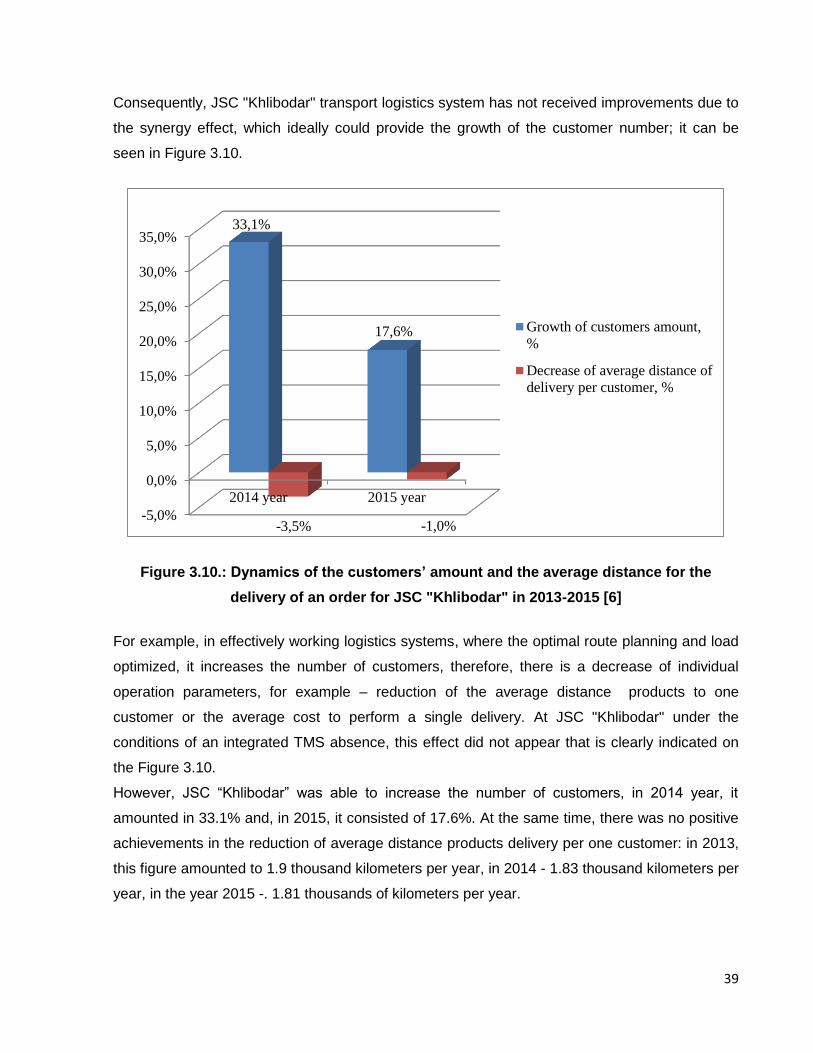
Consequently, JSC "Khlibodar" transport logistics system has not received improvements due to
the synergy effect, which ideally could provide the growth of the customer number; it can be
seen in Figure 3.10.
Figure 3.10.: Dynamics of the customers’ amount and the average distance for the
delivery of an order for JSC "Khlibodar" in 2013-2015 [6]
For example, in effectively working logistics systems, where the optimal route planning and load
optimized, it increases the number of customers, therefore, there is a decrease of individual
operation parameters, for example – reduction of the average distance products to one
customer or the average cost to perform a single delivery. At JSC "Khlibodar" under the
conditions of an integrated TMS absence, this effect did not appear that is clearly indicated on
the Figure 3.10.
However, JSC “Khlibodar” was able to increase the number of customers, in 2014 year, it
amounted in 33.1% and, in 2015, it consisted of 17.6%. At the same time, there was no positive
achievements in the reduction of average distance products delivery per one customer: in 2013,
this figure amounted to 1.9 thousand kilometers per year, in 2014 - 1.83 thousand kilometers per
year, in the year 2015 -. 1.81 thousands of kilometers per year.
-5,0%
0,0%
5,0%
10,0%
15,0%
20,0%
25,0%
30,0%
35,0%
2014 year 2015 year
33,1%
17,6%
-3,5% -1,0%
Growth of customers amount,
%
Decrease of average distance of
delivery per customer, %

40
Table 3.3: Cost indicators of JSC "Khlibodar" transport logistics system in 2013-2015 [6]
№ Indicators 2013 year 2014 year 2015 year
1 Logistic expenses of a company, mln of UAH 3,07 6,5 9,8
2 Conditionally variable costs (fuels and
lubricants), mln of UAH 1,86 3,7 5,66
3 The share of semi-variable logistics costs, % 60,0% 58,2% 57,8%
4 Relatively fixed costs, mln of UAH 1,21 7,2 10,9
5 Salary of delivery department employees 1,6 2,73 4,14
6 Costs for maintenance and service of the
transport fleet, mln of UAH 0,4 0,9 1,4
7 Other administrative and business logistics
costs, mln of UAH 0,22 0,4 0,45
At the same time, the real provision costs of the transport logistics of JSC "Khlibodar"
significantly increased - from 3.07 mln of UAH in 2013 to 9.8 mln of UAH in 2015, while the
percent of semi-variable costs (fuel and lubricants) decreased from 60% to 57.8%. In this, quasi-
fixed costs (salaries of employees of the shipping service, the cost of maintenance and servicing
of the vehicle fleet, administrative and economic logistics costs) has been increased.
Table 3.4.: Indicators of the cost of logistics customer service of JSC "Khlibodar" in 2013-
2015 years [6]
N Indicators 2013 year 2014 year 2015 year
1 Logistics costs per 1 thousands ton-
kilometers of freight traffic, UAH 6,9 10,4 12,7
2 -including semi-variable costs, UAH per 1
thousand of km 4,14 6,08 7,37
3 - including conditionally fixed costs, UAH
per 1 thousand of km 2,8 4,4 5,35
4 Logistics costs per 1 customer per year,
thousands of UAH 8,6 13,67 17,43
5 Transportation costs are based on delivery of
1 tone of products, UAH 313,15 480,21 590
6 Logistics costs per 1 km of delivery, UAH 4,5 7,4 9,6
The change of logistics costs structure to the benefit of semi-constant variables, the Table. 3.4.
expresses that the enterprise logistics system altogether has become less flexible and efficient.

41
Figure 3.11.: Cost indicators of the logistics customer service in 2013-2015
It is also indicated by the rising costs of logistics customer service of JSC "Khlibodar": logistics
costs based on 1 customer increased from 8,6 to 17,43 thousand UAH per year, as well as
logistics costs per 1 km delivery rose from 4,5 to 9,6 UAH in 2015.
Against the background of the rising cost of logistics customer’s service, JSC "Khlibodar"
reduced its overall economic efficiency as indicated by the data in graphic 3.12.
8,6
13,7
17,4
4,5
7,4
9,6
0,0
2,0
4,0
6,0
8,0
10,0
12,0
0,0
2,0
4,0
6,0
8,0
10,0
12,0
14,0
16,0
18,0
20,0
2013 year 2014 year 2015 year
UA
H
per
1 k
m o
f d
eli
ve
ry
tho
usa
nd
s o
f U
AH
per
1 c
us
tom
er
per
ye
ar
Logistics expenses per 1 customer for a year, thousands of UAH
Logistics expenses per 1 km delivery, UAH

42
Figure 3.12.: Efficiency of the logistics customer service in 2013-2015 years
At this rate, in 2013, when the amount of yearly income (revenue from the sale) of one customer
was 195 thousands of UAH per year and the price of its logistics services was 8.6 thousand
UAH per year the proportion (share) of logistics costs and delivery of products income was only
4.4%.
At the same time, in 2015, with a median income of sales 250.5 thousands of UAH and the
annual cost of logistics service for one customer at a rate of 17.4 per thousands of UAH per year
the proportion (share) on logistics costs and deliver products in the amount of income has
already accounted for 7%, i.e. it increased by 2.6 percentage points in relative terms.
In view of the above, it states that the increase in the number of customers and the expansion of
the boundaries of the service area, due to the lack of JSC "Khlibodar" optimal route
management system, did not allow to significantly reducing the average distance for the delivery
for one customer. This fact, on the background of a significant increase in the cost, in the first
place, fuel and lubricants increased the price of the logistics customer service and reduce its
economic efficiency.
No less important for JSC "Khlibodar" is a problem of insufficient administrative efficiency of
logistics business processes. In particular, I am mentioning uneven distribution of the load on the
vehicle transport enterprise park while span load indicators (difference between maximum and
22,6 36,0 45,9
511,9555,2
659,3
4,4%
6,5% 7,0%
0,0%
1,0%
2,0%
3,0%
4,0%
5,0%
6,0%
7,0%
8,0%
0,0
100,0
200,0
300,0
400,0
500,0
600,0
700,0
2013 year 2014 year 2015 year
%
Th
ou
sa
nd
s o
f U
AH
Annual costs of logistics per customer, thousands of UAH
Annual income (sales revenues) per 1 customer, thousands of UAH
Share of logistics costs in an income from customer services, %

43
minimum congestion of vehicles on the road transport section) in 2015 reached 100% of the
average load on one vehicle measured in millions tones–kilometers.
Table 3.5.: Indicators of load uniformity on the transport logistics in 2013-2015 [6]
N Indicators 2013 year 2014 year 2015 year
1 The average load per 1 vehicle, mln. of tones-
km* 30 33 35
2 Maximum load per 1 vehicle, mln. of tones-km 42 50 55
3 Minimum load per 1 vehicle, mln. of tones-km 17 19 20
4 Swipe load (max-min), mln. of tones-km 25,0 31,0 35,0
5 Variation of load (range / mean) % 84,0% 93,9% 100,0%
* - The average load is estimated as the total turnover of the whole company’s transport logistics
divided by the number of used vehicles.
Load variation is the ratio of the difference between the maximum and minimum load to average
load on the vehicle 1 across the transport logistics service load variation is estimated as follows:
𝑉𝑎𝑟 =𝑀𝑎𝑥−𝑀𝑖𝑛
𝐴𝑣∙ 100%,
Where, Var – load variation, Max – maximum operational kilometers per 1 vehicle, Min-
minimum operational kilometers per 1 vehicle, Av – average operational kilometers per one
vehicle.
The variation shows how unevenly used transport fleet companies, how equally or unequally
loaded available on vehicles at JSC "Khlibodar" company. The growth of variations in the
company for the years 2013-2015 shows that the load on transport logistics unevenly distributed
and this unevenness is only strengthened.
Quality performance of JSC "Khlibodar" transport logistics is not high enough while for 2013-
2015, it even slightly deteriorated, and it can be seen in the Table 3.6.
Table 3.6.: Quality indicators of the transport logistics in 2013-2015 years [6]
N Indicators 2013 year 2014 year 2015 year
1 Average waiting time of products delivery to
customers, minutes 80 100 110
2 The average delay time of deliveries, minutes 20,0 27,0 35,0
3 Deviation of actual time delivery from the
expected, % 25,0% 27,0% 31,8%
4 The average number of customers, which had
delayed delivery 10 18 38
5 The average frequency of delayed deliveries,
% of customers 2,8% 3,8% 6,8%

44
At this rate, for 2013-2015 years the average delivery latency to customers increased (average
planned time counted from the moment of vehicles departure from the JSC "Khlibodar"
warehouse and prior to vehicles arrival to the customer) from 80 to 110 minutes, i.e. increase of
the waiting time was about 40%.
No less important is the fact, the average delay time of deliveries increased: if in 2013, a delay
was of no more than 20 minutes, it has grown to 35 minutes in 2015. Perhaps, in another
business, this fact would not have been so important but for the bakery business, it is essential.
In addition to growing the actual delivery time deviation from the expected (from 25% in 2013 to
31.8% in 2015), in recent years the increase in the average number of customers which delayed
delivery was observed
So, if in 2013 year, delayed deliveries happened only to 10 customers from a total of 359, in
2015, the corresponding figures were 38 customers from a total of 562. Thus, the average
frequency of delays of deliveries increased from 2, 8% in 2013 to 6.8% in 2015
Figure 3.13.: The average percentage and frequency of untimely performance of the
products delivery to the customers from JSC "Khlibodar" in 2013-2015
In this case, the average frequency of deliveries delay potentially means the percentage of the
lost customers (6.8%) which, being dissatisfied with the quality of logistics services, will stop to
order products from JSC "Khlibodar" and will cooperate with its competitors.
25,0%27,0%
31,8%
2,8%
3,8%
6,8%
0,0%
1,0%
2,0%
3,0%
4,0%
5,0%
6,0%
7,0%
8,0%
0%
5%
10%
15%
20%
25%
30%
35%
2013 year 2014 year 2015 year
Deviation of actual delivery time from the expected %
Average frequency of delayed deliveries, % from the number ofcustomers

45
In this case, the index of unsatisfied customers due to the logistics quality close to the 7%
means a serious threat to the stability of the customer base since with the real loss of such a
large number of customers the company is threatened to decrease the turnover no less than 7.8
mln of UAH. In connection with this state, the work on the improvement of the logistics discipline,
namely the reduction of the average time and average percent delay deliveries, are important
elements to improve business quality.
At the same time as a practical tool to improve the logistics discipline of JSC "Khlibodar", I
consider the introduction of an automated TMS-system, which includes a module mathematical
optimization of route planning including the modules that support the ability to control the
movement of vehicles in-line eliminating any unwanted deviations from the planned schedule.
Table 3.7.: Integrated assessment of the economic efficiency of transport logistics
system (product delivery) in 2013-2015 years [6]
N Indicators 2013 year 2014 year 2015 year
1 Income from sales, mln of UAH 69,83 100.83 140.77
2 Direct cost of sales, mln of UAH 57.6 84.23 118.8
3 Marginal income (N1, N2), mln of UAH 12,2 16.6 22
4 Margin of products (N3 / N2), % 21,20% 19,70% 18,50%
5 Operation costs, mln. of UAH 7,03 12,9 17.36
6 Including the cost of transport logistics, mln. of UAH 3,07 6,5 9,8
7 The share of logistics costs in total operating costs,% 43,8% 50,7% 56,5%
8 The share of logistics costs in profit margins 25,2% 39,4% 44,6%
9 Operating income from the sale of EBITDA (excluding depreciation, tax, %) 13,6% 9,8% 12,1%
10 Operational margin realization, % 7,4% 3,7% 3,3%
It is necessary to point out the fact, the organization of transport logistics in the enterprise is not
rational and effective enough that altogether impacted on the reduction of the main indicators of
operating efficiency which is indicated by a comprehensive assessment of the economic
efficiency of the transport logistics (delivery) of JSC "Khlibodar" in 2013-2015 years, it is seen in
Table 3.7.
As evidenced by the above data of Table 3.7, despite the marginal increase in income from the
sale of bakery products which increased from 12,2 million of UAH to 22 million of UAH for 2013-
2015, a more rapid increase in operating costs including the logistics reduce the rate of JSC

46
"Khlibodar" operating efficiency. Thus, total operating expenses during this period increased
from 7,03 million of UAH to 17,36 million of UAH, logistics costs have increased even more
rapidly - almost in 3 times from 3,07 in 2013 to 17,36 million of UAH in 2015.
Figure 3.14.: The performance indicators of JSC "Khlibodar" activity in 2013-2015
As a result, operating income from the sale of EBITDA (excluding depreciation, % and taxes) not
only increased but decreased from 13.6 million of UAH in 2013 to 12.1 million of UAH in 2015.
Operating margin realization, i.e. the ratio of EBITDA to gross income from the sale of bakery
products has decreased from 7.4% for this period in 2013 to 3.3% in 2015.
A significant growth of the enterprise logistics costs associated of which a lack of efficiency of
logistics management - low level of automation, the lack of optimization and the use of modern
means of technical control of vehicles moving became one of the reasons of the decrease in
operating efficiency indicators of JSC "Khlibodar".
12,2
16,6
22,0
13,6
9,8
12,1
7,4%
3,7%3,3%
0,0%
1,0%
2,0%
3,0%
4,0%
5,0%
6,0%
7,0%
8,0%
0,0
5,0
10,0
15,0
20,0
25,0
2013 year 2014 year 2015 year
%
mln
of
UA
H
Marginal income of sales, mln. UAH
Operating income from the sale of EBITDA (excluding depreciation, % and taxes)
Operating margin of sales, %

47
Figure 3.15.: Logistics costs in the relation to operating costs and profit margins of JSC
"Khlibodar"
Thus, according to Figure 3.5., the share of logistics costs in total operating costs of the
company increased from 43.8% in 2013 to 56.5% in 2015, as well as the share of logistics costs
in the profit margin increased from 25.2% in 2013 to 44.6% in 2015.
Thus, I can state that in the transport logistics management system of JSC "Khlibodar" there are
many shortcomings that require solutions. First, I am talking about the absence of specialized
enterprise TMS - systems that automate and optimize all logistics business processes based on
modern information technology, mathematical models and means of technical control traffic. The
following section of this study will be devoted to the possibilities of implementation of such a
system as well as the assessment of the expected economic impact for the company the
following section of this study will be devoted.
2013 year 2014 year 2015 year
43,8%
50,7%
56,5%
25,2%
39,4%44,6%
Share of logistics costs in total operational costs,%
Share of logistics costs in marginal income, %
48
3.3. Optimization of transportation logistics and assessment of the proposed measures effectiveness
Thus, in accordance with the previously identified problems of JSC "Khlibodar" logistics, the
focus of the transport logistics optimization is to implement automated solutions of RS.TMS
ASTOR.
The goals of the system are to automate business processes of JSC "Khlibodar" transport
logistics, to make them "transparent" in real time and as a result, to ensure compliance with the
specified quality standards [17]. The purpose and main functions of the system are to build an
effective delivery system of products to final customers, which will allow:
o to monitor the implementation of the route of delivery;
o to increase the speed and accuracy of delivery planning;
o to minimize the human factor in the planning of delivery;
o to take into account the physical characteristics of the goods and the influence of external
parameters on the entire transportation process.
List of logistics business processes of JSC "Khlibodar" to be automated:
o Collection and processing of orders.
o Delivery Scheduling.
o Adjustment of the calculation results.
o Support of routing (monitoring).
Subsystems RS.TMS subjected to revision [7]:
1) Order Management.
o Download and order processing, integration with baseline accounting system
o Group management and order processing
2) Management services.
o The classification of service areas.
o Schedule service of delivery points.

49
o Efficient monitoring of vehicles.
3) Resource management.
o Planning the availability of resources (vehicles, personnel).
o Analysis of the actual use of resources (including the working time table)
Figure 3.16.: The general scheme of transport logistics information system at JSC
"Khlibodar" [7]
The goal of transport logistics is the formation of the efficient delivery system of goods from the
production for the end customer.

50
- Mandatory system’s modules;
- External systems;
Figure 3.17.: Composition of the info system RS TMS ASTOR [7]
The main objective of the JSC "Khlibodar" transportation logistics is to deliver goods:
o To the right place
o At the right time
o In safe keeping
o With the minimum cost (optimal route, optimal fleet selection);
Implementation of RS.TMS allows most effectively perform the following processes:
1.1 Module:
Computation and
optimization
1. The main system
RS.TMS ASTOR
1.2 e-Cards
3. GPS-monitoring
system
2. Baseline
accounting system
4. WMS system
Booking
Delivery Planning
Baseline accounting system
Available resources

51
Figure 3.18.: Technological scheme of RS. TMS.ASTOR processes
Operation territory (geographical zone). The right geographical zoning ensures the most
effective delivery planning, it allows to avoid intersecting delivery points on routes. The analysis
of the (current) geographical delivery zones of JSC "Khibodar" helps to understand that route
has intersecting points, which significantly decrease the transport usage efficiency therefore it,
increases logistics expenses.
Figure 3.19.: Structure of the internal table “Geographical classificator“ [7]
Packaging
Loading
RS.WMS
Classificator <name 1>
Project <name 1>
<>
Operation
territory
<name 1 >
Weekday <
nam
e 1
>
Weekday <
nam
e 2
>
Project <name 2>
<>
Delivery flow <name 1>
<>
Delivery flow <name 2>
<>
Weekday <
nam
e 3
>
Operation
territory
<name 1 >

52
It is proposed to perform geographical zoning of delivery at the first stage of RS. TMS
implementation. It will allow creating the foundation for the efficient transport logistics
composition. Moreover, there are constant changes in the content of delivery points at the
territory, in consequence of; it is required to actualize the data of delivery zones periodically.
The main parameters [17]:
o Priority – it allows defining the order of territory zones processing under automatic
delivery planning. It can be used in the case of territory arranging necessity by the level
of priority.
o Servicing order – it allows to define the order processing within the priority. It is used in
the case of order fixation processing necessity under automatic delivery planning.
o Vehicle average speed – it allows to define vehicle average speed by weekday and time
intervals.
o Prime means of transport, driver – it allows to fix the certain transport and driver to the
assigned territory.
Points of delivery. The points of delivery are very important part of TMS and contain the key
information for its functioning.
The main parameters:
o Delivery address – contains the address of delivery point. The filling correctness define
the correctness of GPS specifications – object coordinates, in case of filling mistakes the
system doesn’t calculate the service order of delivery point.
o Priority – allows to define order processing under the automatic delivery planning. It can
be used in the case of territory arranging necessity by the level of priority or other
characteristics. In practice, it is applied when there is a need to emphasis the most
important clients from the business point of view for which the main factors are the
following:
Right on time delivery;
Right quantity delivery
In many retail networks, there are possible penalties or late payment delivery in case of
conditions non-compliance. As the result, the selection of higher level of priorities will allow
define the most important clients therefore service them at first instance.

53
It is proposed to introduce a mechanism of priorities in the client’s accounting system. It will
optimize processes in terms of transportation logistics and warehouse logistics [18].
o Delivery point – defined as the point at which loading processes is held and considered as
the starting point of the truck route.
o Route order – it allows to fix the order of the points within the territory (zones).
o Time schedule of delivery points – it allows to define the time slot and service duration by
the weekdays.
Currently, there is no time schedule for delivery point. Therefore, at the first stage of
implementation, there is a high need to coordinate a time schedule with existing clients and
introduce defined rules for the time schedule during the signing contacts with clients either
during addition of new delivery points.
Transportation vehicles. It contains a list of vehicles (mainly trucks) which are used for delivery.
The vehicle is a key resource for the delivery planning, contains the necessary parameters and
limits for the calculation.
The main parameters [7]:
o Capacity m3 – contains TC capacity by volume.
o Payload kg - TS payload contains, by weight.
This parameter will be used as the main constraints in the automatic delivery scheduling.
o Number of loads – a vehicle contains a restriction of capacity in cargo areas.
o The main driver - if necessary use a fixing the driver of the vehicle.
Moreover, the parameters can be used for the calculation of planned fuel costs, costs for
maintenance operations and current condition of vehicle.
If necessary, it is possible to keep a record of hired vehicles [7]:
o Billing operations
o Settlements with transport companies
o Planning of hired transport accessibility

54
It can be performed both a full automatic and certain areas of service calculations. After the
calculating, the logisticians need to check the adequacy of the delivery calculation. It is
necessary to check:
o The correctness of the visit’s order to delivery points
o The correctness of the chosen vehicle.
Moreover, the parameters can be used for the calculation of planned fuel costs, costs for
maintenance operations and current condition of vehicle.
If necessary, it is possible to keep a record of hired vehicles:
o Billing operations
o Settlements with transport companies
o Planning of hired transport accessibility
o Billing operations
o Mutual settlements with other transport companies
o Planning of rented transport accessibility
Main parameters of the customer’s order:
o Date of delivery – planning date of delivery to the point of delivery.
o Address of delivery – contains address of the delivery destination
o Priority – filled from the point of delivery or arbitrary method.
o Interval of planning – filled in the order depending on the time of arrival or arbitrary
method.
o Weight, kg - contains the weight of an order
o Volume, m3 – contains the volume of an order
o The time window – the time window, in which you need to deliver the goods, taken from a
graph or filled arbitrarily.
o The time service – time for unloading at the point of delivery.
For effective resource planning, it is proposed to:
o Perform binding of drivers to cars (currently such binding implemented partially).
o Resource planning to produce based on the completed drivers schedule.

55
o Perform the binding of transport to the territories to perform based on the weight and
volume of the ordered products.
Depending on the volume of orders, some cars can be fixed on particular areas. If there is the
lack of resources, more cars can be passed on priority areas. It will be able to adjust the
schedule depending on the current situation.
The main reasons of corrections:
o Absences of driver
o Vehicle Damage
o Increasing the volume of orders leads to the involvement of hired transport.
If necessary, it will be possible to schedule the availability of hired transport. The main method of
delivery planning is encouraged to use the "automatic planning". For the successful
implementation of automatic calculation requires correct filling of the basic data [7]:
o GPS-position of the delivery points
o Available resources (staff, transport)
o Parameters of the customers' orders
It can be performed a full automatic calculation as well as calculation of certain areas of service.
After calculating, the logisticians need to check the adequacy of the calculation of delivery.
The following parameters must be checked:
o The accuracy of the order of visits to delivery points
o The accuracy of the chosen vehicle.
o In the second stage of implementation, we offer to pay maximum attention to this process.
o After automatic delivery calculation, there is the possibility of correcting the results.
o Removal of one or more orders from the route
o The transfer of orders between routes
o Combining multiple routes into one
o Delete all or part of the route
o Recalculation of the sequence point to a point at one or more routes
Manual planning method can be applied in cases when there is no need in automatic
calculations the shipping. Priority visiting point’s logistician fills itself. It applies to:

56
o When the next visit to the points agreed directly with the client.
o When this function takes over the driver.
It is highly suggested to use manual planning as a minimum in order to decrease human factor
as well as there is a function to adjust route conditions after automatic calculations, if it is
needed.
As to the cost-effectiveness of the implementation RS.TMS ASTOR system, it mainly consists of
two components:
1) Direct economy of the operating costs in the delivery of products to customers (in terms of
variable costs) by reducing such parameter as "distance covered by delivery based on 1
customer."
So, at the moment this option is 1.81 thousand kilometers per year (or 452.5 km per 1st quarter),
it is the average distance that transport means zooms to ensure a continuous supply of bakery
products to its customers. This logistics costs (per 1 km of delivery) consists of 10.12 UAH
including variables costs - 58.7% of this amount or 5.94 UAH per 1 km. According to my
estimates, the introduction of RS.TMS ASTOR will reduce this figure as "Covered distance
delivery per customer 1" by 25% due to the exclusion of routes, crossing the proper zoning and
calculating the optimum routes with the help of mathematical optimization model. In this case,
according to the estimates, "the distance covered by delivery per customer 1" after the
implementation of the information system will be 1,448 thousands of tons. Expected savings in
operating costs for the delivery of products for JSC "Khlibodar" (year and quarter) are presented
in Table 3.8
Table 3.8: Expected savings in operational expenses for the products delivery after
the introduction of RS.TMS ASTOR system
N Indicators
Before RS.TMS АSТОR
implementation
After RS.TMS ASTOR
implementation
1 Covered delivery distance based on 1 customer, thousands of km per year 1,81 1,44
2 Direct variable costs per 1 km of delivery, UAH* 5.94 5.64
3 The number of customers of the enterprise * 562 562
4 Direct variable delivery costs, thousands of UAH per year 6042 4834
5 The amount of annual savings from direct delivery costs, thousands of UAH 1 208,4
6 The amount of quarterly cost savings on delivery, thousands of UAH 302
57
* For the correctness of the assessment and comparison of direct variable cost of 1 km of
delivery and the number of enterprise customers it was assumed to be equal before and after
the introduction of RS.TMS ASTOR.
The amount of savings in operating costs from the implementation of the system RS.TMS
ASTOR by minimizing distances for product delivery to customers is estimated as follows:
Е = (𝑇 − 0,75𝑇) ∙ 𝐾 ∙ 𝑃𝑖
E - transaction costs economy, T – covered the distance of delivery per 1 customer per year
(according to 2015), 0,75T - covered the distance of delivery based on 1 customer after the
implementation of the program, which will reduce the distance to 25% from the level of 2015. K -
The number of customers, PI - variable costs of the delivery per 1 km.
Calculations show that the introduction of automated transport logistics management system
RS.TMS ASTOR and with the maintaining of the number of customers and the value of the
variables at the level of costs in 2015 JSC "Khlibodar" can reduce the direct variable cost of
delivery from 6042 thousands UAH to 4834 thousands UAH. The amount of direct savings on
variable costs for the delivery will be 1 208.4 million of UAH per year or 302 thousands UAH per
quarter.
2) Potential savings of the income due to the loss of non-customers who are dissatisfied with
the level of logistical service company.
The second component of the commercial program RS.TMS ASTOR is to reduce the expected
delivery time of products and decrease deviation from the expected level (delays or arrears).
The ultimate goal of these activities is to low such rate as the average number of customers
which delayed delivery such as customers , the candidate number 1 in cooperation with the gap
of JSC "Khlibodar"
Thus, according to 2015, the average waiting time of products delivery by customers reached
110 minutes, and the average delay time - 35 minutes (about 31% of the expected time). In
average, at least 38 customers from the total number had 562 regularly delayed delivery, i.e. the
average percentage of delayed deliveries reached 6.8%. It is the group of customers, which are
now extremely dissatisfied, with the transport logistics of JSC "Khlibodar".
To neutralize the existing problems in the sphere of transport logistics of JSC "Khlibodar", it is
necessary to use a functional RS.TMS ASTOR as a subsystem of "Delivery planning", (module
"delivery plan – routing creation"). Also, a subsystem “Calculation and Optimization" (calculation
of the optimal route of delivery points) as well as the subsystem "Accompanying routings" that

58
will allow GPS-monitoring of traffic and monitor the actual adherence of the drivers and
forwarders formed delivery schedule
According to my estimates, the introduction of RS.TMS ASTOR will reduce the average waiting
time of the order of 70 minutes, reduce the permissible delay time to 10 minutes (the deviation
will be 15% of the expected time). Thus, it is expected that with the implementation of automated
transport logistics management system will be possibility to reduce the delivery waiting time from
the current 35 minutes (data 2015) to 10 minutes. Such estimates are based on the experience
of the company-developer, which is already implementing their product at the enterprises of
similar profile (bread and bakery products) and achieved the desired results there, including the
reduction of the delivery waiting time and time delays.
With regard to the average percentage delay deliveries, I assume that it will decline by 0.5% on
a quarterly basis.
Based on the presented data, in Table 2.9 is presented the forecast of the expected effect of
RS.TMS ASTOR system implementation because JSC "Khlibodar" will be able to increase
customer satisfaction with the logistics services, while maintaining its customer base and sales.
Table 3.9: The assumed increase of customer satisfaction from
logistics services due to the proposed implementation of RS.TMS ASTOR
N Indicators
1st
quarter
2nd
quarter
3rd
quarter
4th
quarter
Total for a
year
1 Number of customers* 562 562 562 562 562
2
The average percentage of
delayed deliveries,% 6,30% 5,80% 5,30% 4,80% 4,30%
3
The number of customers, which
can be lost due to poor logistics 35,4 32,6 29,8 27,0 -
4
Revenue from sales per 1
customer 1, thousands of UAH
per quarter 62.61 62.61 62.61 62.61 250.4817
5
Savings by preventing the loss
of customers, thousands of UAH 175.95 175.95 175.95 175.95 703.85
* For the correctness of the assessment and comparison of the number of direct customers of
the enterprise and the income from sales by one customer were assumed to be equal before
and after the introduction of RS.TMS ASTOR
Expected cost savings at JSC "Khlibodar" (by avoiding the loss of income) is estimated as
follows:
Е = 𝐾 ∙ 𝐷 ∙ 𝐼

59
K - number of customers served by the JSC "Khlibodar", D - the average percentage of delays in
delivery, charge a percentage of dissatisfied customers, which can be lost (on a quarterly basis
is reduced by 1%), I - the average income from the sale of products based on 1 customer.
The calculations show, due to the introduction of automated transport logistics and management
system RS.TMS ASTOR, the quality of logistics customer service will increase and JSC
"Khlibodar" will possibly receive quarterly effect 185 thousand of UAH by preventing the loss of
customers and reduce the percentage of the average deliveries delay by 0.5% on a quarterly
basis.
The amount of such effect for the year will amount to 740 thousands of UAH, which again points
to the cost-effectiveness and feasibility of the implementation of automated solutions for
transport logistics management by RS.TMS ASTOR.
3.4. RS. TMS ASTOR performance capabilities
exemplification in case of route planning and
management
The optimization of logistics costs is one of the most important challenges, which retail networks
are facing today. The increase in profit, increasing number of customer, reducing costs are
possible to achieved by the correct organization of logistical processes. The vehicle fleet is an
essential part of the company's logistics infrastructure. The transport management system
represents the complex relationship between the company’s resources, the environment and the
human factor. The system of transport management ASTOR: TMS is designed to automate,
orders reporting and management, its distribution within available transport capacity and to
control the use of vehicles, in order to increase efficiency and reduce costs [7].
RS.TMS ASTOR system is designed to eliminate the problems concerned with [7]:
o The excess mileage of transport fleet
o The excessive overspendings of fuels and lubricants
o The excessive travel time

60
RS.TMS ASTOR system allows automatically to allocate optimally the available orders for
delivery, taking into account all the parameters: characteristics of the delivery points, the
characteristics of the available means of transport, routes restrictions, etc. The specifics of
RS.TMS is that the system offers zoning function of operation territory. It divides the operation
territory by conditional areas. It connects each zone with certain transport mean. It includes the
restricted areas and zones for vehicles if there is any complications on a road, as well as it
helped to provide with the better solution of route if there is high level of traffic. There are 4
algorithms used for the routing calculations, which are: greedy algorithm, ant colony algorithm,
branch and bound algorithm and enumeration method. The maximum economical effect from the
TMS usage can be with the integration of transport monitoring system. There are two options of
GPS/GLONASS monitoring with the use of regular mobile technology as well as with the use of
specialized GPS/GLONASS technologies. As well as the quick integration of TMS with corporate
management system and integration with internal system RS.WMS. Moreover, the integration of
TMS with mobile navigators for vehicles, where the routes planning are inserted. The integration
with monitoring systems of transport means, where it is possible to track through GPS the
parameters of the on-going route[7]:
o Coordinates;
o Stops;
o Fuel level;
The control of the deviations in routes:
o The sequence of delivery points;
o Delivery delays;
o Actual delivery time at delivery points;
Thus, it is possible to calculate the most cost-effective routes for each order.
The next step is to highlight my practical part concerning the route establishment for the
company in Zaporizhia.
First, it should be note that the calculation execution involves the initial data in EXCEL format.
In order to achieve reliable route planning, initial data is required, which is the following:
o a list of used vehicles, experts use an EXCEL file, such as data base of JSC "Khlibodar";

61
o List of customer’s addresses, which are divided by territory zones such as City, City1,
City2, also, experts use an EXCEL file with initial data.
o Information about delivery points, which includes customer’s time availability for receiving
goods defined by hours.
o Warehouse ramps information.
The order of routing calculation is the following:
1. The required initial data is uploading to RS. TMS ASTOR database in the format.
a) The data from the file, which is name as “vehicle fleet.xls”, in my case, is uploaded to the
internal table division “Transport means” of RS.TMS ASTOR system. The required fields
for the calculation are “Truck type”, “Registration number”, “Loading capacity”, which is
expressed below.
Table 3.10.: Data from the file “vehicle fleet.xls”
Truck Trailer
type
Registration Number Load capacity
Canter АR 759З PP 1,6
Canter AR 9876 KK 1,665
Canter AR 6352 OO 1,665
Canter AR 8276 HH 1,665
Canter AR 1654 CC 1,665
Canter AR 7824 EC 1,665
Canter AR 8193 AD 1,665
Canter AR 0981 CA 3,08
Canter AR 4536 DO 3,08
Canter AR 9810 TA 3
Canter AR 7651 OX 2,2
b) After, expert uploads data from the file, in my case, named as "trial routings.xls" to the
internal table division of RS.TMS ASTOR system: "Points of Delivery", the following data
is necessary for the further routing calculation: "Customer’s addresses”, "Delivery Points".

62
Table 3.11.: Example of initial data from the “trial routings.xls” of a company
Customer Customer’s addresses Delivery Points
Consigliori
LLC
Consigliori LLC, Karpenko-Kary
Str. 27A, Zaporizhia region
Karpenko-Kary Str. 27A,
Zaporizhia region
Globus LLC Globus LLC, Virobnicha Str. 82,
Zaporizhia
Virobnicha Str. 82, Zaporizhia
Breeze LLC Breeze LLC, Sadivnitstva Str. 13,
Zaporizhia
Sadivnitstva Str. 13, Zaporizhia
Rolls
LLC
Rolls LLC, Elevatorna Str. 2a,
Zaporizhia
Elevatorna Str. 2a, Zaporizhia
ATB
LLC
ATB LLC, Chumachenko Str.4,
Zaporizhia
Chumachenko Str.4, Zaporizhia
Silpo
LLC
Silpo LLC, Pzhevalskogo Str.16,
Zaporizhia
Pzhevalskogo Str.16, Zaporizhia
Spar
LLC
Spar LLC, Verbova Str. 35,
Zaporizhia
Tehnіkumіvska Str. 35,
Zaporizhia
Atlantics
LLC
Atlantics LLC, Ferosplavna 10,
Zaporizhia region
Balabin, Zaporizhia region
Next, the system RS.TMS ASTOR accumulates data into the following format:
Table 3.12.: Database of customer’s delivery points exemplification
Delivery Points (TMS) Territory
Type of delivery
points
Karpenko-Kary Str. 27A, Zaporizhia region City Delivery point 1
Virobnicha Str. 82, Zaporizhia City Delivery point 2
Sadivnitstva Str. 13, Zaporizhia City Delivery point 3
Elevatorna Str. 2a, Zaporizhia City Delivery point 4
Muzichna Str. 2a, Zaporizhia City Delivery point 5
Chumachenko Str.4, Zaporizhia City Delivery point 6
Pzhevalskogo Str.16, Zaporizhia City Delivery point 7

63
Table 3.12.: Database of customer’s delivery points exemplification
Urytskogo Str. 35, Zaporizhia region City Delivery point 8
Ferosplavna 10, Zaporizhia region City Delivery point 9
Shevchenko Str. 88, Nikopol City1 Delivery point 10
Svetlyanska Str.44, Nikopol City1 Delivery point 11
Povedy Ave. 90, Nikopol City1 Delivery point 12
Zdolbunivska Str. 7, Dnipropetrovks City2 Delivery point 13
Kirovohradks Str.13, Dnipropetrovsk City2 Delivery point 14
Kuibysheva Str.15, Dnipropetrovks City2 Delivery point 15
The indicated table “Database of customer’s delivery points” includes City which is Zaporizhia or
Zaporizhia region, City1, which is Nikopol and City2, which is Dnipropetrovsk, what system uses
for further creation of the geographical zones in the initial table of RS.TMS ASTOR system.
Then, the system offers to select the required city with reference code. The indicated table
consists of different territories, but further example of routing calculation only covers City, which
is Zaporizhia and Zaporizhia region.
c) The next step is to fill in delivery points, which includes customer’s time availability for
receiving goods defined by hours. Into the system it is inserted manually or it is possible
to upload excel file with initial data.
For each customer’s address, it is set a sign of "active point". Delivery schedule expresses the
time whenever a customer is ready to receive goods. Service Time – it is average time of goods
unloading per each delivery point.

64
Table 3.13: Delivery points exemplification in RS.TMS ASTOR
Delivery points (TMS)
Entitlement: Karpenko-Kary Str. 27A, Zaporizhia region Type: Delivery
point
Сontractor: Сommercial network Code 11111512
Main Delivery Schedule
Delivery
Schedule
№ Weekday Starting Time Ending
Time
Service
Time
Addresses 1 Monday 08:00:00 15:00:00 20:00
2 Tuesday 08:00:00 15:00:00 20:00
3 Wednesday 08:00:00 15:00:00 20:00
4 Thursday 08:00:00 15:00:00 20:00
5 Friday 08:00:00 15:00:00 20:00
6 Saturday 8:00:00 11:00:00 20:00
d) Further, warehouse ramps information is also inserted to the initial table division of
RS.TMS ASTOR system “Ramps schedule”. The warehouse contains three ramps with
different opening hours. The loading capacity is the same at all three ramps.
Table 3.14: Ramps schedule exemplification
Opening Hours
Ramp 1
N Weekday Starting
Time Ending Time
1 Monday 6:00:00 12:00:00
2 Tuesday 6:00:00 12:00:00
3 Wednesday 6:00:00 12:00:00
4 Thursday 6:00:00 12:00:00
5 Friday 6:00:00 12:00:00
6 Saturday 6:00:00 12:00:00

65
Table 3.14: Ramps schedule exemplification
Ramp 2
1 Monday 07:00:00 13:00:00
2 Tuesday 07:00:00 13:00:00
3 Wednesday 07:00:00 13:00:00
4 Thursday 07:00:00 13:00:00
5 Friday 07:00:00 13:00:00
6 Saturday 07:00:00 14:00:00
Ramp 3
1 Monday 08:00:00 16:00:00
2 Tuesday 08:00:00 16:00:00
3 Wednesday 08:00:00 16:00:00
4 Thursday 08:00:00 16:00:00
5 Friday 08:00:00 16:00:00
6 Saturday - -
e) Next, an expert manually enters loading point, in my case, it is a warehouse at Verhnya
Str. 1, Zaporizhia city and picks up the customer’s addresses, which are already in a
system in order to map a route, the example highlighted in table below.
2. System matching of delivery points with a map ( geocoding)
In order to match delivery points with a map, the system RS. TMS ASTOR uses process as
“Objects geocoding”. Estimation of GPS coordinates is done with the help of function “Define
GPS-coordinates by addresses”. To make sure that the system has defined it properly, it is
possible to check with the function “Delivery points check”. Next, the delivery points appear on
the visual map.
During the check, an expert should control the delivery points draugntsmanship.
3. Route calculation
For route calculation, the function “Delivery planning” is used.
The main steps of Route planning in RS. TMS ASTOR are indicated below:
1) User selects the function “Start delivery planning”.

66
2) To select territory “zones” for which calculation is needed, in my example “City” is used, it
includes delivery points in Zaporizhia and few in region.
3) The function “Perform calculation” is used to execute routing planning.
4) The system enquire information about available current orders chosen by delivery points
from selected territory, which is currently considered, it includes following information:
delivery points, order volume, weight, and number of pallets.
5) Taking into account the orders volume, the system picks up the optimal available
transport mean.
6) The system in online mode requests from online provide “yandex.ua” the information
about current traffic on roads and, moreover, the forecasted traffic during which the route
is being carried out selected by the territory zone. The provided traffic information is pre-
paid by the company to “yandex.ua”, therefore, there is no free access to that which can
be shown here as exemplification.
7) After combing the required information mentioned above, the system automatically
creates a route plan.
8) An expert can check and analyze the delivery point’s order, which is also visualized with
the map, example shown below.

67
Figure 3.20.: Delivery route with point’s exemplification.
9) As the result of this calculation is the route sheet which contains all possible information
about the planned route: order creation and number, delivery points, customer’s
addresses, arrival time and departure time of a vehicle, distances between delivery
points, order volume and load, other information for freight forwarder. The example of
route sheet is shown in Table 3.15.

68
Table 3.15.: Route sheet exemplification
N Orders
foundation Delivery Points Customer's addresses
Delivery Schedule
Arrival Time
Unloading Time
Departure Time
Distance (km)
Volume (m3)
Weight (kg)
1
Order №567 from 17.03.2016
Salo A.A., Consigliori LLC, Karpenko-Kary Str. 27A, Zaporizhia
region
Karpenko-Kary Str. 27A,
Zaporizhia region
7:00:00 - 12:00:00 6:58:00
20 7:20:00 10 1,2 17,82
2
Order №568 from 17.03.2016
Tsoy K.M., Globus LLC, Virobnicha Str.
82, Zaporizhia Virobnicha Str. 82, Zaporizhia
6:00:00 - 14:00:00 5:55:00 20 6:15:00 1,15 0,56 5,62
3
Order №565 from 17.03.2016
Akimova T.T,Breeze LLC, Sadivnitstva Str.
13, Zaporizhia Sadivnitstva Str. 13, Zaporizhia
8:00:00 - 15:00:00 8:01:00 22 8:23:00 2,7 0,7 6,96
4
Order №572 from 17.03.2016
Nebo O.O.,Rolls LLC, Elevatorna Str. 2a,
Zaporizhia
Elevatorna Str. 2a, Zaporizhia
9:00:00 - 12:00:00 8:59:45 24 9:24:00 3,4 0,084 8,43
5
Order №561 from 17.03.2016
Hmara P.P, Cookie LLC, Muzichna Str.
2a, Zaporizhia
Muzichna Str. 2a, Zaporizhia
7:30:00 - 13:00:00 7:29:00 20 7:50:00 2,9 0,33 3,33
3,08 42,16

69
3.5. Implementation of an automated transport logistics and management system
The procedure of implementation of the automated transport logistics RS.TMS ASTOR
management system assessed as a management project, in which there should be a close
cooperation and interaction of the participants. There will be a Group A - representatives of the
company-developer of the system of "ASTOR", which will present the representatives of JSC
"Khlibodar" basic version of RS.TMS ASTOR system, to become familiar with the business
processes and logistics functions of JSC "Khlibodar", based on which they are adapting the
basic version of the product under the business specifics of JSC "Khlibodar". In addition,
representatives of "ASTOR" within the framework of this project will be obliged to perform the
following plan of actions:
o presentation of future system project, its discussion with the representatives of JSC
"Khlibodar", amendments;
o further development of the company-developer of amendments, according to the
requirements of JSC "Khlibodar";
o presentation of the final version of the system, making the final amendments;
o adjustment of automized working stations by representatives of the developer company;
o Testing of automized working stations operation, configuration, system configuration,
functionality and refinement of the interface;
o training of personnel of JSC "Khlibodar" with the future system;
o The final debugging and system start-up project.
Group B - representatives of JSC "Khlibodar". In order to perform the project system
implementation at JSC "Khlibodar" working group will be formed, which will come out from the
following employees:
o Director of JSC "Khlibodar"
o Chief Financial Officer
o IT-Director
o Head of Logistics Department
o Programmer
o Employees of Logistics Department

70
Team Leader - the general manager of the project – will be fully responsible for the overall
successful implementation of the project, which is understood as the implementation of all
project activities in full and a full launch of RS.TMS ASTOR system in a timely manner. The
sequence of the individual phases of innovative projects, as well as their duration (in weeks)
are presented in Table 3.16.
Table 3.16: The sequence of phases of the project and the duration of their performance
Project stages Duration, weeks
1 Preliminary meeting with the developer, product presentation, a decision on the choice of system
1
2 Familiarization with business processes by JSC "Khlibodar" representatives, familiarization with enterprise requirements, collection of
requirements to the system functionality
2
3 Development and presentation the future system by developer, amendments discussion with the representatives of JSC "Khlibodar"
4
4 Further development of the company-developer of amendments, according
to the requirements of JSC "Khlibodar";
3
5 Presentation of the final version of the system, making the final
amendments;
1
6 The acquisition of necessary additional equipment, software and peripherals to configure the system
2
7 Adjustment of automized working stations by representatives of the
developer company;
1
8 Testing of automized working stations operation, configuration, system
configuration, functionality and refinement of the interface;
1
9 Training of personnel of JSC "Khlibodar" with the future system; 2
10 Final debugging and system start-up project. 1
Total project duration 18
In accordance with the schedule, the total duration of the innovative project, from the initial
meeting with the representatives of the potential executive "ASTOR" and to full training and
implementation of the system, I suppose will be around 18 weeks, i.e. about 4.5 months.
According my calculations, the longest parts of the project are the development and presentation
of the future system by developer (based on the base versions of the program, taking into
account JSC "Khlibodar" peculiarities of the business processes), a discussion with the
representatives of JSC "Khlibodar" and terms of reference amendment, I suggest the duration of
this phase will be 4 weeks.

71
Table 3.17.The planned schedule of innovative project implementation at JSC "Khlibodar"
Project stages
Weeks
1 2 3 4 5 6 7 8 9 10 11 12 13 14 15 16 17 18
1
Preliminary meeting with the developer, product presentation, a decision on the
choice of system
2
Familiarization with business processes by JSC "Khlibodar" representatives,
familiarization with enterprise requirements, collection of requirements to
the system functionality
3
Development and presentation the future system by developer, amendments
discussion with the representatives of JSC "Khlibodar"
4
Further development of the company-developer of amendments, according to
the requirements of JSC "Khlibodar"
5 Presentation of the final version of the system, making the final amendments
6
The acquisition of necessary additional equipment, software and peripherals to
configure the system
7
Adjustment of automized working stations by representatives of the developer
company
8
Testing of automized working stations operation, configuration, system
configuration, functionality and refinement of the interface
9 Training of personnel of JSC "Khlibodar"
with the future system
10 Final debugging and system start-up
project

72
During the system processes, implementation company-developer will perform most of all the
work. At the same time, JSC "Khlibodar" staff also will take part in several stages of the project
implementation, in connection with which the company incurs certain costs. For example, in
Table 3.18 are presented calculated hourly rates for staff salaries which will taking part in the
project, and Table 3.19 presents a schedule of their participation in the project (by the hour in
the context of the stages) and mine supposed calculation of the total labor costs of personnel for
enterprise.
Table 3.18.: The approximation of employee’s hourly rates who will take part in the
project
№ Occupation Hour rate per
employee, UAH
1 Director of JSC "Khlibodar" 400
2 Chief Financial Officer
350
3 IT-Director 300
4 Head of Logistics Department 350
5 Programmer 300
6 Employees of Logistics Department 200
* The payment for labor is established in accordance with the hourly payment rates of
employees at JSC "Khlibodar" - according to the payroll in 2015 year.
Table 3.19.: Plan-Graphic of employee’s possible involvement in project implementation
and labor costs
N Project phases
Dire
cto
r o
f JS
C
“Kh
libod
ar”
Ch
ief
Fin
an
cia
l
Offic
er
IT-D
ire
cto
r
He
ad
of
Log
istics
De
pa
rtm
en
t
Pro
gra
mm
er
Em
plo
yee
s o
f
Log
istics
De
pa
rtm
en
t
Tota
l, U
AH
*
In hours
1
Preliminary meeting with the developer, product presentation,
a decision on the choice of system
4 4 5 3
2700
2
Familiarization with business processes by JSC "Khlibodar" representatives, familiarization with enterprise requirements,
collection of requirements to the system functionality
2 2 2 7
1920

73
Table 3.19.: Plan-Graphic of employee’s possible involvement in project implementation
and labor costs
3
Development and presentation of future system by developer,
amendments discussion with the representatives
12 12 12
5520
4
Further development of the
company-developer of
amendments, according to the
requirements of JSC "Khlibodar"
10 6 20
5720
5
Presentation of the final version of
the system, making the final
amendments
2
2 2 2
1320
6
The acquisition of necessary
additional equipment, software
and peripherals to configure the
system
2 2 5 5
2220
7
Adjustment of automized working
stations by representatives of the
developer company 10 10 10 3800
8
Testing of automized working
stations operation, configuration,
system configuration, functionality
and refinement of the interface
1
3 10 10
3540
9
Training of personnel of JSC
"Khlibodar" with the future system 3 5 25 3660
10
Final debugging and system start-
up project 5 5 5
2300
Total 2200 1280 7920 7560 10240 3500 32700
*It was calculated in accordance with the hourly payment rate of employees, Table 3.18., and
due to my proposition, the amount of hours during which each employee will take part in the
system implementation process
The total budget of project implementation will cost 358.7 thousands of UAH, according to the
price list of a company-developer. Thus, the cost of the system itself RS.TMS ASTOR is 250

74
thousand of UAH, however, due to the agreement with the developer company, JSC "Khlibodar"
can pay this amount in equal installments during the first 10 months of the project, during
development and when the system still in refining mode.
Labor costs amount comprise of 32,7036 thousands of UAH, calculations are presented in the
Table 3.18, another 76 thousands if UAH will be needed to spent on the purchase of additional
equipment and peripheral equipment which are server housing, commutator, frame relay access
device, Wi-Fi router, cables, voltage regulator, including 50 thousands of UAH during 12th week
of project and another 26 thousands of UAH - in the 13th week.

75
4. Conclusion
In the present master’s thesis, it was analyzed the business activity of the bakery company JSC
“Khlibodar”. It is major player in Zaporizhia region at the bakery market. Therefore, it was
important to analyze consumer’s groups, which are served by the company. There are two: B2C,
which represented by the companies of HoReCa field and B2B are represented by private
organizations such as private hospitals, recreational organizations. Each of the groups has its
own specifics and in order to keep high level of current customer’s satisfaction and attract new
customers, the company must continuously struggle for improvements. Moreover, there was
recent growth of the customer’s number and therefore, there was a required increase in
additional transport fleet.
Currently, the company has 4 types of good distributions, first is the direct delivery from the
warehouse to the major networks regardless of their place of locations. The second is direct
deliveries of bakery products in the linear retail (ordinary food shops) as well as corporate
customers (the HoReCa, health establishments). Third is direct supply of bakery products to the
small private entrepreneurs who sell bread at its sales outlets in the stalls and markets. Fourth,
iindirect supply of products to intermediaries. The target of my research was first 3 types of
goods distribution, which are managed by the company. From 2013-2015 years, the average
delivery latency of customers increased from 80 to 110 minutes, consequently, the waiting time
is about 40%. In addition, the average delay increased from 20 minutes to 35 minutes.
Potentially, it means that it can lead to the loss of customers for 6.8%, which are dissatisfied with
the serving time of the company. Due to my analysis, I came up to the conclusion, the biggest
reason of loss is the absence of automized TMS, a system which is able to optimize the logistics
processes based on modern information technology, mathematical models and means of
technical traffic control.
It was proposed to implement modern system named as RS.TMS ASTOR, due to its optimal
costs for the company among other available foreign systems at the market.
The system can improve transportation logistics overall and the main tasks of it are to help
experts to create efficient transport planning. The main tasks of the system is to improve the
goods delivery to the desired location, at the right time, in safe and at minimum costs for the
optimum route and optimal chosen vehicle.
The mentioned system can save direct operating savings in the products delivery to customers
in terms of variable costs by reducing the parameter as distance covered by delivery based on 1

76
customer." Implementation RS.TMS ASTOR will reduce the parameter as "Covered distance
delivery per customer 1" by 25% due to the exclusion of routes crossing the proper zoning and
calculating the optimum routes with the help of mathematical optimization model.
Thus, it is expected that with the implementation of automated transport logistics and
management system will be possibility to reduce the delivery waiting time from the current 35
minutes to 10 minutes.
Due to my calculations with the introduction of automated transport logistics and management
system RS.TMS ASTOR, the quality of logistics customer service will increase and JSC
"Khlibodar" will possibly receive quarterly effect in 185 thousand of UAH by preventing the loss
of customers and reduce the percentage of the average deliveries delay by 0.5% on a quarterly
basis.
The amount of such effect for the year will amount to 740 thousands of UAH, which again points
to the cost-effectiveness and feasibility of the implementation of automated solutions for
transport logistics management by RS.TMS ASTOR.
In accordance with the proposed schedule of the system introduction, the total duration from the
initial meeting between the representatives of the potential executive "ASTOR" and bakery
company to full training and complete implementation of the system, I suppose will take around
18 weeks, i.e. about 4.5 months. Nevertheless, the whole cooperation and system
implementation will depend on the bakery company decisions and financial capabilities.
77
Bibliography
[1] All terminology in logistics area [online]. [cit. 2016-03-23]. Available at
http://www.fill2001.narod.ru/OpredLogist.htm
[2] Electronic library online “Books in Russian” [online]. 2013 [cit. 2016-05-04]. Available at
orbook.ru
[3] Gordeychik S.V. “The Role of Marketing System in the Economics”, Belorussia [online].
[cit. 2016-03-18]. Available at http://www.konspekt.biz/index.php?text=3573
[4] Gritzenko M.N., National Mining University, Dnipropetrovsk, Ukraine [online]. 2009. [cit.
2016-02-09]. Available at http://www.rusnauka.com/15_NPN_2009/Economics/46663.doc.htm
[5] Hovanov A.A. “Distribution Channel Management in the Wholesale Trade”, Article №3
[online]. 2004. Available at http://mavriz.ru/articles/2004/3/118.html
[6] Internal Data Base (Organizational Manual, Finance Reports), taken from the
representatives of JSC “Khlibodar”.
[7] Internal Data Base taken from the representatives of TMS ASTOR Company.
[8] Kalchenko A.G. Logistics. Logistics as the instrument of trade economy development.
The concept of logistics [online]. [cit. 2016-05-01]. Available at http://orbook.ru/index-10990.htm
[9] Kyrinnaya M. “Ideology of Transport Logistics” [online]. 2000. [cit. 2016-04-07]. Available
at http://www.cfin.ru/press/boss/2000-05/17.shtml
[10] LiveJournal “Transport Logistics, analysis of its effectiveness” [online]. [cit. 2016-01-09].
Available at http://toplogistic.livejournal.com/9501.html
[11] Moscow National Governmetal University of Technologies and Management , Term
Paper in the field of Economics and management at enterprise [online]. 2007. [cit. 2016-04-11].
Available at http://www.bestreferat.ru/referat-91371.html
[12] Nasedkina Y.M. Sales Management Basing on Marketing Management, Essence,
Necessity. Journal: Management Development 14(135)2012. Released Universal Decimal
Classification 005.2:658.8
[13] Mazur I.I., Shapiro V.D., Olderogge N.G., Polkovnikov A.V. “Project Management” [online].
[cit. 2016-04-09]. Available at http://econom-lib.ru/7.php
[14] Nikiforovov V.V. Logistics. Transportation and Warehouse in the Supply Chain:
HrossMedya, ROSBUH, Moscow, 2008. Released ISBN 978-5-476-00525-4

78
[15] Obruch G.V. Journal of economy and transport industry, №44. “The essence AND
SIGNIFICANCE OF LOGISTICS CONCEPT in the business activity”. 2013. Released Universal
Decimal Classification 658.7
[16] Online Report “Analysis of Logistics Costs and Cost of Goods” [online]. [cit 2016-01-02].
Available at http://www.xcomp.biz/4-2-analiz-logisticheskix-izderzhek-i-sebestoimosti-tovara.html
[17] Online Report “Diversity of Logistics Units. Supply chains” [online]. 2014. [cit. 2016-05-
10]. Available at http://zno.znaimo.com.ua/docs/3927/index-30410-3.html
[18] Online Study Report “Objective basics of logistics development” [online]. [cit 2016-05-06].
Available at http://fan-5.ru/entry/work-404032.php
[19] Primacheva N.N., Mezina L.V. “Parameters and Factors of Functional Stability of Trade
Ports”, 2009. Released Universal Decimal Classification 656.615.003
[20] Report, Chapter: Management and Labor relations “Optimization channels of goods
distribution” [online]. 2013. [cit. 2016-03-10]. Available at http://www.refsru.com/referat-24092-
1.html
[21] Serbin V.D. “ Basics of Logistics”. Study tutorial. Taganrog: Pubslisher TRTY [online].
2014 [cit. 2016-03-09]. Available at http://www.aup.ru/books/m97
[22] Tochenov I.V., Zaharov S.E. Study Material in the Discipline “Logistics” [online]. 2006.
[cit. 2016-05-08]. Available at http://works.doklad.ru/view/uoKx-R-PvCw/3.html
Please note, the bibliography was taken mainly in Russian and Ukrainian languages sources
and was translated into English by me.

79
List of figures
Figure 2.1: Supply Chain of Enterprise ……………………………………………….…..…16
Figure 2.2: Basic distribution of goods channels.................................................….........24
Figure 2.3: The relative importance of the logistic services’ elements …………...….......25
Figure 3.1.: Dynamics of bread production and bakery products in Ukraine,
thousands of tones………………………………………………………………..…….……...28
Figure 3.2.:The basic model of the target market segmentation for JSC
"Khlibodar"........................................................................................................................29
Figure 3.3: The target audience of consumers of bread JSC "Khlibodar" in the short (1-2
years) and medium term (3-5 years) term........................................................................30
Figure 3.4.: The value creation model for JSC "Khlibodar" on the bakery market..........30
Figure 3.5.: The operational business model of JSC "Khlibodar" in the bakery
market..............................................................................................................................31
Figure 3.6. The target audience of JSC "Khlibodar" and specifics of goods
distribution…………………………………………………………………………….......…….33
Figure 3.7.: Structure of products sales at JSC "Khlibodar" company, in the context of the
target audience in 2015, % ………………………….........................................................34
Figure 3.8.: The structure of the commercial department at JSC "Khlibodar"………..….35
Figure 3.9.: Load on the transport logistics of JSC "Khlibodar" in 2013-2015..……..…..38
Figure 3.10.: Dynamics of the customers’ amount and the average distance for the
delivery of an order for JSC "Khlibodar" in 2013-2015……………………………….........39
Figure 3.11.: Cost indicators of the logistics customer service in 2013-2015………..…..41
Figure 3.12.: Efficiency of the logistics customer service in 2013-2015
years…..…………………………………………………………………………………………42

80
Figure 3.13.: The average percentage and frequency of untimely performance of the
products delivery to the customers from JSC "Khlibodar" in 2013-2015……………........44
Figure 3.14.: The performance indicators of JSC "Khlibodar" activity in 2013-2015........46
Figure 3.15.: Logistics costs in the relation to operating costs and profit margins of JSC
"Khlibodar"……………………………………………………………………………………….47
Figure 3.16.: The general scheme of transport logistics information system at JSC
"Khlibodar" ………………………………………………………………………………..…….49
Figure 3.17.: Composition of the info system RS TMS ASTOR……………….…………..50
Figure 3.18.: Technological scheme of RS. TMS.ASTOR processes…………….......50-51
Figure 3.19.: Structure of the internal table “Geographical classificator“…………………51
Figure 3.20.: Delivery route with point’s exemplification……………………………………67

81
List of tables
Table 2.1.: Comparing analysis of the traditional and logistics control systems………18
Table 3.1: Cooperation indicators of JSC "Khlibodar" with customers in 2013………..36
Table 3.2.: The characteristics of the transport logistics system (products delivery) at
JCS JSC "Khlibodar" company in 2013-2015 years…………………………………..….37
Table 3.3: Cost indicators of JSC "Khlibodar" transport logistics system in 2013-
2015…………………………………………………………………………………………....40
Table 3.4.: Indicators of the cost of logistics customer service of JSC "Khlibodar" in
2013-2015 years……………………………………………………...………………………40
Table 3.5.: Indicators of load uniformity on the transport logistics in 2013-2015……...43
Table 3.6.: Quality indicators of the transport logistics in 2013-2015 years……………43
Table 3.7.: Integrated assessment of the economic efficiency of transport logistics
system (product delivery) in 2013-2015 years…………………………………………….45
Table 3.8: Expected savings in operational expenses for the products delivery after the
introduction of RS.TMS ASTOR system…………………………………………………...56
Table 3.9: The assumed increase of customer satisfaction from logistics services due
to the proposed implementation of RS.TMS ASTOR……………………………...……..58
Table 3.10.: Data from the file “vehicle fleet.xls”………………………………………….61
Table 3.11.: Example of initial data from the “trial routings.xls” of a company………...62
Table 3.12.: Database of customer’s delivery points exemplification……………....62-63
Table 3.13: Delivery points exemplification in RS.TMS ASTOR………………….….…64
Table 3.14.: Route sheet exemplification…………………………………………...…64-65
Table 3.15: The sequence of phases of the project and the duration of their
performance…………………………………………………………………………….…….68
Table 3.16.:The planned schedule of innovative project implementation at JSC
"Khlibodar"…………………………………………………………………………………….70

82
Table 3.17.: The approximation of employee’s hourly rates who will take part in the
project………………………………………………………………………………………….71
Table 3.18.: Plan-Graphic of employee’s possible involvement in project
implementation and labor costs…………………………………………………………72-73