Embed Size (px)
Citation preview

S.Afr.J.Bus.Manage.2016,47(2) 53
Decoupling paradigm of push-pull theory of oscillation
in the FMCG industry
T.P. Mbhele*
University of KwaZulu Natal (Westville Campus), School of Management, IT & Governance,
Private Bag X54001, Durban 4000, South Africa
*To whom all correspondence should be addressed
The amplification of demand order variability germinates from distorted demand information upstream while sometimes
reacting to demand-driven inventory positioning influenced by the custodians of downstream information. This study
uses factor analysis to tentatively develop a supply chain model to enhance the competence of supply chain performance
in terms of responsiveness, connectivity and agility. The results of the analysis indicate that the magnitude of control on
the bullwhip effect and access to economic information on demand orders in the supply chain network are associated with
the modelling of the push-pull theory of oscillation on three mirror dimensions of supply chain interrelationships
(inventory positioning, information sharing and electronically-enabled supply chain systems). The findings provide the
perspective on managing amplification in consumer demand order variability upstream in the supply chain network while
enhancing the overall efficiency of supply chain performance. This article provides insight into the use of innovative
strategies and modern technology to enhance supply chain visibility through integrated systems networks.
Introduction
In South Africa’s rapidly changing consumer landscape, fast
moving consumer goods (FMCG) retail outlets as well as
suppliers are gradually acknowledging the need for the
efficient strategic diffusion of electronic information
through integrated supply chain information technology
(SCIT). According to Sorescu, Frambach, Singh,
Rangaswamy and Bridges (2011:7), retail business model
(RBM) innovation is defined as “a change beyond current
practice in one or more elements of a retailing business
model (retailing format, activities and governance) and their
interdependencies, thereby modifying the retailer’s
organising logic for value creation and appropriation”. If the
business model represents the firm’s distinctive logic for
value creation and appropriation (Teece, 2010; Zott & Amit
2010), the strategy epitomises a central, integrated,
externally-oriented concept of how the business will achieve
these essential strategic objectives (Hambrick &
Fredrickson, 2005; Gambardella & McGahan, 2010).
Modern global business environments exhort retailers to
constantly look beyond organisational boundaries to
evaluate and integrate the resources and capabilities of their
suppliers and customers. The multi-directional retail
practices leverage upstream and downstream relationships in
the supply chain network. Ganesan, George, Jap, Palmatier
and Weitz (2009:84) recommend “the propensity towards
global sourcing practices and the nature of interfirm ties
between retailers and the organisational partners for better
product and process innovations”. To a certain extent, these
approaches will create superior value and a competitive
advantage that companies might sustain over time. Attaining
competitive advantage requires the creation of an integrated
system that has a unique advantage over competitors to
create customer value in an efficient and sustainable way.
Heizer and Render (2011:68) advocate “competitive
advantage in terms of competing on response strategy (pull-
based system) where a set of values relate to rapid, flexible,
and reliable performance”. This study aims, firstly, to
analyse the challenges raised by the push- and pull-based
oscillation effect from the perspective of electronically-
enabled supply chain management (e-SCM) systems,
information sharing, inventory positioning and global
optimisation strategies in the FMCG industry. The second
objective is to establish the discrete dimensions in the
pattern of interrelationships among the bullwhip effect
challenges together with mitigation strategies for reduced
underlying sets of integrated and synchronised dimensions.
Conceptual view
The phenomenon of bullwhip effect
Companies operating in different markets have observed a
phenomenon known as bullwhip effect, in which order
vacillations increase as orders move upstream. Apart from
observations, Ouyang (2007:1107) describes the bullwhip
effect as “a phenomenon in supply chain operations where
the fluctuations in the order sequence are usually greater
upstream than downstream of a chain”. Chopra and Meindl
(2007:525) associate the phenomenon with the influence on
profitability throughout the network with subsequent costly
inventory levels and positioning. A firm’s ability to establish
and retain satisfactory customer relationships requires an
understanding of buying behaviour. This refers to the
decision processes and acts of those who buy and use
products for personal or household use, rather than for
business purposes (Pride & Ferrell, 2009:171). The
sustainable level of profitability in the supply chain requires

54 S.Afr.J.Bus.Manage.2016,47(2)
focus on positioning and better integration of organisations.
In this way, all participants in the network seem to benefit
from synchronised decision-making processes based on the
underlying high levels of trust, competent collaboration, and
active communication.
Recognising the realities of paradigm shift in supply chain
management, supply chains versus supply chains as a
competition genre creates intensity in integrating more
business activities across the internal and external supply
chain processes. Eventually, this competitive trend serves an
essential purpose of adding value for trading supply chain
partners and customers. Contrarily, Miragliotta (2006:366)
highlights the dearth of supply chain integration in referring
to bullwhip effect as “a supply chain phenomenon revealed
by a distortion (variability amplification and- /or rogue
seasonality) of the demand signal as it is transmitted
upstream from retailers to suppliers”. Demand vacillations
prevail in multiple echelon-stages as orders move from
underlying push-based oscillation to the upstream site of the
network. Wu and Katok (2006:839-850) attempt to
summerise the bullwhip effect, in terms of, “the observation
that the variability of orders in supply chains increases as
one moves closer to the source of production”. These
definitions indicate that the pull-based oscillation network
chain structure and linkage is the result of value-creating
systems and demand-driven orders emanating from
integrated multiple nodes. This study interprets the
dynamics of supply chain networks as a complex web of
interconnected nodes (representing entities or facilities such
as suppliers, distributors, factories and warehouses) and
links (representing the means by which the nodes are
connected on supply chain mapping flows).
Dynamics of supply chain management
The oscillation effect on distorted order information
traveling up stream indicates amplified consumer demand
order variability (DoV) and results in diluted accountability,
and fosters distrust of information and a bloated inventory
level. The analysis indicates that decentralised demand
information can significantly increase the variability while
centralised demand information can significantly reduce, but
will not eliminate, the bullwhip effect (Simchi-Levi,
Kaminsky & Simchi-Levi, 2008; Snyder & Shen, 2011).The
integration of the development chain, demand chain,
distribution chain and supply chain through information
sharing mechanisms and electronically-enabled supply chain
management at multi-level echelons has the propensity to
enhance customer-centric business strategies and ameliorate
the pernicious problem of the bullwhip effect. These chain
networks reflect supply chain architecture that involves a
sequence of value-added processes with an attempt to match
supply and demand, while the demand chain focuses on
creating and managing the quantities of one or more
products that can be served by a supply chain (Schroeder,
2008). In the same perspective, Coyle, Langley Jr, Novack,
and Gibson (2013:16) view supply chain management as “a
pipeline or conduit for the efficient and effective flow of
products/materials, services, information and financials from
the supplier’s suppliers through the various intermediate
organisations out to the customer’s customers or the system
of connected networks between original vendors and the
ultimate final consumer”. This study alludes to the
interpretation of supply chain management in the same light
as the broad and comprehensive synchronisation of flows
with integrated-based activities and extended enterprises.
This advocates an improvement in supply chain
performance that is achieved by means of a schematic
network of interrelationships and interconnectivity between
its elements in order to minimise system-wide costs while
satisfying service level requirements. Integrated
electronically-enabled supply chain management (e-SCM)
systems and synchronised decision-making responsibility
across extended enterprises can be expected to respond
directly to genuine customer demand with an anti-oscillator
effect.
Theoretical framework
Diffusion of electronic supply chain management systems
This study posits that investment in infrastructural
information technology (IT) projects and remodeling
electronic supply chain procedures will enable suppliers to
cooperate and collaboratively espouse e-SCM diffusion. Wu
and Chuang (2009:302) concur with Lin and Huang
(2012:164) in defining e-SCM systems diffusion as “a
process from internal diffusion among functional units
within an organisation to external diffusion across inter-
organisational trading partners when e-SCM becomes an
integral part of the value activities”. According to Hornor
(2008:1), the theory of diffusion of innovation dates back to
1903, when the French sociologist, Gabriel Tarde designed
the original S-shaped curve. The S-shaped curve is
important because most innovations have an S-shaped rate
of adoption and it is used widely in the application of global
technologies. The diffusion process explains and predicts
the period of adoption of new innovations in the
marketplace based on the underlying concepts and theories
of communication and interaction among supply chain
members (Rangaswamy & Gupta, 1999; Shane, 2014).
Rogers (1962) cited in Hornor (2008:1) defines diffusion as
“a process by which an innovation is communicated through
certain channels over time among members of a social
system”. This process is a set of interrelated units that are
engaged in an effective collaboration to accomplish a
mutual economic goal. Essentially, the theory of diffusion of
innovation is distinguished by individual characteristics of
five stages of adoption, such as awareness, interest,
evaluation, trialability and observability (Rogers, 1962;
Horner, 2008); whereas more recently, Tidd and Bessant
(2011:355-359) identify the five characteristics of
innovation as being relative advantage, compatibility,
complexity, trialability and observability.

S.Afr.J.Bus.Manage.2016,47(2) 55
Diffusion and capability theories
Diffusion of innovation (DOI) is predominantly based on
the characteristics of the technology and the users’
perceptions of the innovation (Rogers, 2003). DOI is
influenced by leadership attitude toward change,
interconnectedness and system openness within the context
of technology and top management support within the
organisational context (Oliveira, Thomas & Espadanal,
2014:497). In similar vein, Yeh (2005:327-335) performs
the correlation of factors in an e-SCM relationship where
“resource dependence, trust and relationship commitment
are positively related to the continuity of the cooperative
electronic supply chain relationship; and risk perception is
negatively related to the continuity of the cooperative
electronic relationship”. The dynamic capability theory
(DCT) elaborates more on how organisations and supply
chains can integrate, build or deploy and reconfigure their
internal resources and external competencies in a changing
environment (Teece, Pisano & Shuen, 1997; Newbert,
2007). The dynamic capabilities are critical for performance
in technology-based environments as they determine the
clockspeed (Teece, 2007), and e-supply chain integration
needs to be embedded in the strategies and goals of
partnering organisations as supply chain networks (Rajaguru
& Matanda, 2013:620). Despite these empirical results,
Oliveira & Martins (2010) and Ifinedo (2011) maintain that
technological innovations benefit an organisation’s members
in terms of real-time communication, decreased inventory
and increased service levels. Lin and Huang (2012:162)
underpin the theoretical perspective that “perceived benefits,
knowledge management capability, and trading partner
influence are important factors shaping e-SCM systems
diffusion”.
Systems diffusion allows quasi-real-time information
sharing on inventory position and product development
among trading supply chain partners, and thus generates a
synergic effect (Yao, Palmer & Dresner, 2007:884).
According to the organisational information processing
theory (OIPT) an organisation’s information processing
capabilities must be aligned with its information needs
whereby an organisation must be able to gather, interpret,
synthesise, and coordinate information across the
organisation (Burns & Wholey, 1993:106-138). Frohlich
and Westbrook (2001) and Schoenherr and Swink (2012)
assert that visibility can be distinguished from external
supply chain integration that addressed more general
information sharing and collaborative processes. According
Williams, Roh, Tokar and Swink (2013:543) a strategy for
achieving supply chain responsiveness requires a dual-
pronged approach that aligns increased visibility with
extensive information processing capabilities from internal
integration. Although organisations are confronted by a
number of technological challenges, including the lack of
employee training and education, there is a need to
understand the benefits and goals of e-SCM as well as its
poor implementation (Migiro & Ambe, 2008). The e-SCM
systems diffusion accelerates e-SCM development and
provides new ways to integrate web-based technologies with
core businesses that affect both cross-functional (inside) and
extended cross-enterprise (outside) value chain networks for
business transformation (Wu & Chuang, 2009; Tarofder,
Marthandan & Haque 2010; Lin & Huang, 2012). Cai and
Du (2009:709) recommend that the strategy of risk pooling
is designed to “bring about demand aggregation across
locations or time, in order to reduce the variability which is
measured by either the standard deviation or the coefficient
of variation”.
Oscillated push and pull theory
The hybrid system of push-pull boundary occurs at the point
in time that the firm switches from managing the supply
chain using one strategy (push system), to managing it,
using a different strategy (pull system) (Simchi-Levi et al.,
2008). In interpreting the system, Bowersox, Closs, Cooper
and Bowersox (2013:12) interpret an anticipatory business
model as a push system (produces a product based on a
market forecast) while the responsive business model is
associated with a pull system (relies on timing and agility)
that focuses on reducing forecast reliance and improving
joint planning and real-time information exchange. The
decoupling point also acts as a strategic point for buffer
stock, and its position changes depending on the variability
in demand and product mix (Mason-Jones, Naylor & Towill,
2000). An increase in product mix and fluctuating volume
would force the decoupling point to move upstream, making
the supply chain system more agile in order to ameliorate
the magnified oscillations upstream. The use of supply chain
IT to share data between buyers and suppliers is value-
creating as the virtual supply chain is information-based
(resulting in pull-based oscillation) rather than inventory-
based (resulting in push-based oscillation). Machuca and
Barajas (2004:209) describe the behavioural patterns as
oscillation, where orders and inventory demonstrate large
amplitude-fluctuation nodes in the supply chain. In a closed-
loop supply chain (forward and reverse supply chain
activities for the entire life cycle of the product), oscillation
arises from the combination of time delays in negative
feedback and the failure of the decision-maker to take time
delays into account (Ding & Gan, 2009:343).
From the perspective of the pull theory of oscillation on the
supply chain network along the production, consumption
and replenishment cycles, consumer DoV emphasises,
firstly, a demand-driven supply network that builds supply
chains in response to demand signals through alignment
(create shared incentives); secondly, agility to respond
quickly to short-term change; and finally, adaptability in
terms of adjusting the design of the supply chain to create
sustainable competitive advantage. Christopher (2011:103)
stresses that “supply chain partners can only make full use
of quasi-real-time shared information through process
alignment with collaborative working between buyers and
suppliers, joint product development, common systems and
shared information”. Shih, Hsu, Zhu and Balasubramanian,
(2012:70) add that, in order to decrease uncertainty one
needs to integrate the IT system with the supply chain
network resulting in lower production costs, shorter lead
56 S.Afr.J.Bus.Manage.2016,47(2)
times, and faster product delivery. The authors advocate that
information sharing is suitable for efficient day-to-day
operations, but when the decision-making processes become
more complex and chaotic, knowledge management is better
because it makes it easier to address the uncertainty and
changes in the environment. As the supply chain entails
multiple actors working together in a process of value
creation, effective management of relationships among the
actors is vital to the success of SCM (Christopher, 2011). In
essence, there needs to be harmony among supply chain
members – with a diverse set of cultures, structures and
behaviours – in order for them to achieve the synergistic
effect of working together as a team. The network theory
views any system as a set of interrelated actors or nodes
(Tate, Ellram & Golgeci, 2013:266) whereby the actors can
represent entities at various levels of collectivity, such as
persons, firms, countries and other participants in the
network (Borgatti & Li, 2009:2). Networks represent an
important way to diffuse ideas and practices among supply
chain members within a network, and diffusion using
network theory should enhance the collaboration in a supply
chain network and is required for extended enterprises to
share knowledge and skills (Rugman & Verbeke, 1998;
Tate, Ellram & Golgeci, 2013). Although the chaos theory
suggests that uncertainty in the supply chain can be
managed by imposing rules or principles guided by existing
knowledge and experience, electronically-enabled supply
chain management systems assist in managing the flow of
information and products in extended enterprise supply
chain configurations.
Literature review
Value of information sharing
Information sharing is an optimisation strategy that
enhances active coordination and integration in the chain
network in order to address the challenges emanating from
consumer DoV. Chen (2003:341) presented a comparative
analysis showing that the focus has been on demand-side
information, which optimises a portion of the overall flow
chain network. The argument is that supply-side information
shows limited retail sales information and wavering
inventory at points of sale. “The manufacturers can rollover
new and advanced products over an extended planning
period using the solo-oriented strategy. When the periodic-
review inventory system is coordinated, information sharing
enhances the performance of both supply chain streams of
trading partners” (Li & Gao, 2008:522). However, the
authors add that, “it is not possible to achieve embellished
supply chain performance targets and benefits without
proper coordination and better collaboration”. Choudhury,
Agarwal, Singh and Bandyopadhyay (2008:117-127) test the
belief that “the benefit is increased by sharing relevant
information (sharing demand and inventory information)
among players in an entire supply chain”. In viewing the
models, balanced information sharing on both stream sites
(the Chen model) and the degree of supply chain
performance benefits (the Li & Gao model) provide the
underlying theoretical framework to address the challenges
of the bullwhip effect on business operations from a profit
maximisation point of view. By the same token, information
sharing, a transparent retail order replenishment policy, and
a reliable inventory status, lead to a reduction in inventory
levels and costs (Lee & Whang, 2000; Cheng & Wu, 2005).
Contrarily, Chiang and Feng (2007:1429) advocate that
information sharing is more beneficial for the manufacturer
than for retailers in the presence of supply uncertainty and
demand volatility. The value of information sharing for the
manufacturer can increase or decrease with production yield
variability from different cost structures and demand
patterns. Li and Lin (2006:1641) have noted that the quality
of the information shared may be susceptible to contextual
factors, such as the type of industry, firm size, a firm’s
position in the supply chain, supply chain length, and type
of supply chain (Chen & Yu, 2005). In this situation, the
retailer has to rely on the history of order arrivals to deduce
the lead time and attempt to align replenishment decision-
making responsibility. Information velocity is a term used to
describe how fast information flows from one process to
another, and information volatility is the uncertainty
associated with information content, format, or timing that
must be considered to add value to the supply chain (Wisner
& Stanley, 2008; Simchi-Levi et al., 2008). Wisner and
Stanley (2008:316) further consider enabling information
technologies as a replacement for human coordination, to
reduce uncertainty, promote new synchronised coordination
structures and substitute information and knowledge for
inventory. These putative processes aim to simplify
information flow, inventory positioning and order
replenishment optimisation across supply chains.
Electronically-coordinated business activities (Sebastian &
Lambert, 2003) are likely to address variance amplification
through electronically-enabled supply chain management (e-
SCM) systems diffusion.
Retail demand and risk pooling
Expectations represent the desired level of performance
(Ryding, 2011); as a result, the demand push theory of
oscillation manifests greater amplification of DoV upstream
from underlying responses based only on environmental
stimuli (Lurkovski, 2005; Choi, Kim, Keum, Han, Ko &
Han, 2011). This phenomenon of demand variance
amplification, known as the bullwhip effect, reflects a
progressive increase in order (push-based) variance as order
information passes upstream in a supply chain, from the
customer back to the supplier level. The push-based demand
variance experienced by the upper echelons has several
negative implications, including the need for increased
production capacity by production points and the increased
capacity costs of transportation providers that result in
operational instability (Chatfield & Pritchard, 2013:159).
The retail environment is changing due to increasing
competition and heightened consumer expectations (Ryding,
2011). Retailers’ current strategy of using advanced
technology at points of sale, do not totally satisfy
consumers’ expectations (Pantano & Viassose, 2012).
Although the diffusion of information systems has

S.Afr.J.Bus.Manage.2016,47(2) 57
transformed supply chains into supply networks, in which a
number of producers, suppliers, intermediaries, and
customers are globally interconnected in real time to meet
and satisfy changing consumer requirements. The
integration of information systems across partnering
organisations has become the backbone of supply chain
management as it facilitates information sharing, thereby
enhancing organisational flexibility and responsiveness
while minimising risk and inventory costs (Hartono, Li, Na
& Simpson 2010; Rajaguru & Matanda, 2013).
Risk pooling assumes that the demand in the markets served
by warehouses is negatively correlated (when demand at one
market is greater than average, then demand at another
market will be less than average) (Hopp & Spearman, 2008).
This means that the greater the positive correlation between
demands, the smaller the benefit due to risk pooling (Wisner
& Stanley, 2008; Cachon & Terwiesch, 2009). In an inverse
correlated relationship, Snyder and Shen (2011:273)
postulate that “the information in variability is additive in
the centralised system but multiplicative in the decentralised
system with shared demand information as a significant
factor to reduce bullwhip effect”. The underpinning view
from Simchi-Levi et al. (2008) allude to the fact that “the
benefit of risk pooling in a centralised system depends on
the standard deviation (σ) or the coefficient of variation
(σ/μ) among the different markets with support of e-SCM
system”. The higher the standard deviation or coefficient of
variation, the greater the potential benefit from a centralised
system, although the benefits of risk pooling also depend on
demand correlation among the different markets. Arguably,
a decentralised supply chain allows the manufacturer greater
proximity to consumers with quasi-actual demand
information (Simchi-Levi et al., 2008).
Research methodology
Research design
The research design outlines a plan and structural
framework for how the researcher intends to conduct the
study to solve the research problem (Cooper & Schindler,
2008:140). This study used a cross-sectional quantitative
approach to analyse data, and a self-administered
questionnaire survey instrument was used for data
collection. Organisations in retail sales, logistics,
warehousing, marketing, manufacturing and information
technology hubs were the units of analysis in this study.
Managers (senior and functional levels) including
supervisory level (non-managerial), were used as the
subjects within the organisations. The supervisory positions
were considered for their reliable information and
comprehensive understanding of individual retail outlets as
well as retail warehousing systems. It is crucially important
for this study to make thoughtful and sound inferences in
order to produce integrated research that yields new
knowledge and solution-based findings.
Data collection
Survey instruments
A survey instrument incorporating statements on the
bullwhip effect, inventory positioning, information sharing,
electronically-enabled supply chain management (e-SCM)
and strategic global optimisation activities was self-
constructed based on the literature reviewed. The content
validity of the instrument was established by grounding it in
extant literature. A questionnaire was designed by the
researcher based on both the constructs of the conceptual
and contextual framework using structured questions to
enhance the thematic research thread objectivities. While it
could be argued that objective scales are more insightful, the
study used subjective scales because of the multi-sectoral
nature of the survey. Sekaran and Bougie (2009:197)
describe a questionnaire as an efficient data collection
mechanism with a pre-formulated, written set of questions to
which respondents record their answers, usually within
rather closely defined alternatives. The pre-formulated
thematic instrument (bullwhip effect, information sharing,
inventory positioning and optimisation strategies) was
grounded within the extant literature review. It was pre-
tested using key industry practitioners and discipline-based
academics for suitability in order to enhance face and
content validity.
The survey questionnaire was structured into five sections
with section one including typical demographic data, a
personal profile and general information for both the
company and individual respondents, representing nominal
data (mutually exclusive and collectively exhaustive) and
rank-ordered statements (ordinal data). Section two included
dichotomous questions (Yes or No) on general perceptions
of inventory management systems to mitigate the bullwhip
effect, representing nominal data. Sections three and four
included interval data with a series of statements that
covered operational supply chain networks on the bullwhip
effect, information sharing, electronic supply chain
management integration and global optimisation strategies
to ameliorate the bullwhip effect. According to Anderson
(2009:312), clarity on the research questions and types of
data collected should allow the researcher to identify the
most appropriate quantitative data analysis tools to use on
the main underlying option for parametric and/or non-
parametric data (Collis & Hussey, 2009; Cooper &
Schindler, 2008; Davies, 2007; Hair, Jr, Babin, Money &
Samouel, 2003). The last section listed numerous e-SCM
systems that were being used or recommended by the
respondents.
Respondents indicated the degree of agreement or
disagreement, where 5 represented “strongly agree” and 1
represented “strongly disagree”. In other words, multi-
question Likert-type five point scales ranging from strongly
agree to neutral to strongly disagree in sections three and
four were used to derive composite scores of data for each
variable as representative of interval data. The respondents
were assured that the researcher would not disclose the

58 S.Afr.J.Bus.Manage.2016,47(2)
names of the participating firms or individual respondents to
honour ethical requirements. Assurance of anonymity tends
to yield greater confidence and encourage participation in a
research study.
Data sampling methods
A nonprobability sample that assimilated this study’s criteria
with purposive sampling is called judgment sampling.
Nonprobability sampling has some compelling practical
advantages to meet the sampling objectives of the study
(Blumberg, Cooper & Schindler, 2008:235). This sampling
occurs when a researcher selects sample members to
conform to some criterion (Cooper & Schindler, 2008: 397).
It calls for special efforts to locate and gain access to
individuals that possess the requisite information.
Convenience sampling was identified based on the design of
deliberate sampling for heterogeneity. In other words, one
defines target ranks and departmental persons to ensure that
a wide range of instances from within each echelon are
represented. Sekaran and Bougie (2009:276) describe
convenience sampling as one of the best ways to collect
information quickly and efficiently from members of the
population who are able to provide such information.
Referral sampling also proved to be the most efficient and
effective approach that eventually yielded the majority of
the potential respondents on the sampling frame. Snowball
sampling relies on approaching a few individuals from the
relevant population; these individuals then identify other
members from the same population for inclusion in the
sample (Welman, Kruger & Mitchell, 2005:69).
Sampling size
The retailers (downstream supply chain) and capacitated
suppliers (mid and upstream supply chain) in the selected
FMCG industry constituted the population of 800
proportionate representatives within five major retail chain
stores in eThekwini Metro, South Africa. Approximately
300 selected suppliers for these retail chain stores in food
(dairy, frozen, canned and general) and beverages (hot and
cold), and the personal health care category were considered
for this empirical research study. The sample size of 456
(260 retailers and 196 suppliers) was considered adequate as
Sekaran (2003:295) notes that sample sizes of larger than 30
and less than 500 are appropriate for most research on a
population-to-sample size table. According to Sekaran
(2003:294) and Bartlett, Kotrlik and Higgins (2001:48), the
representative population size of 800 (retailers) and 300
(suppliers) in determining minimum returned sample size is
260 and 196 sample size, respectively, with an alpha of 0.05
and a degree of accuracy of 0.05. The alpha value or level of
significance (0.05) would become enshrined as the threshold
value for declaring statistical significance in this study. This
study produced a sample size of 448 respondents with a
return rate of 98% [(448/456) 100]. According to Krejcie
and Morgan (1970), researchers typically set a sample size
level of about 500 to optimally estimate a single population
parameter; in turn, this will construct a 95% confidence
interval with a margin of error of about ± 4.4 % for large
populations. In terms of an inverse relationship between
sample size and the margin of error, smaller sample sizes
will yield larger margins of error. Larger sample sizes
generally lead to increased precision when estimating
unknown parameters (Cooper & Schindler, 2008; Babbie &
Mouton, 2001; Krejcie & Morgan, 1970).
Administering survey
The questionnaire was self-administered through scheduled
delivery and collection of questionnaires within the agreed
time intervals to enhance the return rate. The questionnaires
were delivered to individual gatekeepers to administer the
survey within their domain and most questionnaires were
personally administered by the researcher within the
eThekwini Metro, South Africa. The relevant letters
(gatekeeper’s letter, ethical clearance certificate, and letter
of consent to ensure confidentiality and anonymity) were
shown to the gatekeepers when the researcher was given
permission to enter their domain.
Statistical analysis of data
The statistical analysis aimed to achieve the study’s research
objectives. The summarised univariate technique examined
the distribution of cases on one variable at a time using
descriptive statistics (mean and standard deviation). The
multivariate analysis was organised around a scheme of
interdependence (factor analysis) procedures to develop
models and dimensions that best describe the population as a
whole.
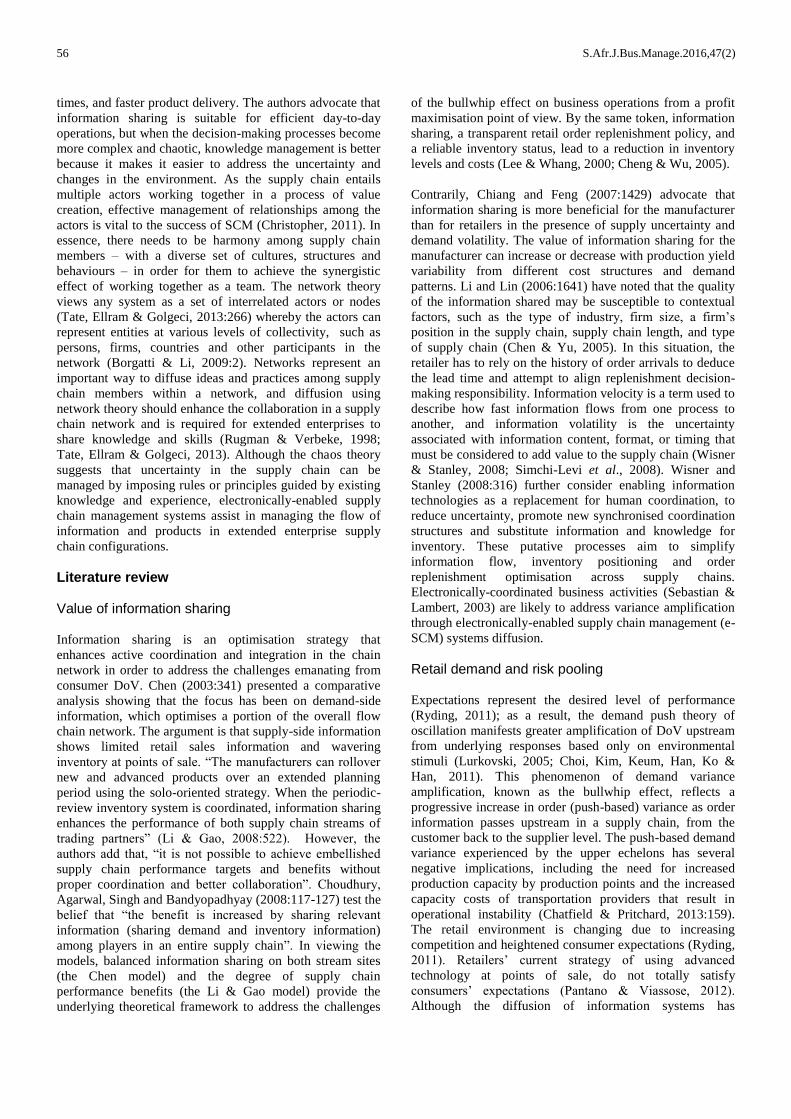
Frequency distribution: experience and perceptions of participants on three critical variables
This figure shows three critical variables (inventory
positioning, e-SCM systems and information sharing) on the
experience and perceptions of the participants. The degree
of agreement on the statements focuses on e-SCM systems,
optimal inventory positioning and information sharing in
attempting to mitigate consumer demand order variability in
the supply chain network.
Figure 1: Experience and perception of participants on
three critical variables

S.Afr.J.Bus.Manage.2016,47(2) 59
The fundamental theoretical framework to analyse the
challenges of the bullwhip effect on the FMCG industry is
constructed around inventory positioning, information
sharing and e-SCM systems. The results show that the
overwhelming majority (92%) of the respondents agree that
e-SCM systems alleviate both push- and pull-based
oscillating demand order variability in the supply chain
network. The systems further enhance optimal inventory
positioning (64%), while achieving better coordination on
quasi-real-time information sharing (76%). These key
theoretical components of this study provide considerable
insight into the role of electronically enabled-SCM systems
and possible mitigation mechanisms for consumer DoV.
Electronic linkages between supply-side and demand-side
partners indicate better information sharing communication
on inventory positioning to achieve integrated supply chain
management processes. The e-SCM systems have the ability
to deliver rapid responses to demand variability and supply
changes in order to reduce supply chain costs and the
opportunity cost of lost sales. The e-SCM systems
ameliorate the amplification of DoV and ultimately respond
directly to pull-based consumer demand in the network.
Descriptive statistics
Measures of dispersion and central tendency provide a
summary indication of the distribution of cases and an
average value by describing a single variable within the
exploratory study. This section of the study advocates that e-
SCM systems (M = 4.56) are the most significant systems to
alleviate DoV in the FMCG industry. These systems seem to
create agility and a high level of flexibility to respond
rapidly to changing market requirements from diverse
customers by quickly delivering the right products and
services through effective integration. The e-SCM system is
described as “a mechanism to integrate trading supply chain
partners at technical, operational and business level with
efficient real-time information sharing and active
coordination” to mitigate the bullwhip effect (Ke, Lui, Wei,
Gu & Chen, 2009:839).
The semantic view of electronically-enabled supply chain
management underpins the effective updated demand
forecast (M = 4.04 with 0.996 std deviation) wherein
organisations jointly participate in updating the demand
forecast across the stream sites of a supply chain. Although
the e-SCM systems are significant in improving flexibility,
future strategic communication (M = 3.88) and informal and
formal information sharing (M = 3.92) in the dynamic
market, as well as information exchange (M = 4.00), are
associated with a high order fulfillment rate and a shorter
order cycle time to enhance supply chain performance
targets in the FMCG industry.
The integrated e-SCM systems (M = 3.80) provide
flexibility to respond (M = 3.61) to emergency demand
order changes despite the fact that organisations frequently
hold a large inventory to avert inventory stock outs (M =
3.68). The respondents agree that the electronically-enabled
supply chain system plays a significant role (highly ranked
M = 4.46) in improving willingness to share sensitive and
confidential information (M = 3.60) based on trust, and
offers greater control and access to advanced economic
information (M = 3.66). Furthermore, the system will
enhance profitability (M = 3.70) and establish common
goals and mutual dependency (M = 3.63) between
collaborating supply chain partners to further optimise
inventory positioning (M = 3.65) with a significant
reduction in lead times (M = 3.75). Despite the essential role
of e-SCM systems, organisations tend to order large
quantities to take advantage of transport discounts (M =
3.85) while making a concerted effort to reduce total lead
time (M = 3.67) in terms of material, information and
delivery lead times and delays. The push-based demand
without virtual approach creates price fluctuations (M =
3.70) that tend to inflate demand orders (M = 3.77) during
promotions and periods of shortage.
Descriptive statistics relating to strategic optimisation
The study found that risk pooling (M = 3.90) is the most
significant global optimising and cost-effective strategy to
reduce consumer DoV by aggregating demand across
locations. The consolidated distribution strategy for either
lead time pooling or location pooling keeps inventory close
to customers while hedging against certain forms of
uncertainty. The central inventory location within a supply
chain can exploit lead time pooling to provide some of the
benefits of location pooling without moving inventory far
away from customers. The respondents advocated the
central supply chain distribution system (M = 3.86) as a
global optimisation model for individual retail facilities that
enhances the integration of stock ordering, buying systems
and store replenishment systems. This collaborative supply
chain system focuses on directly involving suppliers to
realise high levels of product availability, service levels and
stock runs. Interestingly, the collaboration, planning,
forecasting and replenishment (CPFR) model (M = 3.74)
with a standard deviation of 1.069 is perceived as the most
important model to provide unlimited access to a retail
store’s replenishment system to ameliorate and manage
DoV.
This model is most suitable for the build-to-order supply
chain (BTOSC) system (M = 3.67) to allow the greatest
degree of order replenishment flexibility and responsiveness
on the basis of market sensitivity, leveraged IT and tactical
postponement agility. The BTOSC system requires the
decoupling point (boundary) to describe forecast-driven and
demand-driven elements with real-time information flow to
achieve whole system optimisation. The demand-driven
strategy, also known as a pull-based supply chain (M =
3.67) with standard deviation of 1.039 is the better ranked
strategy to improve production leagility and coordination of
customer demand and distribution. The system optimises the
processes and is customer demand-driven to enhance
customer satisfaction through a clear understanding of
demand order variation and oscillation. The forecast-driven
model with accurate forecasting (M = 3.65 and SD/σ =

60 S.Afr.J.Bus.Manage.2016,47(2)
1.119) is supported by the respondents to control the
bullwhip effect in linking the inventory positioning and
order replenishment decisions among supply chain trading
members. Order replenishment decisions allow the supplier
managed inventory (SMI) system (M = 3.64) with standard
deviation of 1.074 “to shift responsibility for inventory
planning from manufacturer to supplier” with an oriented
paradigm on customer services and proximity to
downstream customers.
Assessment of reliability and validity
Researchers need to ensure the measure of the right concept
and measure the stability and consistency of the concept,
which is determined by reliability. This study tested
reliability using Cronbach’s alpha, which is a test for
internal consistency. Cronbach’s alpha values (0.60) show
construct validity and that the constructs are measured with
sufficient reliability. This statistic provides an indication of
the average correlation amongst all the items: reliability is
achieved as Cronbach’s alpha value is equal and/or greater
than 0.60 (Bryman & Bell 2007:164). Validity can be
determined by applying certain validity tests in order to
measure the right concept (Bryman & Bell 2007:165).
Content validity measures the adequacy of the sample
(McBurney & White 2004:129), whilst criterion validity
examines the relationship between scale scores and some
specified scores and construct validity measures the degree
to which the scale measures the underlying concept it claims
to measure (Beins & McCarthy 2012:68).
Factor analysis
The purpose of factor analysis is to discover discrete
dimensions in the pattern of relationships among the
variables in the survey instrument. This study provides a
reduced number of six different factors that explain the
pattern of relationships among the variables. Helizer, Hollis,
de Hernandez, Sanders, Roybal and van Deusen (2010:224)
further stress the need to identify the nature of the factors,
the relationships between the fit of the factors to the
observed data, and the amount of random or unique variance
of each observed variable. This statistical technique allows
for the identification of a relatively small number of
individual factors that can be used to represent relationships
among sets of many interrelated variables (Norusis, 1993).
Nevertheless, its major objective is to reduce a number of
observed variables to a small number of underlying grouped
factors in order to enhance interpretability and detect hidden
structures in the data (Treiblmaier & Filzmoser, 2010: 198).
Fabrigar, Wegener, MacCallum and Strahan (1999:272-299)
observe that this statistical technique has been extensively
used in psychological research to understand aspects of
human behavior from the structure of dimensional
constructs, after being popularised by Charles Spearman in
the early 1900s. The purpose of principal component
analysis (PCA) is to derive a relatively small number of
components that can account for a variability found in a
relatively large number of measures (De Coster, 1998:3).
This study uses principal components analysis with varimax
rotation as the method for data analysis and the Kaiser
criterion to decide on all factors with eigenvalues greater
than one to be retained for rotation.
Table 1: Factor analysis on KMO and Bartlett’s test, rotated components and Alpha
KMO and Bartlett’s Test
Kaiser-Meyer-Olkin (KMO) Measure of Sampling Adequacy
Bartlett’s Test of Sphericity Approx. Chi-Square
Df
Sig.
.832
3662.946
465
.000
Rotated Component Matrixa
Factor
Loading
Eigenvalues Communalities
Extraction
Alpha
Factor 1: Demand-driven supply chain system
Pull-based System. .781 1.942 .660 .667
Supplier Managed Inventory (SMI) .747 .642 .655
Agility Supply Chain System .709 .628 .741
Factor 2: Electronic supply chain information exchange
Integrated e-SCM systems. .702 1.715 .576 .834
Quality Information .662 .608 .832
Information Velocity. .600* .643 .832
Factor 3: Supply chain inventory variability
Total Lead Time .769 1.342 .659 .834
Inventory Stockouts .722 .666 .834
Price fluctuations .600* .537 .834
Factor 4: Central risk pooling system
Risk Pooling . .810 1.274 .736 .696
CscD System .805 .766 .673
Factor 5: Supply chain demand order quantity
Transport Discounts .723 1.167 .617 .834
Inflated Demand Orders .671 .596 .838
S.Afr.J.Bus.Manage.2016,47(2) 61
Factor 6: Electronic supply chain communication system
Strategic Communication .613 1.136 .608 .834
e-SCM Systems. .600* .441 .842
Informal and Formal Sharing. .600* .524 .833 “Extraction Method: Principal Component Analysis., Rotation Method: Varimax with Kaiser Normalization., a. Rotation converged in 22 iterations. Reliability Statistics: Overall Cronbach’s Alpha = .842, * Values between 0.55 and 0.59 are rounded off into 0.6 to qualify for loadings. (Information
velocity=.553, Price fluctuations=.573, e-SCM systems=.599 and Informal and Formal sharing=.587). Cumulative percentage of variance = 61.735%.
Assumptions in factor analysis
Factor analysis has a propensity to epitomise subjectivity in
imputing factor labels from factor loadings; in the absence
of a panel of neutral experts in the imputation process, factor
interpretations and labels use face validity with strong
rooted theory to infer from factor loadings. According to
Garson (2012:55), there is near universal agreement that
factor analysis is inappropriate when the sample size is
below 50. This study concurs with the suggested general
rule of thumb that at least 300 cases should be used for
factor analysis (Tabachnick & Fidell, 2007:613), while
Sapnas and Zeller (2002) and Zeller (2005) recommend 100
or even 50 cases under some circumstances. Normality
assumption pertains to the significance testing of
coefficients, and factor analysis is a correlation technique,
seeking to cluster variables along dimensions (Garson,
2012:59).
The construct validity was evaluated using Cronbach’s
Alpha reliability test while the convergent validity of the
instrument was assessed by examining the factor loadings.
Cronbach’s Alpha values range from 0.655 to 0.842, which
implies reasonable reliability of the scales. This study
generated a number of larger variables into six loaded
factors with an overall value of Cronbach’s alpha (0.701).
The purpose is to capture as much information as possible
from the original data set using an interdependence tool.
This omnibus alpha value reflects good internal consistency
reliability in terms of the correlations amongst the factors
and the adopted measurement scales. The Bartlett test of
sphericity indicated that correlations exist among the
variables (measures of sampling adequacy of 0.832, chi-
square of 3662.946, degree of freedom of 465 and
significant value of 0.000). By the same token, the Kaiser-
Meyer-Olkin (KMO) test provided the measure to quantify
the degree of intercorrelations among the variables and the
appropriateness of the interdependence technique.
Exploratory factor analysis was applied to ensure the
unidimensionality of the scales. Both principal component
analysis and varimax rotation in SPSS were chosen to
identify the factors where the number of factors was not
specified in advance. The variance explained by the
combination of the six dimensions is 61.735% while the
“supply chain information integration system” dimension
explained the biggest part of the variance (variance =
21.071%). In an attempt to understand how much of the
total variance of all variables is covered by the factor, all six
factors have eigenvalues over 1.0, which bestow more
credibility on the factor analysis results.
This study developed six tacit constructs that can be
transformed into explicit bullwhip effect challenges and
optimal mitigation strategies. It tentatively achieved its
objectives by incisively developing bullwhip effect
dimensions together with efficient optimal mitigation
strategies towards ameliorating DoV in the FMCG industry.
The conceptual patterns depict relations between the
extracted principal six bullwhip effect dimensions using the
varimax rotation method and their respective sub-
components. This study developed conceptual patterns of
six key new bullwhip effect dimensions that are all related
to either bullwhip effect challenges or supply chain
optimisation business performance outcomes.
Demand-driven supply chain system
The first dimension focuses on enriching the upstream site
with customer and demand-driven inventory positioning by
inducing velocity and flexibility in the supply chain to
ameliorate consumer DoV. The principle of agile supply
chains in particular, enhances customer satisfaction through
optimum processes and customer-driven-demand from the
pull-based supply chain as orders move upstream on real-
time information sharing systems (Cachon & Terwiesch,
2009; Simchi-Levi et al., 2008; Mason-Jones et al., 2000).
The supplier managed inventory partnerships resemble
vendor managed inventory (VMI) partnerships but the
supplier takes responsibility for managing the supply chain
inventory. In an integrated e-SCM system, the retailers
transmit their point-of-sale data to the vendor’s central hub
of data to facilitate centralised control and management. The
magnitude of collaboration between supply chain partners
will allow supply chain coordination on production
schedules, forecast demand and demand order replenishment
frequencies to subdue the bullwhip effect.
Electronic supply chain information exchange
The second dimension focuses on how the attributes of
clockspeed quality information sharing improve the
integrated e-SCM systems for shorter order cycle times and
higher order replenishment frequencies. Electronically-
enabled information exchange systems improve the quality
and velocity of information sharing through reciprocal
interdependence and integrated coordination both across and
within firms. Chopra and Meindl (2007) and Chatfield, Kim,
Harrison and Hayya (2004) suggest that IT provides the
tools to gather quality information and analyse real-time
information to make optimal supply chain decisions.
Although this factor is underpinned by immense trust and
shared vision between the supply chain partners, the
industry type and the length of the supply chain tend to
impede the quality of information sharing and velocity of
information flow.

62 S.Afr.J.Bus.Manage.2016,47(2)
Supply chain inventory variability
The third dimension focuses on how the desired service
level in reducing the total lead time prevents stockouts and
overcomes the effect of price adjustment mechanisms.
Although the electronic point-of-sale data sharing system
can reduce total lead times (Simchi-Levi et al., 2008) by
expediting purchase orders and communication, the
manufacturing processes and schedules indicate difficult
challenges to shorten lead times (Cachon & Terwiesch,
2009). In this regard, the desired service level to purchase
and hold a large quantity of inventory in the supply chain
network is required to prevent stock outs and to overcome
the effect of price fluctuations during promotions.
Central risk pooling system
The fourth dimension focuses on how demand order
aggregation across locations ensures on-time delivery of
customer orders at desired stock levels. In other words, the
central supply chain distribution systems have the potential
to allow manufacturers and suppliers to orchestrate their
capacity planning and demand forecast within a central
pooling location, while the retailers try to ensure on-time
delivery of customer orders at desirable stock level. Wanke
and Saliby (2009) and Rojas (2007) consider consolidation
efforts in terms of inventory centralisation, order splitting
and transshipment as cornerstone tools to measure inventory
costs, service levels and total costs. Risk pooling occurs
because the centralised system takes advantage of the
concave nature of safety stock requirements. According to
Snyder and Shen (2011:146), the excess inventory at the
low-demand distribution centre can be used to make up the
shortfall at the high-demand distribution centre in the
centralised system. If the distribution centres are
consolidated into a single distribution centre, this super-hub-
distribution centre serves total demand. Its mean (μC =
∑ 𝝁𝒊𝑵𝒊=𝟏 ) and standard deviation
(𝝈𝑪 =√∑ ∑ 𝝈𝒊𝒋𝑵𝒋=𝟏
𝑵𝒊=𝟏 ) in a centralised system show that the
optimal base-stock level for the centralised system is 𝑺𝑪 ∗ =
𝝁𝑪 + 𝒛∝ 𝝈𝑪 with optimal expected cost
E[CC] = 𝜼σC = η√∑ ∑ 𝝈𝒊𝒋𝑵𝒋=𝟏
𝑵𝒊=𝟏 where a single distribution
centre system is formed by merging the distribution centres
in a centralised system,
E[CC ] ≤ E[CD] (Snyder & Shen, 2011).
Supply chain demand order quantity
The fifth dimension describes the conventional cause of the
bullwhip effect when the downstream supply chain inflates
demand order quantities to take advantage of transport
discounts. The customers tend to accumulate a safety stock
target with distorted demand signals. Wisner and Stanley
(2008) cautions that, this results in “unnecessary additions to
production capacity, warehouse space and transport
investments”. If the distorted demand order quantity for
earning transport discounts does not freely allow order
cancellations in a supply chain, the inflated orders and
gaming behaviour strategies become major causes of the
bullwhip effect.
Electronic supply chain communication system
The sixth dimension focuses on how e-SCM capabilities
facilitate the communication of future strategic requirements
in a supply chain to enhance demand order replenishment
frequencies. The electronic system can enhance a trust-
based coordination structure, better communicate demand
order replenishment requirements for consistent product
availability and accelerate physical product and information
flow capacity.
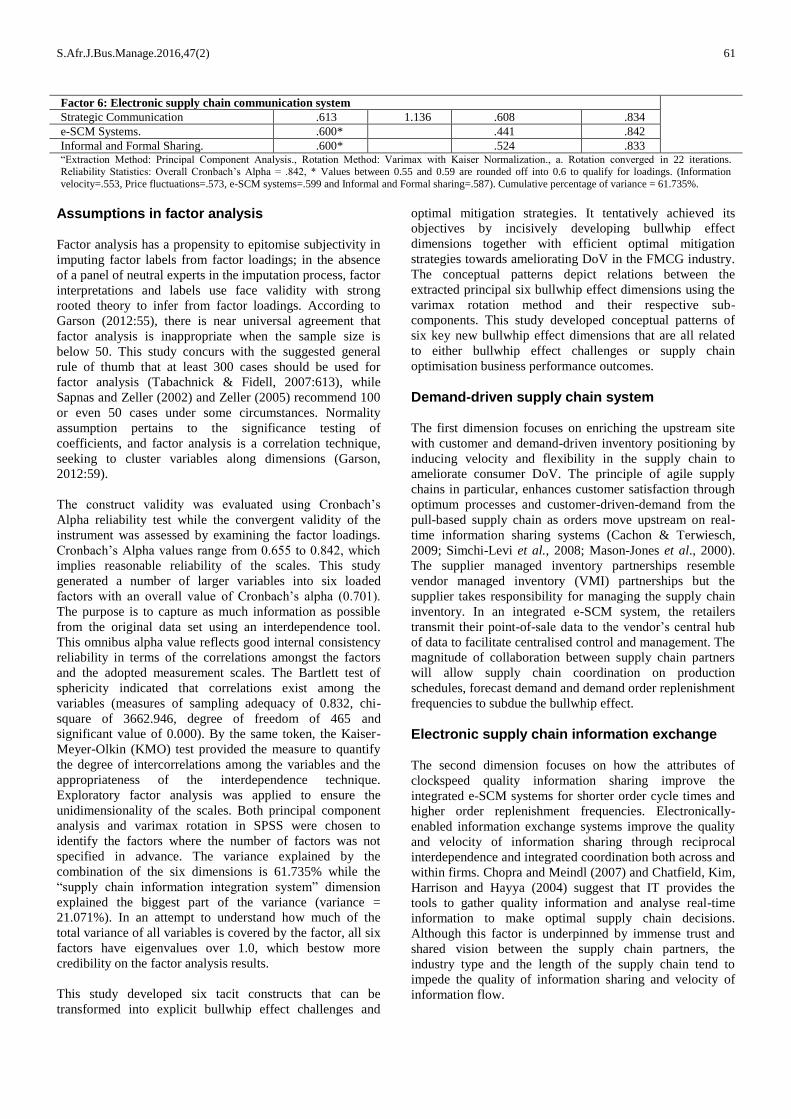
Figure 2: Push-pull theory of oscillation
Source: Developed by the researcher from the empirical
study
In the push theory of oscillation, there is an amplification of
DoV from the custodians of information (downstream
retailers) that generate orders with distorted demand
information moving upstream. In the pull theory of
oscillation, the amplification of DoV is based on reactions
(which all ultimately respond directly to genuine customer
demand – as Anti-Oscillation Effect) from integrated e-SCM
systems and synchronised processes of decision-making
responsibility across extended enterprises. The study reveals
that the surfaces of bullwhip and those of maximum
oscillations of inventories can be obtained as the push theory
of oscillation, with the weight given to the history of the
demand and the importance given to the last incoming order.
This means that the bullwhip and the maximum oscillation
surfaces have a similar characteristic shape for all demand
(supply chain inventory variability and demand order
quantity). The push theory of oscillation describes the
oscillating DoV that originates and germinates from the
operational downstream-site of demand information
distortion and disintegrated order replenishment policies
within supply chain networks. It is also driven by multiple
causes of the bullwhip effect, such as total lead times,
inventory stockouts, price fluctuations, transport discounts
Electronic information exchange Electronic communication systems
Demand-driven supply chain systems
Supply chain inventory variability
Supply chain demand order quantity
Pull Theory of Oscillation
Push Theory of Oscillation
Push-Pull Theory of
Oscillation
Bullwhip Effect
vs Anti-Bullwhip
Effect
Mirror of Information sharing,
inventory positioning & E-enabled
SCM systems
Decoupling Paradigm Point
Anti-Oscillation Effect
Dimensions of Supply
Chain Factors

S.Afr.J.Bus.Manage.2016,47(2) 63
and inflated demand orders. The pull theory of oscillation
describes the oscillating DoV that is controlled and
customer-to-customer driven by the innovative exploitation
of integrated electronically-enabled supply chain systems,
quality knowledge and information sharing, and information
velocity on downstream diagnosed customer demand and
upstream engineered market changes. The alleviation of
DoV can be achieved through electronically-enabled supply
chain central hubs for better integrated strategic
communication using informal and formal information. This
pull-based, innovative theory focuses on enriching upstream
with consumer and demand-driven inventory positioning by
inducing agility within the supply chain networks. In other
words, customer satisfaction is enhanced through the
optimisation process and customer driven-demand from the
pull-based supply chain (Simchi-Levi et al., 2008), an
understanding of demand variation, order oscillations and
demand uncertainty (Jacobs & Chase, 2008), the behaviour
of supply chain partners as orders move upstream, and
information sharing systems (Cachon & Terwiesch, 2009).
In this regard, the pull-based theory of oscillation initially
focuses on a sysnchronised supply chain approach as supply
chain sharing, in terms of both demand visibility and
decision-making responsibility with suppliers that implies
complete inventory and planning collaboration (Ciancimino,
Cannella, Bruccoleri & Framinan, 2012:50). Secondly, the
pull-based theory of oscillation should relate to the
coordination of production planning, inventory management
and distribution activities across the network. The
intensification of global competition and the demand for
better customer service indicate the need for integration
between companies in order to coordinate the processes
along the supply chain (Danese, Romano & Formentini,
2013:126).
The decoupling point also acts as a strategic point for buffer
stock, and its position changes depending on the variability
in demand and product mix (Mason-Jones et al., 2000). An
increase in product mix and fluctuating volume would force
the decoupling point to move upstream, making the supply
chain system more agile to ameliorate the magnified
oscillations upstream. In this study, the decoupling paradigm
point assists in ameliorating order vacillation through central
consolidation and a risk pooling system using the mirror of
the three dimensions of information sharing, visible
inventory positions and electronically-enabled supply chain
systems on the viably regionalised central hubs. The
decoupling point epitomises customer-driven orders on the
upstream site using positive interventions to alleviate the
impact of the bullwhip effect in the FMCG industry.
Customers are becoming more and more aggressive in
demanding new products and services within a short period
of time (closespeed), and the hybrid strategies (push-pull
theory) should facilitate proper understanding of the
underlying causes of oscillation (the push theory of
oscillation) and managing oscillation through the mirror
dimensions (the pull theory of oscillation) to tame and
manage consumer DoV in the supply chain. This dichotomy
of oscillated demand order-push (developing silo-oriented
demand orders and adapting to the changing characteristics
of the industry structure) and demand order-pull has brought
the juxtaposition of these two approaches to the magnitude
of consumer DoV from the characteristics of supply chain
networks. The demand order-pull approach requires the
identification of a broader set of supply chain market
features, including the characteristics of the end markets and
the whole supply chain network economy that affects the
performance of supply chain frequencies to demand order
replenishment rate (Stefano, Gambardella & Verona,
2012:1283). Globalisation and environmental uncertainty
have increased the challenges confronting managers in
delivering services or products to the customer. Dynamic
environments require managers to create new value
propositions that use emphatically-driven chain relationships
characterised by mutual trust, value-adding propositions and
correct service expectations, and product quality and
quantity from organisational flexibility and responsiveness
(aligned with the pull-based theory of oscillation).
Managerial implications
This study developed six tacit constructs that can be
transformed into explicit bullwhip effect challenges and
optimal mitigation strategies. These dimensions reflect a
new perspective in managing and controlling amplification
in the consumer DoV moving upstream the supply chain
network. This study tentatively achieved its objective by
incisively developing bullwhip effect dimensions together
with efficient optimal mitigation strategies to ameliorate
DoV in the FMCG industry. The conceptual patterns
depicted relations between the extracted principal six
bullwhip effect dimensions using the varimax rotation
method and their respective sub-components. The empirical
evidence in this study confirmed a number of bullwhip
effect challenges and the critical role of e-SCM systems,
information sharing, optimal inventory positioning and
global optimisation strategies. The electronically-enabled
supply chain management systems improve effective
communication with efficient real-time information sharing
and better coordination of supply chain processes with
integrated supply chain performance to mitigate the
bullwhip effect. The frequent adoption and implementation
of business to business information technology (B2BIT)
systems allows the migration from an in-house IT
department to align technology clockspeed with a centrally
integrated hub as an agile and highly flexible, responsive
system to address changing market requirements.
References Anderson, V. 2009. Research methods in human resource
management. 2nd Edition. London: Chartered Institute of Personnel
Development.
Babbie, E. & Mouton, J. 2001. The practice of social research.
Cape Town: Oxford.
Bartlett, J.E., II, Kotrlik, J.W. & Higgins, C. 2001. ‘Organisational
research: Determining appropriate sample size for survey
research’, Information Technology, Learning and Performance
Journal, 19(1): 43-50.

64 S.Afr.J.Bus.Manage.2016,47(2)
Beins, B.C. & McCarthy, M.A. 2012. Research methods and
statistics. Upper Saddle River: Pearson Education Inc
Blumberg, B, Cooper, D.R. & Schindler, P.S. 2008. Business
research methods. New York: McGraw-Hill International.
Borgatti, S.P. & Li, H. 2009. ‘On social network analysis in a
supply chain’, Journal of Supply Chain Management, 45(20): 5-22.
Bowersox, D.J., Closs, D.J., Cooper, M.B. & Bowersox, J.C. 2013.
Supply chain logistics management. 4th Edition. Boston: McGraw-
Hill.
Bryman, A. & Bell, E. 2007. Business research methods. 2nd
Edition. New York: Oxford University Press.
Burns, L.R. & Wholey, D.R. 1993. ‘Adoption and abandonment of
matrix management programs: Effects of organisational
characteristics and interorganisational networks’, Academy of
Management Journal, 36(1): 106-138.
Burt, D.N., Dobler, D.W. & Starling, S.L. 2003. World class
supply management: The key to supply chain management. 7th
Edition. New York: McGraw-Hill/Irwin.
Cachon, G. & Terwiesch, C. 2009. Matching supply with demand:
An introduction to operations management. Boston: McGraw-Hill
Irwin.
Cai, X. & Du, D. 2009. ‘On the effects of risks pooling in supply
chain management: Review and extensions’, Acta Methematic
Applicatae, 25(4): 709-722.
Chatfield, D.C. & Pritchard, A.M. 2013. ‘Returns and the bullwhip
effect’, Transportation Research Part E, 49: 159-175.
Chatfield, D.C., Kim, J.G., Harrison, T.P. & Hayya, J.C. 2004.
‘The bullwhip effect – Impact of stockastic lead time, information
quality & information sharing: A simulation study’, Production &
Operations Management, 13(4): 340-353.
Chen, F. 2003. ‘Information sharing and supply chain
coordination’, Operations Research and Management Science,
(11): 341-422.
Chen, F. & Yu, B. 2005. ‘Quantifying the value of leadtime
information in a single-location inventory system’, Manufacturing
Service Operations Management, 7(2): 144-151.
Chen, I.J. & Paulraj, A. 2004. ‘Understanding supply chain
management: Critical research and a theoretical framework’,
International Journal of Production Research, 42(1): 131-163.
Cheng, T.C.E. & Wu, Y.N. 2005. ‘The impact of information
sharing in a two-level supply chain with multiple retailers’, Journal
of the Operational Research Society, (56):1159-1165.
Chiang, W.K. & Feng, Y. 2007. ‘The value of information sharing
in the presence of supply uncertainty and demand volatility’,
International Journal of Production Research, 45(6): 1429.
Choi, H.P. 2008. ‘Supply chain information sharing and the impact
of information errors’, unpublished PhD dissertation, Indiana
University: USA.
Choi, W-H., Kim, S.I., Keum, M.S., Han, W., Ko, H. & Han, D.K.
2011. ‘Acoustic and visual signal based context awareness system
for mobile application’. In: Proceedings of the International
Conference on Consumer Electronics, IEEE, pp. 627-628.
Chopra, S. & Meindl, P. 2007. Supply chain management:
Strategy, planning and operations. 3rd Edition. New Jersey:
Pearson International.
Choudhury, B., Agarwal, Y.K., Singh, K.N. & Bandyopadhyay,
D.K. 2008. ‘Value of information in a capacitated supply chain’,
INFOR, 46(2): 117-127.
Christopher, M. 2011. Logistics and supply chain management. 4th
Edition. Boston: Pearson Publishing.
Ciancimino, E., Cannella, S., Bruccoleri, M. & Framinan, J.M.
2012. ‘On the bullwhip avoidance phase: The synchronised supply
chain’, European Journal of Operational Research, 22(1): 49-63.
Collis, J. & Hussey, R. 2009. Business research: A practical guide
for undergraduate students. Basingstoke: Palgrave.
Cooper, B.R. & Schindler, P.S. 2008. Business research methods.
10th Edition. New York: McGraw-Hill International.
Coyle, J.J., Langley Jr, C.J., Novack, R.A. & Gibson, B.J. 2013.
Managing supply chain: A logistics Approach. 9th Edition. New
York: South-Western, Cengage Learning.
Danese, P., Romano, P. & Formentini, M. 2013. ‘The impact of
supply chain integration on responsiveness: The moderating effect
of using an international supplier network’, Transportation
Research Part E, (49): 126-140.
Davies, M.B. 2007. Doing a successful research project using
qualitative methods. Basingstoke: Palgrave MacMillan.
Ding, X. & Gan, X. 2009. System dynamics model to analysis
oscillation and amplification in the closed-loop supply chain.
International Conference on Management of e-Commerce and e-
Government’, IEEE, Computer Society.
Fabrigar, J.M., Wegener, D.T., MacCallum, R.C. & Strahan, E.J.
1999. ‘Evaluating the use of exploratory factor analysis in
psychological research’, Psychological Methods, 4(3): 272-299.
Frohlich, M.T. & Westbrook, R. 2001. ‘Arcs of integration: An
international study of supply chain strategies’, Journal of
Operations Management. 19(2): 186-200.
Gambardella, A. & McGahan, A.M. 2010. ‘Business-model
innovation: General purpose technologies and their implications for
industry architecture’, Long Range Planning, 43(2/3): 267-271.
Ganesan, S., George, M., Jap, S., Palmatier, R.W. & Weitz, B.
2009. ‘Supply chain management and retailer performance:
Emerging trends, issues, and implications for research and
practice’, Journal of Retailing, 85(1): 84-94.
Garson, G.D. 2012. Factor analysis. North Carolina: Statistical
Associates Publishing.
Hair, Jr, J.F., Babin, B, Money, A.H., & Samouel, P. 2003.
Essentials of business research methods. New York: John Wiley &
Sons, Inc.
Hambrick, D.C. & Fredrickson, J. 2005. ‘Are you sure you have a
sStrategy?’, Academy of Management Executive, 19(4): 51-62.

S.Afr.J.Bus.Manage.2016,47(2) 65
Hartono, E., Li, X., Na, K. & Simpson, J. 2010. ‘The role of the
quality of shared information in interorganisational systems use’,
International Journal of Information Management, 30(5): 399-407.
Heizer, J. & Render, B. 2011. Principles of operations
management. 8th Edition. New Jersey: Pearson Education.
Helizer, D., Hollis, C., de Hernandez, B.U., Sanders, M., Roybal,
S. & van Deusen, I. 2010. ‘Evaluation for community-based
programs: The integration of logic models and factor analysis’,
Evaluation and Program Planning, (33): 223-233.
Hopp, W.J. & Spearman, M.L. 2008. Factory physics. 3rd Edition.
Boston: McGraw-Hill International Edition.
Hornor, M.S. 1998. Diffusion of innovation theory, [online]
<http://www.disciplewalk.com /files/Marianne_S_ Hornor.pdf>.
[Accessed: 20 December 2010].
Hornor, S.H. 2008. Diffusion of Innovation Theory, [online],
http://www.disciplewalk.com files/Marianne_S_Hornor.pdf.
[Accessed: 19 June 2014].
Ifinedo, P. 2011. ‘Internet/e-business technologies acceptance in
Canada’s SMEs: An exploratory investigation’, Internet Research,
21(3): 255-281.
Jacobs, F.R., & Chase, R.B. 2008. Operations and Supply
management: The Core. 2nd Edition, Boston: McGraw-Hill.
Ke, W., Liu, H., Wei, K.K., Gu, J. & Chen, H. 2009. ‘How do
mediated and non-mediated power effect electronic supply chain
management system adoption? The mediating effects of trust and
institutional pressures’. Decision Support Systems, 46:839-851.
Krejcie, R.V & Morgan, D.W. 1970. ‘Determining sample size for
research activities’, Educational and Psychological Measurement,
(30): 607-610.
Lee, H. & Whang, W. 2000. ‘Information sharing in a supply
chain’, International Journal of Technology Management, 20(3/4),
373-87.
Lee, J. & Kim, Y. 1999. ‘Effect of partnership quality on IS
outsourcing: Conceptual framework and empirical validation’,
Journal of Management Information Systems, 15(4): 26-61.
Li, Z. & Gao, L. 2008. ‘The effects of sharing upstream
information on product rollover’, Production and Operations
Management Society, 17(5): 522-531.
Lin, F.R. & Lin, Y.Y. 2006. ‘Integrating multi-agent negotiation to
resolve constraints in fulfilling supply chain orders’, Electronic
Commerce Research and Applications, 5(4): 313-322.
Lin, H. & Huang, N. 2012. ‘Understanding the determinants of
electronic supply chain management diffusion’. Business and
Information, E: 162-178.
Mason-Jones, R, Naylor, B & Towill, D.R. 2000. ‘Engineering the
leagile supply chain’, International Journal of Agile Management
Systems, 2(1): 54-61.
McBurney, D.H. & White, T.L. 2004. Research methods. 6th
Edition. Belmont: Thomson Wadsworth.
McBurney, D.H. & White, T.L. 2007. Research methods. 7th
Edition. Belmont: Thomson Wadsworth.
Migiro, S.O. & Ambe, I.M. 2008. ‘Evaluation of the
implementation of public sector supply chain management and
challenges: A case of study of the central district municipality,
North West Province, South Africa’, African Journal of Business
Management, 2(12): 230-242.
Miragliotta, G. 2006. ‘Layers and mechanisms: A new taxonomy
for the bullwhip effect’, International Journal of Production
Economics, (104): 365-381.
Newbert, S.L. 2007. ‘Empirical research on the resource-based
view of the firm: An assessment and suggestions for future
research’, Strategic Management Journal, 30(8): 909-920.
Norusis, M.J. 2012. IBM SPSS statistics 19 statistical procedures
companion. Upper Saddle River, New York: Prentice Hall.
Oliveira, T. & Martins, M.F. 2010. ‘Understanding e-business
adoption across industries in European countries’, Industrial
Management and Data Systems, 110(9): 1337-1354.
Oliveira, T., Thomas, M. & Espadanal, M. 2014. ‘Assessing the
determinants of cloud computing adoption: An analysis of the
manufacturing and services sectors’, Information and
Management, 51: 497-510.
Ouyang, Y. 2007. ‘The effect of information sharing on supply
chain stability and the bullwhip effect’, European Journal of
Operational Research, (182): 1107-1121.
Pantano, E. & Di Pietro, L. 2012. ‘Understanding consumer’s
acceptance of technology-based innovations in retailing’, Journal
of Technology Management and Innovation, 7(4): 1-19.
Pride, W.M. & Ferrell, O.C. 2009. Marketing foundations. 3rd
Edition. Australia: Cengage Learning.
Rajaguru, R. & Matanda, M.J. 2013. ‘Effects of inter-
organisational compatibility on supply chain capabilities:
Exploring the mediating role of inter-organisational information
systems (IOIS) integration’, Industrial Marketing Management, 42:
620-632.
Rangaswamy, A & Gupta, S. 1999. Innovation Adoption And
diffusion In The Digital Environment: Some Research
Opportunities [online], available: http://www.google.co.za/url?
sa=t&rct=j&q=&esrc=s&frm=1&source=web&cd=4&ved=0CEE
QFjAD&url=http%3A%2F%2Fwww.researchgate.net%2Fpublicat
ion%2F228587652_4._INNOVATION_ADOPTION_AND_DIFF
USION_IN_THE_DIGITAL_ENVIRONMENT_SOME_RESEAR
CH_OPPORTUNITIES%2Ffile%2F60b7d516d5156dcd08.pdf&ei
=DMOzUpK8fQ7AbuuICgBw&usg=AFQjCNGxJtoeMoKRh65R
QdA3nSfxePbcbQ [2 July 2014]
Rogers, E. 1962. Diffusion of innovations. Fifth edition. [online]
http://www.amazon.com /gp/reader/0029266718/ref=sib_dp_pt#
reader-link. [Accessed: 12 October 2008].
Rogers, E.M. 2003. Diffusion of innovation. 5th Edition. New York:
Free Press.
Rojas, E. 2007. ‘MCS observers on board at-sea transshipment
vessels’, APO Mail Buoy, 10(3): 8-9.
Rugman, A.M. & Verbeke, A. 1998. ‘Corporate strategies and
environmental regulations: an organising framework’, Strategic
Management Journal, 19(4): 363-375.

66 S.Afr.J.Bus.Manage.2016,47(2)
Ryding, D. 2011. ‘A comparative analysis of the relative
importance of service quality for two UK grocery retailers’,
Journal Food Products Marketing, 17(5): 503-517.
Sapnas, K.G. & Zeller, R.A. 2002. ‘Minimising sample size when
using exploratory factor analysis for measurements’, Journal of
Nursing Measurement, 10(2): 135-153.
Schoenherr, T. & Swink, M. 2012. ‘Revisiting the arcs of
integration: Cross-validations and extensions’, Journal of
Operations Management, 30(1-2): 99-115.
Schroeder, R.G. 2008. Operations management: Contemporary
concepts and cases. 4th Edition. Boston: McGraw-Hill International
Edition.
Sebastian, J.G.D. & Lambert, D.M. 2003. ‘Internet-enabled
coordination in the supply chain’, Industrial Marketing
Management, 32(2): 251-263.
Sekaran, U. 2003. Research methods for business: A skill building
approach. 4th Edition. New York: John Wiley & Sons Inc.
Sekaran, U. & Bougie, R. 2009. Research methods for business: A
skill building approach. 5th Edition. New York: Wiley & Sons.
Shane, S.A. 2014. Technology strategy for managers and
entrepreneurs. 1st Edition. New Jersey: Pearson Publishing.
Shih, S.C., Hsu, S.H.Y., Zhu, Z. & Balasubramanian, S.K. 2012.
‘Knowledge sharing – A key role in the downstream supply chain’,
Information & Management, 49: 70-80
Simchi-Levi, D., Kaminsky, P. & Simchi-Levi, E. 2008. Designing
and managing in supply chain: Concepts, strategies & case
studies. 3rd Edition. New York: McGraw-Hill/Irwin.
Snyder, L.V. & Shen, Z.M. 2011. Fundamentals of supply chain
rheory. New Jersey: John Wiley & Sons, Inc.
Sorescu, A., Frambach, R.T., Singh, J., Rangaswamy, A. &
Bridges, C. 2011. ‘Innovations in retail business models’, Journal
of Retailing, 87S (1): S3-S16.
Stefano Di, G., Gambardella, A. & Verona, G. 2012. ‘Technology
push and demand pull perspectives in innovation studies: Current
findings and future research directions’, Research Policy, (41):
1283-1295.
Tabachnick, B.G. & Fidell, L.S. 2007. Using multivariate
statistics. 5th Edition. Boston: Pearson International Edition.
Tarofder, A.K., Marthandan, G. & Haque, A. 2010. ‘Critical
factors for diffusion of web technologies for supply chain
management functions: Malaysian perspective’, European Journal
of Social Sciences, 12(3): 490-505.
Tate, W.L., Ellram, L.M. & Golgeci, I. 2013. ‘Diffusion of
environmental business practices: A network approach’, Journal of
Purchasing & Supply Management, 19: 264-275.
Teece, D, Pisano, G. & Shuen, A. 1997. ‘Dynamic capabilities and
strategic management’, Strategic Management Journal, 18(7): 509-
533.
Teece, D.J. 2007. ‘Explicating dynamic capabilities: The nature
and micro foundations of (sustainable) enterprise performance’,
Strategic Management Journal, 28(13): 1319-1350.
Teece. D.J. 2010. ‘Business models, business strategy and
innovation’, Long Range Planning, 43(2/3): 172-194.
Tidd, J. & Bessant, J. 2011. Managing innovation: Integrating
technological, market and organisational change. 4th Edition. West
Sussex: John Wiley & Sons Ltd.
Towill, D.R. 1997. ‘Forridge – principles of good material flow’,
Production Planning and Control, 8(7): 622-32.
Treiblmaier, H. & Filzmozer, P. 2010. ‘Exploratory factor analysis:
How robust models support the detection of hidden multivariate
data structures in IS research’, Information and Management, (47):
197-207.
Wanke, P.F. & Saliby, E. 2009. ‘Consolidation effects: Whether
and how inventories should be pooled’, Transportation Research
Part E, (45): 678-692.
Warburton, R.D.H. 2004. ‘Analytical investigation of the bullwhip
effect’, International Journal of Production Management, New
York: The Free Press.
Warburton, R.D.H., Hodgson, J.P.E, & Kim, Y.K. 2004. An
analytical investigation of the bullwhip effect NTC S03-MD13s.
NTC Project: S03-MD13s. National Textile Center Annual Report:
November 2004.
Welman, J.C., Kruger, S.J. & Mitchell, B.C. 2005. Research
methodology. 3rd Edition. Cape Town: Oxford University Press
Southern Africa.
Williams, B.D., Roh, J., Tokar, T. & Swink, M. 2013. ‘Leveraging
supply chain visibility for responsiveness: The moderating role of
internal integration’, Journal of Operations Management, 31: 543-
554.
Wisner, J.D. & Stanley, L.L. 2008. Process management: Creating
value along the supply chain, text and cases. Australia: Thomson
South-Western.
Wu, D.Y. & Katok, E. 2006. ‘Learning, communication, and the
bullwhip effect’, Journal of Operations Management, (24): 839-
850.
Wu, I-L. & Chuang, C-H. 2009. ‘Analysing contextual antecedents
for the stage-based diffusion of electronic supply chain
management’, Electronic Commerce Research and Applications,
8(6): 302-314.
Yao, Y., Palmer, J. & Dresner, M. 2007. ‘An interorganisational
perspective on the use of electronically-enabled supply chains’,
Decision Support Systems, 43(3): 884-896.
Yeh, Y. 2005. ‘Identification of factors affecting continuity of
cooperative electronic supply chain relationships: Empirical case of
the Taiwanese motor industry’, Supply Chain Management: An
International Journal, 10(4): 327-335.
Zeller, R.A. 2005. ‘How few cases is enough to do a credible factor
analysis?’, A Monte Carlo Simulation. Manuscript submitted for
publication.
Zott, C. & Amit, R. 2010. ‘Business model design: An activity
system perspective’, Long Range Planning, 43(2/3), 216-2.