Embed Size (px)
Citation preview
Decreasing Avoidable 30-day Rehospitalizations
Anne-Marie J. Audet, MD, MSc, SM
M1Anne-Marie J. Audet, MD, MSc, SM
Barbara Balik, RN, EdD
Amy Boutwell, MD, MPP
Steve Jencks, MD, MPH
Gail Nielsen, BSHCA, FAHRA, RTR
Pat Rutherford, RN, MS
21st Annual National Forum on Quality Improvement in Health CareDecember 7, 2009 Orlando, Florida
Welcome
• Who’s here today?
• Why are you here today?
• What 3 things would you like to learn?
• What would you like to share with this group?
Minicourse Objectives
• Understand key drivers of rehospitalization rates and how national data compare to state/regional findings
• Identify high-leverage changes (and tests of change) to begin to reduce rehospitalizations
• Describe characteristics of a multi-stakeholder quality initiative that crosses organizational boundaries
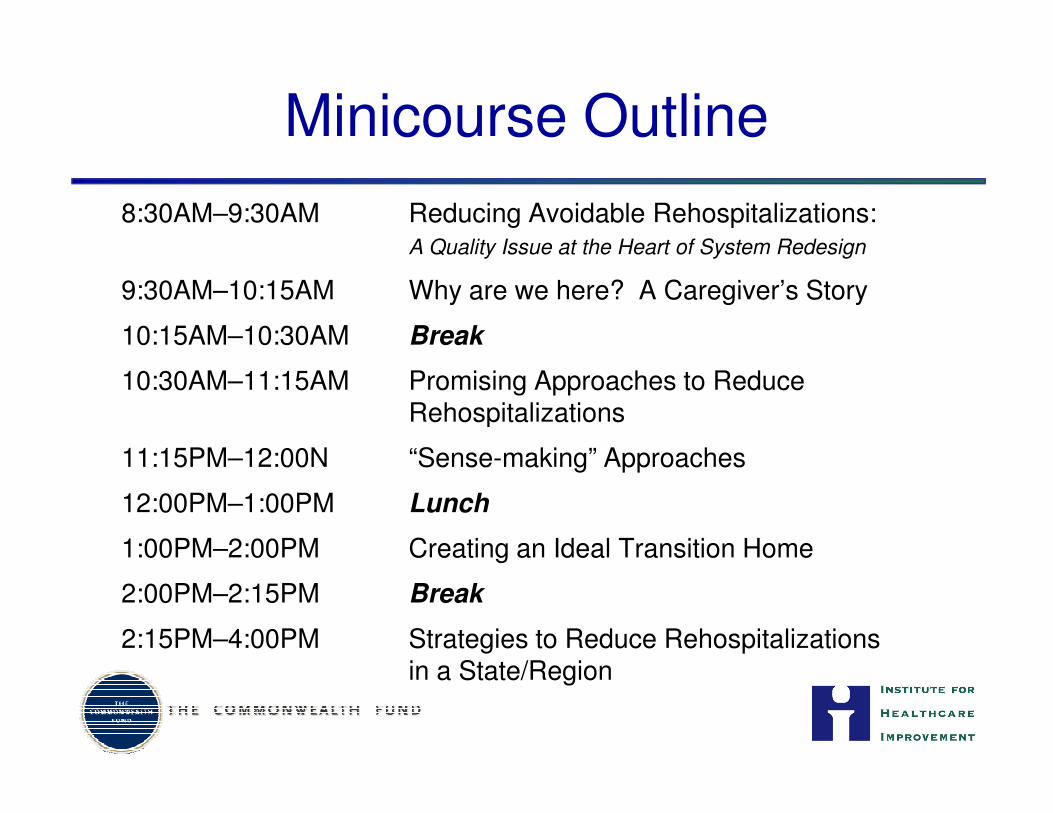
Minicourse Outline
8:30AM–9:30AM Reducing Avoidable Rehospitalizations: A Quality Issue at the Heart of System Redesign
9:30AM–10:15AM Why are we here? A Caregiver’s Story
10:15AM–10:30AM Break
10:30AM–11:15AM Promising Approaches to Reduce RehospitalizationsRehospitalizations
11:15PM–12:00N “Sense-making” Approaches
12:00PM–1:00PM Lunch
1:00PM–2:00PM Creating an Ideal Transition Home
2:00PM–2:15PM Break
2:15PM–4:00PM Strategies to Reduce Rehospitalizations in a State/Region
Reducing Avoidable Rehospitalizations: A Quality Issue at the Heart of System Redesign
Amy Boutwell, MD, MPPDirector of Health Policy Strategy
Co-Principle Investigator, STAAR InitiativeInstitute for Healthcare Improvement
Setting the Stage
Readmissions are a….
• Hospital issue?
• NH/SNF issue?
• Primary care issue?
• Home care issue?• Home care issue?
• Patient issue?
• Politically hot topic, feels like a fad?
• Not the right question, not the right focus (access, ED, patient engagement etc.)?
• A consequence of other forces (uninsured, hospitalists, etc.)?
• Other?
Setting the Stage
• Which of your organizations are:
– Actively working on reducing readmissions?
– Studying and planning work on readmissions?
– Watching and waiting for now to see what will come out of DC?
• If working on readmissions:• If working on readmissions:
─ What‘s your hospital’s motivation for prioritizing this work?
• If studying and planning:
─ What information would be helpful to accelerate your work?
• If watchful waiting:
─ What are your concerns and cautions?
Setting the Stage
Do you know your hospital’s 30-day readmission rates?
� Yes, we track and monitor trends
� Yes, we know readmission rates but for certain conditions (e.g. 15-day HF readmissions)conditions (e.g. 15-day HF readmissions)
� Now we do, because of Hospital Compare data (but don’t have our “own” reports)
� No, we are trying to establish what to measure (deciding upon inclusions and exclusions)
� No, readmissions are not high on our priority list at this time
Rehospitalizations:Why all the attention?Why all the attention?
“The Billion Dollar U-Turn”
• 17.6% of all Medicare hospitalizations are 30d rehospitalizations
─ Accounting for $15 B in spending in 2004
• Not all rehospitalizations are avoidable, but many are
─ 75% “potentially preventable”
─ Accounts for $12B in Medicare spending
─ Heart Failure, Pneumonia, COPD, Acute MI lead the medical conditions─ Heart Failure, Pneumonia, COPD, Acute MI lead the medical conditions
─ CABG, PTCA, other vascular procedures lead the surgical conditions
• There is wide intra-state and inter-state variation
– Medicare 30-day rehospitalization rate varies 13-24% across states
Mark Taylor, The Billion Dollar U-Turn, Hospitals and Health Networks, May 2008
MedPAC Report to Congress, Promoting Greater Efficiency in Medicare. June 2007
Commonwealth Fund State Scorecard on Health System Performance. October 2009
Rehospitalizations are….
• Frequent
- 18% of all Medicare hospitalizations are 30 day re-hospitalizations
- Average >20% for certain patient populations
• Costly
- $15B annually in Medicare
• Potentially avoidable• Potentially avoidable
- 76% of Medicare re-hospitalizations were “potentially preventable”
- 14-46% were assessed as “potentially avoidable” in retrospective clinician reviews
• Actionable for improvement
- Research and quality improvement initiatives have demonstrated >30% reduction of 30-day readmission rates for a variety of populations
Why not yet?
“If rehospitalizations are frequent, costly, and able to be
reduced, why haven’t they been?”
• Hospital-level barriers- Financial disincentives (volume-revenue), no financial incentives, not
part of P4P contracts, not high on priority list, limited disease-specific efforts efforts
• Community-level barriers- Not common to engage organizations across continuum to collaborate
on improving care, lack of IT connectivity, no reimbursement for coordination
• State-level barriers- Lack of population-based data, lack of understanding costs of poor
quality on systems, effect of fragmented payer market and lack of CMS participation
Why not yet?Hospital-Level Barriers
The Wall Street Journal reports [reducing rehospitalizations is] easier said than done. One hospital executive said few programs reimburse the types of care that reduce readmissions, so "[y]ou do it because it's the right thing to do. But doing the right thing is
getting expensive."
Another hospital succeeded in cutting its readmission rate by 4.4 percent between 2006 and 2008, but estimates that the improvement resulted in $225,000 in lost revenue (from admissions) and the new program that made it possible cost $500,000 in operating costs. The hospital expects a 17 percent readmission rate this year (Winslow, 7/28/09).
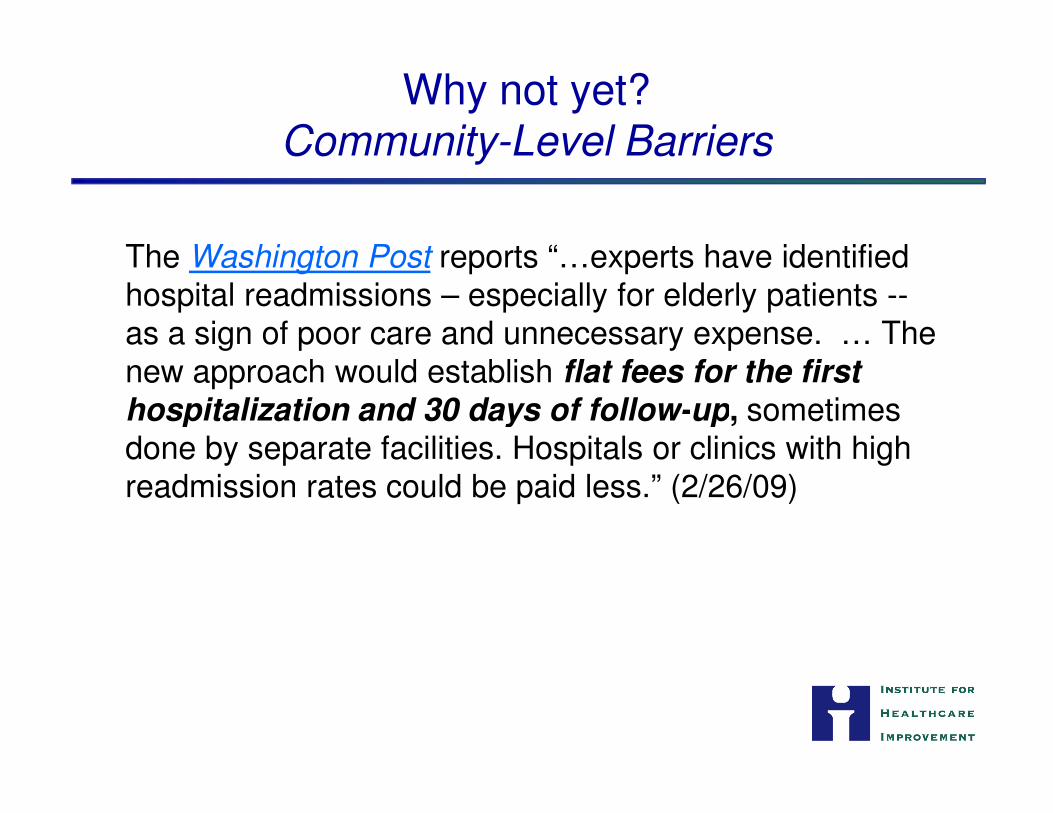
The Washington Post reports “…experts have identified hospital readmissions – especially for elderly patients --as a sign of poor care and unnecessary expense. … The new approach would establish flat fees for the first hospitalization and 30 days of follow-up, sometimes
Why not yet?Community-Level Barriers
hospitalization and 30 days of follow-up, sometimes done by separate facilities. Hospitals or clinics with high readmission rates could be paid less.” (2/26/09)
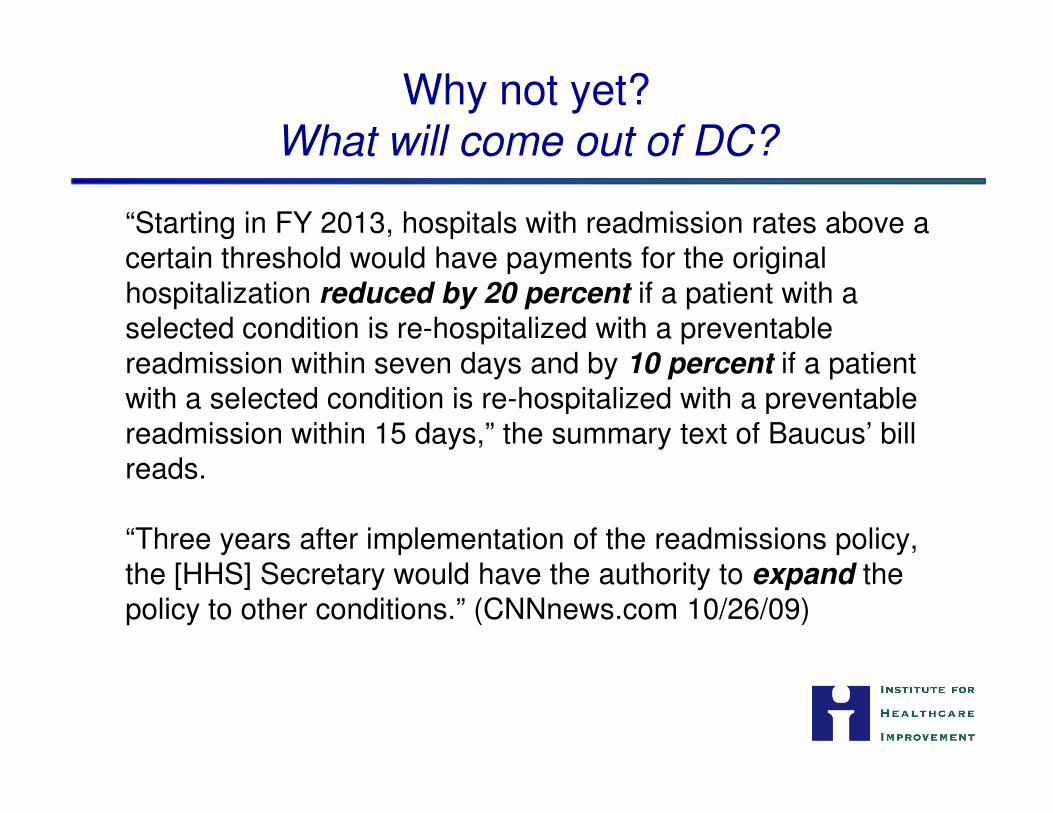
Why not yet?What will come out of DC?
“Starting in FY 2013, hospitals with readmission rates above a certain threshold would have payments for the original hospitalization reduced by 20 percent if a patient with a selected condition is re-hospitalized with a preventable readmission within seven days and by 10 percent if a patient with a selected condition is re-hospitalized with a preventable with a selected condition is re-hospitalized with a preventable readmission within 15 days,” the summary text of Baucus’ bill reads.
“Three years after implementation of the readmissions policy, the [HHS] Secretary would have the authority to expand the policy to other conditions.” (CNNnews.com 10/26/09)
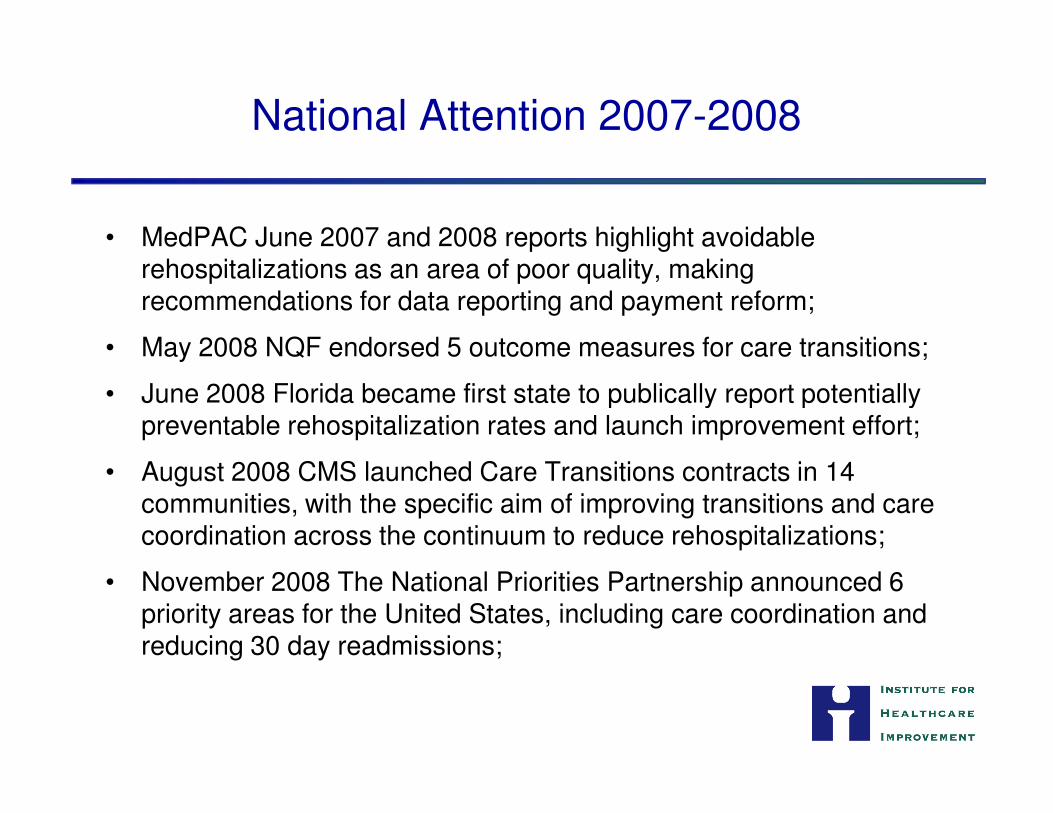
National Attention 2007-2008
• MedPAC June 2007 and 2008 reports highlight avoidable rehospitalizations as an area of poor quality, making recommendations for data reporting and payment reform;
• May 2008 NQF endorsed 5 outcome measures for care transitions;
• June 2008 Florida became first state to publically report potentially • June 2008 Florida became first state to publically report potentially preventable rehospitalization rates and launch improvement effort;
• August 2008 CMS launched Care Transitions contracts in 14 communities, with the specific aim of improving transitions and care coordination across the continuum to reduce rehospitalizations;
• November 2008 The National Priorities Partnership announced 6 priority areas for the United States, including care coordination and reducing 30 day readmissions;
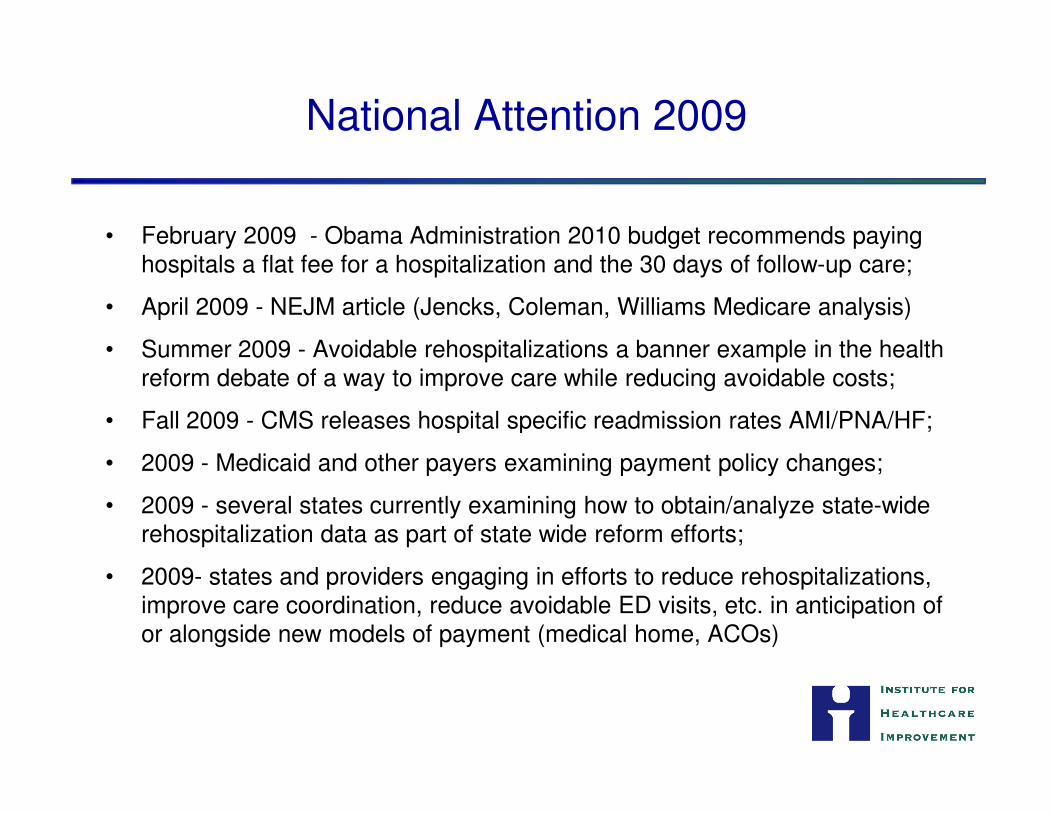
National Attention 2009
• February 2009 - Obama Administration 2010 budget recommends paying hospitals a flat fee for a hospitalization and the 30 days of follow-up care;
• April 2009 - NEJM article (Jencks, Coleman, Williams Medicare analysis)
• Summer 2009 - Avoidable rehospitalizations a banner example in the health reform debate of a way to improve care while reducing avoidable costs;
• Fall 2009 - CMS releases hospital specific readmission rates AMI/PNA/HF;• Fall 2009 - CMS releases hospital specific readmission rates AMI/PNA/HF;
• 2009 - Medicaid and other payers examining payment policy changes;
• 2009 - several states currently examining how to obtain/analyze state-wide rehospitalization data as part of state wide reform efforts;
• 2009- states and providers engaging in efforts to reduce rehospitalizations, improve care coordination, reduce avoidable ED visits, etc. in anticipation of or alongside new models of payment (medical home, ACOs)
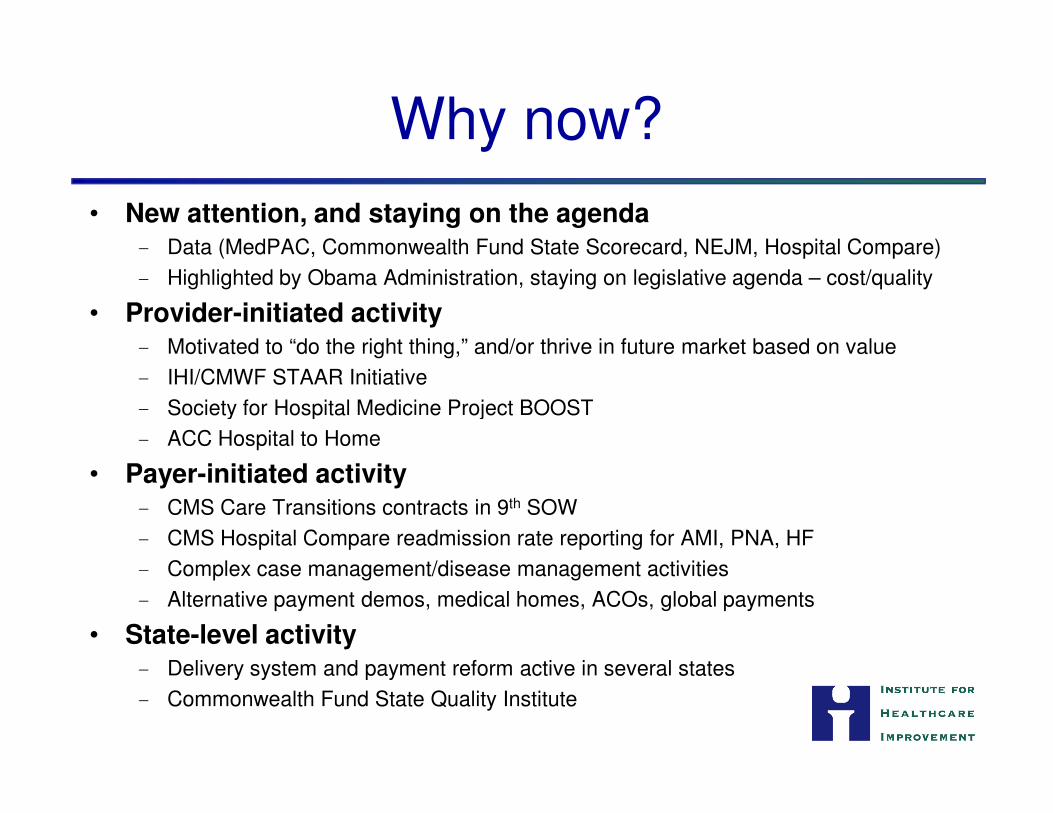
Why now?
• New attention, and staying on the agenda- Data (MedPAC, Commonwealth Fund State Scorecard, NEJM, Hospital Compare)
- Highlighted by Obama Administration, staying on legislative agenda – cost/quality
• Provider-initiated activity - Motivated to “do the right thing,” and/or thrive in future market based on value
- IHI/CMWF STAAR Initiative
- Society for Hospital Medicine Project BOOST- Society for Hospital Medicine Project BOOST
- ACC Hospital to Home
• Payer-initiated activity- CMS Care Transitions contracts in 9th SOW
- CMS Hospital Compare readmission rate reporting for AMI, PNA, HF
- Complex case management/disease management activities
- Alternative payment demos, medical homes, ACOs, global payments
• State-level activity- Delivery system and payment reform active in several states
- Commonwealth Fund State Quality Institute
Rehospitalizations:A quality issue at the heart of system
redesign
19
Stephen F. Jencks, M.D., M.P.H.Consultant in Healthcare Safety and Quality
410-708-1134 443-801-8348
Rehospitalization is a symptom of a
non-system of care
• Many rehospitalizations result from systemic
failures in the transition from hospital to the
next source of care.
20
• This systemic failure allows, and sometimes
causes, clinical deterioration causing
rehospitalization.
Rehospitalization: an opportunity
for redesign
• Aim in reducing rehospitalizations is to
improve the system to avoid deterioration and
rehospitalization.
21
• Accomplishing this will necessitate other
meaningful delivery system changes:
timeliness, communication, performing as a
team over time and across settings
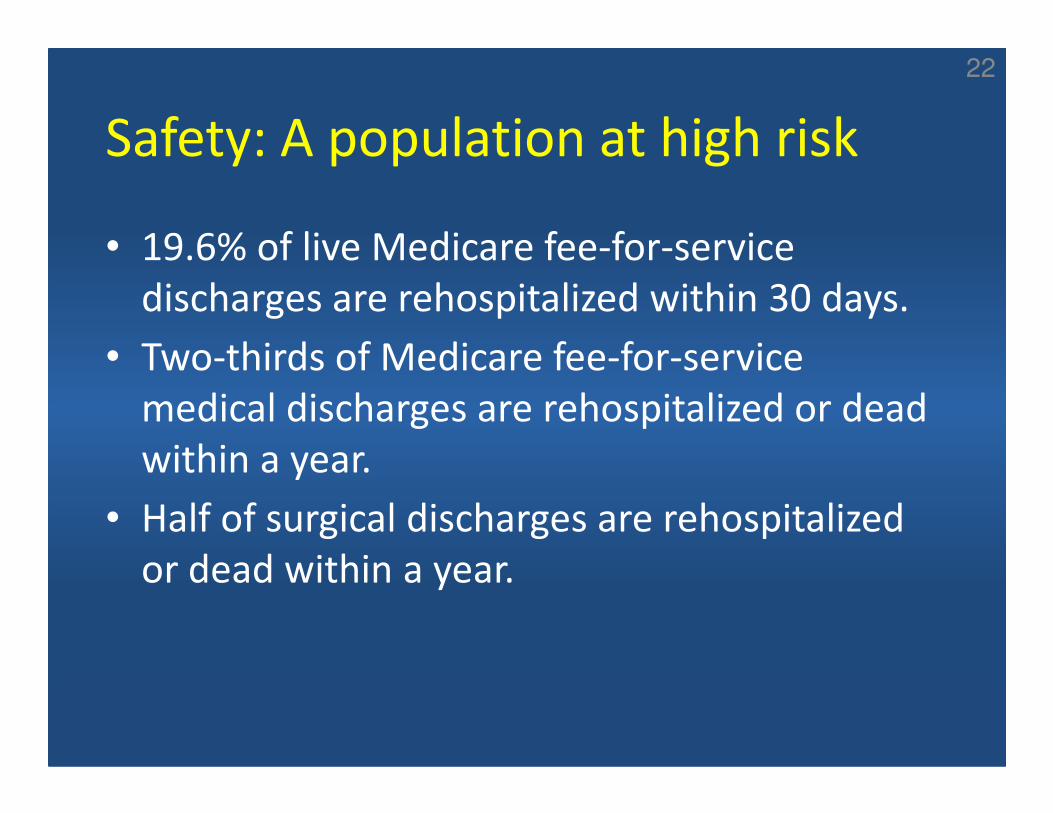
Safety: A population at high risk
• 19.6% of live Medicare fee-for-service
discharges are rehospitalized within 30 days.
• Two-thirds of Medicare fee-for-service
medical discharges are rehospitalized or dead
22
medical discharges are rehospitalized or dead
within a year.
• Half of surgical discharges are rehospitalized
or dead within a year.
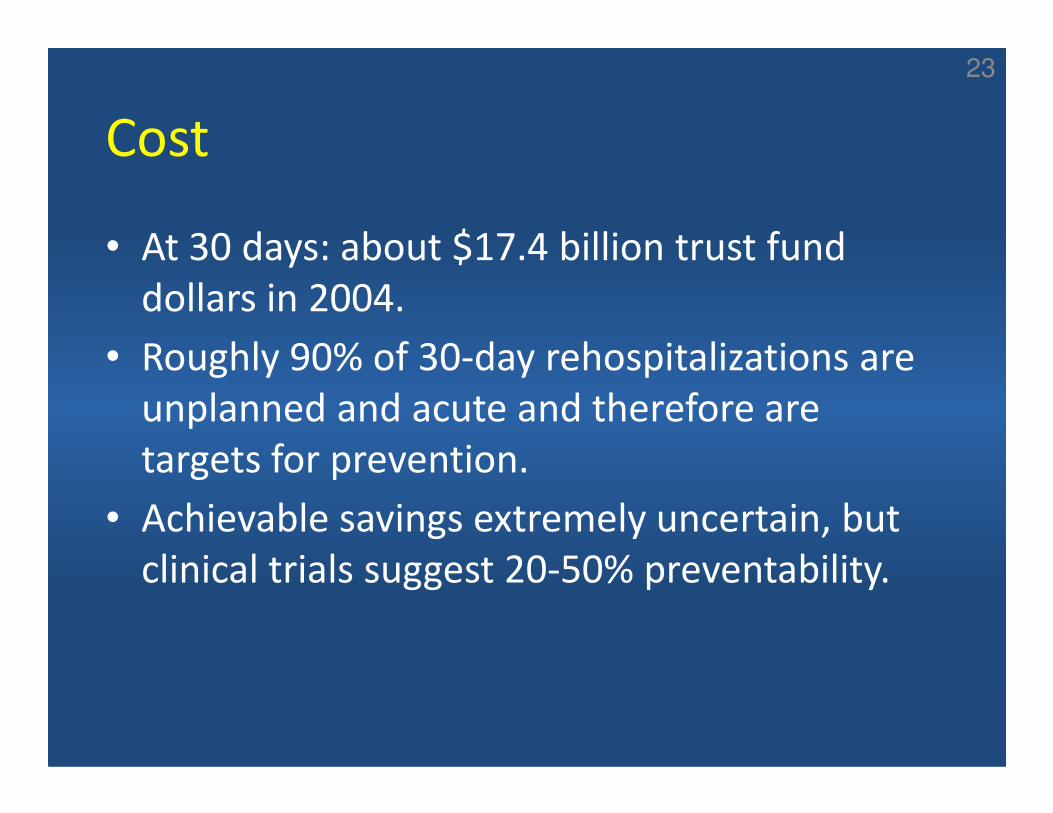
Cost
• At 30 days: about $17.4 billion trust fund
dollars in 2004.
• Roughly 90% of 30-day rehospitalizations are
unplanned and acute and therefore are
23
unplanned and acute and therefore are
targets for prevention.
• Achievable savings extremely uncertain, but
clinical trials suggest 20-50% preventability.
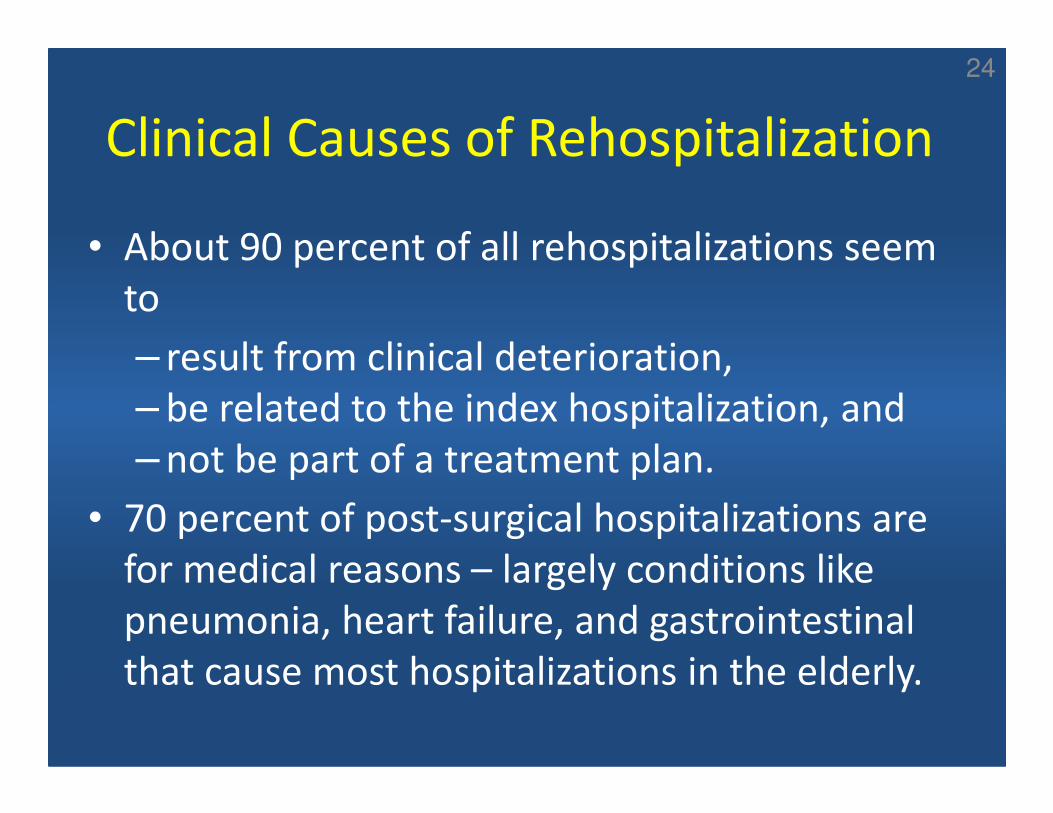
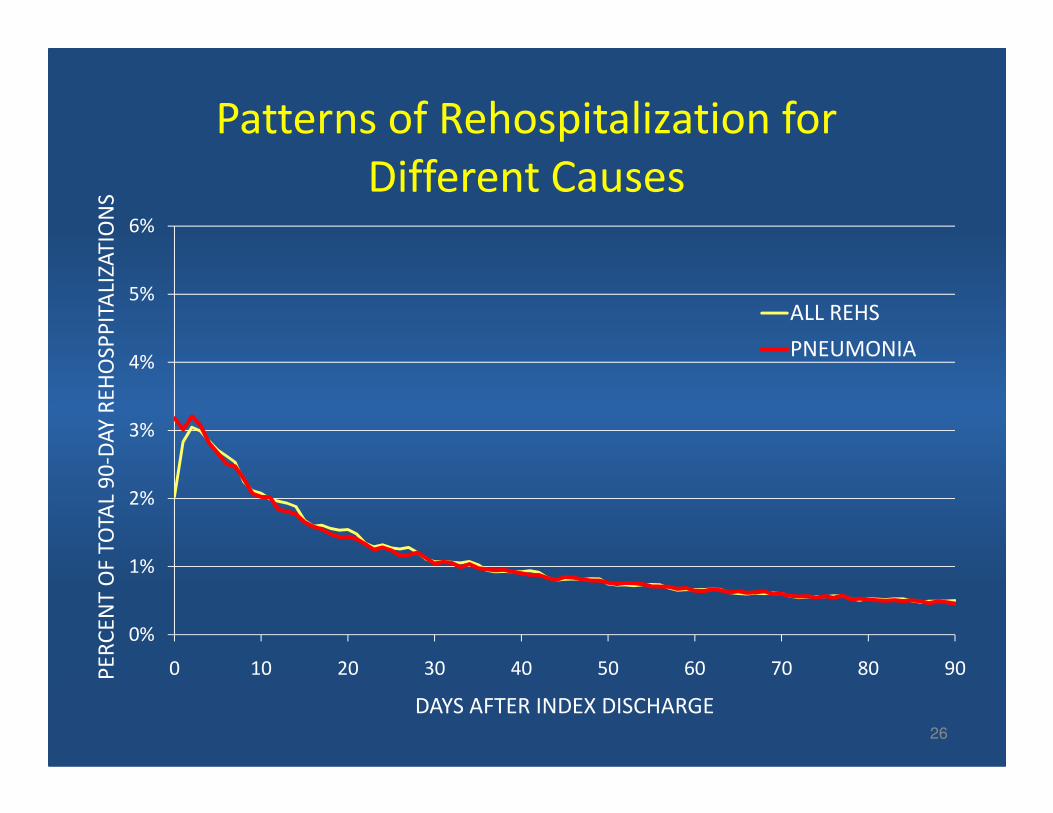
Clinical Causes of Rehospitalization
• About 90 percent of all rehospitalizations seem
to
– result from clinical deterioration,
– be related to the index hospitalization, and
24
– be related to the index hospitalization, and
– not be part of a treatment plan.
• 70 percent of post-surgical hospitalizations are
for medical reasons – largely conditions like
pneumonia, heart failure, and gastrointestinal
that cause most hospitalizations in the elderly.
4%
5%
6%
DA
Y R
EH
OSP
PIT
ALI
ZAT
ION
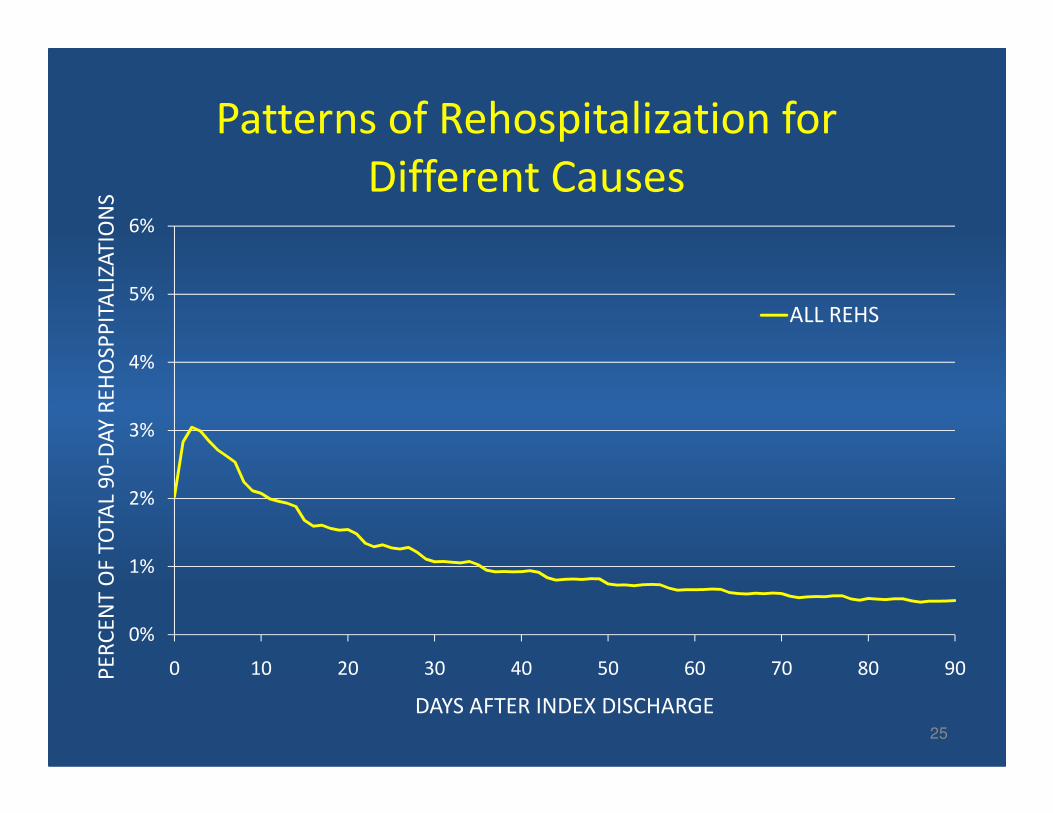
SPatterns of Rehospitalization for
Different Causes
ALL REHS
25
0%
1%
2%
3%
0 10 20 30 40 50 60 70 80 90PE
RC
EN
T O
F TO
TAL
90
-DA
Y R
EH
OSP
PIT
ALI
ZAT
ION
S
DAYS AFTER INDEX DISCHARGE
4%
5%
6%
DA
Y R
EH
OSP
PIT
ALI
ZAT
ION
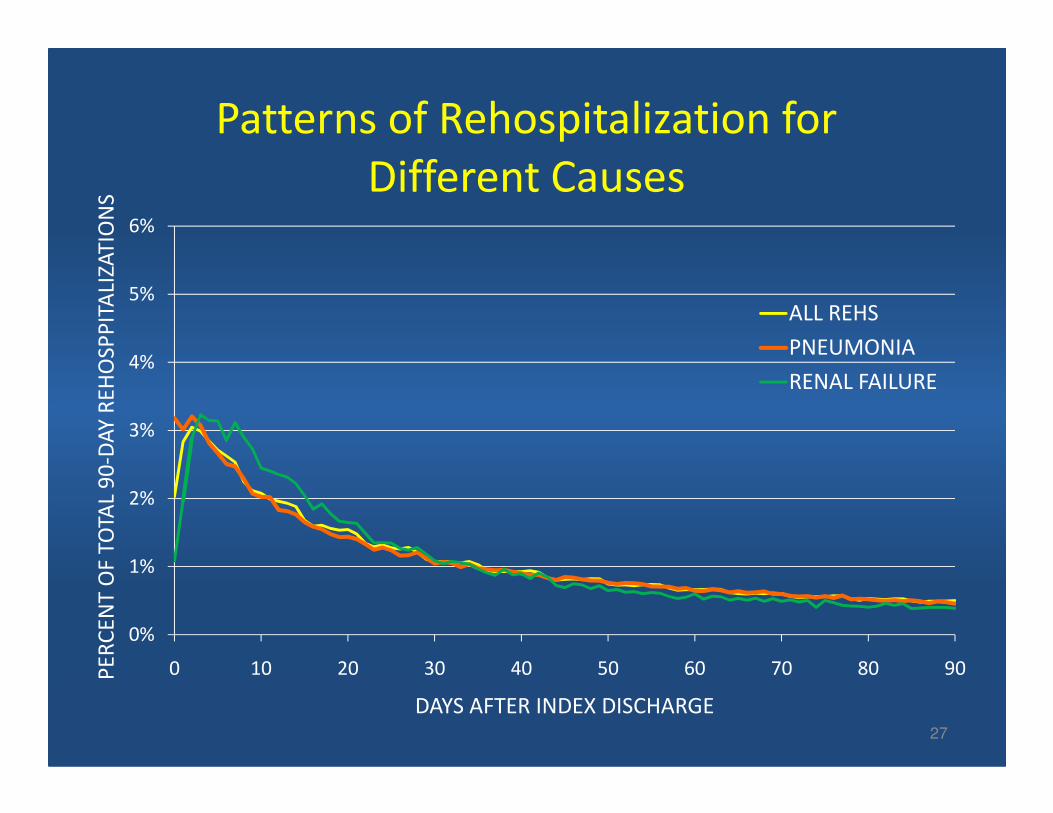
SPatterns of Rehospitalization for
Different Causes
ALL REHS
PNEUMONIA
26
0%
1%
2%
3%
0 10 20 30 40 50 60 70 80 90PE
RC
EN
T O
F TO
TAL
90
-DA
Y R
EH
OSP
PIT
ALI
ZAT
ION
S
DAYS AFTER INDEX DISCHARGE
4%
5%
6%
DA
Y R
EH
OSP
PIT
ALI
ZAT
ION
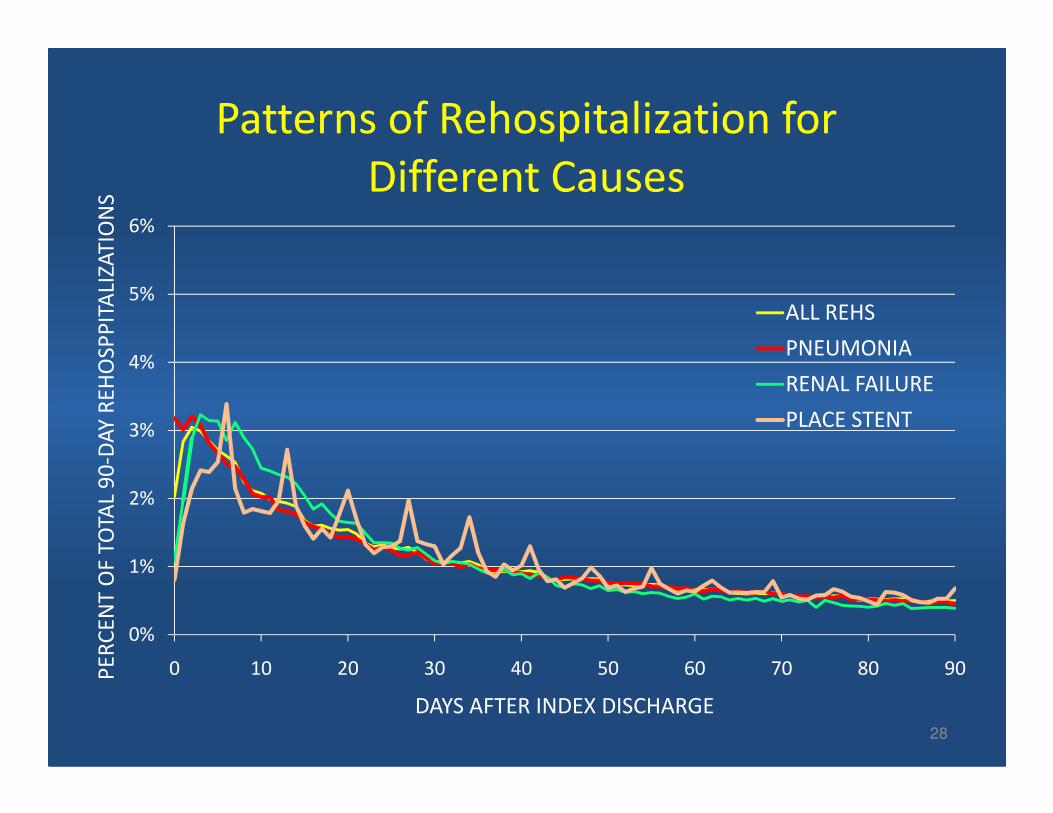
SPatterns of Rehospitalization for
Different Causes
ALL REHS
PNEUMONIA
RENAL FAILURE
27
0%
1%
2%
3%
0 10 20 30 40 50 60 70 80 90PE
RC
EN
T O
F TO
TAL
90
-DA
Y R
EH
OSP
PIT
ALI
ZAT
ION
S
DAYS AFTER INDEX DISCHARGE
4%
5%
6%
DA
Y R
EH
OSP
PIT
ALI
ZAT
ION
SPatterns of Rehospitalization for
Different Causes
ALL REHS
PNEUMONIA
RENAL FAILURE
PLACE STENT
28
0%
1%
2%
3%
0 10 20 30 40 50 60 70 80 90PE
RC
EN
T O
F TO
TAL
90
-DA
Y R
EH
OSP
PIT
ALI
ZAT
ION
S
DAYS AFTER INDEX DISCHARGE
PLACE STENT
4%
5%
6%
DA
Y R
EH
OSP
PIT
ALI
ZAT
ION
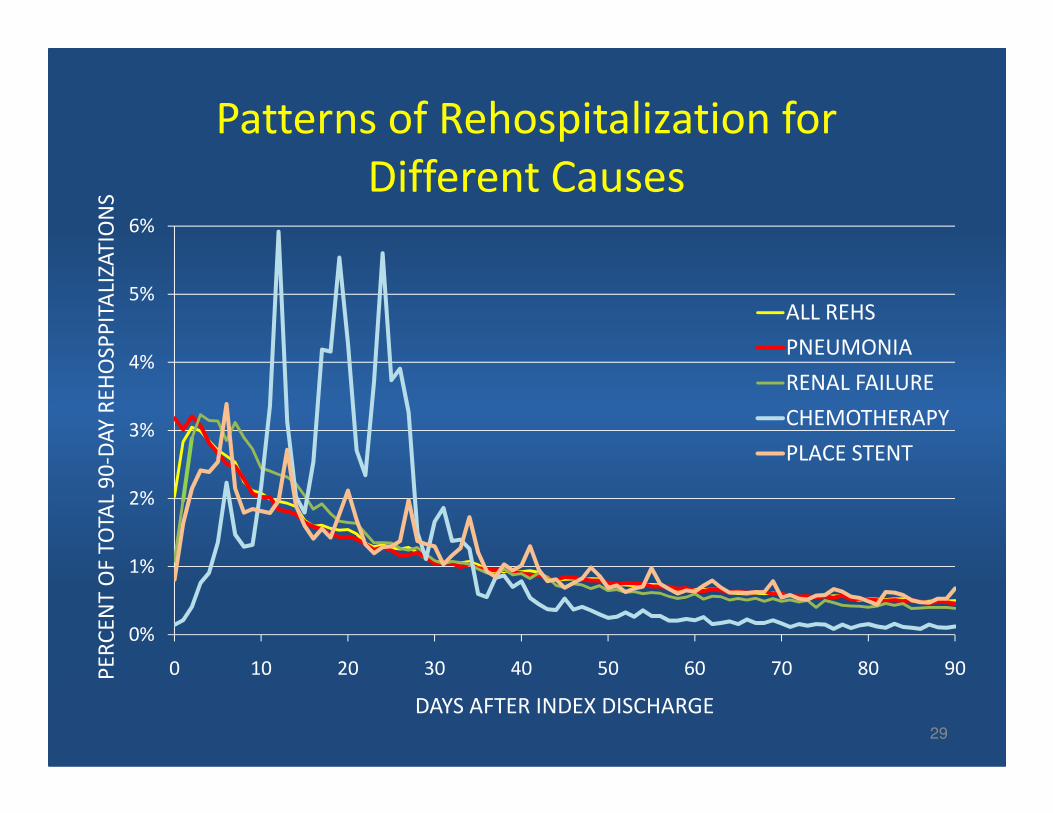
SPatterns of Rehospitalization for
Different Causes
ALL REHS
PNEUMONIA
RENAL FAILURE
CHEMOTHERAPY
29
0%
1%
2%
3%
0 10 20 30 40 50 60 70 80 90PE
RC
EN
T O
F TO
TAL
90
-DA
Y R
EH
OSP
PIT
ALI
ZAT
ION
S
DAYS AFTER INDEX DISCHARGE
CHEMOTHERAPY
PLACE STENT
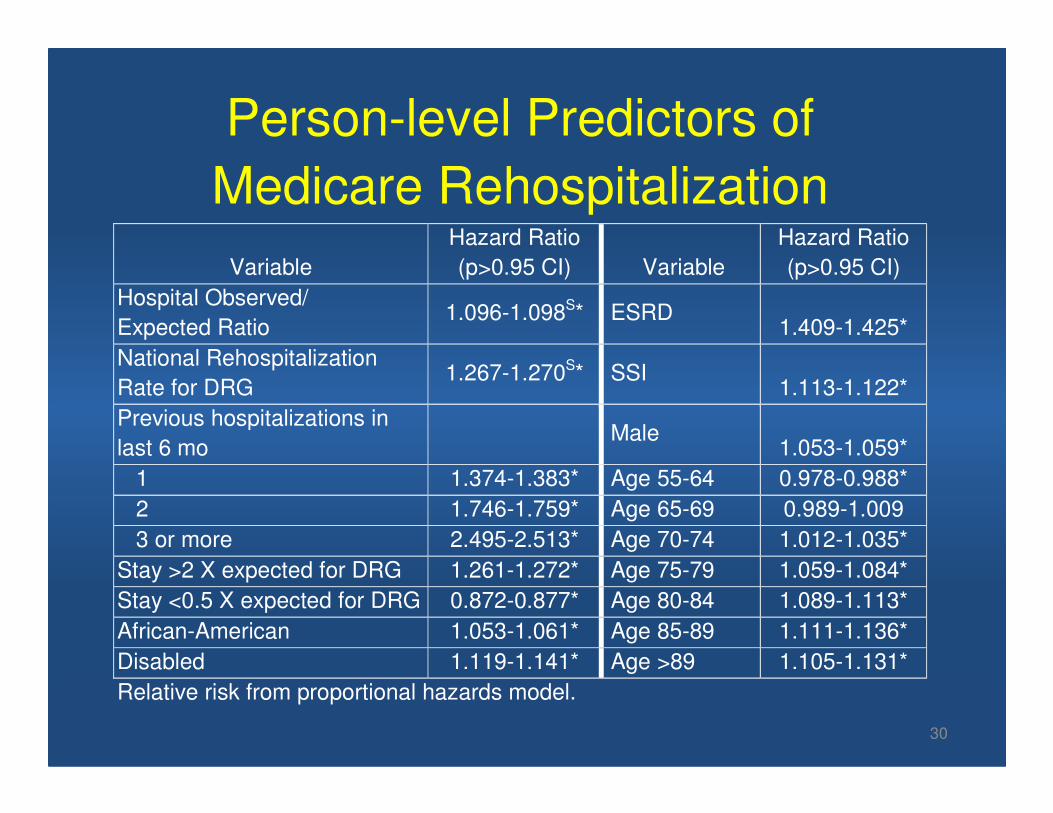
Person-level Predictors of
Medicare Rehospitalization
Variable
Hazard Ratio
(p>0.95 CI) Variable
Hazard Ratio
(p>0.95 CI)
Hospital Observed/
Expected Ratio 1.096-1.098S* ESRD
1.409-1.425*
National Rehospitalization
Rate for DRG 1.267-1.270S* SSI
1.113-1.122*
Previous hospitalizations in
30
Previous hospitalizations in
last 6 mo Male
1.053-1.059*
1 1.374-1.383* Age 55-64 0.978-0.988*
2 1.746-1.759* Age 65-69 0.989-1.009
3 or more 2.495-2.513* Age 70-74 1.012-1.035*
Stay >2 X expected for DRG 1.261-1.272* Age 75-79 1.059-1.084*
Stay <0.5 X expected for DRG 0.872-0.877* Age 80-84 1.089-1.113*
African-American 1.053-1.061* Age 85-89 1.111-1.136*
Disabled 1.119-1.141* Age >89 1.105-1.131*
Relative risk from proportional hazards model.
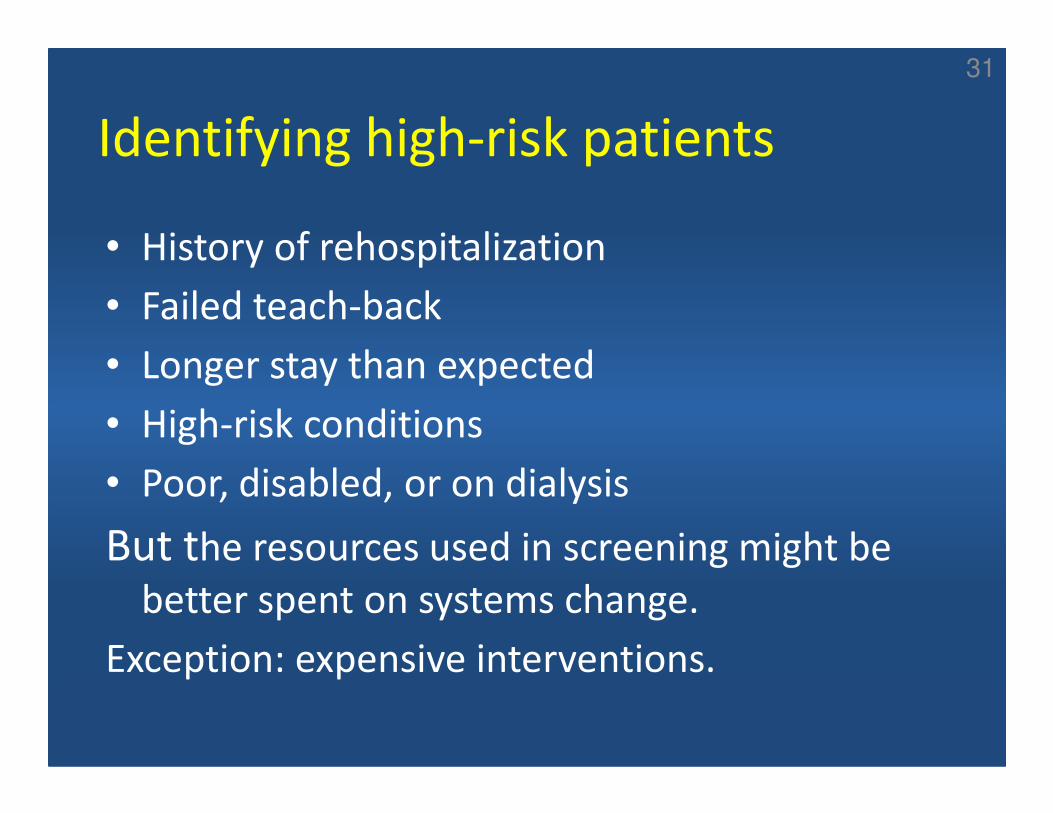
Identifying high-risk patients
• History of rehospitalization
• Failed teach-back
• Longer stay than expected
• High-risk conditions
31
• High-risk conditions
• Poor, disabled, or on dialysis
But the resources used in screening might be
better spent on systems change.
Exception: expensive interventions.
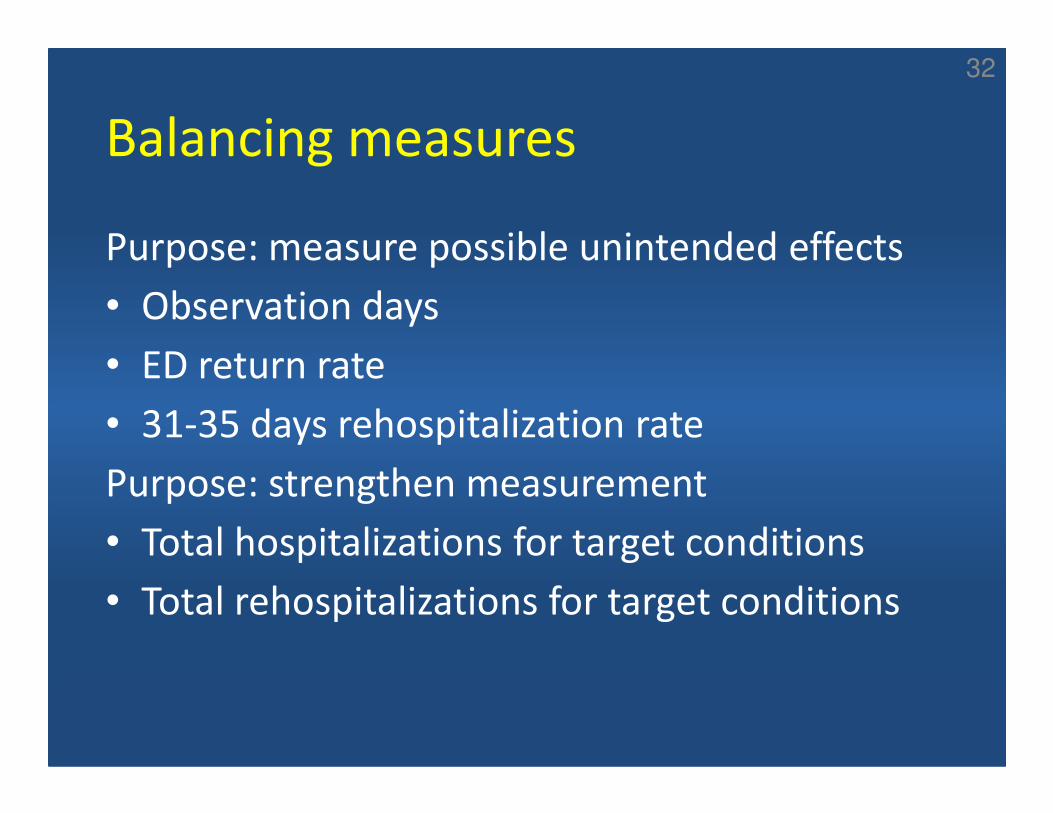
Balancing measures
Purpose: measure possible unintended effects
• Observation days
• ED return rate
• 31-35 days rehospitalization rate
32
• 31-35 days rehospitalization rate
Purpose: strengthen measurement
• Total hospitalizations for target conditions
• Total rehospitalizations for target conditions
Rehospitalization as an opportunity
• Fragmentation of care lies behind many failed
transitions.
• Improving transitions will necessarily reduce
fragmentation.
33
• If we succeed we have established a
precedent for fixing other broken parts of the
health care system.
Commonwealth Fund State Scorecard:Rehospitalizations as opportunity for system redesign
Anne-Marie J. Audet, MD, MSc
The Commonwealth Fund
Anne-Marie Audet MD, MSc, SM
Vice President, Quality Improvement and Efficiency
The Commonwealth Fund
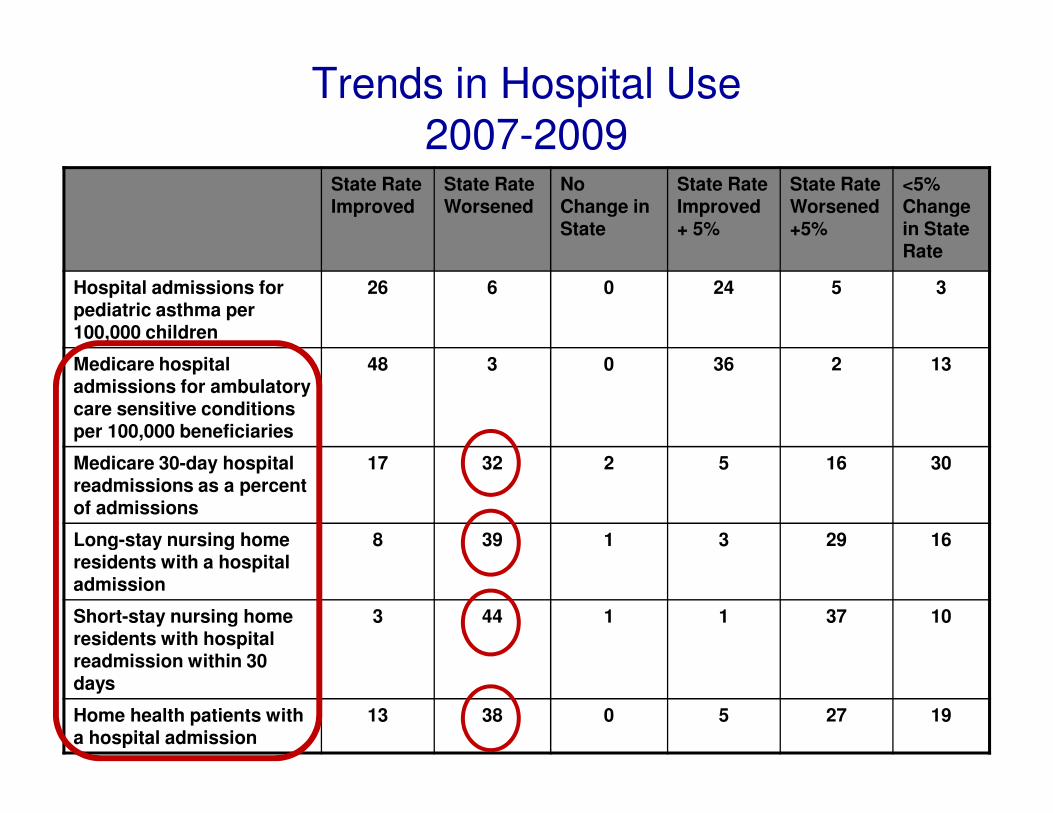
Trends in Hospital Use2007-2009
State Rate Improved
State Rate Worsened
No Change in State
State Rate Improved + 5%
State Rate Worsened +5%
<5% Change in State Rate
Hospital admissions for pediatric asthma per 100,000 children
26 6 0 24 5 3
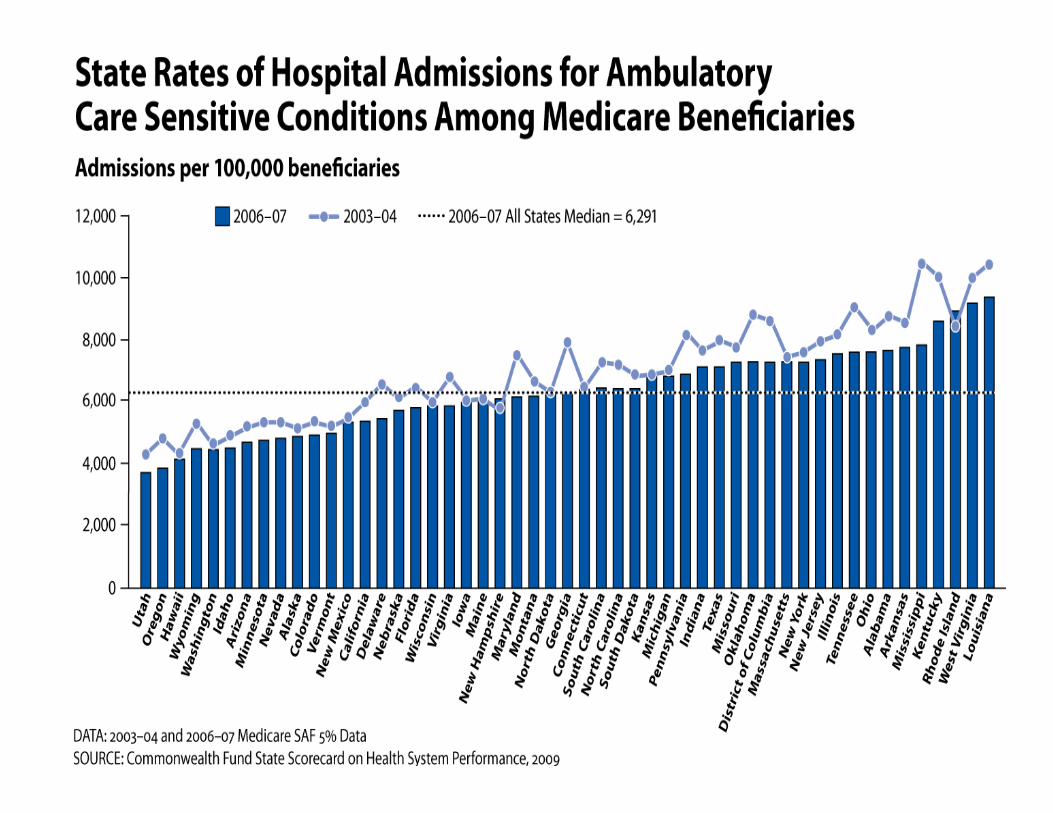
Medicare hospital admissions for ambulatory care sensitive conditions
48 3 0 36 2 13
care sensitive conditions per 100,000 beneficiaries
Medicare 30-day hospital readmissions as a percent of admissions
17 32 2 5 16 30
Long-stay nursing home residents with a hospital admission
8 39 1 3 29 16
Short-stay nursing home residents with hospital readmission within 30 days
3 44 1 1 37 10
Home health patients with a hospital admission
13 38 0 5 27 19
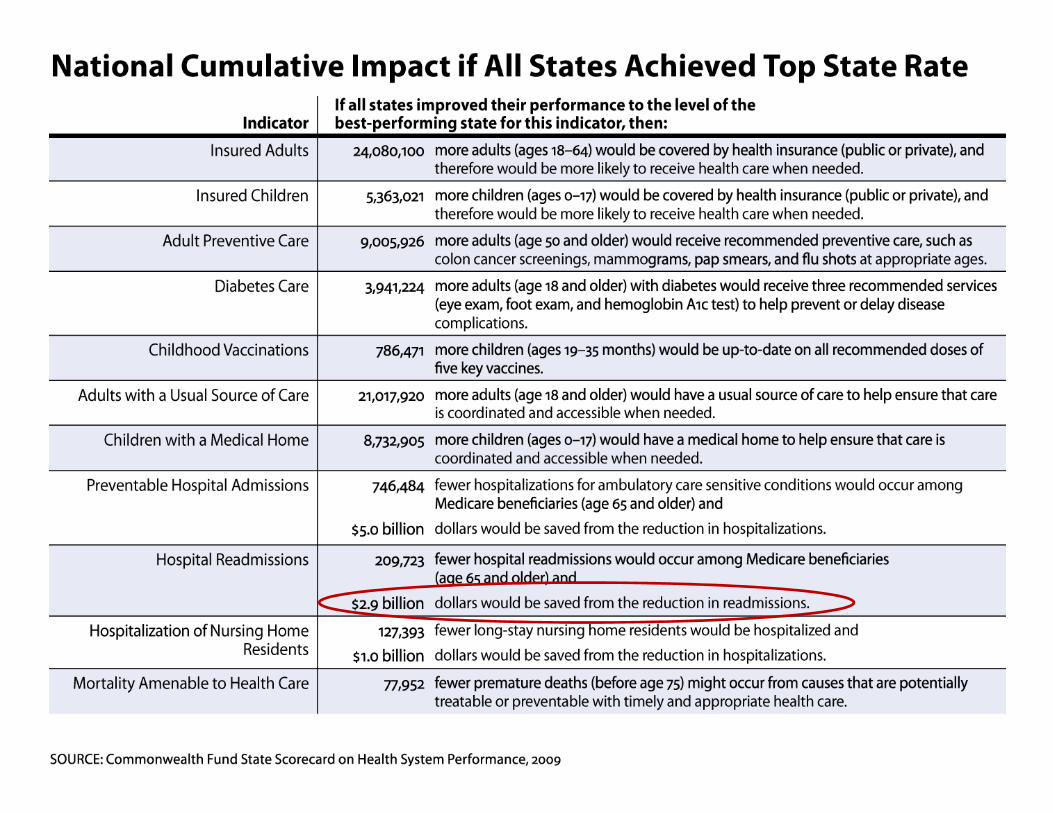
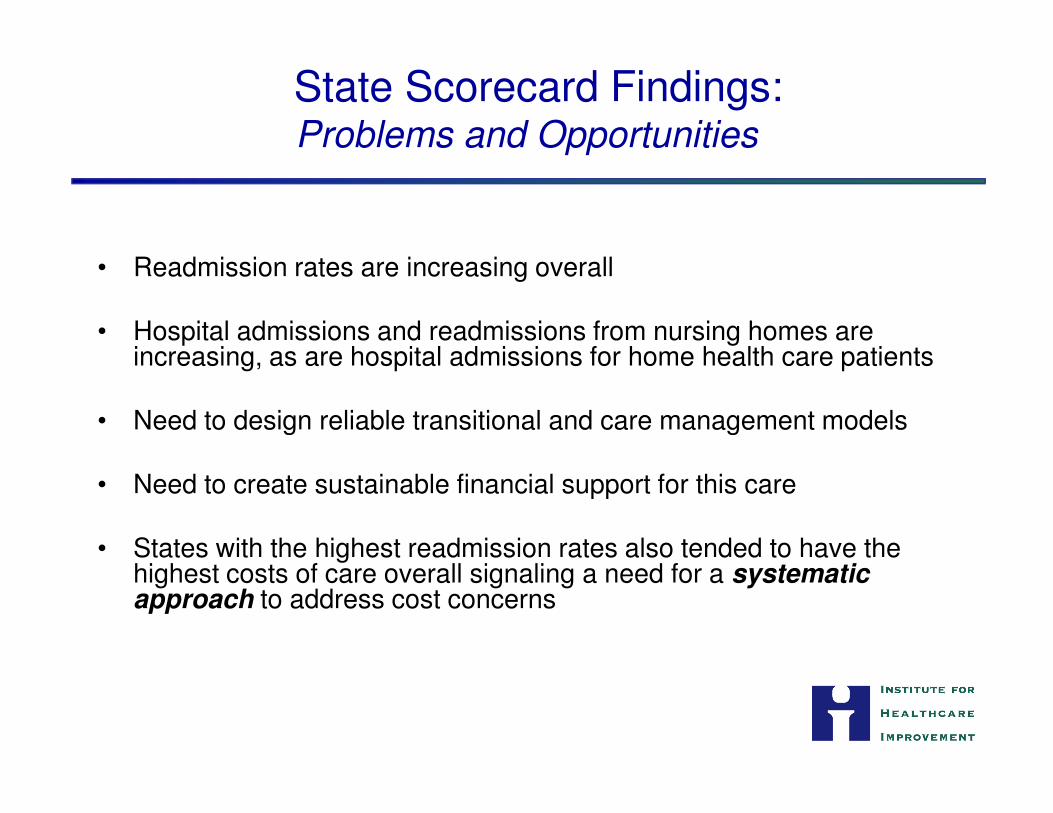
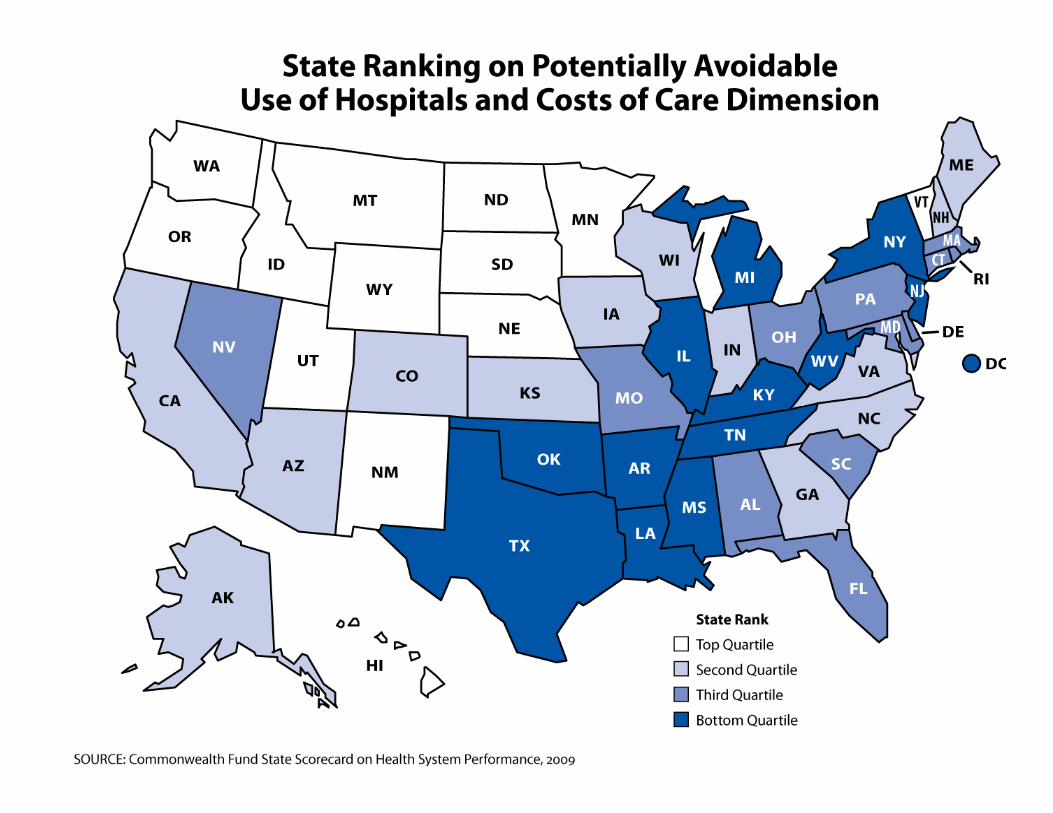
State Scorecard Findings:Problems and Opportunities
• Readmission rates are increasing overall
• Hospital admissions and readmissions from nursing homes are increasing, as are hospital admissions for home health care patients
• Need to design reliable transitional and care management models • Need to design reliable transitional and care management models
• Need to create sustainable financial support for this care
• States with the highest readmission rates also tended to have the highest costs of care overall signaling a need for a systematic approach to address cost concerns
Patient and Family Caregivers’ Experience
Barbara Balik, RN, EdD
Senior Faculty
Institute for Healthcare Improvement
Why we are here?
• Understand rehospitalizations from the patient and family perspective
• Identify two immediate steps to take to partner with patients and family members partner with patients and family members in order to reduce avoidable rehospitalizations
• Identify the resources available to assist healthcare leaders and providers in patient/family centered care

A Family Caregiver’s Story
Grace Lyskawa
Resources
• Partnering with Patients and Families to Enhance Safety and Quality: A mini tool kit; Institute for Family Centered Care─ http://www.familycenteredcare.org
• IHI Patient Experience Evidence─ http://www.ihi.org/ihi/topics/patientcenteredcare/patientcenteredcaregen
eral/emergingcontent/improvingthepatientexperienceofinpatientcare.htm
• IHI Improvement Map • IHI Improvement Map ─ http://www.ihi.org/imap/tool
• Patient-Centered Care Improvement Guide ─ www.pickerinstitute.org
• Teamwork – TeamSTEPPS─ http://www.ahrq.gov/qual/teamstepps
• High Performing Academic Medical Centers in PFCC─ http://www.pickerinstitute.org/Research/shallerdarby.html

Promising Approaches to Reduce Rehospitalizations
Amy Boutwell, MD, MPP
Director of Health Policy Strategy
Co-Principal Investigator, STAAR Initiative
Institute for Healthcare Improvement
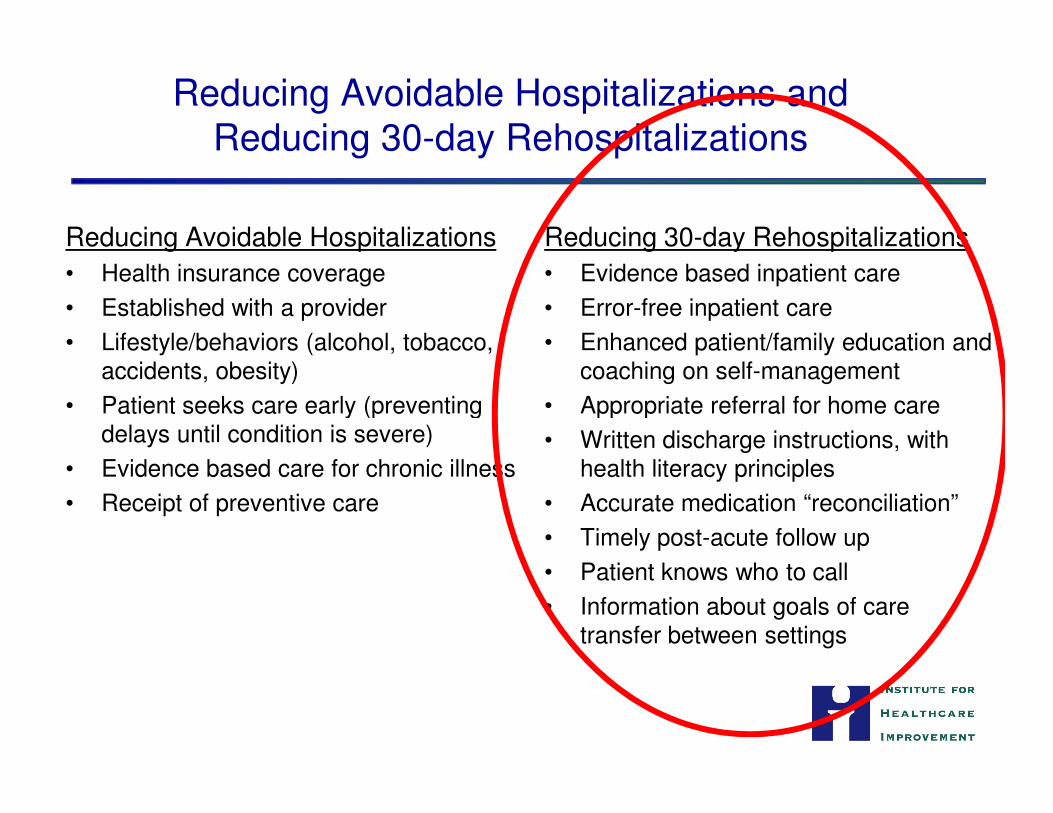
Reducing Avoidable Hospitalizations and Reducing 30-day Rehospitalizations
Reducing Avoidable Hospitalizations
• Health insurance coverage
• Established with a provider
• Lifestyle/behaviors (alcohol, tobacco, accidents, obesity)
• Patient seeks care early (preventing
Reducing 30-day Rehospitalizations
• Evidence based inpatient care
• Error-free inpatient care
• Enhanced patient/family education and coaching on self-management
• Appropriate referral for home care• Patient seeks care early (preventing delays until condition is severe)
• Evidence based care for chronic illness
• Receipt of preventive care
• Appropriate referral for home care
• Written discharge instructions, with health literacy principles
• Accurate medication “reconciliation”
• Timely post-acute follow up
• Patient knows who to call
• Information about goals of care transfer between settings
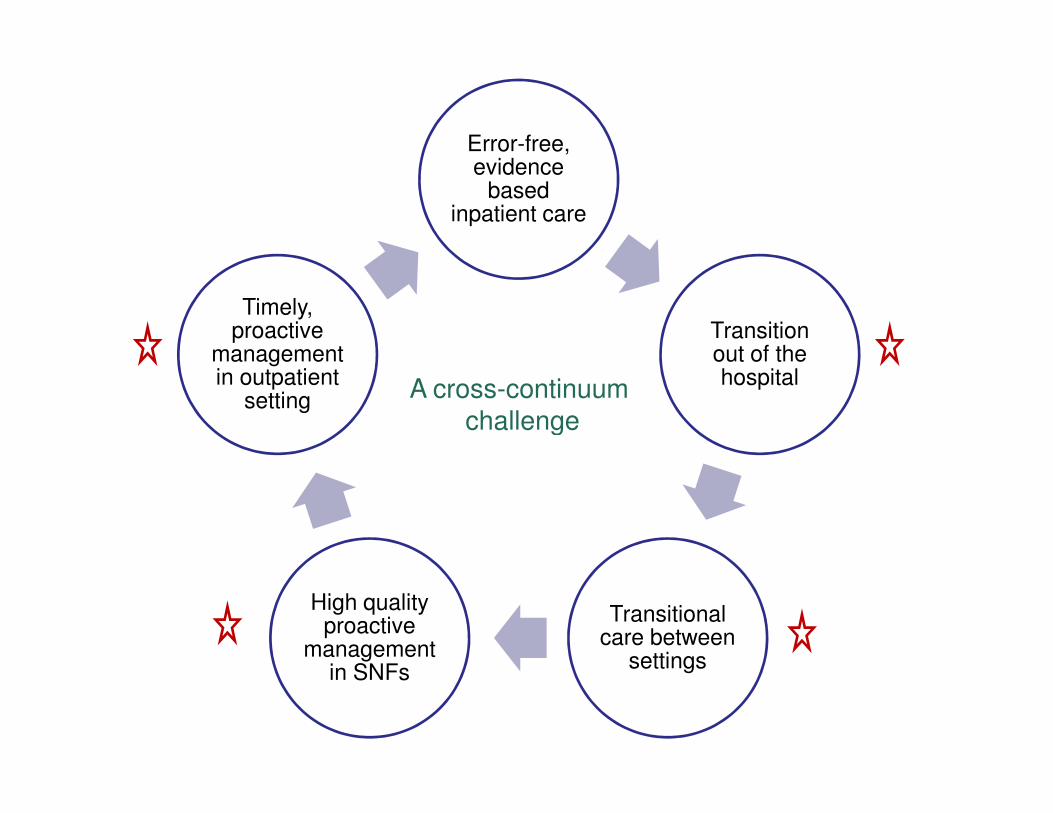
Error-free, evidence
based inpatient care
Transition out of the hospital
Timely, proactive
management in outpatient
setting A cross-continuum challenge
Transitional care between
settings
High quality proactive
management in SNFs
settingchallenge

Who’s leading the pack?
What are they doing?What are they doing?
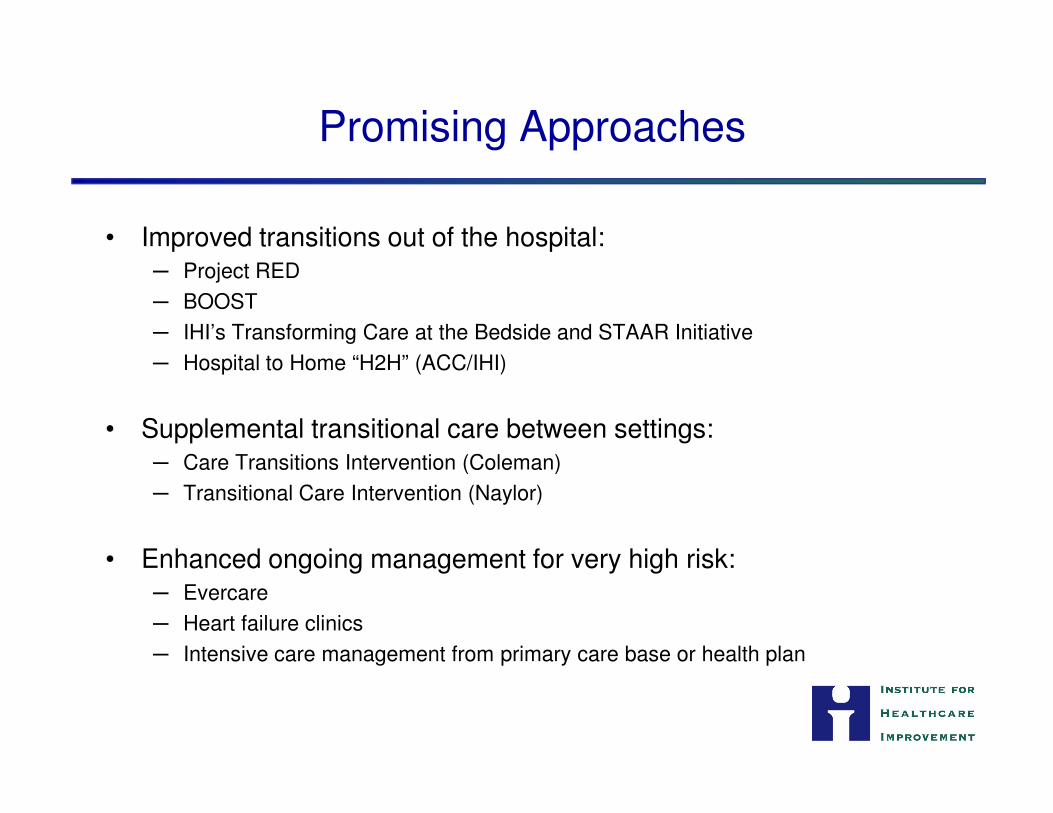
Promising Approaches
• Improved transitions out of the hospital:─ Project RED
─ BOOST
─ IHI’s Transforming Care at the Bedside and STAAR Initiative
─ Hospital to Home “H2H” (ACC/IHI)
• Supplemental transitional care between settings:─ Care Transitions Intervention (Coleman)
─ Transitional Care Intervention (Naylor)
• Enhanced ongoing management for very high risk:─ Evercare
─ Heart failure clinics
─ Intensive care management from primary care base or health plan
Improved Transitions Out of the HospitalImproved Transitions Out of the Hospital
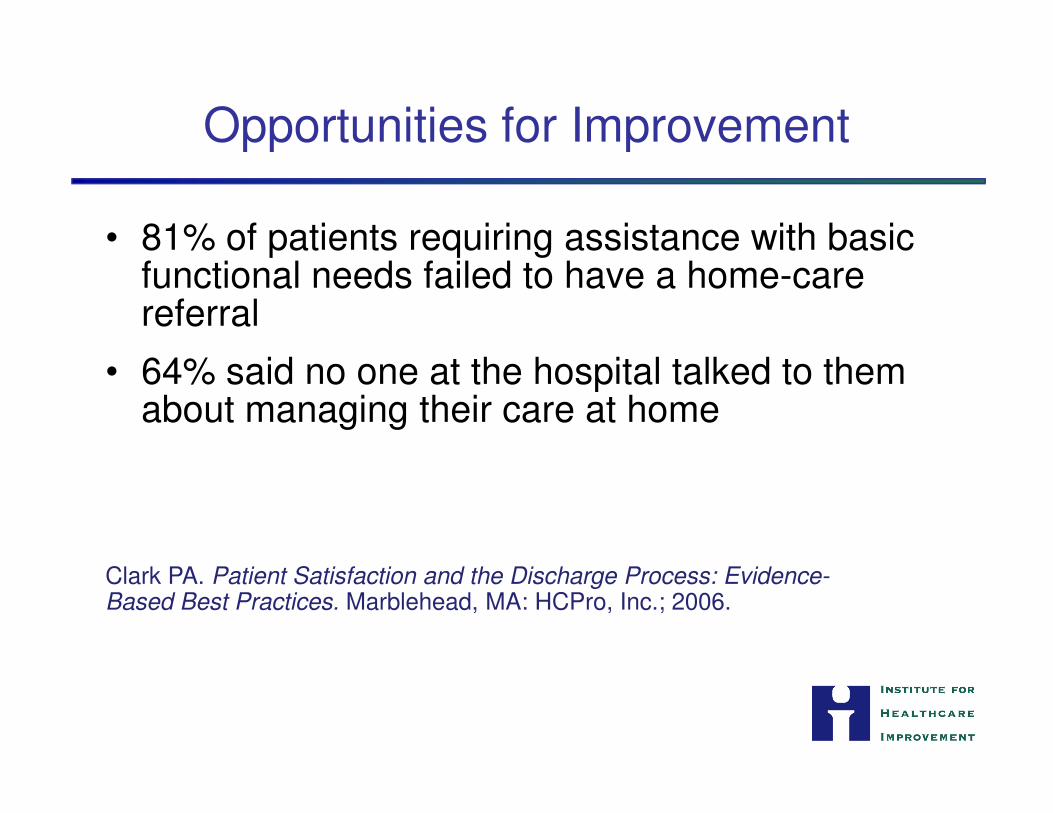
• 81% of patients requiring assistance with basic functional needs failed to have a home-care referral
• 64% said no one at the hospital talked to them about managing their care at home
Opportunities for Improvement
about managing their care at home
Clark PA. Patient Satisfaction and the Discharge Process: Evidence-Based Best Practices. Marblehead, MA: HCPro, Inc.; 2006.
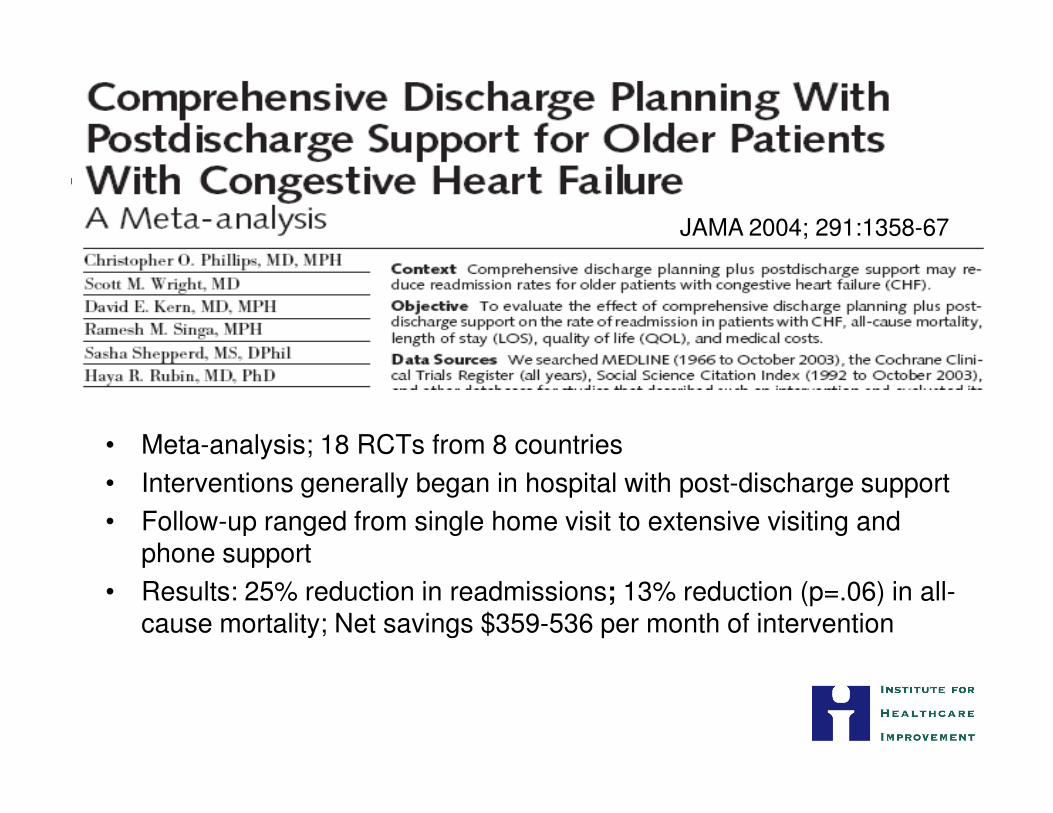
JAMA 2004; 291:1358-67
• Meta-analysis; 18 RCTs from 8 countries
• Interventions generally began in hospital with post-discharge support
• Follow-up ranged from single home visit to extensive visiting and phone support
• Results: 25% reduction in readmissions; 13% reduction (p=.06) in all-cause mortality; Net savings $359-536 per month of intervention
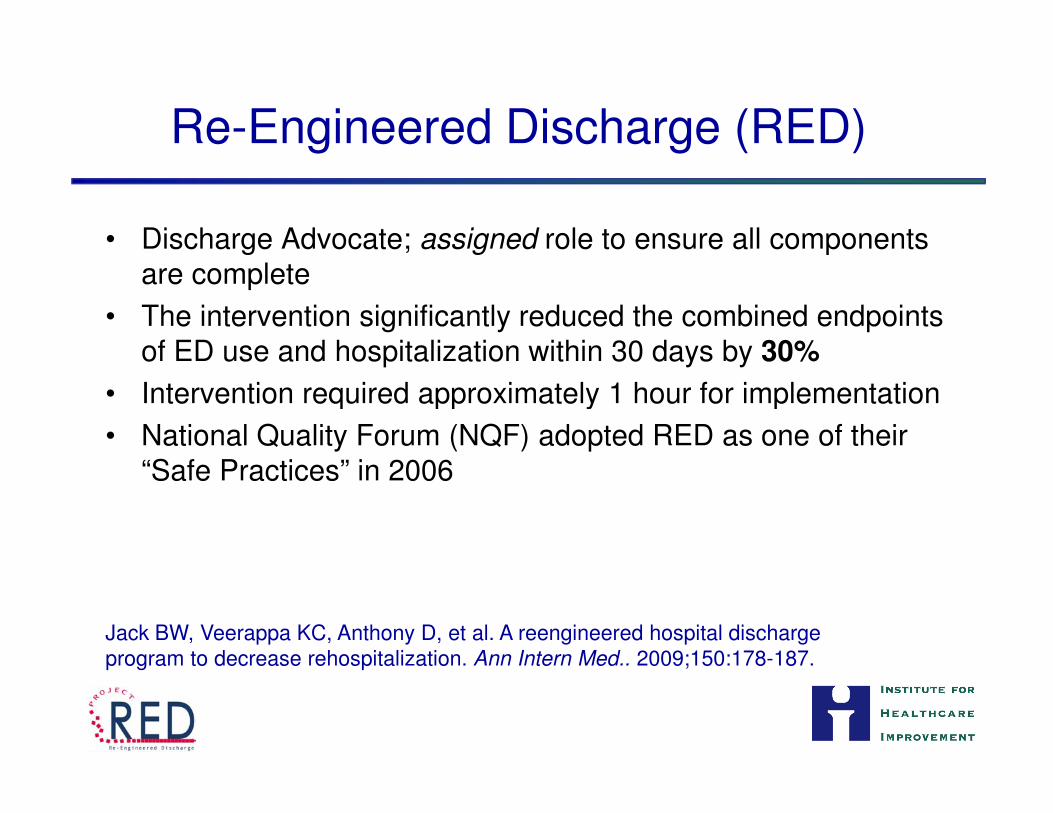
Re-Engineered Discharge (RED)
• Discharge Advocate; assigned role to ensure all components are complete
• The intervention significantly reduced the combined endpoints of ED use and hospitalization within 30 days by 30%
• Intervention required approximately 1 hour for implementation• Intervention required approximately 1 hour for implementation
• National Quality Forum (NQF) adopted RED as one of their “Safe Practices” in 2006
Jack BW, Veerappa KC, Anthony D, et al. A reengineered hospital discharge program to decrease rehospitalization. Ann Intern Med.. 2009;150:178-187.
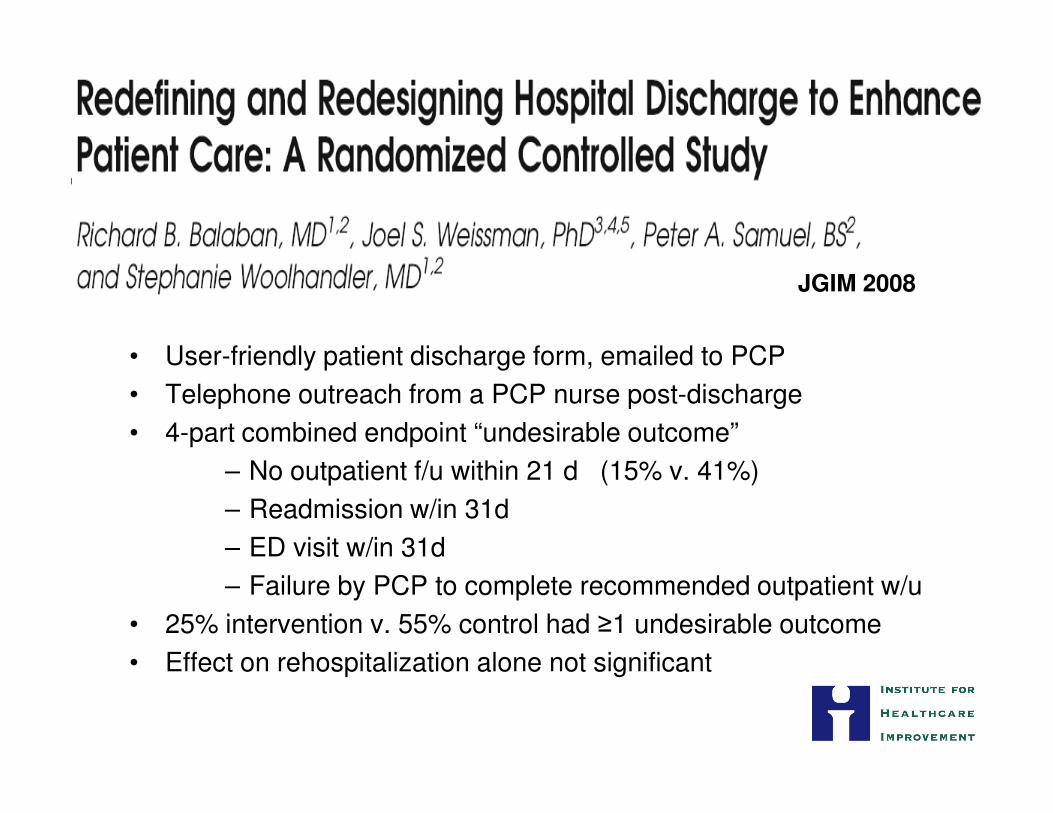
• User-friendly patient discharge form, emailed to PCP
• Telephone outreach from a PCP nurse post-discharge
JGIM 2008
• Telephone outreach from a PCP nurse post-discharge
• 4-part combined endpoint “undesirable outcome”
– No outpatient f/u within 21 d (15% v. 41%)
– Readmission w/in 31d
– ED visit w/in 31d
– Failure by PCP to complete recommended outpatient w/u
• 25% intervention v. 55% control had ≥1 undesirable outcome
• Effect on rehospitalization alone not significant
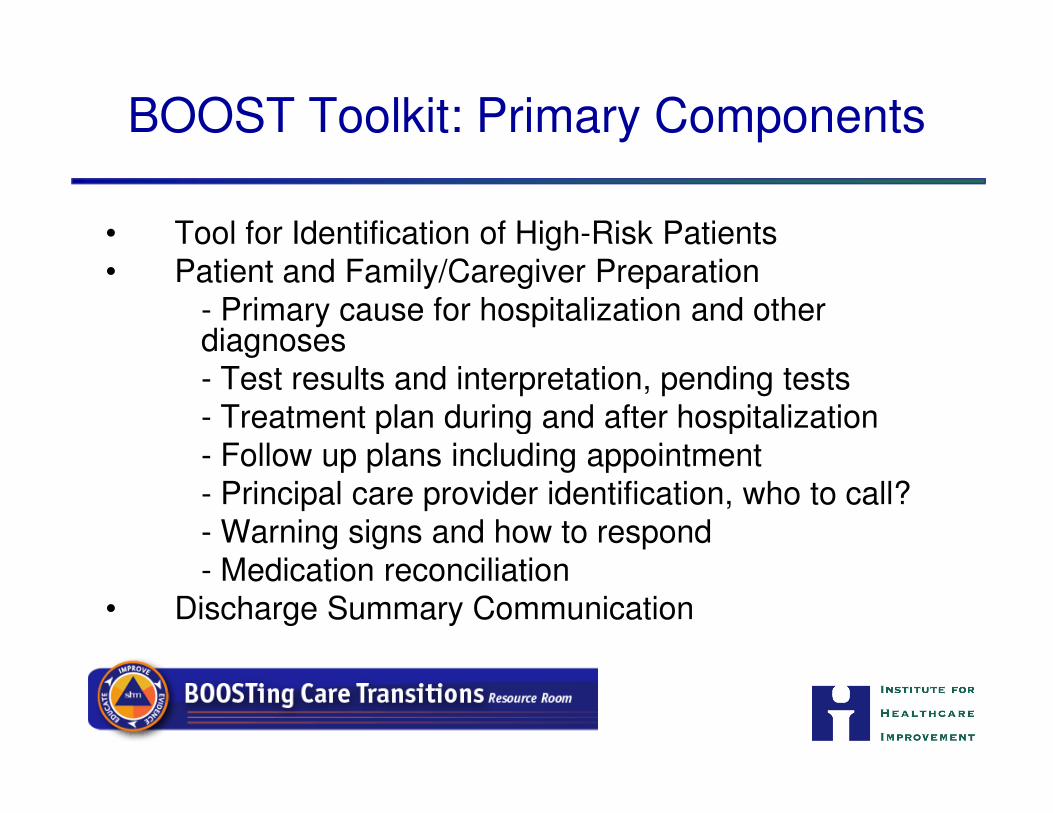
BOOST Toolkit: Primary Components
• Tool for Identification of High-Risk Patients• Patient and Family/Caregiver Preparation
- Primary cause for hospitalization and other diagnoses- Test results and interpretation, pending tests- Treatment plan during and after hospitalization- Treatment plan during and after hospitalization- Follow up plans including appointment- Principal care provider identification, who to call?- Warning signs and how to respond- Medication reconciliation
• Discharge Summary Communication
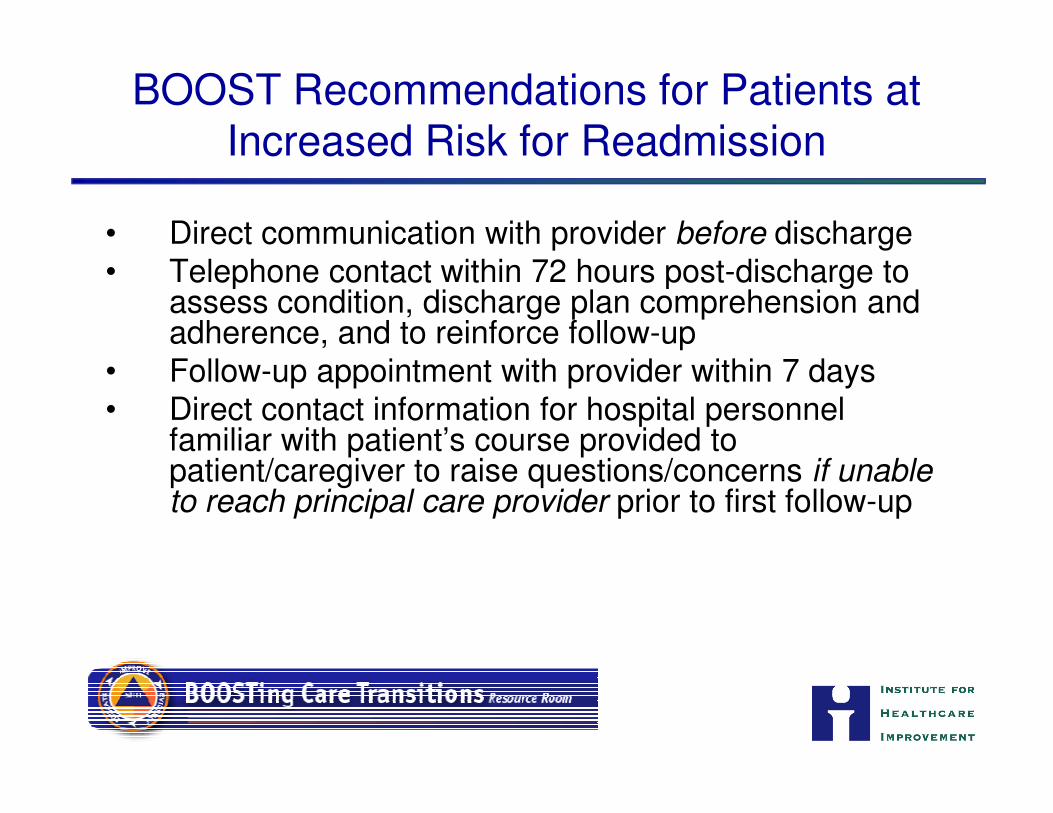
BOOST Recommendations for Patients at Increased Risk for Readmission
• Direct communication with provider before discharge• Telephone contact within 72 hours post-discharge to
assess condition, discharge plan comprehension and adherence, and to reinforce follow-up
• Follow-up appointment with provider within 7 days• Direct contact information for hospital personnel • Direct contact information for hospital personnel
familiar with patient’s course provided to patient/caregiver to raise questions/concerns if unable to reach principal care provider prior to first follow-up

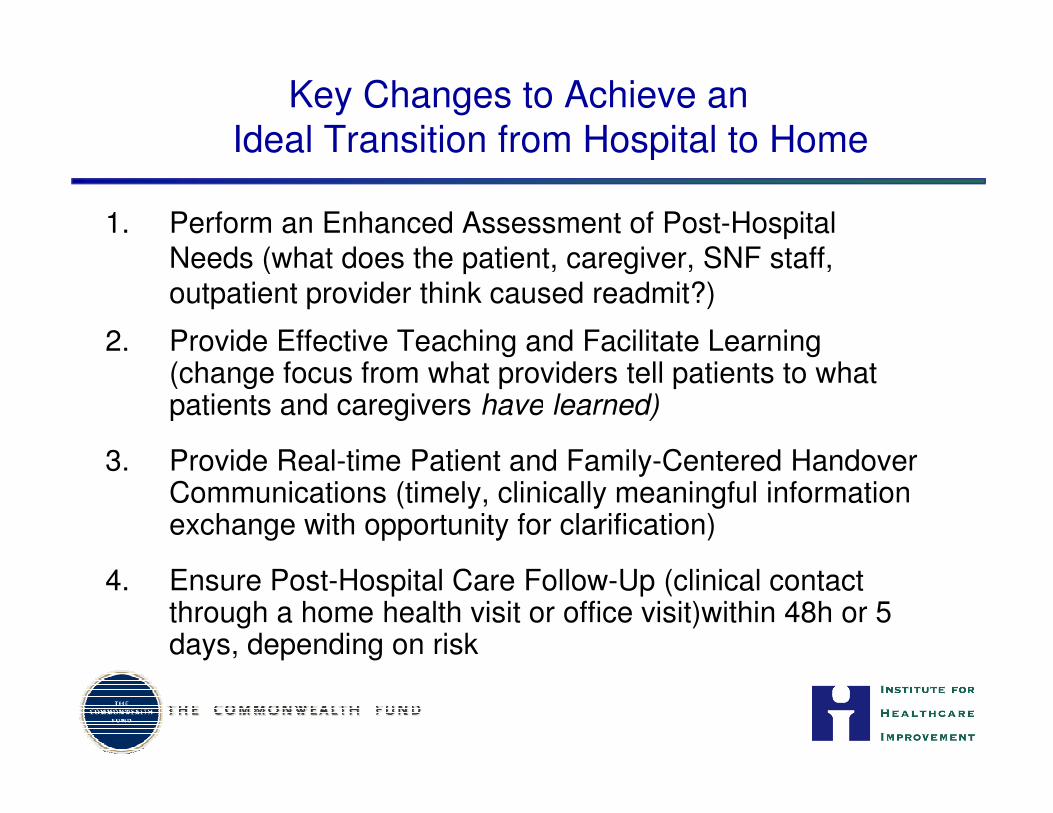
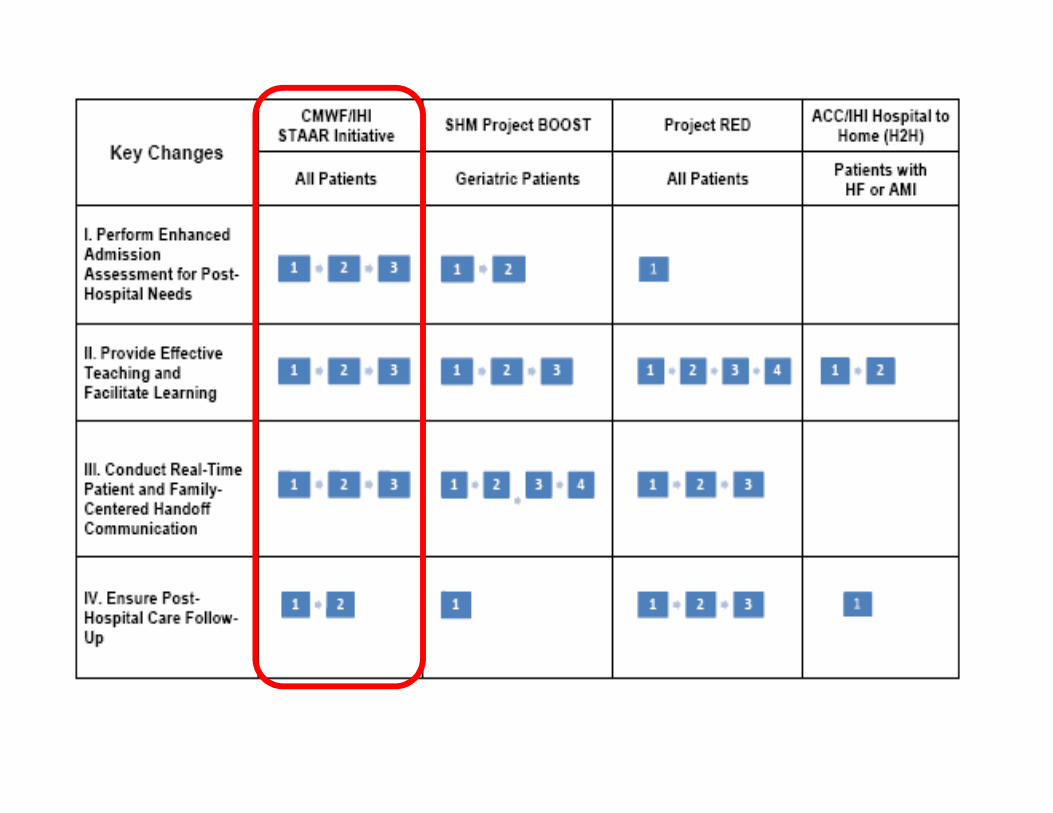
Key Changes to Achieve an Ideal Transition from Hospital to Home
1. Perform an Enhanced Assessment of Post-Hospital Needs (what does the patient, caregiver, SNF staff, outpatient provider think caused readmit?)
2. Provide Effective Teaching and Facilitate Learning (change focus from what providers tell patients to what patients and caregivers have learned)patients and caregivers have learned)
3. Provide Real-time Patient and Family-Centered Handover Communications (timely, clinically meaningful information exchange with opportunity for clarification)
4. Ensure Post-Hospital Care Follow-Up (clinical contact through a home health visit or office visit)within 48h or 5 days, depending on risk
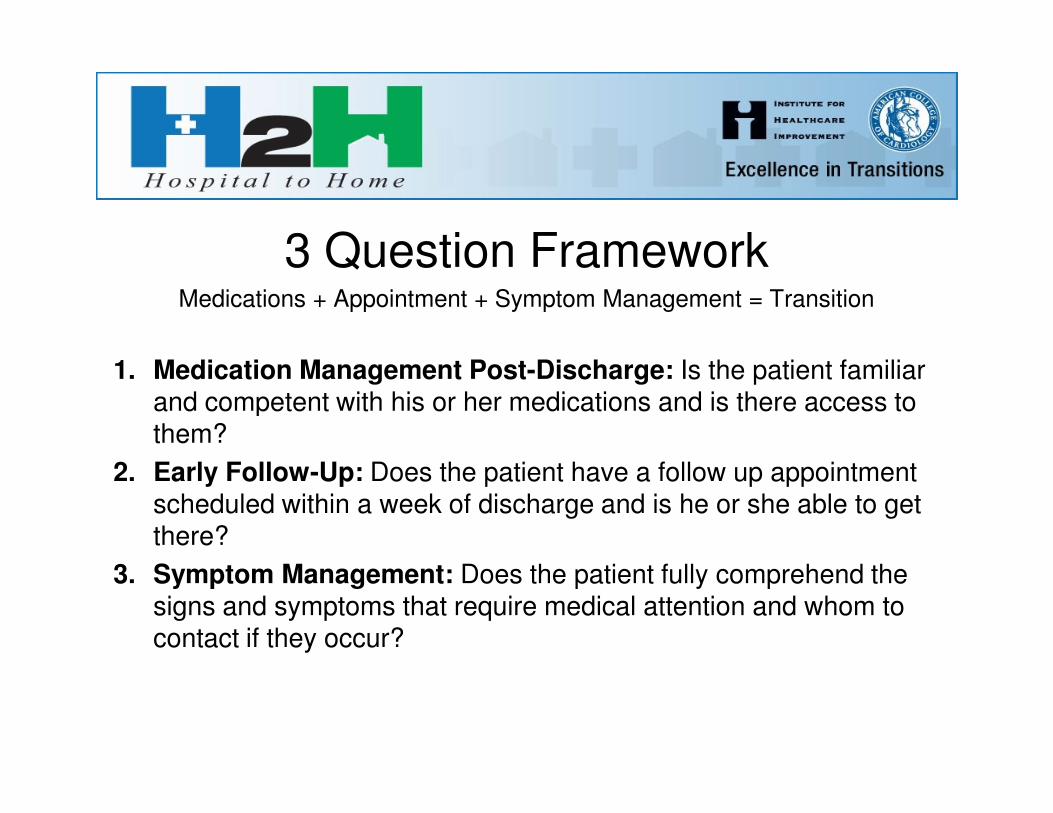
3 Question FrameworkMedications + Appointment + Symptom Management = Transition
1. Medication Management Post-Discharge: Is the patient familiar and competent with his or her medications and is there access to and competent with his or her medications and is there access to them?
2. Early Follow-Up: Does the patient have a follow up appointmentscheduled within a week of discharge and is he or she able to get there?
3. Symptom Management: Does the patient fully comprehend the signs and symptoms that require medical attention and whom to contact if they occur?
Transitional Care Between SettingsTransitional Care Between Settings
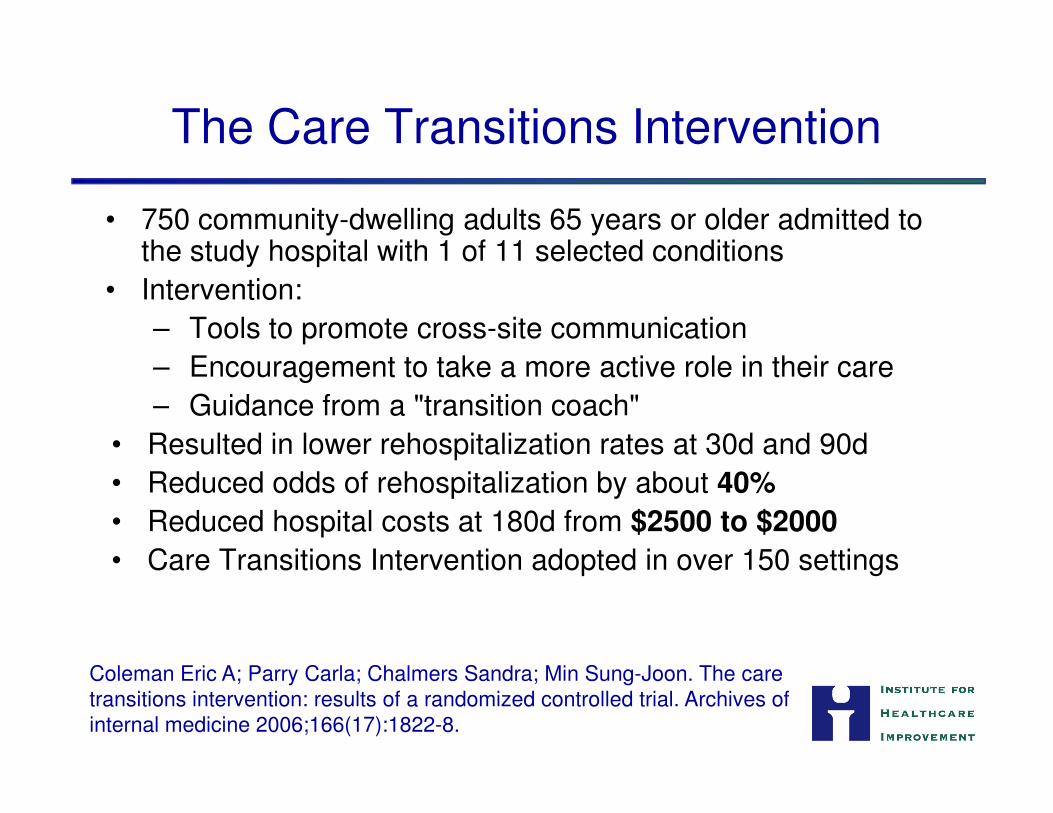
The Care Transitions Intervention
• 750 community-dwelling adults 65 years or older admitted to the study hospital with 1 of 11 selected conditions
• Intervention:
– Tools to promote cross-site communication
– Encouragement to take a more active role in their care
– Guidance from a "transition coach" – Guidance from a "transition coach"
• Resulted in lower rehospitalization rates at 30d and 90d
• Reduced odds of rehospitalization by about 40%
• Reduced hospital costs at 180d from $2500 to $2000
• Care Transitions Intervention adopted in over 150 settings
Coleman Eric A; Parry Carla; Chalmers Sandra; Min Sung-Joon. The care transitions intervention: results of a randomized controlled trial. Archives of internal medicine 2006;166(17):1822-8.
Transitional Care Model
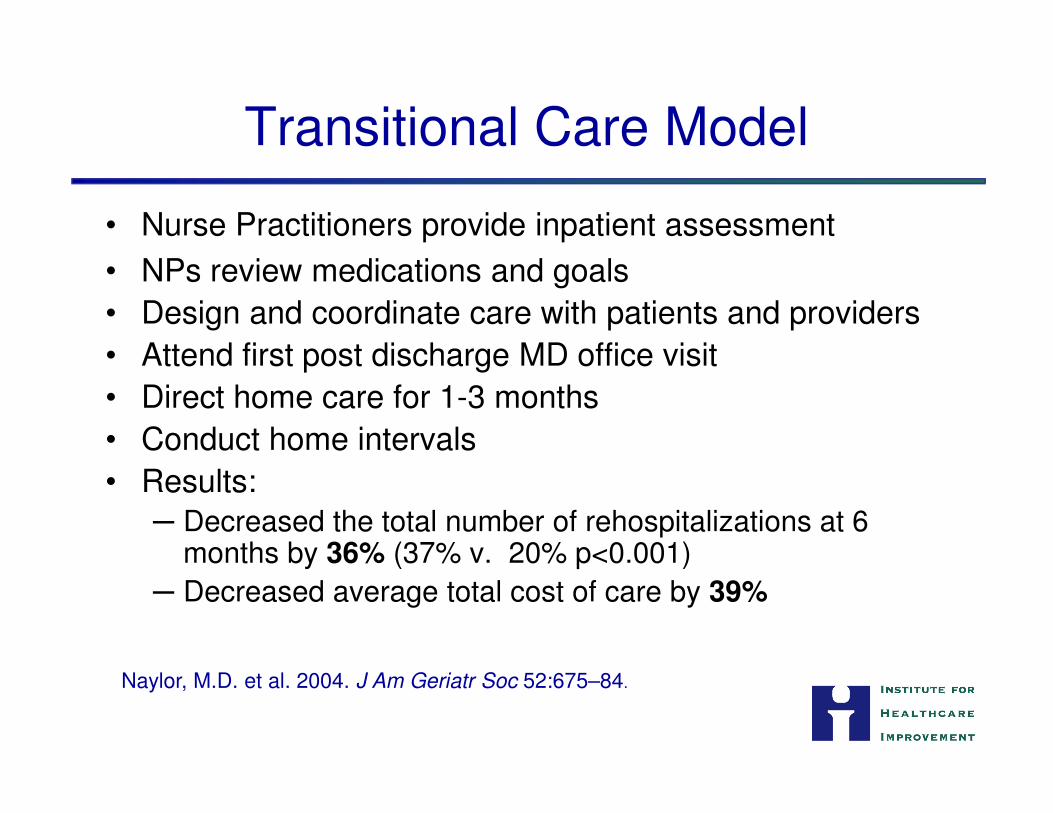
• Nurse Practitioners provide inpatient assessment
• NPs review medications and goals
• Design and coordinate care with patients and providers
• Attend first post discharge MD office visit
• Direct home care for 1-3 months• Direct home care for 1-3 months
• Conduct home intervals
• Results:─ Decreased the total number of rehospitalizations at 6
months by 36% (37% v. 20% p<0.001)
─ Decreased average total cost of care by 39%
Naylor, M.D. et al. 2004. J Am Geriatr Soc 52:675–84.
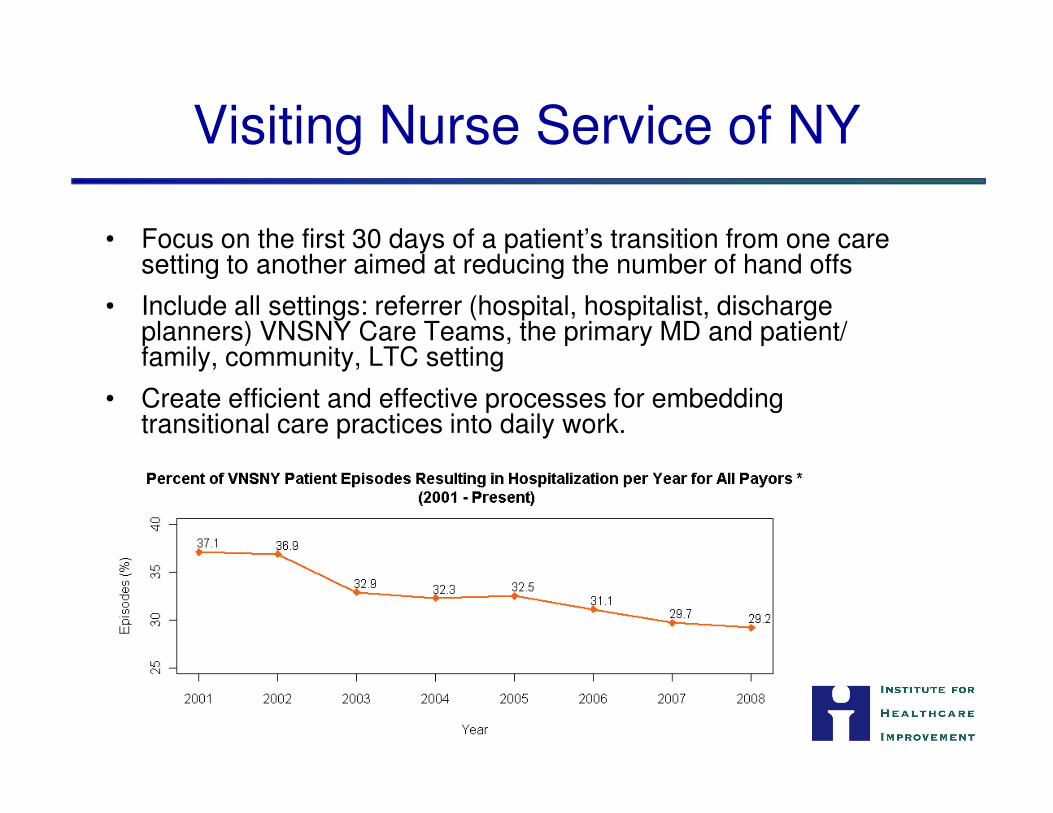
Visiting Nurse Service of NY
• Focus on the first 30 days of a patient’s transition from one care setting to another aimed at reducing the number of hand offs
• Include all settings: referrer (hospital, hospitalist, discharge planners) VNSNY Care Teams, the primary MD and patient/ family, community, LTC setting
• Create efficient and effective processes for embedding • Create efficient and effective processes for embedding transitional care practices into daily work.
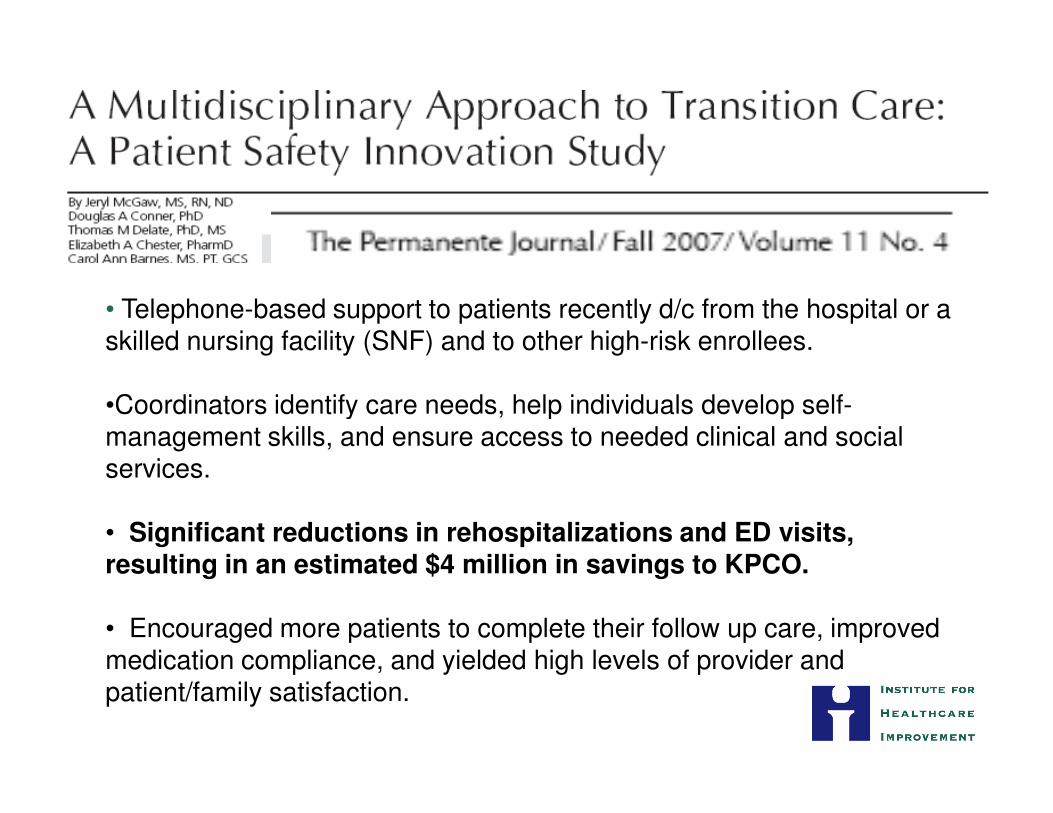
• Telephone-based support to patients recently d/c from the hospital or a skilled nursing facility (SNF) and to other high-risk enrollees.
•Coordinators identify care needs, help individuals develop self-•Coordinators identify care needs, help individuals develop self-management skills, and ensure access to needed clinical and social services.
• Significant reductions in rehospitalizations and ED visits, resulting in an estimated $4 million in savings to KPCO.
• Encouraged more patients to complete their follow up care, improved medication compliance, and yielded high levels of provider and patient/family satisfaction.
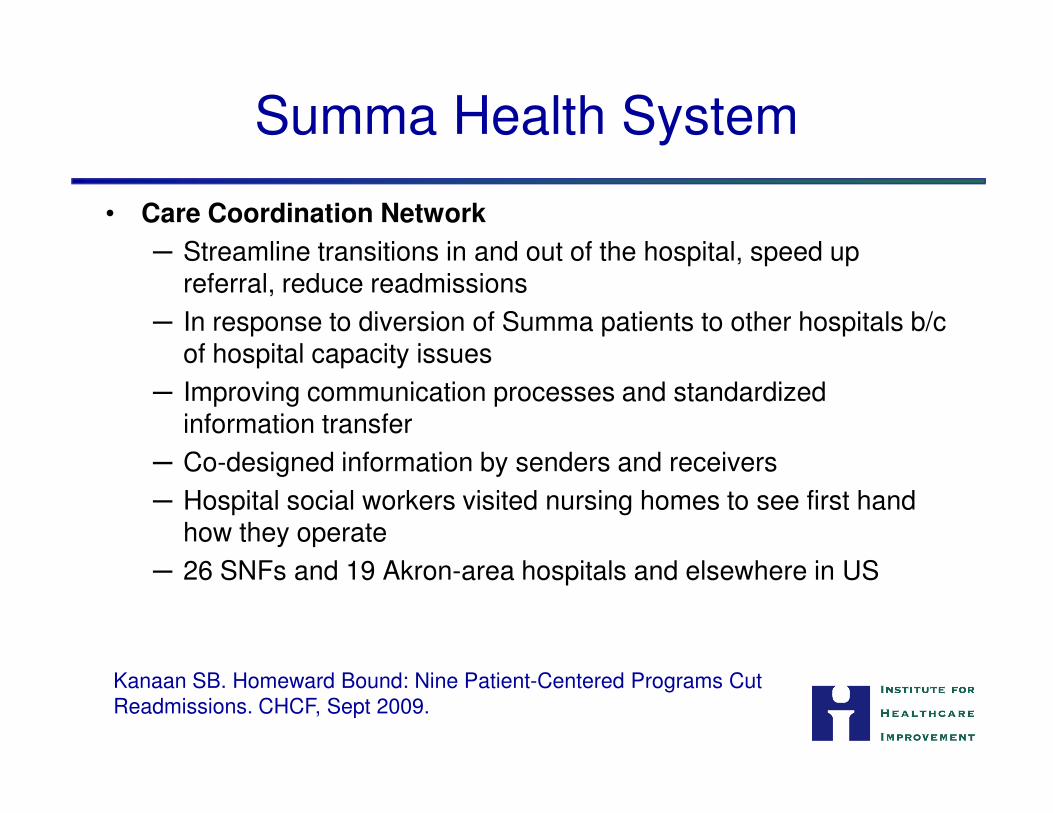
Summa Health System
• Care Coordination Network
─ Streamline transitions in and out of the hospital, speed up referral, reduce readmissions
─ In response to diversion of Summa patients to other hospitals b/c of hospital capacity issues
─ Improving communication processes and standardized information transfer
─ Co-designed information by senders and receivers
─ Hospital social workers visited nursing homes to see first hand how they operate
─ 26 SNFs and 19 Akron-area hospitals and elsewhere in US
Kanaan SB. Homeward Bound: Nine Patient-Centered Programs Cut Readmissions. CHCF, Sept 2009.
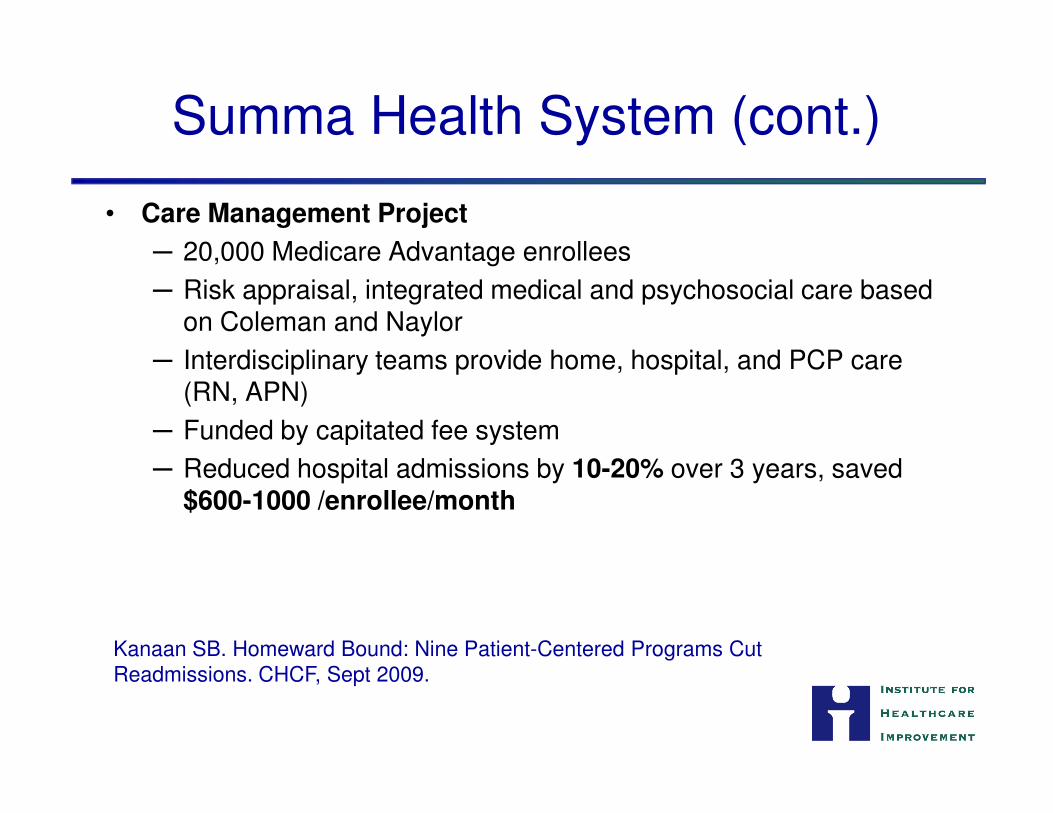
Summa Health System (cont.)
• Care Management Project
─ 20,000 Medicare Advantage enrollees
─ Risk appraisal, integrated medical and psychosocial care based on Coleman and Naylor
─ Interdisciplinary teams provide home, hospital, and PCP care (RN, APN)
─ Funded by capitated fee system
─ Reduced hospital admissions by 10-20% over 3 years, saved $600-1000 /enrollee/month
Kanaan SB. Homeward Bound: Nine Patient-Centered Programs Cut Readmissions. CHCF, Sept 2009.
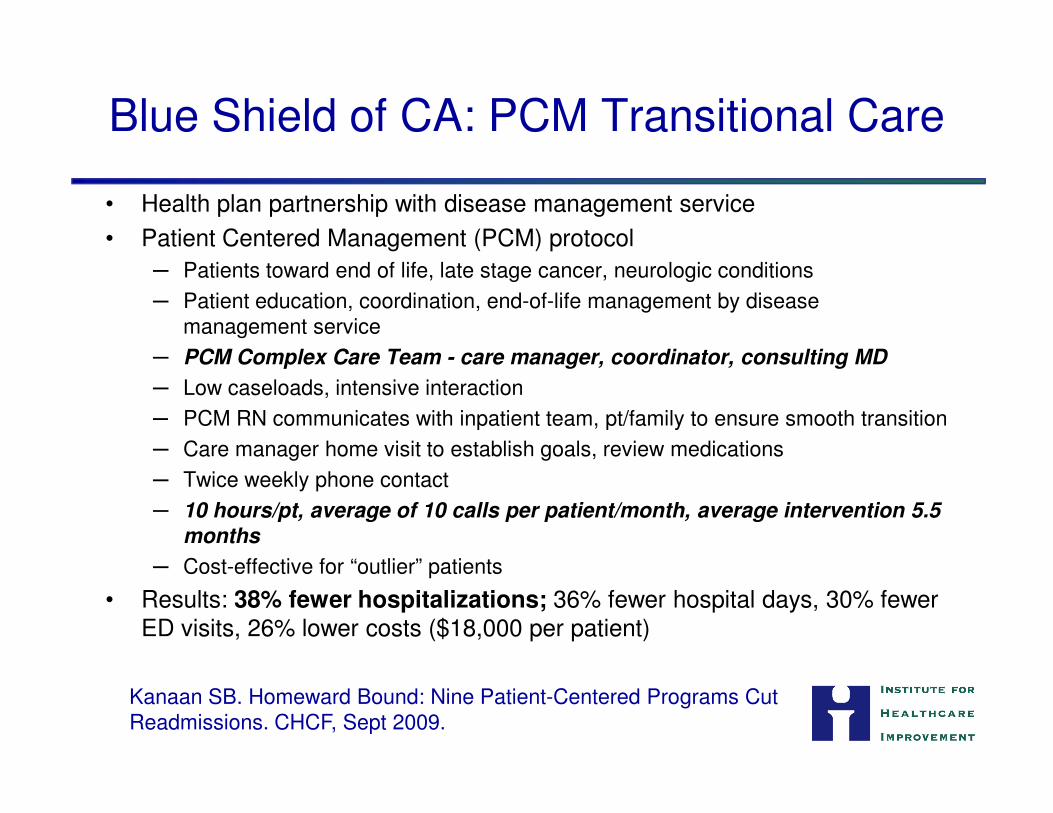
Blue Shield of CA: PCM Transitional Care
• Health plan partnership with disease management service
• Patient Centered Management (PCM) protocol
─ Patients toward end of life, late stage cancer, neurologic conditions
─ Patient education, coordination, end-of-life management by disease management service
─ PCM Complex Care Team - care manager, coordinator, consulting MD
─ Low caseloads, intensive interaction
─ PCM RN communicates with inpatient team, pt/family to ensure smooth transition─ PCM RN communicates with inpatient team, pt/family to ensure smooth transition
─ Care manager home visit to establish goals, review medications
─ Twice weekly phone contact
─ 10 hours/pt, average of 10 calls per patient/month, average intervention 5.5 months
─ Cost-effective for “outlier” patients
• Results: 38% fewer hospitalizations; 36% fewer hospital days, 30% fewer ED visits, 26% lower costs ($18,000 per patient)
Kanaan SB. Homeward Bound: Nine Patient-Centered Programs Cut Readmissions. CHCF, Sept 2009.
Enhanced Ongoing ManagementEnhanced Ongoing Management
Evercare Model
• Nurse Practitioners and Care Managers develop and manage personalized care plans
─ coordinate multiple services
─ help facilitate better communication between physicians, institutions, patients and their families
─ help ensure effective integration of treatments
• Four levels of care, with each level involving different priorities and focus of care provided by the NP or CM
• Results:
─ Reduced hospitalizations by 45% with no change in mortality
─ Reduced emergency room visits by 50%
Kane, R. L., G. Keckhafer, et al. (2003). “The effect of Evercare on hospital use.” Journal of the American Geriatric Society 51(10):1427-34.
Heart Failure Clinic
• St. Mary's Duluth Clinic Heart Center (1 example)
─ Combination of chronic care and disease management principles and providing home telemonitoring for high-risk patients.
• 6-month readmission rate decreased from 20-25% to 3-4 %
• Program saved $1.25 million on the care of 29 CHF patients over a 6-month period (savings from reduced hospital admissions and reduced ED visits)
Heart Failure Resource Center
• Piedmont Hospital in Atlanta, GA
• Improves outpatient care for HF patients through:
─ Use of NPs as care managers;
─ Evidence-based clinical care protocols; and
─ Remote patient telemonitoring.
• Results:
─ 30-day rehospitalization rate decreased 75% for patients who were treated at the HFRC for fiscal year 2007
─ 90-day rehospitalization rate decreased from 10.4% to 2.9% for patients in the program, compared with controls
─ Cost-neutral program
Home Healthcare Telemedicine
• Presbyterian Home Healthcare in New Mexico
─ CHF and COPD patients
─ Nurses specializing in telemonitoring
o Computers
o High resolution video units
o Data fed into Presbyterian’s IT systemo Data fed into Presbyterian’s IT system
o Abnormal result alerts a nurse
• Results:
─ Rehospitalization rates decreased from 6% to ~ 1%
─ Productivity of telehealth nurses is almost double that of traditional home health nurses (8 visits vs. 5 visits per 8 hours).
─ $5,500 cost of the telemedicine units is less than one hospital admission, demonstrating ROI for the organization.
Mercy HealthPartners
• Large not for profit health system; 30d rehospitalization rates a system objective
• Aim: reduce readmissions for heart failure patients
• Core intervention: Created heart failure advocate positions to service highest risk patients
• Results:
─ 66% reduction in hospitalizations pre- and post intervention
─ 41% reduction in 30-day readmissions
─ Range in all cause 30-day readmission rate consistently ranged between 1% and 10%
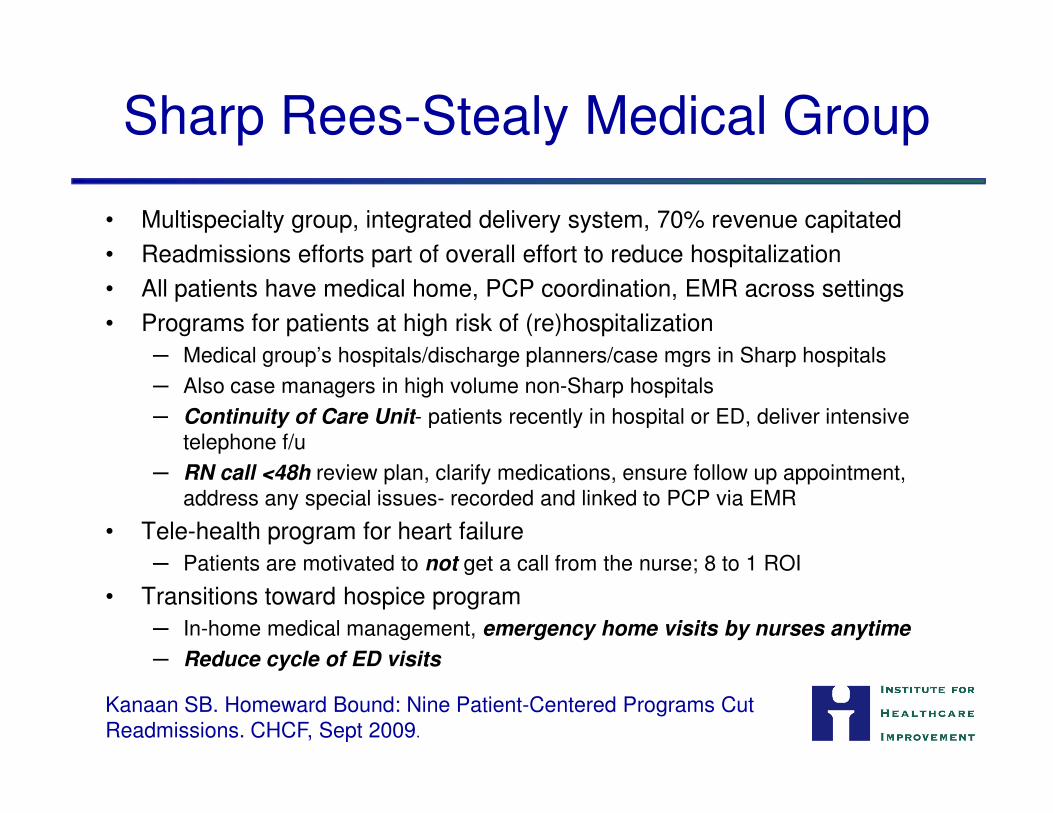
Sharp Rees-Stealy Medical Group
• Multispecialty group, integrated delivery system, 70% revenue capitated
• Readmissions efforts part of overall effort to reduce hospitalization
• All patients have medical home, PCP coordination, EMR across settings
• Programs for patients at high risk of (re)hospitalization
─ Medical group’s hospitals/discharge planners/case mgrs in Sharp hospitals
─ Also case managers in high volume non-Sharp hospitals
─ Continuity of Care Unit- patients recently in hospital or ED, deliver intensive ─ Continuity of Care Unit- patients recently in hospital or ED, deliver intensive telephone f/u
─ RN call <48h review plan, clarify medications, ensure follow up appointment, address any special issues- recorded and linked to PCP via EMR
• Tele-health program for heart failure
─ Patients are motivated to not get a call from the nurse; 8 to 1 ROI
• Transitions toward hospice program
─ In-home medical management, emergency home visits by nurses anytime
─ Reduce cycle of ED visits
Kanaan SB. Homeward Bound: Nine Patient-Centered Programs Cut Readmissions. CHCF, Sept 2009.
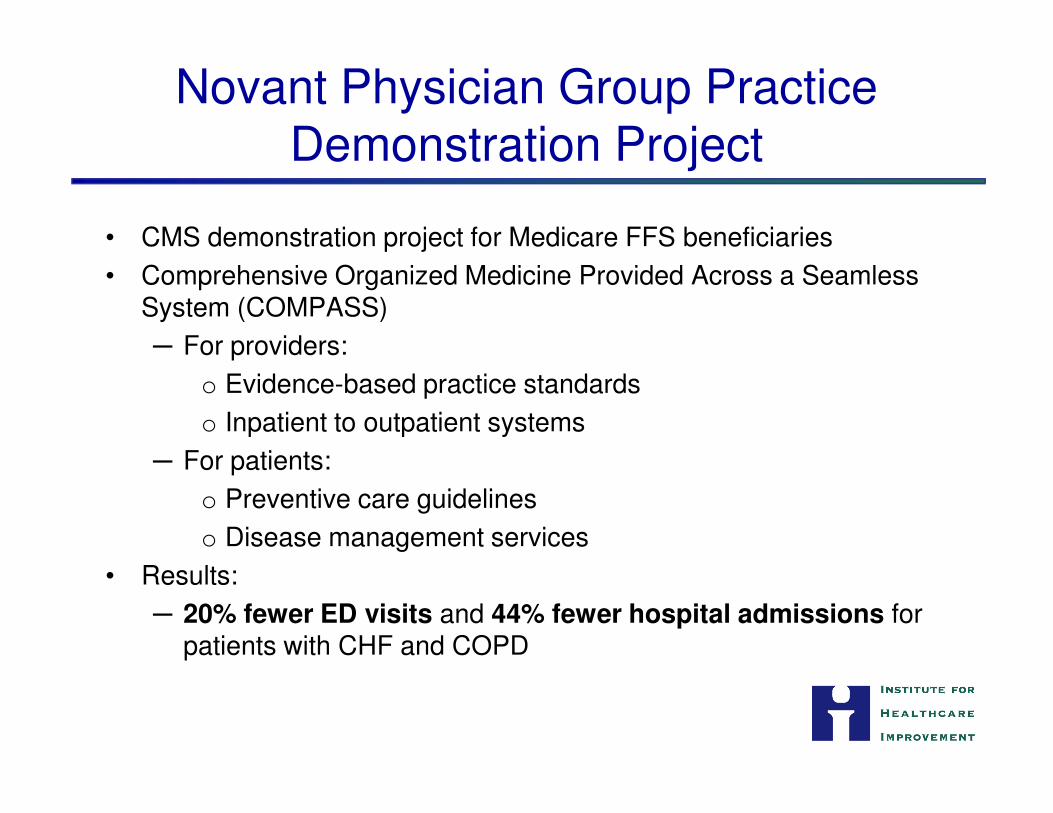
Novant Physician Group Practice Demonstration Project
• CMS demonstration project for Medicare FFS beneficiaries
• Comprehensive Organized Medicine Provided Across a Seamless System (COMPASS)
─ For providers:
o Evidence-based practice standards
o Inpatient to outpatient systems
─ For patients:
o Preventive care guidelines
o Disease management services
• Results:
─ 20% fewer ED visits and 44% fewer hospital admissions for patients with CHF and COPD
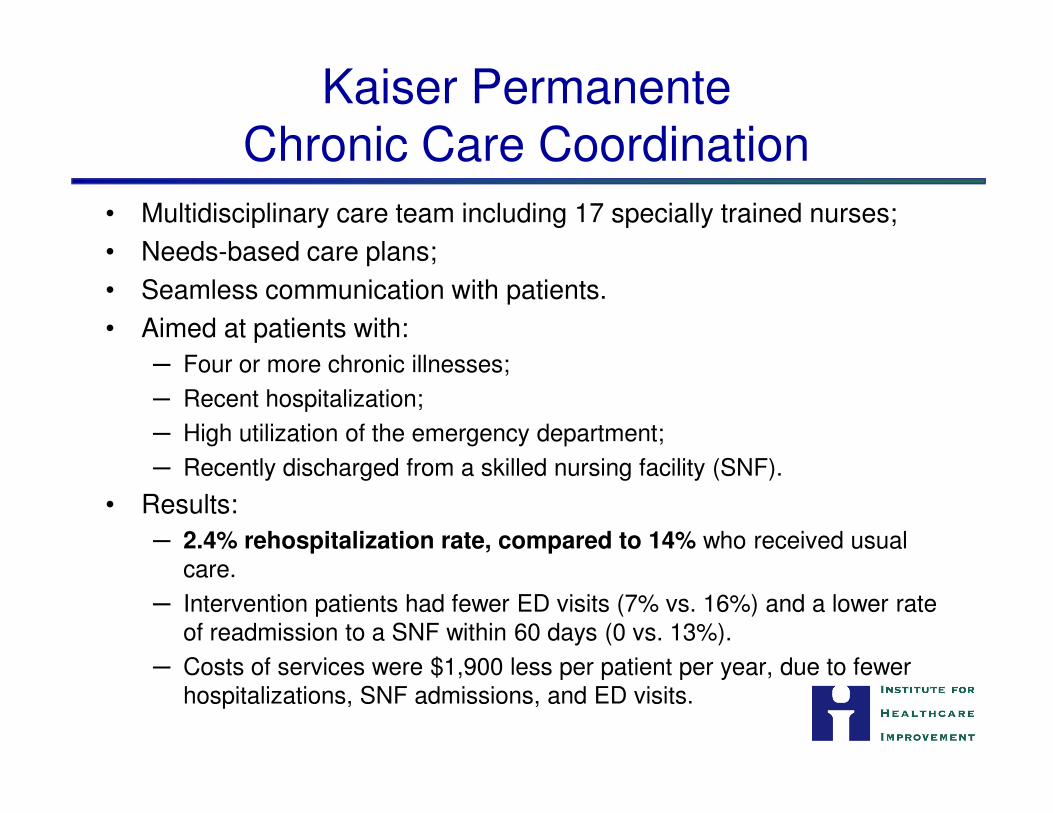
Kaiser Permanente Chronic Care Coordination
• Multidisciplinary care team including 17 specially trained nurses;
• Needs-based care plans;
• Seamless communication with patients.
• Aimed at patients with:
─ Four or more chronic illnesses;
─ Recent hospitalization;─ Recent hospitalization;
─ High utilization of the emergency department;
─ Recently discharged from a skilled nursing facility (SNF).
• Results:
─ 2.4% rehospitalization rate, compared to 14% who received usual care.
─ Intervention patients had fewer ED visits (7% vs. 16%) and a lower rate of readmission to a SNF within 60 days (0 vs. 13%).
─ Costs of services were $1,900 less per patient per year, due to fewer hospitalizations, SNF admissions, and ED visits.
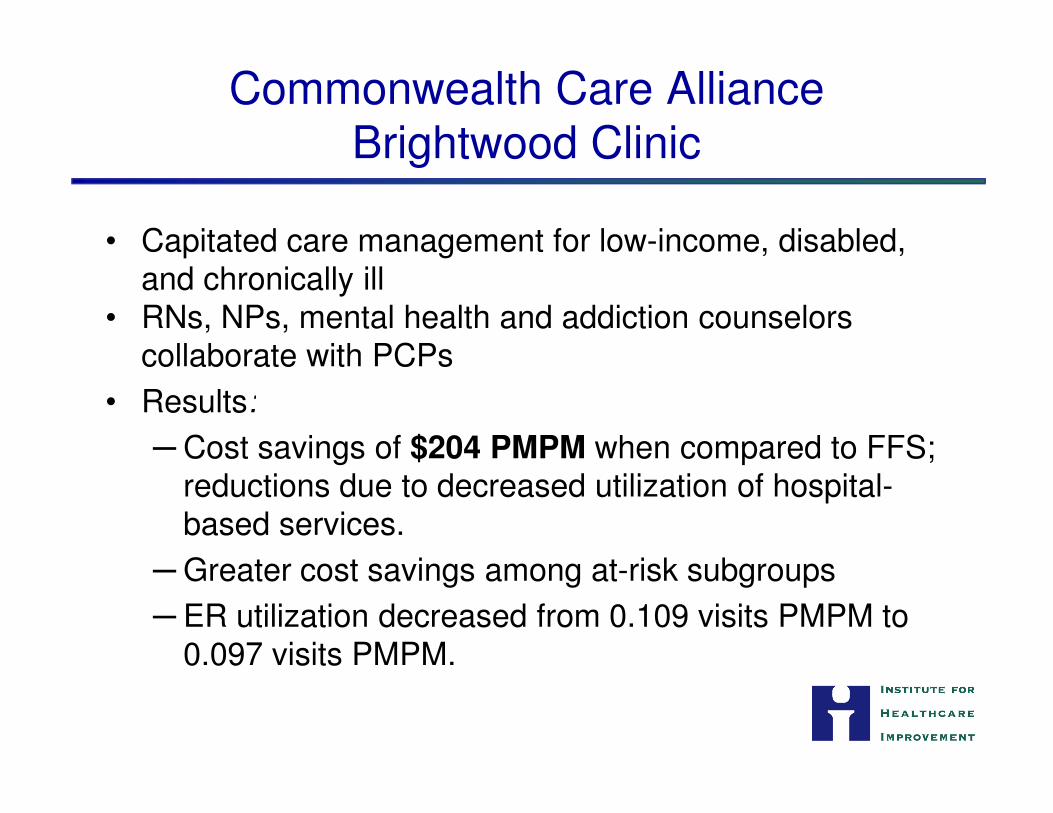
Commonwealth Care Alliance Brightwood Clinic
• Capitated care management for low-income, disabled, and chronically ill
• RNs, NPs, mental health and addiction counselors collaborate with PCPs
• Results:• Results:
─ Cost savings of $204 PMPM when compared to FFS; reductions due to decreased utilization of hospital-based services.
─Greater cost savings among at-risk subgroups
─ ER utilization decreased from 0.109 visits PMPM to 0.097 visits PMPM.
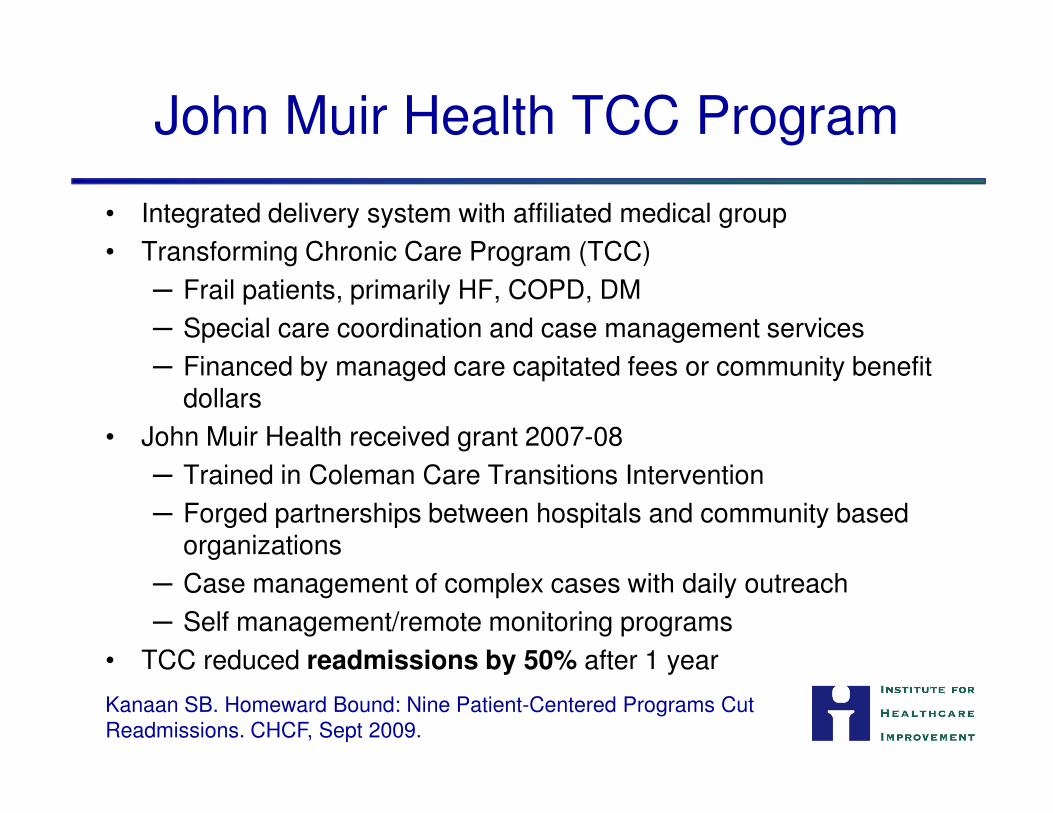
John Muir Health TCC Program
• Integrated delivery system with affiliated medical group
• Transforming Chronic Care Program (TCC)
─ Frail patients, primarily HF, COPD, DM
─ Special care coordination and case management services
─ Financed by managed care capitated fees or community benefit dollarsdollars
• John Muir Health received grant 2007-08
─ Trained in Coleman Care Transitions Intervention
─ Forged partnerships between hospitals and community based organizations
─ Case management of complex cases with daily outreach
─ Self management/remote monitoring programs
• TCC reduced readmissions by 50% after 1 year
Kanaan SB. Homeward Bound: Nine Patient-Centered Programs Cut Readmissions. CHCF, Sept 2009.
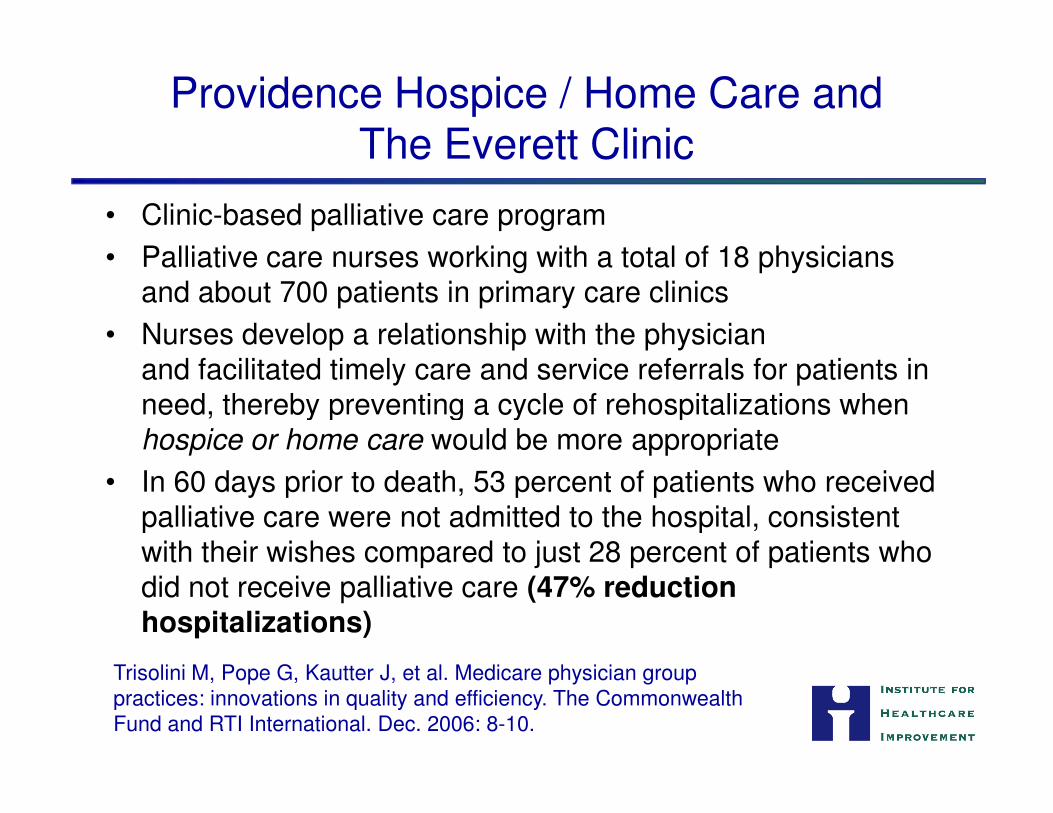
• Clinic-based palliative care program
• Palliative care nurses working with a total of 18 physicians and about 700 patients in primary care clinics
• Nurses develop a relationship with the physician and facilitated timely care and service referrals for patients in need, thereby preventing a cycle of rehospitalizations when
Providence Hospice / Home Care and The Everett Clinic
need, thereby preventing a cycle of rehospitalizations when hospice or home care would be more appropriate
• In 60 days prior to death, 53 percent of patients who received palliative care were not admitted to the hospital, consistent with their wishes compared to just 28 percent of patients who did not receive palliative care (47% reduction hospitalizations)
Trisolini M, Pope G, Kautter J, et al. Medicare physician group practices: innovations in quality and efficiency. The Commonwealth Fund and RTI International. Dec. 2006: 8-10.
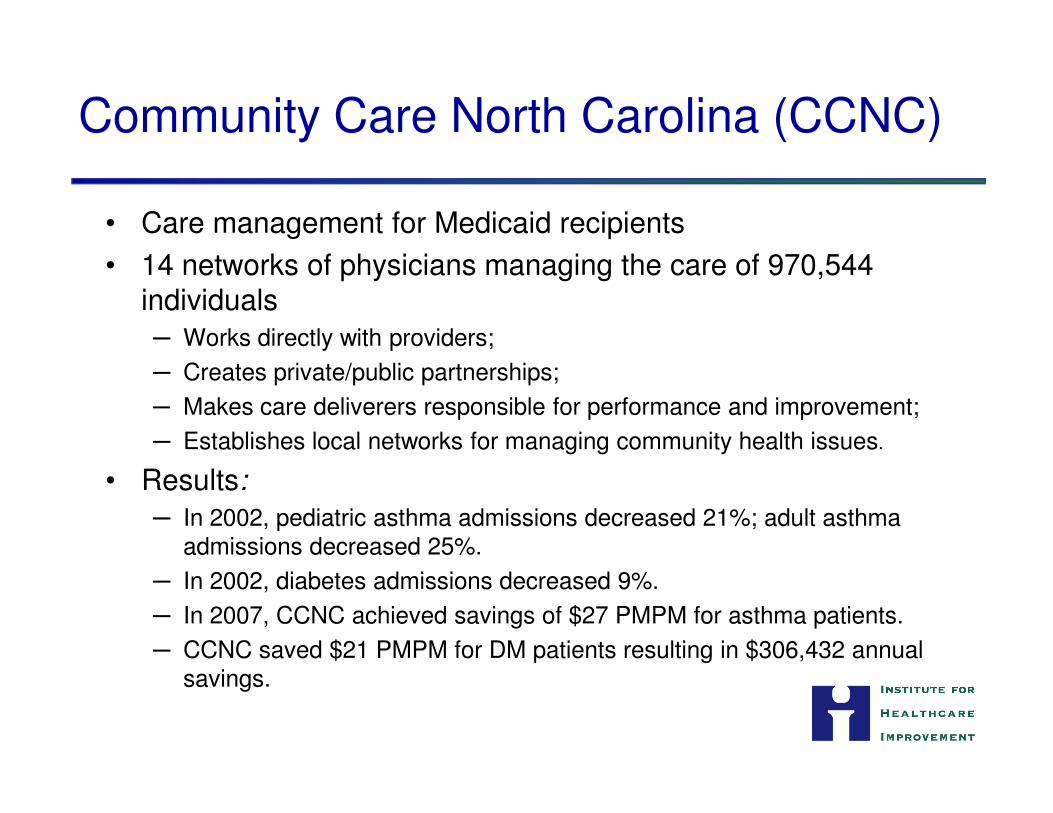
Community Care North Carolina (CCNC)
• Care management for Medicaid recipients
• 14 networks of physicians managing the care of 970,544 individuals─ Works directly with providers;
─ Creates private/public partnerships;
─ Makes care deliverers responsible for performance and improvement;─ Makes care deliverers responsible for performance and improvement;
─ Establishes local networks for managing community health issues.
• Results:
─ In 2002, pediatric asthma admissions decreased 21%; adult asthma admissions decreased 25%.
─ In 2002, diabetes admissions decreased 9%.
─ In 2007, CCNC achieved savings of $27 PMPM for asthma patients.
─ CCNC saved $21 PMPM for DM patients resulting in $306,432 annual savings.
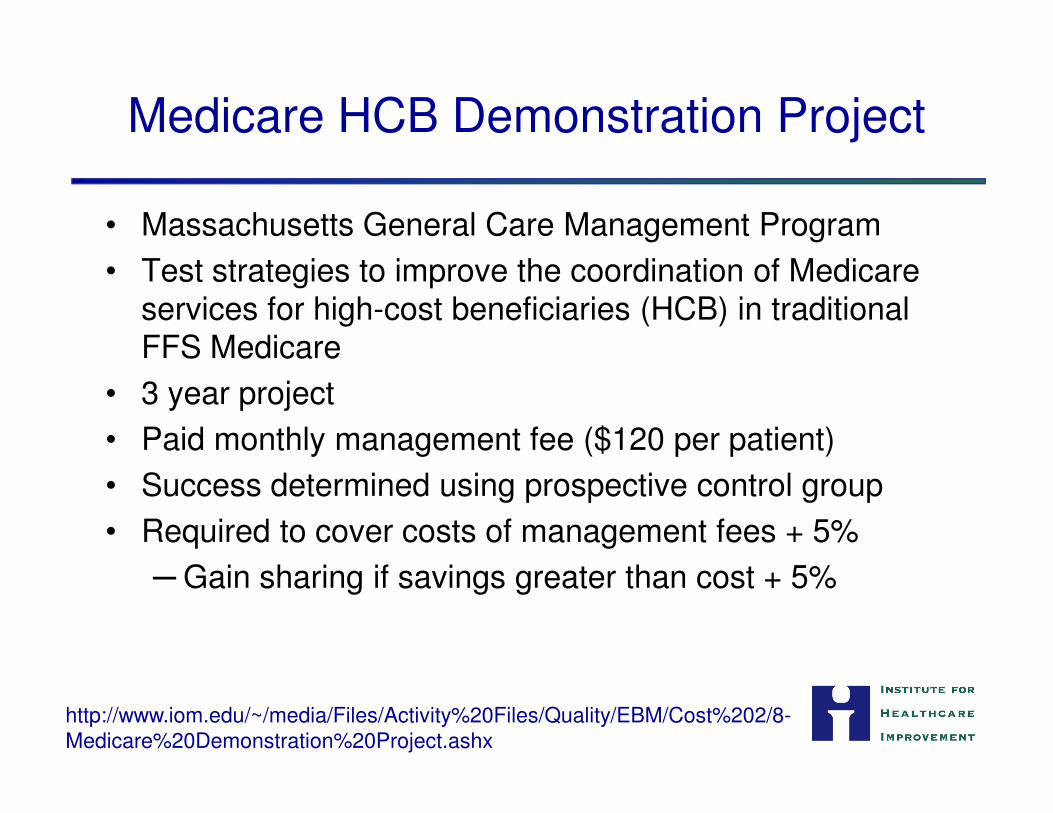
Medicare HCB Demonstration Project
• Massachusetts General Care Management Program
• Test strategies to improve the coordination of Medicare services for high-cost beneficiaries (HCB) in traditional FFS Medicare
• 3 year project • 3 year project
• Paid monthly management fee ($120 per patient)
• Success determined using prospective control group
• Required to cover costs of management fees + 5%
─Gain sharing if savings greater than cost + 5%
http://www.iom.edu/~/media/Files/Activity%20Files/Quality/EBM/Cost%202/8-Medicare%20Demonstration%20Project.ashx
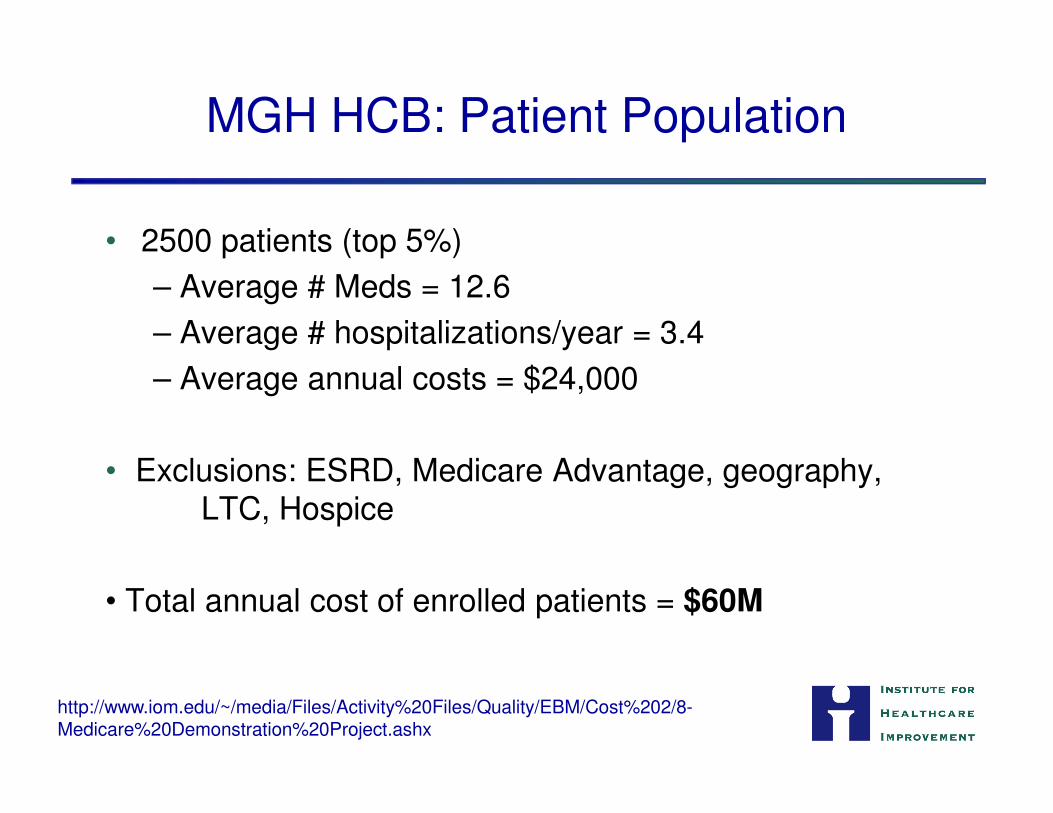
MGH HCB: Patient Population
• 2500 patients (top 5%)
– Average # Meds = 12.6
– Average # hospitalizations/year = 3.4
– Average annual costs = $24,000
• Exclusions: ESRD, Medicare Advantage, geography, LTC, Hospice
• Total annual cost of enrolled patients = $60M
http://www.iom.edu/~/media/Files/Activity%20Files/Quality/EBM/Cost%202/8-Medicare%20Demonstration%20Project.ashx
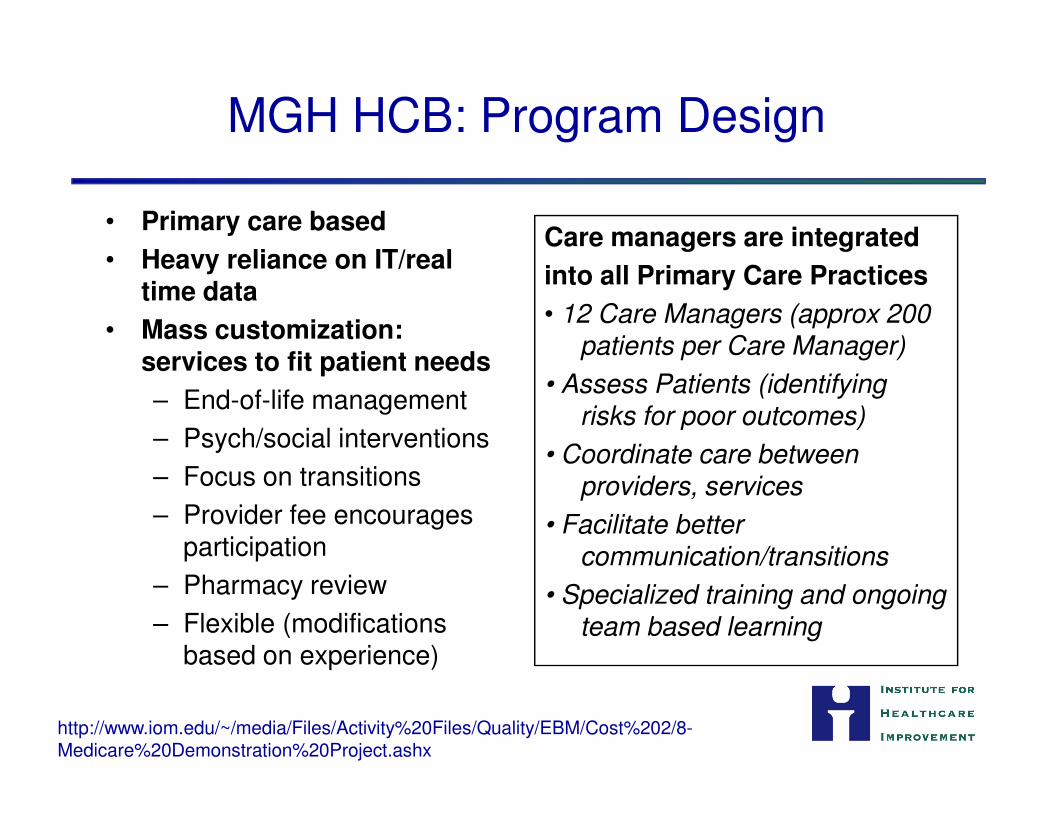
MGH HCB: Program Design
• Primary care based
• Heavy reliance on IT/real time data
• Mass customization: services to fit patient needs
– End-of-life management
Care managers are integrated
into all Primary Care Practices
• 12 Care Managers (approx 200 patients per Care Manager)
• Assess Patients (identifying risks for poor outcomes)
– End-of-life management
– Psych/social interventions
– Focus on transitions
– Provider fee encourages participation
– Pharmacy review
– Flexible (modifications based on experience)
risks for poor outcomes)
• Coordinate care between providers, services
• Facilitate better communication/transitions
• Specialized training and ongoing team based learning
http://www.iom.edu/~/media/Files/Activity%20Files/Quality/EBM/Cost%202/8-Medicare%20Demonstration%20Project.ashx
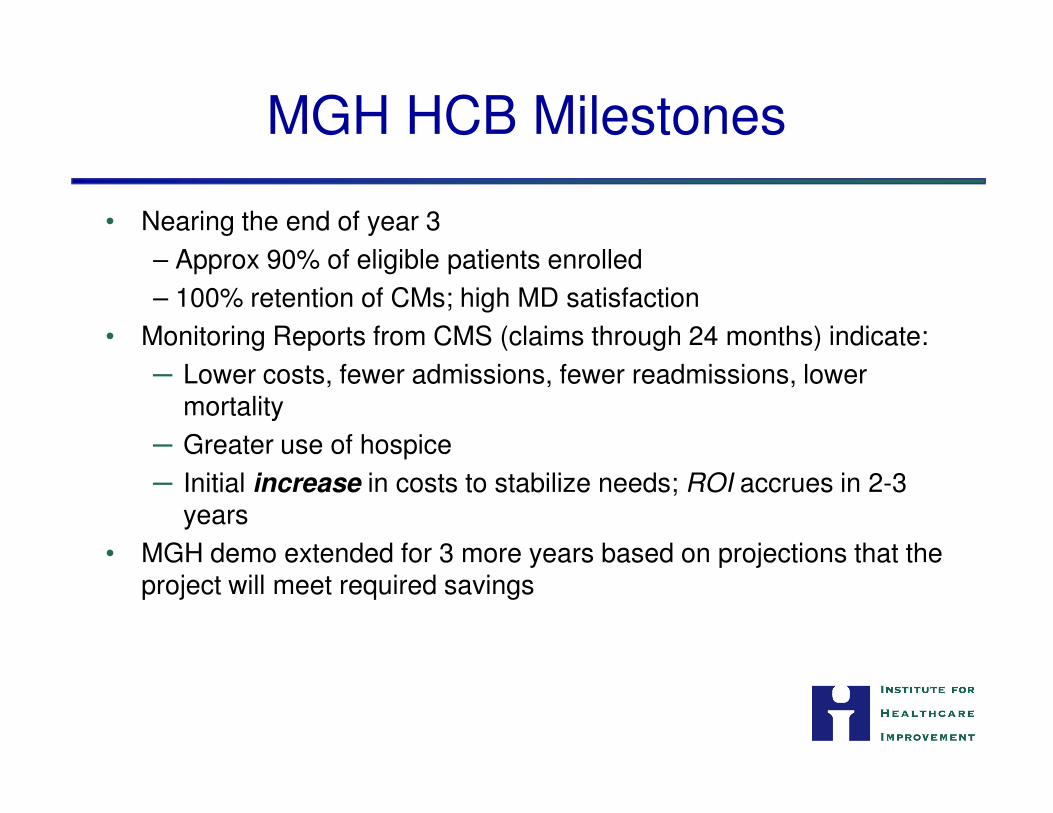
MGH HCB Milestones
• Nearing the end of year 3
– Approx 90% of eligible patients enrolled
– 100% retention of CMs; high MD satisfaction
• Monitoring Reports from CMS (claims through 24 months) indicate:
─ Lower costs, fewer admissions, fewer readmissions, lower mortalitymortality
─ Greater use of hospice
─ Initial increase in costs to stabilize needs; ROI accrues in 2-3 years
• MGH demo extended for 3 more years based on projections that the project will meet required savings

Synthesis of Common Principles
• Early assessment of discharge needs
• Enhanced patient and family caregiver engagement in plan
• Appropriate referral for home care services
• Timely communication between clinicians at times of transfer
• Accurate medication management across settings
• Hospital-based nurse/pharmacist phone calls 48h after d/c to confirm medical and follow up plan
• Early post-acute follow up
• Remote monitoring
• Encourage discussion of care preferences and ensure stated preferences transfer between settings
• Complex care management for high risk patients

“Sense-Making”Practical Strategies for Catalyzing Action
Pat Rutherford, RN, MS
Vice President
Co-Principal Investigator, STAAR Initiative
Institute for Healthcare Improvement
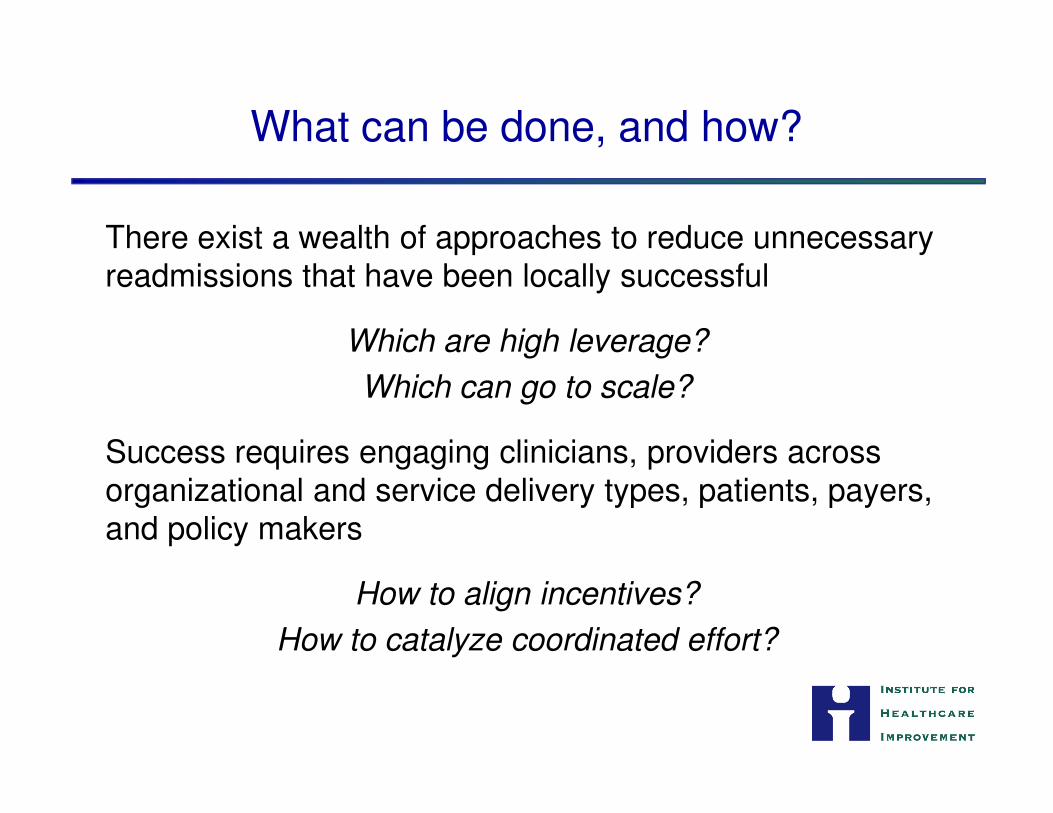
What can be done, and how?
There exist a wealth of approaches to reduce unnecessary readmissions that have been locally successful
Which are high leverage?
Which can go to scale?
Success requires engaging clinicians, providers across organizational and service delivery types, patients, payers, and policy makers
How to align incentives?
How to catalyze coordinated effort?
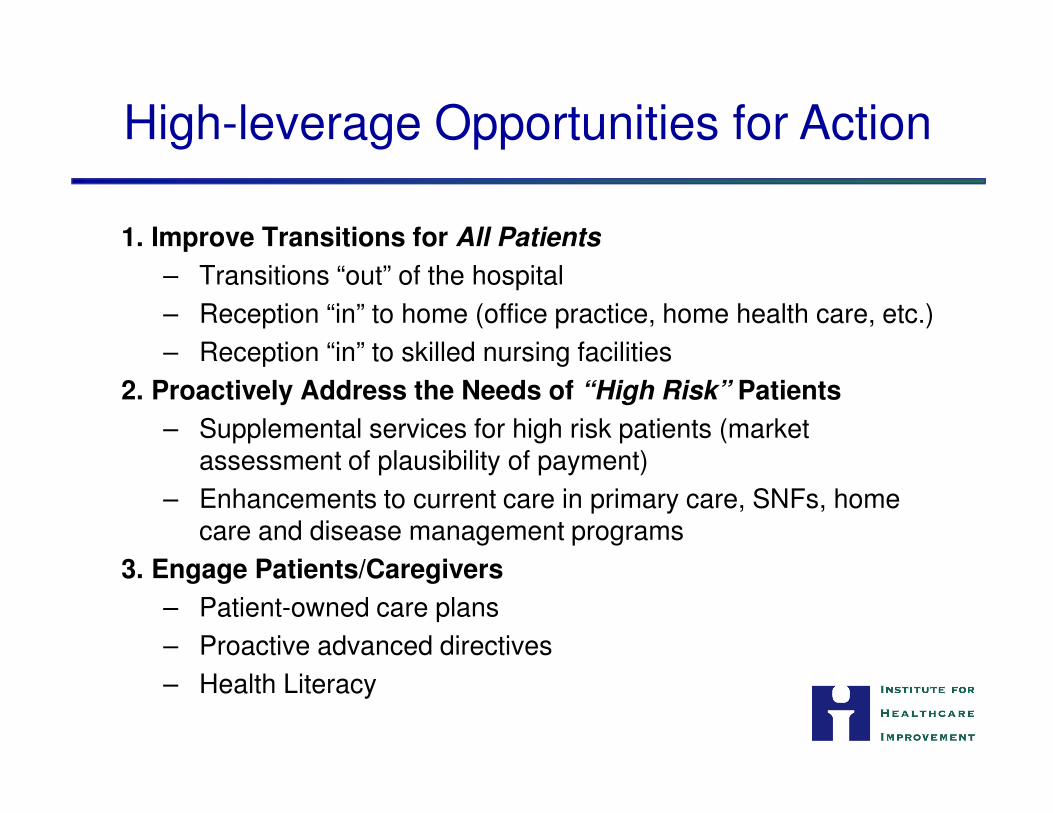
1. Improve Transitions for All Patients
– Transitions “out” of the hospital
– Reception “in” to home (office practice, home health care, etc.)
– Reception “in” to skilled nursing facilities
2. Proactively Address the Needs of “High Risk” Patients
High-leverage Opportunities for Action
– Supplemental services for high risk patients (market assessment of plausibility of payment)
– Enhancements to current care in primary care, SNFs, home care and disease management programs
3. Engage Patients/Caregivers
– Patient-owned care plans
– Proactive advanced directives
– Health Literacy

How did they do that?they do that?
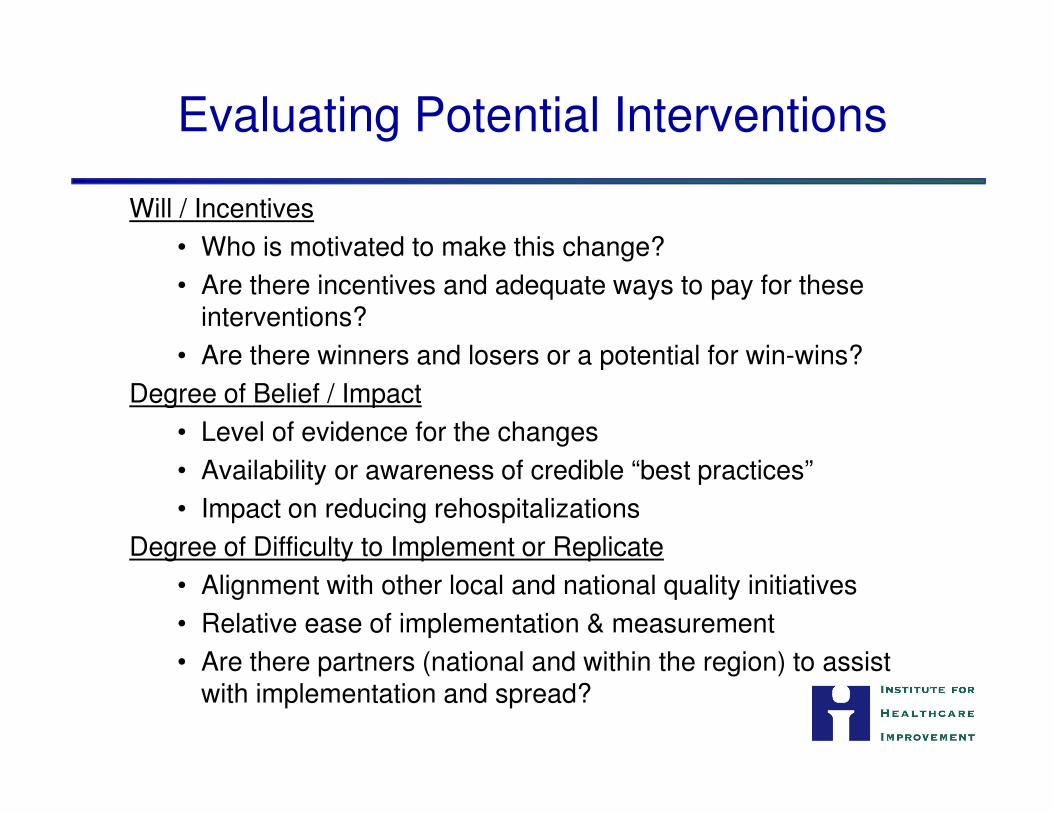
Will / Incentives
• Who is motivated to make this change?
• Are there incentives and adequate ways to pay for these interventions?
• Are there winners and losers or a potential for win-wins?
Degree of Belief / Impact
Evaluating Potential Interventions
Degree of Belief / Impact
• Level of evidence for the changes
• Availability or awareness of credible “best practices”
• Impact on reducing rehospitalizations
Degree of Difficulty to Implement or Replicate
• Alignment with other local and national quality initiatives
• Relative ease of implementation & measurement
• Are there partners (national and within the region) to assist with implementation and spread?
STate Action on Avoidable Rehospitalizations (STAAR) Initiative
The Commonwealth Fund-supported initiative to reduce
avoidable 30-day rehospitalizations, taking states as unit of
intervention.
• May 1, 2009 launch
• Anticipated 4-year initiative• Anticipated 4-year initiative
• Institute for Healthcare Improvement providing technical assistance and facilitating a learning system
• Multi-stakeholder coalitions in 3 states selected as partners in this initiative (Massachusetts, Michigan, Washington)
Goals
• Reduce each state’s all-cause 30-day rehospitalization rates by 30 percent
STate Action on Avoidable Rehospitalizations (STAAR) Initiative
• Increase patient and family satisfaction with transitions in care and with coordination of care
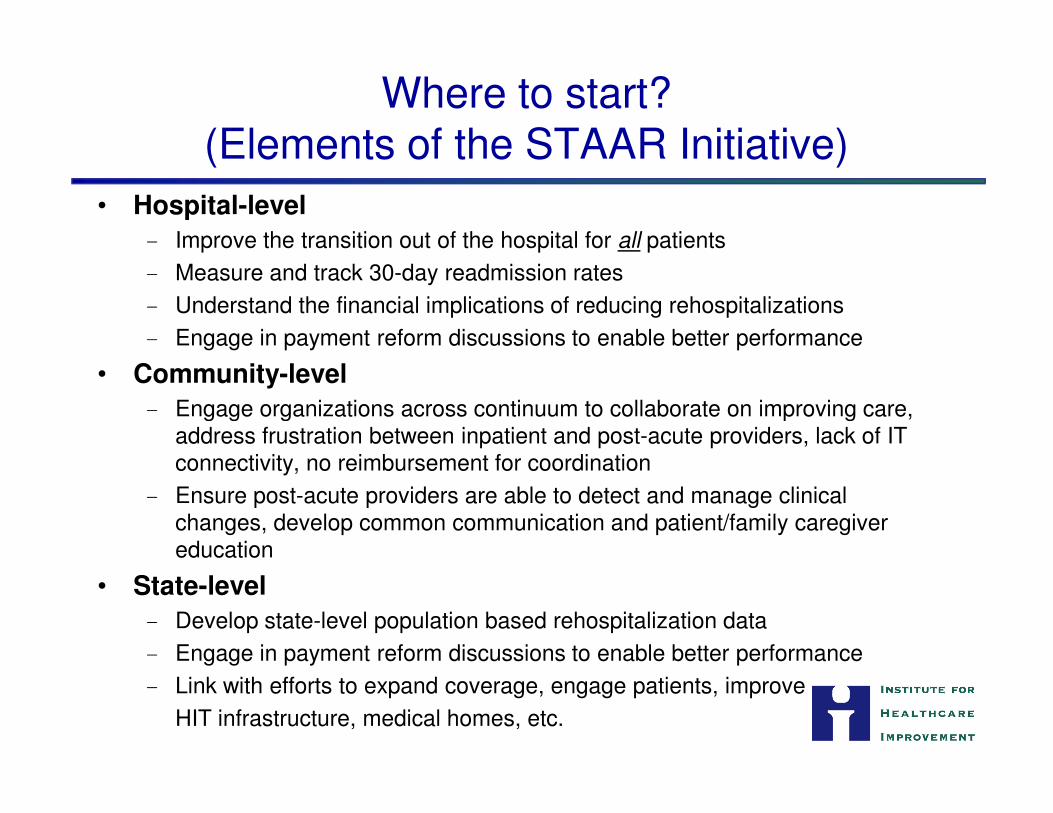
Where to start? (Elements of the STAAR Initiative)
• Hospital-level
- Improve the transition out of the hospital for all patients
- Measure and track 30-day readmission rates
- Understand the financial implications of reducing rehospitalizations
- Engage in payment reform discussions to enable better performance
• Community-level
- Engage organizations across continuum to collaborate on improving care, - Engage organizations across continuum to collaborate on improving care, address frustration between inpatient and post-acute providers, lack of IT connectivity, no reimbursement for coordination
- Ensure post-acute providers are able to detect and manage clinical changes, develop common communication and patient/family caregiver education
• State-level
- Develop state-level population based rehospitalization data
- Engage in payment reform discussions to enable better performance
- Link with efforts to expand coverage, engage patients, improve
HIT infrastructure, medical homes, etc.
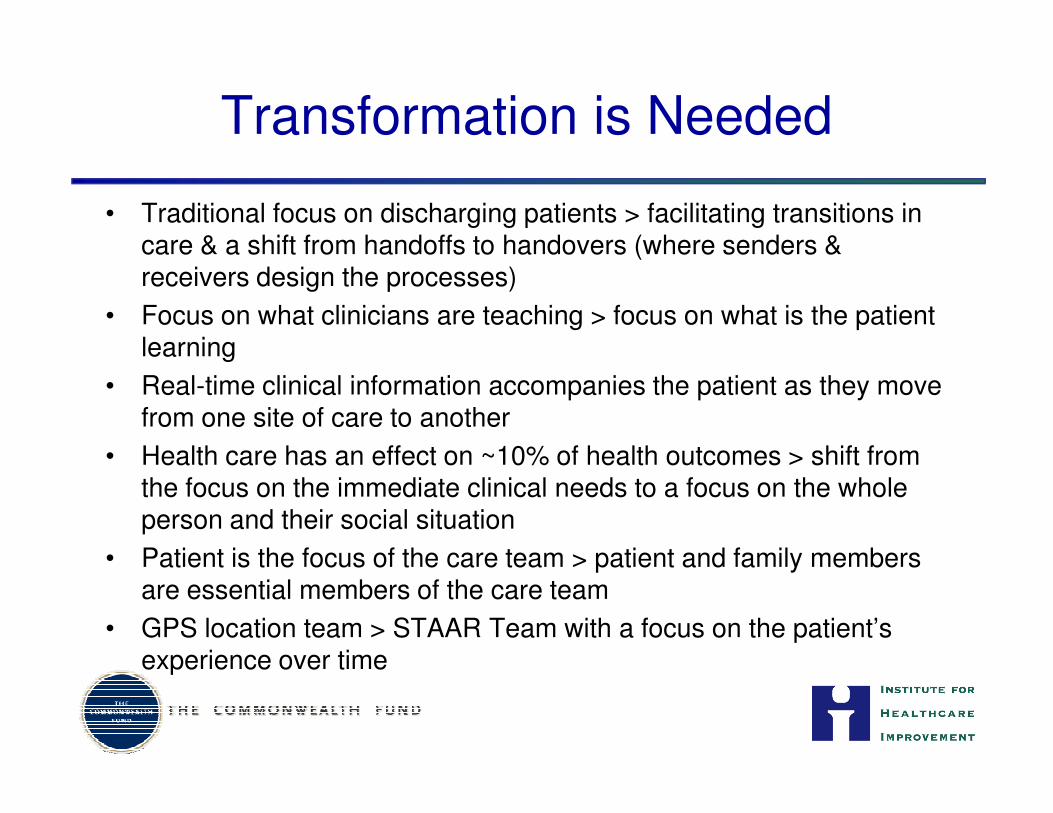
Transformation is Needed
• Traditional focus on discharging patients > facilitating transitions in care & a shift from handoffs to handovers (where senders & receivers design the processes)
• Focus on what clinicians are teaching > focus on what is the patient learning
• Real-time clinical information accompanies the patient as they move from one site of care to anotherfrom one site of care to another
• Health care has an effect on ~10% of health outcomes > shift from the focus on the immediate clinical needs to a focus on the whole person and their social situation
• Patient is the focus of the care team > patient and family members are essential members of the care team
• GPS location team > STAAR Team with a focus on the patient’s experience over time
“Handing off the Baton”
Transition from Transition from
Hospital to Home
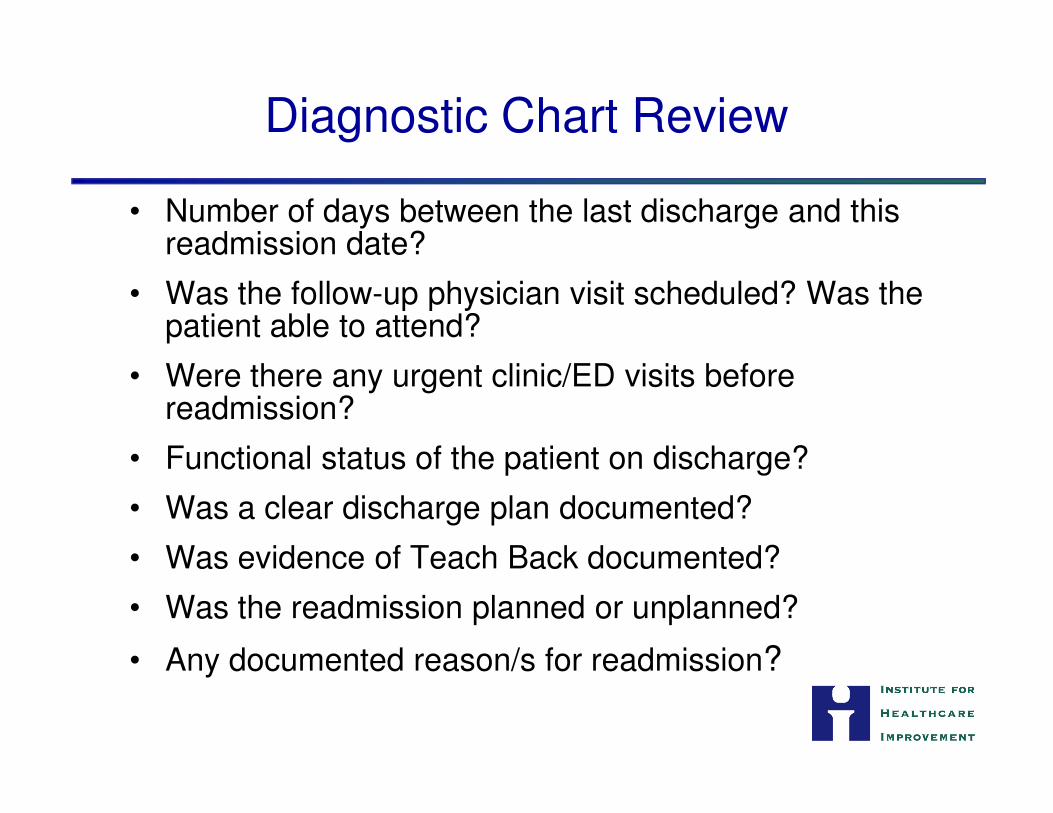
Diagnostic Chart Review
• Number of days between the last discharge and this readmission date?
• Was the follow-up physician visit scheduled? Was the patient able to attend?
• Were there any urgent clinic/ED visits before readmission?readmission?
• Functional status of the patient on discharge?
• Was a clear discharge plan documented?
• Was evidence of Teach Back documented?
• Was the readmission planned or unplanned?
• Any documented reason/s for readmission?
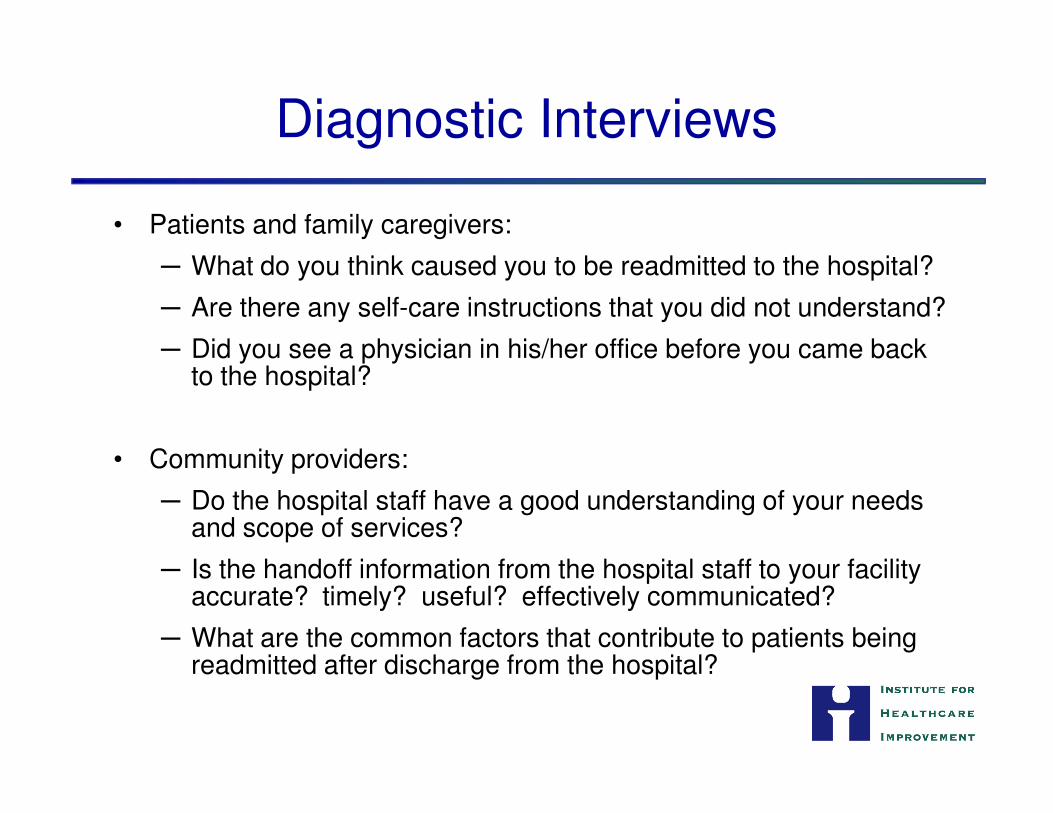
Diagnostic Interviews
• Patients and family caregivers:
─ What do you think caused you to be readmitted to the hospital?
─ Are there any self-care instructions that you did not understand?
─ Did you see a physician in his/her office before you came back to the hospital?
• Community providers:
─ Do the hospital staff have a good understanding of your needs and scope of services?
─ Is the handoff information from the hospital staff to your facility accurate? timely? useful? effectively communicated?
─ What are the common factors that contribute to patients being readmitted after discharge from the hospital?
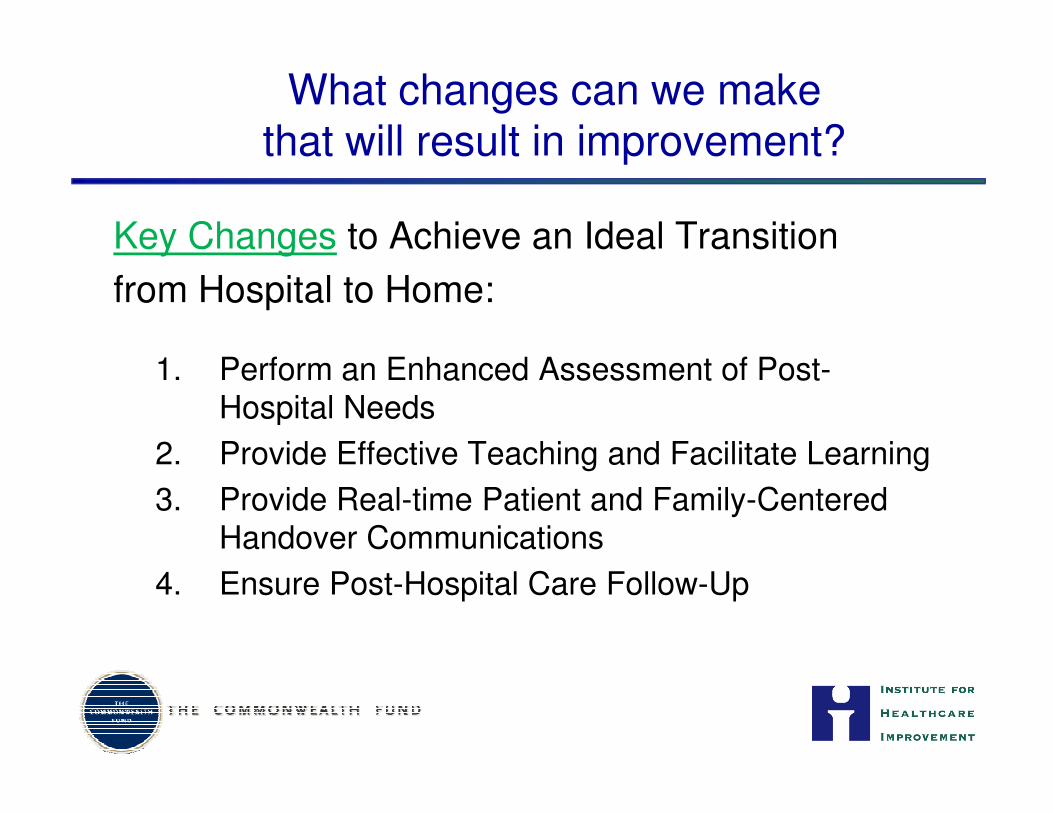
What changes can we makethat will result in improvement?
Key Changes to Achieve an Ideal Transition
from Hospital to Home:
1. Perform an Enhanced Assessment of Post-Hospital NeedsHospital Needs
2. Provide Effective Teaching and Facilitate Learning
3. Provide Real-time Patient and Family-Centered Handover Communications
4. Ensure Post-Hospital Care Follow-Up
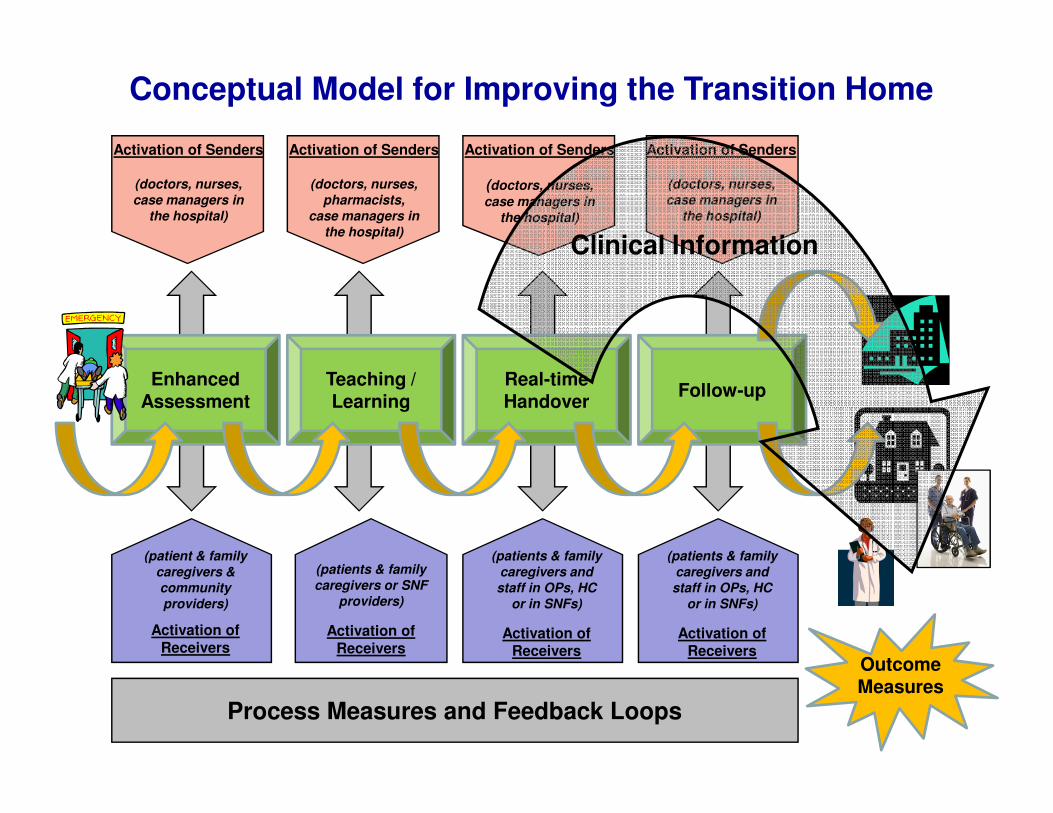
Conceptual Model for Improving the Transition Home
Activation of Senders
(doctors, nurses, case managers in
the hospital)
Activation of Senders
(doctors, nurses, pharmacists,
case managers in the hospital)
Activation of Senders
(doctors, nurses,
case managers in the hospital)
Activation of Senders
(doctors, nurses, case managers in
the hospital)
Enhanced Assessment
Follow-upReal-time Handover
Teaching / Learning
Clinical Information
Process Measures and Feedback Loops
(patient & family caregivers & community providers)
Activation of Receivers
(patients & family caregivers or SNF
providers)
Activation of Receivers
(patients & family caregivers and staff in OPs, HC
or in SNFs)
Activation of Receivers
Assessment HandoverLearning
Outcome Measures
(patients & family caregivers and staff in OPs, HC
or in SNFs)
Activation of Receivers
“Receiving the Baton”
Reception into Office Practices
Reception into Skilled Nursing Facilities
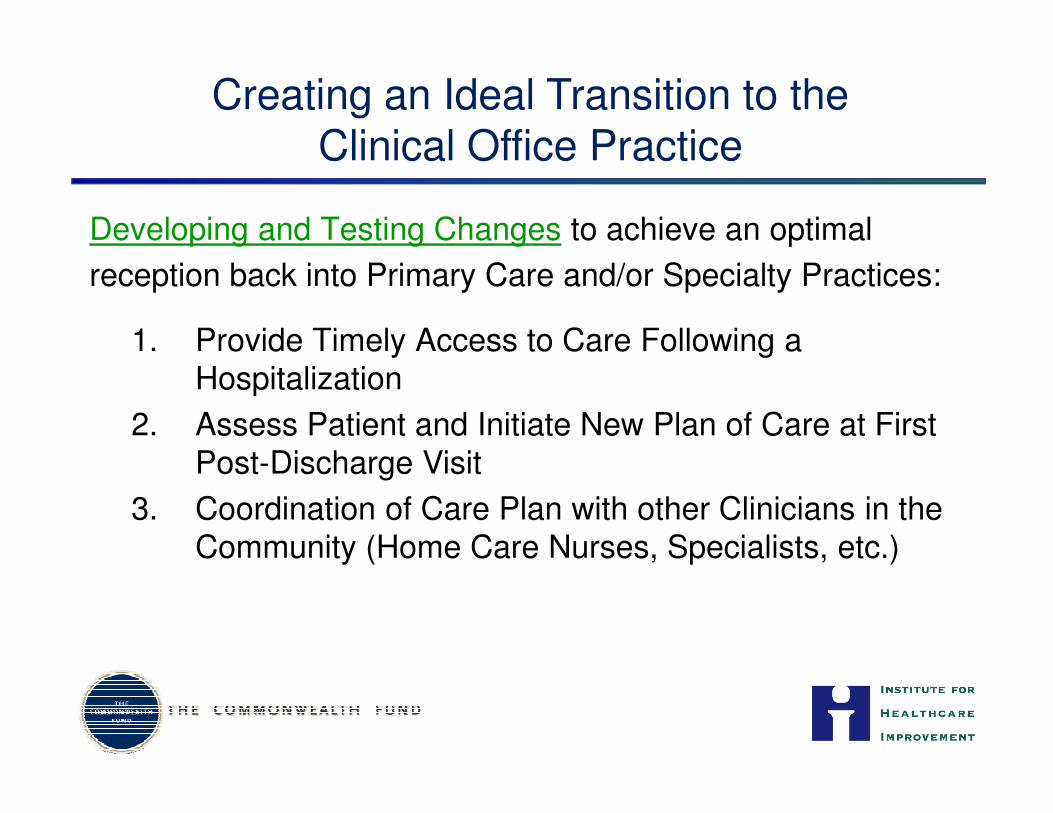
Creating an Ideal Transition to the Clinical Office Practice
Developing and Testing Changes to achieve an optimal
reception back into Primary Care and/or Specialty Practices:
1. Provide Timely Access to Care Following a Hospitalization
2. Assess Patient and Initiate New Plan of Care at First 2. Assess Patient and Initiate New Plan of Care at First Post-Discharge Visit
3. Coordination of Care Plan with other Clinicians in the Community (Home Care Nurses, Specialists, etc.)
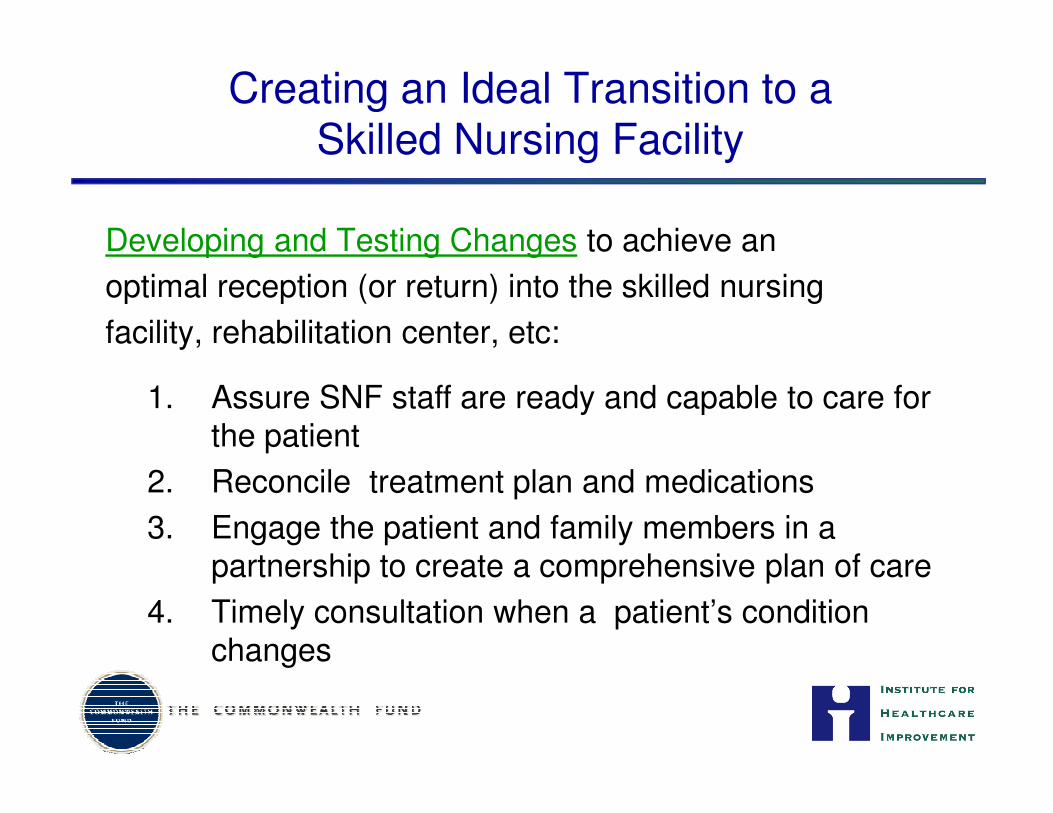
Creating an Ideal Transition to a Skilled Nursing Facility
Developing and Testing Changes to achieve an
optimal reception (or return) into the skilled nursing
facility, rehabilitation center, etc:
1. Assure SNF staff are ready and capable to care for 1. Assure SNF staff are ready and capable to care for the patient
2. Reconcile treatment plan and medications
3. Engage the patient and family members in a partnership to create a comprehensive plan of care
4. Timely consultation when a patient’s condition changes


Creating an Ideal Transition Home
Gail Nielsen, BSHCA, FAHRA, RTR
Iowa Health System
Expert Faculty for STAAR

What changes can we makethat will result in improvement?
Key Changes to Achieve an Ideal Transition
from Hospital to Home:
1. Perform an Enhanced Assessment of Post-Hospital NeedsHospital Needs
2. Provide Effective Teaching and Facilitate Learning
3. Provide Real-time Patient and Family-Centered Handover Communications
4. Ensure Post-Hospital Care Follow-Up
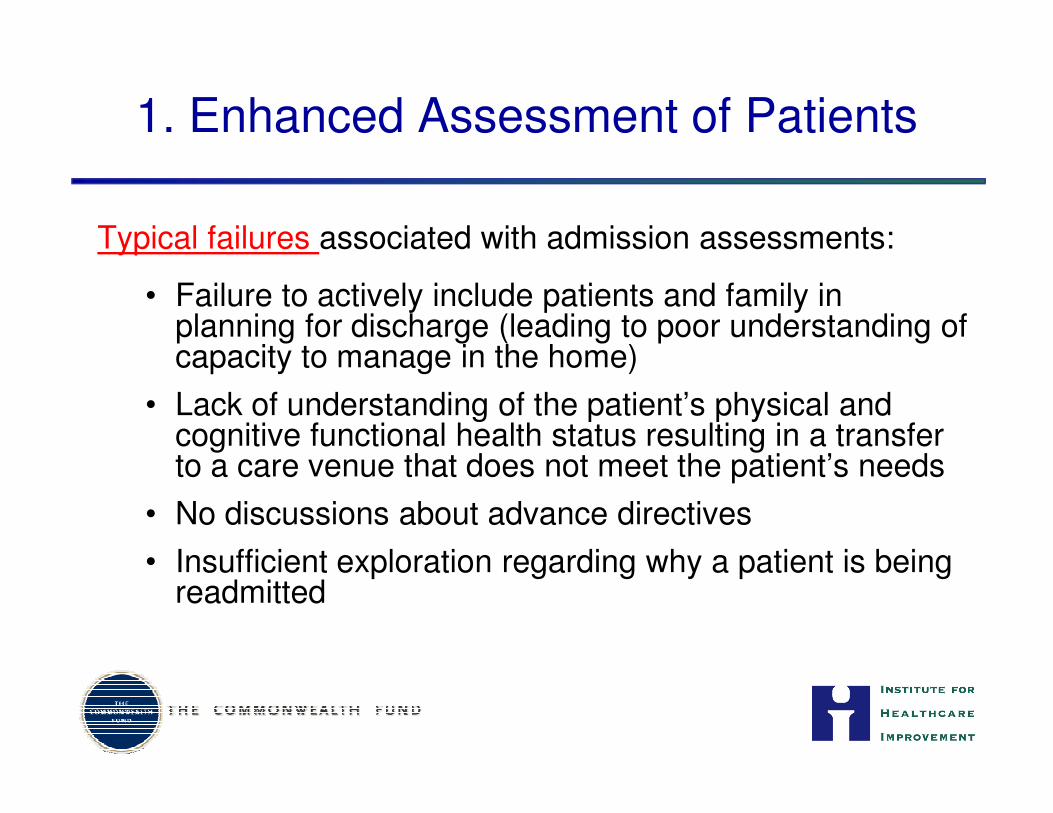
1. Enhanced Assessment of Patients
Typical failures associated with admission assessments:
• Failure to actively include patients and family in planning for discharge (leading to poor understanding of capacity to manage in the home)
• Lack of understanding of the patient’s physical and • Lack of understanding of the patient’s physical and cognitive functional health status resulting in a transfer to a care venue that does not meet the patient’s needs
• No discussions about advance directives
• Insufficient exploration regarding why a patient is being readmitted

1. Enhanced Assessment of Patients
a. Include family caregivers and community providers (e.g., home health nurses, primary care physicians, HF clinic nurses, etc) as full partners in:
– standardized assessment
– discharge planning– discharge planning
– predicting home-going needs
b. Reconcile medications upon admission
c. Initiate a standard plan of care based on the results of the assessment
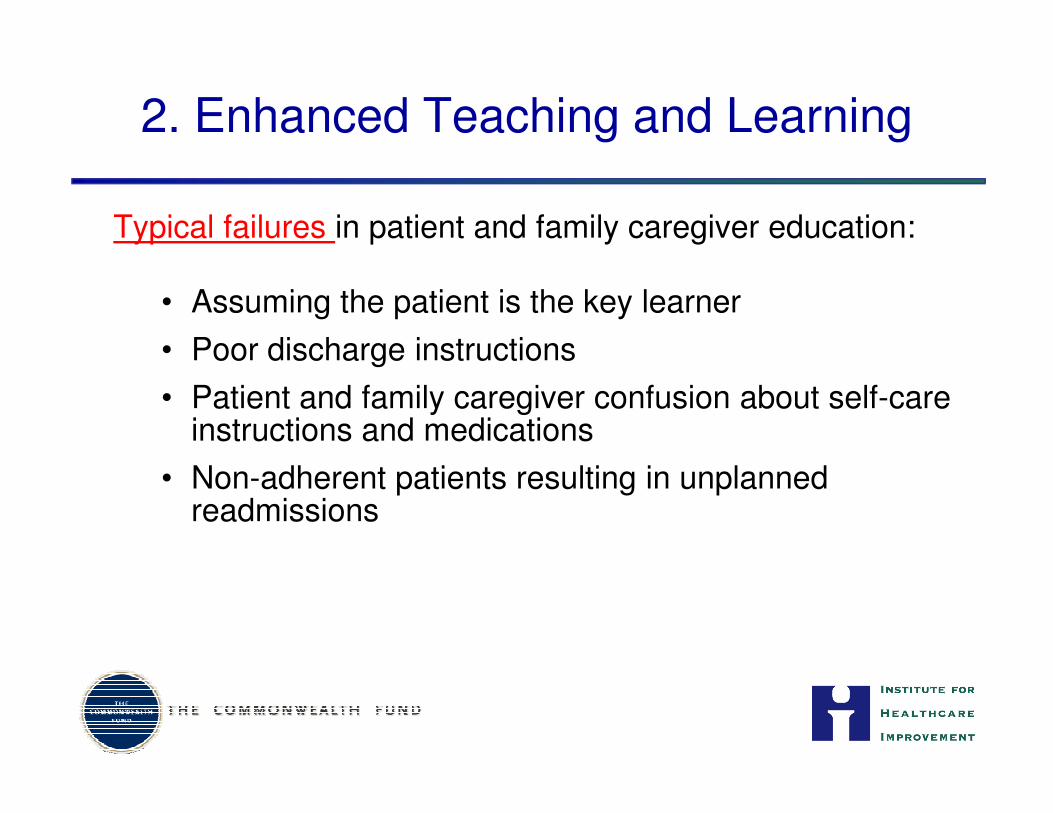
2. Enhanced Teaching and Learning
Typical failures in patient and family caregiver education:
• Assuming the patient is the key learner
• Poor discharge instructions
• Patient and family caregiver confusion about self-care • Patient and family caregiver confusion about self-care instructions and medications
• Non-adherent patients resulting in unplanned readmissions
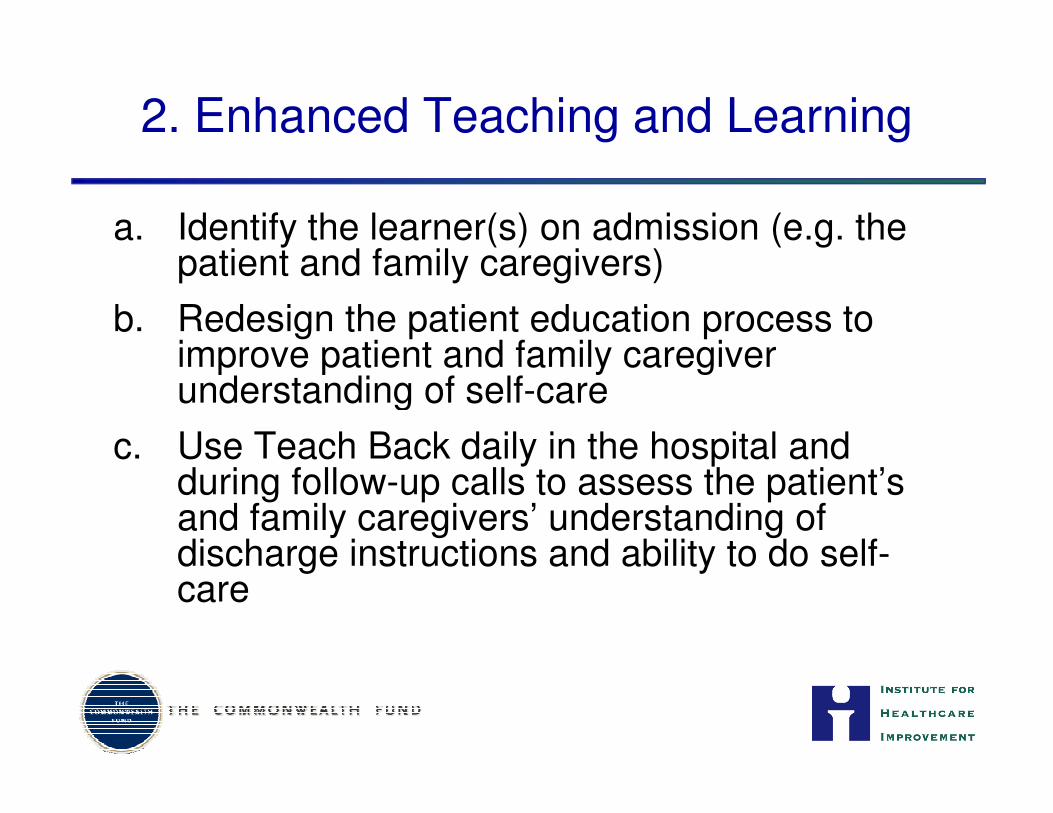
2. Enhanced Teaching and Learning
a. Identify the learner(s) on admission (e.g. the patient and family caregivers)
b. Redesign the patient education process to improve patient and family caregiver understanding of self-careunderstanding of self-care
c. Use Teach Back daily in the hospital and during follow-up calls to assess the patient’s and family caregivers’ understanding of discharge instructions and ability to do self-care
Factors that Contribute to Health Literacy
• General literacy
• Experience with health system
• Complexity of information
• Cultural and language factors• Cultural and language factors
• How information is communicated
• Aging
Low Health Literacy: Individuals Have Problems with…
• Medications
• Appointments
• Informed consent
• Health education materials• Health education materials
• Insurance applications
• Discharge instructions
“Ask Me 3”
• Encourages patients to ask 3 questions in every health care encounter:
1) What is my main problem?
2) What do I need to do?
3) Why is it important for me to do this?3) Why is it important for me to do this?
• Providers’ “teach to the test”
Nurses and Doctors say that “This changes the way I
talk to patients.”
http://www.npsf.org/askme3/
Teach Back
• Explain needed information to the patient or family caregiver
• Ask in a non-shaming way for the individual to explain in his or her own words what was understood understood
• If a gap in understanding is identified, offer additional teaching or explanation followed by a second request for Teach Back
Schillinger D et al. Closing the loop: physician
communication... Arch Intern Med. 2003;163:83-90.
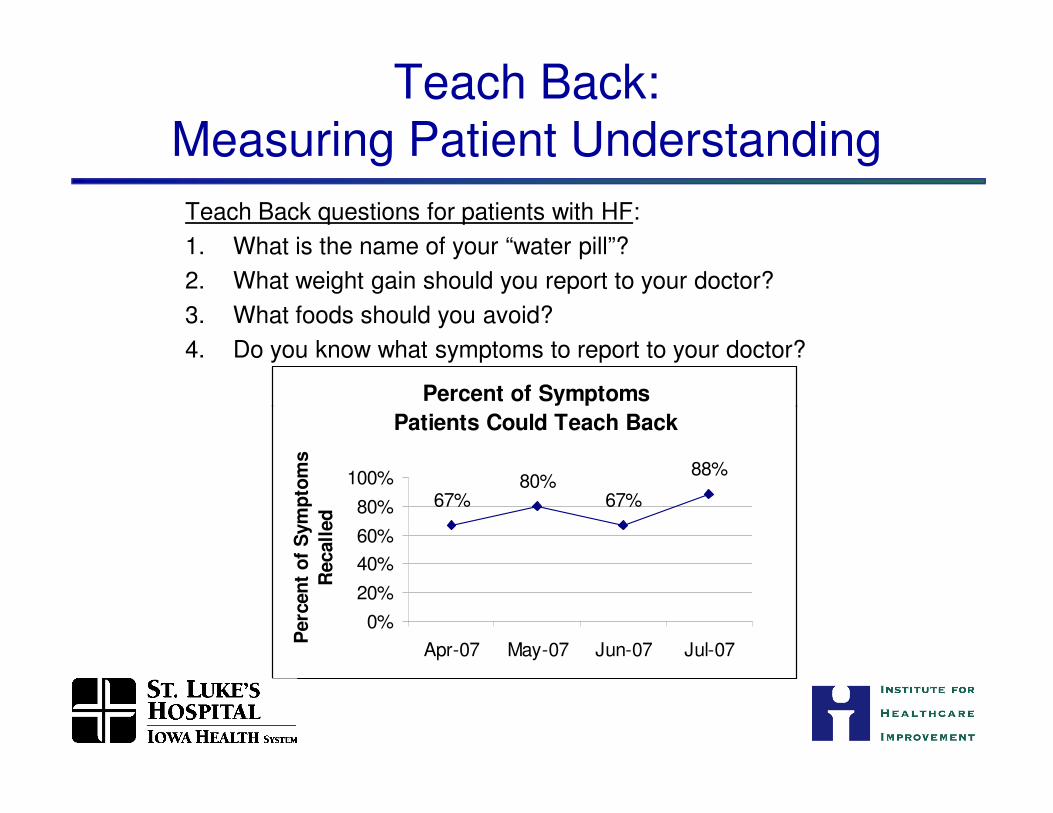
Teach Back:Measuring Patient Understanding
Percent of Symptoms
Teach Back questions for patients with HF:
1. What is the name of your “water pill”?
2. What weight gain should you report to your doctor?
3. What foods should you avoid?
4. Do you know what symptoms to report to your doctor?
Patients Could Teach Back
67%80%
67%
88%
0%
20%
40%
60%
80%
100%
Apr-07 May-07 Jun-07 Jul-07
Perc
en
t o
f S
ym
pto
ms
Recall
ed
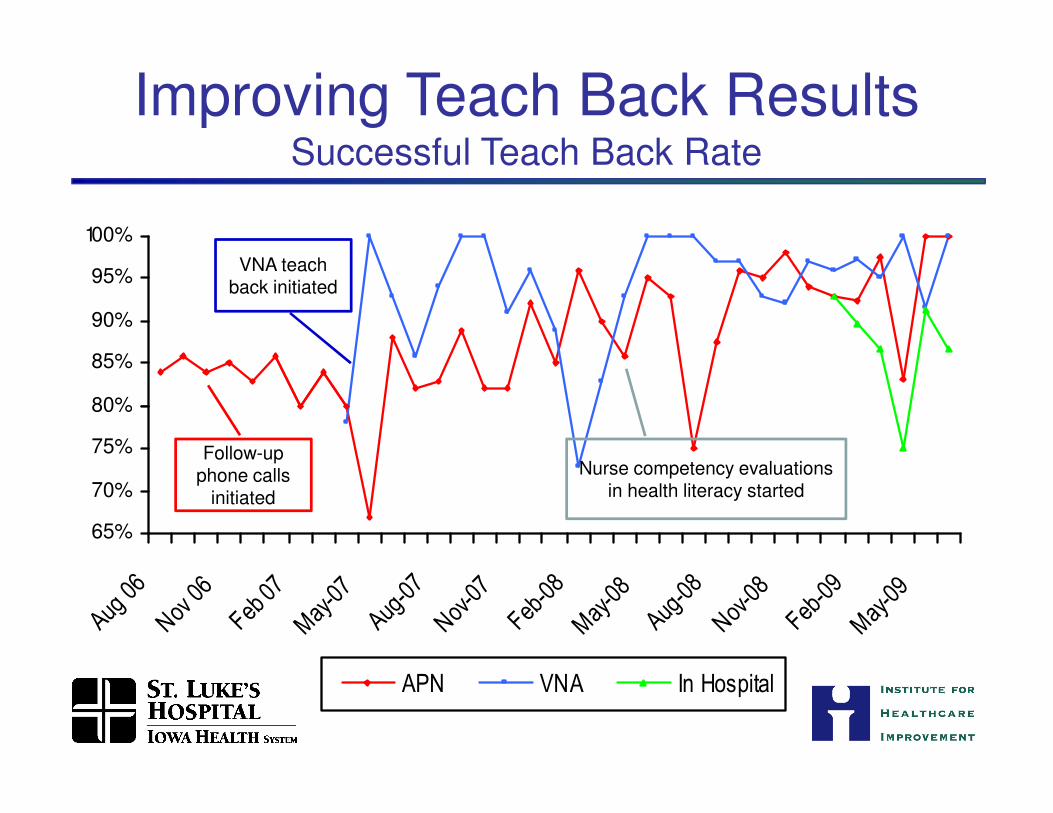
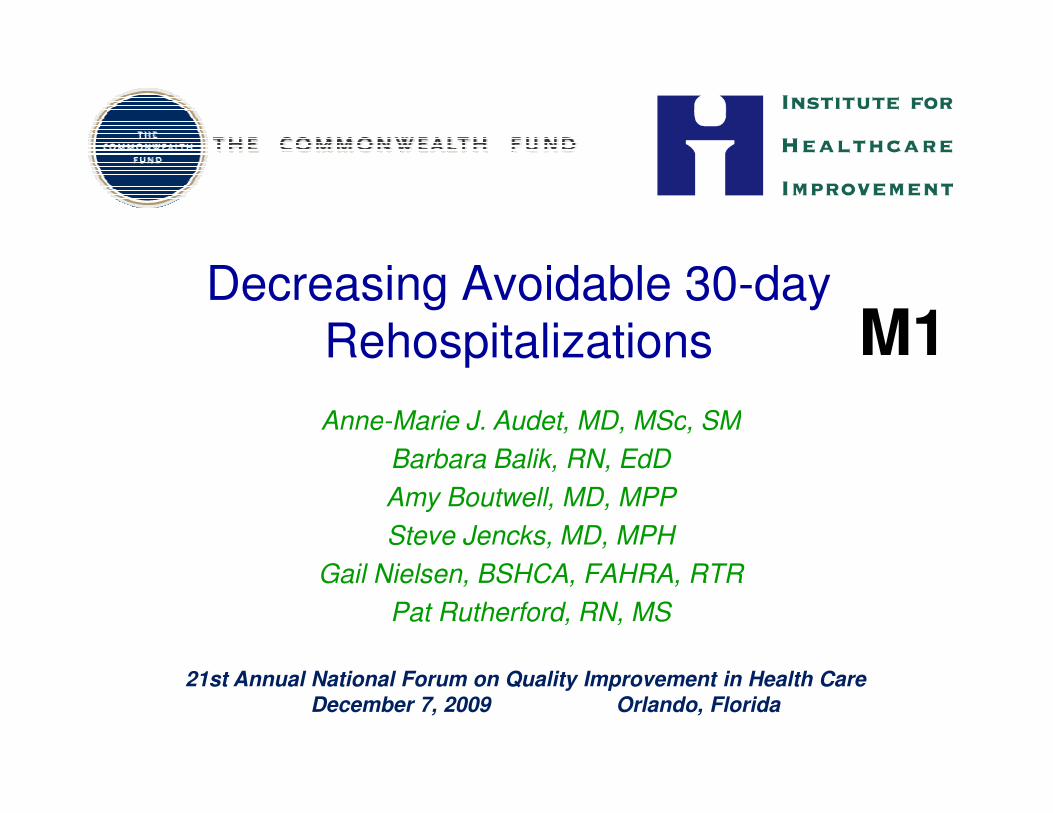
Improving Teach Back ResultsSuccessful Teach Back Rate
80%
85%
90%
95%
100%
VNA teach back initiated
65%
70%
75%
80%
Aug 06
Nov 0
6
Feb 0
7May-07
Aug-07
Nov-0
7
Feb-08
May-08
Aug-08
Nov-0
8
Feb-09
May-09
APN VNA In Hospital
Follow-up phone calls
initiated
Nurse competency evaluations in health literacy started
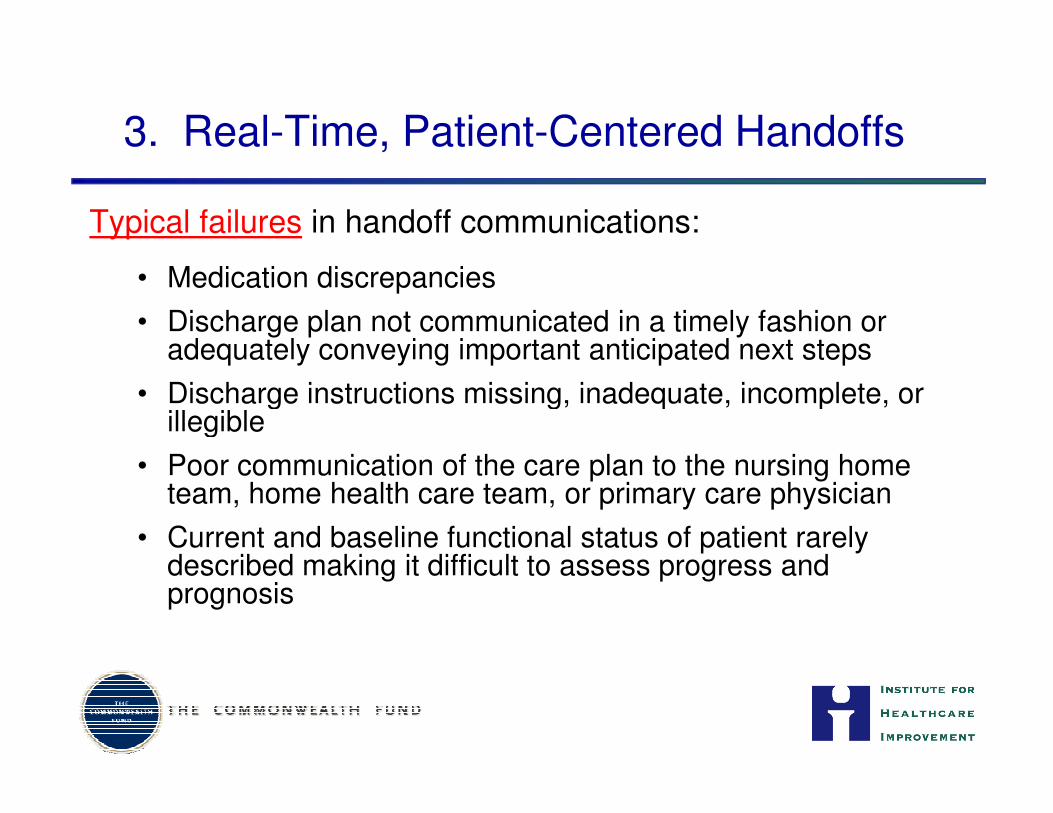
3. Real-Time, Patient-Centered Handoffs
Typical failures in handoff communications:
• Medication discrepancies
• Discharge plan not communicated in a timely fashion or adequately conveying important anticipated next steps
• Discharge instructions missing, inadequate, incomplete, or illegible
• Discharge instructions missing, inadequate, incomplete, or illegible
• Poor communication of the care plan to the nursing home team, home health care team, or primary care physician
• Current and baseline functional status of patient rarely described making it difficult to assess progress and prognosis
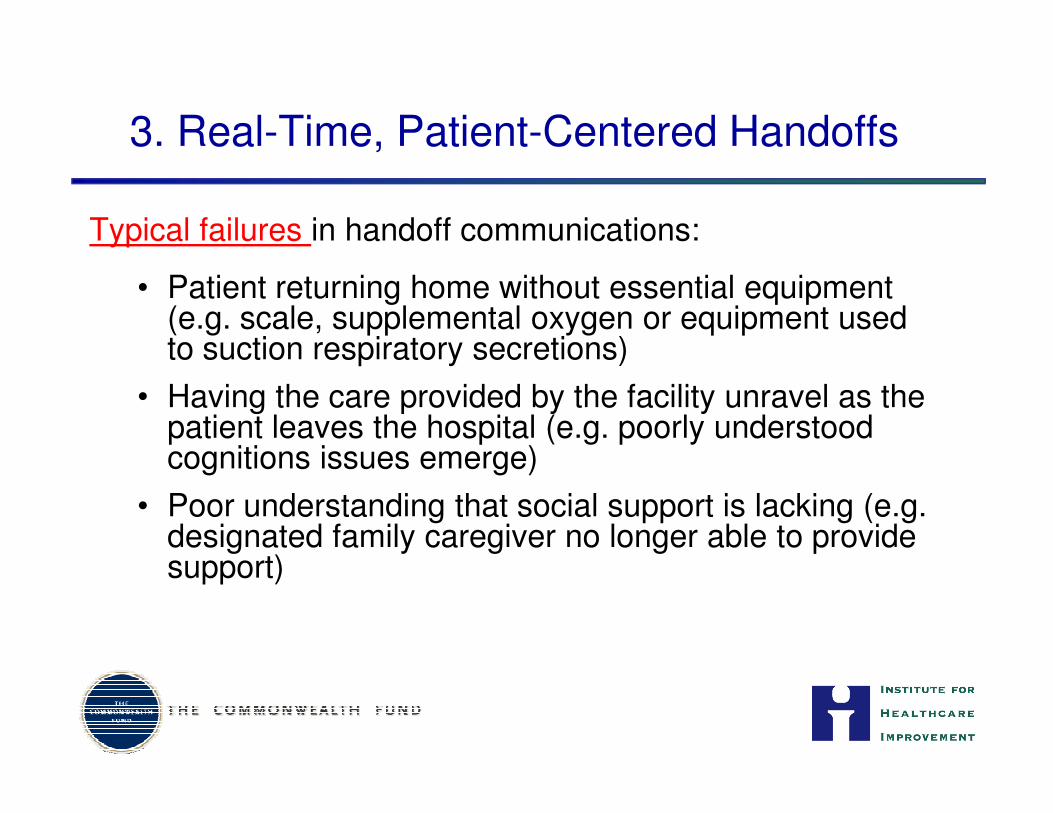
3. Real-Time, Patient-Centered Handoffs
Typical failures in handoff communications:
• Patient returning home without essential equipment (e.g. scale, supplemental oxygen or equipment used to suction respiratory secretions)
• Having the care provided by the facility unravel as the • Having the care provided by the facility unravel as the patient leaves the hospital (e.g. poorly understood cognitions issues emerge)
• Poor understanding that social support is lacking (e.g. designated family caregiver no longer able to provide support)
3. Real-Time, Patient-Centered Handoffs
a. Reconcile medications at time of discharge
b. Provide customized, real-time critical information to the next care provider(s) that:
– accompanies the patient to the next institution and/or institution and/or
– is transmitted to the receiving physician and/or home health agency or other care providers at time of discharge
4. Post Acute Follow-Up
Typical failures following discharge from hospital include:
• Medication errors • Poor discharge instructions • No follow-up appointment• Follow up too long after hospitalization• Follow up too long after hospitalization• Poor outpatient management • Lack of social support • Patient confusion about self-care instructions
medications • Lack of adherence to medications, therapies, daily
weights and adjustment to medication and diet as a result
4. Post Acute Follow-Up
a. High risk patients: prior to discharge, schedule a face-to-face follow-up visit (home care visit, care coordination visit, or physician office visit), to occur within 48 hours after discharge
b. Moderate risk patients: prior to discharge schedule follow-up phone call within 48 hours and schedule a physician office visit within 5 days
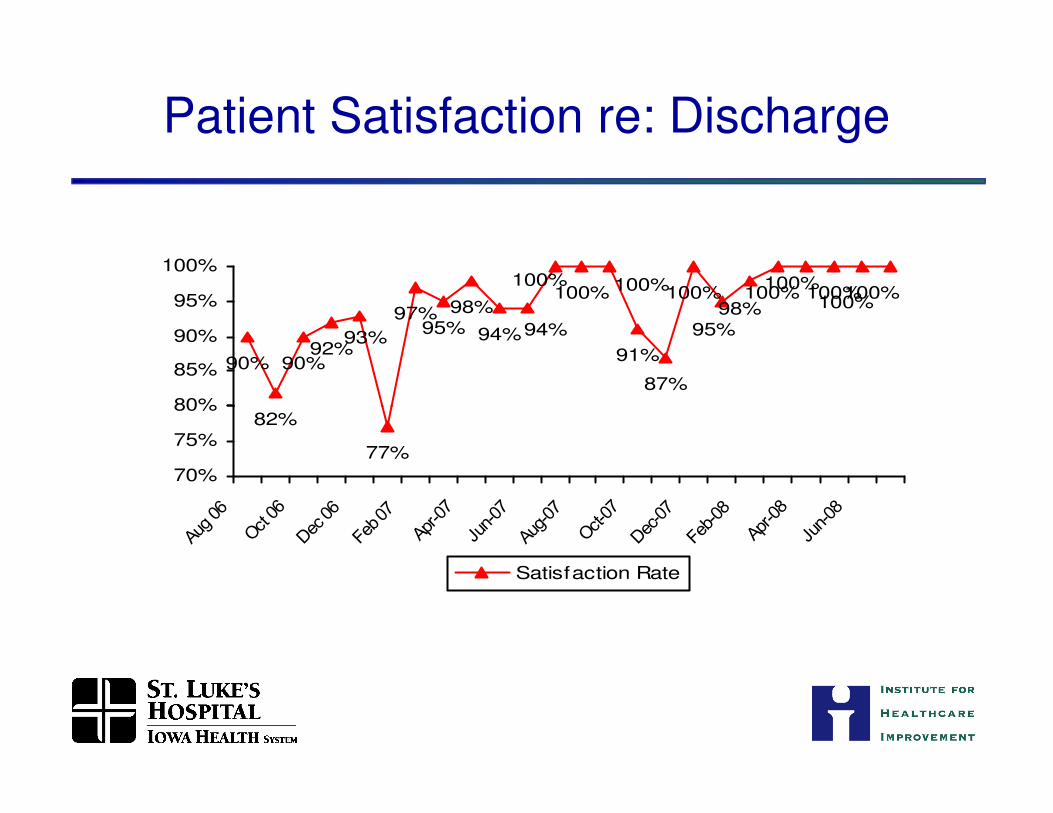
90%92%
98%
94%91%
87%
100% 100%100%100%98%
100%
95%93%
90%
97%95% 94%
100% 100%100%100%
80%
85%
90%
95%
100%
Patient Satisfaction re: Discharge
82%
77%
70%
75%
80%
Aug 06
Oct 06
Dec 06
Feb 07
Apr-0
7
Jun-07
Aug-07
Oct-07
Dec-07
Feb-08
Apr-0
8
Jun-08
Satisfaction Rate
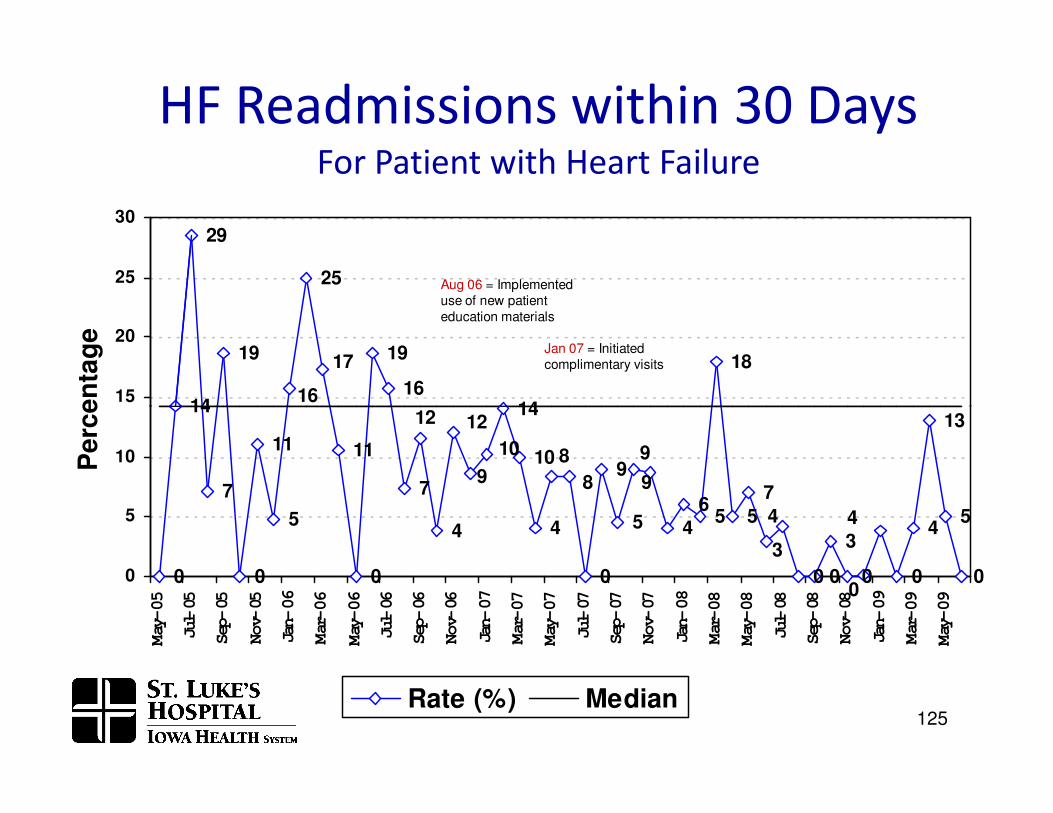
Heart Failure Readmission Rate
19 19
1614
18
16
17
14
29
25
1215
20
25
30
Perc
en
tag
e
Aug 06 = Implemented use of new patient education materials
Jan 07 = Initiated complimentary visits
HF Readmissions within 30 DaysFor Patient with Heart Failure
0 0
11
5
11
0
7
4
14
10
4
0
9
5 46
5 5
7
0 0
3
0 0
4
13
5
00
4
3
4
9
98
89
7
14
10
1212
0
5
10
May-05
Jul-05
Sep-05
Nov-05
Jan-06
Mar-06
May-06
Jul-06
Sep-06
Nov-06
Jan-07
Mar-07
May-07
Jul-07
Sep-07
Nov-07
Jan-08
Mar-08
May-08
Jul-08
Sep-08
Nov-08
Jan-09
Mar-09
May-09
Perc
en
tag
e
Rate (%) Median125
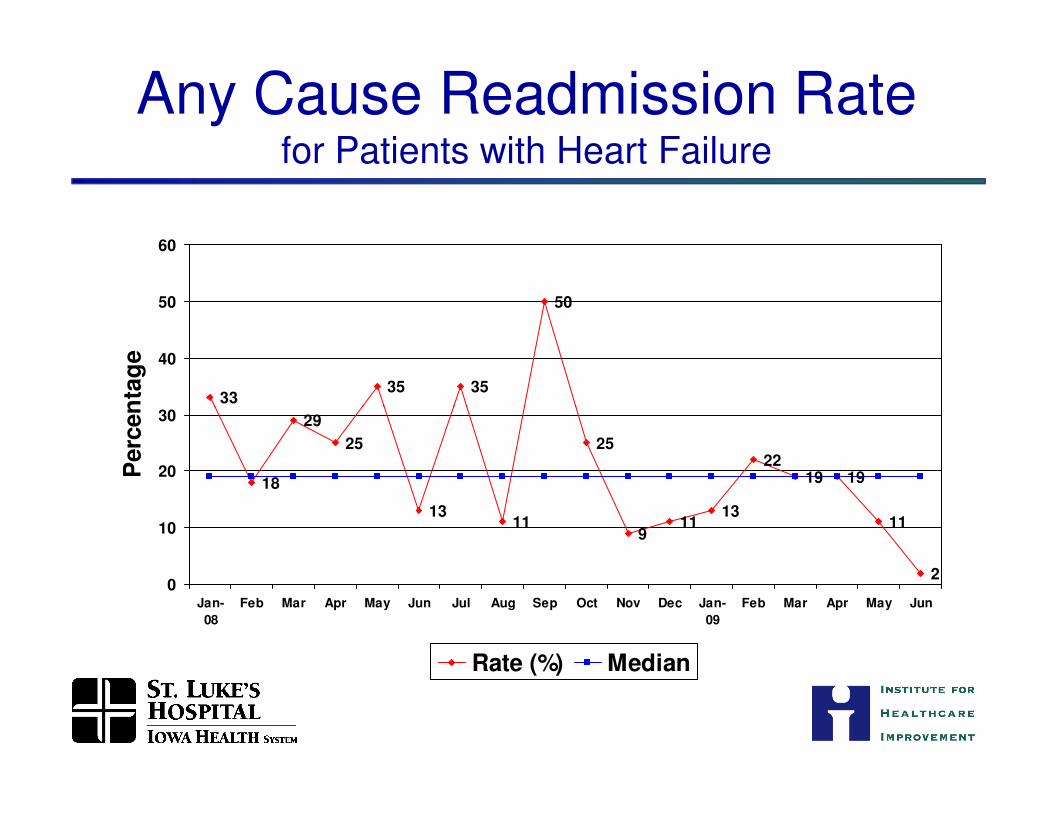
Any Cause Readmission Ratefor Patients with Heart Failure
3335 35
50
30
40
50
60
Perc
en
tag
e
18
29
25
1311
25
911
13
2219 19
11
20
10
20
30
Jan-
08
Feb Mar Apr May Jun Jul Aug Sep Oct Nov Dec Jan-
09
Feb Mar Apr May Jun
Perc
en
tag
e
Rate (%) Median
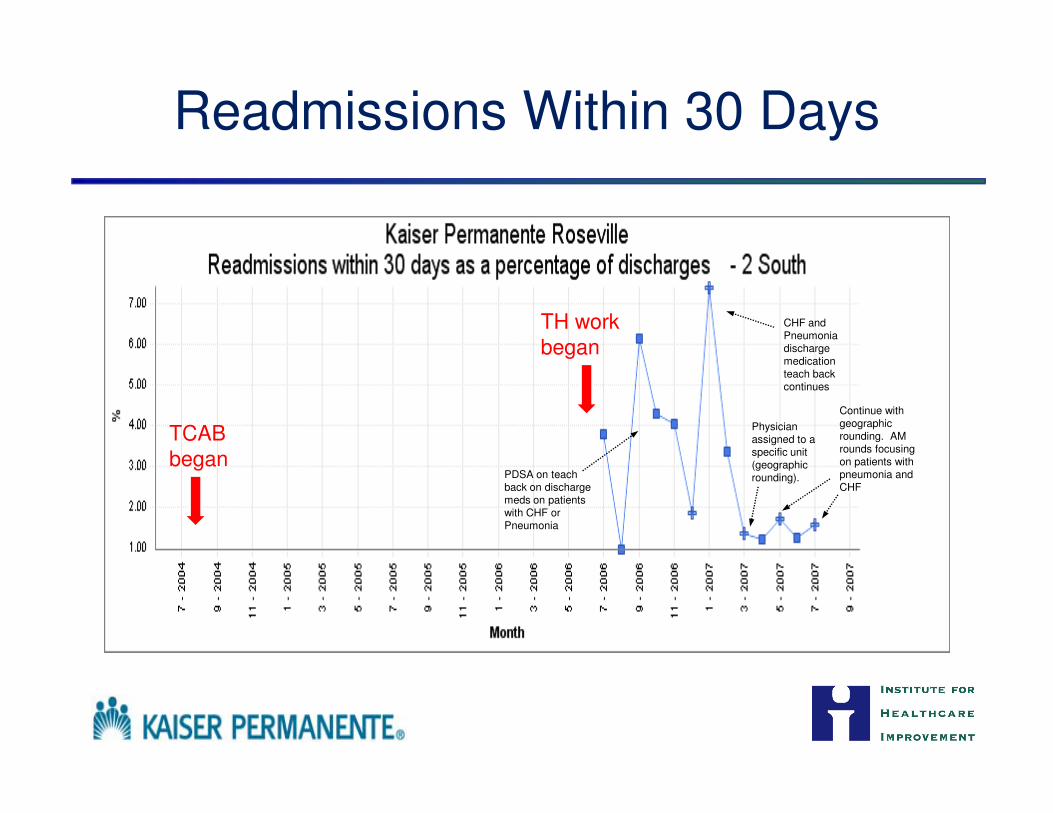
Readmissions Within 30 Days
CHF and Pneumonia discharge medication teach back continues
Continue with
TH workbegan
PDSA on teach back on discharge meds on patients with CHF or Pneumonia
Physician assigned to a specific unit (geographic rounding).
Continue with geographic rounding. AM rounds focusing on patients with pneumonia and CHF
TCAB began
Your Turn
• What success have you had?
• What works?• What works?
• What doesn’t work?
• What questions do you have?

Strategies to Reduce Rehospitalizations in a State/RegionRehospitalizations in a State/Region
Anne-Marie J. Audet, MD, MSc, SM
Barbara Balik, RN, EdD
Amy Boutwell, MD, MPP
Stephen Jencks, MD, MPH
Agenda for this Session
• Designing a strategy for regional success
• Proposed role of policy levers
• Systemic barriers to reducing rehospitalizations
─ Leadership attention
─ Financial impact─ Financial impact
─ Population data and measurement
─ Payment policies
─Working across organizational barriers toward same outcome goal
• State-specific strategies in MA/WA/MI

Designing a Strategy for Regional Success
Provider-Based Initiatives
• Florida Hospital Association Collaborative to Reduce Readmissions
─ 90 hospitals, 2 years (2008-2010)
─ Goals to reduce readmissions for certain conditions by 40-50%
─ Locally adapt best practices through quality improvement approach
• Project BOOST• Project BOOST
─ 35 hospitals across US
─ BOOST toolkit, mentoring, adopts quality improvement approach
• ACC/IHI H2H
─ expected 1500 enrollees, launched October 2009
• Medicare High Cost Beneficiaries Demonstration Projects expansion
• Numerous system-based initiatives
• Numerous care transitions intervention (CTI) trainings
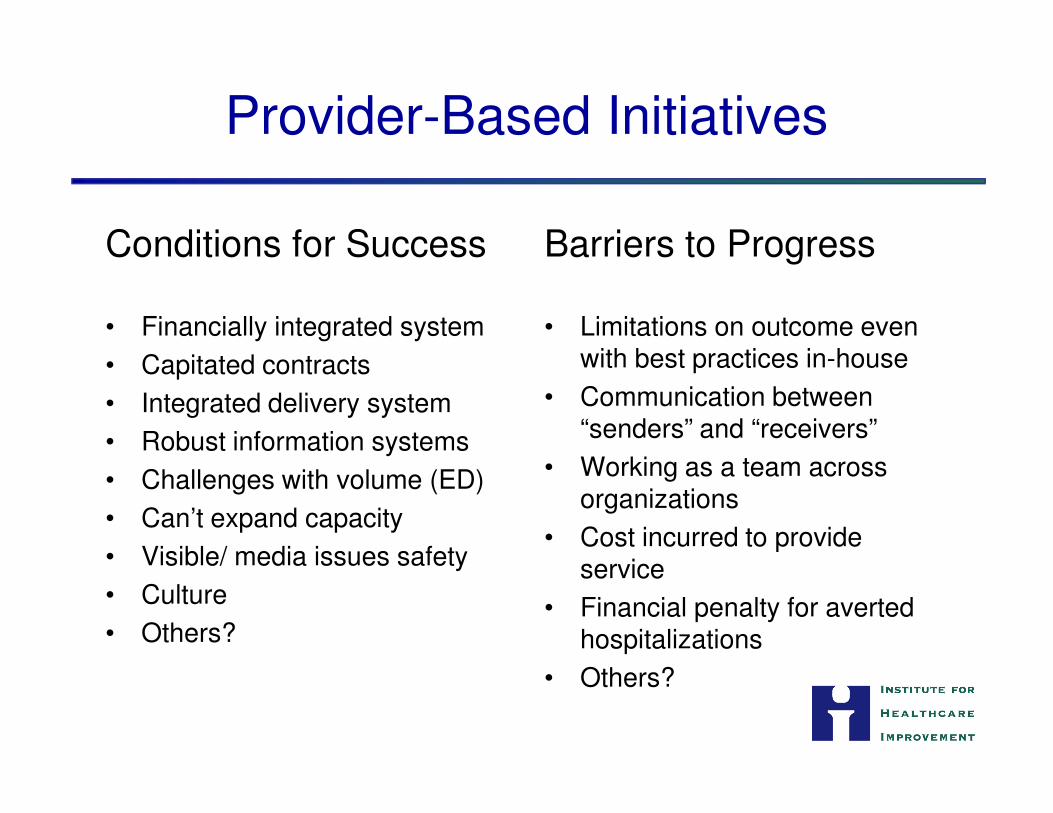
Provider-Based Initiatives
Conditions for Success
• Financially integrated system
• Capitated contracts
• Integrated delivery system
Barriers to Progress
• Limitations on outcome even with best practices in-house
• Communication between • Integrated delivery system
• Robust information systems
• Challenges with volume (ED)
• Can’t expand capacity
• Visible/ media issues safety
• Culture
• Others?
• Communication between “senders” and “receivers”
• Working as a team across organizations
• Cost incurred to provide service
• Financial penalty for averted hospitalizations
• Others?
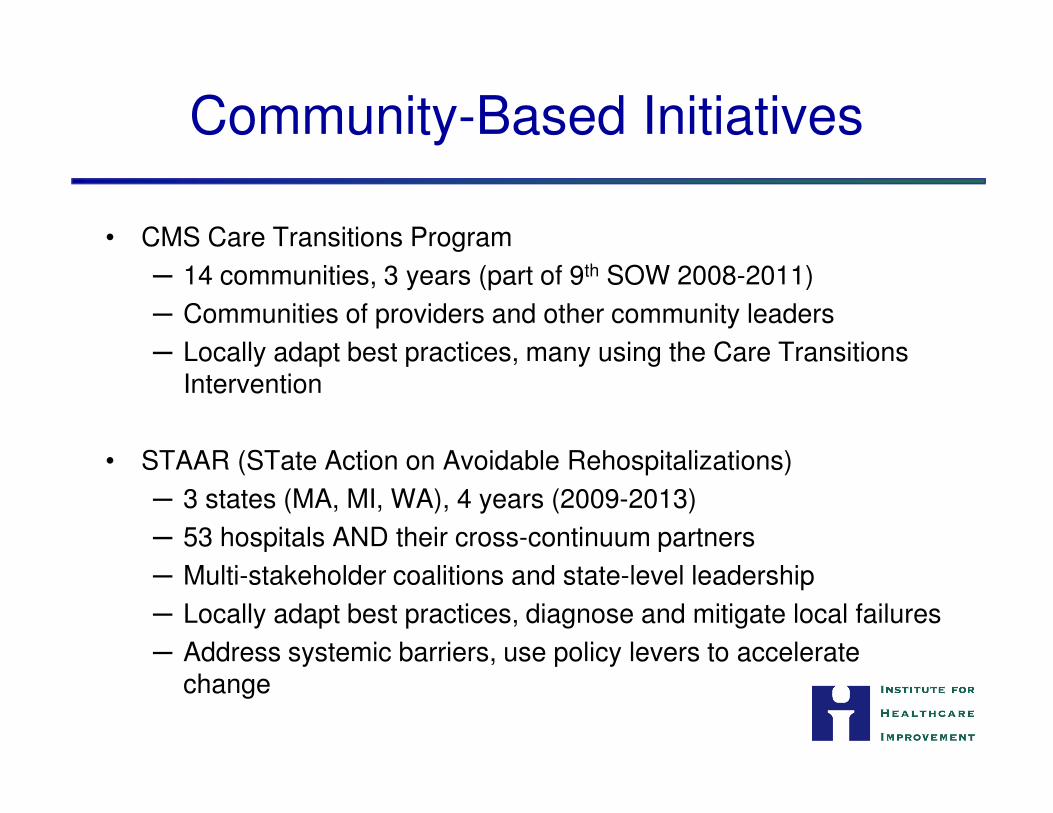
Community-Based Initiatives
• CMS Care Transitions Program
─ 14 communities, 3 years (part of 9th SOW 2008-2011)
─ Communities of providers and other community leaders
─ Locally adapt best practices, many using the Care Transitions Intervention
• STAAR (STate Action on Avoidable Rehospitalizations)
─ 3 states (MA, MI, WA), 4 years (2009-2013)
─ 53 hospitals AND their cross-continuum partners
─ Multi-stakeholder coalitions and state-level leadership
─ Locally adapt best practices, diagnose and mitigate local failures
─ Address systemic barriers, use policy levers to accelerate change
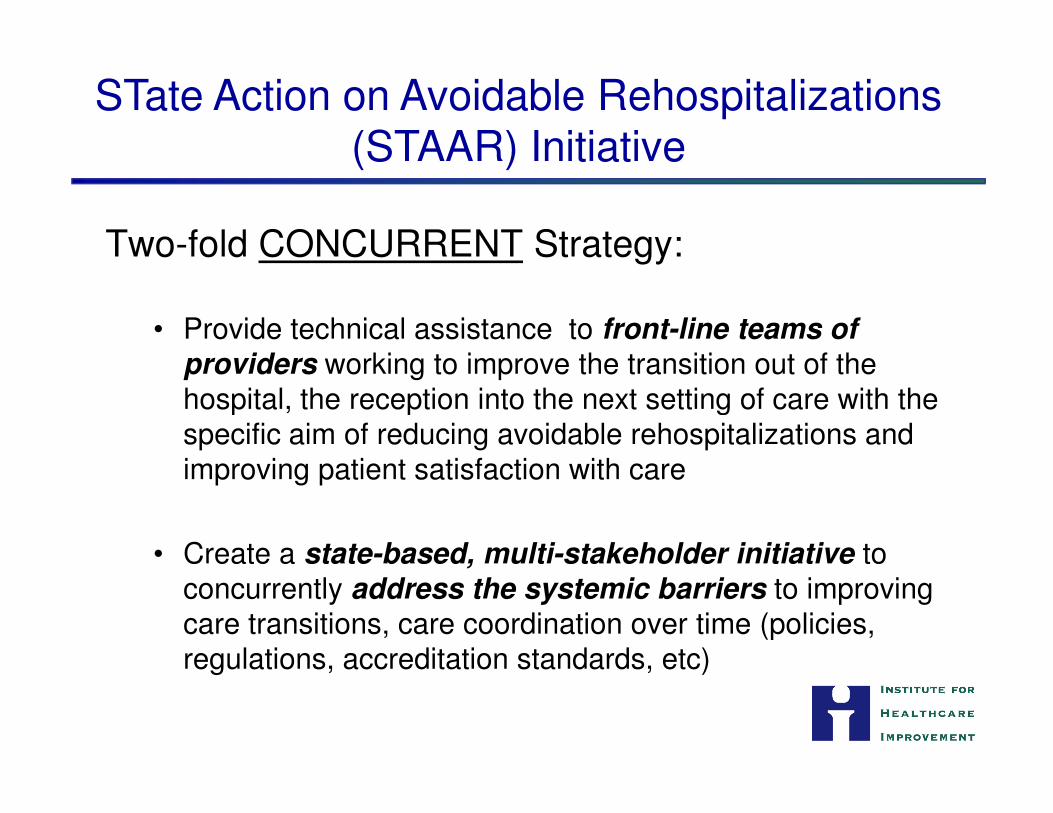
Two-fold CONCURRENT Strategy:
• Provide technical assistance to front-line teams of providers working to improve the transition out of the hospital, the reception into the next setting of care with the
STate Action on Avoidable Rehospitalizations (STAAR) Initiative
hospital, the reception into the next setting of care with the specific aim of reducing avoidable rehospitalizations and improving patient satisfaction with care
• Create a state-based, multi-stakeholder initiative to concurrently address the systemic barriers to improving care transitions, care coordination over time (policies, regulations, accreditation standards, etc)

Proposed Role of Policy Levers to Accelerate ChangeAccelerate Change
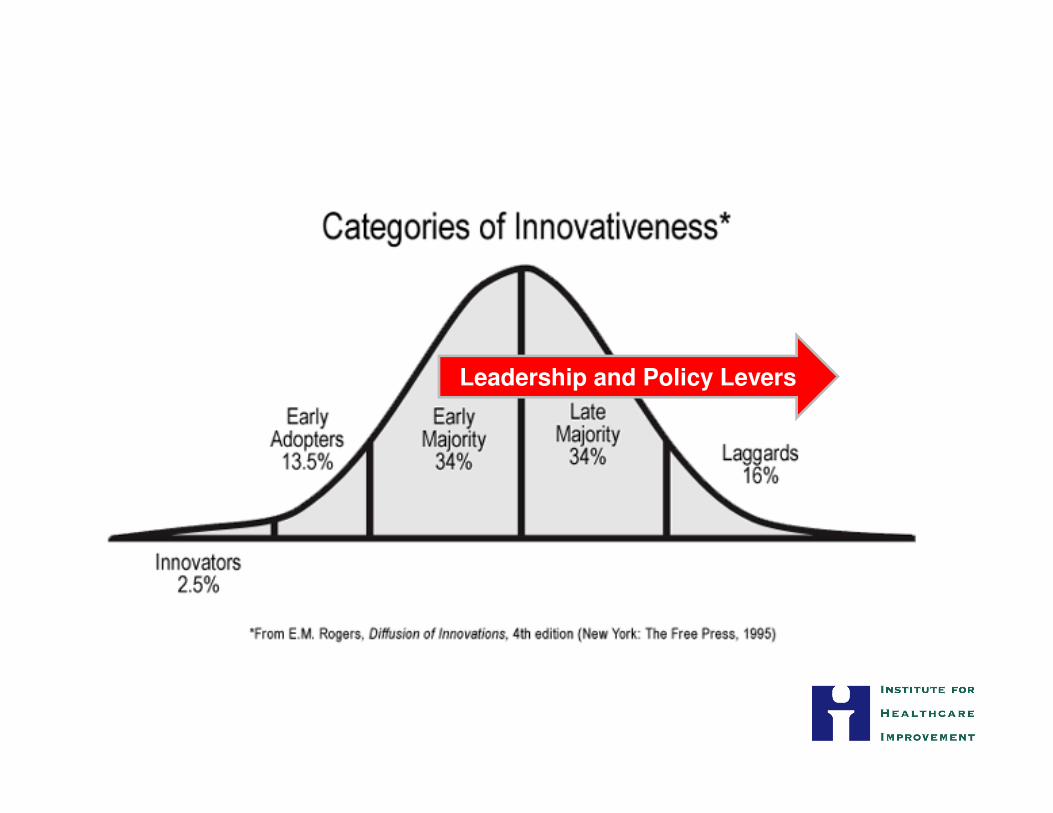
Leadership and Policy Levers
Systemic Barriers
Systemic Barriers
• Leadership attention among competing priorities
• State-level data and measurement
• Financial impact of reducing rehospitalizations
• Working as a community of providers toward • Working as a community of providers toward common goal
• Uncompensated time, effort (“payment reform”)
• Others?
State-Level Leadership Attention
• Why are rehospitalizations on / not on the state agenda?
─ Cost control imperatives, quality ambitions, media/PR attention?
• What is competing and what is complimentary?
─ Coordinate and leverage existing state and national ─ Coordinate and leverage existing state and national activities to reduce re-hospitalizations (e.g. CMWF SQI, NASHP State QI Partnerships, Advancing Excellence Campaign, INTERACT, Medical Home Demonstrations, AF4Q, QIO Care Transitions, ACC/IHI Hospital 2 Home, ACO demos)
• Identify and develop approaches and influence policy to remove systemic barriers to reducing re-hospitalizations
State-Level Data and Measurement Barriers
• Lack of uniform measurement strategy for rehospitalizations
─ Time interval (7, 14, 30 days)
─ Conditions of interest (selected conditions, service lines, all patients)
─ Conditions of interest causing readmission (clinically related or all-cause)
─ Exclusions (trauma, ob/newborn, discharge against medical advice)─ Exclusions (trauma, ob/newborn, discharge against medical advice)
• All provider discharge database limitations
─ Many lack unique patient identifiers
─ Lack of reliable fields to capture where patients are coming from (eg home, NH)
─ Do not capture outpatient services rendered (i.e. follow up visits)
• All payer claims database benefits
─ Can track utilization across continuum
Financial Impact of Reducing Readmissions
• Few hospitals have examined the financial implications of reducing readmissions- either in the current payment climate or in any number of future states.
• Understanding current reality will allow more informed • Understanding current reality will allow more informed examination of the impact of proposed payment reforms regarding readmissions and proactive engagement in shaping the transition to creating value across the continuum.
STAAR: Financial Analytic Roadmap
• Engage with a number of CFOs from hospitals around the US to:
– describe current financial impact of 30 day readmissions
– generalize the methods of those CFO analyses– generalize the methods of those CFO analyses
– create and test a roadmap for other hospitals
• This tool will accelerate hospitals’ ability to assess the current financial impact of readmissions.
Working as a Team Across Boundaries
• New competencies in partnering across boundaries
─ Power of “senders”, “receivers” and patients meeting together
─Moving past blame and finger-pointing
─ Establishing standard communication processes─ Establishing standard communication processes
─ Addressing shared health information
• Testing new organizational delivery models (e.g. ACOs)
Payment Reform
• Uncompensated coordination activities
• Uncompensated enhanced transition care services, such as coaching, advanced nurse coordination
• Transition strategies toward new models of accountability for outcomes accountability for outcomes
─ Reduced payment for early rehospitalization
─ Reduced payment for higher than expected overall rates
─ Bundled payment for hospitalization plus follow up services
─ Global payments over time and across settings
Competencies in data/working across boundaries/financial impact will all inform payment reform strategies.
Elements of the STAAR Initiative
• Hospital-level
- Improve the transition out of the hospital for all patients
- Measure and track 30-day readmission rates
- Understand the financial implications of reducing rehospitalizations
• Community-level
- Engage organizations across continuum to collaborate on improving care, address frustration between inpatient and post-acute providers, lack of IT address frustration between inpatient and post-acute providers, lack of IT connectivity, who “owns” coordination
- Ensure post-acute providers are able to detect and manage clinical changes, develop common communication and education tools
• State-level
- Develop state-level population based rehospitalization data
- Engage in payment reform discussions to enable better performance
- Link with efforts to expand coverage, engage patients, improve
HIT infrastructure, establish medical homes, contain costs, etc.
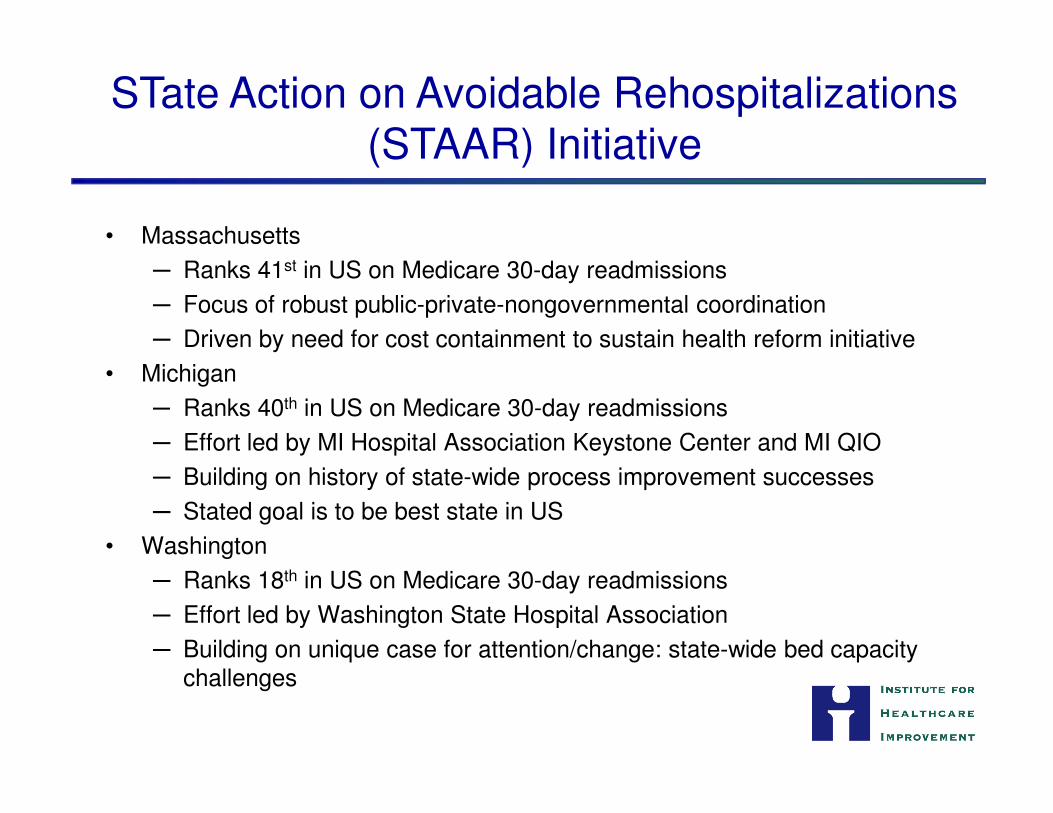
• Massachusetts
─ Ranks 41st in US on Medicare 30-day readmissions
─ Focus of robust public-private-nongovernmental coordination
─ Driven by need for cost containment to sustain health reform initiative
• Michigan
─ Ranks 40th in US on Medicare 30-day readmissions
STate Action on Avoidable Rehospitalizations (STAAR) Initiative
─ Ranks 40th in US on Medicare 30-day readmissions
─ Effort led by MI Hospital Association Keystone Center and MI QIO
─ Building on history of state-wide process improvement successes
─ Stated goal is to be best state in US
• Washington
─ Ranks 18th in US on Medicare 30-day readmissions
─ Effort led by Washington State Hospital Association
─ Building on unique case for attention/change: state-wide bed capacity challenges
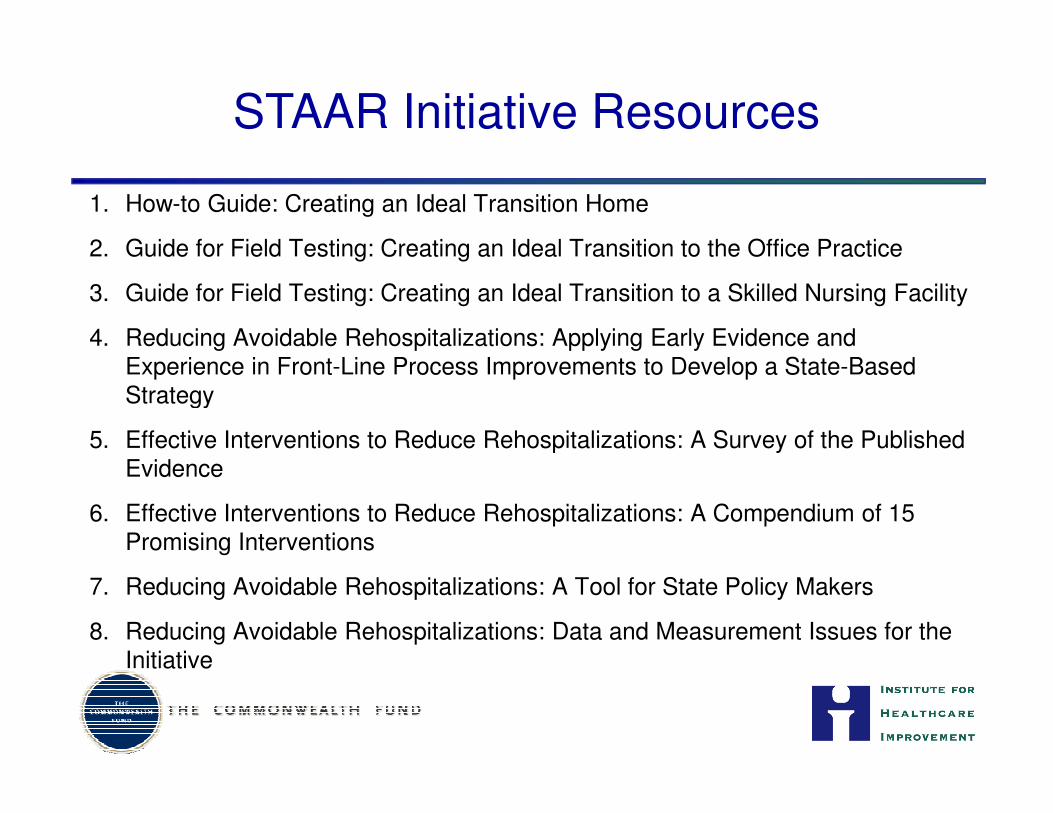
1. How-to Guide: Creating an Ideal Transition Home
2. Guide for Field Testing: Creating an Ideal Transition to the Office Practice
3. Guide for Field Testing: Creating an Ideal Transition to a Skilled Nursing Facility
4. Reducing Avoidable Rehospitalizations: Applying Early Evidence and Experience in Front-Line Process Improvements to Develop a State-Based Strategy
STAAR Initiative Resources
Strategy
5. Effective Interventions to Reduce Rehospitalizations: A Survey of the Published Evidence
6. Effective Interventions to Reduce Rehospitalizations: A Compendium of 15 Promising Interventions
7. Reducing Avoidable Rehospitalizations: A Tool for State Policy Makers
8. Reducing Avoidable Rehospitalizations: Data and Measurement Issues for the Initiative
Amy E. Boutwell, MD, MPP ([email protected])
Pat Rutherford, RN, MS ([email protected])
Co-Principal Investigators, STAAR Initiative
Institute for Healthcare Improvement