Embed Size (px)
Citation preview

Research ArticleDecrypting the Molecular Mechanistic Pathways Delineating theChemotherapeutic Potential of Ruthenium-Phloretin Complex inColon Carcinoma Correlated with the Oxidative Status andIncreased Apoptotic Events
Guoguo Jin ,1 Zhenjiang Zhao ,2 Tania Chakraborty ,3 Aikyadeep Mandal ,3
Arka Roy ,3 Souvik Roy ,3 and Zhiping Guo 4
1Laboratory of Bone Tumor, The Henan Luoyang Orthopedic Hospital, Zhengzhou, Henan 450000, China2Department of Radiology, The Henan Luoyang Orthopedic Hospital, Zhengzhou, Henan 450000, China3Department of Pharmacy, NSHM Knowledge Campus-Kolkata, 124 B.L., Saha Road, Kolkata, 700053 West Bengal, India4Department of Orthopeadic Surgery, The Henan Luoyang Orthopedic Hospital, Zhengzhou, Henan 450000, China
Correspondence should be addressed to Souvik Roy; [email protected] and Zhiping Guo; [email protected]
Received 21 January 2020; Revised 17 March 2020; Accepted 6 April 2020; Published 31 May 2020
Academic Editor: Juan Gambini
Copyright © 2020 Guoguo Jin et al. This is an open access article distributed under the Creative Commons Attribution License,which permits unrestricted use, distribution, and reproduction in any medium, provided the original work is properly cited.
To explore fresh strategies in colorectal cancer (CRC) chemotherapy, we evaluated the capability of the ruthenium-phloretincomplex in exterminating colon cancer by effectively addressing multiple apoptotic mechanisms on HT-29 cancer cells togetherwith an animal model of colorectal cancer activated by 1,2-dimethylhydrazine and dextran sulfate sodium. Our currentapproach offers tangible evidence of the application of the ruthenium-phloretin complex in future chemotherapy. The complextriggers intrinsic apoptosis triggered by p53 and modulates the Akt/mTOR pathway along with other inflammatory biomarkers.The ruthenium-phloretin complex has been synthesized and successfully characterized by numerous spectroscopicmethodologies accompanied by DPPH, FRAP, and ABTS assays assessing its antioxidant potential. Studies conducted in humancell lines revealed that the complex improved levels of p53 and caspase-3 while diminishing the activities of VEGF and mTOR,triggers apoptosis, and induces fragmentation of DNA in the HT-29 cells. Toxicity studies were conducted to identify thetherapeutic doses of the novel complex in animal models. The outcomes of the in vivo report suggest that the complex wasbeneficial in repressing multiplicity of aberrant crypt foci as well as hyperplastic lesions and also promoted increased levels ofCAT, SOD, and glutathione. In addition, the ruthenium-phloretin complex was able to control cell proliferation and boostedapoptotic outbursts in cancer cells associated with the increase in cellular response towards Bax while diminishing responsestowards Bcl-2, NF-κB, and MMP-9. Our observations from the experiments deliver testament that the ruthenium-phloretincomplex has the potential to act as a promising chemotherapeutic agent in colorectal cancer because it can affect the growth ofACF and hyperplastic abrasions in the colon tissues by evoking cell death.
1. Introduction
Colorectal cancer (CRC) is the second most common cancerin the world, accounting for 8.5% of all deaths due to cancer[1]. Nations such as the Republic of Korea, Singapore, thePhilippines, Thailand, China, and India have seen a steadyincrease in colorectal cancer prevalence in the recent past.The sharp increase in colorectal cancer incidences across
the developing countries of pan-Asia could have been dueto the spurt of economic development including a transfor-mation of ecology and lifestyle [2]. Throughout China, therise in the annual rate of colon cancer and mortality has gonefrom 14.25 per 100,000 in 1990 to 25.27 per 100,000 in 2016[3]. The annual colon cancer incidence rates (AARs) in Indiain 2017 is about 4.4 per 100,000 males and 3.9 per 100,000females [4]. Contrary to the lower prevalence of CRC, the
HindawiOxidative Medicine and Cellular LongevityVolume 2020, Article ID 7690845, 24 pageshttps://doi.org/10.1155/2020/7690845

5-year rate of survival remains extremely poor, shockinglyalso for localized cases, creating the impression of a substan-tial shortage in adequate intervention and diagnosis [5].Although there are several alternatives available for treatingthis disease, such as surgery, chemotherapy, radiation ther-apy, and immunotherapy, recovery rates are not all thatencouraging [6]. Chemotherapy still remains to be the pre-dominant therapeutic alternative for CRC, and successfulapproaches substantially prolong the longevity and ensurewell-being of patients in CRC [7]. However, frighteningadverse effects and drug resistance limit the implementationof extended chemotherapy in CRC.
Around 1978, cisplatin (a platinum derivative) led every-one to a revolutionary era of cancer therapy, culminating inthe application of platinum-based chemotherapy for a con-siderable patient population [8]. Nevertheless, typical reper-cussions of platinum-based chemotherapy include nausea,vomiting, gastrointestinal discomfort, and reduced bloodlevels. Multidrug resistance (MDR) is another crucial aspectfor the failure of platinum-based chemotherapy resultingfrom cross-resistance to many other nonrelated agents struc-turally, chemically, and functionally [9]. These dramatictimes call for an effective drug with enhanced cellular con-centration at safe doses for the complete eradication of carci-nogenic cells. Several other metal-based drugs often do notdeteriorate rapidly in vivo as compared to platinum drugs,which are absolutely essential for the transmission of thedrugs to effective regions in order to combat the diseaseand fight toxicity [10]. Lately, ruthenium (Ru) has stimulatedour expectations, in metal-based therapies, owing to itsassorted oxidative stages (II, III, and IV); improved consis-tency, specificity, oxidation, and reduction potential; DNAintercalation; ligand exchange kinetics; and iron mimickingbehavior [11]. Studies on derivatives centered around ruthe-nium have demonstrated very beneficial results in demon-strating the anticancer potential of the metal [12–15].NAMI-A is one of the forerunners of phase II chemotherapytrials focused on ruthenium (III)-based drugs [16]. Addi-tional compounds belonging to this category KP1019 [17]and NKP1339 (a sodium salt of KP1019) are also accreditedfor clinical use [18]. Interestingly certain studies point outthat metal-drug complexes are better suited to alternativechemotherapy than pure metals [19, 20].
The colorectal cancer-diet correlation is a well-documented one that has been established over the last 25years [21]. Various population-based research denotes thathigher fiber-rich foods/fruit consumption along with loweramounts of red meat, fat, and alcohol ingestion is alllinked to lower incidences of CRC [22, 23]. Apple is onesuch dietary source offering a plethora of antioxidants andanti-inflammatory agents. Among several polyphenols pres-ent in cross-resistance is phloretin [2′,4′,6′-trihydroxy-3-(4-hydroxyphenyl)-propiophenone], which has gained sub-stantial recognition as an antineoplastic agent [24]. Tanakaet al.’s research spearheaded the demonstration that phlore-tin was capable of preventing the neoplastic progression ofBalb/3T3 cells when subjected to a model tumor-inducingagent, 12-O-tetradecanoyl phorbol-13 acetate (TPA) [25].Ensuing findings have confirmed that phloretin possesses
activities triggering antioxidation, anti-inflammation, anti-proliferation, and apoptosis in vivo.
Additionally, phloretin was also able to prevent theprogression of xenograft tumors in nude mice when usedindependently or in conjunction with standard chemother-apy [26–29].
One of the most elementary detectable lesions in animalCRC prototypes is the aberrant crypt foci or ACF that is asso-ciated with the colon cancer progression [30]. Furtherresearch denoted that the profound presence of protein activ-ity such as proliferating cell nuclear antigen (PCNA) includ-ing the disinclination of apoptotic events, by an assortmentof metabolic paths, is frequently correlated with the diseaseprognosis [31]. In conjunction, uncontrolled expressions ofprotein such as p53, Bax (BcL-2 associated X protein), BcL-2 (B cell lymphoma 2), VEGF (vascular endothelial growthfactor), and mTOR (mammalian target of rapamycin) havebeen found to correspond with the development and growthof colon cancer [32–34]. Furthermore, the Akt/mTOR sig-naling axis plays a crucial role in the proliferation, resistanceto apoptosis, angiogenesis, and metastasis, and that isdirected to the development and prolongation of colorectalcancer [35]. Activation of Akt by phosphorylation at ser473and Thr308 activates several downstream targets includingmTOR [36]. Downregulation of mTOR signaling occurs inmany types of human tumors including colorectal carcinoma[35]. mTOR is associated with Raptor (mTORC1 complex)to phosphorylate to p70S6K, which further phosphorylates4E-BP1 that leads to increased cell proliferation [37]. mTORfurther associates with Rictor (mTORC2 complex) and func-tions in a feedback loop and promotes phosphorylates thatactivate Akt at ser473 [36]. A number of research studieshave demonstrated that apoptosis (programmed cell death)is a key procedure to destroy the tumor cells by chemothera-peutic agents [38]. And caspase gives rise to active signalingmolecules to propagate the apoptotic process. They are clas-sified by their mechanism of action which includes initiatorcaspases (caspase-8 and caspase-9) and executioner caspases(caspase-3, caspase-6, and caspase-7) [39]. Caspase-3, amajor effector caspase in apoptotic pathways, is an inactive32 kDa proenzyme. It further cleaves at an aspartate residueto yield a p12 and p17 subunit to form the active caspase-3enzyme (cleaved caspase-3) [40], which is responsible formorphological and biochemical changes in apoptosis [41].
A widely used compound to promote colorectal carcino-genesis in laboratory rodents is 1,2-dimethylhydrazine(DMH). Dextran sulfate sodium (DSS) is supplied to animalsin drinkable water besides DMH to synergize colitis forma-tion as DSS administration causing acute murine colitis com-parable to that of ulcerative colitis in humans. As far as we areaware, the ruthenium-phloretin complex is a newfangledentity that is yet to be evaluated for its biological properties.We have synthesized and identified the complex of ruthe-nium and phloretin throughout this research and assessedits antioxidant interaction and DNA-binding capabilities.Furthermore, the current study explores the chemotherapeu-tic potential of this unique complex in a HT-29 cell line alongwith a known-documented prototype of DMH and DSS-mediated colon cancer.
2 Oxidative Medicine and Cellular Longevity

2. Materials and Methods
2.1. Chemicals, Reagents, and Antibodies. The chemicals,reagents, and antibodies are the following: phloretin andruthenium (III) chloride hydrate, DPPH, penicillin, TPTZ,ABTS, CT-DNA (calf thymus DNA), foetal bovine serum(FBS), sodium pyruvate, MTT, Annexin V, propidium iodide(PI) (procured from Sigma-Aldrich Chemical Co.), DMH(dimethylhydrazine), streptomycin, DSS (dextran sodiumsulfate), insulin, L-glutamine, streptavidin peroxidase, 3,3′-diaminobenzidine (DAB), and proteinase K. Antibodiesspecific for p53, PCNA, pro- and active caspase-3, Akt1,phospho Akt, mTOR, phospho mTOR, and VEGF (627501)were acquired from BioLegend (San Diego, CA, USA).Anti-rat antibody for Bcl-2, Bax, beta catenin, NF-κB, andgoat anti-rabbit IgG secondary antibody were bought fromGenetex, Inc. (Irvine, CA, USA). An immunohistochemistrykit was acquired from Biovision, Inc. (Milpitas, CA, USA),and an apoptosis detection kit was purchased from TakaraBio Inc. (Shiga, Japan).
2.2. Synthesis of Ruthenium-Phloretin Complex. 6.4 g(18.6mmol) of phloretin was added to 100ml of methanolwhile stirring continuously, and the solution was poureddropwise to 2.48 g (9.2mmol) of ruthenium chloride dis-solved in 50ml of methanol. The solution was stirred contin-uously for 48 hours by the help of a magnetic stirrer, and aftermixing, the reaction mixture was dried in a vacuum using sil-ica gel beads. The dark green colored ruthenium-phloretincomplex has been obtained, which was found to be solublein methanol and dimethyl sulfoxide (DMSO).
2.3. Characterization of Ruthenium-Phloretin Complex.Recording of infrared spectra using FT-IR spectroscopy(ALPHA-T, Bruker, Rheinstetten, Germany) in the range400-4000 cm-1 confirmed the structure of the complex. AUV spectrophotometer (UV-1800 Shimadzu) was used toobserve the UV-visible spectroscopy of both complex andfree phloretin. Electron Ionization TandemMass Spectrome-try (ESI-MS) technique was used to register the mass spec-trometry of the complex, and 1H NMR was conductedusing a Bruker-Avance-500MHz. X’Pert Pro XRD (PANaly-tical) was used to analyze the diffractogram by X-ray study ofnewly formed compound. Eventually, a scanning-orientedelectron microscope (JEOL MAKE, UK, JSM6360) was usedto capture the morphological structure of the complex at var-ious magnifications.
2.4. In Vitro Antioxidant Properties. FRAP, DPPH, andABTS method were utilized to discover the in vitro antioxi-dant properties of the ruthenium-phloretin complex. Thereduction of Fe3+ ions by the ruthenium-phloretin complexwas observed as per Benzie and Strain’s method [42]. Theprocess identified by Dolatabadi et al. was followed to deter-mine the DPPH reducing capacity of the complex [43]. Theradical scavenging activity percentage was measured as
RSA% = 100 Ac − Asð ÞAc
, ð1Þ
where Ac denotes absorbance of DPPH and As denotes theabsorbance of the complex at 517nm. The method of Penny-cooke et al. was used to determine the radical scavengingactivity of the complex [44]. The following formula has beenused to calculate radical scavenging behavior (RSA):
RSA% =1 − Af
A0× 100, ð2Þ
where the absorbance A0 is that of the unrestrained radicalcation and Af is the absorbance noted 10-12 minutes afterthe sample addition.
2.5. DNA Binding Study. Intercalation of CT-DNA with thecompound was determined using a UV-visible spectropho-tometer (UV-1800 Shimadzu), based on the method reportedby Dehghan et al. [45]. The intrinsic binding constant wascalculated as
DNAεa − εf
= DNAεb − εf
+ 1Kb εb − εfð Þ , ð3Þ
where DNA represents the number of base pairing of DNA,εa represents the extinction coefficient (Aobs/Ru) factor, εfis the free drug-related extinction coefficient, and εb repre-sents bound drug-associated extinction coefficient, and thecomplex-associated calibration curve is derived from εf inthe aqueous solution. εa represents the ratio of recordedabsorbance to concentration of the complex by Beer’s law.
2.6. In Vitro Study
2.6.1. Cell Culture. The HT-29 cell line for human colon ade-nocarcinoma was collected from the National Center for CellScience (Pune, India). The obtained cells were cultured andmaintained in Dulbecco’s modified Eagle’s medium aug-mented with 10% FBS and antibiotics at 5% CO2, 95% air,and 37°C.
2.6.2. Cytotoxicity Assay. A 96-well plate was taken, and200μl of cell suspension was seeded in each well at approxi-mately 20,000 cells per well. After being incubated for 24hours, each plate was treated with different concentrations(12.5, 25, 50, 100, and 200μM) of the Ru-phloretin com-plex. Then, the cells were allowed to grow for 12/24 hoursat 37°C fortified with a 5% CO2 atmosphere and a completegrowth medium. Each well was supplemented with an MTTreagent (0.5mg/ml), and the plates were finally incubated at37°C for 3 hours. Lastly, the MTT reagent was tossed outand 100μl of DMSO was supplemented to each plate. TheELISA plate reader was employed to record the absorbanceof individual wells at 570 nm and 630 nm wavelengths. Thefollowing equation has been used to calculate the cell viabil-ity:
% viability = 100 −% of cytotoxicity: ð4Þ
2.6.3. Oligonucleosomal Fragmentation. Six-well plates wereseeded with HT-29 cells and incubated for 12 hours. The
3Oxidative Medicine and Cellular Longevity

following day, 36.56, 73.13, and 109.69μM concentrations ofRu-phloretin complex were added to the cells and incubatedfor 24 hours. The cells were finally collected and fixed inparaformaldehyde (4%) followed by treatment with 0.25%Triton X-100 in TBS meant for 15min at room temperature.Each well was exposed to 50μl DAPI (4mg/ml) for 30minutes, to be stained. Finally, cells were washed in PBSand stored in darkness at 4°C before being observed by a fluo-rescence microscope [46].
2.6.4. Detection of Apoptosis by Flow Cytometry. Apoptoticand necrotic cells were detected with an Annexin V-FITCApoptosis Detection Kit (Sigma Aldrich) as per the instruc-tions of the user manual. 36.56, 73.13, and 109.69μM of theRu-phloretin complex were used to treat the HT-29 cellsfor 24 hours, before being rinsed with PBS. Finally, cells werestained with Annexin V conjugated-FITC and propidiumiodide and stored in the dark for 15 minutes. A flow cyt-ometer coupled with Cell Quest software was used for thedetection of apoptotic cells.
2.6.5. Cell Cycle Analysis. Different concentrations of the Ru-phloretin complex (36.56, 73.13, and 109.69μM) were usedto treat precultured HT-29 cells for 24 hours. 70% cold aque-ous ethanol (v/v) (2ml) was used for fixing the cells after thetreatment. Then, the cells were centrifuged and rinsed withcold PBS thrice and resuspended in 0.5ml PBS. 50μM ofRNase A (1mg/ml in PBS) was added to a 0.5ml cell sampleand incubated for 30 minutes at 37°C. After 5 minutes of gen-tle stirring at 37°C in the darkness, 50μM of PI was furtherapplied. A BD FACSCalibur cytometer (Becton Dickinson,Heidelberg, Germany) was used analyze the resuspendedcells. 10,000 cells were analyzed per group. The DNA con-tents were presented with a histogram, and the data assimi-lated was analyzed with the help of software (ModFit LT 3.2).
2.6.6. SDS-PAGE and Western Blotting. The protein expres-sion levels of VEGF, caspase-3, cleaved caspase-3, Akt, phos-pho Akt, mTOR, phospho mTOR, and p53 were determinedwith the help of Western blotting techniques. The cells werecollected by trypsinization post treatment with various con-centrations of the Ru-phloretin complex. The collected cellswere lysed with 50μl NP40 lysis buffer in ice-cold conditionfor 1 hour. The cell lysates were centrifuged at 12,000 rpm for10 minutes at 4°C, and the supernatant was collected. Proteinestimation was done by conducting a Bradford assay accord-ing to the manufacturer’s protocol. An equivalent amount ofSDS-loading dye was added to the normalized proteins, andthe mixture was boiled for 15min. Twenty micrograms ofprotein from each sample was loaded, run on a 10% SDS-PAGE gel, and transferred to 0.25μm PVDF membranes(Millipore, Bedford, MA, USA). After blocking membranesin 5% nonfat milk in Tris-buffered saline with 0.1% Tween-20 (TBST) for 1 hour at room temperature, the membraneswere washed (3x in TBST for 5min) and incubated with spe-cific primary antibody (antibody dilution according to theproduct data sheet) at 4°C overnight. The membranes werewashed and incubated with HRP-conjugated secondary anti-body at a dilution of 1 : 2000 for 1 hour at room temperature.
The chemiluminescence of the membrane was measured byan ECL chemiluminescence detection reagent to developthe bands, and the images were captured using ImageJ soft-ware [47]. Beta actin was used as a loading control.
2.7. In Vivo Study
2.7.1. Experimental Animals and Maintenance. Balb/c mice(25-30 grams), containing animals of both sexes, were usedfor toxicity study, and for carcinogenicity study, male Wistarrats (80-120 grams) were used. All animals were purchasedfrom Indian IICB, Kolkata, India. Animals were exposed toa light/dark period of 12 hours, with humidity at approxi-mately 50 to 58 per cent and a temperature at 22°C. Theywere housed in polypropylene cages and given modified pel-let diets [48] along with clean drinking water. Animals wereaccustomed under the above conditions for 10 days prior tothe beginning of experiments. The IAEC (Institutional Ani-mal Ethical Committee), which supervised and controlledthe experiments (CPCSEA Regn. No. 1458/PO/a/11/CPC-SEA), guidelines were strictly adhered to while performinganimal experiments and for their care. All experimental workon animals were approved by the IAEC (Ref number:HCG/Pharmacol/2019/05), NSHM College of Pharmaceuti-cal Technology.
2.7.2. Acute Toxicity Study. Acute toxicity studies determinedthe LD50 of the Ru-phloretin complex as per the OECDguidelines for assessment of novel compounds, TG 420(adopted: December 2001). Five groups of six Balb/c mice(three of each sex) were divided into control and test groups.Test groups were administered with 2000, 600, 400, and200mg/kg body weight of the complex suspended in doubledistilled water with CMC, through gastric intubation. Con-trol groups were provided with only 0.5% CMC solution. Fol-lowing drug administration, the subjects were given freeaccess to regular food and water while signs of toxicity andmortality were observed for the following three days.
2.7.3. Subacute Toxicity Study. The OECD recommendationswere adhered to while performing the 28-day repeated dosetoxicity study (oral) in mice (1995; No. 407). The controland test groups (doses 25mg/kg, 50mg/kg, 100mg/kg, and300mg/kg of Ru-phloretin complex) were divided into fivegroups of thirty Balb/c mice, comprising six animals in eachgroup (three per sex). Animals were provided with oraltreatments daily for 28 consecutive days and finally sacri-ficed on the 29th day with anesthetic ether vapors > 4:5%in 100% oxygen until the absence of respiration was observedfor greater than 1 minute. After euthanasia, the organs likethe kidney, liver, stomach, and testis were extracted forfurther studies.
(1) Hematological and Serum Biochemical Analysis. Bloodsamples obtained from the retroorbital plexus of animalswere used for determining various hematological parametersand further analyzed by Medonic CA-620 cell analyzer sys-tems (Boule Medical, Stock-Holm, Sweden). Biochemicalparameters were also analyzed from the blood samples gath-ered from experimental animals after the serum was
4 Oxidative Medicine and Cellular Longevity

removed by centrifuging at 3000 rpm for 10 minutes. Anautomatic biochemistry analyzer/Pentra C400 (Horiba Med-ical, Kyoto, Japan) was used for the analysis of biochemicalparameters [49].
(2) Histopathological Analysis. Important organs extractedfrom the animals on completion of the 28-day toxicity studywere washed in alcohol and fixed in paraffin blocks. Theseblocks were dissected into 5μm thickness to be placed onthe slides. Before staining the tissues with hematoxylin andeosin (H&E), they were deparaffinized and rehydrated. Pre-pared slides were visualized under a microscope for analysis.
2.7.4. Experimental Design of Carcinogenicity Study. 35 maleWistar rats (80-120 gm) were taken and randomly dividedinto seven groups (5 rats per group). The animals in groupI were administered a pseudotoxic dose of carboxymethylcellulose (0.5%) by oral gavages, after 10 days of acclimatiza-tion whereas DMH at the dosage of 30mg/kg body weightwas provided to the rest of the animals via a single intraper-itoneal injection. DSS (2%) was supplied in portable watercommencing on the seventh from the day of injection andmaintained for a week [50]. The experimental layout isdenoted as the following:
Group I animals receiving neither carcinogen nortreatment (normal control).
Group II animals receiving only DMH+DSS (positivecontrol).
Group III animals receiving DMH+DSS and accompa-nied by 50mg/kg body weight treatment withthe Ru-phloretin complex (test group).
Group IV animals receiving DMH+DSS and accompa-nied by 100mg/kg body weight treatmentwith the Ru-phloretin complex (test group).
Group V animals receiving DMH+DSS and accompa-nied by 200mg/kg body weight treatmentwith the Ru-phloretin complex (test group).
Group VI animals receiving DMH+DSS and accompa-nied by 100mg/kg body weight treatment ofruthenium (test group).
Group VII animals receiving DMH+DSS and accompa-nied by 100mg/kg body weight treatment ofphloretin (test group).
The animals were sacrificed following 20 weeks of treat-ment under ether anesthesia for analysis.
(1) ACF Counting. A portion of colon tissue was sliced openand placed evenly on filter paper with the lumen exposed.Samples were fixed on slides with the help of 10% bufferedformalin; after 12 hours, the samples were stained with0.2% methylene blue prepared in PBS and examinedthrough a microscope (4x magnification). ACFs could bedistinctively characterized by their microscopically pro-nounced slit openings with a dense epithelial casing and
profound stain. ACF has been reported as the sum totalof occurrences per 5 cm2 [51].
(2) Histopathological Analysis of Colon. Ten random animalswere selected from individual collections, and their colon wasremoved. Before placing on the slides, the tissues were sys-tematically processed and cut into 5μm thickness. Hematox-ylin and eosin (H&E) were used to stain the tissues beforefurther analysis.
(3) Antioxidant Activity of Colon Tissues. Collected colontissues were compressed and homogenized (10% w/v) in0.1M phosphate buffer (pH 7.0). The homogenized mixturewas centrifuged for 10 minutes to evaluate the antioxidantactivity. The procedure of Jagatheesh et al. was employedto obtain the activity of the supernatant [52]. Catalaseactivity was carried out in the method illustrated by Sinhaand his colleagues [53]. A superoxide dismutase assay wasconducted with the technique developed by Awasthi et al.[54]. GPx activity was assessed using the Rotruck et al.method [55].
(4) Immunohistochemical Analysis. The obtained colon tis-sues were preserved in formalin and fixed in paraffin. The tis-sues were further cut to a thickness of 5μm and mounted onglass slides and then deparaffinized and immersed in H2O2.In the next step, tissues were exposed to treatment with goatserum and subsequently exposed to anti-rat Bcl-2, NF-κΒ,Bax, and MMP-9 antibodies (1 : 200) and kept at 4°C forthe next 12 hours. The slides were finally rinsed with PBSand exposed to biotinylated HRP-conjugated secondary anti-body for 30 minutes. The streptavidin biotin HRP complex-treated slides were further treated with DAB chromogenand stained with hematoxylin. The labeling index wasexpressed as the fraction of stained cells by the total numberof cells counted [56].
(5) Cell Proliferating Assay. Deparaffinized and rehydratedwith graded alcohol, sections of poly-L-lysine-coated tissuewere submerged in H2O2 (3%) accompanied by 1-hour goatserum incubation. Tissue segments were rinsed in PBS andincubated overnight at 4°C with anti-rat PCNA antibody.Tissues had been stained with DAB as chromogen withhematoxylin as counterstain [57].
(6) Apoptosis Assay by Tunnel Method. An apoptosis assaywas conducted by the using the In Situ Apoptosis DetectionKit by Takara Bio Inc. (MK500) as per the manufacturer’sprotocol, developed with DAB as chromogen and methylgreen (Loba Chemie Pvt. Ltd.) as counterstain. The sectionswere cleaned, desiccated, and mounted. Identification of apo-ptotic cells was done by observing the reddish brown-stainednuclei [57].
(7) Determination of Labeling and Apoptotic Index. The ratioof the percentage of PCNA-stained nuclei to the overall num-ber of cells gave the labeling index (LI). The apoptotic index(AI) has been determined as the % of stained cells by the totalcells observed.
5Oxidative Medicine and Cellular Longevity

2.8. Statistical Analysis. Data were reported as the mean ±standard errormean ðSEMÞ. Statistical testing was conductedusing t-test along with ANOVA assisted by GraphPad Prism,accompanied by Dunnet’s t-test; the alterations were evalu-ated as statistically relevant at p < 0:05.
3. Results
3.1. Instrumental Analysis. UV-visible spectroscopy did notshow any significant changes in the absorption spectra ofphloretin and ruthenium-phloretin complex. The ruthenium-phloretin complex slightly showed charge transfer transitions.Both phloretin and complex showed strong absorption bandsat 280430 nm (Figure 1(b)). The ruthenium-phloretin com-plex exhibited only charge transfer transitions, from theligand (RIF) to the metal. Therefore, no d-d transitions areexpected for Ru (III) complexes. The ruthenium-phloretincomplex and free phloretin FTIR spectra were documentedto establish the coordinating sites and binding characteristicsof the complex as shown in Figure 1(c) and assessed inTable 1.The v(O-H) broad bands appeared at 3221.01 cm-1
and 3215.23 cm-1 in the IR spectrum of phloretin andruthenium-phloretin complex showing the presence of watermolecules. The v(C=C) stretching occurred at 1571.75 cm-1
for the complex. The v(C=O) stretching occurred at1384.23 cm-1 and 1248 cm-1 for phloretin whereas for thecomplex, it is seen at 1377.28 cm-1 and 1240.53 cm-1 corre-spondingly. The v(COH) bond shifted from 980.13 cm-1 to972.67 cm-1 for the ruthenium-phloretin complex. The char-acteristic band for the ruthenium-phloretin complex wasseen at 614.22 cm-1 which was absent in free phloretin. Theseresults indicate that maybe the OH group present in phlore-tin can coordinate with ruthenium to form a coordinationcomplex. Table 2 shows the chemical transition of 1H NMRspectrum of the complex and the unbound ligand. The obser-vations reveal the omission of 3-OH and 9-OH protons in thespectra of the complex, signifying that ruthenium confiscatestwo protons from the flavonoid phloretin upon complexa-tion, while the other protons were found to be slightly shiftedand are intramolecularly bonded (Figure 1(d)). The aboveevidence suggests that the chelation occurred via the 3-OHand 9-OH functional groups of the ligand. The mass spec-troscopy of the ruthenium-phloretin complex is shown inFigure 1(e); the base signal at m/z 275 was of free phloretinwhereas m/z 302 was of phloretin+two water molecules.The signal at m/z 487 was seen for one phloretin+rutheniumeach. The molecular peak for the ruthenium-phloretincomplex was seen at m/z 794 where two phloretin+oneruthenium+two water molecules coordinated to form thecomplex. The fragmentation is depicted in Figure 1(f).Figures 1(g)–1(i) exhibit the surface structural arrangementof the ruthenium-phloretin complex, evaluated by SEMwhich denotes crystalline in nature and asymmetrical shapeof the complex. The X-ray diffraction study of the complexindicates multiple distinctive sharp peaks which occurred atdifferent diffraction angles attributable to its recognizablecrystalline structure (Figure 1(j)).
3.2. Ruthenium-Phloretin Complex Scavenges DPPH, FRAP,and ABTS Radicals. Figure 2(a) displays the scavenging ofradicals by free phloretin and ruthenium-phloretin complex
by ABTS. It was observed that by varying the concentrationsof the complex, the absorption of activated ABTS at 734nmdropped significantly. The complex was able to scavenge freeradical more efficiently in the presence of ABTS as comparedto free phloretin. The antioxidant behavior of the ligand isconsiderably correlated with their molecular structure.
The complex’s strong antioxidant activity could be attrib-uted to the hydroxyl functional group and their capacity tocontribute hydrogen atoms which has been considerablyimproved after the complexation with ruthenium.
Figure 2(b) illustrated the scavenging of radicals byphloretin and ruthenium-phloretin complex, where the plotsuggested that phloretin scavenged free radical to about43% while the complex scavenged to about 79%. Thus, thecomplex represented better inhibitory effect compared tothe phloretin. These are mainly attributed to synergisticeffects of the ruthenium-phloretin complex. The radical-sensitive Ru-O bond was introduced to the ruthenium-phloretin complex, which collectively enhances the bioactiv-ities of both ruthenium and phloretin.
The availability of Fe+3-TPTZ was observed in the pres-ence of phloretin and ruthenium-phloretin complex at593 nm by altering the difference absorbance, for a 10mininteraction, of the complex and phloretin in the FRAP solu-tion. Declination in the absorbance was in proportion inaspect to the antioxidant range of the complex and the ligand.Figure 2(c) reaffirms that the complex possesses a greaterantioxidant power than free phloretin. These observationsdenote that the phloretin and ruthenium-phloretin complexcan donate protons and are capable of terminating a chainreaction. Moreover, metal chelation augments the transferof electrons from phloretin and hence improves the redoxpotential of the ruthenium-phloretin complex.
3.3. Ruthenium-Phloretin Complex Binds with CT-DNA. Theabsorption spectrum of the complexes in the presence of CT-DNA (5μΜ) is shown in Figure 2(d). Upon addition ofincreasing amounts of the complex to CT-DNA, a decreasein the absorption intensity (hypochromism) of the absorp-tion peak is observed. After increasing the concentration ofthe complex to the DNA, the intensity changes can be iden-tified within the intraligand transition band at 383 nm. Thesespectral characteristics reveal that the complex interactedwith DNA via stacking interaction between the chromophoreof the ligand through the intercalative mode and the basepairs of DNAs.
3.4. In Vitro Study
3.4.1. Inhibition of HT-29 Cell Proliferation by Ruthenium-Phloretin Complex. Figures 3(a) and 3(b) denote the effectof the ruthenium-phloretin complex on the growth of HT-29 cells assessed by MTT. The cell viability of the complexat 12.5, 25, 50, 100, and 200μM after 24 hours was foundto be 90.17%, 75.28%, 59.61%, 45.50%, and 22.95%, respec-tively. It can thus be assumed that the development of HT-29 cells decreased markedly in a dose-dependent manner fol-lowing ruthenium-phloretin complex treatment, with the
6 Oxidative Medicine and Cellular Longevity
HOOH
B
OOH
342
11′2′
3′
4′5′
6′OH
A
HO
65
OH OH
H
H
OHHOHO
O
Ru
O
OOO
H
HO
𝛼
𝛽
(a)
800
UV spectroscopy
600Wavelength
40020000
0.51
1.52
2.5
Abs
orpt
ion
33.5
44.5
5
PhloretinRu-phl complex
(b)
500
Phloretin-ruth complexphloretin
100015002000Wavenumber (cm–1)
2500
2583
.12
2360
.80
2359
.55
1880
.74
1608
.95
1607
.59
1571
.75
1570
.94
1520
.37
1518
.53
1477
.07
1473
.37
1435
.70
1384
.23
1377
.28
1294
.75
1294
.10
1248
.92
1240
.53
1204
.95
1202
.79
1161
.88
1160
.72
1074
.34
1071
.17
1017
.02
980.
1397
2.67
826.
2582
0.25
696.
2768
8.36
580.
1557
9.06
526.
04
2763
.75
2884
.63
3215
.23
3221
.01
3740
.85
30003500
50
60
70
80
90
Tran
smitt
ance
(%)
100
110
120
(c)
(d)
Figure 1: Continued.
7Oxidative Medicine and Cellular Longevity

1000
(%)
100
200 300
393.2965302.9601
301.1427
275.0965
413.2690 849.3206 587.1259663.4522
685.4369763.5149
685.4384 796.8340
796.8300
794.8323
487.3737
229.1429
150.1287
400 500 600 700 800 900 1000 1100m/z
(e)
(f)
200 𝜇m
(g)
100 𝜇m
(h)
50.0 𝜇m
(i)
Figure 1: Continued.
8 Oxidative Medicine and Cellular Longevity

highest inhibition at 77.05% after treatment with 200μM ofthe ruthenium-phloretin complex after 24 hours.
3.4.2. Ruthenium-Phloretin Complex Promotes Apoptosis ofHT-29 Cells. Treatment of HT-29 cells with 36.56, 73.13,and 109.69μM of the ruthenium-phloretin complex for 24hours evidently reduced the number of viable cells. As shownin Figure 3(c), the untreated control cells maintained theirunique shape and their nuclei were homogeneously stainedwith a dull blue color. Treated cells exhibited more intenseblue fluorescence as compared to the untreated cells. Thismore intense staining may be due to the presence of highlycondensed chromatin or because of cell cycle arrest.
To further confirm the apoptosis-inducing activity of theruthenium-phloretin complex, HT-29 cells were subjected toAnnexin V-FITC/PI staining with flow cytometry. The anal-ysis of the results revealed that the percentages of apoptoticcell are 22.68%, 57.06%, and 79.24% following treatment with36.56, 73.13, and 109.69μMof the complex (Figures 3(d) and3(e)). In addition, a dose-dependent improvement was alsoidentified in the areas of early apoptotic cells in 36.56,73.13, and 109.69μM of the complex-treated cells after 24hours (Figure 3(f)).
3.4.3. Ruthenium-Phloretin Complex Promotes Cell CycleArrest in HT-29 Cells. The inhibition of cell proliferationcould be the result of the inception of apoptosis that ismediated by cell cycle arrest. Therefore, the cell cycle dis-tribution in the HT-29 cells treated with the ruthenium-phloretin complex was further analyzed. A decreased per-
centage of cells in the G0/G1 phase together with a slightincrease in the S phase was observed to occur in a dose-dependent manner (Figures 3(g) and 3(h)), while the com-plex interrupts the cell cycle G2/M phase in a dose-dependent way. When exposed to 36.56, 73.13, and109.69μM of the complex after 24 hours, the cell populationof HT-29 cells in the G0/G1 phase was 59.64%, 58.54%, and54.98% at 24 hours (Figure 3(h)). As the number of cells inthe G0/G1 phase decreases with the increase of the drug con-centration, we can conclude that the complex arrests the cellcycle G0/G1 process in a dose-dependent way.
3.4.4. Ruthenium-Phloretin Complex Alters the Illustration ofp53, Caspase-3, Akt1, mTOR, and VEGF in HT-29 Cells. Toexplore the pattern of ruthenium-phloretin-induced apopto-sis of HT-29 cells, the expressions of various proteinsinvolved were evaluated using Western blotting. After 24-hour treatment with 36.56, 73.13, and 109.69μM of the com-pound, a concentration-dependent decline of Akt1, phosphoAkt, mTOR, phospho mTOR, and VEGF was recorded. Con-sequently, an increase in the p53 and pro- and active caspase-3 expressions was observed in HT-29 cells following complexadministration in a dose-dependent manner.
3.5. In Vivo Study
3.5.1. Toxicity Study
(1) Acute and Subacute Toxicity Study. The LD50 dose wasfound to be 400mg/kg of the ruthenium-phloretin complex.Following the LD50 dose assessment, 25, 50, 100, and300mg/kg were selected as the subacute toxic doses. Duringsubacute toxicity analysis (28 days), no treatment-relatedfatalities were reported in animals treated with 25, 50, 100,or 300mg/kg of the complex.
(2) Hematological and Serum Biochemical Analysis.Tables 3–6 show the hematological and serum biochemicalprofile of the treated and control groups. WBC and RBC
00
200
400
Complex 1
20 30 40 50Position (°2 Theta)
60 70 80
(j)
Figure 1: (a) Ruthenium-phloretin complex. (b) UV-visible spectrum of phloretin and ruthenium-phloretin compound. (c) FTIR spectra ofphloretin and ruthenium-phloretin complex. (d) NMR spectra of ruthenium-phloretin complex. (e) Mass spectroscopy of ruthenium-phloretin complex. (f) Fragmentation mechanism of the ruthenium-phloretin complex. SEM of the complex at (g) 200μm, (h) 100 μm,and (i) 50μm. (j) X-ray diffractogram of ruthenium-phloretin complex.
Table 1: FTIR spectrum of phloretin and ruthenium-phloretincomplex (band position cm-1).
Compound v(O-H) v(C=C) v(C-O) v(C-OH) v(M-O)
Phloretin 3221.01 1248.92 980.13
Ruthenium-phloretin
3215.23 1571.75 1240.53 972.67 614.22
9Oxidative Medicine and Cellular Longevity

amounts were significantly augmented in ruthenium-phloretin complex (300mg/kg)-treated groups contrastingwith control animals. At the completion of the 28-daysubacute toxicity test, ALT, AST, and ALP were signifi-cantly higher than the control group at 300mg/kg (p < 0:05).Glucose and BUN were also significantly (p < 0:05) alteredat 300mg/kg compound-treated animals. Therefore, the300mg/kg dose of the complex caused toxicity in the labora-
tory animals to some degree and was therefore not regardedas a dose for ensuing study.
(3) Histopathology. Histopathology of the kidney(Figure 4(a), A) of the control group exhibited a normalstructural architectural organization. The foremost morpho-logical variations were observed at the 300mg/kg dose(Figure 4(a), E). 25 and 50mg/kg doses did not denote any
Table 2: Chemical shift (δ (ppm)) of free phloretin and ruthenium-phloretin complex.
Compound 3-OH 5-OH 7-OH 2H-β 2H-α 9-OH 5-H 12-H 17-OH 15-H
Phloretin 9.18 12.30 10.56 2.86 3.20 3.41 5.80 3.26 7.02 6.69
Ruthenium-phloretin 12.26 10.40 2.83 3.21 5.81 3.23 7.01 6.67
00
1020304050
Radi
cal s
cave
ngin
g ac
tivity
(%)
60708090
20 40Concentration (𝜇M)
ABTS assay
60
PhloretinRutheniumRu-phl complex
(a)
00
1020304050
Radi
cal s
cave
ngin
g ac
tivity
(%)
60708090
2010 30Time (min)
DPPH assay
60
PhloretinRutheniumRu-phl complex
(b)
00
0.2
0.4
0.6
Ferr
ic re
duci
ng p
ower
(mm
ol F
e+2/
g)
0.8
1
20 40Concentration (𝜇M)
FRAP assay
60
PhloretinRutheniumRu-phl complex
(c)
60
0.00
0.20
0.40
0.60
Abso
rban
ce
0.80
1.00
400 500 600Wavelength (nm)
700
5 𝜇m complex5 𝜇m complex+CT-DNA10 𝜇m complex+CT-DNA15 𝜇m complex+CT-DNA20 𝜇m complex+CT-DNA25 𝜇m complex+CT-DNA30 𝜇m complex+CT-DNA40 𝜇m complex+CT-DNA50 𝜇m complex+CT-DNA
(d)
Figure 2: Assessment of antioxidant status: (a) antioxidant property of the ruthenium-phloretin complex by ABTS procedure, (b) DPPHmethod, (c) FRAP procedure, and (d) absorbance spectrum of CT-DNA in complexation with ruthenium-phloretin.
10 Oxidative Medicine and Cellular Longevity

50 100 150Conce in (𝜇M)
12 hours%
of c
ell v
iabi
lity
20000
102030405060708090
100
Cell viability
(a)
50 100 150Conce in (𝜇M)
24 hours
% o
f cel
l via
bilit
y
20000
102030405060708090
100
Cell viability
(b)
109.69 𝜇m73.13 𝜇m
36.56 𝜇mControl
(c)
100100
101
102PI
103
104
101 102
Annexin-V-FITC
97.2% 2.8%
Control0% 0%
77.32% 22.68%
36.56 𝜇m0% 0%HT-29 cell control
103 104 100100
101
102PI
103
104
101 102
Annexin-V-FITC
HT-29 NSHM 01 IC25
103 104
100100
101
102PI
103
104
101 102
Annexin-V-FITC
42.94% 57%
73.13 𝜇m0% 0.06%
20.49% 77.34%
109.69 𝜇m0.27% 1.9%HT-29 NSHM 01 IC50
103 104 100100
101
102PI
103
104
101 102
Annexin-V-FITC
HT-29 NSHM 01 IC25
103 104
(d)
Figure 3: Continued.
11Oxidative Medicine and Cellular Longevity

Control
2.8
22.68
57.06
79.24
0102030405060
Perc
enta
ge (%
)708090
36.56 73.13 109.69
(e)
Control 36.560 0 0.06 1.9
22.68
57
77.34
2.8
73.13 109.69
Conc in (𝜇m)
0102030405060
Perc
enta
ge (%
)
708090
Late apoptosisEarly apoptosis
(f)
1000800600Propidium iodide
400
G2/M
G0/G1
Sub G0/G1
HT-29 cell control
Control
S
20000
120
240
360
Cou
nts
480
600
1000800600Propidium iodide
400
G2/M
G0/G1
Sub G0/G1
HT-29 NSHM 01 IC25
36.56 𝜇m
S
20000
120
240
360C
ount
s
480
600
1000800600Propidium iodide
400
G2/M
G0/G1
Sub G0/G1
HT-29 NSHM 01 IC50
S
20000
120
240
360
Cou
nts
480
600
1000800600Propidium iodide
400
G2/M
G0/G1
Sub G0/G1
HT-29 NSHM 01 IC50
109.69 𝜇m73.13 𝜇m
S
20000
120
240
360
Cou
nts
480
600
(g)
Figure 3: Continued.
12 Oxidative Medicine and Cellular Longevity

major abnormalities in the animals (Figure 4(a), B and C),whereas minor thickening of Bowman’s capsule was detectedin the mice treated with doses of 100mg/kg complex(Figure 4(a), D). At 600mg/kg vacuolization (v), pyknoticnucleus (pn), cytoplasmic debris (cd), capsular membranethickening (tm), and sclerosis at nodes (n) were observed.The histopathology of the liver (Figure 4(b) , A) denotedstandard hepatic structures in the control group whereas
maximum doses (300mg/kg) of the ruthenium-phloretincomplex denoted focal inflammation (fi), degeneration ofhepatocytes (d), and periportal mononuclear infiltrates (pmi)(Figure 4(b), E). 25, 50, and 100mg/kg dose-administeredanimals did not exhibit any vital deformity (Figure 4(b), B–D). Figure 4(c) reveals the microscopic assessment of thestomach, where the 300mg/kg dose of the ruthenium-phloretin complex showed the congestion (c), hemorrhages
0Cell control
25
10.91 15.62 18.91 19.12
54.98
4.224.334.35
3.139.76
19.2 17.67 20.21
58.5459.6476.26
Conc in (𝜇M)
50
Gat
ed ce
ll cy
cle p
hase
(%) 75
100
36.56 73.13 109.69
G2/M G0/G1
Sub G0/G1S
(h)
Conc in (𝜇M)
Bata actin
Cleaved caspase 3
p53
mTOR
p-mTOR
Akt
p-Akt
Caspase 3
VEGF
Con
trol
36.5
6 um
73.1
3 um
109.
69 u
m
(i)
Figure 3: HT-29 cell viability of ruthenium-phloretin complex at (a) 12 hours and (b) 24 hours. (c) DAPI staining of colon carcinoma cellstreated with ruthenium-phloretin complex. (d) Flow cytometric analysis of HT-29 cells for detection of apoptotic events after treatment withruthenium-phloretin complex. (e) Proportion of apoptotic cells against concentration. (f) Percentage of apoptotic cells in early and lateapoptosis stages. (g) Cell cycle analysis of HT-29 cells following exposure to ruthenium-phloretin complex. (h) Various phases of cell cycleanalysis of HT-29 cells. (i) Analysis of Western blot to determine the expressions of p53, caspase-3, cleaved caspase-3, Akt, phospho Akt,VEGF, mTOR, and phospho mTOR in HT-29 cells.
Table 3: Hematological finding of male Balb/c mice for oral subacute toxicological analysis.
Parameters (±SEM) Control Ru-phl (300mg) Ru-phl (100mg) Ru-phl (50mg) Ru-phl (25mg)
Hemoglobin (%) 12:22 ± 0:013 13:16 ± 0:01 12:45 ± 0:02 12:04 ± 0:03 12:28 ± 0:0410Total RBC(106/μ) 4:26 ± 0:001 5:01 ± 0:002# 4:53 ± 0:001 4:31 ± 0:002 4:60 ± 0:001Platelet count (105/μ) 2:95 ± 0:001 4:25 ± 0:03 2:65 ± 0:004 2:58 ± 0:001 2:78 ± 0:002WBC (103/μ) 8:64 ± 0:02 13:11 ± 0:02# 11:53 ± 0:02 6:3 ± 0:04 3:26 ± 0:01MCV (fl) 87:96 ± 0:03 90:37 ± 0:02 84:30 ± 0:01 88:91 ± 0:03 87:14 ± 0:02MCH (pg) 27:48 ± 0:02 29:36 ± 0:05 27:03 ± 0:02 28:72 ± 0:01 28:07 ± 0:02MCHC (%) 32:58 ± 0:01 32:83 ± 0:01 31:03 ± 0:02 31:42 ± 0:01 31:76 ± 0:02Neutrophil (%) 27:88 ± 0:20 30:58 ± 0:01 24:37 ± 0:48 27:29 ± 0:33 26:79 ± 0:01Eosinophil (%) 2:15 ± 0:01 6:87 ± 0:01 6:43 ± 0:01 5:58 ± 0:06 1:42 ± 0:02Monocyte (%) 1:44 ± 0:05 1:58 ± 0:01 1:28 ± 0:02 1:86 ± 0:07 1:20 ± 0:03Basophil (%) 0:0 ± 0:0 0:0 ± 0:0 0:0 ± 0:0 0:0 ± 0:0 0:0 ± 0:0Standard error of the mean is calculated as the ratio of standard deviation (SD) to the square root of entire subjects. Results were analyzed by t-test and ANOVA(one-way), and it was established by Dunnett’s multiple comparison test. MCV:mean corpuscular volume;MCH:mean corpuscular hemoglobin; MCHC:meancorpuscular hemoglobin concentration; RBC: red blood cell; WBC: white blood cell. #Level of significance at p < 0:05, as compared to the control group.
13Oxidative Medicine and Cellular Longevity

(h), and hyperplasia of the gastric glandular zone (hyp)(Figure 4(c), E). But at the lower dose level (25mg/kg,50mg/kg, and 100mg/kg), histopathological variations
were not observed (Figure 4(c), B–D). Figure 4(d) revealsthe microscopic assessment of the testis, where 300mg/kg(Figure 4(d), E) of the ruthenium-phloretin complex-treated
Table 4: Hematological finding of female Balb/c mice for oral subacute toxicological analysis.
Parameters (±SEM) Control Ru-phl (300mg) Ru-phl (100mg) Ru-phl (50mg) Ru-phl (25mg)
Hemoglobin (%) 12:14 ± 0:022 13:16 ± 0:12 12:08 ± 0:04 12:34 ± 0:024 13:02 ± 0:15Total RBC (106/μ) 4:18 ± 0:05 5:06 ± 0:04# 4:50 ± 0:002 4:32 ± 0:004 4:60 ± 0:003Platelet count (105/μ) 2:95 ± 0:002 3:21 ± 0:005 2:63 ± 0:002 2:68 ± 0:002 2:88 ± 0:002WBC (10/μ) 8:62 ± 0:05 13:16 ± 0:02# 11:84 ± 0:02 5:37 ± 0:03 3:84 ± 0:02MCV (fl) 87:68 ± 0:02 90:28 ± 0:01 89:34 ± 0:05 88:96 ± 0:03 87:12 ± 0:23MCH (pg) 27:21 ± 0:17 30:08 ± 0:03 29:38 ± 0:03 28:69 ± 0:01 27:14 ± 0:26MCHC (%) 30:20 ± 0:044 31:64 ± 0:05 32:68 ± 0:05 30:26 ± 0:02 30:62 ± 0:03Neutrophil (%) 28:60 ± 0:14 32:24 ± 0:05 24:80 ± 0:20 26:80 ± 0:20 24:00 ± 0:31Eosinophil (%) 2:14 ± 0:09 1:20 ± 0:12 6:08 ± 0:04 5:08 ± 0:04 1:02 ± 0:02Monocyte (%) 1:02 ± 0:02 2:32 ± 0:09 1:00 ± 0:04 1:05 ± 0:06 2:00 ± 0:01Basophil (%) 0:0 ± 0:0 0:0 ± 0:0 0:0 ± 0:0 0:0 ± 0:0 0:0 ± 0:0Standard error of the mean is calculated as the ratio of standard deviation (SD) to the square root of entire subjects. Results were analyzed by t-test and ANOVA(one-way), and it was established by Dunnett’s multiple comparison test. MCV:mean corpuscular volume;MCH:mean corpuscular hemoglobin; MCHC:meancorpuscular hemoglobin concentration; RBC: red blood cell; WBC: white blood cell. #Level of significance at p < 0:05, as compared to the control group.
Table 5: Serum biochemical finding in male Balb/c mice for 28 days of repeated-dose oral subacute toxicity study.
Parameters (±SEM) Control Ru-phl (300mg) Ru-phl (100mg) Ru-phl (50mg) Ru-phl (25mg)
Aspartate aminotransferase (AST) 39:09 ± 0:11 50:11 ± 0:04# 40:02 ± 0:03 35:20 ± 0:05 30:05 ± 0:02Alanine aminotransferase (ALT) 31:23 ± 0:03 50:01 ± 0:01# 45:03 ± 0:02 37:15 ± 0:06 34:04 ± 0:05Alkaline phosphatase (ASP) 352:7 ± 0:12 495:3 ± 0:06# 365:2 ± 0:25 353:4 ± 0:16 221:4 ± 0:06Blood urea nitrogen (mg/dl) 18:01 ± 0:02 30:20 ± 0:04# 28:24 ± 0:09 18:35 ± 0:01 17:08 ± 0:02Creatinine (mg/dl) 0:61 ± 0:02 0:61 ± 0:001 0:61 ± 0:003 0:56 ± 0:01 0:57 ± 0:001Glucose (mg/dl) 115:7 ± 0:17 127:9 ± 0:11# 115:3 ± 0:23 110:5 ± 0:13 105:4 ± 0:05Cholesterol (mg/dl) 47:02 ± 0:04 50:04 ± 0:02 47:13 ± 0:09 43:12 ± 0:03 41:23 ± 0:02Standard error of the mean is calculated as the ratio of standard deviation (SD) to the square root of entire subjects. Results were analyzed by t-test and ANOVA(one-way), and it was established by Dunnett’s multiple comparison test. MCV:mean corpuscular volume;MCH:mean corpuscular hemoglobin; MCHC:meancorpuscular hemoglobin concentration; RBC: red blood cell; WBC: white blood cell. #Level of significance at p < 0:05, as compared to the control group.
Table 6: Serum biochemical finding in female Balb/c mice for 28 days of repeated-dose oral subacute toxicity study.
Parameter (±SEM) Control Ru-phl (300mg) Ru-phl (100mg) Ru-phl (50mg) Ru-phl (25mg)
Aspartate aminotransferase (AST) 31:24 ± 0:14 49:01 ± 0:01# 38:04 ± 0:05 33:13 ± 0:09 30:07 ± 0:03Alanine aminotransferase (ALT) 31:23 ± 0:09 49:23 ± 0:02# 43:57 ± 0:03 37:04 ± 0:06 32:06 ± 0:08Alkaline phosphatase (ASP) 352:4 ± 0:12 400:1 ± 0:34# 383:5 ± 0:23 310:7 ± 0:15 231:3 ± 0:09Blood urea nitrogen (mg/dl) 17:08 ± 0:05 30:21 ± 0:02# 27:78 ± 0:02 26:53 ± 0:04 20:07 ± 0:03Creatinine (mg/dl) 0:60 ± 0:004 0:60 ± 0:004 0:60 ± 0:002 0:54 ± 0:003 0:50 ± 0:002Glucose (mg/dl) 114:6 ± 0:28 126:1 ± 0:24# 119:5 ± 0:34 119:4 ± 0:30 126:1 ± 0:20Cholesterol (mg/dl) 46:07 ± 0:04 50:18 ± 0:05 46:03 ± 0:01 44:09 ± 0:06 42:03 ± 0:07Standard error of the mean is calculated as the ratio of standard deviation (SD) to the square root of entire subjects. Results were analyzed by t-test and ANOVA(one-way), and it was established by Dunnett’s multiple comparison test. MCV:mean corpuscular volume;MCH:mean corpuscular hemoglobin; MCHC:meancorpuscular hemoglobin concentration; RBC: red blood cell; WBC: white blood cell. #Level of significance at p < 0:05, as compared to the control group.
14 Oxidative Medicine and Cellular Longevity
animals exhibited degeneration in seminiferous tubules (D)and edema in interstitial tissues (E), and at 100mg/kg(Figure 4(d), D), degeneration (D) and hyperplasia (hyp)were noted. But at the lower dose level (25mg/kg and50mg/kg), no histopathological alterations were observed(Figure 4(d), B and C).
3.5.2. Carcinogenicity Study
(1) Ruthenium-Phloretin Treatment Suppressed the Forma-tion of Aberrant Crypt Foci in Rats. To evaluate the effect ofruthenium-phloretin on suppressing colon carcinogenesis,ACF was assessed as a biomarker to detect early-stage colon
cancer in rats. The incidence of ACF on the colon mucosawas analyzed with methylene blue staining immediately afterthe sacrifice of animals, and the data are depicted inFigure 5(a) and Table 7. ACF is typically characterized ascrypts with eminent sizes, altered luminal epithelia, andapparent pericryptal zones. The incidence of ACF wasnoticeably decreased in the groups treated with the complexas compared to the carcinogen control group (Figure 5(a),B). Compared to the carcinogen control groups, a substantialdecrease in the multiplication of ACF was discernible in thegroups treated with 50mg/kg and 100mg/kg of the complex,respectively (Figure 5(a), C and D), but the greatest reductionwas most noticeable in the groups treated with the highest
(a)
(b)
(c)
(d)
Figure 4: (a) Histopathology of kidney of Balb/c mice: (A) normal tissue showing glomerulus (g), proximal convoluted tubule (pct), maculadensa (md), Bowman’s capsule (bc), and distal convoluted tubule (dct); (B) kidney tissue exposed to 25mg/kg complex; (C) kidney tissueexposed to 50mg/kg complex; (D) kidney tissue exposed to 200mg/kg complex; (E) kidney tissue exposed to 600mg/kg complex showingcapsular membrane thickening (tbm), desquamated nuclei (dn), ruptures (r), and vacuolization. (b) Histopathological representation ofliver of Balb/c mice: (A) normal control expressing the central vein (cv), bile duct (bd), sinusoidal dilation (sd), Kupffer cell (kc), andlymph vessel (lv); (B and C) kidney tissue exposed to 25mg/kg and 50mg/kg of complex; (D and E) kidney tissue exposed to 100 and300mg/kg complex exhibited periportal mononuclear infiltration (pmi), disintegration of hepatocyte (dh), and inflammation in focalregion (fi). (c) Histopathological representation of the stomach of Balb/c mice: (A) normal control exhibited muscularis externa (me),submucosa (sm), muscularis mucosa (mm), lamina propia (lp), pit of the gastric region (gp), and lining of the epithelial region (epl); (Band C) stomach tissue exposed to 25mg/kg and 50mg/kg of complex; (D and E) stomach tissue exposed to 100 and 300mg/kg complexshowing hemorrhages (h) between villus, hyperplasia (hyp), and infiltration of leukocytes (Li). (d) Histopathological representation of thetestis of Balb/c mice: (A) normal control exhibiting Sertoli cell (sc), spermatogonia (Sp), and seminiferous tubule (St), and tissues ofinterstitial region (It) are seen within the tubular lumen; (B and C) testis exposed to 25mg/kg and 50mg/kg of complex; (D and E) testisexposed to 100 and 300mg/kg complex exhibited edema in interstitial region (E), deterioration of seminiferous tubule (D), andhyperplasia (Hyp). H&E: 10x magnification (inset 40x).
15Oxidative Medicine and Cellular Longevity

dose (200mg/kg) of the complex (Figure 5(a), E) (p < 0:01).No substantial decrement in ACF multiplicity was noted inthe ruthenium and phloretin-treated groups (Figure 5(a), Fand G).
(2) Ruthenium-Phloretin Treatment Altered the ColonicMucosa in Rats. After 20 weeks of treatment, colonic tissueswere examined histopathologically at 40x by H&E stainingwhere the pristine cylindrical shape and typical architectureof crypts are visible in the control group (Figure 5(b), A).However, in the carcinogen control group (Figure 5(b), B),the correlation between crypt architecture and stromal tis-sues has been deformed due to dysplasia and enlarged nuclei.
The dysplastic tissue is demarcated by a mucosal prolifera-tion and promotes mitosis with diminution of goblet cellsand completes exhaustion of mucin. Immense hyperplasiacan also be identified by the number of deeply stained nucleidue to the presence of highly proliferative cells. The coad-ministration of the ruthenium-phloretin complex in 50 and100mg/kg-treated groups (Figure 5(b), C and D) signifi-cantly corrected these carcinogenic changes. The histopatho-logical architecture of the colonic tissue of 200mg/kg-treatedrats (Figure 5(b), E) resembles that of the control animals.However, no significant improvement was noted in the tis-sues of animals supplemented with ruthenium and phloretin100mg/kg (Figure 5(b), F and G).
(a)
(b)
(c)
(d)
(e)
(f)
Figure 5: (a) Assessment of ACF on colonic tissue: (A) normal control group; (B) DMH and DSS-treated control group; (C) 50mg/kg ofruthenium-phloretin-treated group; (D and E) 100 and 200mg/kg of ruthenium-phloretin complex treated, respectively; (F) ruthenium100mg/kg; and (G) phloretin 100mg/kg served animals. Denotion of the crypts done with white arrows. (b) Histological analysis of ratcolonic mucosa at 10x magnification (inset 40x): (A) normal control rat showing the submucosal layer (sm), mucosal layer (M), laminapropia (Lp), muscularis mucosa (mm), columnar absorptive cells (Cac), and goblet cell (Gc); (B) hyperplasia of mucosa observed in DMHand DSS-treated rat colon (Hyp), mucin depletion (DM), epithelial cell sloughing (Se), and dysplasia (Dys); (C) DMH and DSS and50mg/kg ruthenium-phloretin-treated animals exhibited sloughing of epithelial cells (Se), crypts (c), dilation of column (Dc), andoccasional rupture (R); (D) DMH and DSS and 100mg/kg ruthenium-phloretin-treated animals showing hyperplastic lesion of mucosa(Hyp) and attenuation of goblet cells (D); (E) DMH+DSS+200mg/kg ruthenium-phloretin-treated animals exhibited practically normalhistological structure; (F and G) DMH and 100mg/kg ruthenium and DSS and DMH treatment with DSS and 100mg/kg phloretinexposed animals exhibited hyperplasia (Hyp), dysplasia (Dys), sloughing of epithelial cells (Se), dilation of column (Dc), and occasionalrupture (R). The immunohistochemical analysis of (c) Bax, (d) Bcl-2, (e) NF-κB, and (f) MMP-9 expressions in the colon tissues ofdifferent groups of rats: (A) the normal control; (B) carcinogen control; (C) 50mg/kg of complex treated; (D and E) 100 and 200mg/kgcomplex treated; (F and G) 100mg/kg ruthenium and 100mg/kg phloretin-treated animals. All images at 40x. Scale bars represent 100 μmin all images.
16 Oxidative Medicine and Cellular Longevity
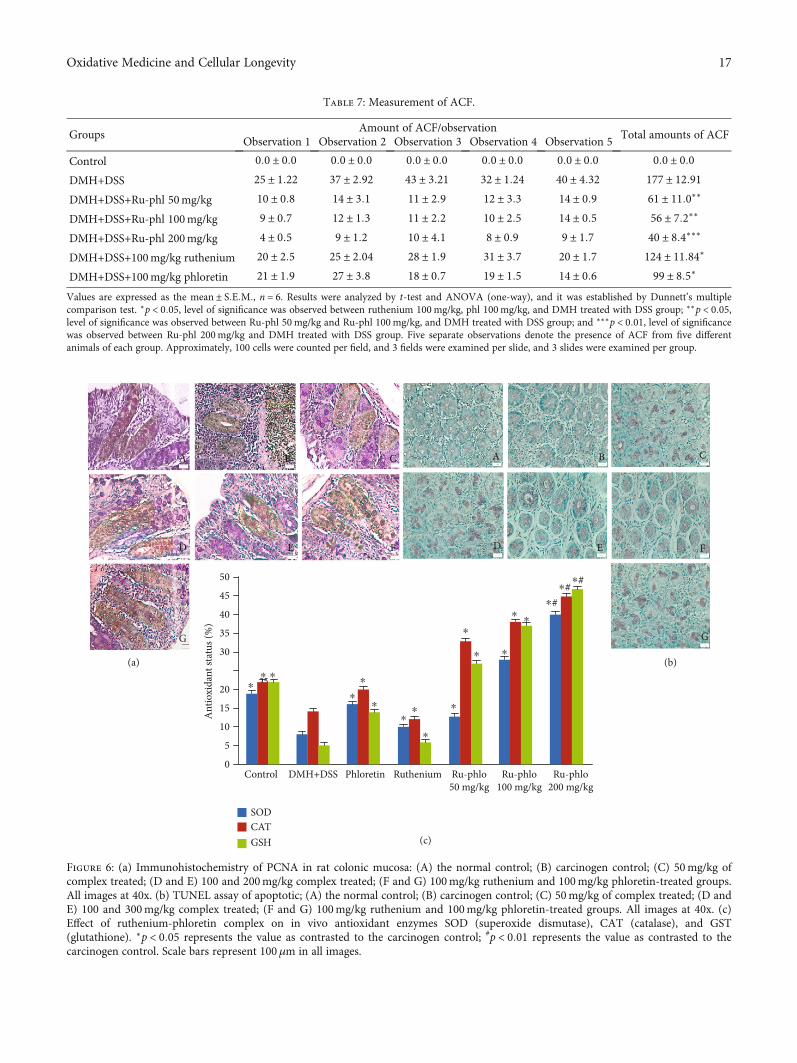
Table 7: Measurement of ACF.
GroupsAmount of ACF/observation
Total amounts of ACFObservation 1 Observation 2 Observation 3 Observation 4 Observation 5
Control 0:0 ± 0:0 0:0 ± 0:0 0:0 ± 0:0 0:0 ± 0:0 0:0 ± 0:0 0:0 ± 0:0DMH+DSS 25 ± 1:22 37 ± 2:92 43 ± 3:21 32 ± 1:24 40 ± 4:32 177 ± 12:91DMH+DSS+Ru-phl 50mg/kg 10 ± 0:8 14 ± 3:1 11 ± 2:9 12 ± 3:3 14 ± 0:9 61 ± 11:0∗∗
DMH+DSS+Ru-phl 100mg/kg 9 ± 0:7 12 ± 1:3 11 ± 2:2 10 ± 2:5 14 ± 0:5 56 ± 7:2∗∗
DMH+DSS+Ru-phl 200mg/kg 4 ± 0:5 9 ± 1:2 10 ± 4:1 8 ± 0:9 9 ± 1:7 40 ± 8:4∗∗∗
DMH+DSS+100mg/kg ruthenium 20 ± 2:5 25 ± 2:04 28 ± 1:9 31 ± 3:7 20 ± 1:7 124 ± 11:84∗
DMH+DSS+100mg/kg phloretin 21 ± 1:9 27 ± 3:8 18 ± 0:7 19 ± 1:5 14 ± 0:6 99 ± 8:5∗
Values are expressed as the mean ± S:E:M:, n = 6. Results were analyzed by t-test and ANOVA (one-way), and it was established by Dunnett’s multiplecomparison test. ∗p < 0:05, level of significance was observed between ruthenium 100mg/kg, phl 100mg/kg, and DMH treated with DSS group; ∗∗p < 0:05,level of significance was observed between Ru-phl 50mg/kg and Ru-phl 100mg/kg, and DMH treated with DSS group; and ∗∗∗p < 0:01, level of significancewas observed between Ru-phl 200mg/kg and DMH treated with DSS group. Five separate observations denote the presence of ACF from five differentanimals of each group. Approximately, 100 cells were counted per field, and 3 fields were examined per slide, and 3 slides were examined per group.
A B C
D
G
(a) (b)
(c)
E F
A B C
D
G
E F
Control0
5
10
15
2025
30
Ant
ioxi
dant
stat
us (%
)
35
40
45
50
DMH+DSS Phloretin Ruthenium Ru-phlo50 mg/kg
Ru-phlo100 mg/kg
Ru-phlo200 mg/kg
#
SODCATGSH
⁎⁎⁎
⁎
⁎
⁎⁎⁎
⁎
⁎
⁎
⁎
⁎
⁎
⁎#⁎ #⁎
⁎
Figure 6: (a) Immunohistochemistry of PCNA in rat colonic mucosa: (A) the normal control; (B) carcinogen control; (C) 50mg/kg ofcomplex treated; (D and E) 100 and 200mg/kg complex treated; (F and G) 100mg/kg ruthenium and 100mg/kg phloretin-treated groups.All images at 40x. (b) TUNEL assay of apoptotic; (A) the normal control; (B) carcinogen control; (C) 50mg/kg of complex treated; (D andE) 100 and 300mg/kg complex treated; (F and G) 100mg/kg ruthenium and 100mg/kg phloretin-treated groups. All images at 40x. (c)Effect of ruthenium-phloretin complex on in vivo antioxidant enzymes SOD (superoxide dismutase), CAT (catalase), and GST(glutathione). ∗p < 0:05 represents the value as contrasted to the carcinogen control; #p < 0:01 represents the value as contrasted to thecarcinogen control. Scale bars represent 100μm in all images.
17Oxidative Medicine and Cellular Longevity

(3) Antioxidant Assessment of Ruthenium-Phloretin Complexin Colon Tissue. The quantity of SOD, CAT, and reduced glu-tathione plunged considerably in the carcinogen control ani-mals (Figure 6(c)). However, the highest dose of the complex(200mg/kg) exhibited a prominent upgrade in the SOD,CAT, and glutathione levels of the colon tissues with respectto carcinogen control and other treated groups (p < 0:01).
(4) Regulation of Bax, Bcl-2, NF-κB, andMMP-9 Pathways byRuthenium-Phloretin Treatment. To delineate the effect ofruthenium-phloretin treatment on the rat colonic mucosa,the presence of cellular biomarkers like Bax, Bcl-2, NF-κB,and MMP-9 was assessed by the immunohistochemicalstaining techniques (Figure 5 and Table 8). It was observedthat DMH and DSS administration downregulated in asignificant way the levels of Bax (Figure 5(c), B); however,an increment of Bcl-2 (Figure 5(d), B), NF-κΒ(Figure 5(e), B), and MMP-9 (Figure 5(f), B) levels wereperceived, related to the control animals (Figures 5(c), A;5(d), A; 5(e), A; and 5(f), A) (p < 0:05). The Bax illustra-tion (Figure 5(c), C–E) was significantly increased in theruthenium-phloretin complex-treated animals, whereas
the revelation of Bcl-2, NF-κΒ, and MMP-9 was reducedin a significant manner (Figures 5(d), C–E; 5(e), C–E;and 5(f), C–E) especially with respect to carcinogen-treated animals (p < 0:05). The dose of 200mg/kg bodyweight of the ruthenium-phloretin complex wasimmensely powerful in amplifying the appearance of Baxand concurrently declined the Bcl-2, NF-κΒ, and MMP-9protein levels (p < 0:01) relative to the carcinogen-treatedanimals. The appearance of the aforementioned bio-markers orients us to perceive that the complex actuatesapoptosis and furthermore restricts cell cycle to adequatelyrestrict disease progression.
(5) Repression of PCNA by Ruthenium-Phloretin Complex.The efficacy of the ruthenium-phloretin compound in theproliferation of colon tissues is designated in Figure 6(a).The LI (labeling index) is calculated as the fraction ofPCNA-labeled cells represented in Table 9. A significant risein the PCNA-LI values was observed in carcinogen control ani-mals (Figure 6(a), B); however, a considerable reduction inthe PCNA-LI index could be found in the maximum dose ofthe ruthenium-phloretin complex-treated animals (p < 0:01)
Table 8: Immunohistochemical analysis of Bax, Bcl-2, NF-κΒ, and MMP-9 in colon carcinoma.
Groups Bax§ Bcl-2§ NF-κΒ§ MMP-9§
Control 11:2 ± 0:8 6:9 ± 0:2 8:2 ± 0:6 9:1 ± 0:4DMH+DSS 4:5 ± 0:8 25:4 ± 1:8 21:9 ± 0:5 23:4 ± 0:7Ru-phl 50mg/kg 5:3 ± 0:2∗∗ 18:4 ± 0:1∗∗ 17:5 ± 0:2 20:6 ± 0:6Ru-phl 100mg/kg 8:1 ± 0:3∗ 11:6 ± 0:2∗∗ 10:3 ± 0:4∗∗ 14:2 ± 0:5∗∗
Ru-phl 200mg/kg 11:7 ± 1:8∗ 7:3 ± 0:5∗ 8:4 ± 0:6∗ 9:5 ± 0:1∗
Ruthenium 100mg/kg 5:9 ± 0:1 17:7 ± 0:8∗∗ 15:8 ± 0:3∗∗ 19:5 ± 0:7∗∗
Phloretin 100mg/kg 9:2 ± 0:8∗∗ 12:7 ± 0:2∗ 13:8 ± 0:6∗ 12:1 ± 0:9∗§Score designated by the results of 6 slides per animal and 6 animals per group, mean ± S:E: (n = 6). Each area was chosen randomly for assessment of thepercentage of immune-positive cells. ∗Level of significance was observed between treated and DMH treated with DSS group (p < 0:01). ∗∗Level ofsignificance was observed between treated and DMH treated with DSS group (p < 0:05).
Table 9: Apoptosis and cell proliferation in colon.
Groups PCNA-LI§ AI (%)§ R = PCNA‐LI/AINormal control 22:08 ± 0:4 0:17 ± 0:02 134:12 ± 0:2DMH+DSS 37:5 ± 1:3 0:08 ± 0:03 468:75 ± 0:5Ru-phl 50mg/kg 27:7 ± 0:4 0:07 ± 0:02 395:71 ± 0:1Ru-phl 100mg/kg 21:2 ± 0:8∗∗ 0:12 ± 0:04## 176:66 ± 0:2$$
Ru-phl 200mg/kg 17:5 ± 0:2∗ 0:13 ± 0:05# 134:61 ± 0:9$
Phloretin 100mg/kg 20:9 ± 0:15∗∗ 0:10 ± 0:03## 209:00 ± 0:7$$
Ruthenium 100mg/kg 25:8 ± 0:12 0:11 ± 0:08 234:54 ± 0:7LI = labelling index; PCNA-LI is represented as the percentage of PCNA-labelled cells to the ratio total number of cells counted; AI = apoptotic index. R isrepresented as PCNA-LI of to the ratio AI. AI was calculated as the percentage of TUNEL-positive cells/total number of cells counted. Values represent themean ± S:E:§The total number of six slides was evaluated per rat. Each field consisted of approximately 500 cells. ∗Level of significance between PCNA-LI ofRu-phl 200mg/kg vs. DMH treated with DSS animals (p < 0:01). ∗∗Level of significance between PCNA-LI of Ru 100mg/kg, Ru-phl 100mg/kg vs. DMHtreated with DSS animals (p < 0:05). #Level of significance between AI of Ru-phl 200mg/kg vs. DMH treated with DSS animals (p < 0:01). ##Level ofsignificance between AI of Ru 100mg/kg, Ru-phl 100mg/kg vs. DMH treated with DSS animals (p < 0:05). $Level of significance between R of Ru-phl200mg/kg vs. DMH treated with DSS animals (p < 0:01). $$Level of significance between R of Ru 100mg/kg, Ru-phl 100mg/kg vs. DMH treated with DSSanimals (p < 0:05).
18 Oxidative Medicine and Cellular Longevity

(Figure 6(a), E). Ruthenium-phloretin at 100mg/kg-treatedgroups (Figure 6(a), D) also showed a decrease in thePCNA-LI values (p < 0:05) while the rest of the animals didnot show any noteworthy alteration at levels of PCNA incomparison to the carcinogen-treated animals.
(6) Ruthenium-Phloretin Complex Promotes Apoptosis. TheTUNNEL assay was carried out to visualize the result ofruthenium-phloretin treatment on apoptosis in colon cancer(Figure 6(b)). Apoptosis causes the nuclear DNA to ruptureinto smaller fragments yielding DNA strand breaks, whichcan be detected by the brown stains, formed by DAB chro-mogen. The TUNEL-positive cells undergoing apoptosiswere very few in the case of the carcinogen control group(Figure 6(b), B), whereas the TUNEL-positive cells ofruthenium-phloretin-treated animals increased significantly(Figure 6(b), C–E). In an area with almost 700 cells, 3 to 5apoptotic cells were usually observed in the carcinogen con-trol group, which raised to 10-14 cells every 700 cellsthroughout the 200mg/kg of the complex-treated animals.AI defines the apoptotic index and is documented inTable 9. Animals receiving 200mg/kg of the compounddenoted a substantial increase in apoptosis when con-trasted to the carcinogen control group. The value Rreflects the ratio of cell proliferation to apoptosis. Cellularproliferation and TUNNEL assessment indicate that perhapsthe latest alterations in the microenvironment of the tumorare accompanied by a concurrent boost in cell proliferationas well as minimizing cell death. The value of R reaches apeak in the carcinogen control group; however, it declinessteadily with the increase in the dose concentration of thecomplex. By stating all of these assumptions, we can inferthat the complex triggers apoptosis and consequentlydecreases proliferation of the cells in a concentration-controlled fashion.
4. Discussion
For a competent module of administration, modern antican-cer drugs derived from metal complexes emphasize oninducing apoptosis in cancer cells which provide markedimprovements in pharmacological applications [58]. Themove was greatly inspired by the development of platinum-based antitumor drugs, but numerous drawbacks such asextreme adverse side effects, drug resistance, accumulationof mutations, and epimutations force us to look for alterna-tive therapies. Allardyce and Dyson mentioned in their jour-nal article that ruthenium a platinum group of metal hasmany enticing physiological effects [11] and can developstrong chemical bonds with varying electronegativity thatenable it to bind to a multitude of biomolecules [59].
Bioflavonoids, a group of polyphenols originating inplant-based diets, are the captivating substitute to metal-based treatment in CRC. Bioflavonoids possess significantanticancer properties due to their potentiality to trigger theapoptosis, metabolic activation, cell proliferation, adhesionof tumor cell, and angiogenesis [60]. In addition, these com-pounds can chelate to form complexes with a wide range ofmetal ions and have considerable radical scavenging activities
as compared with the flavonoids, alongside having a pivotalrole in countering oxidative stress [61]. Phloretin is one suchnatural product found in plants that exhibits a range of bio-activities such as anticancer, antimicrobial, and antioxidantactivities [62]. Phloretin is known to cause apoptotic celldeath in the cancer cells of the esophagus [63]. Phloretincan increase cisplatin’s potency in treating lung cancer [64]and has been observed to cause apoptosis in human leukemiacells [65]. Being a natural flavonoid (dihydrochalcone),phloretin has almost no cytotoxicity against normal cells. Inthis present research, we explored the potential impact ofthe ruthenium-phloretin complex on colon carcinoma incorrelation with in vitro and in vivo protocols.
During our analysis, we synthesized the molecules, andfurther, it has been characterized. We applied different spec-troscopic assessments to determine the antioxidant capacityof phloretin before and after the complex formation. Resultsconfirm that the chelation materializes by the 3-OH and 9-OH functional groups of the ligand, and the complex is foundcrystalline. The study of antioxidant activity revealed that theproperty of free radical scavenging of phloretin is consider-ably intensified on subsequent complexation with metal.Therefore, ruthenium facilitates to modify the oxidativecapacity of phloretin following complexation by increasingthe shifting of electrons from phloretin and hence escalatingits redox potential. The reaction of the complex through CT-DNA ensued in a decline in the spectrum of absorption ofuncombined DNA, evidence of the phloretin complex inter-calated with CT-DNA.
The subsequent module of the study was dedicated todetermine the outcome of the ruthenium-phloretin complexon the HT-29 cancer cell line. The MTT assay revealed thatthe ruthenium-phloretin complex is capable of reducing cel-lular propagation and initiates apoptosis. Among the mostconsequential objectives of anticancer drugs is the cell cycleregulation; particularly, the arrest of phases G1 and G2 offersa crucial role in the sequence of the cell cycle [66]. An under-standing into the mechanistic approach of the apoptoticinduction by the complex was obtained by flow cytometrystudies applying Annexin V and PI staining. Furthermore,results showed that a greater proportion of early apoptoticevents is marked by ruthenium-phloretin in the HT-29 can-cer cells (Figure 3(f)) by detaining the cells in the G0/G1stage (Figure 3(h)) that consequently leads to cellular death.
The global harmonized program for classifying andmark-ing chemicals includes the recording of the safest dose for anovel cancer entity [67]. Hence, acute and subacute toxicolog-ical studies were carried out to assess the LD50 value and safedoses of the complex. Furthermore, a cell-oriented reporterassessment has been performed to evaluate the result ofruthenium-phloretin complex treatment on the appearanceof VEGF, Akt, phospho Akt, p53, pro- and active caspase-3,phosphormTOR, andmTOR-related signaling trail. In recentscenarios, the genemutation in cancer is caused by tumor sup-pressor gene TP53. Mutation of TP53 and the simultaneousinactivation of p53 suppress tumor cell death and progression[68]. The expressions of PTEN are controlled by cellular p53levels, which in turn negatively regulate the PI3 kinase path-way that explains the indications from tyrosine kinase
19Oxidative Medicine and Cellular Longevity

receptors to amend the cell-regulated setting [69]. Activationof P13 assisted by PTEN causes the Akt phosphorylation thatin turn activates the mTOR pathways kindling tumorigenesis[70]. There is a recent preclinical study withOSI-027, a potentinhibitor of Akt/mTORwhich suppressed the growth of colo-rectal cancer [71]. In addition, Akt and mTOR inhibitors candownregulate leptin-mediated PI3K/Akt/mTOR signalingwhich influences the colon cancer cells to proliferate and pro-mote apoptosis [72]. Our studies in the manuscript had simi-lar results with ruthenium-phloretin complex effectively,downregulating both Akt and mTOR and their phosphory-lated forms. Additionally, mTOR also upregulate cyclinsresponsible for controlling the action of enzymes essentialin the passage of cells all the way through G1-S stages[70]. mTOR is further responsible for the regulation ofthe angiogenic growth factor similar to VEGF, which isinvolved towards the progress of tumors in mammary, cer-vical, ovarian, and gastrointestinal cancers [70]. Besides,p53 promotes the caspase cascade through the intrinsicapoptotic pathway to degenerate several cells derived fromproteins in sequence to foster the morphological variationsessential in apoptosis [73].
Our experiments aim is to reveal that the ruthenium-phloretin complex operates alongside a unique mechanismby escalating the caspase-3 and p53 proteins and subsidingmTOR, VEGF, and Akt expressions. Hence, apoptosis ismodulated through intrinsic trail subsequently by initiatingthe caspase pathways. Additionally, the complex exhibitsthe cell cycle arrest by detaining the G0/G1 point. Our resultsfruitfully demonstrated that the complex treatment pro-foundly suppressed VEGF, Akt, and mTOR, expressions thatcould contribute significantly in the prevention of the angio-genic process. Furthermore, our research provides abundantproof that the ruthenium-phloretin complex pursues a p53-dependent apoptotic cell death in colon carcinoma. One ofthe principal aspects accompanying the cellular apoptoticprocess is the Bax and Bcl-2 proteins, which are typicallyassociated with Akt and extracellular signal-regulated kinase(ERK) trail [74]. Bax, proapoptotic in nature, is essentialfor the apoptotic process in regular cells and to inhibitunwarranted proliferation and the prospect of tumorigene-sis. Bcl-2 proteins, however, act in the opposing mannerby promoting cell survival and suppressing apoptosis [75].Ruthenium-phloretin treatment downregulates Bcl-2 intensityand enhanced the proapoptotic proteins, such as Bax andcaspase-3, thus escalating the Bax/Bcl-2 ratio and encourag-ing the apoptotic process.
Immune cells that infiltrate gastrointestinal mucosa, asin inflammatory intestinal disease (IBD), secrete protu-morigenic cytokines like TNF-α, IL-1, and IL-17 to increaseNF-κB activity and to increase colon cancer risk [76]. Therecurrent upregulation of the NF-κB signaling trail in carci-noma provides a stringent microenvironment that is essen-tial either for tumor activation or for tumor growth, orcollectively [77]. We noticed that the ruthenium-phloretincomplex treatment module effectively decreased NF-κBintensity in the colon carcinoma cells (Figure 5(e), A–G),hence denoting that ruthenium-phloretin treatment influ-ences the inflammatory pathways in colon cancer. MMPs have
emerged as essential regulatory proteins equally in pro- andanti-inflammatory pathways. MMP production and activationare usually enhanced in any tissue damage and inflammatorydisease cycle, so there is considerable indication that theseproteinases work primarily in inflammation to alter the infil-tration of leukocytes, either by barrier function control or bycytokine/chemokine activity [78]. Our study provides con-clusive evidence that ruthenium-phloretin treatment regu-lates MMP-9 expressions in inflammation-associated coloncancer (Figure 5 (vi) A-G).
Recent studies indicate that the two common hallmarksof tumors are altered redox balance and abrogate redox sig-naling which are sturdily associated with malignancy andresistance to treatment [79]. Thus, it can be expected thatthe upregulation of SOD, GSH, and CAT would result inthe increment of the H2O2 level in the mitochondria, whichis an important signaling molecule and a “reactive oxygenspecies” [80]. Several studies have directed that mitochon-drial H2O2 is a direct and effective apoptotic process inducer[81]. Treatment of ruthenium-phloretin significantly ele-vated expressions of SOD, CAT, and GSH in colon cancercells, probably by stimulating the ROS to instigate the apo-ptotic events (Figure 6(c)).
Cell growth is a necessity for the progression of cancer atprimary and metastatic sites, and PCNA is a crucial factorfor DNA replication; thus, the inhibition of PCNA is consid-ered to be a viable anticancer strategy [82]. Our study revealsthat the carcinogen control animals exhibited an upsurge inthe amount of cells labeled with PCNA through declining AI(apoptotic index) (Table 9), indicating cellular proliferationand a greater number of ACF multiplicity within the colonicmucosa. On the other hand, a decrease of cells labeled withPCNA and consequent increment of AI were observed posttreatment with the ruthenium-phloretin complex. In sum-mary, the ruthenium-phloretin complex is accountable forthe p53 intervene apoptosis in the colon carcinoma, instigatedby instigation of the intrinsic apoptotic trail facilitated by theBcl-2 and Bax and at the same time downregulating theAkt/mTOR with NF-κB/MMP-9-regulated inflammatorypathways. Besides, the complex furthermore exhibits an anti-angiogenic process by decrementing the VEGF biomarkers,allowing a decline of multiplicity of ACF in the colonmucosa.Moreover, the complex fruitfully demonstrated the intenseactivity on the free radical scavenging capabilities of colon car-cinoma cells owing to the commencement of mitochondria-related reactive oxygen species by the regulation of p53. Thediminution of PCNA due to the stimulation of p53 furtherheightens apoptosis by minimizing cellular proliferation.
The present alternative approach to colon cancer therapyshows higher efficiency at significantly lesser doses whichoffers insignificant toxicity and no additional adverse effects,as documented by our study. The outcomes give considerableproof that low dosages of ruthenium-phloretin chemother-apy could interrupt, revoke, or suspend the succession ofcolon carcinoma by finding the biomarkers corelated withthe initiation of the apoptotic process in colon carcinomaand altering intrinsic apoptosis along with the antiangiogenicpathway, hence fulfilling the role of a prospective candidatein cancer chemotherapeutics in the vicinity of the future.
20 Oxidative Medicine and Cellular Longevity
Abbreviation
DMSO: Dimethyl sulfoxideTPTZ: 2,4,6-Tri(2-pyridyl)-striazineFT-IR: Fourier transform infrared spectroscopic analysisXRD: X-ray diffraction spectroscopyVEGF: Vascular endothelial growth factorFRAP: Ferric reducing antioxidant powerDPPH: 1,1-Diphenyl-2-picrylhydrazylABTS: 2,2-Azino-bis(3-ethylbenzothiazoline-6-sulfonate)NMR: Nuclear magnetic resonanceMTT: 3-(4,5-Dimethyl thiazole-2-yl)-2,5-diphenyltetra-
zolium bromidePCNA: Proliferating cell nuclear antigenmTOR: Mammalian target of rapamycinACF: Aberrant crypt fociIR: Infrared spectroscopy.
Data Availability
The data used to support the findings of this study are avail-able from the corresponding author upon request.
Ethical Approval
The entire experimental procedure concerning animals hasbeen carried out in compliance with the guidelines of the Insti-tutional Animal Ethics Committee and the Government’sAnimal Regulatory Body (Regd No. 1458/PO/a/11/CPCSEA).
Conflicts of Interest
The authors have declared that no competing interest exists.
Authors’ Contributions
GJ and ZZ designed the study and were involved in itssynchronization. Experiments on animals and collectionof samples were done by AR and AM. Cell culture wasconducted by SR and TC along with statistical analysisand writing of the manuscript. ZG was involved in manu-script synchronization. The manuscript is read andapproved by all publishers.
Acknowledgments
The writers are deeply obliged in this study work for theassistance provided by Haricharan Garg Charitable Trustand the Henan Luoyang Orthopedic Hospital, Zhengzho.The writers are thankful to BioBharati LifeScience Pvt,Ashoka Laboratories Ltd., and Stellixir Biotech for theirvalued support.
Supplementary Materials
(1) Page 1: certificate from the Institutional Ethical Commit-tee denoting the study number and the number of animalsused. (2) Page 2: full blot of protein pro-caspase-3 in HT-29cells after treatment with the ruthenium-phloretin complex.(3) Page 2: full blot of protein active caspase-3 in HT-29 cells
after treatment with the ruthenium-phloretin complex(Supplementary Materials)
References
[1] F. Bray, J. Ferlay, I. Soerjomataram, R. L. Siegel, L. A. Torre,and A. Jemal, “Global cancer statistics 2018: GLOBOCAN esti-mates of incidence and mortality worldwide for 36 cancers in185 countries,” CA: A Cancer Journal for Clinicians, vol. 68,no. 6, pp. 394–424, 2018.
[2] S. Park and S. H. Jee, “Epidemiology of colorectal cancer inAsia-Pacific region,” in Surgical Treatment of Colorectal Can-cer, N. Kim, K. Sugihara, and J. T. Liang, Eds., pp. 3–10,Springer, Berlin/Heidelberg, Germany, 2018.
[3] L. Zhang, F. Cao, G. Zhang et al., “Trends in and predictions ofcolorectal cancer incidence and mortality in China from 1990to 2025,” Frontiers in Oncology, vol. 9, no. 9, pp. 98–119, 2019.
[4] P. S. Patil, A. Saklani, P. Gambhire et al., “Colorectal cancer inIndia: an audit from a tertiary center in a low prevalence area,”Indian Journal of Surgical Oncology, vol. 8, no. 4, pp. 484–490,2017.
[5] S. Pathy, R. Lambert, C. Sauvaget, and R. Sankaranarayanan,“The incidence and survival rates of colorectal cancer in Indiaremain low compared with rising rates in East Asia,” Diseasesof the Colon and Rectum, vol. 55, no. 8, pp. 900–906, 2012.
[6] J. Mishra, J. Drummond, S. H. Quazi et al., “Prospective ofcolon cancer treatments and scope for combinatorial approachto enhanced cancer cell apoptosis,” Critical Reviews in Oncolo-gy/Hematology, vol. 86, no. 3, pp. 232–250, 2013.
[7] X. Liu, J. Wu, D. Zhang, K. Wang, X. Duan, and X. Zhang, “Anetwork pharmacology approach to uncover the multiplemechanisms of Hedyotis diffusa Willd. on colorectal cancer,”Evidence-Based Complementary and Alternative Medicine,vol. 2018, Article ID 6517034, 12 pages, 2018.
[8] T. C. Johnstone, K. Suntharalingam, and S. J. Lippard,“Third row transition metals for the treatment of cancer,”Philosophical Transactions of the Royal Society A: Mathemati-cal, Physical and Engineering Sciences, vol. 373, no. 2037,2015.
[9] B. Mansoori, A. Mohammadi, S. Davudian, S. Shirjang, andB. Baradaran, “The different mechanisms of cancer drug resis-tance: a brief review,” Advanced Pharmaceutical Bulletin,vol. 7, no. 3, pp. 339–348, 2017.
[10] C. H. Leung, H. J. Zhong, D. S. H. Chan, and D. L. Ma, “Bioac-tive iridium and rhodium complexes as therapeutic agents,”Coordination Chemistry Reviews, vol. 257, no. 11-12,pp. 1764–1776, 2013.
[11] C. S. Allardyce and P. J. Dyson, “Ruthenium in medicine: cur-rent clinical uses and future prospect,” Platinum MetalsReview, vol. 45, no. 2, pp. 62–69, 2001.
[12] J. Ochocki, M. Kasprzak, L. Chęcińska et al., “Synthesis, single-crystal and solution structure analysis and in vitro cytotoxicactivity of two novel complexes of ruthenium(ii) with in situformed flavanone-based ligands,” Dalton Transactions,vol. 39, no. 40, pp. 9711–9718, 2010.
[13] W.M.Motswainyana and P. A. Ajibade, “Anticancer Activitiesof Mononuclear Ruthenium(II) Coordination Complexes,”Advances in Chemistry, vol. 2015, Article ID 859730, 21 pages,2015.
[14] F. A. Beckford, M. Shaloski, Jr, G. Leblanc et al., “Microwavesynthesis of mixed ligand diimine-thiosemicarbazone
21Oxidative Medicine and Cellular Longevity

complexes of ruthenium (II): biophysical reactivity and cyto-toxicity,” Dalton Transactions, vol. 48, no. 48, pp. 10757–10764, 2009.
[15] W. Cao, W. Zheng, and T. Chen, “Ruthenium polypyridylcomplex inhibits growth and metastasis of breast cancer cellsby suppressing FAK signaling with enhancement of TRAIL-induced apoptosis,” Scientific Reports, vol. 5, no. 1, article9157, 2015.
[16] E. Alessio, G. Mestroni, A. Bergamo, and G. Sava, “Rutheniumantimetastatic agents,” Current Topics in Medicinal Chemistry,vol. 4, no. 15, pp. 1525–1535, 2004.
[17] C. G. Hartinger, M. A. Jakupec, S. Zorbas-Seifried et al.,“KP1019, a new redox-active anticancer agent–preclinicaldevelopment and results of a clinical phase I study in tumorpatients,” Chemistry and Biodiversity, vol. 5, no. 10, pp. 2140–2155, 2008.
[18] L. S. Flocke, R. Trondl, M. A. Jakupec, and B. K. Keppler,“Molecular mode of action of NKP-1339 - a clinically investi-gated ruthenium-based drug - involves ER- and ROSrelatedeffects in colon carcinoma cell lines,” Investigational NewDrugs, vol. 34, no. 3, pp. 261–268, 2016.
[19] T. J. Hubin, P. N. A. Amoyaw, K. D. Roewe et al., “Synthesisand antimalarial activity of metal complexes of cross-bridgedtetraazamacrocyclic ligands,” Bioorganic & Medicinal Chemis-try, vol. 22, no. 13, pp. 3239–3244, 2014.
[20] S. A. Khan, A. M. Asiri, K. Al-Amry, and M. A. Malik, “Syn-thesis, Characterization, Electrochemical Studies, and In VitroAntibacterial Activity of Novel Thiosemicarbazone and ItsCu(II), Ni(II), and Co(II) Complexes,” The Scientific WorldJournal, vol. 2014, Article ID 592375, 9 pages, 2014.
[21] S. Azeem, S. W. Gillani, A. Siddiqui, S. B. Jandrajupalli, V. Poh,and S. A. S. Sulaiman, “Diet and colorectal cancer risk in Asia–a systematic review,” Asian Pacific Journal of Cancer Preven-tion, vol. 16, no. 13, pp. 5389–5396, 2015.
[22] E. Giovannucci, M. J. Stampfer, G. A. Colditz et al., “Folate,methionine and alcohol intake and risk of colorectal ade-noma,” Journal of the National Cancer Institute, vol. 85,no. 11, pp. 875–883, 1993.
[23] E. A. Platz, W. C. Willett, G. A. Colditz, E. B. Rimm,D. Spiegelman, and E. Giovannucci, “Proportion of colon can-cer risk that might be preventable in a cohort of middle-agedUS men,” Cancer Causes & Control, vol. 11, no. 7, pp. 579–588, 2000.
[24] B. Y. Choi, “Biochemical basis of anti-cancer-effects ofphloretin-a natural dihydrochalcone,” Molecules, vol. 24,no. 2, p. 278, 2019.
[25] K. Tanaka, T. Ono, and M. Umeda, “Inhibition of biologicalactions of 12-O-tetradecanoylphorbol-13-acetate by inhibitorsof protein kinase C,” Japanese Journal of Cancer Research,vol. 77, no. 11, pp. 1107–1113, 1986.
[26] Y. Nakamura, S. Watanabe, N. Miyake, H. Kohno, andT. Osawa, “Dihydrochalcones: evaluation as novel radicalscavenging antioxidants,” Journal of Agricultural and FoodChemistry, vol. 51, no. 11, pp. 3309–3312, 2003.
[27] S. Y. Park, E. J. Kim, H. K. Shin et al., “Induction of apoptosisin HT-29 colon cancer cells by phloretin,” Journal of MedicinalFood, vol. 10, no. 4, pp. 581–586, 2007.
[28] K. C. Yang, C. Y. Tsai, Y. J. Wang et al., “Apple polyphenolphloretin potentiates the anti-cancer actions of paclitaxelthrough induction of apoptosis in human hep G2 cells,”Molec-ular Carcinogenesis, vol. 48, no. 5, pp. 420–431, 2009.
[29] W. T. Chang, W. C. Huang, and C. J. Liou, “Evaluation of theanti-inflammatory effects of phloretin and phlorizin inlipopolysaccharide-stimulated mouse macrophages,” FoodChemistry, vol. 134, no. 2, pp. 972–979, 2012.
[30] C. L. Lin, J. H. Jeng, C. C. Wu et al., “Chemopreventive Poten-tial of 2,3,5,4′-Tetrahydroxystilbene-2-O-β-D-glucoside onthe Formation of Aberrant Crypt Foci in Azoxymethane-Induced Colorectal Cancer in Rats,” BioMed Research Interna-tional, vol. 2017, Article ID 3634915, 8 pages, 2017.
[31] R. S. Ray, B. Ghosh, A. Rana, and M. Chatterjee, “Suppressionof cell proliferation, induction of apoptosis and cell cyclearrest: chemopreventive activity of vanadium in vivo andin vitro,” International Journal of Cancer, vol. 120, no. 1,pp. 13–23, 2007.
[32] W. Li, Q. L. Wang, X. Liu et al., “Combined use of vitamin D3andmetformin exhibits synergistic chemopreventive effects oncolorectal neoplasia in rats and mice,” Cancer PreventionResearch, vol. 8, no. 2, pp. 139–148, 2015.
[33] M. Hajrezaie, K. Shams, S. Z. Moghadamtousi et al., “Chemo-prevention of Colonic Aberrant Crypt Foci by Novel SchiffBased Dichlorido(4-Methoxy-2-{[2-(Piperazin-4-Ium-1-Yl)Ethyl]Iminomethyl}Phenolate)Cd Complex in Azoxymethane-Induced Colorectal Cancer in Rats,” Scientific Reports, vol. 5,no. 1, pp. 1–15, 2015.
[34] L. Mousa, M. E. Salem, and S. Mikhail, “Biomarkers of angio-genesis in colorectal cancer,” Biomarkers in Cancer, vol. 7,no. S1, pp. 13–19, 2015.
[35] S. M. Johnson, P. Gulhati, B. A. Rampy et al., “Novel expres-sion patterns of PI3K/Akt/mTOR signaling pathway compo-nents in colorectal cancer,” Journal of the American Collegeof Surgeons, vol. 210, no. 5, pp. 767–776, 2010.
[36] N. Awasthi, P. L. Yen, M. A. Schwarz, and R. E. Schwarz, “Theefficacy of a novel, dual PI3K/mTOR inhibitor NVP-BEZ235to enhance chemotherapy and antiangiogenic response in pan-creatic cancer,” Journal of Cellular Biochemistry, vol. 113,no. 3, pp. 784–791, 2012.
[37] W. Glienke, L. Maute, J. Wicht, and L. Bergmann, “The dualPI3K/mTOR inhibitor NVP-BGT226 induces cell cycle arrestand regulates survivin gene expression in human pancreaticcancer cell lines,” Tumour Biology, vol. 33, no. 3, pp. 757–765, 2012.
[38] T. Fujioka, Y. Kashiwada, R. E. Kilkuskie et al., “Anti-AIDSagents, 11. Betulinic acid and platanic acid as anti-HIV princi-ples from syzigium claviflorum, and the anti-HIV activity ofstructurally related triterpenoids,” Journal of Natural Products,vol. 57, no. 2, pp. 243–247, 1994.
[39] D. R. McIlwain, T. Berger, and T. W. Mak, “Caspase functionsin cell death and disease,” Cold Spring Harbor Perspectives inBiology, vol. 5, no. 4, article a008656, 2013.
[40] Y. J. Chang, N. H. Linh, Y. H. Shih, H. M. Yu, M. S. Li, andY. R. Chen, “Alzheimer's amyloid-β sequesters caspase-3in vitro via its C-terminal tail,” ACS Chemical Neuroscience,vol. 7, no. 8, pp. 1097–1106, 2016.
[41] L. Flanagan, M. Meyer, J. Fay et al., “Low levels of caspase-3predict favourable response to 5FU-based chemotherapy inadvanced colorectal cancer: caspase-3 inhibition as a therapeu-tic approach,” Cell Death and Disease, vol. 7, no. 2, articlee2087, 2016.
[42] I. F. F. Benzie and J. J. Strain, “The Ferric Reducing Ability ofPlasma (FRAP) as a measure of “Antioxidant Power”: theFRAP assay,” Analytical Biochemistry, vol. 239, no. 1, pp. 70–76, 1996.
22 Oxidative Medicine and Cellular Longevity

[43] J. E. N. Dolatabadi, A. Mokhtarzadeh, S. M. Ghareghoran, andG. Dehghan, “Synthesis, characterization and antioxidantproperty of quercetin-Tb (III) complex,” Advanced Pharma-ceutical Bulletin, vol. 4, no. 2, pp. 101–104, 2014.
[44] J. C. Pennycooke, S. Cox, and C. Stushnoff, “Relationship ofcold acclimation, total phenolic content and antioxidantcapacity with chilling tolerance in petunia (Petunia ×hybrida),” Environmental and Experimental Botany, vol. 53,no. 2, pp. 225–232, 2005.
[45] G. Dehghan, J. E. N. Dolatabadi, A. Jouyban, K. A. Zeynali,S. M. Ahmadi, and S. Kashanian, “Spectroscopic studies onthe interaction of Quercetin–Terbium(III) complex with calfthymus DNA,” DNA and Cell Biology, vol. 30, no. 3,pp. 195–201, 2011.
[46] H. Li, Q. Wang, L. Dong et al., “Morusin suppresses breastcancer cell growth in vitro and in vivo through C/EBPβand PPARγ mediated lipoapoptosis,” Journal of Experimen-tal & Clinical Cancer Research, vol. 34, no. 1, pp. 137–149,2015.
[47] X. H. Deng, H. Y. Song, Y. F. Zhou, G. Y. Yuan, and F. J.Zheng, “Effects of quercetin on the proliferation of breast can-cer cells and expression of survivin in vitro,” Experimental andTherapeutic Medicine, vol. 6, no. 5, pp. 1155–1158, 2013.
[48] V. K. Kumar, S. Vennila, and N. Nalini, “Modifying effects ofmorin on the development of aberrant crypt foci and bacterialenzymes in experimental colon cancer,” Food and ChemicalToxicology, vol. 47, no. 2, pp. 309–315, 2009.
[49] N. Ghosh, R. Sandur, D. Ghosh, S. Roy, and S. Janadri, “Acute,28days sub acute and genotoxic profiling of quercetin-magnesium complex in Swiss albino mice,” Biomedicine &Pharmacotherapy, vol. 86, pp. 279–291, 2017.
[50] S. Roy, R. Das, B. Ghosh, and T. Chakraborty, “Decipheringthe biochemical and molecular mechanism underlying thein vitro and in vivo chemotherapeutic efficacy of rutheniumquercetin complex in colon cancer,”Molecular Carcinogenesis,vol. 57, no. 6, pp. 700–721, 2018.
[51] A. Tsunoda, M. Shibusawa, Y. Tsunoda et al., “Antitumoreffect of S-1 on DMH induced colon cancer in rats,” Antican-cer Research, vol. 18, no. 2A, pp. 1137–1141, 1998.
[52] K. Jagatheesh, V. Arumugam, N. Elangovan, andP. Pavankumar, “Evaluation of the antitumor and antioxidantactivity of Amorphophallus paeonifolius on DMBA inducedmammary carcinoma,” International Journal of Chemicaland Pharmaceutical Science, vol. 1, no. 2, pp. 40–50, 2010.
[53] B. B. P. Sinha, G. A. Peterson, G. C. Li, and R. R. Whitney,“Nuclear charge distribution of isotone pairs I 31P and 32S,”Physical Review C, vol. 6, no. 5, pp. 1930–1938, 1972.
[54] S. Awasthi, P. Kakkar, P. N. Viswanathan, and R. Bharadwaj,“Effect of anaesthetic ether on lipid peroxidation and superox-ide dismutase isozymes of young and adult rat brain,” IndianJournal of Experimental Biology, vol. 27, no. 7, pp. 647–649,1989.
[55] J. T. Rotruck, A. L. Pope, H. E. Ganther, A. B. Swanson, D. G.Hafeman, and W. G. Hoekstra, “Selenium: biochemical role asa component of glutathione peroxidase,” Science, vol. 179,no. 4073, article 4073, pp. 588–590, 1973.
[56] Y. Wang, L. Bian, T. Chakraborty, T. Ghosh, P. Chanda,and S. Roy, “Construing the biochemical and molecularmechanism underlying the in vivo and in vitro chemothera-peutic efficacy of ruthenium-baicalein complex in colon can-cer,” International Journal of Biological Sciences, vol. 15,no. 5, pp. 1052–1071, 2019.
[57] S. Roy, A. Sil, and T. Chakraborty, “Potentiating apoptosis andmodulation of p53, Bcl-2, and Bax by a novel chrysin ruthe-nium complex for effective chemotherapeutic efficacy againstbreast cancer,” Journal of Cellular Physiology, vol. 234, no. 4,pp. 4888–4909, 2019.
[58] D. Hanahan and R. A. Weinberg, “Hallmarks of Cancer: TheNext Generation,” Cell, vol. 144, no. 5, pp. 646–674, 2011.
[59] R. Santamaria, C. Irace, G. D'Errico, D. Montesarchio, andL. Paduano, “Perspectives and potential applications of ruthe-nium based nano-carriers for cancer therapy,” Journal of Phar-maceutics and Drug Development, vol. 1, no. 2, pp. 1–4, 2014.
[60] T. M. de Kok, S. G. van Breda, and M. M. Manson, “Mecha-nisms of combined action of different chemopreventive dietarycompounds,” European Journal of Nutrition, vol. 47, no. S2,pp. 51–59, 2008.
[61] M. Symonowicz and M. Kolanek, “Flavonoids and their prop-erties to form chelate complexes,” Food Science and Biotech-nology, vol. 76, no. 1, pp. 35–41, 2012.
[62] S. Behzad, A. Sureda, D. Barreca, S. F. Nabavi, L. Rastrelli, andS. M. Nabavi, “Health effects of phloretin: from chemistry tomedicine,” Phytochemistry Reviews, vol. 16, no. 3, pp. 527–533, 2017.
[63] H.Duan, R.Wang, X. Yan et al., “Phloretin induces apoptosis ofhuman esophageal cancer via a mitochondria-dependent path-way,” Oncology Letters, vol. 14, no. 6, pp. 6763–6768, 2017.
[64] L. Ma, R. Wang, Y. Nan, W. Li, Q. Wang, and F. Jin, “Phloretinexhibits an anticancer effect and enhances the anticancerability of cisplatin on non-small cell lung cancer cell linesby regulating expression of apoptotic pathways and matrixmetalloproteinases,” International Journal of Oncology, vol. 48,no. 2, pp. 843–853, 2016.
[65] M. J. Chung, J. K. Sohng, D. J. Choi, and Y. I. Park, “Inhibitoryeffect of phloretin and biochanin A on IgE-mediated allergicresponses in rat basophilic leukemia RBL-2H3 cells,” Life Sci-ences, vol. 93, no. 9-11, pp. 401–408, 2013.
[66] T. Muthurajan, P. Rammanohar, N. P. Rajendran,S. Sethuraman, and U. M. Krishnan, “Evaluation of a querce-tin–gadolinium complex as an efficient positive contrastenhancer for magnetic resonance imaging,” RSC Advances,vol. 5, no. 106, pp. 86967–86979, 2015.
[67] M. Hajrezaie, P. Hassandarvish, S. Z. Moghadamtousi et al.,“Chemopreventive evaluation of a Schiff base derived copper(II) complex against azoxymethane-induced colorectal cancerin rats,” PLoS One, vol. 9, no. 3, article e91246, 2014.
[68] V. J. N. Bykov, S. E. Eriksson, J. Bianchi, and K. G. Wiman,“Targeting mutant p53 for efficient cancer therapy,” NatureReviews Cancer, vol. 18, no. 2, pp. 89–102, 2018.
[69] J. S. Fridman and S. W. Lowe, “Control of apoptosis by p53,”Oncogene, vol. 22, no. 56, pp. 9030–9040, 2003.
[70] S. H. Advani, “Targeting mTOR pathway: a new concept incancer therapy,” Indian Journal of Medical and PaediatricOncology, vol. 31, no. 4, pp. 132–136, 2010.
[71] S. V. Bhagwat, P. C. Gokhale, A. P. Crew et al., “Preclinicalcharacterization of OSI-027, a potent and selective inhibitorof mTORC1 and mTORC2: distinct from rapamycin,”Molecular Cancer Therapeutics, vol. 10, no. 8, pp. 1394–1406, 2011.
[72] D. Wang, J. Chen, H. Chen et al., “Leptin regulates prolifera-tion and apoptosis of colorectal carcinoma through PI3K/Akt/mTOR signalling pathway,” Journal of Biosciences, vol. 37,no. 1, pp. 91–101, 2012.
23Oxidative Medicine and Cellular Longevity

[73] Z. Zhuo, J. Hu, X. Yang et al., “Ailanthone inhibits Huh7cancer cell growth via cell cycle arrest and apoptosisin vitro and in vivo,” Scientific Reports, vol. 5, no. 1, article16185, 2015.
[74] S. K. L. Ong, M. K. Shanmugam, L. Fan et al., “Focus onformononetin: anticancer potential and molecular targets,”Cancers, vol. 11, no. 5, p. 611, 2019.
[75] T. Rossé, R. Olivier, L. Monney et al., “Bcl-2 prolongs cell sur-vival after Bax-induced release of cytochrome c,” Nature,vol. 391, no. 6666, pp. 496–499, 1998.
[76] J. Terzić, S. Grivennikov, E. Karin, and M. Karin, “Inflamma-tion and colon cancer,” Gastroenterology, vol. 138, no. 6,pp. 2101–2114.e5, 2010.
[77] Y. Xia, S. Shen, and I. M. Verma, “NF-κB, an active player inhuman cancers,” Cancer Immunology Research, vol. 2, no. 9,pp. 823–830, 2014.
[78] A. M. Manicone and J. K. McGuire, “Matrix metalloprotein-ases as modulators of inflammation,” Seminars in Cell andDevelopmental Biology, vol. 19, no. 1, pp. 34–41, 2008.
[79] E. Panieri and M. M. Santoro, “ROS homeostasis and metabo-lism: a dangerous liason in cancer cells,” Cell Death and Dis-ease, vol. 7, no. 6, article e2253, 2016.
[80] M. Giorgio, M. Trinei, E. Migliaccio, and P. G. Pelicci, “Hydro-gen peroxide: a metabolic by-product or a common mediatorof ageing signals?,” Nature Reviews Molecular Cell Biology,vol. 8, no. 9, pp. 722–728, 2007.
[81] M. A. Khan, H.-c. Chen, X.-x. Wan et al., “Regulatory effects ofresveratrol on antioxidant enzymes: a mechanism of growthinhibition and apoptosis induction in cancer cells,” Moleculesand Cells, vol. 35, no. 3, pp. 219–225, 2013.
[82] S. C. Wang, “PCNA: a silent housekeeper or a potential thera-peutic target?,” Trends in Pharmacological Sciences, vol. 35,no. 4, pp. 178–186, 2014.
24 Oxidative Medicine and Cellular Longevity