Embed Size (px)
Citation preview

Landscape Ecology & Ecosystem ScienceMichigan State UniversityEmail: [email protected]
July 31, 2021School of Geographical Sciences, Southwest University, Chongqing
The 17th USCCC Annual Meeting
Deep Learning and Flux Predictions: A New Frontier for USCCC
Jiquan Chen
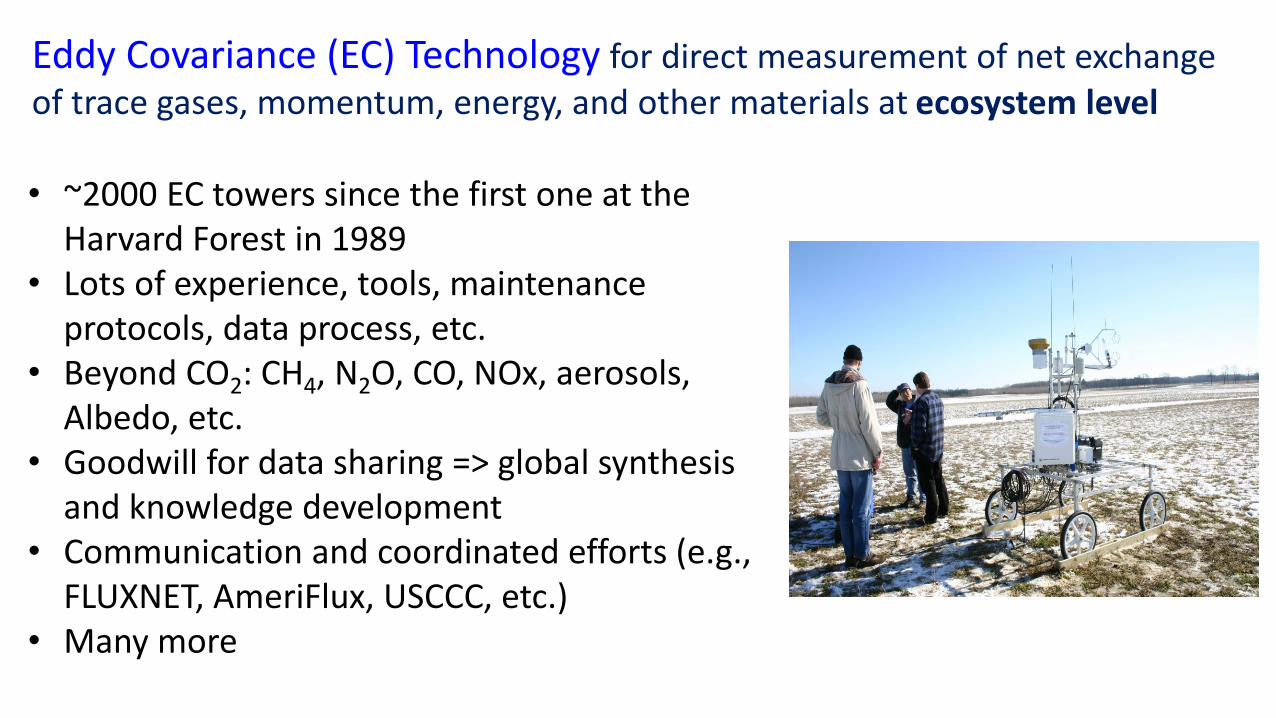
Eddy Covariance (EC) Technology for direct measurement of net exchange of trace gases, momentum, energy, and other materials at ecosystem level
• ~2000 EC towers since the first one at the Harvard Forest in 1989
• Lots of experience, tools, maintenance protocols, data process, etc.
• Beyond CO2: CH4, N2O, CO, NOx, aerosols, Albedo, etc.
• Goodwill for data sharing => global synthesis and knowledge development
• Communication and coordinated efforts (e.g., FLUXNET, AmeriFlux, USCCC, etc.)
• Many more
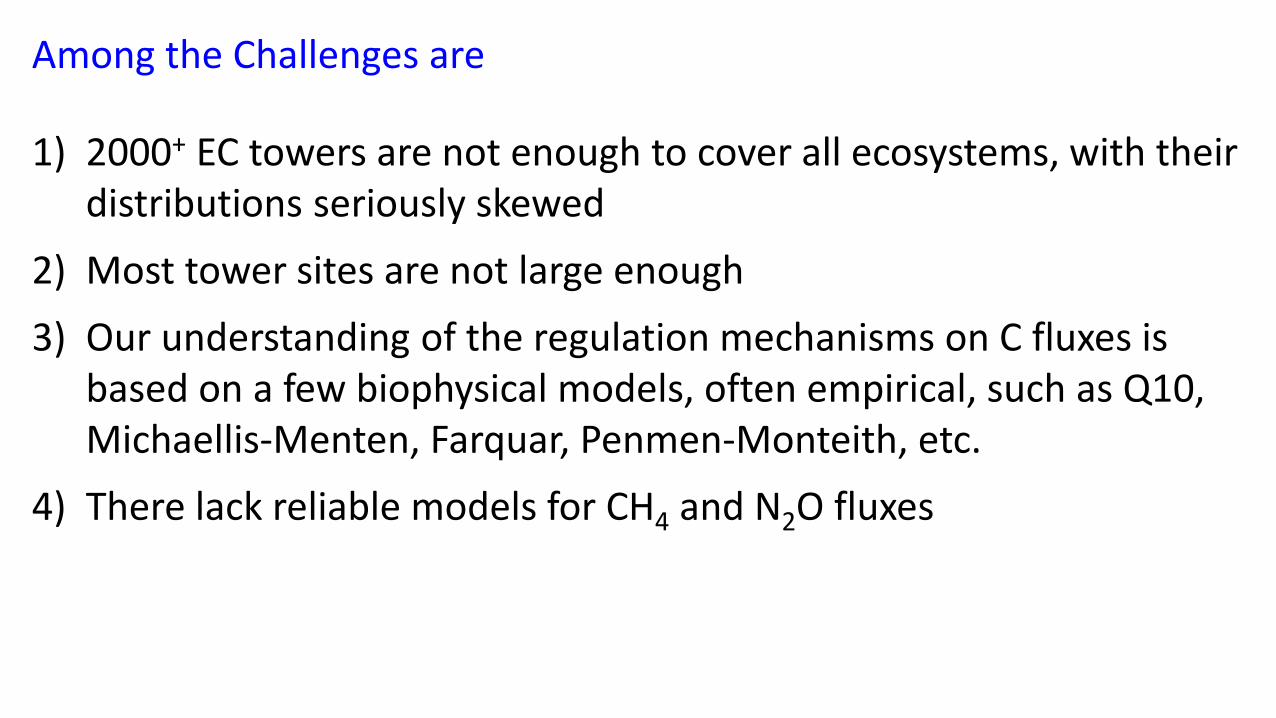
Among the Challenges are
1) 2000+ EC towers are not enough to cover all ecosystems, with their distributions seriously skewed
2) Most tower sites are not large enough
3) Our understanding of the regulation mechanisms on C fluxes is based on a few biophysical models, often empirical, such as Q10, Michaellis-Menten, Farquar, Penmen-Monteith, etc.
4) There lack reliable models for CH4 and N2O fluxes

Among the Challenges are
• 2000+ EC towers are not enough to cover all ecosystems, with their distributions seriously skewed
https://fluxnet.org/sites/site-summary/
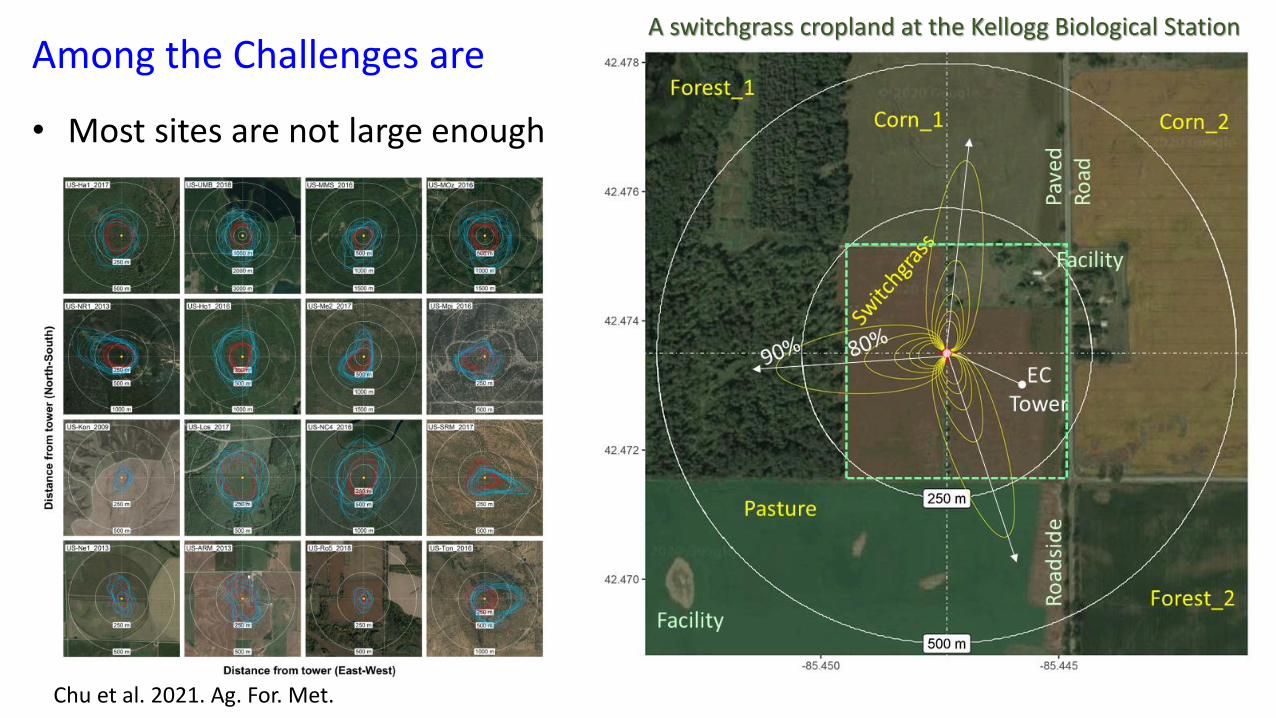
Among the Challenges are
Chu et al. 2021. Ag. For. Met.
• Most sites are not large enough
A switchgrass cropland at the Kellogg Biological Station
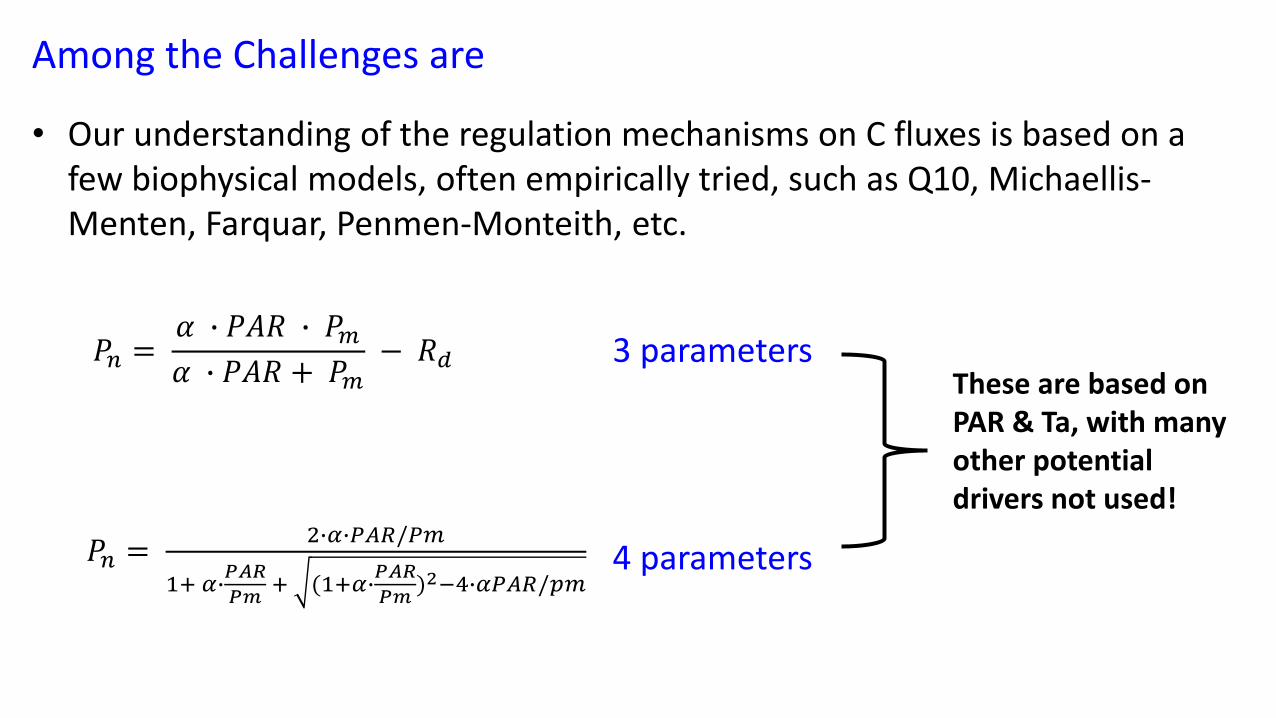
Among the Challenges are
• Our understanding of the regulation mechanisms on C fluxes is based on a few biophysical models, often empirically tried, such as Q10, Michaellis-Menten, Farquar, Penmen-Monteith, etc.
𝑃𝑛 =𝛼 ∙ 𝑃𝐴𝑅 ∙ 𝑃𝑚𝛼 ∙ 𝑃𝐴𝑅 + 𝑃𝑚
− 𝑅𝑑
𝑃𝑛 =2∙𝛼∙𝑃𝐴𝑅/𝑃𝑚
1+ 𝛼∙𝑃𝐴𝑅
𝑃𝑚+ (1+𝛼∙
𝑃𝐴𝑅
𝑃𝑚)2−4∙𝛼𝑃𝐴𝑅/𝑝𝑚
3 parameters
4 parameters
These are based on PAR & Ta, with many other potential drivers not used!
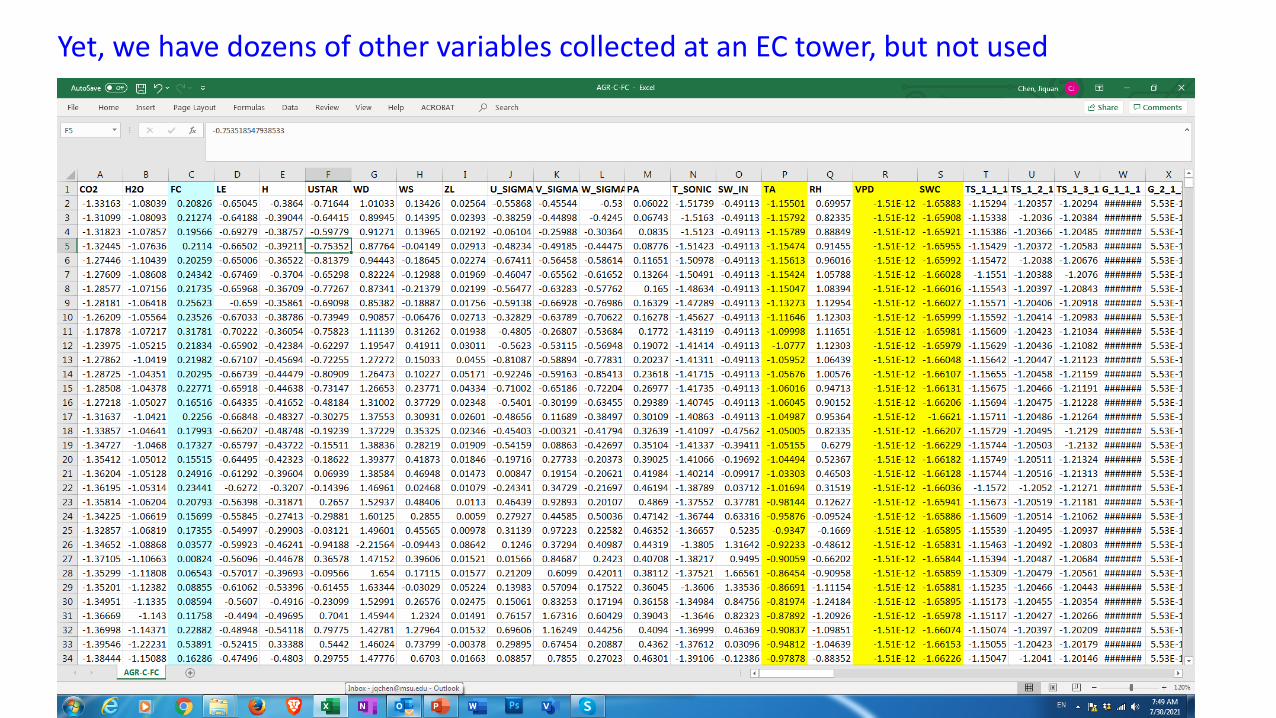
Yet, we have dozens of other variables collected at an EC tower, but not used
Among the Challenges are
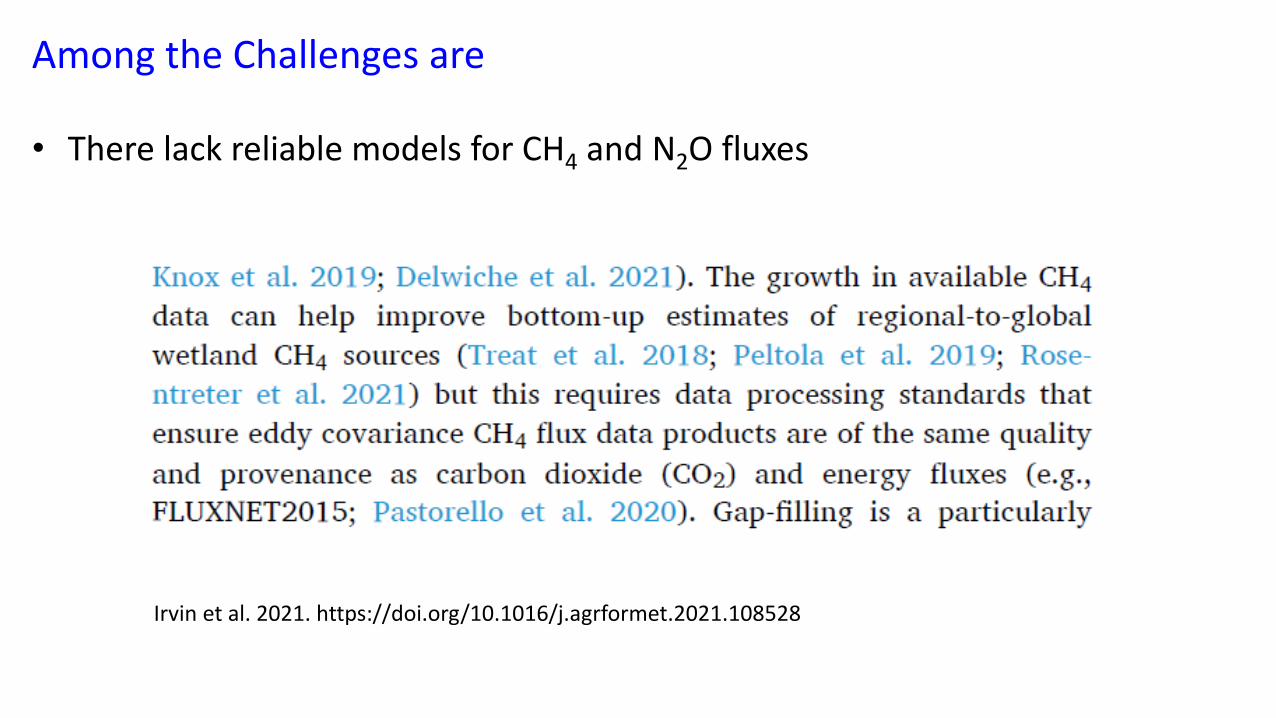
• There lack reliable models for CH4 and N2O fluxes
Irvin et al. 2021. https://doi.org/10.1016/j.agrformet.2021.108528
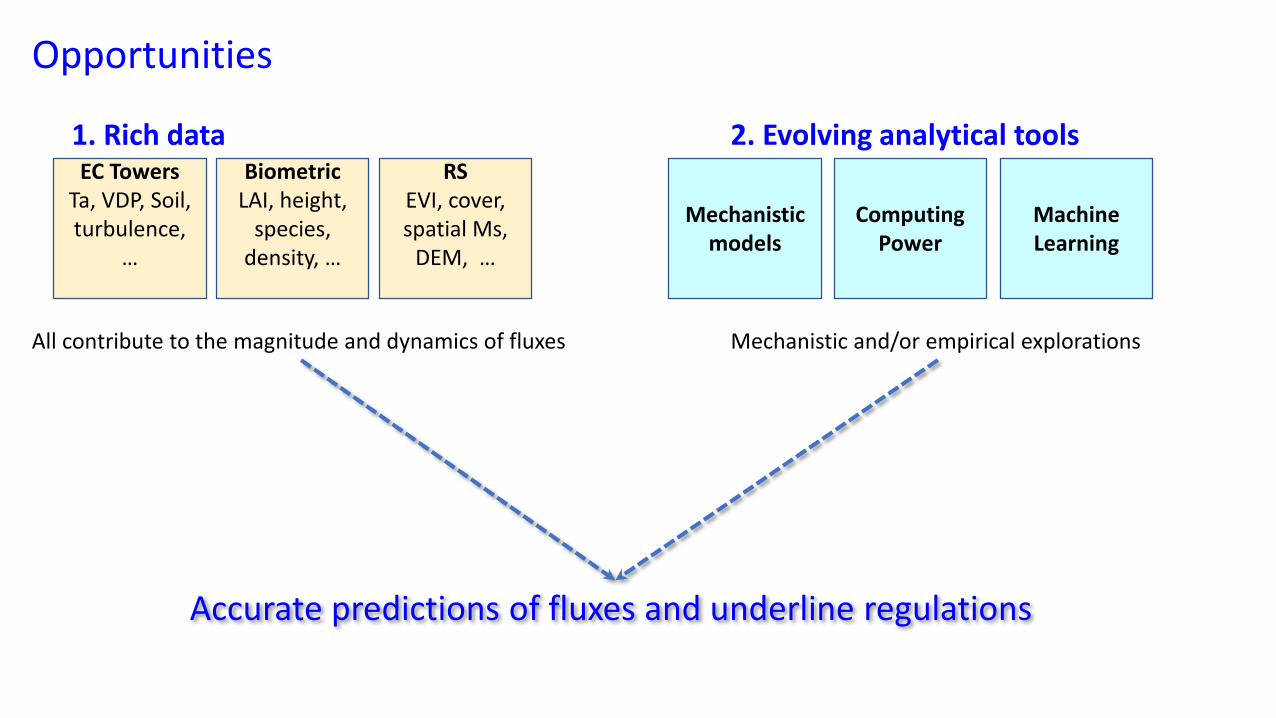
Opportunities
1. Rich dataEC Towers
Ta, VDP, Soil, turbulence,
…
BiometricLAI, height,
species, density, …
RSEVI, cover, spatial Ms,
DEM, …
2. Evolving analytical tools
Mechanistic models
ComputingPower
Machine Learning
All contribute to the magnitude and dynamics of fluxes Mechanistic and/or empirical explorations
Accurate predictions of fluxes and underline regulations
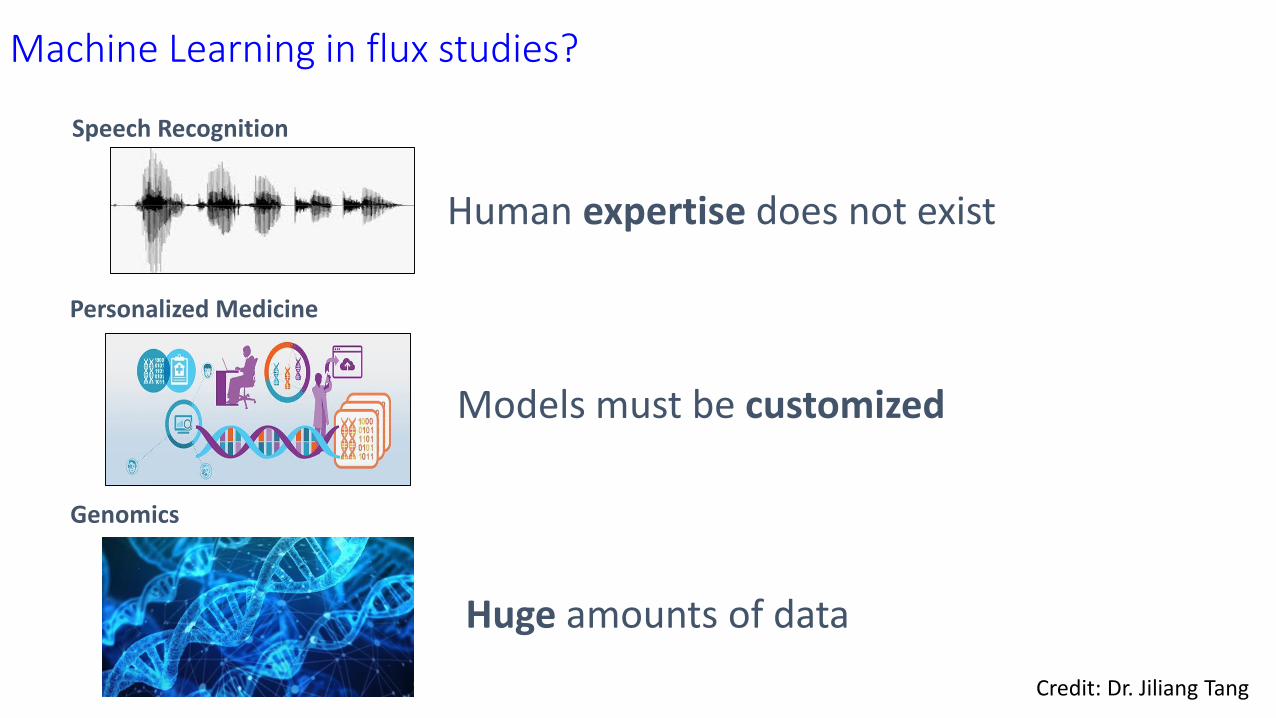
Machine Learning in flux studies?
Speech Recognition
Human expertise does not exist
Personalized Medicine
Models must be customized
Genomics
Huge amounts of data
Credit: Dr. Jiliang Tang

The fundamental concept of Machine Learning (ML) in flux studies
All bio-physical variables are responsible, at various degrees, for the magnitude and dynamics of fluxes, with known or unknown mechanisms.
Complex tasks Continuously updated
Credit: Dr. Jiliang Tang
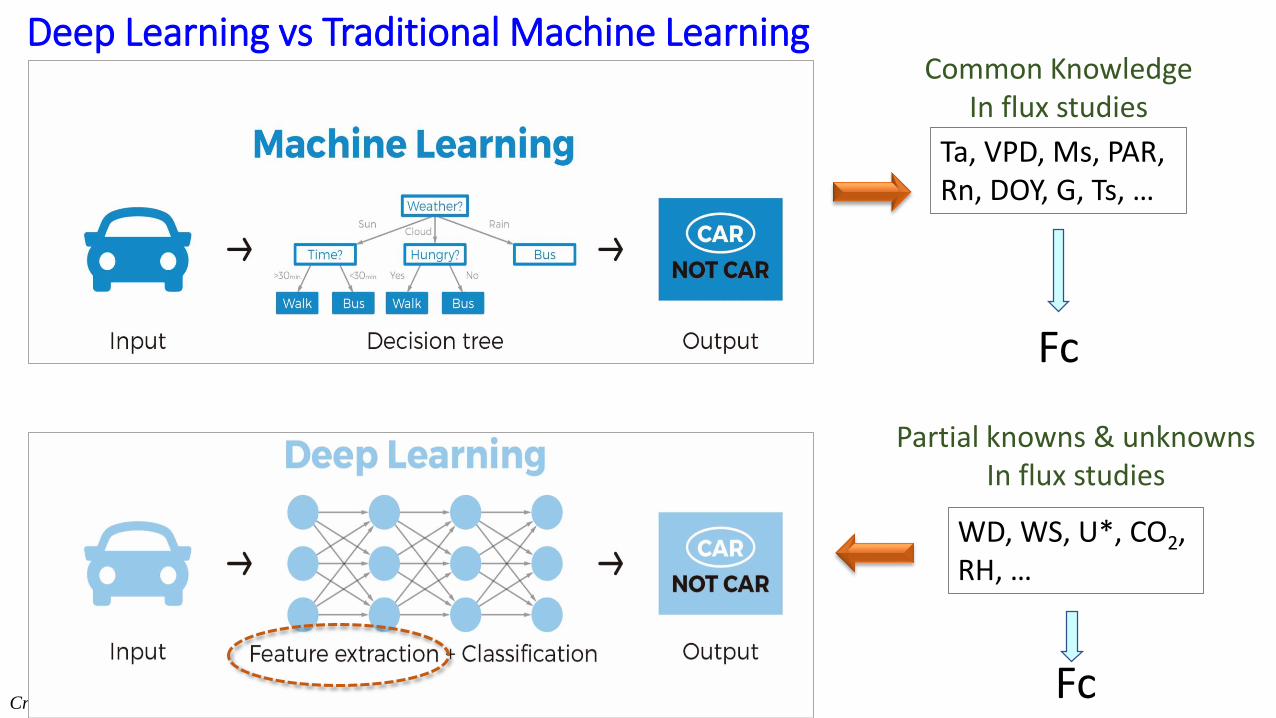
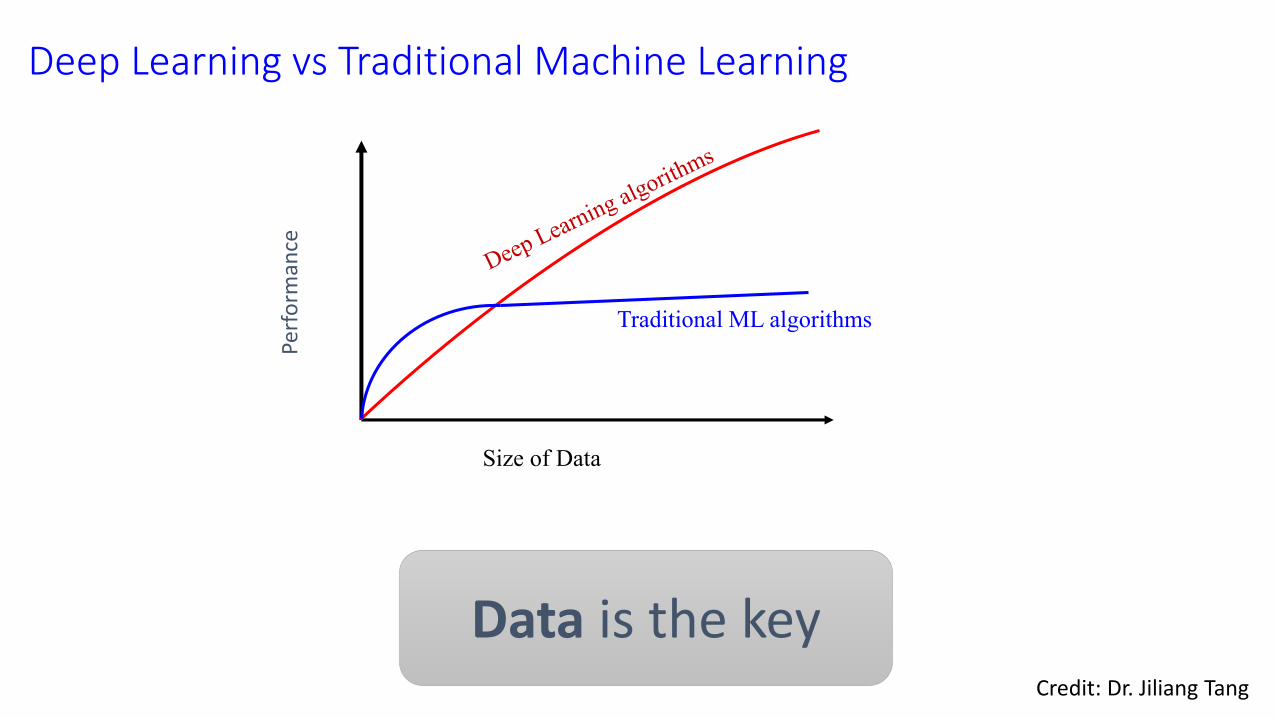
Deep Learning vs Traditional Machine Learning
Credit: Dr. Jiliang Tang
Partial knowns & unknownsIn flux studies
WD, WS, U*, CO2, RH, …
Fc
Common KnowledgeIn flux studies
Ta, VPD, Ms, PAR, Rn, DOY, G, Ts, …
Fc
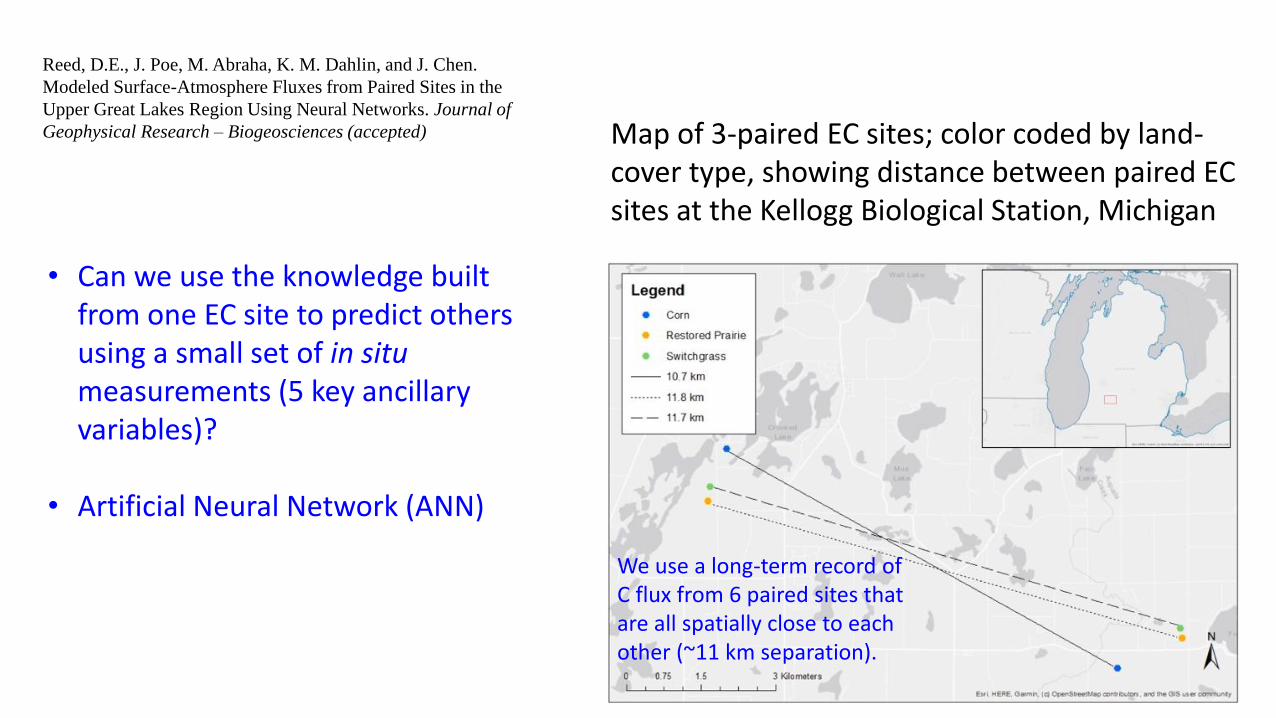
Map of 3-paired EC sites; color coded by land-cover type, showing distance between paired EC sites at the Kellogg Biological Station, Michigan
• Can we use the knowledge built from one EC site to predict others using a small set of in situ measurements (5 key ancillary variables)?
• Artificial Neural Network (ANN)
Reed, D.E., J. Poe, M. Abraha, K. M. Dahlin, and J. Chen.
Modeled Surface-Atmosphere Fluxes from Paired Sites in the
Upper Great Lakes Region Using Neural Networks. Journal of
Geophysical Research – Biogeosciences (accepted)
We use a long-term record of C flux from 6 paired sites that are all spatially close to each other (~11 km separation).
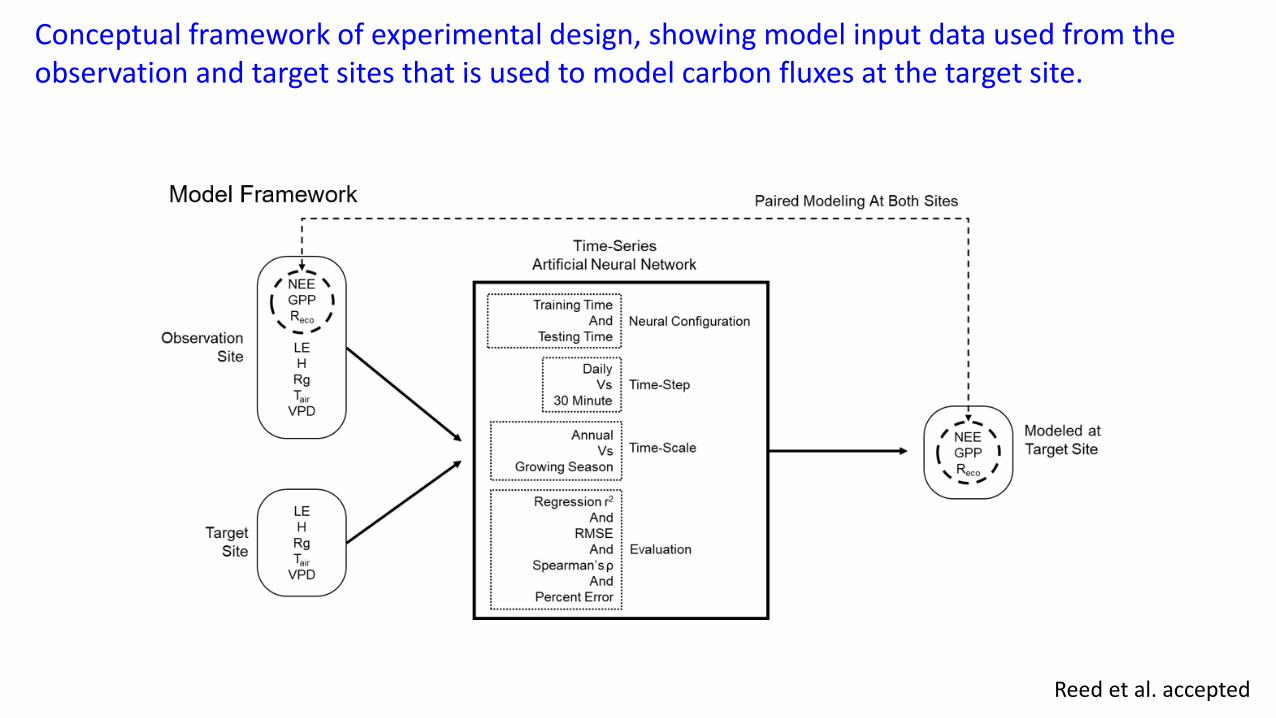
Conceptual framework of experimental design, showing model input data used from the observation and target sites that is used to model carbon fluxes at the target site.
Reed et al. accepted
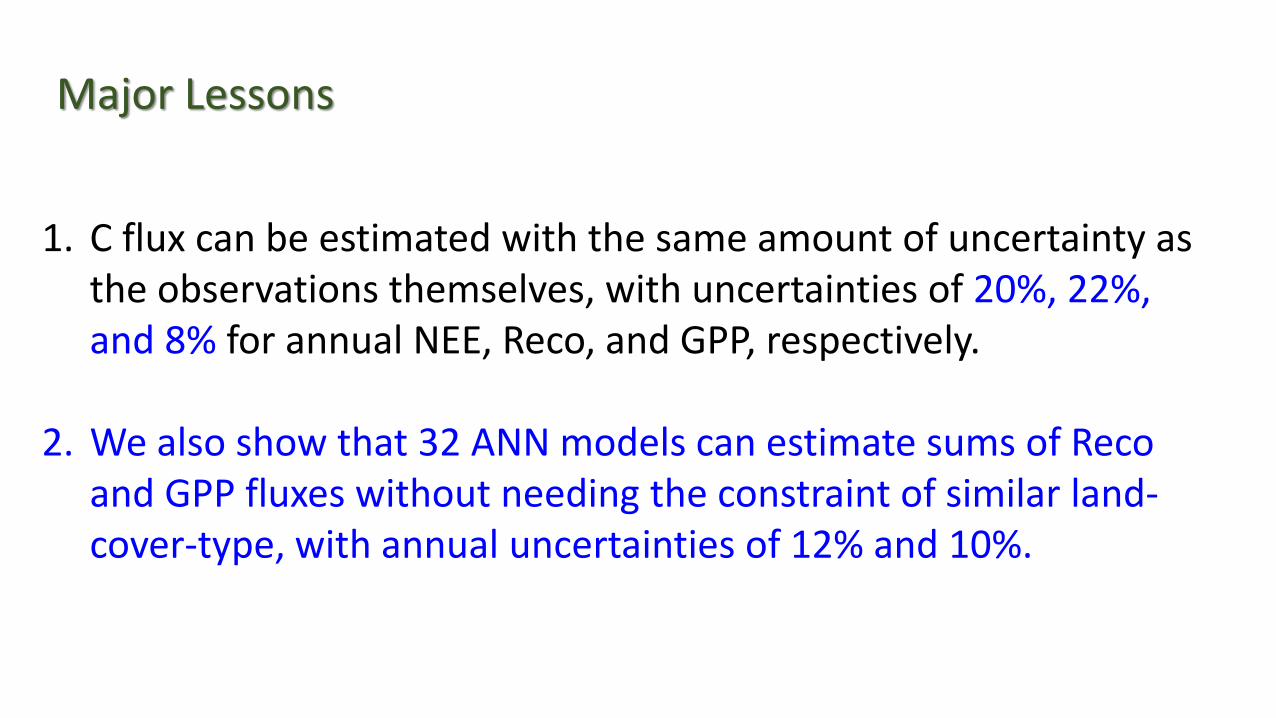
1. C flux can be estimated with the same amount of uncertainty as the observations themselves, with uncertainties of 20%, 22%, and 8% for annual NEE, Reco, and GPP, respectively.
2. We also show that 32 ANN models can estimate sums of Reco and GPP fluxes without needing the constraint of similar land-cover-type, with annual uncertainties of 12% and 10%.
Major Lessons

EC towers provide multiple time series data of dozens variables
Reed et al. accepted
• Does the snow fall from last winter matter for current NEP?
• Would a rain pulse last week be important for present photosynthesis?
• Are heatwaves in the spring affecting growing season NEP?
Chile's Atacama desert: World's driest place in bloom after surprise rain -- BBC
https://www.bbc.com/news/world-latin-america-41021774
Recurrent Neural
Network (RNN)
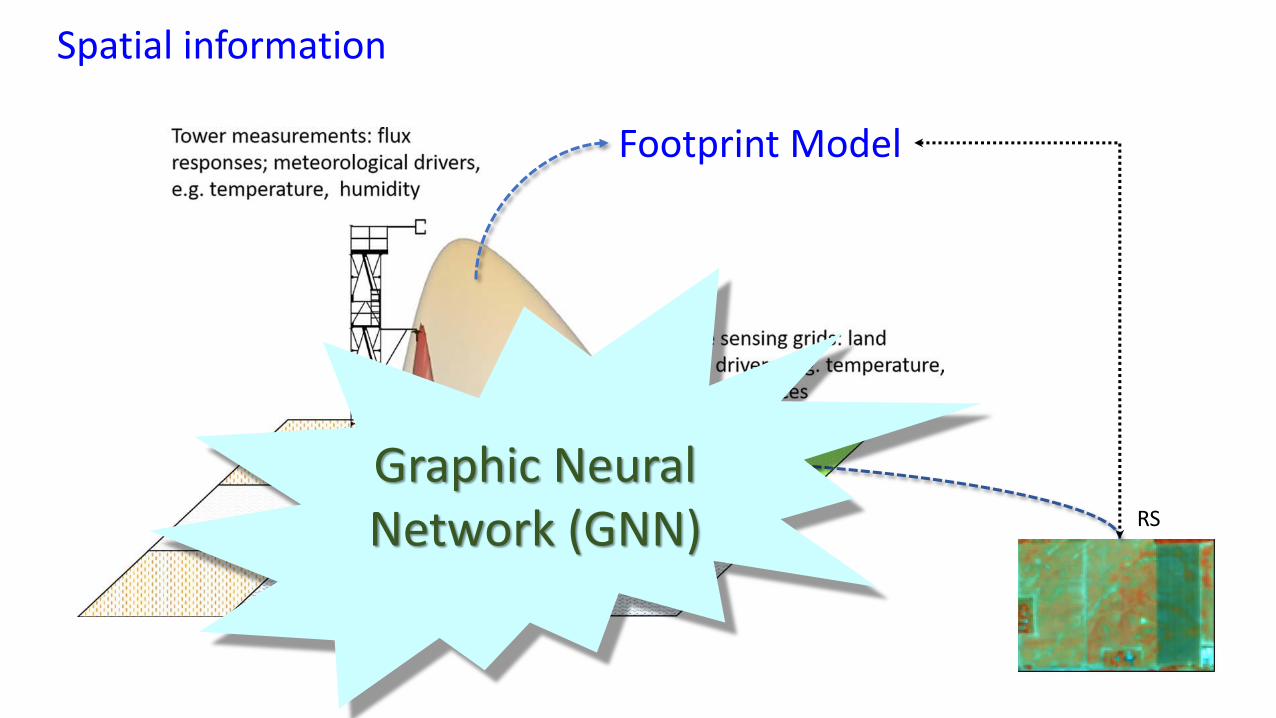
RS
Footprint Model
Spatial information
Graphic Neural Network (GNN)

-60
-40
-20
0
20
-60 -50 -40 -30 -20 -10 0 10 20 30
R2 = 0.67MAE = 3.22RSME = 5.53Slope = 0.65
Measured Fc
Pre
dic
ted
Fc
[MM + Q10] model
-60
-40
-20
0
20
-70 -50 -30 -10 10 30
R2 = 0.92MAE = 0.05RSME = 2.05Slope = 0.88
Measured Fc
Pre
dic
ted
Fc
RNN model
Predictions based on conventional “biophysical models” and recurrent neural network (RNN) at an agricultural land in KBS
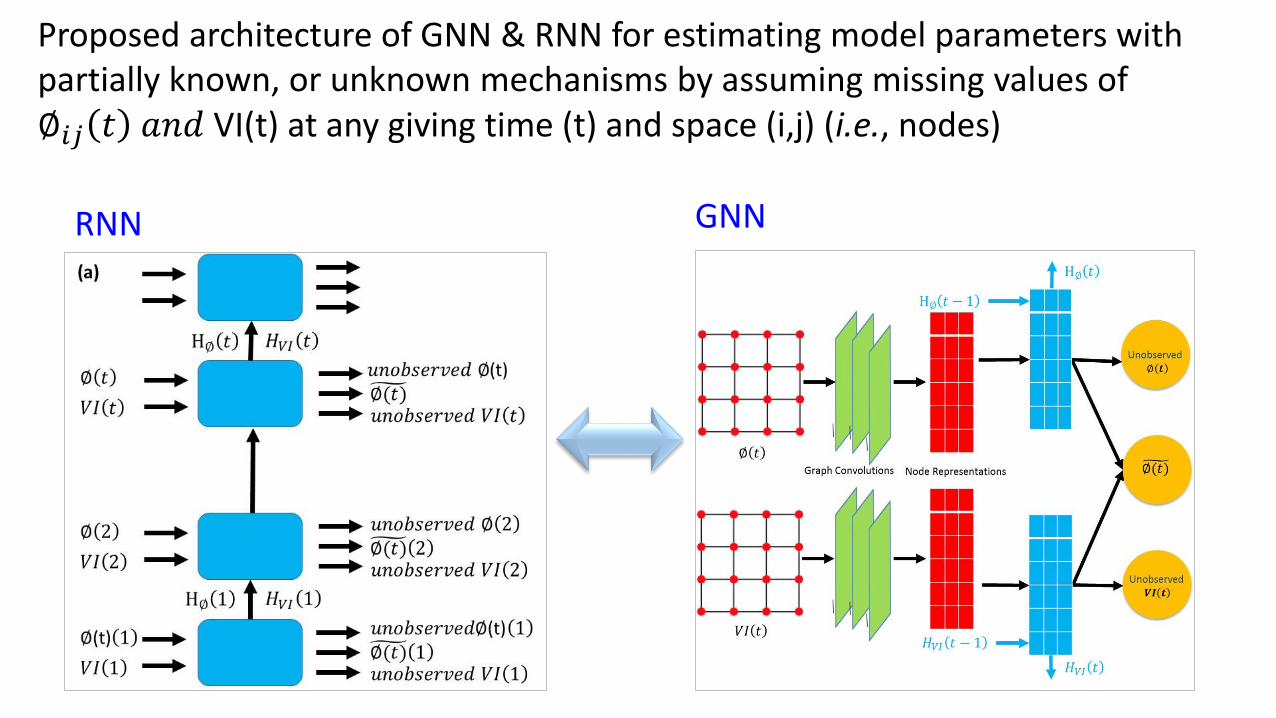
Proposed architecture of GNN & RNN for estimating model parameters with partially known, or unknown mechanisms by assuming missing values of ∅𝑖𝑗 𝑡 𝑎𝑛𝑑 VI(t) at any giving time (t) and space (i,j) (i.e., nodes)
RNN GNN
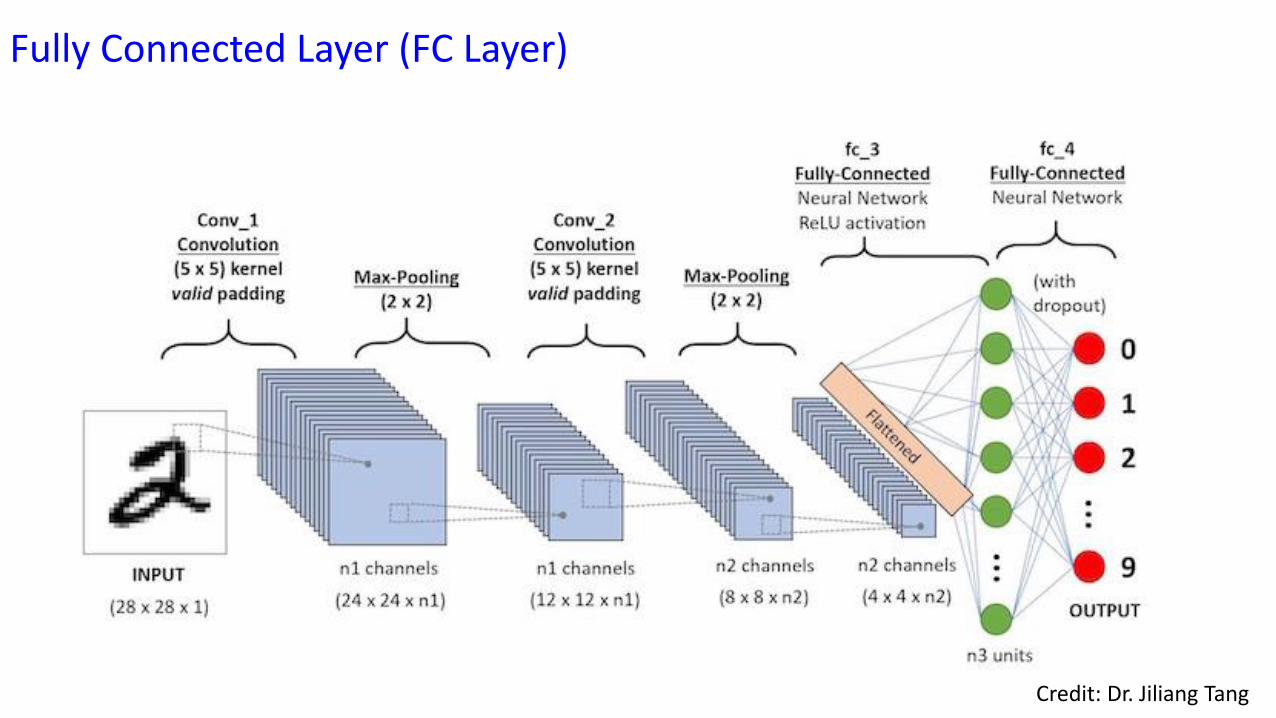
Fully Connected Layer (FC Layer)
Credit: Dr. Jiliang Tang
RS Imagetime series
𝐹𝑐𝑠𝒕 =[𝑃𝑖𝑗 (𝑡) ∙ 𝐹𝑐(𝑖𝑗)
𝑃(𝒕)]𝐹𝑐
𝑠(t)
∅𝒊𝒋…𝑭𝒄(𝒊𝒋) = 𝑓(𝑉𝐼𝑖𝑗) ∙ 𝑓(∅𝒊𝒋)
Independent field data
𝐹𝑐(𝑖𝑗)𝑃 𝑡 , ∅𝒊𝒋 𝒕 , …
Landscape C fluxes(෪𝑭𝒄𝑳) (Task 1)
HLS
EC toweruncertainty
෫𝑭𝒄(𝒊𝒋)𝑷 (𝒕)
𝑃𝑖𝑗(𝑡)covertype
Validation
turbulentprocesses
Footprintmodeling
validation
ecosystemprocesses
VIs LAI, SIF, LST, …
𝐹𝑐(𝑖𝑗)𝑃 𝑡
𝑭𝒄(𝒕)]
T2.5
T2.4
T2.3
T2.2
T2.1
෫𝑭𝒄𝑺(𝒕)
෪𝑭𝒄𝑺 𝑡 =𝐹𝑐 𝑖𝑗 𝑡 =𝑓(𝑉𝐼𝑖𝑗 𝑡 ) ∙ 𝑓(∅𝒊𝒋(𝑡))
Scale-resolved C flux
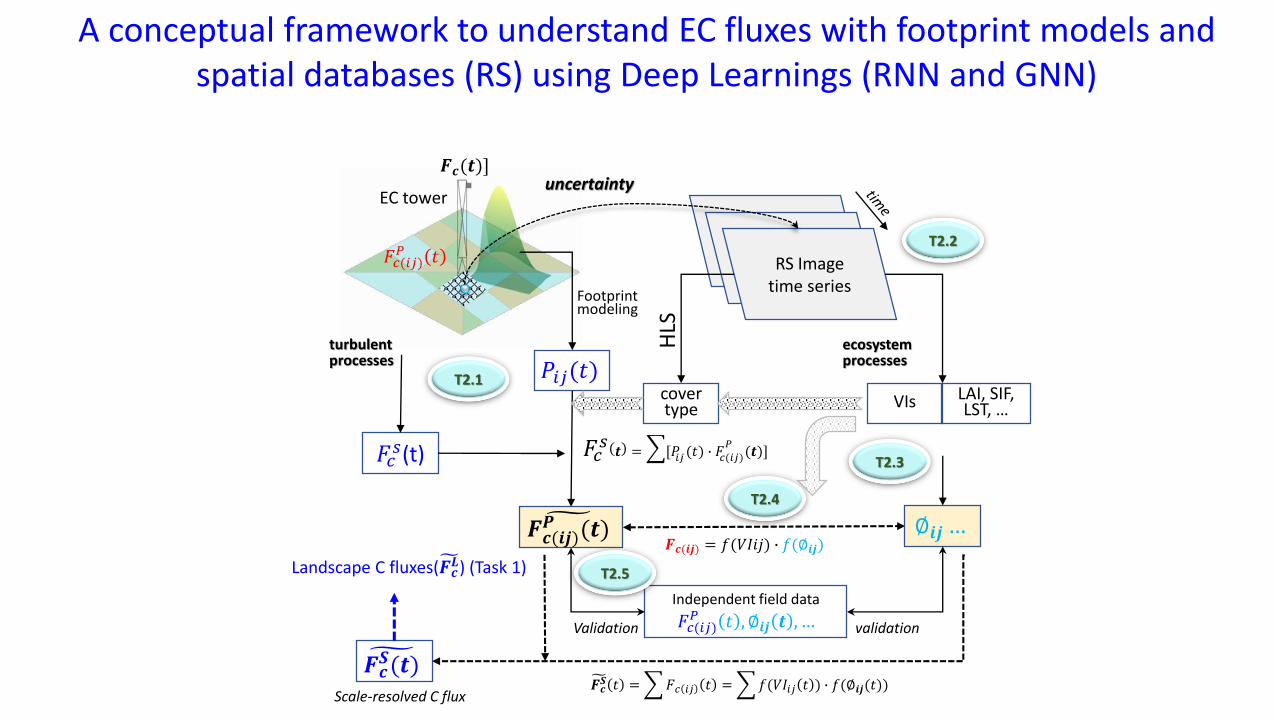
A conceptual framework to understand EC fluxes with footprint models and spatial databases (RS) using Deep Learnings (RNN and GNN)
In sum,
More details at1) LEES Webpage:
http://lees.geo.msu.edu/
1) Recent publication: https://scholar.google.com/citations?user=fv8umPcAAAAJ&hl=en&oi=ao
Questions?
Integrating time series of multiple variables (RNN) and spatial data (GNN) of various resolutions is a promising direction in flux studies (gap filling,
predictions, regional applications).
Deep Learning vs Traditional Machine Learning
Size of Data
Perf
orm
ance
Traditional ML algorithms
Data is the keyCredit: Dr. Jiliang Tang