Embed Size (px)
Citation preview

Deep learning for detecting pulmonary tuberculosis via chest radiography: an international study across 10 countries
Authors
Sahar Kazemzadeh1†, Jin Yu1†, Shahar Jamshy1†, Rory Pilgrim1, Zaid Nabulsi1, Christina Chen1, Neeral
Beladia1, Charles Lau2, Scott Mayer McKinney1, Thad Hughes1, Atilla Kiraly1, Sreenivasa Raju
Kalidindi3, Monde Muyoyeta4, Jameson Malemela5, Ting Shih6, Greg S. Corrado1, Lily Peng1, Katherine
Chou1, Po-Hsuan Cameron Chen1, Yun Liu1*, Krish Eswaran1, Daniel Tse1*, Shravya Shetty1‡, Shruthi
Prabhakara1‡
Affiliations
1 Google Health, Palo Alto, CA, USA 2 Work done at Google via Advanced Clinical, Deerfield, IL, USA 3 Apollo Radiology International, Hyderabad, India 4 TB department, Center of Infectious Disease Research in Zambia, Lusaka, Zambia 5 Sibanye Stillwater, Weltevreden Park, Roodepoort, South Africa 6 Clickmedix, Gaithersburg, MD, USA † equal contributions ‡ equal contributions
*Address correspondence to: [email protected], [email protected]
Abstract
Purpose: Tuberculosis (TB) is one of the top 10 causes of death worldwide and disproportionately
affects low-to-middle-income-countries. Though the WHO recommends chest radiographs (CXRs) to
facilitate TB screening efforts and the means of acquiring CXRs are generally accessible, expertise in
CXR interpretation poses a challenge to broad implementation of TB screening efforts in many parts of
the world. To help mitigate this challenge, we developed a generalizable deep learning system (DLS) to
help detect active TB and compared its performance to 14 radiologists, from both endemic (India) and
non-endemic (US) practice settings.
Materials and Methods: We trained a DLS using CXRs from 9 countries spanning Africa, Asia, and
Europe. To improve generalization, we incorporated large-scale CXR pretraining, attention pooling, and
semi-supervised learning via “noisy student”. The DLS was evaluated on a combined test set spanning
sites in China, India, US, and Zambia, with all positives confirmed via microbiology or nucleic acid
amplification testing (NAAT). The India test set was independent of those used in training. Another
independent test set from a mining population in South Africa was also used to further evaluate the
model. Given WHO targets of 90% sensitivity and 70% specificity, the DLS’s operating point was
prespecified to favor sensitivity over specificity.
Results: Across the combined test set spanning 4 countries, the DLS’s receiver operating
characteristic (ROC) curve was above all 9 India-based radiologists (where TB is endemic), with an
area under the curve (AUC) of 0.90 (95%CI 0.87-0.92). At the prespecified operating point, the DLS’s
sensitivity (88%) was higher than the India-based radiologists (mean sensitivity: 75%, range 69-87%,
p<0.001 for superiority), and the DLS’s specificity (79%) was non-inferior to these radiologists (mean
specificity: 84%, range 78-88%, p=0.004). Similar trends were observed within HIV positive and sputum
smear positive sub-groups, and in the additional South Africa test set. We additionally found that 5 US-
based radiologists (where TB is not endemic) who also reviewed the cases were more sensitive but
less specific than the India-based radiologists. The DLS was similarly non-inferior to this second cohort
of radiologists at the same prespecified operating point. Depending on the simulated setting and
prevalence, use of the DLS as a prioritization tool for NAAT could reduce the cost per positive TB case
detected by 40-80% compared to the use of NAAT alone.
Conclusion: We developed a DLS to detect active pulmonary TB on CXRs, which generalized to
patient populations from 5 different regions of the world, and merits prospective evaluation to assist
cost-effective screening efforts in settings with scarce access to radiologists. Operating point flexibility
may permit customization of the DLS to account for site-specific factors such as TB prevalence,
demographics, clinical resources, and customary practice patterns.
Introduction Globally, 1 in 4 people are infected with Mycobacterium tuberculosis, and 5-10% of these individuals
will develop active tuberculosis (TB) disease in their lifetime1,2. In 2019, the estimated TB mortality was
1.4 million, including 200,000 people who were human immunodeficiency virus (HIV) positive, and an
estimated 2.9 million people who contracted TB were not formally reported due to a combination of
underreporting, underdiagnosis, and pretreatment loss to follow up. Almost 90% of the active TB cases
occur in a few dozen “high-burden” countries, many with scarce resources needed to tackle this public
health problem.3 The anticipated rising burden of drug resistant TB poses an increased threat to both
endemic and non-endemic parts of the world.4 Lastly, the COVID-19 pandemic that has caused
devastation around the world has also disrupted efforts to combat TB: globally, 21% fewer (1.4 million)
people received care for TB in 2020 than in 2019.5
In the past decade, there has been steady global support to combat this health crisis through the World
Health Organization (WHO)’s End TB Strategy, the United Nations (UN)’s Sustainable Development
Goals, and the Global Fund to fight AIDS, TB and malaria.6 Cost effective pulmonary TB screening
using CXR has the potential to increase equity in access to healthcare, particularly in difficult-to-reach
populations.7 In light of high patient volumes and limited access to timely expert interpretation of CXRs
in many regions, there has been active research into using artificial intelligence to screen with a CXR
followed by a corroborating diagnostic test;8–20,21 Such artificial intelligence-based triaging followed by
GeneXpert testing for a confirmatory diagnosis was shown to be cost-effective compared to GeneXpert
alone, and also substantially increased patient throughput.13 As part of their recently-published 2021
guidance, the WHO evaluated three independent computer-aided detection (CAD) software systems,
and determined that the diagnostic accuracy and performance of CAD software was similar to human
readers.7,9,13,17 Given the scarcity of experienced readers, as an alternative to human interpretation of
CXR, the WHO now recommends CAD for both screening and triage in individuals 15 years or older.7
However, the WHO emphasized the importance of using a performant CAD system that has been
tested on a population that is representative of the target population.
In this study, we developed a deep learning system (DLS) to interpret CXRs for imaging features of
active TB. Developing a universal TB classifier can be challenging - not only due to the array of
potential imaging features - but because prevailing imaging features, severity of disease at
presentation, and prevalence of TB and HIV can differ broadly on locale. Therefore, we validated our
DLS using an aggregate of datasets from China, India, US, and Zambia that together reflect different
regions, race/ethnicities, and local disease prevalence. We evaluated the DLS under two conditions:
having a single prespecified operating point across all datasets, and when customized to radiologists’
performance in each locale. As diagnostic performance may be influenced by disease prevalence, we
compared the DLS with two different cohorts of radiologists: one based in a TB-endemic region (India)
and one based in a TB non-endemic region (United States). An analysis of HIV positive and sputum
smear positive subgroups was also performed. Finally, we estimate cost savings for using this DLS as
a triaging solution for nucleic acid amplification testing (NAAT) in screening settings.
Methods
Datasets For this work, we leveraged de-identified CXR images from multiple datasets spanning 9 countries for
training and 4 countries for validating the DLS, for a total of 10 countries (Table 1). Our DLS was
trained using 160,187 images from Europe22 (Azerbaijan, Belarus, Georgia, Moldova, Romania), India,
and South Africa, and tuned using 3,258 images from China16,23,24, India, and Zambia25. Additionally, we
used 550,297 images26,27 for pretraining purposes (10,310 of which overlapped with the train sets and
none of which overlapped with the tune sets), and 138 images with labeled lung segmentation masks
from the US dataset for training and tuning of the lung cropping model. We then validated the DLS
using 1,262 images from China16,23, India, US16,23, and Zambia, and 1040 images from South Africa,
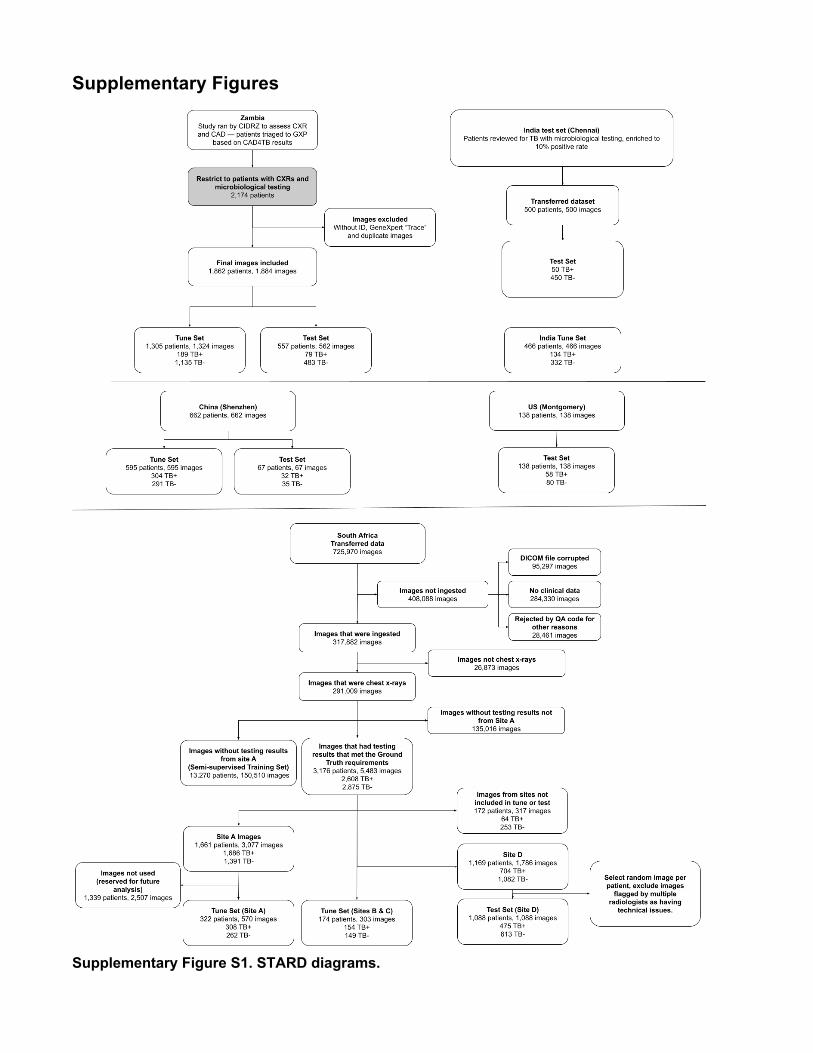
using 1 image per patient in both cases. Additional details including inclusion/exclusion criteria,
enrichment, and reference standard are presented in Supplementary Figure S1 and Supplementary
Table S1. This retrospective study was approved by the respective Ethics Committee or Institutional
Review Board at each participating institution and all data were de-identified prior to transfer.
Reference standard for TB status For all test and tune datasets, the positive TB status were confirmed via microbiology (sputum culture
or sputum smear) or NAAT (GeneXpert MTB/RIF, Cepheid, Sunnyvale, CA); see Table 1 and
Supplementary Table S1. On the train datasets, the reference standard varied due to site-specific
practice differences and data availability, including microbiology, radiologist interpretation, clinical
diagnoses (based on medical history and imaging), and NAAT.
Deep Learning System
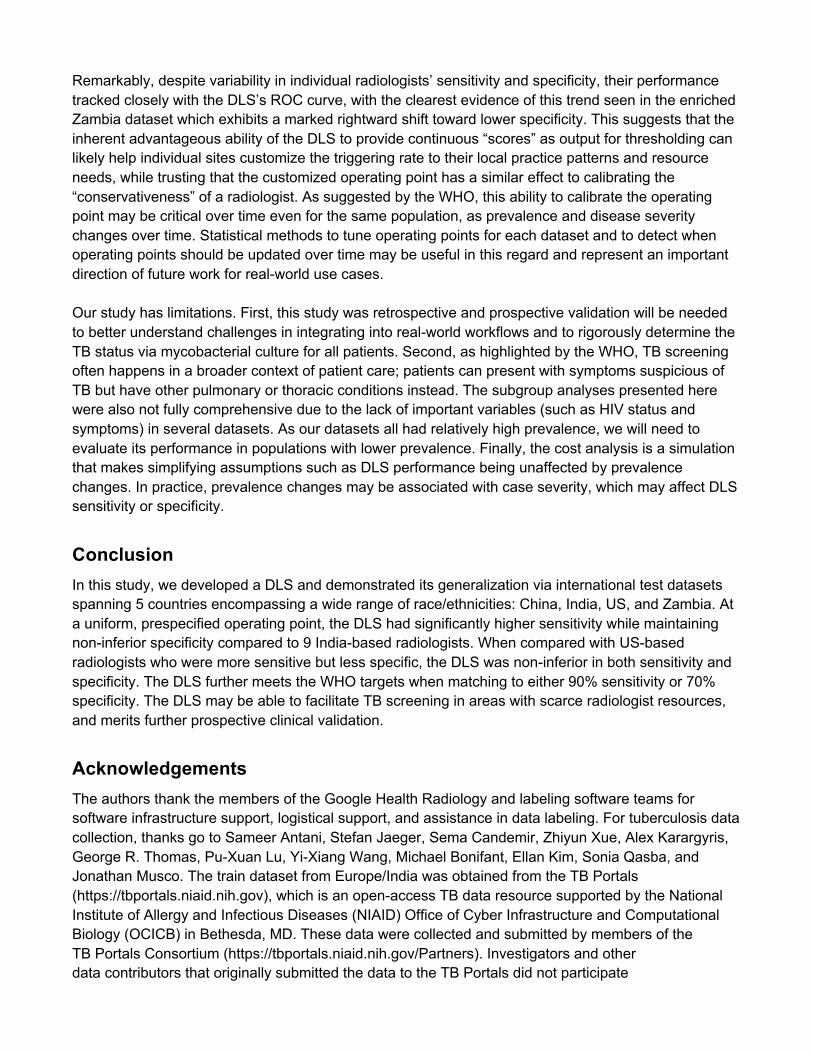
Deep Learning System Architecture We developed a DLS to detect evidence of active pulmonary TB on CXRs. The system consists of
three modules: a lung cropping model for identifying a bounding box spanning the lungs, a detection
model for identifying regions containing possible imaging features of active tuberculosis (nodules,
airspace opacities with cavitation, airspace opacities without cavitation, pleural effusion, granulomas,
and fibroproductive lung opacities), and a classification model that takes the output from both the
segmentation model and the detection model to predict the likelihood of the CXR being TB positive
(Figure 1).
For the lung cropping model, we used Mask RCNN28 with a ResNet-101-FPN29 feature extractor to train
for both pixel-level segmentation and bounding boxes as outputs. We then cropped each CXR using
the model’s output bounding box enclosing the lungs as the input for the classification model. For the
detection model, we used a Single Shot MultiBox Detector (SSD)30 to create bounding boxes around
potential TB-relevant imaging features. Based on the predicted bounding boxes, a probabilistic
attention mask was calculated as the final pooling layer in the classification model. For the classification
model, we combined an EfficientNet-B731 pre-trained on classifying CXRs as normal or abnormal27 with
an attention pooling layer and a fully-connected layer. The attention pooling layer utilizes the
probabilistic attention mask generated from the detection model to perform a weighted average of the
feature maps before feeding to the final fully connected layer. The classification model classifies CXRs
into 1 of 3 classes: TB-positive, TB-negative but abnormal, and normal. We took the prediction score
for TB-positive class as the output prediction for all TB-related analysis.
Deep Learning System Training Training the individual components of the DLS described above is a multi-step process (Figure 1). First,
we trained the lung cropping model using lung segmentation masks from the US dataset of 138 images
with 80% used for training and 20% used for tuning. To train the detection model, radiologists
annotated 9,871 bounding boxes around TB-indicative abnormalities (nodules, airspace opacities with
cavitation, airspace opacities without cavitation, pleural effusion, granulomas, lymphadenopathy, and
fibroproductive lung opacities). Both the detection and classification models were trained using the
Europe dataset and the two India train datasets. Due to the limited amount of labeled data, we used the
noisy-student32 semi-supervised learning approach to leverage a much larger set of unlabeled data.
Specifically, we obtained “noisy” TB labels by running inference using the initial version of the DLS on
the South Africa train dataset with more than 150,000 unlabeled CXRs. These data with generated
labels were combined with the original dataset to train 6 classification models, which were then
ensembled by taking the mean of the scores.
For the detection model, we used a dropout keep probability of 0.99, and augmentation included
random cropping, rotation, flipping, jitter on the bounding boxes, multi-scale anchors, and a box
matcher with intersection-over-union. For the classification model, we applied dropout, with a dropout
keep probability of 0.5. Furthermore, we applied data augmentation such as horizontal flipping, random
shears, and random deformations. All hyperparameters were selected based on empirical performance
on the tune sets. Training was done using TensorFlow on third-generation tensor processing units with
a 4x4 topology. All images were scaled to 1024 x 1024 pixels, and image pixel values were normalized
on a per-image basis to be between 0 and 1.
Model Selection For model selection (checkpoint selection and other hyperparameter optimization), we selected models
to maximize the area under the receiver operating characteristic curve (area under ROC curve, or AUC)
corresponding to the range of radiologists’ sensitivities in the tune sets. This approach was used to help
explicitly select models that were performant across the range of radiologist sensitivities, instead of
potentially optimizing for ranges that were beyond the scope of customary clinical practice.
Comparator Radiologist Reviews In order to gauge the performance of the DLS across datasets containing cases of different levels of
difficulty, all test set cases were reviewed by a team of radiologists, whose performance not only served
as a baseline for comparison, but also as an indirect indicator of difficulty level. As the performance
characteristics of radiologists accustomed to practice in endemic vs. non-endemic settings can vary,
this team consisted of two cohorts of radiologists (10 India-based consultant radiologists and 5 US-
based board-certified radiologists). The India-based radiologists had an average of 6 years of
experience (range 3-9), while the US-based radiologists had an average of 10.8 years of experience
(range 3-22). These radiologists were provided with both the image and additional clinical information
about the patient when available (age, sex, symptoms, and HIV status), whereas the DLS was blinded
to these information. For each image, the radiologists labeled it for the presence/absence of TB, other
pulmonary findings, and optionally whether there were any minor technical issues visible on the image.
The tune sets were labeled similarly.
Statistical Analysis Our primary analyses compared the performance of the DLS with that of the India-based radiologists on
the pooled combination of 4 test datasets. To support comparisons with the binary judgments of
experts, we thresholded the DLS’s continuous score using an operating point of 0.45, chosen based on
an analysis of the tune datasets (conducted prior to evaluating the DLS on any of the test sets).
We tested for noninferiority of sensitivity and specificity, both with a 10% absolute margin. To account
for correlations within case and within radiologist, we used the Obuchowski-Rockette-Hillis
procedure33,34 configured for binary data35 and adapted to compare readers with the standalone
algorithm36 in a noninferiority setting37. A p-value below 0.0125 was considered significant for the
primary analyses (a conservative one-sided alpha of 0.025 was halved for a Bonferroni correction for 2
tests). Subsequent superiority testing was prespecified if non-inferiority was met, which does not
require multiple testing correction.38
Prespecified secondary analyses included per-dataset subgroup analysis for ROC; sensitivity and
specificity at the prespecified operating point; operating points corresponding to the WHO thresholds;
matched sensitivity/specificity analysis on a per-dataset and per-radiologist level; comparisons of the
India-based and US-based radiologists, and comparison of the DLS to the US-based radiologists.
Additional secondary analyses were on subgroups based on HIV status, images flagged by the
reviewing radiologists to have minor technical issues, demographic information, and symptoms (work in
progress). Exploratory subgroup analysis based on sputum smear was also conducted. Unless
otherwise specified, 95% confidence intervals (CIs) were calculated using the bootstrap method with
1000 samples.
Labeling for non-TB Pulmonary Findings To understand the performance of the “abnormality” detector in the DLS, we additionally labeled the
India test dataset for any actionable abnormal CXR findings. Each case was reviewed by 3 US-based
radiologists. Because follow up testing such as a repeat CXR or computed tomography were not
available, “ground truth” was based on how many radiologists indicated the presence of an abnormal
finding: at least 1 of 3, at least 2 of 3, and all 3 of 3.
Cost Analysis Finally, we simulated the potential cost savings of using our DLS as a TB screening intervention.
Recent studies have estimated the overall cost for subsidized GeneXpert to be about US$13.06 per
test, including equipment, resources, maintenance, and consumables.13 The cost to acquire a single
digital CXR was estimated to be US$1.49, including equipment and running costs, but not radiology
interpretation.13,39 In our simulation, the DLS is used for initial TB screening, and patients who meet the
threshold (based on our prespecified operating point) proceed with GeneXpert testing. The expected
total GeneXpert testing cost was computed using the prevalence, sensitivity, and specificity to get DLS-
positive rates and multiplying by the cost of GeneXpert. The total expected cost included both this
testing cost for DLS-positive patients and the cost of CXR screening for all patients. Finally, we divided
the total cost by the number of true positive TB cases caught to derive the cost per positive TB case.

We then analyzed the effect of prevalence on the cost, which makes the simplifying assumption that
there are no changes in case severity or other factors that may affect DLS performance.
Results DLS performance was first evaluated on a combined test dataset incorporating a diverse population
representing multiple races and ethnicities, drawn from 4 countries: China, India, US, and Zambia
(Table 1). Among a total of 1,262 images from 1,262 patients, there were 217 TB cases based on
positive culture or GeneXpert. DLS development (training and tuning) and operating point selection was
conducted on the tune datasets, independently of the test datasets. Patient sources for these 4
datasets included TB referral centers, outpatient clinics, and active case finding. The India test dataset
was from a site independent of those used in development. An independent dataset from South Africa
comprising a mining population served as an additional test set.
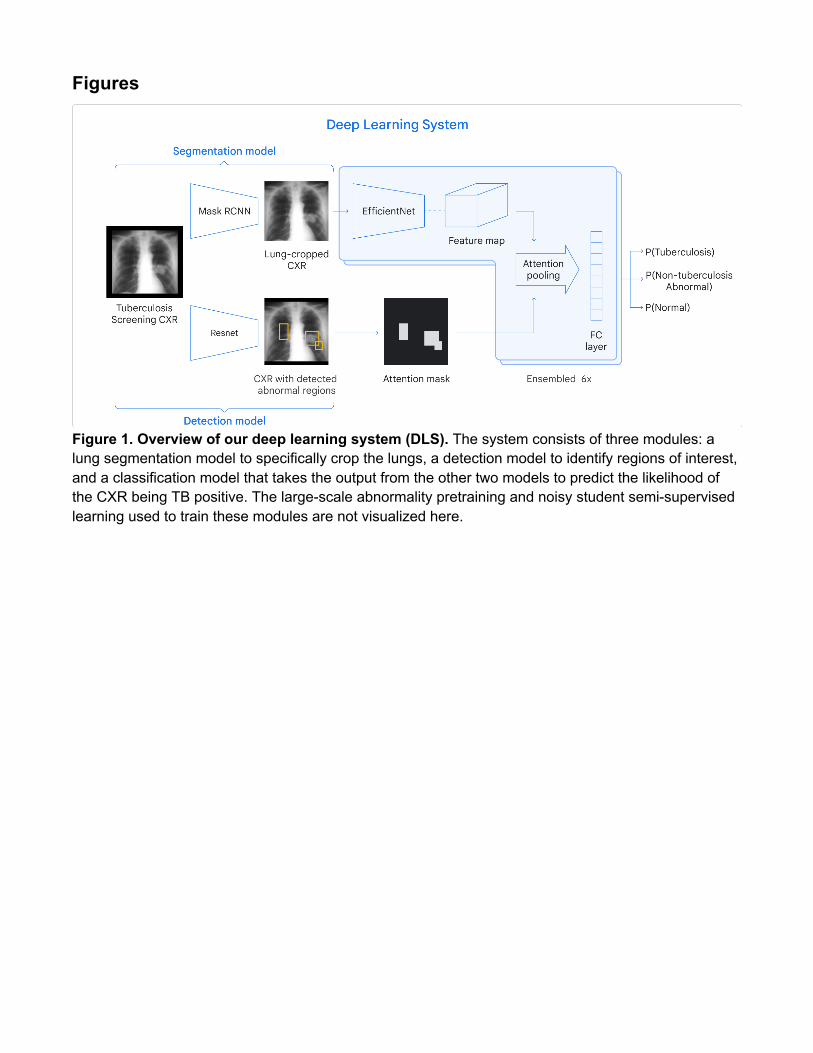
DLS Performance In our combined test dataset across 4 countries, the DLS achieved an AUC of 0.90 (Figure 2A, Table
2). To contextualize the model’s performance and better understand the case spectrum, we obtained
radiologist interpretations for the same cases from two cohorts of radiologists: radiologists based in
India, a country where TB is endemic, and radiologists based in the US. One India-based radiologist
was found to have a rate of flagging positives (and consequently sensitivity) substantially below the
others (Supplementary Figure S2) and so was excluded from subsequent analyses to avoid under-
representing radiologist performance. The DLS’s ROC curve was above the performance points of all 9
remaining India-based radiologists (Figure 2A).
Our prespecified primary analyses involved comparisons of the DLS at a prespecified operating point
(0.45) with India-based radiologists. The DLS’s sensitivity (88%, 95% CI 83-94%) was higher than
(superiority test was conducted if non-inferiority passed, see Methods) the India-based radiologists
(median sensitivity: 74%; IQR: 72-76%), p<0.001. At the same operating point, the DLS’s specificity
(79%, 95%CI 75-82%) was similarly non-inferior to the India-based radiologists (median specificity:
86%; IQR: 81-87%), p=0.003.
Comparison of India-based and US-based Radiologists While both India-based and US-based radiologists had sensitivities and specificities that tracked closely
and slightly below the ROC curve of our model, the conservativeness with which the two groups of
radiologists called cases as positive for TB appeared to differ (Figure 2A-C, Supplementary Figure S2).
India-based radiologists appeared to be more specific but less sensitive than US-based radiologists,
who had a median sensitivity of 84% (IQR 76-86%) and a median specificity of 71% (IQR 67-81%). The
DLS’s sensitivity and specificity remained comparable to the US-based radiologists (p-value for non-
inferiority: 0.022 for sensitivity; 0.018 for specificity).
Per-dataset Analysis Next, we conducted subgroup analysis on a per-dataset level (Table 2 and Figure 2B). The China and
US datasets were similarly-constructed case-control datasets, with normal CXRs selected to match the
TB positive CXRs. On these two datasets, while the India-based radiologists achieved high specificity
(96-99%), their sensitivity was lower (53-65%) compared to in the combined dataset. At the
prespecified operating point, both the DLS’s sensitivity and specificity were non-inferior to the
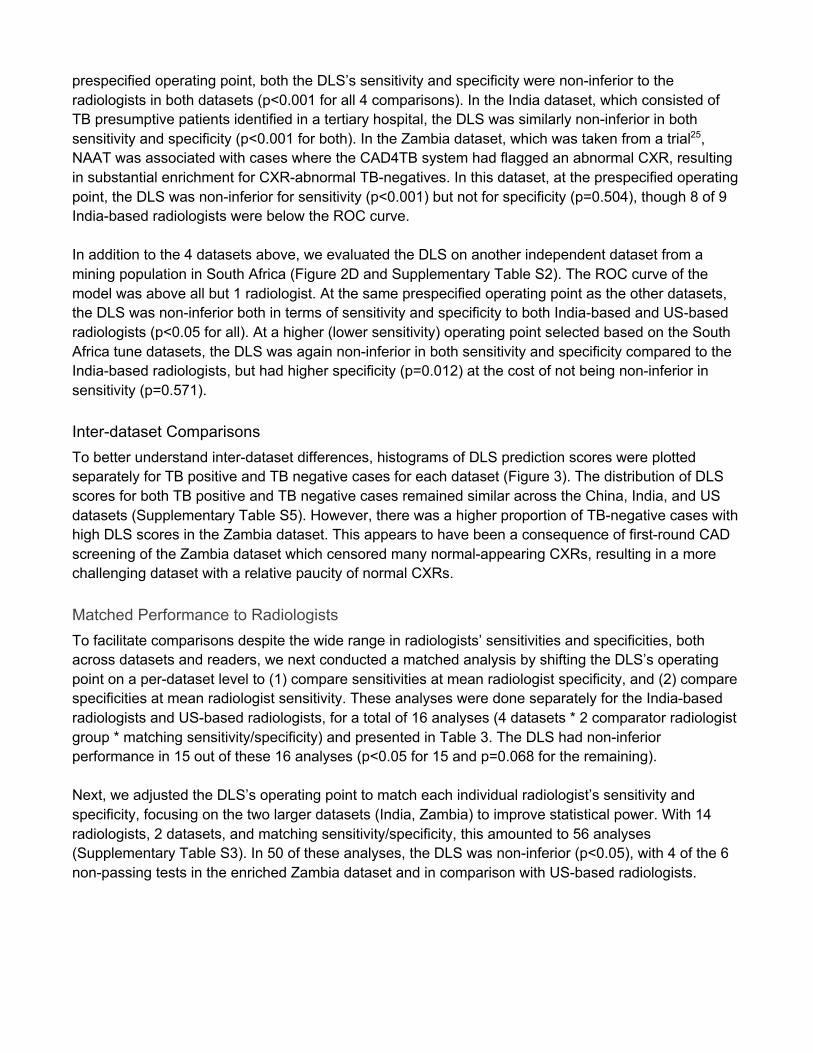
radiologists in both datasets (p<0.001 for all 4 comparisons). In the India dataset, which consisted of
TB presumptive patients identified in a tertiary hospital, the DLS was similarly non-inferior in both
sensitivity and specificity (p<0.001 for both). In the Zambia dataset, which was taken from a trial25,
NAAT was associated with cases where the CAD4TB system had flagged an abnormal CXR, resulting
in substantial enrichment for CXR-abnormal TB-negatives. In this dataset, at the prespecified operating
point, the DLS was non-inferior for sensitivity (p<0.001) but not for specificity (p=0.504), though 8 of 9
India-based radiologists were below the ROC curve.
In addition to the 4 datasets above, we evaluated the DLS on another independent dataset from a
mining population in South Africa (Figure 2D and Supplementary Table S2). The ROC curve of the
model was above all but 1 radiologist. At the same prespecified operating point as the other datasets,
the DLS was non-inferior both in terms of sensitivity and specificity to both India-based and US-based
radiologists (p<0.05 for all). At a higher (lower sensitivity) operating point selected based on the South
Africa tune datasets, the DLS was again non-inferior in both sensitivity and specificity compared to the
India-based radiologists, but had higher specificity (p=0.012) at the cost of not being non-inferior in
sensitivity (p=0.571).
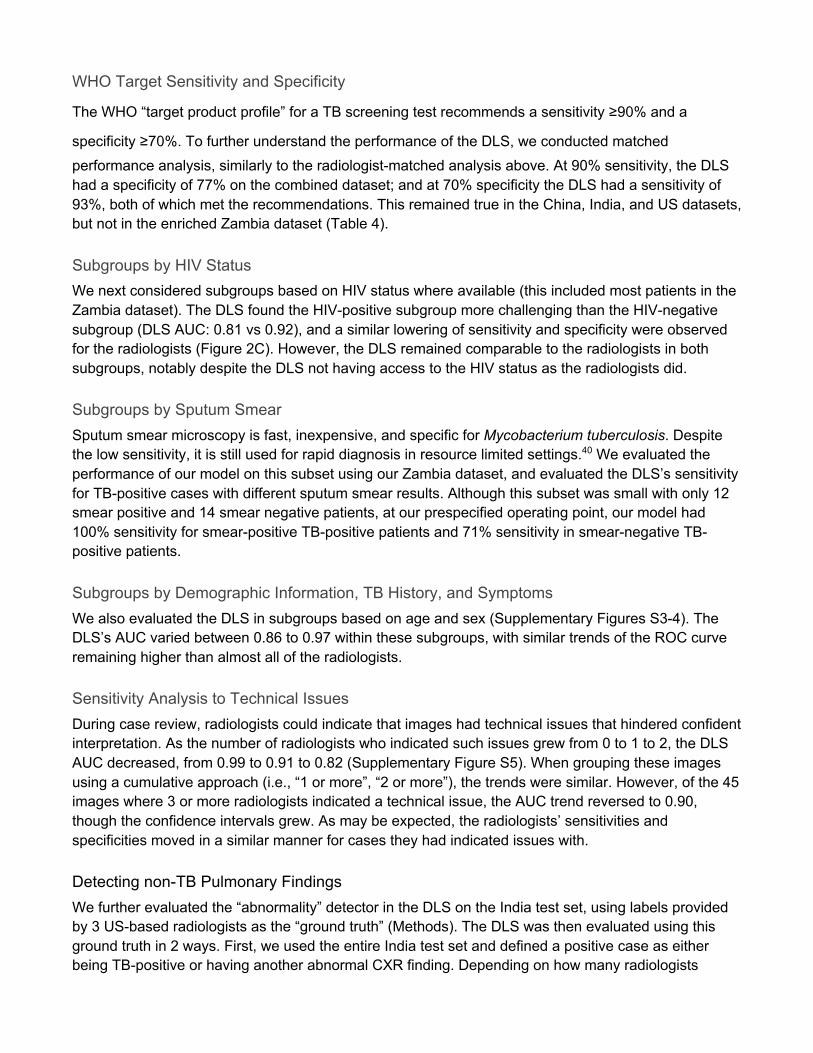
Inter-dataset Comparisons To better understand inter-dataset differences, histograms of DLS prediction scores were plotted
separately for TB positive and TB negative cases for each dataset (Figure 3). The distribution of DLS
scores for both TB positive and TB negative cases remained similar across the China, India, and US
datasets (Supplementary Table S5). However, there was a higher proportion of TB-negative cases with
high DLS scores in the Zambia dataset. This appears to have been a consequence of first-round CAD
screening of the Zambia dataset which censored many normal-appearing CXRs, resulting in a more
challenging dataset with a relative paucity of normal CXRs.
Matched Performance to Radiologists To facilitate comparisons despite the wide range in radiologists’ sensitivities and specificities, both
across datasets and readers, we next conducted a matched analysis by shifting the DLS’s operating
point on a per-dataset level to (1) compare sensitivities at mean radiologist specificity, and (2) compare
specificities at mean radiologist sensitivity. These analyses were done separately for the India-based
radiologists and US-based radiologists, for a total of 16 analyses (4 datasets * 2 comparator radiologist
group * matching sensitivity/specificity) and presented in Table 3. The DLS had non-inferior
performance in 15 out of these 16 analyses (p<0.05 for 15 and p=0.068 for the remaining).
Next, we adjusted the DLS’s operating point to match each individual radiologist’s sensitivity and
specificity, focusing on the two larger datasets (India, Zambia) to improve statistical power. With 14
radiologists, 2 datasets, and matching sensitivity/specificity, this amounted to 56 analyses
(Supplementary Table S3). In 50 of these analyses, the DLS was non-inferior (p<0.05), with 4 of the 6
non-passing tests in the enriched Zambia dataset and in comparison with US-based radiologists.
WHO Target Sensitivity and Specificity
!"#$%&'$()*+,#)$-+./01)$-+.234#5$2.+$*$!6$71+##838,$)#7)$+#1.99#8/7$*$7#873)3:3);$<=>?$*8/$*$
7-#132313);$<@>?. To further understand the performance of the DLS, we conducted matched
performance analysis, similarly to the radiologist-matched analysis above. At 90% sensitivity, the DLS
had a specificity of 77% on the combined dataset; and at 70% specificity the DLS had a sensitivity of
93%, both of which met the recommendations. This remained true in the China, India, and US datasets,
but not in the enriched Zambia dataset (Table 4).
Subgroups by HIV Status We next considered subgroups based on HIV status where available (this included most patients in the
Zambia dataset). The DLS found the HIV-positive subgroup more challenging than the HIV-negative
subgroup (DLS AUC: 0.81 vs 0.92), and a similar lowering of sensitivity and specificity were observed
for the radiologists (Figure 2C). However, the DLS remained comparable to the radiologists in both
subgroups, notably despite the DLS not having access to the HIV status as the radiologists did.
Subgroups by Sputum Smear Sputum smear microscopy is fast, inexpensive, and specific for Mycobacterium tuberculosis. Despite
the low sensitivity, it is still used for rapid diagnosis in resource limited settings.40 We evaluated the
performance of our model on this subset using our Zambia dataset, and evaluated the DLS’s sensitivity
for TB-positive cases with different sputum smear results. Although this subset was small with only 12
smear positive and 14 smear negative patients, at our prespecified operating point, our model had
100% sensitivity for smear-positive TB-positive patients and 71% sensitivity in smear-negative TB-
positive patients.
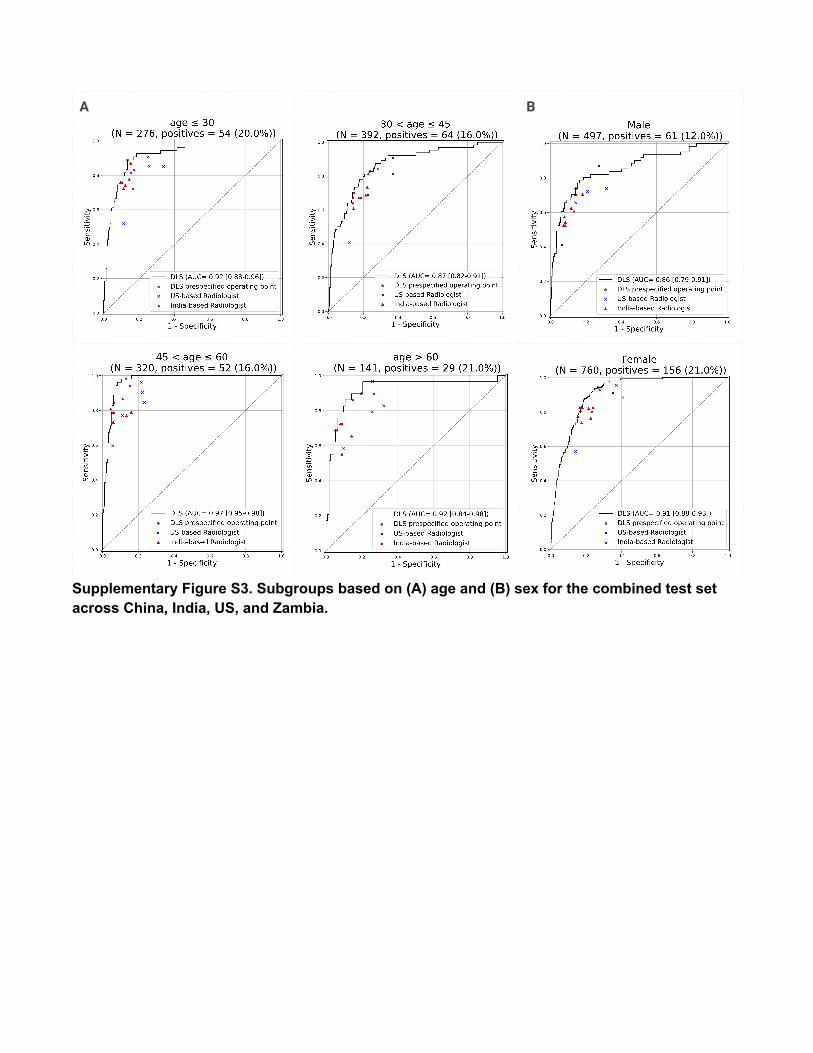
Subgroups by Demographic Information, TB History, and Symptoms We also evaluated the DLS in subgroups based on age and sex (Supplementary Figures S3-4). The
DLS’s AUC varied between 0.86 to 0.97 within these subgroups, with similar trends of the ROC curve
remaining higher than almost all of the radiologists.
Sensitivity Analysis to Technical Issues During case review, radiologists could indicate that images had technical issues that hindered confident
interpretation. As the number of radiologists who indicated such issues grew from 0 to 1 to 2, the DLS
AUC decreased, from 0.99 to 0.91 to 0.82 (Supplementary Figure S5). When grouping these images
using a cumulative approach (i.e., “1 or more”, “2 or more”), the trends were similar. However, of the 45
images where 3 or more radiologists indicated a technical issue, the AUC trend reversed to 0.90,
though the confidence intervals grew. As may be expected, the radiologists’ sensitivities and
specificities moved in a similar manner for cases they had indicated issues with.
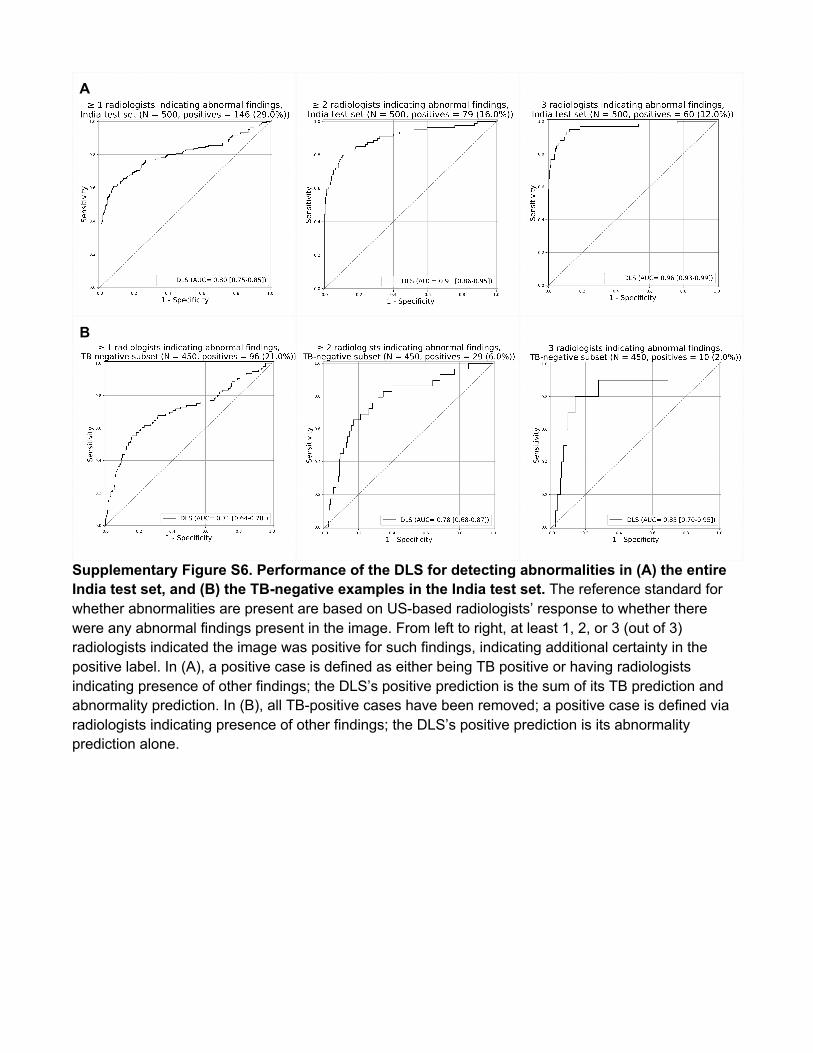
Detecting non-TB Pulmonary Findings We further evaluated the “abnormality” detector in the DLS on the India test set, using labels provided
by 3 US-based radiologists as the “ground truth” (Methods). The DLS was then evaluated using this
ground truth in 2 ways. First, we used the entire India test set and defined a positive case as either
being TB-positive or having another abnormal CXR finding. Depending on how many radiologists
indicated the presence of the abnormality, the DLS’s AUC ranged from 0.80 to 0.96 (Supplementary
Figure S6). Second, using only TB-negative cases, we defined a positive case as having any abnormal
CXR finding, and plotted the ROC for the DLS’s “non-TB abnormality” prediction alone. The AUC of the
DLS ranged from 0.71 to 0.85, though with wider confidence intervals (Supplementary Figure S6).
Cost Analysis Finally, in our analysis of potential cost savings, we simulated a workflow where patients only proceed
to GeneXpert testing if they are flagged as positive by the DLS. This workflow has a reduced overall
sensitivity (though still exceeding the WHO target of 90%), but substantially reduces cost via a lower
number of confirmatory tests being conducted and thus improves cost effectiveness as measured by
cost per positive TB case detected. We then simulated the cost of using the DLS performance on the
India dataset (94% sensitivity and 95% specificity), the WHO target performance (90% sensitivity and
70% specificity), a lower-specificity device (90% sensitivity and 65% specificity), and GeneXpert only
(no CXR). Based on the performance on the India dataset, as prevalence decreases from 10% to 1%,
the cost per positive TB case detected increased substantially, and the cost savings compared to using
GeneXpert alone increased from 73% to 82% (Figure 5). The corresponding cost savings at low
prevalence is not as profound when simulating the WHO target (47% to 53%) and a lower-specificity
device (42 to 48%).
Discussion In order to achieve the long term public health vision of global elimination of TB, there is a pressing
need to scale up identification and treatment in resource-constrained settings. The recently-released
2021 WHO consolidated guidelines stated that CAD technologies had the potential to “increase equity
in the reach of TB screening interventions and in access to TB care.” They also emphasized the
importance of using a high-performing CAD that was tested on CXRs drawn from a representative
population for the corresponding use case.7,41 We have developed a DLS using data from 9 countries
and validated the DLS in 5 countries, together covering many of the high-TB-burden countries and a
wide range of race/ethnicities and clinical settings. In this combined international test dataset, the DLS’s
pre-specified operating point demonstrated higher sensitivity and non-inferior specificity relative to a
large cohort of India-based radiologists. The development of a DLS with robust performance across a
broad spectrum of patient settings has the potential to equip public health organizations and healthcare
providers with a powerful tool to reduce inequities in efforts to screen and triage TB throughout the
world.
When considering each dataset individually, the DLS’s performance was excellent in two commonly-
used case-control datasets from China and US, and generalized well to an external validation set in
India. Moreover, the DLS’s performance was maintained in the enriched Zambia dataset, which was
filtered by another CAD device. Since many images that were considered radiologically clear were
excluded from this dataset, the difficulty of triaging the remaining cases was likely increased. The DLS
also performed well when radiologists indicated minor technical issues with the image, indicating
robustness to real-world issues.
In addition to performing well in different countries with a wide range of race/ethnicities, the model was
also comparable to radiologists in important subgroups. First, HIV infection increases the risk of active

TB disease up to 40 fold compared to background rates.1,42 Patients with HIV-associated pulmonary TB
often have an atypical presentation on CXR, making them more difficult to screen.43 Thus, the fact that
the DLS’s detection performance remained comparable with radiologists in HIV-positive patients is
reassuring. Second, sputum smear has a fast turnaround and a low cost, leading to its importance in
resource-limited settings despite having limited sensitivity. Though the subgroups were small, the DLS
was able to identify all sputum-positive cases and remained accurate on sputum-negative cases. The
fact that the use of the DLS should not lead to missing cases that would otherwise be detected by a
relatively accessible procedure is comforting, but will need to be further validated in a larger population.
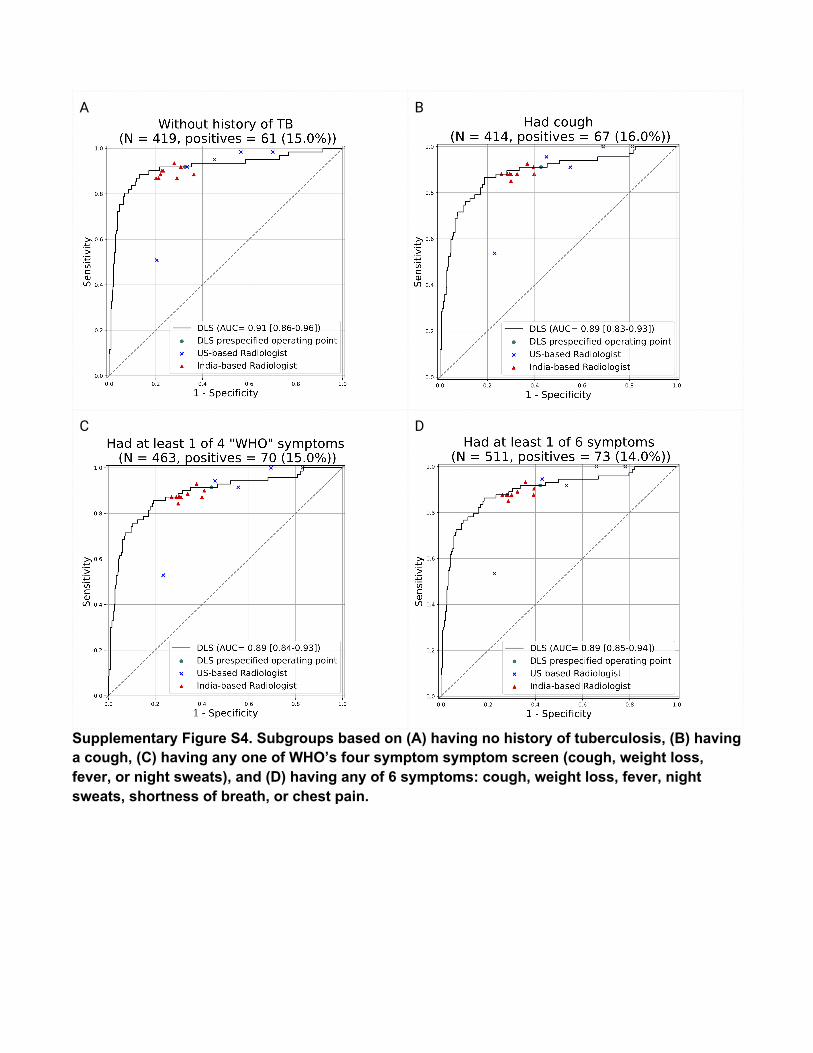
We further verified that the DLS remained comparable to the radiologists in important populations
based on demographic information, for patients without a prior history of TB, and subgroups based on
symptoms including WHO’s recommended 4-symptom screen: cough, weight loss, fever, or night
sweats. Importantly, our test set comprising a gold mining population in South Africa is supportive
evidence for the DLSs potential to help with this subgroup recommended by the WHO for systematic
screening. Finally, the DLS was able to accurately detect other non-TB abnormalities that were
identified by radiologists. Such a capability resolves one of the drawbacks that traditional CAD systems
were noted to have by the WHO: that unlike human readers, the CAD systems could not
simultaneously screen for pulmonary or thoracic conditions.
Although NAAT, such as GeneXpert have high positive predictive value, many populations are unable
to derive the broadest possible benefit from such tests because of their higher relative per-unit cost.
However, if coupled to an inexpensive but relatively sensitive first-line filter like CXR (i.e., only cases
screening positive on CXR are tested using NAAT), the benefits of NAAT could effectively benefit a
larger population due to more targeted use. Two-stage screening strategies of this type would
traditionally be intractable in many locales because settings with constrained access to NAAT often
also lack providers trained to reliably interpret CXRs for TB-related abnormalities. In these settings, in
accordance with current WHO guidelines, a robust performing CAD can increase the viability of this
strategy by serving as an effective alternative to human readers. Our cost analysis of this two-stage
screening workflow using the DLS suggests that it has the potential to provide 40-80% cost savings at
1-10% prevalence. The cost savings increases further as prevalence falls, which is an important
financial consideration in disease eradication.
Our comprehensive analysis with a large cohort of radiologists also revealed several important
subtleties. First, irrespective of practice location, radiologists demonstrated a wide range of sensitivities
and specificities. For example, even among our 9 India-based radiologists, sensitivities spanned a 18%
range (69-87%). This variability is documented in the literature, with clinical experience being a
potential contributing factor.7,44–46 However, this means that direct, single-operating-point comparisons
with any individual radiologist can be difficult to interpret without matching the DLS operating point to
either the sensitivity or specificity of that reader. Second, radiologists practicing in India were generally
more specific and less sensitive than those practicing in the US. This may partially be due to practice
patterns: in India where TB is endemic, radiologists’ calls need to be highly specific to avoid testing an
overwhelming number of patients. By contrast, in the US where TB is relatively rare and the goal is to
avoid outbreaks, radiologists are incentivized to make calls that are highly sensitive at the expense of
specificity. The wide range in performance between individuals and across practice locations suggests
that future CAD for TB studies will likely need to take into account the practice locations of the
comparator radiologists, and ensure that a sufficient number of radiologists are recruited to represent
the natural variability.
Remarkably, despite variability in individual radiologists’ sensitivity and specificity, their performance
tracked closely with the DLS’s ROC curve, with the clearest evidence of this trend seen in the enriched
Zambia dataset which exhibits a marked rightward shift toward lower specificity. This suggests that the
inherent advantageous ability of the DLS to provide continuous “scores” as output for thresholding can
likely help individual sites customize the triggering rate to their local practice patterns and resource
needs, while trusting that the customized operating point has a similar effect to calibrating the
“conservativeness” of a radiologist. As suggested by the WHO, this ability to calibrate the operating
point may be critical over time even for the same population, as prevalence and disease severity
changes over time. Statistical methods to tune operating points for each dataset and to detect when
operating points should be updated over time may be useful in this regard and represent an important
direction of future work for real-world use cases.
Our study has limitations. First, this study was retrospective and prospective validation will be needed
to better understand challenges in integrating into real-world workflows and to rigorously determine the
TB status via mycobacterial culture for all patients. Second, as highlighted by the WHO, TB screening
often happens in a broader context of patient care; patients can present with symptoms suspicious of
TB but have other pulmonary or thoracic conditions instead. The subgroup analyses presented here
were also not fully comprehensive due to the lack of important variables (such as HIV status and
symptoms) in several datasets. As our datasets all had relatively high prevalence, we will need to
evaluate its performance in populations with lower prevalence. Finally, the cost analysis is a simulation
that makes simplifying assumptions such as DLS performance being unaffected by prevalence
changes. In practice, prevalence changes may be associated with case severity, which may affect DLS
sensitivity or specificity.
Conclusion In this study, we developed a DLS and demonstrated its generalization via international test datasets
spanning 5 countries encompassing a wide range of race/ethnicities: China, India, US, and Zambia. At
a uniform, prespecified operating point, the DLS had significantly higher sensitivity while maintaining
non-inferior specificity compared to 9 India-based radiologists. When compared with US-based
radiologists who were more sensitive but less specific, the DLS was non-inferior in both sensitivity and
specificity. The DLS further meets the WHO targets when matching to either 90% sensitivity or 70%
specificity. The DLS may be able to facilitate TB screening in areas with scarce radiologist resources,
and merits further prospective clinical validation.
Acknowledgements The authors thank the members of the Google Health Radiology and labeling software teams for
software infrastructure support, logistical support, and assistance in data labeling. For tuberculosis data
collection, thanks go to Sameer Antani, Stefan Jaeger, Sema Candemir, Zhiyun Xue, Alex Karargyris,
George R. Thomas, Pu-Xuan Lu, Yi-Xiang Wang, Michael Bonifant, Ellan Kim, Sonia Qasba, and
Jonathan Musco. The train dataset from Europe/India was obtained from the TB Portals
(https://tbportals.niaid.nih.gov), which is an open-access TB data resource supported by the National
Institute of Allergy and Infectious Diseases (NIAID) Office of Cyber Infrastructure and Computational
Biology (OCICB) in Bethesda, MD. These data were collected and submitted by members of the
TB Portals Consortium (https://tbportals.niaid.nih.gov/Partners). Investigators and other
data contributors that originally submitted the data to the TB Portals did not participate

in the design or analysis of this study. Sincere appreciation also goes to the radiologists who enabled
this work with their image interpretation and annotation efforts throughout the study, Jonny Wong for
coordinating the imaging annotation work, Anna Majkowska for initial modeling efforts, Joshua Reicher
for early input, Christopher Semturs for team guidance, Rayman Huang for statistical input, T
Saensuksopa for figure and user interface design, and Akinori Mitani and Craig H. Mermel for
manuscript feedback.
Figures
Figure 1. Overview of our deep learning system (DLS). The system consists of three modules: a
lung segmentation model to specifically crop the lungs, a detection model to identify regions of interest,
and a classification model that takes the output from the other two models to predict the likelihood of
the CXR being TB positive. The large-scale abnormality pretraining and noisy student semi-supervised
learning used to train these modules are not visualized here.
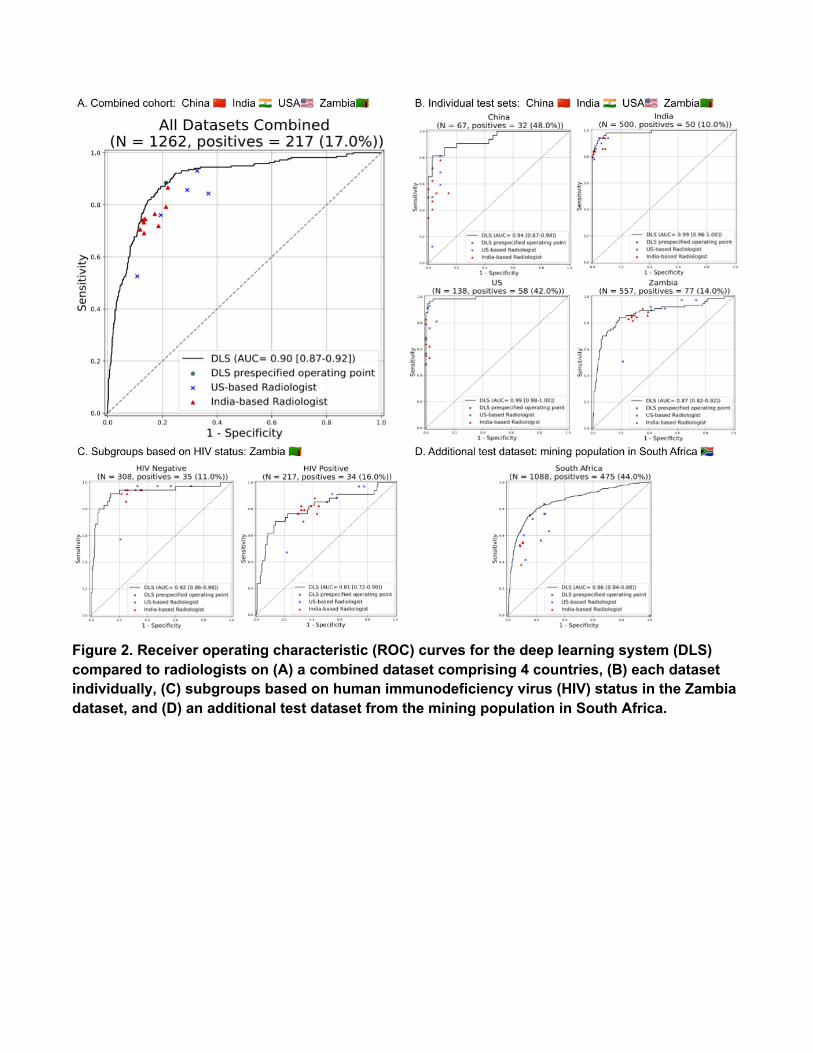
Figure 2. Receiver operating characteristic (ROC) curves for the deep learning system (DLS)
compared to radiologists on (A) a combined dataset comprising 4 countries, (B) each dataset
individually, (C) subgroups based on human immunodeficiency virus (HIV) status in the Zambia
dataset, and (D) an additional test dataset from the mining population in South Africa.

Figure 3. Histograms representing the distribution of deep learning system (DLS) predictions
stratified by positive (red) vs negative (blue) examples to illustrate shifts across datasets.
Figure 4. Examples of chest radiographs (CXRs) corresponding to (A) TB-positive cases and (B) TB-negative cases. Blue outlines encircle salient regions via Grad-CAM47 that most influence the deep learning system (DLS) predictions, whereas yellow outlines were annotated by a radiologist to indicate regions of interest.
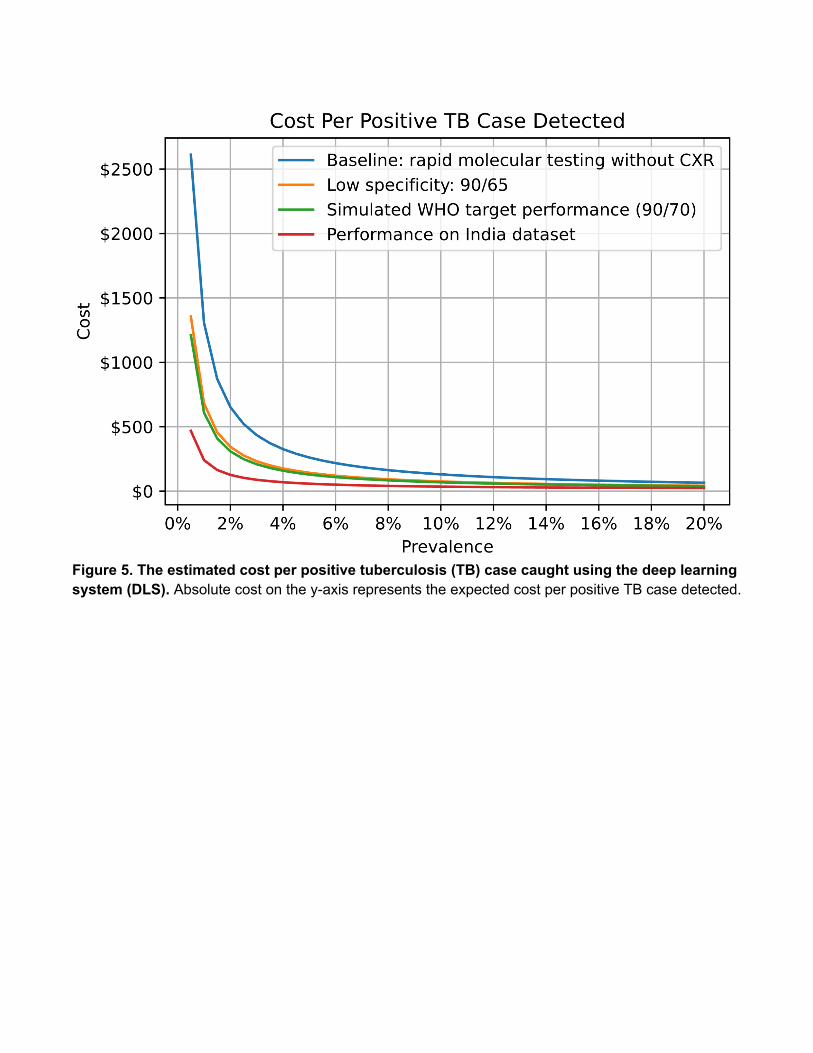
Figure 5. The estimated cost per positive tuberculosis (TB) case caught using the deep learning system (DLS). Absolute cost on the y-axis represents the expected cost per positive TB case detected.
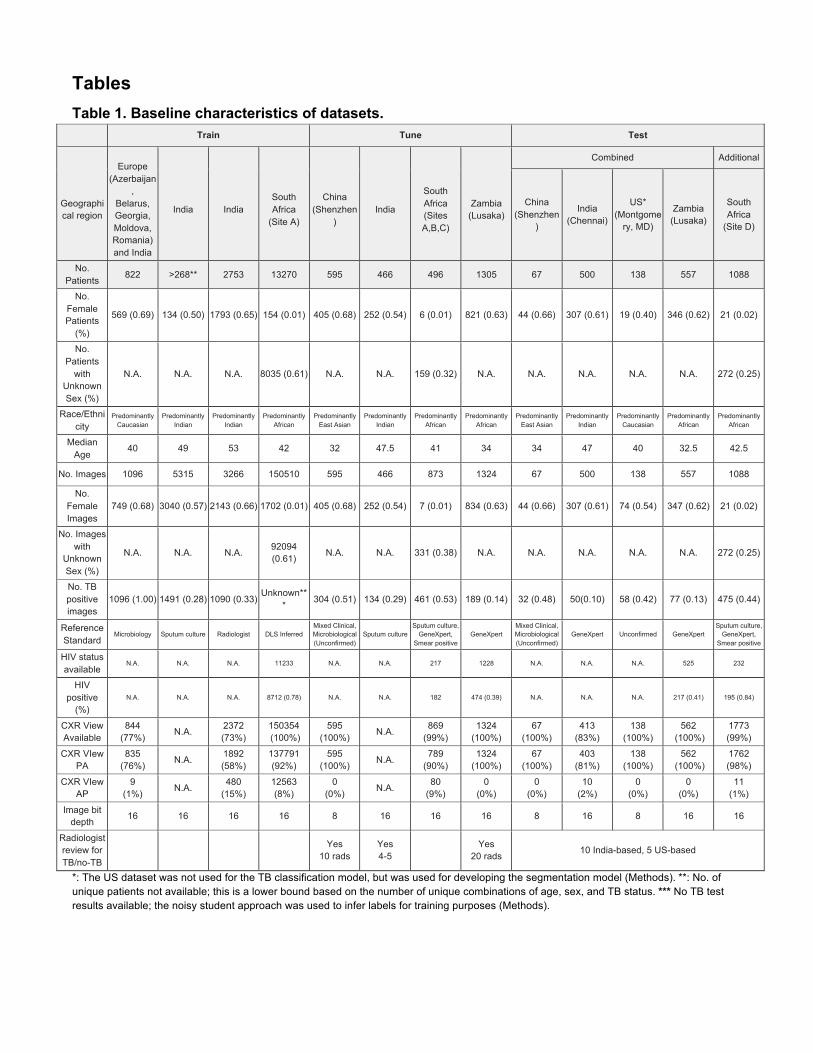
Tables Table 1. Baseline characteristics of datasets.
Train Tune Test
Geographical region
Europe
(Azerbaijan,
Belarus, Georgia, Moldova, Romania) and India
India
India
South Africa
(Site A)
China
(Shenzhen)
India
South Africa (Sites A,B,C)
Zambia
(Lusaka)
Combined Additional
China (Shenzhen
)
India (Chennai)
US* (Montgome
ry, MD)
Zambia (Lusaka)
South Africa
(Site D)
No. Patients
822 >268** 2753 13270 595 466 496 1305 67 500 138 557 1088
No. Female Patients
(%)
569 (0.69) 134 (0.50) 1793 (0.65) 154 (0.01) 405 (0.68) 252 (0.54) 6 (0.01) 821 (0.63) 44 (0.66) 307 (0.61) 19 (0.40) 346 (0.62) 21 (0.02)
No. Patients
with Unknown Sex (%)
N.A. N.A. N.A. 8035 (0.61) N.A. N.A. 159 (0.32) N.A. N.A. N.A. N.A. N.A. 272 (0.25)
Race/Ethnicity
Predominantly Caucasian
Predominantly Indian
Predominantly Indian
Predominantly African
Predominantly East Asian
Predominantly Indian
Predominantly African
Predominantly African
Predominantly East Asian
Predominantly Indian
Predominantly Caucasian
Predominantly African
Predominantly African
Median Age
40 49 53 42 32 47.5 41 34 34 47 40 32.5 42.5
No. Images 1096 5315 3266 150510 595 466 873 1324 67 500 138 557 1088
No. Female Images
749 (0.68) 3040 (0.57) 2143 (0.66) 1702 (0.01) 405 (0.68) 252 (0.54) 7 (0.01) 834 (0.63) 44 (0.66) 307 (0.61) 74 (0.54) 347 (0.62) 21 (0.02)
No. Images with
Unknown Sex (%)
N.A. N.A. N.A. 92094 (0.61)
N.A. N.A. 331 (0.38) N.A. N.A. N.A. N.A. N.A. 272 (0.25)
No. TB positive images
1096 (1.00) 1491 (0.28) 1090 (0.33) Unknown**
* 304 (0.51) 134 (0.29) 461 (0.53) 189 (0.14) 32 (0.48) 50(0.10) 58 (0.42) 77 (0.13) 475 (0.44)
Reference Standard
Microbiology Sputum culture Radiologist DLS Inferred Mixed Clinical, Microbiological (Unconfirmed)
Sputum culture Sputum culture,
GeneXpert, Smear positive
GeneXpert Mixed Clinical, Microbiological (Unconfirmed)
GeneXpert Unconfirmed GeneXpert Sputum culture,
GeneXpert, Smear positive
HIV status available
N.A. N.A. N.A. 11233 N.A. N.A. 217 1228 N.A. N.A. N.A. 525 232
HIV positive
(%)
N.A. N.A. N.A. 8712 (0.78) N.A. N.A. 182 474 (0.39) N.A. N.A. N.A. 217 (0.41) 195 (0.84)
CXR View Available
844 (77%)
N.A. 2372 (73%)
150354 (100%)
595 (100%)
N.A. 869
(99%) 1324
(100%) 67
(100%) 413
(83%) 138
(100%) 562
(100%) 1773 (99%)
CXR VIew PA
835 (76%)
N.A. 1892 (58%)
137791 (92%)
595 (100%)
N.A. 789
(90%) 1324
(100%) 67
(100%) 403
(81%) 138
(100%) 562
(100%) 1762 (98%)
CXR VIew AP
9 (1%)
N.A. 480
(15%) 12563 (8%)
0 (0%)
N.A. 80
(9%) 0
(0%) 0
(0%) 10
(2%) 0
(0%) 0
(0%) 11
(1%)
Image bit depth
16 16 16 16 8 16 16 16 8 16 8 16 16
Radiologist review for TB/no-TB
Yes
10 rads Yes 4-5
Yes
20 rads 10 India-based, 5 US-based
*: The US dataset was not used for the TB classification model, but was used for developing the segmentation model (Methods). **: No. of unique patients not available; this is a lower bound based on the number of unique combinations of age, sex, and TB status. *** No TB test results available; the noisy student approach was used to infer labels for training purposes (Methods).
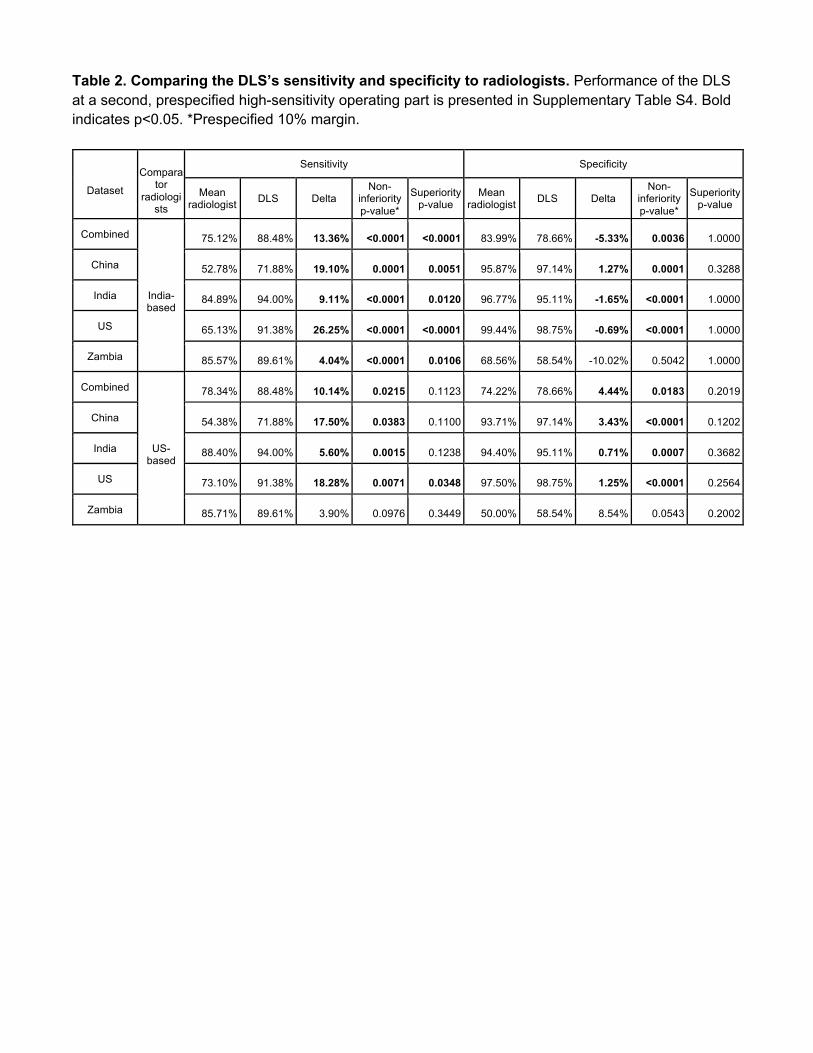
Table 2. Comparing the DLS’s sensitivity and specificity to radiologists. Performance of the DLS at a second, prespecified high-sensitivity operating part is presented in Supplementary Table S4. Bold indicates p<0.05. *Prespecified 10% margin.
Dataset
Compara
tor radiologi
sts
Sensitivity Specificity
Mean radiologist DLS Delta
Non-inferiority p-value*
Superiority p-value
Mean radiologist DLS Delta
Non-inferiority p-value*
Superiority p-value
Combined
India- based
75.12% 88.48% 13.36% <0.0001 <0.0001 83.99% 78.66% -5.33% 0.0036 1.0000
China 52.78% 71.88% 19.10% 0.0001 0.0051 95.87% 97.14% 1.27% 0.0001 0.3288
India 84.89% 94.00% 9.11% <0.0001 0.0120 96.77% 95.11% -1.65% <0.0001 1.0000
US 65.13% 91.38% 26.25% <0.0001 <0.0001 99.44% 98.75% -0.69% <0.0001 1.0000
Zambia 85.57% 89.61% 4.04% <0.0001 0.0106 68.56% 58.54% -10.02% 0.5042 1.0000
Combined
US-
based
78.34% 88.48% 10.14% 0.0215 0.1123 74.22% 78.66% 4.44% 0.0183 0.2019
China 54.38% 71.88% 17.50% 0.0383 0.1100 93.71% 97.14% 3.43% <0.0001 0.1202
India 88.40% 94.00% 5.60% 0.0015 0.1238 94.40% 95.11% 0.71% 0.0007 0.3682
US 73.10% 91.38% 18.28% 0.0071 0.0348 97.50% 98.75% 1.25% <0.0001 0.2564
Zambia 85.71% 89.61% 3.90% 0.0976 0.3449 50.00% 58.54% 8.54% 0.0543 0.2002
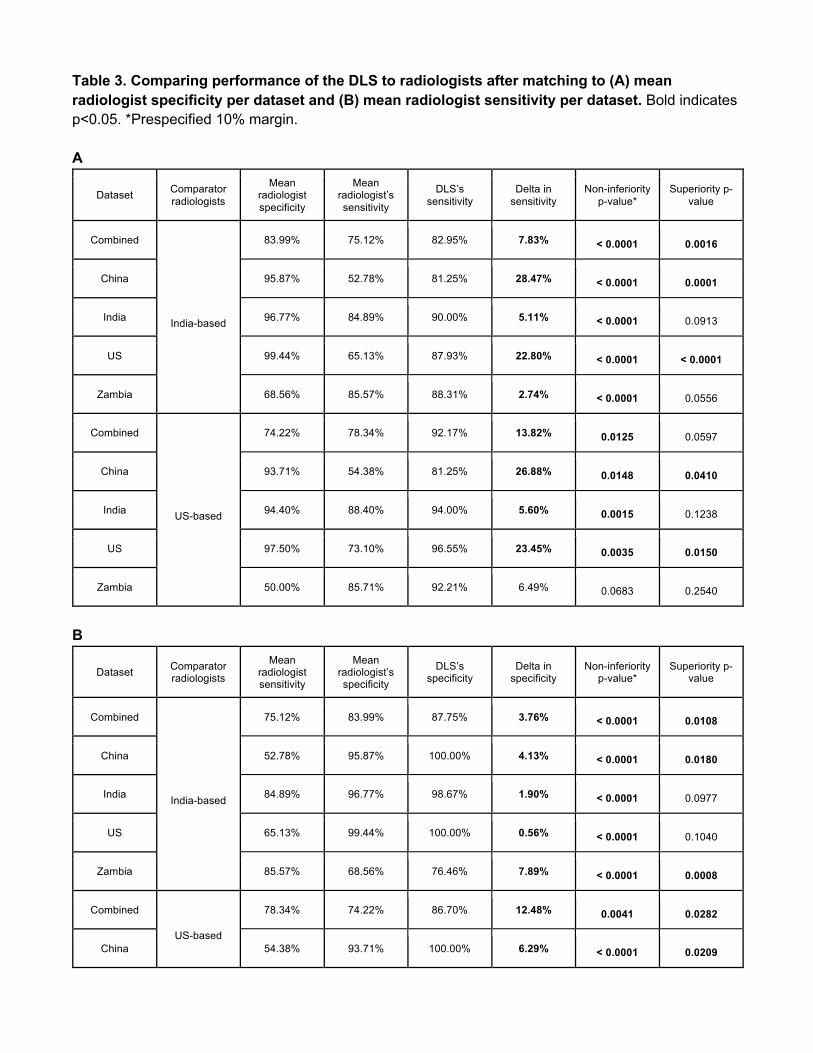
Table 3. Comparing performance of the DLS to radiologists after matching to (A) mean radiologist specificity per dataset and (B) mean radiologist sensitivity per dataset. Bold indicates p<0.05. *Prespecified 10% margin. A
Dataset Comparator radiologists
Mean radiologist specificity
Mean radiologist’s sensitivity
DLS’s sensitivity
Delta in sensitivity
Non-inferiority p-value*
Superiority p-value
Combined
India-based
83.99% 75.12% 82.95% 7.83% < 0.0001 0.0016
China 95.87% 52.78% 81.25% 28.47% < 0.0001 0.0001
India 96.77% 84.89% 90.00% 5.11% < 0.0001 0.0913
US 99.44% 65.13% 87.93% 22.80% < 0.0001 < 0.0001
Zambia 68.56% 85.57% 88.31% 2.74% < 0.0001 0.0556
Combined
US-based
74.22% 78.34% 92.17% 13.82% 0.0125 0.0597
China 93.71% 54.38% 81.25% 26.88% 0.0148 0.0410
India 94.40% 88.40% 94.00% 5.60% 0.0015 0.1238
US 97.50% 73.10% 96.55% 23.45% 0.0035 0.0150
Zambia 50.00% 85.71% 92.21% 6.49% 0.0683 0.2540
B
Dataset Comparator radiologists
Mean radiologist sensitivity
Mean radiologist’s specificity
DLS’s specificity
Delta in specificity
Non-inferiority p-value*
Superiority p-value
Combined
India-based
75.12% 83.99% 87.75% 3.76% < 0.0001 0.0108
China 52.78% 95.87% 100.00% 4.13% < 0.0001 0.0180
India 84.89% 96.77% 98.67% 1.90% < 0.0001 0.0977
US 65.13% 99.44% 100.00% 0.56% < 0.0001 0.1040
Zambia 85.57% 68.56% 76.46% 7.89% < 0.0001 0.0008
Combined
US-based
78.34% 74.22% 86.70% 12.48% 0.0041 0.0282
China 54.38% 93.71% 100.00% 6.29% < 0.0001 0.0209

India 88.40% 94.40% 97.11% 2.71% 0.0004 0.1076
US 73.10% 97.50% 100.00% 2.50% 0.0004 0.0710
Zambia 85.71% 50.00% 76.46% 26.46% 0.0073 0.0207

Table 4. Model performance at the World Health Organization’s (WHO) target sensitivity and specificity thresholds.
Dataset DLS Specificity @ 90% Sensitivity DLS Sensitivity @ 70% Specificity
Combined 76.65% 93.55%
China 80.00% 90.63%
India 97.11% 98.00%
US 98.75% 98.28%
Zambia 56.25% 87.01%
References
1. Global Tuberculosis Report 2020. World Health Organization
https://www.who.int/tb/publications/global_report/TB20_Exec_Sum_20201022.pdf?ua=1.
2. Latent tuberculosis infection: updated and consolidated guidelines for programmatic management.
(World Health Organization, 2018).
3. Stop TB Partnership. http://www.stoptb.org/countries/tbdata.asp.
4. Lange, C. et al. Management of drug-resistant tuberculosis. Lancet 394, 953–966 (2019).
5. Roberts, L. How COVID hurt the fight against other dangerous diseases. Nature 592, 502–504
(2021).
6. WHO | UN General Assembly adopts Declaration of the first-ever United Nations High Level
Meeting on TB. (2020).
7. WHO consolidated guidelines on tuberculosis: Module 2: screening – systematic screening for
tuberculosis disease. (World Health Organization, 2021).
8. Xiong, Y. et al. Automatic detection of mycobacterium tuberculosis using artificial intelligence. J.
Thorac. Dis. 10, 1936–1940 (2018).
9. Qin, Z. Z. et al. Using artificial intelligence to read chest radiographs for tuberculosis detection: A
multi-site evaluation of the diagnostic accuracy of three deep learning systems. Sci. Rep. 9, 15000
(2019).
10. Lakhani, P. & Sundaram, B. Deep Learning at Chest Radiography: Automated Classification of
Pulmonary Tuberculosis by Using Convolutional Neural Networks. Radiology 284, 574–582 (2017).
11. Seixas, J. M. et al. Artificial neural network models to support the diagnosis of pleural tuberculosis
in adult patients. The International Journal of Tuberculosis and Lung Disease vol. 17 682–686
(2013).
12. Khan, F. A. et al. Chest x-ray analysis with deep learning-based software as a triage test for
pulmonary tuberculosis: a prospective study of diagnostic accuracy for culture-confirmed disease.
Lancet Digit Health 2, e573–e581 (2020).
13. Murphy, K. et al. Computer aided detection of tuberculosis on chest radiographs: An evaluation of
the CAD4TB v6 system. Sci. Rep. 10, 5492 (2020).
14. Becker, A. S. et al. Detection of tuberculosis patterns in digital photographs of chest X-ray images
using Deep Learning: feasibility study. Int. J. Tuberc. Lung Dis. 22, 328–335 (2018).
15. Rajaraman, S. et al. A novel stacked generalization of models for improved TB detection in chest
radiographs. Conf. Proc. IEEE Eng. Med. Biol. Soc. 2018, 718–721 (2018).
16. Jaeger, S. et al. Automatic tuberculosis screening using chest radiographs. IEEE Trans. Med.
Imaging 33, 233–245 (2014).
17. Engle, E., Gabrielian, A., Long, A., Hurt, D. E. & Rosenthal, A. Performance of Qure.ai automatic
classifiers against a large annotated database of patients with diverse forms of tuberculosis. PLoS
One 15, e0224445 (2020).
18. Hwang, E. J. et al. Development and Validation of a Deep Learning-based Automatic Detection
Algorithm for Active Pulmonary Tuberculosis on Chest Radiographs. Clin. Infect. Dis. 69, 739–747
(2019).
19. Qin, Z. Z. et al. A new resource on artificial intelligence powered computer automated detection
software products for tuberculosis programmes and implementers. Tuberculosis 127, 102049
(2021).
20. Rajpurkar, P. et al. CheXpedition: Investigating Generalization Challenges for Translation of Chest
X-Ray Algorithms to the Clinical Setting. arXiv [eess.IV] (2020).
21. Rapid communication on systematic screening for tuberculosis.
https://apps.who.int/iris/bitstream/handle/10665/337372/9789240016552-eng.pdf.
22. Rosenthal, A. et al. The TB Portals: an Open-Access, Web-Based Platform for Global Drug-
Resistant-Tuberculosis Data Sharing and Analysis. J. Clin. Microbiol. 55, 3267–3282 (2017).
23. Jaeger, S. et al. Two public chest X-ray datasets for computer-aided screening of pulmonary
diseases. Quant. Imaging Med. Surg. 4, 475–477 (2014).
24. Candemir, S. et al. Lung segmentation in chest radiographs using anatomical atlases with nonrigid
registration. IEEE Trans. Med. Imaging 33, 577–590 (2014).
25. Kagujje, M. et al. Active TB case finding in a high burden setting; comparison of community and

facility-based strategies in Lusaka, Zambia. PLoS One 15, e0237931 (2020).
26. Majkowska, A. et al. Chest Radiograph Interpretation with Deep Learning Models: Assessment
with Radiologist-adjudicated Reference Standards and Population-adjusted Evaluation. Radiology
294, 421–431 (2020).
27. Nabulsi, Z. et al. Deep Learning for Distinguishing Normal versus Abnormal Chest Radiographs
and Generalization to Unseen Diseases. arXiv [eess.IV] (2020).
28. He, K., Gkioxari, G., Dollár, P. & Girshick, R. Mask R-CNN. arXiv [cs.CV] (2017).
29. Lin, T.-Y., Goyal, P., Girshick, R., He, K. & Dollár, P. Focal Loss for Dense Object Detection. arXiv
[cs.CV] (2017).
30. Liu, W. et al. SSD: Single Shot MultiBox Detector. arXiv [cs.CV] (2015).
31. Tan, M. & Le, Q. V. EfficientNet: Rethinking Model Scaling for Convolutional Neural Networks.
arXiv [cs.LG] (2019).
32. Xie, Q., Luong, M.-T., Hovy, E. & Le, Q. V. Self-training with Noisy Student improves ImageNet
classification. arXiv [cs.LG] (2019).
33. Obuchowski, N. A. & Rockette, H. E. Hypothesis testing of diagnostic accuracy for multiple readers
and multiple tests an anova approach with dependent observations. Communications in Statistics -
Simulation and Computation 24, 285–308 (1995).
34. Hillis, S. L. A comparison of denominator degrees of freedom methods for multiple observer ROC
analysis. Stat. Med. 26, 596–619 (2007).
35. Chen, W., Wunderlich, A., Petrick, N. & Gallas, B. D. Multireader multicase reader studies with
binary agreement data: simulation, analysis, validation, and sizing. J Med Imaging (Bellingham) 1,
031011 (2014).
36. Chakraborty, D. P. Observer performance methods for diagnostic imaging: foundations, modeling,
and applications with r-based examples. (CRC Press, 2017).
37. Chen, W., Petrick, N. A. & Sahiner, B. Hypothesis testing in noninferiority and equivalence MRMC
ROC studies. Acad. Radiol. 19, 1158–1165 (2012).
38. Committee for Proprietary Medicinal Products. Points to consider on switching between superiority
and non-inferiority. Br. J. Clin. Pharmacol. 52, 223–228 (2001).
39. Philipsen, R. H. H. M. et al. Automated chest-radiography as a triage for Xpert testing in resource-
constrained settings: a prospective study of diagnostic accuracy and costs. Sci. Rep. 5, 12215
(2015).
40. Schumacher, S. G. et al. Guidance for Studies Evaluating the Accuracy of Sputum-Based Tests to
Diagnose Tuberculosis. J. Infect. Dis. 220, S99–S107 (2019).
41. WHO. WHO operational handbook on tuberculosis. Module 2: screening – systematic screening for
tuberculosis disease. https://apps.who.int/iris/bitstream/handle/10665/340256/9789240022614-
eng.pdf (2021).
42. Selwyn, P. A. et al. A prospective study of the risk of tuberculosis among intravenous drug users
with human immunodeficiency virus infection. N. Engl. J. Med. 320, 545–550 (1989).
43. Kistan, J. et al. Pulmonary TB: varying radiological presentations in individuals with HIV in Soweto,
South Africa. Trans. R. Soc. Trop. Med. Hyg. 111, 132–136 (2017).
44. Pinto, L. M. et al. Scoring systems using chest radiographic features for the diagnosis of pulmonary
tuberculosis in adults: a systematic review. Eur. Respir. J. 42, 480–494 (2013).
45. van’t Hoog, A. H. et al. A systematic review of the sensitivity and specificity of symptom- and chest-
radiography screening for active pulmonary tuberculosis in HIV-negative persons and persons with
unknown HIV status. https://www.who.int/tb/Review2Accuracyofscreeningtests.pdf.
46. Piccazzo, R., Paparo, F. & Garlaschi, G. Diagnostic accuracy of chest radiography for the
diagnosis of tuberculosis (TB) and its role in the detection of latent TB infection: a systematic
review. J. Rheumatol. Suppl. 91, 32–40 (2014).
47. Selvaraju, R. R. et al. Grad-CAM: Visual Explanations from Deep Networks via Gradient-Based
Localization. in 2017 IEEE International Conference on Computer Vision (ICCV) 618–626 (2017).
Supplementary Figures
Supplementary Figure S1. STARD diagrams.
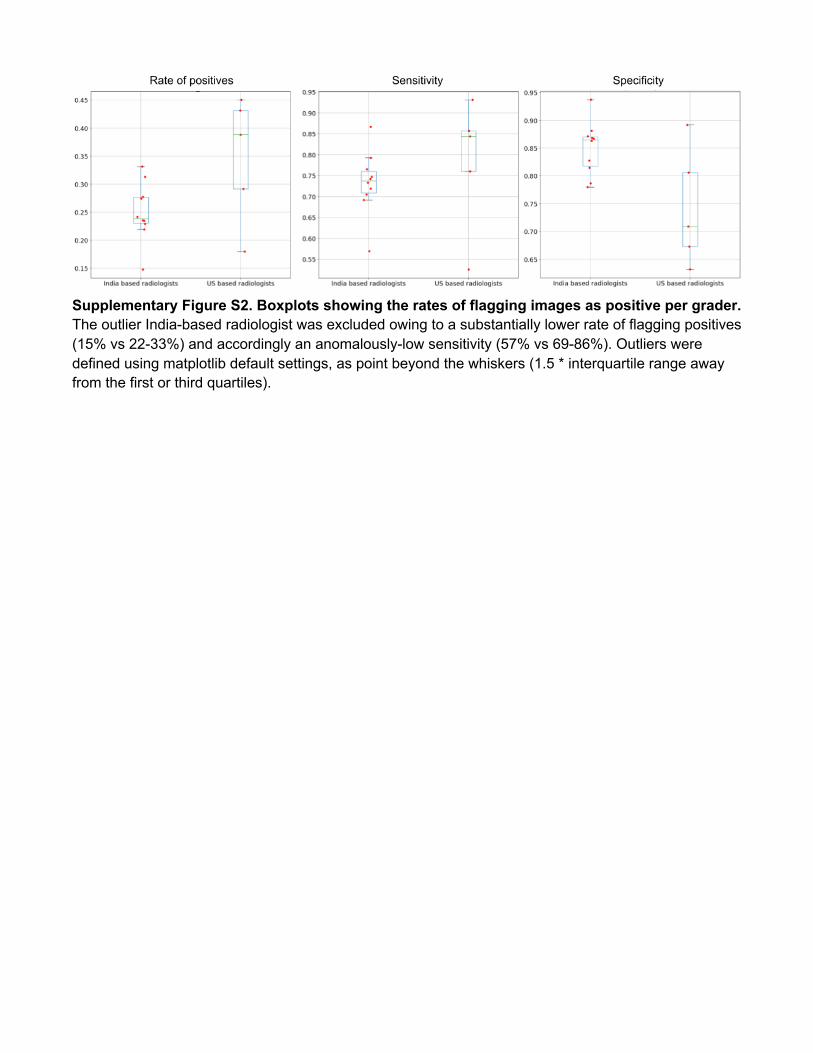
Supplementary Figure S2. Boxplots showing the rates of flagging images as positive per grader. The outlier India-based radiologist was excluded owing to a substantially lower rate of flagging positives (15% vs 22-33%) and accordingly an anomalously-low sensitivity (57% vs 69-86%). Outliers were defined using matplotlib default settings, as point beyond the whiskers (1.5 * interquartile range away from the first or third quartiles).
A
B
Supplementary Figure S3. Subgroups based on (A) age and (B) sex for the combined test set across China, India, US, and Zambia.
A
B
C
D
Supplementary Figure S4. Subgroups based on (A) having no history of tuberculosis, (B) having a cough, (C) having any one of WHO’s four symptom symptom screen (cough, weight loss, fever, or night sweats), and (D) having any of 6 symptoms: cough, weight loss, fever, night sweats, shortness of breath, or chest pain.
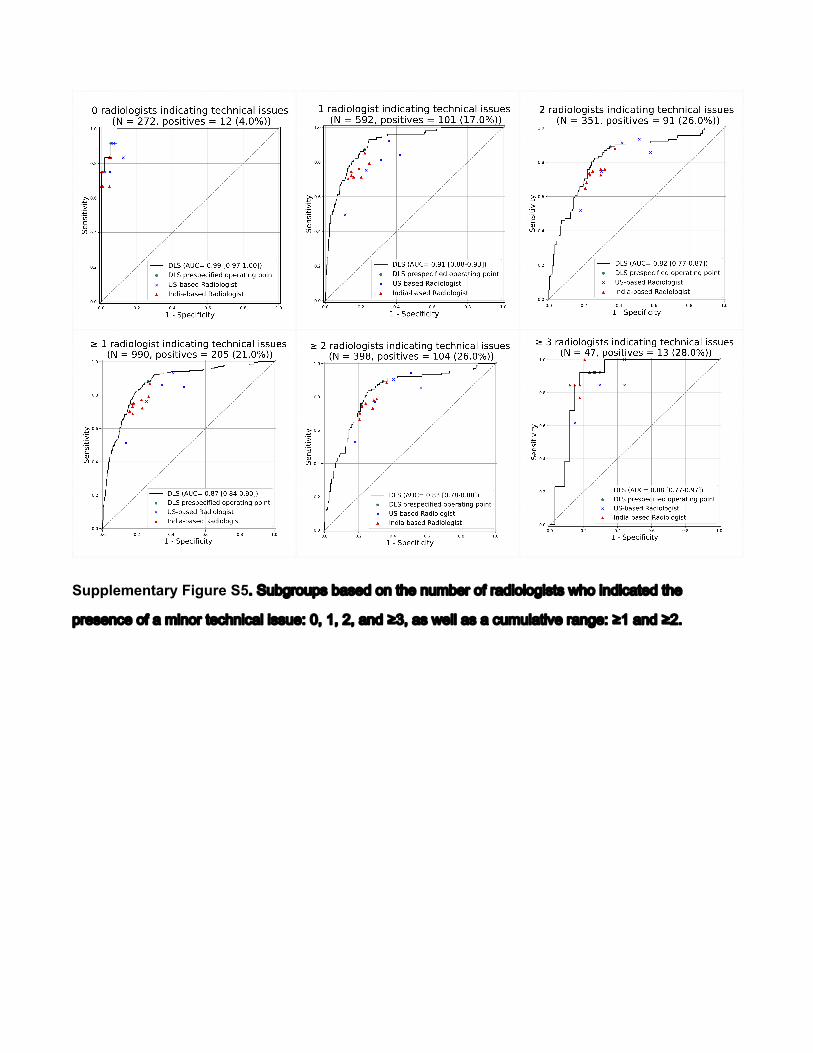
Supplementary Figure S5!"#$%&'($)*"%+*,-"(."/0,".$1%,'"(2"'+-3(4(&3*/*"50("3.-36+/,-"/0,"
)',*,.6,"(2"+"13.('"/,60.36+4"3**$,7"89":9";9"+.-"<=9"+*"5,44"+*"+"6$1$4+/3>,"'+.&,7"<:"+.-"<;!
A
B
Supplementary Figure S6. Performance of the DLS for detecting abnormalities in (A) the entire India test set, and (B) the TB-negative examples in the India test set. The reference standard for whether abnormalities are present are based on US-based radiologists’ response to whether there were any abnormal findings present in the image. From left to right, at least 1, 2, or 3 (out of 3) radiologists indicated the image was positive for such findings, indicating additional certainty in the positive label. In (A), a positive case is defined as either being TB positive or having radiologists indicating presence of other findings; the DLS’s positive prediction is the sum of its TB prediction and abnormality prediction. In (B), all TB-positive cases have been removed; a positive case is defined via radiologists indicating presence of other findings; the DLS’s positive prediction is its abnormality prediction alone.
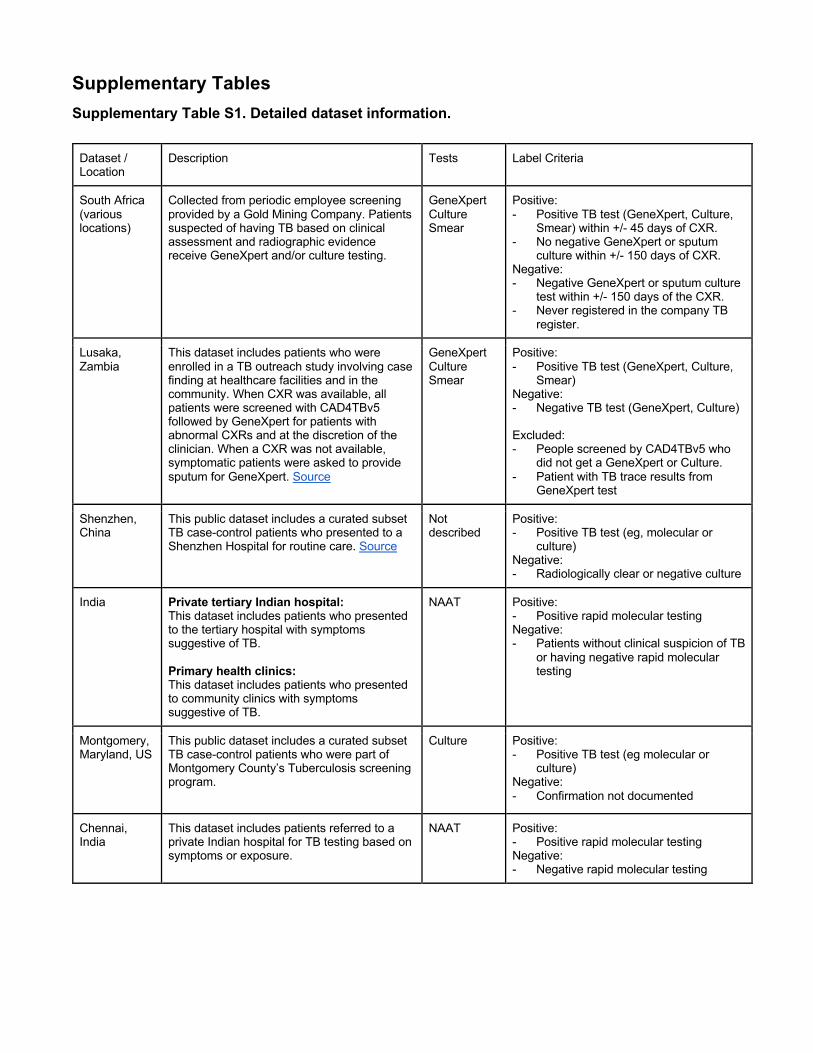
Supplementary Tables Supplementary Table S1. Detailed dataset information.
Dataset / Location
Description Tests Label Criteria
South Africa (various locations)
Collected from periodic employee screening provided by a Gold Mining Company. Patients suspected of having TB based on clinical assessment and radiographic evidence receive GeneXpert and/or culture testing.
GeneXpert Culture Smear
Positive: - Positive TB test (GeneXpert, Culture,
Smear) within +/- 45 days of CXR. - No negative GeneXpert or sputum
culture within +/- 150 days of CXR. Negative: - Negative GeneXpert or sputum culture
test within +/- 150 days of the CXR. - Never registered in the company TB
register.
Lusaka, Zambia
This dataset includes patients who were enrolled in a TB outreach study involving case finding at healthcare facilities and in the community. When CXR was available, all patients were screened with CAD4TBv5 followed by GeneXpert for patients with abnormal CXRs and at the discretion of the clinician. When a CXR was not available, symptomatic patients were asked to provide sputum for GeneXpert. Source
GeneXpert Culture Smear
Positive: - Positive TB test (GeneXpert, Culture,
Smear) Negative: - Negative TB test (GeneXpert, Culture) Excluded: - People screened by CAD4TBv5 who
did not get a GeneXpert or Culture. - Patient with TB trace results from
GeneXpert test
Shenzhen, China
This public dataset includes a curated subset TB case-control patients who presented to a Shenzhen Hospital for routine care. Source
Not described
Positive: - Positive TB test (eg, molecular or
culture) Negative: - Radiologically clear or negative culture
India Private tertiary Indian hospital: This dataset includes patients who presented to the tertiary hospital with symptoms suggestive of TB. Primary health clinics: This dataset includes patients who presented to community clinics with symptoms suggestive of TB.
NAAT Positive: - Positive rapid molecular testing Negative: - Patients without clinical suspicion of TB
or having negative rapid molecular testing
Montgomery, Maryland, US
This public dataset includes a curated subset TB case-control patients who were part of Montgomery County’s Tuberculosis screening program.
Culture Positive: - Positive TB test (eg molecular or
culture) Negative: - Confirmation not documented
Chennai, India
This dataset includes patients referred to a private Indian hospital for TB testing based on symptoms or exposure.
NAAT Positive: - Positive rapid molecular testing Negative: - Negative rapid molecular testing
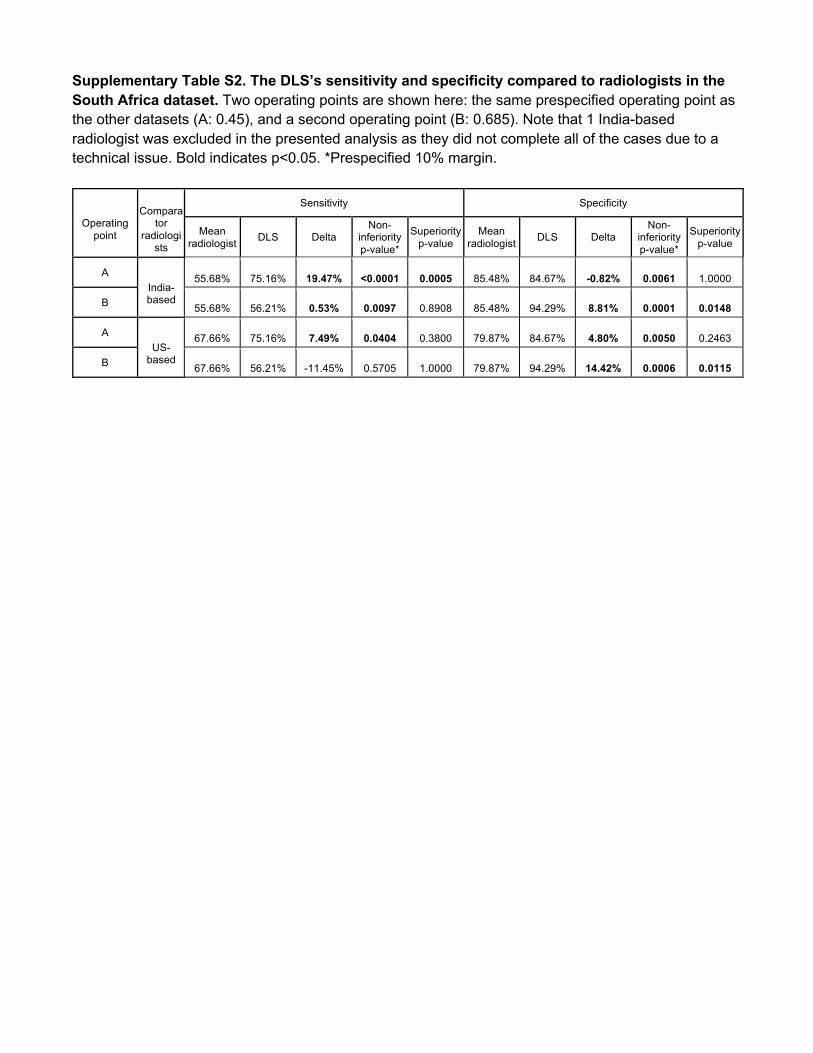
Supplementary Table S2. The DLS’s sensitivity and specificity compared to radiologists in the South Africa dataset. Two operating points are shown here: the same prespecified operating point as the other datasets (A: 0.45), and a second operating point (B: 0.685). Note that 1 India-based radiologist was excluded in the presented analysis as they did not complete all of the cases due to a technical issue. Bold indicates p<0.05. *Prespecified 10% margin.
Operating
point
Compara
tor radiologi
sts
Sensitivity Specificity
Mean radiologist DLS Delta
Non-inferiority p-value*
Superiority p-value
Mean radiologist DLS Delta
Non-inferiority p-value*
Superiority p-value
A India- based
55.68% 75.16% 19.47% <0.0001 0.0005 85.48% 84.67% -0.82% 0.0061 1.0000
B 55.68% 56.21% 0.53% 0.0097 0.8908 85.48% 94.29% 8.81% 0.0001 0.0148
A US-
based
67.66% 75.16% 7.49% 0.0404 0.3800 79.87% 84.67% 4.80% 0.0050 0.2463
B 67.66% 56.21% -11.45% 0.5705 1.0000 79.87% 94.29% 14.42% 0.0006 0.0115

Supplementary Table S3. Comparing sensitivity of AI and radiologists at (A) matching specificity and (B) matching sensitivity to individual radiologists in the external test set (Chennai, India) and a split-sample test set (Zambia). This analysis compared the AI with each individual radiologist. P-values are based on the Wald test for non-inferiority and McNemar test for superiority. Bold indicates p<0.05. *Prespecified 10% margin. A
Dataset Radiologist # Radiologist specificity (%)
Radiologist sensitivity (%) AI sensitivity Delta in
sensitivity Non-inferiority
p-value* Superiority p-
value
India: N=500 cases;
n=50 TB-positive (10%)
India 1 91.11% 86.00% 96.00% 10.00% < 0.001 0.059
India 2 99.56% 84.00% 82.00% -2.00% 0.037 1.000
India 3 98.89% 84.00% 84.00% 0.00% 0.021 1.000
India 4 99.56% 84.00% 82.00% -2.00% 0.065 1.000
India 5 98.22% 84.00% 88.00% 4.00% < 0.001 0.317
India 6 91.33% 94.00% 96.00% 2.00% 0.004 0.655
India 7 92.89% 86.00% 94.00% 8.00% 0.002 0.206
India 8 100.00% 80.00% 80.00% 0.00% 0.021 1.000
India 9 99.33% 82.00% 82.00% 0.00% 0.021 1.000
India 10* 99.56% 58.00% 82.00% 24.00% < 0.001 < 0.001
US 1 92.44% 94.00% 94.00% 0.00% 0.006 1.000
US 2 93.78% 90.00% 94.00% 4.00% 0.006 0.480
US 3 97.78% 86.00% 88.00% 2.00% 0.012 0.705
US 4 98.89% 78.00% 84.00% 6.00% 0.004 0.317
US 5 89.11% 94.00% 98.00% 4.00% < 0.001 0.157
Zambia: N=557 cases;
n=77 TB-positive (14%)
India 1 68.75% 84.42% 88.31% 3.90% < 0.001 0.257
India 2 72.50% 85.71% 85.71% 0.00% < 0.001 1.000
India 3 72.50% 84.42% 85.71% 1.30% 0.002 0.739
India 4 71.67% 81.82% 85.71% 3.90% < 0.001 0.180
India 5 64.58% 90.91% 89.61% -1.30% < 0.001 1.000
India 6 60.83% 88.31% 89.61% 1.30% < 0.001 0.564
India 7 61.25% 85.71% 89.61% 3.90% < 0.001 0.083
India 8 70.21% 85.71% 87.01% 1.30% < 0.001 0.317
India 9 74.79% 83.12% 85.71% 2.60% < 0.001 0.414
India 10* 86.67% 64.94% 75.32% 10.39% < 0.001 0.059
US 1 36.88% 97.40% 92.21% -5.19% 0.029 1.000
US 2 26.67% 97.40% 93.51% -3.90% 0.003 1.000
US 3 78.75% 50.65% 84.42% 33.77% < 0.001 < 0.001
US 4 58.96% 92.21% 89.61% -2.60% 0.010 1.000
US 5 48.75% 90.91% 92.21% 1.30% < 0.001 0.564
*This radiologist was an outlier and excluded in the other analyses (Supplementary Figure S2); presented here for completeness.
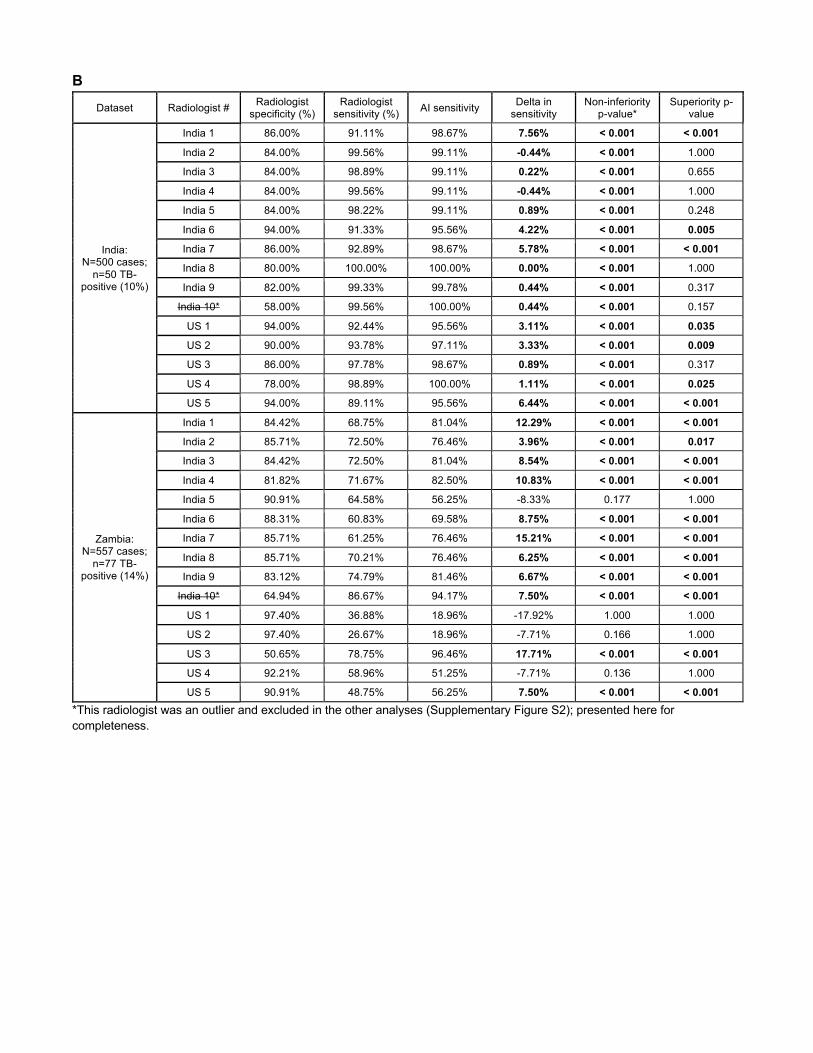
B Dataset Radiologist # Radiologist
specificity (%) Radiologist
sensitivity (%) AI sensitivity Delta in sensitivity
Non-inferiority p-value*
Superiority p-value
India: N=500 cases;
n=50 TB-positive (10%)
India 1 86.00% 91.11% 98.67% 7.56% < 0.001 < 0.001
India 2 84.00% 99.56% 99.11% -0.44% < 0.001 1.000
India 3 84.00% 98.89% 99.11% 0.22% < 0.001 0.655
India 4 84.00% 99.56% 99.11% -0.44% < 0.001 1.000
India 5 84.00% 98.22% 99.11% 0.89% < 0.001 0.248
India 6 94.00% 91.33% 95.56% 4.22% < 0.001 0.005
India 7 86.00% 92.89% 98.67% 5.78% < 0.001 < 0.001
India 8 80.00% 100.00% 100.00% 0.00% < 0.001 1.000
India 9 82.00% 99.33% 99.78% 0.44% < 0.001 0.317
India 10* 58.00% 99.56% 100.00% 0.44% < 0.001 0.157
US 1 94.00% 92.44% 95.56% 3.11% < 0.001 0.035
US 2 90.00% 93.78% 97.11% 3.33% < 0.001 0.009
US 3 86.00% 97.78% 98.67% 0.89% < 0.001 0.317
US 4 78.00% 98.89% 100.00% 1.11% < 0.001 0.025
US 5 94.00% 89.11% 95.56% 6.44% < 0.001 < 0.001
Zambia: N=557 cases;
n=77 TB-positive (14%)
India 1 84.42% 68.75% 81.04% 12.29% < 0.001 < 0.001
India 2 85.71% 72.50% 76.46% 3.96% < 0.001 0.017
India 3 84.42% 72.50% 81.04% 8.54% < 0.001 < 0.001
India 4 81.82% 71.67% 82.50% 10.83% < 0.001 < 0.001
India 5 90.91% 64.58% 56.25% -8.33% 0.177 1.000
India 6 88.31% 60.83% 69.58% 8.75% < 0.001 < 0.001
India 7 85.71% 61.25% 76.46% 15.21% < 0.001 < 0.001
India 8 85.71% 70.21% 76.46% 6.25% < 0.001 < 0.001
India 9 83.12% 74.79% 81.46% 6.67% < 0.001 < 0.001
India 10* 64.94% 86.67% 94.17% 7.50% < 0.001 < 0.001
US 1 97.40% 36.88% 18.96% -17.92% 1.000 1.000
US 2 97.40% 26.67% 18.96% -7.71% 0.166 1.000
US 3 50.65% 78.75% 96.46% 17.71% < 0.001 < 0.001
US 4 92.21% 58.96% 51.25% -7.71% 0.136 1.000
US 5 90.91% 48.75% 56.25% 7.50% < 0.001 < 0.001 *This radiologist was an outlier and excluded in the other analyses (Supplementary Figure S2); presented here for completeness.
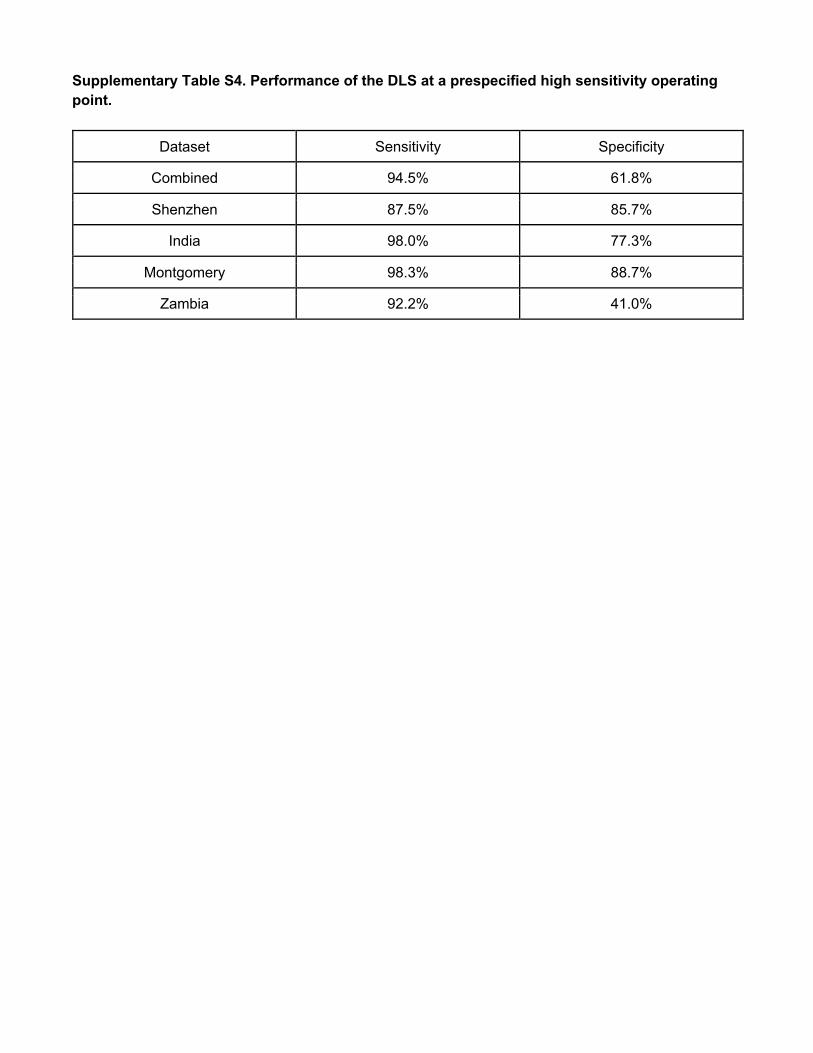
Supplementary Table S4. Performance of the DLS at a prespecified high sensitivity operating point.
Dataset Sensitivity Specificity
Combined 94.5% 61.8%
Shenzhen 87.5% 85.7%
India 98.0% 77.3%
Montgomery 98.3% 88.7%
Zambia 92.2% 41.0%
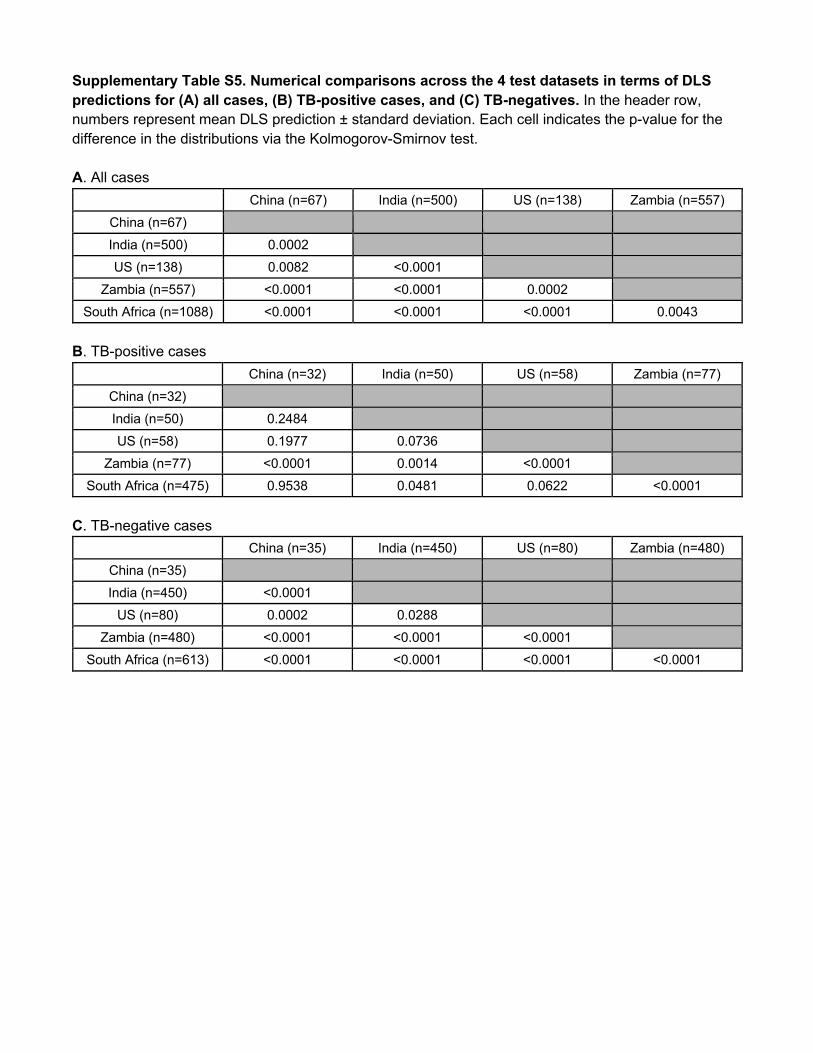
Supplementary Table S5. Numerical comparisons across the 4 test datasets in terms of DLS predictions for (A) all cases, (B) TB-positive cases, and (C) TB-negatives. In the header row, numbers represent mean DLS prediction ± standard deviation. Each cell indicates the p-value for the difference in the distributions via the Kolmogorov-Smirnov test. A. All cases
China (n=67) India (n=500) US (n=138) Zambia (n=557)
China (n=67)
India (n=500) 0.0002
US (n=138) 0.0082 <0.0001
Zambia (n=557) <0.0001 <0.0001 0.0002
South Africa (n=1088) <0.0001 <0.0001 <0.0001 0.0043
B. TB-positive cases
China (n=32) India (n=50) US (n=58) Zambia (n=77)
China (n=32)
India (n=50) 0.2484
US (n=58) 0.1977 0.0736
Zambia (n=77) <0.0001 0.0014 <0.0001
South Africa (n=475) 0.9538 0.0481 0.0622 <0.0001
C. TB-negative cases
China (n=35) India (n=450) US (n=80) Zambia (n=480)
China (n=35)
India (n=450) <0.0001
US (n=80) 0.0002 0.0288
Zambia (n=480) <0.0001 <0.0001 <0.0001
South Africa (n=613) <0.0001 <0.0001 <0.0001 <0.0001