Embed Size (px)
Citation preview

Contents lists available at ScienceDirect
Deep–Sea Research I
journal homepage: www.elsevier.com/locate/dsri
Decoupling between bacterial production and primary production overmultiple time scales in the North Pacific Subtropical Gyre
Donn A. Viviania,b,⁎, Matthew J. Churcha,b,1
a Department of Oceanography, University of Hawaii at Manoa, Honolulu, HI, USAb Center for Microbial Oceanography: Research and Education, University of Hawaii, Honolulu, HI, USA
A R T I C L E I N F O
Keywords:3H-leucine incorporationPrimary productionTime-seriesNorth Pacific OceanStation ALOHA
A B S T R A C T
We measured rates of 3H-leucine (3H-Leu) incorporation, as a proxy for bacterial production, at Station ALOHA(22°45′N, 158°W) in the oligotrophic North Pacific Subtropical Gyre (NPSG). We report measurementsconducted between January 2011 and April 2013, examining variability in 3H-Leu incorporation over diel,daily, and monthly time scales. Rates of 3H-Leu were evaluated in the context of contemporaneous 14C-basedprimary productivity (14C-PP) to identify potential temporal coupling between these measures of productivity.Throughout the upper ocean (0–125 m), rates of 3H-Leu incorporation measured in the light (3H-LeuLight) werestimulated (1.5-fold, on average) relative to measurements in the dark (3H-LeuDark). At monthly scales, rates of3H-LeuLight and
3H-LeuDark varied 4.9-fold and 3.8-fold, respectively, while rates of 14C-PP varied 1.7-fold.Rates of 14C-PP were often elevated during summer months (May through August) when incident light flux wasgreatest, while rates of both 3H-LeuLight and
3H-LeuDark often peaked in early fall (August through October)when seawater temperatures were maximal. Near-daily measurements of 3H-Leu incorporation and 14C-PPconducted over a 62-day period in the summer of 2012 revealed that rates of 3H-LeuLight and
3H-LeuDark varied~2.5 and 2.0-fold, respectively, similar to ~1.8-fold daily variability observed in rates of 14C-PP. Over diel timescales, rates of 3H-LeuLight and
3H-LeuDark demonstrated different patterns, with rates of 3H-LeuLight elevated atmid-day and rates of 3H-LeuDark greatest in the early evening. Together, these results suggest that in thisoligotrophic ecosystem, photosynthetic production of organic matter and bacterial production can be temporallyuncoupled across daily to seasonal scales.
1. Introduction
The ocean supports nearly half of global net primary productivity(PP), with much of that production occurring in the oligotrophic gyresof the open ocean (Behrenfeld and Falkowski, 1997; Field et al., 1998).A significant fraction of this photosynthetically-fixed carbon supportsthe growth and metabolic activities of bacterioplankton (del Giorgioet al., 1997; Duarte and Cebrian, 1996; Ducklow and Carlson, 1992).Bacterial production (BP) of biomass is a central component of aquaticfood webs (Azam et al., 1983; Pomeroy, 1974), estimated to account for10–15% of net PP in open ocean ecosystems (Ducklow, 1999; Ducklowand Carlson, 1992), with bacterial demand for organic matter (in-clusive of requirements for biomass production and respiration)accounting for > 70% of contemporaneous rates of primary production(Church, 2008; Kirchman, 2004). Hence, estimates of the magnitudeand variability associated with bacterial growth in the sea are critical tounderstanding ocean carbon cycling.
Examining spatiotemporal coupling between BP and PP providesinsight into the relative dependence of bacterial growth on contem-poraneous phytoplankton production. The nature of the couplingbetween BP and PP is generally quantified based on correlative orregression analyses (Ducklow and Carlson, 1992; Joint and Pomroy,1987). Such analyses provide insight into the strength of couplingbetween photosynthetic production of organic matter and its consump-tion by heterotrophic bacteria (Billen et al., 1990; Ducklow andCarlson, 1992). The nature of such coupling can be regulated bynumerous processes, including availability of inorganic and organicnutrients, grazing pressure, and temperature (Alonso-Sáez et al., 2008;Billen et al., 1990; Carlson et al., 1996; Cotner and Biddanda, 2002;Fouilland et al., 2014; Shiah and Ducklow, 1994). To date there are fewstudies examining temporal coupling between BP and PP in open oceanecosystems (although see Carlson et al., 1996; Ducklow and Carlson,1992; Ducklow et al., 2012; Steinberg et al., 2001; Van Wambeke et al.,2008); this coupling has also been examined in coastal, estuarine, and
http://dx.doi.org/10.1016/j.dsr.2017.01.006Received 17 June 2016; Received in revised form 6 January 2017; Accepted 16 January 2017
⁎ Correspondence to: University of Hawaii at Manoa, Department of Oceanography, 1950 East-West Road, Honolulu, HI 96822, USA.
1 Current address: Flathead Lake Biological Station, University of Montana, Polson, MT, USA.E-mail address: [email protected] (D.A. Viviani).
Deep–Sea Research Part I 121 (2017) 132–142
Available online 18 January 20170967-0637/ © 2017 The Authors. Published by Elsevier Ltd. This is an open access article under the CC BY-NC-ND license (http://creativecommons.org/licenses/BY-NC-ND/4.0/).
MARK

freshwater systems (e.g. Fuhrman et al., 1985; Pace and Cole, 1994;Shiah and Ducklow, 1994). Some of these studies describe significantpositive correlations between BP and PP; however, the nature of theserelationships can be complicated by lagged responses in BP relative toPP (e.g. Steinberg et al., 2001). For example, at the Bermuda AtlanticTime-series Study (BATS) in the Sargasso Sea, rates of BP demonstrateweak to moderate seasonality, generally increasing 2–3-fold duringmid-summer and declining into fall and winter (Carlson et al., 1996;Steinberg et al., 2001). In contrast, rates of 14C-primary production(14C-PP) demonstrate relatively strong seasonality, varying up to 5-foldover the year, peaking in early spring (Michaels et al., 1994; Steinberget al., 2001). The seasonal-scale decoupling of PP and BP in thisecosystem coincides with patterns in the production and removal ofdissolved organic carbon (DOC), resulting in concentrations of DOCincreasing throughout the spring and summer (Carlson et al., 1994;Hansell and Carlson, 1998). Such seasonal-scale decoupling in 14C-PPand BP in this ecosystem results in net production of DOC, which isavailable for subsequent export (via convective mixing) during thewinter (Carlson et al., 1994). Hence, the coupling between contem-poraneous 14C-PP and BP plays potentially important roles in carbonexport and cycling.
Since 1988, the Hawaii Ocean Time-series (HOT) program hasconducted near-monthly measurements of ocean biogeochemistry andhydrography at the open ocean field site Station ALOHA (22°45′N,158°00′W) in the North Pacific Subtropical Gyre (NPSG). Thisecosystem is characterized by a deep euphotic zone (the depth towhich 1% of the surface light flux penetrates at Station ALOHAaverages 105 ± 10 m), persistently low concentrations of inorganicnutrients, and picoplankton ( < 2 µm) comprising a large fraction ofupper ocean biomass (Campbell et al., 1994; Rii et al., 2016).Moreover, rates of PP in this ecosystem appear sustained in large partby intensive recycling of nutrients through the metabolic activities ofplanktonic microorganisms (Karl, 1999). HOT program measurementsof 14C-PP reveal significant seasonality, with rates increasing 2–3-foldin summer, coincident with increased insolation (Church et al., 2013;Karl et al., 2012; Letelier et al., 2004). Despite these seasonal-scaleincreases in 14C-PP, rates of photosynthetic production of DOC (asmeasured by production of extracellular 14C-DOC) do not demonstratesignificant seasonality or apparent relationships to rates of 14C-PP(Viviani et al., 2015). To date however, less is known about temporalvariability in BP, or possible relationships between rates of BP and PPin this ecosystem. Previous work at ALOHA has demonstrated thatsunlight stimulates rates of 3H-leucine (3H-Leu) incorporation (Churchet al., 2006, 2004), a proxy for BP, an effect that appears largely drivenby incorporation of 3H-Leu by the unicellular cyanobacteriumProchlorococcus (Björkman et al., 2015; Church et al., 2006, 2004).
In this study, we measured rates of 3H-Leu incorporation and 14C-PP over diel to near-monthly time scales at Station ALOHA. Doing soallowed us to evaluate potential coupling between BP and PP over arange of time scales and provided insight into factors controlling theseprocesses in this persistently oligotrophic habitat.
2. Methods
2.1. 14C-primary production and 3H-leucine incorporationmeasurements
Samples were collected at or in the vicinity of Station ALOHA on 24different cruises between January 2011 and April 2013. On each cruise,rates of 3H-Leu incorporation into protein were measured (Kirchmanet al., 1985; Simon and Azam, 1989). Coincident measurements ofplankton assimilation of 14C-bicarbonate were utilized as a proxy fornet PP (Marra, 2009; Steemann Nielsen, 1952). Seawater samples forboth measurements of production were collected from pre-dawnvertical hydrocasts at 6 discrete depths (5, 25, 45, 75, 100, 125 m)using polyvinyl chloride sampling bottles affixed to a rosette sampler
equipped with Sea-Bird 911+ conductivity, temperature, and depth(CTD) sensors (Karl and Lukas, 1996). Measurements of 14C-PP wereconducted following HOT program protocols (Letelier et al., 1996).Briefly, seawater was subsampled under subdued light from the rosettesampling bottles into triplicate acid-cleaned 500 ml polycarbonatebottles. Samples were inoculated with 14C-bicarbonate to a final activityof ~1.85 MBq, affixed to a free-drifting array, and incubated in situover the full photoperiod (ranging 11–13 h). During the summer of2012, rates of 14C-PP were measured daily as part of the Center forMicrobial Oceanography: Research and Education (C-MORE) HOE-DYLAN cruises. For these near-daily scale measurements, seawaterwas collected at 25 m from a predawn CTD rosette cast; triplicate500 ml polycarbonate bottles were filled from the CTD rosette bottles,inoculated with ~1.85 MBq 14C-bicarbonate, and placed for the dura-tion of the photoperiod in a seawater-cooled, deckboard incubator,shaded with blue Plexiglass to ~30% of surface irradiance.
At the end of the photoperiod, bottles were retrieved from theincubator or the in situ array, and 250 µl was subsampled from eachsample bottle into a 20 ml glass scintillation vial containing 500 µl ofβ–phenethylamine for subsequent determination of the total activity of14C added to each sample. The remaining sample volume was gentlyvacuum filtered onto 25 mm diameter glass fiber filters (Whatman GF/F). Filters were placed in glass 20 ml scintillation vials and storedfrozen until analysis. At the shore-based laboratory, filters were thawedand 1 ml of 2 mol L−1 hydrochloric acid was added to each filter; filterswere allowed to passively vent in a fume hood overnight. After venting,10 ml of Ultima Gold (Perkin Elmer) liquid scintillation cocktail wasadded to each filter and to the total activity vials; vials were placed in aliquid scintillation counter for determination of the resulting 14Cactivities. Samples were stored in the dark and recounted after amonth; the values from the second counts were used to calculate ratesof 14C-PP (Karl et al., 1998).
Seawater for measurements of 3H-Leu incorporation was collectedfrom the same CTD hydrocasts and depths as coincident 14C-PPmeasurements. Polyethylene amber bottles (125 ml capacity) weresubsampled from the CTD rosette bottles, and duplicate acid-cleaned12 ml polycarbonate centrifuge tubes (Nalgene Oak Ridge) were filledfrom each depth. Each polycarbonate tube was inoculated with20 nmol L−1 (final concentration) 3,4,5-3H-leucine (Perkin Elmer;stock specific activities ranged from 108 to 144 Ci/mmol). An addi-tional 1.5 ml per depth was subsampled into 2 ml microcentrifugetubes (Axygen; Pace et al., 2004) containing 100 µl of 100% (w/v) ice-cold trichloroacetic acid (TCA) to serve as a killed blank. Thepolycarbonate sample tubes were capped and incubated in situ overthe photoperiod to measure rates of 3H-Leu incorporation in both dark(through use of black cloth bags; hereafter 3H-LeuDark) and light(hereafter 3H-LeuLight) on the same free-drifting array utilized for the14C-PP measurements. At the end of the photoperiod, triplicate 1.5 mlsubsamples were removed from each tube and added to 2 ml micro-centrifuge tubes (Axygen) containing 100 µl of 100% ice-cold TCA;these tubes were stored frozen until analysis. Samples were processedfollowing a modified method of the microcentrifuge method (Smith andAzam, 1992). Microcentrifuge tubes were spun at ~23,900g for 15 minat 4 °C in a refrigerated microcentrifuge; supernatants were decanted,1 ml ice-cold 5% TCA was added to each microcentrifuge tube andsamples were spun for an additional 5 min at ~23,900g at 4 °C.Supernatants were decanted and 1 ml of 80% ethanol was added toeach sample, and tubes were spun for an additional 5 min at ~23,900gat 4 °C. After decanting supernatants, samples were left uncapped for12–16 h in a fume hood to evaporate any residual ethanol from themicrocentrifuge tubes. When samples had completely dried, 1 ml ofUltima Gold LLT scintillation cocktail was added to each tube, thetubes were vortexed, placed into 7 ml polyethylene scintillation vials(serving as a carrier vials) and counted on a liquid scintillation counter.
During the summer of 2012, rates of 3H-Leu incorporation weremeasured at near-daily time scales during a series of cruises to Station
D.A. Viviani, M.J. Church Deep–Sea Research Part I 121 (2017) 132–142
133

ALOHA as part of the C-MORE HOE-DYLAN cruises. For thesemeasurements, seawater samples from 25 m were collected from apredawn CTD rosette cast; the seawater was transferred into 125 mlamber polyethylene bottles and triplicate 1.5 ml subsamples wereadded to 2 ml microcentrifuge tubes (Axygen) containing 3H-Leu(20 nmol L−1
final concentration). Triplicate samples were incubatedin the dark (inside a black cloth bag) and in the light using the samedeckboard incubator used for 14C-PP measurements. Blank (TCAkilled) samples were prepared as previously described. In addition,we performed higher frequency “diel” sampling over a 48-h period(August 31 to September 1), in which 25 m samples were collectedevery four hours, and samples were incubated in the same deckboardincubator previously described. Measurements conducted during day-light hours included both dark and light incubations (as describedpreviously), while nighttime incubations were only incubated in thedark. The resulting measured rates of 3H-Leu incorporation were fit inMATLAB (Mathworks) using a nonlinear least squares fit to asinusoidal model (John et al., 2011).
2.2. Time-course experiments to evaluate linearity of 3H-leucineincorporation
Measurements of 3H-Leu incorporation were conducted during themonthly HOT program cruises on the same free-drifting array used formeasurements of 14C-PP, allowing incubation of samples under in situtemperature and light conditions. However, this procedure resulted inrelatively long incubation times (photoperiods ranging 11–13 h), andthus had the potential to underestimate 3H-Leu incorporation ratesdue to increased likelihood of turnover of the 3H-labeled protein pool(Kirchman et al., 1986). To evaluate potential non-linearity in rates of3H-Leu incorporation, we performed a series of time-course incubationexperiments (April 2013, May 2013, June 2013, and May 2014). Forthese experiments, samples were incubated between 3 and 15 h toascertain the period over which rates of 3H-Leu incorporation into TCAinsoluble macromolecules remained linear. Seawater (5 m and 25 m)was subsampled into amber polyethylene bottles from the CTD rosette;1.5 ml subsamples were aliquoted into 2 ml microcentrifuge tubes(Axygen) and inoculated with 20 nmol L−1 (final concentration) 3H-leucine. Samples were incubated in a surface seawater-cooled incuba-tor, in both light and dark (as described previously), and triplicate1.5 ml samples were sacrificed at regular intervals to evaluate therelationship between incubation time and 3H activity (measured asdisintegrations per minute, dpm).
Least squares regression analyses were used to evaluate therobustness of linear model fits to observations of 3H-Leu incorporationover time; candidate models were chosen that included both linear andsaturation phases. Akaike information criterion (AIC) scores (Burnhamet al., 2010) were calculated and used to select the model with the bestfit to the time-course activity measurements. We used the model withthe best fit to determine the time period over which these incubationexperiments remained linear. We then corrected for non-linearityderiving from incubation length for our measured rates of 3H-LeuDarkand 3H-LeuLight from in situ incubations on each cruise:
H−Leu incorporation = H −Leu
+ [time of incubation–period of linearity]*( H −Leu /incubation period of linearity)
3 3measured
3measured (1)
where 3H-Leumeasured is the rate of 3H-Leu incorporation measured inthe incubation, time of incubation is the duration of each incubation,and period of linearity (in hours) is the time over which theincorporation was linear.
2.3. Contextual measurements of light, cell abundances, and nutrients
The daily flux of incoming photosynthetically active radiation (PAR;
400–700 nm) was measured using a deckboard LI-COR LI-192 cosinecollector. Vertical profiles of downwelling photosynthetically activeradiation (PAR) were measured at noon using a Satlantic HyperProradiometer; in addition, a deckboard radiometer (Satlantic) collectedcoincident measurements of incident PAR. These measurements wereused to derive attenuation coefficients of PAR (KPAR) for each cruise.Derived KPAR values and incident surface irradiance were used tocalculate daily light fluxes at specific depth horizons.
Cellular abundances of non-pigmented picoplankton andProchlorococcus were enumerated by flow cytometry. Briefly, seawatersamples were fixed with 0.25% final concentration of paraformalde-hyde, flash frozen at −80 °C, and analyzed using an Influx Mariner flowcytometer (Cytopeia) following standard HOT protocols (http://hahana.soest.hawaii.edu/hot/methods/bact.html). Inorganic nutrientconcentrations (nitrate + nitrite, N+N and soluble reactive phosphorus,SRP) and chlorophyll a concentrations were collected and analyzedusing standard HOT program protocols (Karl et al., 2001).
2.4. Statistical data analysis and carbon conversion
Seasonal binning of data was defined based on the solstice toequinox (i.e. Spring from March 20 to June 20; Summer from June 21to September 22, Fall from September 23 to December 20, and Winterfrom December 21 to March 19). Depth-integrated (0–125 m) ratesand stocks were calculated using trapezoidal integration. Statisticalanalyses and curve fitting were performed using MATLAB (Mathworks)or in the R statistical environment (R Development Core Team, 2008).Data that did not meet the assumptions of normality were log10transformed prior to analysis. For statistical treatment of ratios,geometric mean and standard deviations were used (Zar, 1999).Least squares linear regression analyses were utilized to examinepotential temporal coupling between measured rates of 14C-PP and3H-Leu. In addition, measurements of 14C-PP, PAR, temperature,chlorophyll a, and picoplankton abundances were used for stepwisemultiple linear regression analyses to examine how variability inhabitat conditions influenced rates of BP. Stepwise multiple linearregressions were performed through sequential addition of terms to alinear model, retaining those terms whose inclusion resulted in a modelwith a p-value < 0.05; this procedure generated an n-order polynomial,where n is the number of terms successfully retained in the final model.We also examined our time-series for possible lags in the relationshipsbetween 14C-PP and 3H-LeuDark or 3H-LeuLight at daily scales (duringthe summer of 2012) and at monthly scales. For monthly lags, webinned rates of 14C-PP, 3H-LeuDark, and
3H-LeuLight by month and theninterrogated these monthly time-series for lagged relationships. Dailyrates of 3H-Leu incorporation were computed as the rate of 3H-LeuLightmultiplied by the duration of the photoperiod, plus the rate of 3H-LeuDark multiplied by the length of the nighttime period.
3. Results
The current study sought to examine temporal relationshipsbetween BP and PP at Station ALOHA in the persistently oligotrophicupper ocean (0–125 m) habitat of the NPSG. A total of 24 differentcruises at or in the vicinity of Station ALOHA were sampled over an ~2-year period. Throughout the study, sea surface temperatures (SST)varied from 22.5 to 26.8 °C, reaching an annual maximum inSeptember and October, and minimum during the late winter(February and March). The mixed layer fluctuated between 34 and126 m, with deeper mixed layers in the winter, followed by rapidshoaling and stratification through the spring to early fall (Fig. 1).Incident PAR fluctuated between 15.2 and 48.4 mol quanta m−2 d−1,with lower fluxes in the winter, increasing steadily from the spring intothe summer (Fig. 1). Concentrations of inorganic nutrients (specificallyN+N and SRP) were persistently low (averaging 4 ± 2 nmol N L−1 and100 ± 49 nmol P L−1, respectively) in the well-lit regions ( < 45 m) of
D.A. Viviani, M.J. Church Deep–Sea Research Part I 121 (2017) 132–142
134

the upper ocean, with concentrations increasing sharply at depthsbelow which PAR fluxes were < 5 mol quanta m−2 d−1. Rates of 14C-PPmeasured during this study (2011–2013) demonstrated depth-depen-dent patterns consistent with the historical HOT program measure-ments, with rates in the upper euphotic zone (0–45 m) approximately
3-fold greater than those in the lower euphotic zone (75–125 m;Fig. 1). When sampled at near-monthly time scales, depth-integrated(0–125 m) rates of 14C-PP varied less than 2-fold, ranging 2.7 and4.6 mmol C m−2 h−1, with a major fraction (46–75%) of this productionoccurring in the upper 45 m of the water column (Table 1).
3.1. Time-course experiments to examine linearity in 3H-leucineincorporation
Use of in situ incubations for measuring rates of 3H-Leu incorpora-tion and 14C-PP enabled mimicking of light and temperature condi-tions from depths where the samples were collected. To examinewhether the incorporation of 3H-Leu remained linear over thesephotoperiod incubations (11–13 h), we conducted time-course experi-ments (incubations ranging from 3 to 16 h) in both the light and darkin deck-board incubators. Least-squares regression analyses were usedto fit hyperbolic tangent models to the time-course measurements(Fig. 2). In these experiments 3H-Leu incorporation remained linearfor 9 ± 2 h. Comparing the rates of 3H-Leu incorporation derived basedon a linear fit over the initial ~9 h of these experiments to thehyperbolic tangent fit of the full photoperiod incubations (11–13 h),demonstrated that the photoperiod measurements underestimatedboth 3H-LeuDark and 3H-LeuLight by 48–70%. The resulting regressionanalyses were used to correct rates of 3H-LeuDark and 3H-LeuLightmeasured over the photoperiod.
3.2. Monthly-scale variability in rates of 3H-leucine incorporation
On near-monthly HOT cruises, rates of 3H-Leu incorporation weremeasured coincident with HOT program measurements of 14C-PP.Rates of both 3H-LeuDark and
3H-LeuLight showed vertically-dependentpatterns (Fig. 3), with depth-integrated rates significantly greater in thewell-lit upper euphotic zone (0–45 m) compared to the lower euphoticzone (75–125 m; t-test; p < 0.0001; Table 1). Rates of both 3H-LeuDarkand 3H-LeuLight in the upper euphotic zone ( < 45 m) ranged 3–15pmol Leu L−1 h−1 and 4–26 pmol Leu L−1 h−1, respectively. In thelower euphotic zone (75–125 m) rates of 3H-LeuDark and 3H-LeuLightranged 1–10 pmol Leu L−1 h−1 and 1–15 pmol Leu L−1 h−1,respectively (Fig. 3). The ratio of 3H-LeuLight to
3H-LeuDark (L: D ratio)averaged 1.5 throughout the euphotic zone (0–125 m) and demon-strated no significant depth-dependent pattern (one-way ANOVA, p >0.05; Fig. 3). The difference between 3H-LeuLight and 3H-LeuDark(ΔLeu; ΔLeu = 3H-LeuLight - 3H-LeuDark) averaged 5 ± 3 pmol LeuL−1 h−1 in the upper euphotic zone, and 2 ± 3 pmol Leu L−1 h−1 in thelower euphotic zone. The resulting depth-integrated (0–125 m) rates of3H-LeuDark ranged from 0.3 to 1.2 µmol Leu m−2 h−1 (averaging 0.7 ±0.2 µmol Leu m−2 h−1), while the rates of 3H-LeuLight varied between0.4 and 1.9 Leu m−2 h−1 (averaging 1.2 ± 0.4 µmol Leu m−2 h−1; Fig. 4).There were no significant interannual differences in the depth-inte-grated (0–125 m) rates of 3H-LeuDark measured in 2011 and 2012 (t-
Fig. 1. Measurements of mixed layer depth (MLD) from HOT cruises and sea surfacetemperature (SST) from the WHOI Hawaii Ocean Time-series (WHOTS) mooring duringthis study (panel A). Rates of 14C-PP measured during this study (color contours; panelB) overlain by downwelling photosynthetically active radiation (PAR; in units of molquanta m−2 d−1; white contours). The climatology of monthly-binned depth-integrated(0–125 m) rates of 14C-PP and surface PAR at Station ALOHA (panel C); error bars areone standard deviation of the time-averaged mean.
Table 1Depth-integrated stocks and rate measurements during this study, including mean ± standard deviation (SD) and ranges (in parenthesis) for rates of 3H-LeuDark and 3H-LeuLight(nmol Leu m−2 h−1), abundances of Prochlorococcus (Pro) and non-pigmented picoplankton (non-pigs). Also shown are rates of 14C-PP (mmol C m−2 h−1) and the ratio of daily rates ofBP to 14C-PP (as a percent).
Depth 3H-LeuDark3H-LeuLight Pro non-pigs 14C-PP BP: 14C-PP (%)
(m) (nmol Leu m−2 h−1) (nmol Leum−2 h−1) (cells*1011 m−2) (cells*1011 m−2) (mmol C m−2 h−1)
0–45 360 ± 116 576 ± 204 86 ± 16 214 ± 26 2.0 ± 0.4 6 ± 2(143–622) (197–1003) (65–111 (179–282) (1.2–3.2) (2–9)
75–125 181 ± 64 299 ± 134 74 ± 19 207 ± 21 0.7 ± 0.2 9 ± 4(102–316) (90–573) (38–110) (171–235) (0.3–1.2) (4–22)
0–125 739 ± 204 1198 ± 387 222 ± 33 562 ± 46 3.6 ± 0.5 7 ± 2(313–1198) (384–1893) (175–276) (478–670) (2.7–4.6) (3–9)
D.A. Viviani, M.J. Church Deep–Sea Research Part I 121 (2017) 132–142
135

test; p > 0.05); however, the resulting depth-integrated (0–125 m)rates of 3H-LeuLight were significantly lower in 2012 than in 2011 (t-test; p > 0.001). Consequently, L:D ratios of the depth-integrated (0–125 m) rates from early 2011 through July 2012 averaged 1.8, whileL:D ratios after July 2012 averaged 1.2. Throughout the study period,rates of 3H-LeuDark and 3H-LeuLight demonstrated a significant linearrelationship (Model II linear regression; r2 =0.45; p < 0.0001; Table 2).
The resulting depth-integrated rates of 14C-PP during this study inthe upper euphotic zone (0–45 m) were greater than those in the lowereuphotic zone (75–125 m; t-test; p < 0.0001; Table 1). Rates of 14C-PPin the upper euphotic zone ( < 45 m) ranged 19–84 nmol C L−1 h−1
(averaging 44 ± 10 nmol C L−1 h−1), while rates in the lower euphoticzone (75–125 m) ranged 1–41 nmol C L−1 h−1 (averaging 14 ± 9nmol C L−1 h−1). Rates of 14C-PP did not demonstrate statisticallysignificant interannual differences between 2011 and 2012 (t-test; p> 0.05). Rates of 14C-PP remained relatively elevated during the winterof 2011–2012 (Fig. 4); upper euphotic zone (0–45 m) rates of 14C-PPmeasured in November 2011 were above the 95% upper confidenceintervals derived from 24 years of HOT program measurements for themonth of November. This pattern was not observed in rates of either
3H-LeuLight or 3H-LeuDark (Fig. 4). During this study, there was nosignificant correlation between 14C-PP and rates of either 3H-LeuLightor 3H-LeuDark at either 25 or 100 m (Supplementary Table 1) or whendepth-integrated (0–125 m) rates were examined. However, when a 3-month lag was applied to rates measured at the 25 m depth horizon, asignificant relationship was observed between rates of 3H-LeuDark and14C-PP at near-monthly time scales (Model II linear regression p <0.05; Table 2). There were no other significant relationships between14C-PP and lagged monthly rates of 3H-LeuLight or
3H-LeuDark (whenexamining lags of up to 6 months). Rates of ΔLeu at 25 m weresignificantly related to fluctuations in 14C-PP, but the relationship wasrelatively weak (Model II linear regression r2 =0.16; p < 0.001;Table 2).
3.3. Daily and diel scale variability in rates of 3H-Leu incorporationand 14C-PP
During the summer of 2012, rates of 3H-Leu incorporation and 14C-PP were measured at 25 m at near-daily time scales to assess potentialcoupling between these processes. During this period, rates of 3H-
Fig. 2. Representative time-course experiment conducted on HOT 252 (May 2013) depicting disintegrations per minute (dpm) as a function of time measured during the 3H-LeuDark(panel A) and 3H-LeuLight (panel B) incubations. Also shown are the least squares regression fits for linear (solid grey line) and hyperbolic tangent models (dashed black line).
Fig. 3. Depth profiles of 3H-LeuDark (panel A),3H-LeuLight (panel B), and ratio of 3H-LeuLight:
3H-LeuDark (panel C). Individual measurements are given as filled circles (3H-LeuDark),open squares (3H-LeuLight), and open diamonds (L:D ratio). Larger symbols connected by lines represent time-averaged mean values.
D.A. Viviani, M.J. Church Deep–Sea Research Part I 121 (2017) 132–142
136
LeuDark and 3H-LeuLight varied 2- and 2.5-fold, respectively, with 3H-LeuLight and
3H-LeuDark ranging between 6 and 13 pmol Leu L−1 h−1
and 8 and 20 pmol Leu L−1 h−1, respectively (Fig. 5). Over near-dailyscales, rates of 14C-PP at 25 m varied 1.8-fold, ranging between 32 and58 nmol C L−1 h−1 (Fig. 6). Consistent with the near-monthly scalepatterns, neither 3H-LeuDark nor 3H-LeuLight were significantly relatedto daily-scale variations in rates of 14C-PP. We examined linearrelationships between rates of 14C-PP and 3H-LeuLight and 3H-LeuDark measured at daily scales over the summer of 2012, includinglags of up to seven days, and found no significant relationship between14C-PP and 3H-LeuDark or 3H-LeuLight at any of those lags (Model II
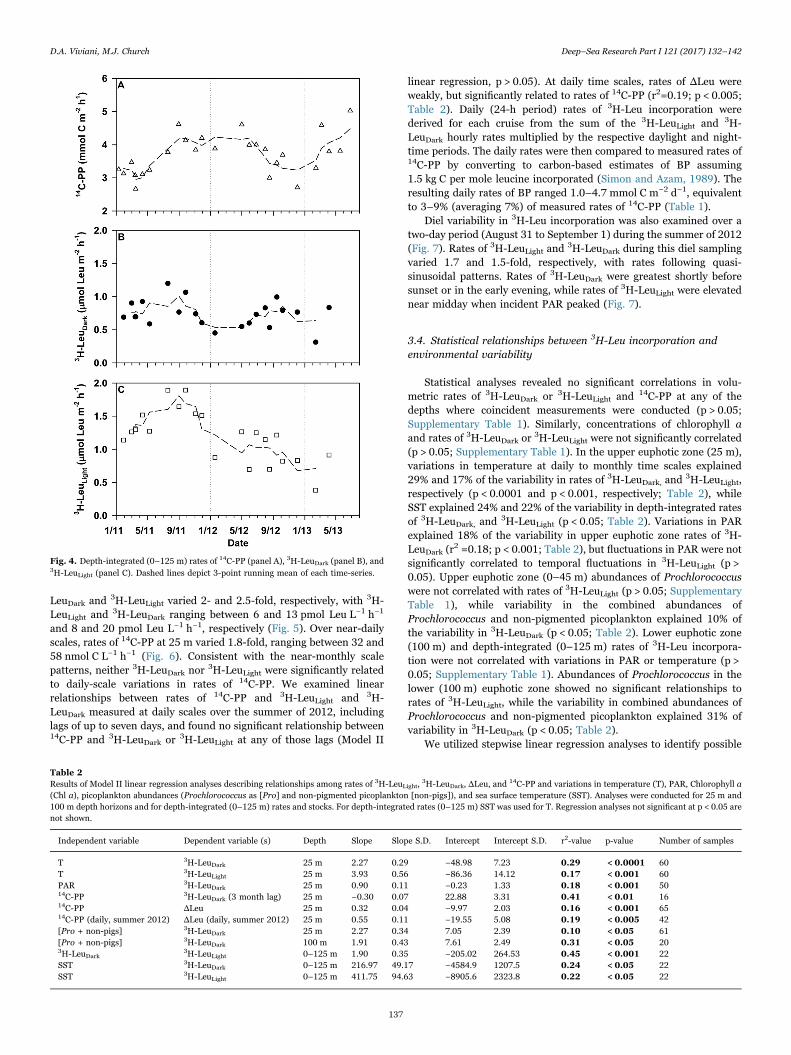
linear regression, p > 0.05). At daily time scales, rates of ΔLeu wereweakly, but significantly related to rates of 14C-PP (r2=0.19; p < 0.005;Table 2). Daily (24-h period) rates of 3H-Leu incorporation werederived for each cruise from the sum of the 3H-LeuLight and 3H-LeuDark hourly rates multiplied by the respective daylight and night-time periods. The daily rates were then compared to measured rates of14C-PP by converting to carbon-based estimates of BP assuming1.5 kg C per mole leucine incorporated (Simon and Azam, 1989). Theresulting daily rates of BP ranged 1.0–4.7 mmol C m−2 d−1, equivalentto 3–9% (averaging 7%) of measured rates of 14C-PP (Table 1).
Diel variability in 3H-Leu incorporation was also examined over atwo-day period (August 31 to September 1) during the summer of 2012(Fig. 7). Rates of 3H-LeuLight and
3H-LeuDark during this diel samplingvaried 1.7 and 1.5-fold, respectively, with rates following quasi-sinusoidal patterns. Rates of 3H-LeuDark were greatest shortly beforesunset or in the early evening, while rates of 3H-LeuLight were elevatednear midday when incident PAR peaked (Fig. 7).
3.4. Statistical relationships between 3H-Leu incorporation andenvironmental variability
Statistical analyses revealed no significant correlations in volu-metric rates of 3H-LeuDark or 3H-LeuLight and 14C-PP at any of thedepths where coincident measurements were conducted (p > 0.05;Supplementary Table 1). Similarly, concentrations of chlorophyll aand rates of 3H-LeuDark or
3H-LeuLight were not significantly correlated(p > 0.05; Supplementary Table 1). In the upper euphotic zone (25 m),variations in temperature at daily to monthly time scales explained29% and 17% of the variability in rates of 3H-LeuDark, and
3H-LeuLight,respectively (p < 0.0001 and p < 0.001, respectively; Table 2), whileSST explained 24% and 22% of the variability in depth-integrated ratesof 3H-LeuDark, and
3H-LeuLight (p < 0.05; Table 2). Variations in PARexplained 18% of the variability in upper euphotic zone rates of 3H-LeuDark (r
2 =0.18; p < 0.001; Table 2), but fluctuations in PAR were notsignificantly correlated to temporal fluctuations in 3H-LeuLight (p >0.05). Upper euphotic zone (0–45 m) abundances of Prochlorococcuswere not correlated with rates of 3H-LeuLight (p > 0.05; SupplementaryTable 1), while variability in the combined abundances ofProchlorococcus and non-pigmented picoplankton explained 10% ofthe variability in 3H-LeuDark (p < 0.05; Table 2). Lower euphotic zone(100 m) and depth-integrated (0–125 m) rates of 3H-Leu incorpora-tion were not correlated with variations in PAR or temperature (p >0.05; Supplementary Table 1). Abundances of Prochlorococcus in thelower (100 m) euphotic zone showed no significant relationships torates of 3H-LeuLight, while the variability in combined abundances ofProchlorococcus and non-pigmented picoplankton explained 31% ofvariability in 3H-LeuDark (p < 0.05; Table 2).
We utilized stepwise linear regression analyses to identify possible
Fig. 4. Depth-integrated (0–125 m) rates of 14C-PP (panel A), 3H-LeuDark (panel B), and3H-LeuLight (panel C). Dashed lines depict 3-point running mean of each time-series.
Table 2Results of Model II linear regression analyses describing relationships among rates of 3H-LeuLight,
3H-LeuDark, ΔLeu, and14C-PP and variations in temperature (T), PAR, Chlorophyll a
(Chl a), picoplankton abundances (Prochlorococcus as [Pro] and non-pigmented picoplankton [non-pigs]), and sea surface temperature (SST). Analyses were conducted for 25 m and100 m depth horizons and for depth-integrated (0–125 m) rates and stocks. For depth-integrated rates (0–125 m) SST was used for T. Regression analyses not significant at p < 0.05 arenot shown.
Independent variable Dependent variable (s) Depth Slope Slope S.D. Intercept Intercept S.D. r2-value p-value Number of samples
T 3H-LeuDark 25 m 2.27 0.29 −48.98 7.23 0.29 <0.0001 60T 3H-LeuLight 25 m 3.93 0.56 −86.36 14.12 0.17 <0.001 60PAR 3H-LeuDark 25 m 0.90 0.11 −0.23 1.33 0.18 <0.001 5014C-PP 3H-LeuDark (3 month lag) 25 m −0.30 0.07 22.88 3.31 0.41 <0.01 1614C-PP ΔLeu 25 m 0.32 0.04 −9.97 2.03 0.16 <0.001 6514C-PP (daily, summer 2012) ΔLeu (daily, summer 2012) 25 m 0.55 0.11 −19.55 5.08 0.19 <0.005 42[Pro + non-pigs] 3H-LeuDark 25 m 2.27 0.34 7.05 2.39 0.10 <0.05 61[Pro + non-pigs] 3H-LeuDark 100 m 1.91 0.43 7.61 2.49 0.31 <0.05 203H-LeuDark
3H-LeuLight 0–125 m 1.90 0.35 −205.02 264.53 0.45 <0.001 22SST 3H-LeuDark 0–125 m 216.97 49.17 −4584.9 1207.5 0.24 <0.05 22SST 3H-LeuLight 0–125 m 411.75 94.63 −8905.6 2323.8 0.22 <0.05 22
D.A. Viviani, M.J. Church Deep–Sea Research Part I 121 (2017) 132–142
137

interactions between time-varying changes in measured rates of 14C-PP, 3H-LeuDark, and
3H-LeuLight and temporal fluctuations in PAR,temperature, chlorophyll a, and picoplankton abundances. Stepwisemultiple linear regression analyses identified interactive relationshipsbetween depth-integrated (0–45 m) rates of 3H-LeuDark and 14C-PPand mixed layer temperature (r2 =0.72; p < 0.001; Table 3), wheretemperature alone explained 50% more of the variability in rates of 3H-LeuDark than 14C-PP. Results from these analyses also revealed that atthe 25 m depth horizon there was a significant interactive relationshipbetween temperature and the combined abundances ofProchlorococcus and non-pigmented picoplankton on rates of 3H-LeuDark (r
2 =0.21; p < 0.0001; Table 3); however, temperature was 80%more powerful than the sum of Prochlorococcus and non-pigmentedpicoplankton in explaining variability in 3H-LeuDark.
4. Discussion
Bacterial metabolism plays a central role in ocean carbon cycling(Cho and Azam, 1988; Duarte and Agusti, 1998); however, to datethere are relatively few studies examining temporal variability inbacterial growth across multiple scales in the open sea. In the currentstudy, we examined time-variability in rates of 3H-Leu incorporationover time scales ranging from diel to seasonal in the persistentlyoligotrophic waters of the NPSG. In addition, by evaluating statisticalrelationships between 3H-Leu incorporation and 14C-PP, we sought tobetter understand temporal coupling between contemporaneous ratesof BP and PP in this habitat, and gain insight into factors regulatingproductivity in this ecosystem.
Previous work has suggested that aquatic bacterial growth can becontrolled either by limited supply of organic substrates or by low
temperatures (Shiah and Ducklow, 1994). Our regression analysesidentified relatively strong, interactive relationships between tempera-ture and 14C-PP as possible regulators of 3H-LeuDark incorporation inthe well-lit regions of the euphotic zone (0–45 m), highlighting whatmay be an important dynamic between resource availability andtemperature as co-regulators of BP in this ecosystem. Temperaturewas positively related to rates of 3H-LeuDark. We also considered thecombined effect of temperature and 14C-PP together on 3H-LeuDark,and when we controlled for the effect of temperature, rates of 14C-PPwere inversely related to 3H-LeuDark. These results, when coupled withthe observation that in the near-surface waters rates of 3H-LeuDarkappear to lag rates of 14C-PP (by up to 3 months), suggest that duringlate summer and fall when bacterial abundance is greatest and rates of14C-PP have begun to decline, increasing temperatures stimulate BP.Similar relationships between 3H-Leu incorporation and temperaturewere not observed below the mixed layer, where temperatures areconsiderably more time variable. Lower euphotic zone temperaturevariability does not exhibit significant seasonality, undergoing higherfrequency forcing by meso- and submesoscale physical forcing (Churchet al., 2009). In well-lit regions of the euphotic zone, temporalfluctuations in PAR also appeared significantly related to rates of 3H-LeuDark, although changes in PAR explained less of the variability in3H-LeuDark than temperature.
We derived daily rates of BP as the sum of the 3H-LeuLight and3H-
LeuDark hourly rates multiplied by the respective daylight and night-time periods for each cruise. This assumes the 3H-LeuDark ratesapproximate nighttime rates of BP. Our diel scale sampling of 3H-Leu (Fig. 7) suggests rates of 3H-LeuDark increase ~25% in the earlyevening, so the daily rates of BP derived by this approach are likely tobe underestimates. The resulting carbon-based rates of daily BP
Fig. 5. Time-series of 3H-LeuDark (panel A) and3H-LeuLight (panel B) measured at 25 m (error bars represent standard deviation of triplicate measurements). Black line represents sea
surface temperature (mean daily SST; from WHOI Hawaii Ocean Time-series (WHOTS) mooring (http://www.soest.hawaii.edu/whots/index.html). Lower panels are daily-scalemeasurements of 3H-LeuDark (panel C) and
3H-LeuLight (panel D) during the summer of 2012. Dashed black line represents time-averaged rates at 25 m depth for the entire period of thisstudy, and dashed grey lines represent upper and lower 95% confidence intervals.
D.A. Viviani, M.J. Church Deep–Sea Research Part I 121 (2017) 132–142
138

averaged 2.9 ± 0.8 mmol C m−2 d−1, equivalent to 3–9% of contem-poraneous 14C-PP. This ratio is similar to the BP:PP ratios of 5%reported by Ducklow et al. (2012) and ratios reported at BATS(Steinberg et al., 2001; Carlson et al., 1996), but are somewhat lowcompared to the 10–30% reported in other regions of the open sea(Anderson and Ducklow, 2001; Cole et al., 1988; del Giorgio et al.,1997; Ducklow, 1999; Hoppe et al., 2002).
A recent study reported rates of euphotic zone microbial commu-nity respiration (R) measured in the dark at Station ALOHA between2011 and 2012 (a period overlapping our study) that averaged 41.2 ±8.7 mmol C m−2 d−1 (based on 0–125 m depth-integrated rates esti-mated for 0.2–0.8 µm size fractionated plankton (Martínez-García andKarl, 2015). Assuming the < 0.8 µm measurements of R from thisstudy reflect activities of bacterioplankton, combining these data withour measurements of BP suggests bacterial carbon demand (BCD = BP+ R) during this period was upwards of 44 ± 9 mmol C m−2 d−1,equivalent to 100%± 27% of the contemporaneous measurements of14C-PP. These analyses also imply a bacterial growth efficiency (BGE =BP / BCD) of 7 ± 2%. BGEs for marine bacteria have been reported torange between 5–40% (Carlson et al., 1999; Carlson and Ducklow,1996; del Giorgio et al., 1997; del Giorgio and Cole, 1998), with BGEoften lower in oligotrophic relative to more eutrophic marine ecosys-tems (Carlson and Ducklow, 1996; del Giorgio and Cole, 1998). Hence,although our measurements revealed that a relatively low fraction ofcontemporaneous 14C-PP supports BP at Station ALOHA, based onthese estimates of BGE, the daily flux of carbon supporting bacterialmetabolism appears to be a major pathway for primary production inthis ecosystem. Moreover, statistical analyses of the relationshipsbetween 3H-Leu and 14C-PP revealed an apparent temporal lagbetween BP and PP, with BP regulated through the interactiveinfluences of PP and temperature. Such results may imply temporal
shifts in the partitioning of photosynthetic organic matter productionbetween dissolved and particulate pools. In particular, during the earlyfall when upper ocean temperatures are maximal, phytoplankton maypartition a larger fraction of daily production into DOM relative toproduction of cellular material. However, time-series measurements ofDOC production at Station ALOHA suggest no seasonal dependence inthe partitioning of primary production between particulate and dis-solved phases (Viviani et al., 2015). Temporal decoupling betweenmaximal PP and BP over several weeks to months has also been
Fig. 6. Time-series of 14C-PP measured at 25 m during this study (panel A); dashedblack line depicts the mean time-averaged rate of 14C-PP measured by the HOT programfor this depth; dashed grey lines represent 95% confidence intervals for these measure-ments. Also shown are rates of 14C-PP at 25 m measured during summer 2012 (panel B).The mean HOT program derived rate of 14C-PP (1988–2014) for July, August, andSeptember is shown as a black dashed line, with the associated 95% confidence intervalsshown as grey dashed lines.
Fig. 7. Diel variability in rates of 3H-Leu incorporation (both light and dark) measuredat 25 m during the summer of 2012. Grey bars represent night periods. Daily variation inincident PAR (panel A), 3H-LeuLight and
3H-LeuDark (panel B), and L:D ratio (panel C).Error bars represent standard deviations of triplicate measurements at each time point.Grey line depicts sinusoidal model fit (r2 =0.64) from John et al. (2011).
Table 3Results of stepwise multiple linear regression analyses evaluating relationships amongrates of 3H-LeuLight,
3H-LeuDark, and14C-PP and variations in temperature (T), PAR,
Chlorophyll a (Chl a), and picoplankton abundances (Prochlorococcus as [Pro] and non-pigmented picoplankton as [non-pigs]). Analyses were conducted for 25 m and 100 mdepth horizons and for depth-integrated rates (0–45 m and 0–125 m), where sea surfacetemperature (SST) was used for T. Regression analyses not significant at p < 0.05 are notshown. Standardized partial regression coefficients are given for both significantindependent variables, separated by commas. Best fit factor coefficient is listed first.
Dependentvariable
Depth Significantindependentvariables
Best fitfactor
Standardizedpartial regressioncoefficients
r2
3H-LeuDark 25 T, [Pro + non-pigs]
T 0.52, 0.29 0.31
3H-LeuDark 0–45 m T, 14C-PP T 0.85, −0.55 0.7214C-PP 0–125 m PAR, Chl a PAR 0.74, 0.61 0.55
D.A. Viviani, M.J. Church Deep–Sea Research Part I 121 (2017) 132–142
139

observed at BATS (Steinberg et al., 2001), suggesting that this patternmay be a common feature of oligotrophic ecosystems. This decouplingmay derive from seasonal-scale shifts in the nutritional and energeticcontent of photosynthetically produced DOM. Alternatively, the tem-porally lagged response in BP relative to PP observed in the presentstudy may suggest bacterial growth during the fall depends on excessphytoplankton production that occurs during the summer months,highlighting a potential role for semi-labile DOM in supportingbacterial growth in the upper ocean of this ecosystem.
By conducting parallel 3H-Leu incubations in both the dark andlight, we examined how vertical and time-varying changes in irradianceinfluenced rates of bacterial protein production. Consistent withprevious reports (Church et al., 2006, 2004), we found that upperocean ( < 125 m) rates of 3H-LeuLight were consistently greater than3H-LeuDark by 1.5-fold, on average, a finding consistent with incor-poration of 3H-Leu by Prochlorococcus (Michelou et al., 2007; Zubkovet al., 2004; Zubkov and Tarran, 2005). Despite large changes in thevertical flux of light through the upper ocean, we observed noconsistent depth-dependent patterns to the photostimulation of 3H-Leu incorporation. In a recent study, Björkman et al. (2015) quantifiedrates of 3H-Leu incorporation by both Prochlorococcus and non-pigmented picoplankton at Station ALOHA based on flow cytometricsorting of radiolabeled cells. These authors report that ~60% of the 3H-Leu incorporation that occurred in the light was attributable toassimilation by Prochlorococcus, with rates of 3H-Leu incorporationby these cyanobacteria 7-fold greater (on average) in the light than inthe dark. In contrast, Prochlorococcus contributed ~20% of the total3H-Leu incorporation in the dark (Björkman et al., 2015), slightly lessthan the average proportional contribution of these cells to totalpicoplankton abundances (Prochlorococcus averages 26% of the totalpicoplankton cell inventories at Station ALOHA).
The extent to which Prochlorococcus relies on organic matter tosupplement autotrophic production remains unclear; however,Prochlorococcus is responsible for a large fraction of daily net primaryproductivity in the NPSG (Liu et al., 1997) and demonstrates relativelyhigh per cell rates of 3H-Leu incorporation (Björkman et al., 2015). Inthe current study, rates of 3H-LeuLight were lower in 2012 relative tothe previous year, while rates of 3H-LeuDark were generally similar. Theresulting 3H-Leu L:D ratio decreased by ~25% between these years;these changes coincided with a period where Prochlorococcus cellabundances and rates of primary productivity were anomalously lowfor this region (Wilson et al., 2015). Together these findings suggestvariability in the biomass and growth of Prochlorococcus exertssubstantial control over upper ocean carbon cycling in this ecosystem.The lack of relationship between Prochlorococcus cell abundance andΔLeu suggests variability in the rates of 3H-LeuLight reflects variationsin Prochlorococcus growth rather than fluctuations in biomass. Incontrast, the observed relationship between 3H-LeuDark and thesummed abundances of non-pigmented picoplankton andProchlorococcus, suggests that time-varying changes in the populationsizes of these organisms regulates rates of 3H-LeuDark. Thus BP in thisoligotrophic ecosystem appears driven by a combination of temporallyvariable rates of light enhanced growth by Prochlorococcus, super-imposed over a less variable heterotrophic metabolism that appearspartly controlled by variations in temperature, cellular abundance, andresource availability.
During the summer of 2012 we examined diel- to daily-scalefluctuations in rates of 3H-Leu incorporation. Over diel-scales, ratesof 3H-LeuDark and 3H-LeuLight oscillated by 1.5- and 1.7-fold, respec-tively, while day-to-day changes in these rates varied approximately 2-and 2.5-fold, respectively. Diel-scale measurements indicated rates of3H-LeuDark were greatest at or near dusk, consistent with observationsfrom the tropical Atlantic (Mary et al., 2008). In other studies, forexample the North Sea (Winter et al., 2004) and Southern CaliforniaBight (Fuhrman et al., 1985) BP was higher during day than at night,while studies in more eutrophic freshwater and coastal systems
identified no consistent diel pattern in BP (Riemann andSøndergaard, 1984). In contrast, our observations that rates of 3H-LeuLight peak near noon supports the notion that photostimulation of3H-Leu incorporation is likely controlled by variations inProchlorococcus growth. Our results also appear consistent withstudies suggesting that phytoplankton and heterotrophic bacteriamay exhibit synchronous activity, with Prochlorococcus transcriptionalmaxima of photosystem genes followed on the order of hours by asuccession of transcript maxima in oxidative phosphorylation genesamong heterotrophic bacteria (Aylward et al., 2015; Ottesen et al.,2014).
4.1. Conclusions
In summary, we observed consistent, albeit temporally decoupled,daily patterns of 3H-Leu incorporation in the light and the dark. Suchresults likely reflect the coupling between photosynthetic production oforganic matter and subsequent bacterial growth over diel to daily timescales. In contrast, over weekly to monthly scales, variability inmeasured rates of 14C-PP was relatively constant (varying < 2-fold)across daily to monthly scales, while rates of 3H-Leu incorporationgenerally demonstrated greater variability at these time scales (5- and4-fold variability in light and dark, respectively). Moreover, statisticalevaluation of the measured rates of 3H-Leu incorporation and 14C-PPtogether with coincident measurements of environmental variability(including temperature, light, picoplankton abundances, and chloro-phyll) revealed that temporal fluctuations in 14C-PP, temperature, andbacterial abundance (inclusive of both non-pigmented picoplanktonand Prochlorococcus) were significant controls on bacterial growth inthe well-lit regions of the euphotic zone. Such results highlight thecomplexity of interacting processes that appear to regulate BP and PPin this ecosystem, and reinforce the value of examining coupling inthese processes across multiple, nested time scales.
Author contributions
Both DAV and MJC contributed to the design of the project; DAVconducted the sampling and laboratory analyses, and both authorscontributed to the analyses of data and writing of the manuscript.
Acknowledgements
Funding for this study derived from the National ScienceFoundation (NSF), including grants OCE-0850827 and OCE-1260164to MJC. Additional support was provided by NSF through the Centerfor Microbial Oceanography: Research and Education (CMORE; EF-0424599) and the Simons Collaboration on Ocean Processes andEcology (SCOPE award ID 329108). We thank the scientists and staffof the HOT program for their assistance at sea and in the laboratory,and Dr. Sam Wilson (UH) for his leadership during the HOE DYLANcruises. Drs. Craig Nelson (UH) and David Karl (UH) providedcomments that improved this manuscript. An anonymous reviewerprovided thoughtful comments that further improved this work. Weextend our gratitude to the officers and crew of the R/V Kilo Moanaand the R/V Kaimikai-o-Kanaloa.
Appendix A. Supplementary information
Supplementary information associated with this article can befound in the online version at doi:10.1016/j.dsr.2017.01.006.
References
Alonso-Sáez, L., Vázquez-Domínguez, E., Cardelús, C., Pinhassi, J., Sala, M.M.,Lekunberri, I., Balagué, V., Vila-Costa, M., Unrein, F., Massana, R., Simó, R., Gasol,J.M., 2008. Factors controlling the year-round variability in carbon flux through
D.A. Viviani, M.J. Church Deep–Sea Research Part I 121 (2017) 132–142
140

bacteria in a coastal marine system. Ecosystems 11, 397–409. http://dx.doi.org/10.1007/s10021-008-9129-0.
Anderson, T., Ducklow, H., 2001. Microbial loop carbon cycling in ocean environmentsstudied using a simple steady-state model. Aquat. Microb. Ecol. 26, 37–49. http://dx.doi.org/10.3354/ame026037.
Aylward, F.O., Eppley, J.M., Smith, J.M., Chavez, F.P., Scholin, C.A., DeLong, E.F., 2015.Microbial community transcriptional networks are conserved in three domains atocean basin scales. Proc. Natl. Acad. Sci. USA 112, 5443–5448. http://dx.doi.org/10.1073/pnas.1502883112.
Azam, F., Fenchel, T., Field, J., Gray, J., Meyer-Reil, L., Thingstad, F., 1983. Theecological role of water-column microbes in the sea. Mar. Ecol. Prog. Ser. 10,257–263.
Behrenfeld, M.J., Falkowski, P.G., 1997. Photosynthetic rates derived from satellite-based chlorophyll concentration. Limnol. Oceanogr. 42, 1–20.
Billen, G., Servais, P., Becquevort, S., 1990. Dynamics of bacterioplankton in oligotrophicand eutrophic aquatic environments: bottom-up or top-down control? Hydrobiologia207, 37–42. http://dx.doi.org/10.1007/BF00041438.
Björkman, K.M., Church, M.J., Doggett, J.K., Karl, D.M., 2015. Differential assimilationof inorganic carbon and leucine by Prochlorococcus in the oligotrophic North PacificSubtropical Gyre. Front. Microbiol. 6, 1401. http://dx.doi.org/10.3389/fmicb.2015.01401.
Burnham, K.P., Anderson, D.R., Huyvaert, K.P., 2010. AIC model selection andmultimodel inference in behavioral ecology: some background, observations, andcomparisons. Behav. Ecol. Sociobiol. 65, 23–35. http://dx.doi.org/10.1007/s00265-010-1029-6.
Campbell, L., Nolla, H.A., Vaulot, D., 1994. The importance of Prochlorococcus tocommunity structure in the central North Pacific Ocean. Limnol. Oceanogr. 39,954–961.
Carlson, C., Ducklow, H., Michaels, A., 1994. Annual flux of dissolved organic carbonfrom the euphotic zone in the northwestern Sargasso Sea. Nature 371, 405–408.
Carlson, C.A., Ducklow, H.W., 1996. Growth of bacterioplankton and consumption ofdissolved organic carbon in the Sargasso Sea. Aquat. Microb. Ecol. 10, 69–85.http://dx.doi.org/10.3354/ame010069.
Carlson, C.A., Ducklow, H.W., Sleeter, T.D., 1996. Stocks and dynamics ofbacterioplankton in the northwestern Sargasso Sea. Deep Sea Res. II 43, 491–515.http://dx.doi.org/10.1016/0967-0645(95)00101-8.
Carlson, C.A., Bates, N.R., Ducklow, H.W., Hansell, D.A., 1999. Estimation of bacterialrespiration and growth efficiency in the Ross Sea, Antarctica. Aquat. Microb. Ecol.19, 229–244.
Cho, B.C., Azam, F., 1988. Major role of bacteria in biogeochemical fluxes in the ocean'sinterior. Nature 332, 441–443. http://dx.doi.org/10.1038/332441a0.
Church, M., Ducklow, H., Karl, D., 2004. Light dependence of [3H]leucine incorporationin the oligotrophic North Pacific ocean. Appl. Environ. Microbiol. 70, 4079–4087.
Church, M., Ducklow, H., Letelier, R., Karl, D., 2006. Temporal and vertical dynamics inpicoplankton photoheterotrophic production in the subtropical North Pacific Ocean.Aquat. Microb. Ecol. 45, 41–53.
Church, M.J., 2008. Resource control of bacterial dynamics in the sea. In: Kirchman, D.L.(Ed.), Microbial Ecology of the Oceans. John Wiley & Sons, Inc, Hoboken, NJ, USA,335–382.
Church, M.J., Mahaffey, C., Letelier, R.M., Lukas, R., Zehr, J.P., Karl, D.M., 2009.Physical forcing of nitrogen fixation and diazotroph community structure in theNorth Pacific subtropical gyre. Glob. Biogeochem. Cycles 23, GB2020. http://dx.doi.org/10.1029/2008GB003418.
Church, M.J., Lomas, M.W., Muller-Karger, F., 2013. Sea change: charting the course forbiogeochemical ocean time-series research in a new millennium. Deep Sea Res. II 93,2–15. http://dx.doi.org/10.1016/j.dsr2.2013.01.035.
Cole, J., Findlay, S., Pace, M., 1988. Bacterial production in fresh and saltwaterecosystems - a cross-system overview. Mar. Ecol. Prog. Ser. 43, 1–10. http://dx.doi.org/10.3354/meps043001.
Cotner, J.B., Biddanda, B.A., 2002. Small players, large role: microbial influence onbiogeochemical processes in pelagic aquatic ecosystems. Ecosystems 5, 105–121.http://dx.doi.org/10.1007/s10021-001-0059-3.
Duarte, C., Cebrian, J., 1996. The fate of marine autotrophic production. Limnol.Oceanogr. 41, 1758–1766.
Duarte, C., Agusti, S., 1998. The CO2 balance of unproductive aquatic ecosystems.Science 281, 234–236.
Ducklow, H., 1999. The bacterial component of the oceanic euphotic zone. FEMSMicrobiol. Ecol. 30, 1–10.
Ducklow, H.W., Schofield, O.M.E., Vernet, M., Stammerjohn, S.E., Erickson, M., 2012.Multiscale control of bacterial production by phytoplankton dynamics and sea icealong the western Antarctic Peninsula: a regional and decadal investigation. J. Mar.Syst. 98, 26–39.
Ducklow, H., Carlson, C., 1992. Oceanic bacterial production. In: Advances in MicrobialEcology. Springer, USA, pp. 113–181.
Field, C.B., Behrenfeld, M.J., Randerson, J.T., Falkowski, P., 1998. Primary production ofthe biosphere: integrating terrestrial and oceanic components. Science 281, 237–240. http://dx.doi.org/10.1126/science.281.5374.237.
Fouilland, E., Tolosa, I., Bonnet, D., Bouvier, C., Bouvier, T., Bouvy, M., Got, P., Floc’h,E.L., Mostajir, B., Roques, C., Sempéré, R., Sime-Ngando, T., Vidussi, F., 2014.Bacterial carbon dependence on freshly produced phytoplankton exudates underdifferent nutrient availability and grazing pressure conditions in coastal marinewaters. FEMS Microbiol. Ecol. 87, 757–769. http://dx.doi.org/10.1111/1574-6941.12262.
Fuhrman, J.A., Eppley, R.W., Hagström, Å., Azam, F., 1985. Diel variations inbacterioplankton, phytoplankton, and related parameters in the Southern CaliforniaBight. Mar. Ecol. Prog. Ser. 27, 9–20.
del Giorgio, P., Cole, J., 1998. Bacterial growth efficiency in natural aquatic systems. Ann.Rev. Mar. Sci. 29, 503–541.
del Giorgio, P., Cole, J., Cimbleris, A., 1997. Respiration rates in bacteria exceedphytoplankton production in unproductive aquatic systems. Nature 385, 148–151.
Hansell, D., Carlson, C., 1998. Net community production of dissolved organic carbon.Glob. Biogeochem. Cycles 12, 443–453.
Hoppe, H.-G., Gocke, K., Koppe, R., Begler, C., 2002. Bacterial growth and primaryproduction along a north–south transect of the Atlantic Ocean. Nature 416, 168–171. http://dx.doi.org/10.1038/416168a.
John, D.E., López-Díaz, J.M., Cabrera, A., Santiago, N.A., Corredor, J.E., Bronk, D.A.,Paul, J.H., 2011. A day in the life in the dynamic marine environment: how nutrientsshape diel patterns of phytoplankton photosynthesis and carbon fixation geneexpression in the Mississippi and Orinoco River plumes. Hydrobiologia 679,155–173. http://dx.doi.org/10.1007/s10750-011-0862-6.
Joint, I., Pomroy, A., 1987. Activity of heterotrophic bacteria in the euphotic zone of theCeltic Sea. Mar. Ecol. Prog. Ser. 41, 155–165.
Karl, D., 1999. A sea of change: biogeochemical variability in the North PacificSubtropical Gyre. Ecosystems 2, 181–214.
Karl, D., Lukas, R., 1996. The Hawaii Ocean Time-series (HOT) program: background,rationale and field implementation. Deep Sea Res. II 43, 129–156.
Karl, D., Hebel, D., Björkman, K., Letelier, R., 1998. The role of dissolved organic matterrelease in the productivity of the oligotrophic North Pacific Ocean. Limnol.Oceanogr. 43, 1270–1286.
Karl, D.M., Björkman, K.M., Dore, J.E., Fujieki, L., Hebel, D.V., Houlihan, T., Letelier,R.M., Tupas, L.M., 2001. Ecological nitrogen-to-phosphorus stoichiometry at stationALOHA. Deep Sea Res. II 48, 1529–1566. http://dx.doi.org/10.1016/S0967-0645(00)00152-1.
Karl, D.M., Church, M.J., Dore, J.E., Letelier, R.M., Mahaffey, C., 2012. Predictable andefficient carbon sequestration in the North Pacific Ocean supported by symbioticnitrogen fixation. Proc. Natl. Acad. Sci. USA 109, 1842–1849. http://dx.doi.org/10.1073/pnas.1120312109.
Kirchman, D., K’nees, E., Hodson, R., 1985. Leucine incorporation and its potential as ameasure of protein synthesis by bacteria in natural aquatic systems. Appl. Environ.Microbiol 49, 599–607.
Kirchman, D., Newell, S., Hodson, R., 1986. Incorporation versus biosynthesis of leucine- implications for measuring rates of protein-synthesis and biomass production bybacteria. Mar. Ecol. Prog. Ser. 32, 47–59. http://dx.doi.org/10.3354/meps032047.
Kirchman, D.L., 2004. A primer on dissolved organic material and heterotrophicprokaryotes in the oceans. In: Follows, M., Oguz, T. (Eds.), The Ocean Carbon Cycleand Climate (NATO Science Series). Springer, Netherlands, 31–63.
Letelier, R., Dore, J., Winn, C., Karl, D., 1996. Seasonal and interannual variations inphotosynthetic carbon assimilation at Station ALOHA. Deep Sea Res II 43, 467–490.
Letelier, R., Karl, D., Abbott, M., Bidigare, R., 2004. Light driven seasonal patterns ofchlorophyll and nitrate in the lower euphotic zone of the North Pacific SubtropicalGyre. Limnol. Oceanogr. 49, 508–519.
Liu, H., Nolla, H., Campbell, L., 1997. Prochlorococcus growth rate and contribution toprimary production in the equatorial and subtropical North Pacific Ocean. Aquat.Microb. Ecol. 12, 39–47. http://dx.doi.org/10.3354/ame012039.
Marra, J., 2009. Net and gross productivity: weighing in with 14C. Aquat. Microb. Ecol.56, 123–131.
Martínez-García, S., Karl, D.M., 2015. Microbial respiration in the euphotic zone atStation ALOHA. Limnol. Oceanogr. 60, 1039–1050. http://dx.doi.org/10.1002/lno.10072.
Mary, I., Garczarek, L., Tarran, G.A., Kolowrat, C., Terry, M.J., Scanlan, D.J., Burkill,P.H., Zubkov, M.V., 2008. Diel rhythmicity in amino acid uptake by Prochlorococcus.Environ. Microbiol. 10, 2124–2131. http://dx.doi.org/10.1111/j.1462-2920.2008.01633.x.
Michaels, A., Bates, N., Buesseler, K., Carlson, C., Knap, A., 1994. Carbon-cycleimbalances in the Sargasso Sea. Nature 372, 537–540.
Michelou, V.K., Cottrell, M.T., Kirchman, D.L., 2007. Light-stimulated bacterialproduction and amino acid assimilation by cyanobacteria and other microbes in theNorth Atlantic Ocean. Appl. Environ. Microbiol. 73, 5539–5546. http://dx.doi.org/10.1128/AEM.00212-07.
Ottesen, E.A., Young, C.R., Gifford, S.M., Eppley, J.M., Marin, R., Schuster, S.C., Scholin,C.A., DeLong, E.F., 2014. Multispecies diel transcriptional oscillations in open oceanheterotrophic bacterial assemblages. Science 345, 207–212. http://dx.doi.org/10.1126/science.1252476.
Pace, M.L., Cole, J.J., 1994. Primary and bacterial production in lakes: are they coupledover depth? J. Plankton Res. 16, 661–672. http://dx.doi.org/10.1093/plankt/16.6.661.
Pace, M.L., del Giorgio, P., Fischer, D., Condon, R., Malcom, H., 2004. Estimates ofbacterial production using the leucine incorporation method are influenced bydifferences in protein retention of microcentrifuge tubes. Limnol. Oceanogr.Methods 2, 55–61. http://dx.doi.org/10.4319/lom.2004.2.55.
Pomeroy, L.R., 1974. The ocean's food web, a changing paradigm. BioScience 24,499–504. http://dx.doi.org/10.2307/1296885.
R Development Core Team, 2008. R: A Language and Environment for StatisticalComputing. R Foundation for Statistical Computing, Vienna, Austria.
Riemann, B., Søndergaard, M., 1984. Measurements of diel rates of bacterial secondaryproduction in aquatic environments. Appl. Environ. Microbiol. 47, 632–638.
Rii, Y.M., Karl, D.M., Church, M.J., 2016. Temporal and vertical variability inpicophytoplankton primary productivity in the North Pacific Subtropical Gyre. Mar.Ecol. Prog. Ser. 562, 1–18.
Shiah, F., Ducklow, H., 1994. Temperature regulation of heterotrophic bacterioplanktonabundance, production, and specific growth-rate in Chesapeake Bay. Limnol.Oceanogr. 39, 1243–1258.
D.A. Viviani, M.J. Church Deep–Sea Research Part I 121 (2017) 132–142
141

Simon, M., Azam, F., 1989. Protein content and protein synthesis rates of planktonicmarine bacteria. Mar. Ecol. Prog. Ser. 51, 201–213. http://dx.doi.org/10.3354/meps051201.
Smith, D.C., Azam, F., 1992. A simple, economical method for measuring bacterialprotein synthesis rates in seawater using 3H-leucine. Mar. Microb. Food Webs 6,107–114.
Steemann Nielsen, E., 1952. The use of radio-active carbon (C14) for measuring organicproduction in the sea. J. Cons. Int. Explor. Mer. 18, 117–140. http://dx.doi.org/10.1093/icesjms/18.2.117.
Steinberg, D.K., Carlson, C.A., Bates, N.R., Johnson, R.J., Michaels, A.F., Knap, A.H.,2001. Overview of the US JGOFS Bermuda Atlantic Time-series Study (BATS): adecade-scale look at ocean biology and biogeochemistry. Deep Sea Res II 48,1405–1447, (doi:16/S0967-0645(00)(00148-X).
Van Wambeke, F.V., Obernosterer, I., Moutin, T., Duhamel, S., Ulloa, O., Claustre, H.,2008. Heterotrophic bacterial production in the eastern South Pacific: longitudinaltrends and coupling with primary production. Biogeosciences 5, 157–169.
Viviani, D.A., Karl, D.M., Church, M.J., 2015. Variability in photosynthetic production ofdissolved and particulate organic carbon in the North Pacific Subtropical Gyre.Front. Mar. Sci. 2, 73. http://dx.doi.org/10.3389/fmars.2015.00073.
Wilson, S.T., Barone, B., Ascani, F., Bidigare, R.R., Church, M.J., del Valle, D.A.,Dyhrman, S.T., Ferrón, S., Fitzsimmons, J.N., Juranek, L.W., Kolber, Z.S., Letelier,R.M., Martínez-Garcia, S., Nicholson, D.P., Richards, K.J., Rii, Y.M., Rouco, M.,Viviani, D.A., White, A.E., Zehr, J.P., Karl, D.M., 2015. Short-term variability ineuphotic zone biogeochemistry and primary productivity at Station ALOHA: a casestudy of summer 2012. Glob. Biogeochem. Cycles 29. http://dx.doi.org/10.1002/2015GB005141.
Winter, C., Herndl, G.J., Weinbauer, M.G., 2004. Diel cycles in viral infection ofbacterioplankton in the North Sea. Aquat. Microb. Ecol. 35, 207–216.
Zar, J.H., 1999. Biostatistical Analysis. Prentice Hall PTR, New Jersey.Zubkov, M.V., Tarran, G.A., 2005. Amino acid uptake of Prochlorococcus spp. in surface
waters across the South Atlantic Subtropical Front. Aquat. Microb. Ecol. 40,241–249.
Zubkov, M.V., Tarran, G.A., Fuchs, B.M., 2004. Depth related amino acid uptake byProchlorococcus cyanobacteria in the Southern Atlantic tropical gyre. FEMSMicrobiol. Ecol. 50, 153–161. http://dx.doi.org/10.1016/j.femsec.2004.06.009.
D.A. Viviani, M.J. Church Deep–Sea Research Part I 121 (2017) 132–142
142