Embed Size (px)
Citation preview

Contents lists available at ScienceDirect
Deep-Sea Research Part I
journal homepage: www.elsevier.com/locate/dsri
Mercury bioaccumulation patterns in deep-sea fishes as indicators ofpollution scenarios in the northern Pacific of Mexico
Edgar Cruz-Acevedoa, Miguel Betancourt-Lozanoa, Dana Isela Arizmendi-Rodríguezb,Hugo Aguirre-Villaseñorc, Daniela Aguilera-Márquezd, Jaqueline García-Hernándezd,⁎
a Centro de Investigación en Alimentación y Desarrollo A.C., CIAD-Mazatlán Unit, Avenida Sábalo-Cerritos S/N, Mazatlán 82112, Sinaloa, Mexicob Instituto Nacional de Pesca y Acuacultura, Centro Regional de Investigación Pesquera-Guaymas, Miguel Alemán Sur 608, Col. La Cantera 85400, Guaymas, Sonora,Mexicoc Instituto Nacional de Pesca y Acuacultura, Centro Regional de Investigación Pesquera-Mazatlán, Calzada Sábalo-Cerritos S/N, Mazatlán 1177, Sinaloa, Mexicod Centro de Investigación en Alimentación y Desarrollo A.C., CIAD-Guaymas Unit, Carretera al Varadero Nacional km 6.6, Col. Las Playitas, Guaymas, Sonora 85480,Mexico
A R T I C L E I N F O
Keywords:Deep-seaMercuryBioaccumulationSpatial patternsBiomonitoringLiver/muscle concentration index
A B S T R A C T
Mercury (Hg) bioaccumulation in deep-sea fauna (> 200m depth) of the northern Mexican Pacific is unknown.We measured the total Hg concentration (THg µg/g wet weight) in 18 fish species, caught between 90 and1100m depth, in two ecoregions of the Mexican Pacific: The Gulf of California (GC) and the western coast ofBaja California (BC), in the Southern Californian Pacific. We assessed spatial (ecoregion and depth) and biolo-gical (species, tissues, trophic position, sex and size) patterns of bioaccumulation. The highest THg concentra-tions were observed in liver (geometric mean: 1.28 ± 2.31 µg/g, range:<Method Detection Limit(MDL)–16.17 µg/g), followed by muscle (geometric mean: 0.34 ± 0.53 µg/g, range:<MDL–6.12 µg/g) andgonad (geometric mean: 0.29 ± 0.49 µg/g, range:<MDL–2.18 µg/g). The maximum limit established forhuman consumption (1 µg/g wet weight) was exceeded by 7.8% of the muscle samples and 31% exceeded theprotection threshold for possible harmful effects in fish (0.2 µg/g wet weight). We observed that THg con-centrations tended to increase at higher trophic levels, total lengths and condition factors. Our results indicate aclear differentiation of the mercury bioaccumulation patterns between GC and BC, where GC species(200–500m) had consistently higher liver/muscle concentration ratios than those from BC (600–1100m).Altogether, the findings presented in this study are possible evidence of differential scenarios of environmentalcontamination.
1. Introduction
Due to its toxicity and high availability in the environment, mercury(Hg) is the most relevant pollutant in the oceans (Boening, 2000;Batrakova et al., 2014). Its distribution in the sea is governed by dif-ferent biogeochemical processes, adsorption by particles and oceano-graphic processes at different scales, meanwhile factors such as trophicposition, sex, age (size) and reproductive stage may influence thebioaccumulation of this metal in organisms (Burger et al., 2007; Hincket al., 2007). These factors can determine temporal and spatial patternsin the concentrations of Hg in both, environment and biota (Burgeret al., 2007; Batrakova et al., 2014).
More than 75% of Hg that enters the marine environment comesfrom the atmosphere, in inorganic form: Elemental (Hg0), divalent(Hg2+) and particulate (Hgp), and to a lesser extent as methylmercury,
MeHg (CH3Hg+), its most toxic and bioaccumulative form (Sunderlandand Mason, 2007; Batrakova et al., 2014). MeHg constitutes up to morethan 90% of the total Hg in individuals (Harris, 2003; Alpers et al.,2005).
Up to 70% of the world total Hg is deposited in the deep-sea(> 200m depth) (Booth and Zeller, 2005; Batrakova et al., 2014). Mostof the inorganic Hg transformation to MeHg occurs in environmentswith low concentrations of oxygen, such as sediment and the mesope-lagic zone, driven by sulfate-reducing bacteria (Boening, 2000;Sunderland and Mason, 2007; Sunderland et al., 2009). Due to thisbiotransformation, MeHg concentrations in water, sediments and deep-sea biota are generally higher than in shallow waters (Boening, 2000;Chiu and Mok, 2011; Batrakova et al., 2014).
Most contaminants are bioaccumulated in large quantities in theliver, the main detoxification organ; however, due to its affinity to thiol
https://doi.org/10.1016/j.dsr.2019.01.002Received 21 November 2018; Received in revised form 4 January 2019; Accepted 6 January 2019
⁎ Corresponding author.E-mail address: [email protected] (J. García-Hernández).
Deep-Sea Research Part I 144 (2019) 52–62
Available online 08 January 20190967-0637/ © 2019 Elsevier Ltd. All rights reserved.
T

(-SH), a structural muscle compound, Hg tends to bioaccumulate inmuscle too (Boening, 2000; Booth and Zeller, 2005). In fishes, con-centrations above 5 µg/g wet weight in muscle are considered very highand an indication of polluted sites (Scheuhammer et al., 2012). How-ever, concentrations below this limit have been related to adverse ef-fects in growth, behavior and reproduction in different fish species(0.25–1.2 µg/g wet weight of whole body); a concentration of 0.2 µg/gwhole body concentration has been suggested as a protection limit forjuvenile and adult fish (Beckvar et al., 2005 and references therein). Forhuman consumption, the maximum allowed limits in fish muscle es-tablished in the international law vary, although, they are generallyestablished between 0.3 and 1 µg/g wet weight (UNEP, 2002; DOF,2009a; Health Canada, 2017).
The monitoring of Hg contamination in deep-sea species has focusedmainly on commercially important fisheries (Mormede and Davies,2001; Pethybridge et al., 2010; Chiu and Mok, 2011). In some of thesespecies, Hg has been observed at higher concentrations than in shallowwater species of similar habits, exceeding permissible limits for humanconsumption (Mormede and Davies, 2001; Martins et al., 2006; Chiuand Mok, 2011).
Different studies report relatively high concentrations of Hg inshallow water fishes of coastal and pelagic environments from theMexican Pacific, mainly in the northwest region (Ruelas-Inzunza andPáez-Osuna, 2005; García-Hernández et al., 2007, 2018; Ruelas-Inzunza et al., 2011, 2013; Zamora-Arellano et al., 2017). However, thedeep-sea of the Mexican Pacific is a poorly explored environment untilrecent times (Hendrickx, 2012; Cruz-Acevedo et al., 2018), and Hgbioaccumulation patterns in its fauna are unknown. In the context ofthe Minamata agreement, the identification of contaminated sites (Ar-ticle 12) and the monitoring of pollution trends in the different en-vironmental and biotic compartments (Article 19; UN, 2017) are re-levant objectives. The objective of this work is to present the firstevaluation of contamination by Hg in deep-sea fishes in the northwestMexican Pacific, exploring possible patterns of bioaccumulation be-tween species, tissue, trophic levels and sizes and assessing the relationbetween total Hg concentrations, depth gradient and geographic re-gions.
2. Material and methods
2.1. Sampling of specimens
Eighteen fish species were caught in two marine ecoregions(Wilkinson et al., 2009) of the northwest Pacific of Mexico (Table 1,Fig. 1): 14 species from the lower continental shelf and upper slope ofthe northern-central Gulf of California (GC: 90–850m depth) and fourspecies from the upper/middle continental slope of the northern-centralportion of the western coast of Baja California (BC: 600–1100m depth),in the Southern Californian Pacific.
The species from BC were caught on board the oceanographic vessel“El Puma”, during TALUD (Hendrickx, 2012; Cruz-Acevedo et al.,2018), a research project focused on exploring the biodiversity of thecontinental slope of the Mexican Pacific (cruise: TALUD XVI-B, extremelatitudes: 28°47′N–31°46′N, depth interval: 610–1100m). TALUD useda benthic sledge (2.35 m wide, 0.90m high) equipped with a collectingnet of about 5.5 cm stretched mesh size (Cruz-Acevedo et al., 2017,2018).
The species from GC were caught during the TALUD XIV cruise(extreme latitudes: 28°11′N–29°04′N, depth interval: 181–847m) andduring four consecutive years of sampling (commercial fishing andfisheries prospections from the Instituto Nacional de Pesca yAcuacultura) in the Pacific hake (Merluccius productus) fishing zone(2014, 2015, 2016 and 2017; extreme latitudes: 28°03′N–30°28′N,depth interval: 92–462m). The fishes were identified to species leveland frozen at −20 °C until dissected. For the comparison of the Pacifichake Hg concentrations, we incorporated 14 specimens of this species
from the Montereyan Pacific Transition (MPT: extreme latitudes:34°26′N–37°25′N, depth interval: 248–483m).
In the laboratory, total length (TL) and total weight (TW) of thespecimens were measured. Later, their organs were extracted from theabdominal cavity to obtain the eviscerated weight (EW), with the ex-ception of some specimens from the hake fishery that were dissected onboard (30% of the individuals) and were not weighed without guts. Theliver, gonad and part from the fish’s muscle were also individuallyweighed, homogenized and frozen to −20 °C until the Hg analysis.
2.2. Determination of THg concentrations
Samples were weighed (precision 0.01 g), lyophilized during 72 h(LABCONCO Lyophilizer 79340–00, pressure: 133×10−3 mBar, tem-perature: −40 °C), weighed again and grounded in a ceramic mortar.Percent humidity was obtained for each sample using the difference inthe sample weights. Of each type of lyophilized tissue -gonad, liver andmuscle- aliquots of 0.01 g, 0.01 g and 0.25 g were taken, respectively.Samples were acid digested in two stages, the first, with 50% nitric acid,and the second with 30% hydrogen peroxide in a Microwave digestionsystem CEM Corp. Mod. MARSX with three pressure and temperatureramps (65 PSI-100 °C, 100 PSI-120 °C, 140 PSI-140 °C), following theEPA method 3052 (Tobergte and Curtis, 2013).
Total mercury concentrations (THg) were obtained using anodicstripping voltammetry (ASV) at the rotating gold electrode, with a797 VA Computrace instrument (Metrohm AG ® Ionenstrasse 9100Herisau, Switzerland) using the Application Bulletin 96/5 e method(Metrohm, 2014). The ASV is an EPA approved methodology (EPA,1996) comparable with spectrophotometric methods for the analysis ofmercury in fish tissues (Augelli et al., 2007; Giacomino et al., 2017).Voltammetric parameters used are presented in Table A.1.
For quality control/quality assurance (QA/QC) purposes, a blank, aduplicate and a certified reference material (DOLT-4, Dogfish LiverCertified Reference Material for Trace Metals, NRCC) were included inthe digestion of samples. Using the percent humidity for each sample,concentrations were transformed from dry weight to wet weight andare expressed in µg/g. The method performance variables obtainedfrom the analyses of fish samples are presented in Table A.2. TheMethod Detection Limit (MDL = 0.002 µg/g) was calculated accordingto Helsel (2012).
2.3. Data analysis
The condition factor (K), which relates the weight and size of eachindividual to estimate indirectly its health condition (Froese, 2006),was calculated using the following formula: K =EW/TLb, where “K” isthe condition factor, “EW” is the eviscerated weight, TL is the totallength and “b” is the slope of the length-weight relation of the species.As the information regarding the trophic position of deep-sea fishes isscarce, the average trophic level of some species was assigned from thedata of the closest species available in the literature (see Livingston andBailey, 1985; Hoff et al., 2000; Nelson, 2006; FishBase, 2017).
Due to the incidence of censored data (14% of the total samples),the nonparametric Kaplan-Meier estimator was used (function “cenfit”from “NADA” package in R 3.4.2) to calculate the basic statistic of THgconcentrations in the species. This method is recommended for data-bases with less than 50% of observations below the MDL (Helsel, 2012;R Core Team, 2017). Statistical comparisons of THg concentrationswere performed only for the species with at least five measurements pertissue. All statistical analysis were made using the R 3.4.2 software,considering the significance of α=0.05 (R Core Team, 2017).
The comparisons of THg concentrations between species and be-tween trophic levels were made using the “Censored Regressions usingMaximum Likelihood Estimation” (CENMLE; function “cenmle” from“NADA” package; Helsel, 2012). The CENMLE method allows testinghypotheses similar to the analysis of variance when the database has
E. Cruz-Acevedo et al. Deep-Sea Research Part I 144 (2019) 52–62
53

censored data, reporting a Chi-square analysis (Helsel, 2012). TheCENMLE analysis was performed for liver and muscle, respectively,excluding the gonad from the analysis, due to the small number ofsamples of this tissue (Table 1). The species with significant differenceswere identified by pair-wise comparisons, using the CENMLE estimator.To reduce the probability of reporting false positives, p-values wereadjusted by the “False Discovery Rate” (FDR), using the “fdrtool”package (Benjamini and Hochberg, 1995; Strimmer, 2008).
The comparisons within species were made for those with THgconcentrations measured in two or more tissues (M. productus,Hydrolagus colliei, Nezumia liolepis, Nezumia stelgidolepis and Sebastolobusaltivelis). Due to the presence of censored data, THg concentrations inM. productus, H. colliei, N. liolepis and S. altivelis, were compared by
CENMLE analysis (Helsel, 2012). For M. productus in GC, the inter-annual variation of THg concentrations between sexes and tissues wascompared using two independent comparisons (CENMLE does notevaluate more than one explanatory variable at a time), grouping thefactors as follows: year-tissue and year-sex. Later, within each year ofcapture, THg concentrations were compared using the combination ofsex-tissue as an explanatory variable. To compare THg concentrationsin hake from different ecoregions (GC and MPT in 2017) CENMLEanalyses were performed, evaluating the effect of the site and thecombination site-tissue. The sex was not considered in the analysisbecause of the reduced number of females and immature organismsfrom MPT (Table 1). The comparisons to H. colliei were performedbetween the sex-tissue groups. Because N. liolepis and S. altivelis were
Table 1Total mercury concentrations (THg µg/g wet weight) in tissues of deep-sea fishes of northern Mexico and hake of Central California, in the Eastern Pacific. Datashowed: geometric mean± standard deviation, parenthesis: total samples/censored samples (Helsel, 2012).
Species Acronym Depth (m) Min-max n Trophic level Gonad (THg) Liver (THg) Muscle(THg)
Gulf of CaliforniaHyporthodus acanthistius Hpa 223− 256 3 3.9 – – 0.772, 1.033 (3/1)Brotula clarkae Brc 216− 251 3 4.1 – – 0.570 ± 0.721 (3/0)Lepophidium negropinna Len 216− 256 14 3.8 – 0.985 (4/3) 0.490 ± 0.531 (14/3)Merluccius productus Mep 92− 462 165 4.4 0.239 ± 0.439 (26/2) 1.641 ± 2.632 (143/3) 0.135 ± 0.243 (165/48)Mustelus henlei Mus 204− 296 7 3.6 – 1.194 ± 0.451 (7/2) ND (7)Hydrolagus colliei Hyc 243− 462 30 3.7 1.136 ± 0.755 (3/0) 0.786 ± 1.959 (26/3) 0.749 ± 0.708 (30/4)Symphurus oligomerus Syo 181− 414 20 3.3 – – 0.305 ± 0.130 (20/0)Galeus piperatus Gap 234− 462 6 3.8 – 1.004 ± 0.059 (3/0) 0.511 ± 0.374 (6/1)Coelorinchus scaphopsis Coe 260− 414 26 3.6 – 7.439 (1/0) 0.487 ± 0.708 (26/1)Cherublemma emmelas Che 327− 443 7 3.6 – – 0.314 ± 0.083 (7/0)Physiculus rastrelliger Phn 181− 443 7 3.4 0.149 ± 0.049 (3/0) – 0.274 ± 0.065 (7/0)Sebastes sinensis Ses 385− 443 9 3.5 – – 0.642 ± 0.375 (9/1)Eptatretus stoutii Eps 414 2 4.2 – – 1.516, 1.097 (2/0)Cephalurus cephalus Cec 847 12 3.7 – – 0.434 ± 0.254 (12/0)Western coast off Baja CaliforniaNezumia stelgidolepis Nes 760 14 4.4 0.163 ± 0.072 (4/1) 0.332 ± 0.255 (10/0) 1.072 ± 1.489 (14/0)Nezumia liolepis Nel 611− 1101 29 3.3 – 0.166 ± 0.222 (9/1) 0.423 ± 0.263 (29/0)Sebastolobus altivelis Seb 611− 1101 19 3.3 – 0.071 ± 0.051 (14/2) 0.466 ± 0.482 (19/0)Microstomus pacificus Mic 705− 1101 7 3.2 – 0.574, 0.531 (2) 0.454 ± 0.473 (7/0)Central CaliforniaMerluccius productus Mep 249–483 14 4.4 – 1.398 ± 1.281 (9/1) 0.428, 0.947 (14/12)Number of samples 36 228 394
Fig. 1. Sampling sites for the quantification of total mercury (THg) in deep-sea fishes of northern Mexico and Central California, in the Eastern Pacific.
E. Cruz-Acevedo et al. Deep-Sea Research Part I 144 (2019) 52–62
54

not sexed, their comparisons were only made between tissues (liver andmuscle). For species subjected to more than two factors and comparedby overall CENMLE analyzes, pair-wise CENMLE comparisons wereperformed and p values were adjusted through FDR of the "fdrtool"package (Benjamini and Hochberg, 1995; Strimmer, 2008; Helsel,2012). As Nezumia stelgidolepis did not have censored data, THg con-centrations in this species were evaluated through a two way ANOVAwith interactions, using as independent factors sex and type of tissue.Tukey HSD tests were used to identify the groups with different THgconcentrations (Chambers and Hastie, 1993; R Core Team, 2017).
The liver/muscle index (THg concentration in liver/THg con-centration in muscle) was calculated for individuals with THg data inboth tissues (n=177). According to Kružíková et al. (2013), an indexhigher than one suggests a Hg-contaminated environment, whereasvalues below one could indicate negligible Hg pollution (Hg mainly ofnatural origin). Species with more than five individuals were selectedand their liver/muscle indices were compared through a one-wayANOVA. Tukey HSD tests were used to identify groups with differentliver/muscle indices (Chambers and Hastie, 1993; R Core Team, 2017).For M. productus, the liver/muscle index was compared between thesampling years, using a one-way ANOVA.
To evaluate possible patterns of bioaccumulation of Hg throughoutthe depth and trophic levels, Spearman correlation (rs) analysis wereperformed regarding the liver and muscle THg concentrations(including<MDL observations), as well for the liver/muscle indices
(Di Giulio and Hinton, 2008; Helsel, 2012). The variations on THgconcentrations regarding size (THg versus TL) and the body condition(THg versus K) were evaluated for all the specimens of each species (forboth tissues when possible). For M. productus correlations were calcu-lated for each ecoregion and sex. When censored data were absent onTHg measurements, the Pearson correlation coefficient (r) was used toestablish associations; otherwise, Spearman correlations were used(Helsel, 2012). All correlations were calculated using the “agricolae”package (De Mendiburu, 2016).
3. Results
A total of 648 THg measurements were obtained in 18 deep-sea fishspecies. Table 1 summarizes the Hg concentrations by species andtissue. In general, the highest concentrations were recorded in the liver(geometric mean: 1.28 ± 2.31 µg/g, range:<MDL–16.17 µg/g), fol-lowed by muscle (geometric mean: 0.34 ± 0.53 µg/g, range:<MDL–6.12 µg/g) and gonad (geometric mean: 0.29 ± 0.49 µg/g,range:<MDL–2.18 µg/g). The five highest individual concentrationswere found in liver, four of them in M. productus (16.2, 12.7, 11.6 and11.2 µg/g) and one in H. colliei (9.6 µg/g). Regarding muscle, thehighest individual concentrations were found in four different species:N. stelgidolepis (6.12 µg/g), H. colliei (3.25 µg/g), Coelorinchus scaphopsis(3.45 and 1.98 µg/g) and Lepophidium negropinna (1.98 µg/g). Re-garding suitability for human consumption, 21.5% of muscle
Fig. 2. Concentration of total mercury (THg) in gonad(a), liver (b) and muscle (c) of deep-sea fishes fromnorthern Mexico, in the Eastern Pacific. Each pair ofequal capital letters indicate species with significantdifferences. GC: Gulf of California, BC, western coastoff Baja California, Brc: Brotula clarkae, Cec:Cephalurus cephalus, Che: Cherublemma emmelas, Coe:Coelorinchus scaphopsis, Eps: Eptatretus stoutii, Gap:Galeus piperatus, Hyc: Hydrolagus colliei, Hpa:Hyporthodus acanthistius, Len: Lepophidium negropinna,Mep: Merluccius productus, Mic: Microstomus pacificus,Mus: Mustelus henlei, Nel: Nezumia liolepis, Nes:Nezumia stelgidolepis, Phn: Physiculus rastrelliger, Ses:Sebastes sinensis, Seb: Sebastolobus altivelis, Syo:Symphurus oligomerus. Dashed line: maximum allowedconcentration of mercury in fish muscle for humanconsumption (UNEP, 2002; DOF, 2009a), asterisks:species not included in statistical analysis.
E. Cruz-Acevedo et al. Deep-Sea Research Part I 144 (2019) 52–62
55
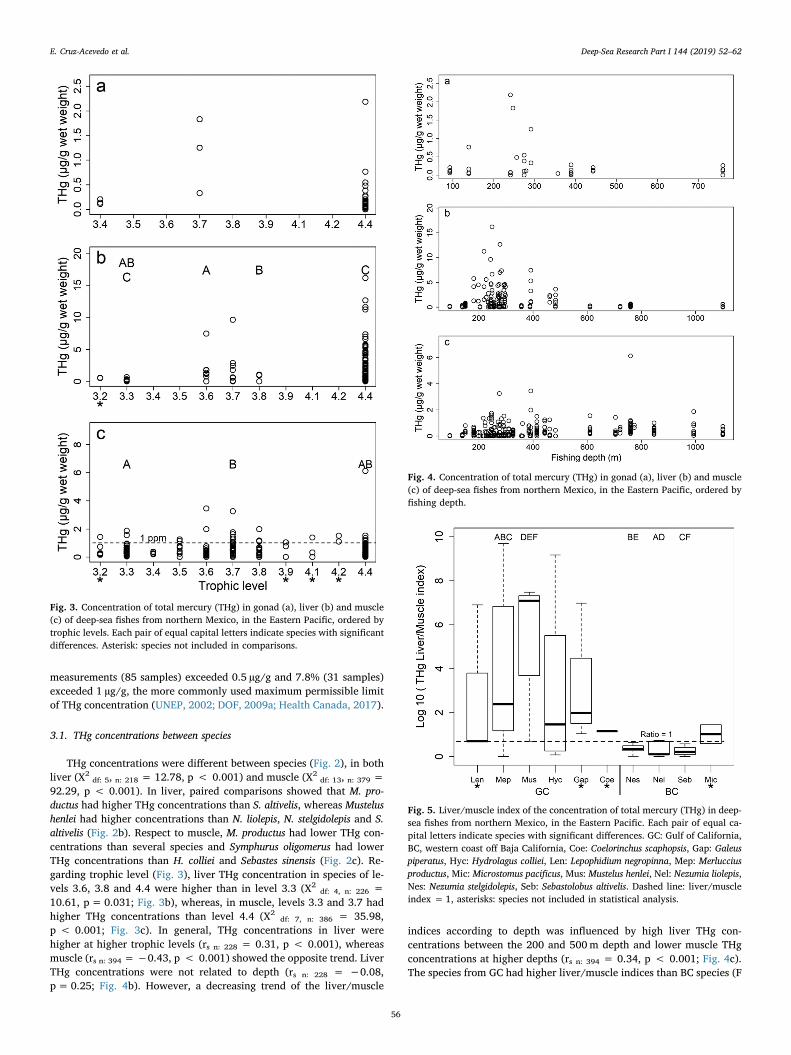
measurements (85 samples) exceeded 0.5 µg/g and 7.8% (31 samples)exceeded 1 µg/g, the more commonly used maximum permissible limitof THg concentration (UNEP, 2002; DOF, 2009a; Health Canada, 2017).
3.1. THg concentrations between species
THg concentrations were different between species (Fig. 2), in bothliver (X2
df: 5, n: 218 = 12.78, p < 0.001) and muscle (X2df: 13, n: 379 =
92.29, p < 0.001). In liver, paired comparisons showed that M. pro-ductus had higher THg concentrations than S. altivelis, whereas Mustelushenlei had higher concentrations than N. liolepis, N. stelgidolepis and S.altivelis (Fig. 2b). Respect to muscle, M. productus had lower THg con-centrations than several species and Symphurus oligomerus had lowerTHg concentrations than H. colliei and Sebastes sinensis (Fig. 2c). Re-garding trophic level (Fig. 3), liver THg concentration in species of le-vels 3.6, 3.8 and 4.4 were higher than in level 3.3 (X2
df: 4, n: 226 =10.61, p= 0.031; Fig. 3b), whereas, in muscle, levels 3.3 and 3.7 hadhigher THg concentrations than level 4.4 (X2
df: 7, n: 386 = 35.98,p < 0.001; Fig. 3c). In general, THg concentrations in liver werehigher at higher trophic levels (rs n: 228 = 0.31, p < 0.001), whereasmuscle (rs n: 394 =−0.43, p < 0.001) showed the opposite trend. LiverTHg concentrations were not related to depth (rs n: 228 = −0.08,p=0.25; Fig. 4b). However, a decreasing trend of the liver/muscle
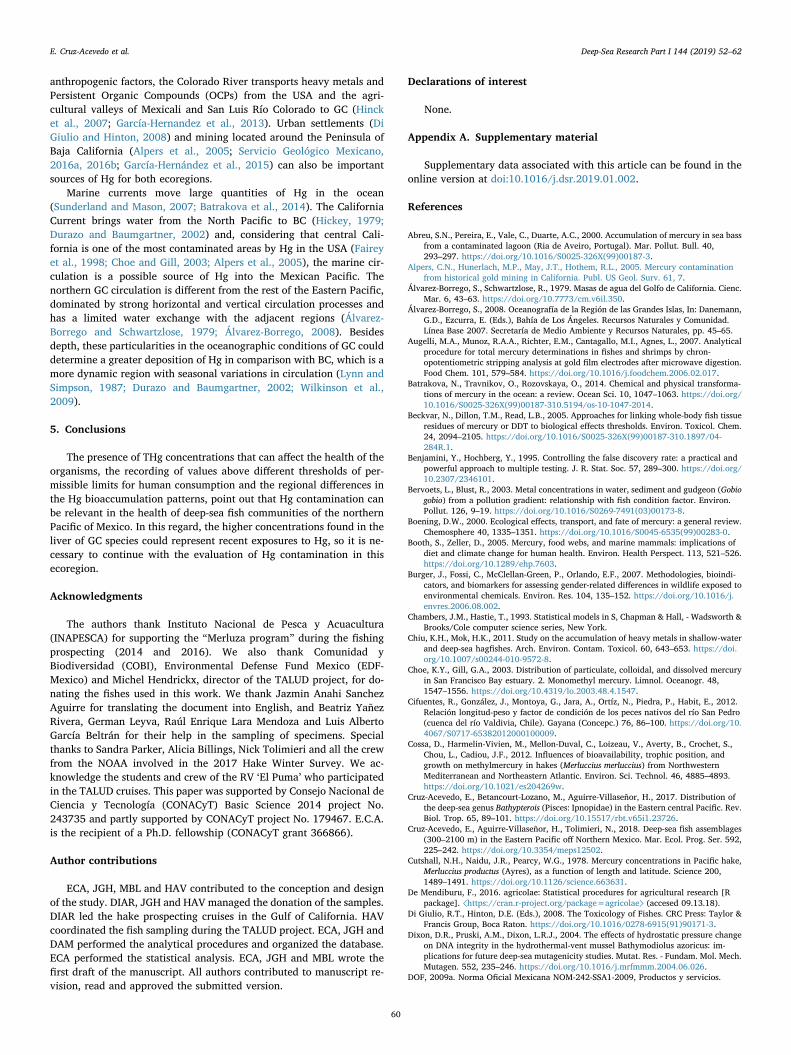
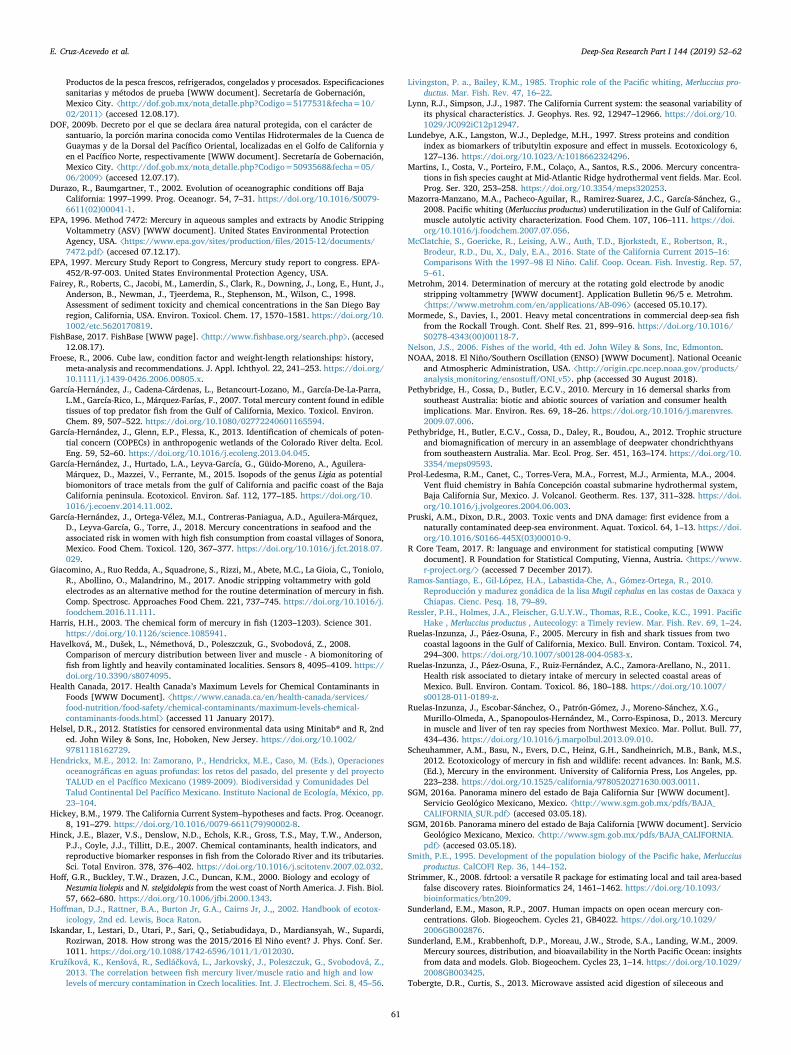
indices according to depth was influenced by high liver THg con-centrations between the 200 and 500m depth and lower muscle THgconcentrations at higher depths (rs n: 394 = 0.34, p < 0.001; Fig. 4c).The species from GC had higher liver/muscle indices than BC species (F
Fig. 3. Concentration of total mercury (THg) in gonad (a), liver (b) and muscle(c) of deep-sea fishes from northern Mexico, in the Eastern Pacific, ordered bytrophic levels. Each pair of equal capital letters indicate species with significantdifferences. Asterisk: species not included in comparisons.
Fig. 4. Concentration of total mercury (THg) in gonad (a), liver (b) and muscle(c) of deep-sea fishes from northern Mexico, in the Eastern Pacific, ordered byfishing depth.
Fig. 5. Liver/muscle index of the concentration of total mercury (THg) in deep-sea fishes from northern Mexico, in the Eastern Pacific. Each pair of equal ca-pital letters indicate species with significant differences. GC: Gulf of California,BC, western coast off Baja California, Coe: Coelorinchus scaphopsis, Gap: Galeuspiperatus, Hyc: Hydrolagus colliei, Len: Lepophidium negropinna, Mep: Merlucciusproductus, Mic: Microstomus pacificus, Mus: Mustelus henlei, Nel: Nezumia liolepis,Nes: Nezumia stelgidolepis, Seb: Sebastolobus altivelis. Dashed line: liver/muscleindex = 1, asterisks: species not included in statistical analysis.
E. Cruz-Acevedo et al. Deep-Sea Research Part I 144 (2019) 52–62
56

df: 9, 167; n: 177 = 4.82, p < 0.001; Fig. 5), with significant higherconcentrations found in M. productus and M. henlei from GC comparedto three species from BC: N. liolepis, N. stelgidolepis and S. altivelis (TukeyHSD, p < 0.05).
3.2. THg concentrations within species
Physiculus rastreliger, S. sinensis and S. altivelis had higher muscleTHg concentrations at larger sizes. The health condition (K) was posi-tively correlated with liver THg concentration ofM. productus, N. liolepisand N. stelgidolepis, and muscle of M. pacificus (Table 2, Fig. B.1).
THg concentrations in H. colliei were not different between sex-tissue groups (X2
df: 4, n: 59, = 2.04, p=0.73, Fig. 6a), S. altivelis hadhigher THg concentrations in muscle than in liver (X2
df: 1, n: 33 = 8.71,p=0.003, Fig. 6b), as well as N. liolepis (X2
df: 1, n: 38 = 6.92, p= 0.01,Fig. 6c). For N. stelgidolepis, differences were found between tissues (F
df: 2, 23; n: 28 = 4.26, p=0.02; muscle> liver and gonad, Tukey HSD),but sex was not a determinant factor (F df: 1, 23; n: 28 = 0.93, p= 0.34Fig. 6d), neither the sex-tissue interaction (F df: 1, 23; n: 28 = 1.31,p=0.26).
Hake specimens from GC had significant differences in the THgconcentrations between years (X2
df: 3, n: 287 = 32.48, p < 0.001;Fig. 7), year-sex (X2
df: 8, n: 287 = 43.41, p < 0.001) and year-tissue (X2
df: 8, n: 287 = 132.12, p < 0.001) combinations. Hake specimens caughtin 2014 and the muscle of females from 2015 had lower THg con-centrations compared to the rest of the combinations. When comparingindividual years, CENMLE analyses showed differences in THg con-centrations between tissues and sexes (p < 0.05), showing, mostlyhigher concentrations in liver than in muscle. For 2014, female livershad the highest THg concentrations (Fig. 7a), whereas for 2015 thelivers of both sexes had higher THg concentrations than muscle of fe-males (Fig. 7b). Liver of females in 2016 had higher THg concentrationsthan the rest of the groups (Fig. 7c) and liver of females in 2017 hadhigher concentrations than in muscle (Fig. 7d). No THg differenceswere observed between hake specimens from GC and MPT caught in2017 (X2
df: 1, n: 41 = 3.11, p=0.07; Figs. 7d and 7e); however, in bothecoregions hake had higher THg concentrations in liver than in muscle(X2
df: 3, n: 41 = 21.18, p < 0.001). The liver/muscle index was lowerin 2014 than in the other sampling years (F df: 4, 121; n: 126 = 11.90,p < 0.001; Fig. 7f).
4. Discussion
The inter and intraspecific differences observed in the THg con-centrations of deep-sea fishes from the northern Pacific of Mexico are areflection of differences in life history (trophic position), biologicalfactors (type of tissue, size, condition factor, and, to a lesser extent, sex)and exposure (possibly due to both natural and anthropogenic sce-narios), likely determined by geographic region and depth (Cutshallet al., 1978; Kružíková et al., 2013).
4.1. Inter and intraspecific comparisons
The capture site (ecoregion and depth) and trophic position weredeterminant factors influencing the inter-specific differences of liverTHg concentration, whereas muscle showed more homogeneous values,being M. productus the GC species with lower THg concentrations inmuscle, but also the one with higher concentrations in liver. Althoughthe trophic interval among the species in this study seems short (from3.2 to 4.4), this factor elicited the greatest influence on the THg dis-tribution among the species, particularly in liver, where the level 4.4(M. productus and N. stelgidolepis) presented the significantly highestconcentrations. Predatory species, such as tertiary consumers (trophiclevel 4) and top predators (trophic level 5), tend to have higher con-centrations of pollutants due to biomagnification, regardless of the typeof environment in which they live (EPA, 1997; Cossa et al., 2012;Pethybridge et al., 2012).
In environmental toxicology, longer life means greater exposuretime; therefore, there is an expected relationship between pollutantconcentrations and size of organisms, which is normally used as anindirect measure of age (Cossa et al., 2012; Walker et al., 2012). Thiswas true only for P. rastrelliger, S. sinensis and S. altivelis, where largerindividuals showed higher THg concentrations in muscle. However, thistrend was not observed in liver, indicating that other environmentalfactors are influencing bioaccumulation in these species (Kružíkováet al., 2013).
Despite its limitations, the condition factor (K) is commonly used toestimate biological condition, where organisms with higher K valuesare those that have a greater weight than expected for their size, whichcould be linked to energy reserves and fitness (Froese, 2006; Ramos-Santiago et al., 2010; Cifuentes et al., 2012). When an organism is af-fected by pollutants, a decreasing trend in its condition could be
Table 2Correlation indexes for the following comparisons: Concentration of totalmercury (THg µg/g wet weight) versus total length (TL), and THg concentrationversus condition factor (K), in tissues of deep-sea fishes from northern Mexicoand Central California, in the Eastern Pacific. Asterisks: significant correlations,plus symbol: Spearman correlation.
Species/correlation Total samples Gonad Liver Muscle
Cephalurus cephalusTL – – – −0.08K 0.49Cherublemma emmelasTL – – – −0.32K −0.65Coelorinchus scaphopsis+
TL – – – 0.39K 0.19Galeus piperatus+
TL 0.20 – – 0.77K 0.03 0.14Hydrolagus colliei+
TL 0.12 – −0.05 0.11K 0.06 0.11 0.01Merluccius productus GC+
TL 0.15 0.06 0.06 0.17Males −0.50 −0.23 0.08Females 0.22 0.10 0.14K 0.09 0.18 0.38* −0.15Males −0.50 0.42 −0.61*Females 0.18 0.37* 0.09Merluccius productus CAL+
TL 0.15 – −0.04 −0.27K −0.11 −0.10 −0.28Microstomus pacificusTL −0.03 – – −0.05K 0.64 0.74*Mustelus henlei+
TL −0.29 – −0.41 –K 0.09 0.19Nezumia liolepis+
TL 0.14 – 0.36 0.20K 0.33 * −0.05 0.30Nezumia stelgidolepis+
TL 0.09 – −0.16 0.04K 0.41 * 0.81* 0.01Physiculus rastrelligerTL 0.10 0.05 – 0.77*K 0.21 −0.13 0.12Sebastes sinensis+
TL – – – 0.80*K −0.5Sebastolobus altivelis+
TL 0.14 – − 0.31 0.67*K − 0.01 0.21 −0.28Symphurus oligomerusTL – – – −0.03K −0.13
E. Cruz-Acevedo et al. Deep-Sea Research Part I 144 (2019) 52–62
57

expected (Lundebye et al., 1997; Bervoets and Blust, 2003). However,individuals of M. productus, N. stelgidolepis, M. pacificus and N. liolepiswith higher body mass tended to present higher THg concentrations.Possibly, their THg concentrations were not too unfavorable to theorganism’s well-being or survival and K was determined by other fac-tors (e.g., habitat quality and food availability) (Bervoets and Blust,2003).
Eighty-three percent of the liver/muscle index values from GC ex-ceeded the threshold of one, in contrast with BC that showed only 5% ofits values above one. According to Abreu et al. (2000) and Havelkováet al. (2008), when Hg environmental concentrations are minimal, themuscle shows the greatest bioaccumulation, however, when Hg en-vironmental contamination is high, the liver tends to present higherconcentrations than the muscle. This seems to agree with the fact thatGC presented the highest THg concentrations in liver, in depths be-tween 200 and 500m, a zone known with the highest biotransforma-tion rate of inorganic Hg to MeHg due to a greater amount of parti-culate organic matter and low concentrations of dissolved oxygen(Sunderland and Mason, 2007; Di Giulio and Hinton, 2008; Batrakovaet al., 2014).
The analysis within species showed contrasting results. Sebastolobusaltivelis, N. liolepis and N. stelgidolepis, species caught mainly in themiddle slope of BC, had the highest THg concentrations in muscle,whereas M. productus, from the lower continental shelf and upper slopeof GC, consistently had the highest values of THg in the liver betweenthe different sampling years. Regarding sex, females usually eliminatehigher concentrations of pollutants than males during reproduction,which transfer to their offspring or gonads (Hoffman et al., 2002;Burger et al., 2007). However, no clear effect of sex was observed in theTHg concentrations, possibly due to the dispersion of the data and thevariation in the availability of individuals of each sex for the compar-isons. Regarding the organs, different bioaccumulation patterns of THgin liver and muscle were observed between the ecoregions, indicating
greater Hg contamination in the lower continental shelf and upper slopeof GC (90–500m depth) than in the upper and middle slope of BC(600–1100m depth).
Merluccius productus was the only species that could be spatially andtemporarily compared. This mesopelagic species is one of the mostabundant fishes between 100 and 500m depth in the California Currentand the Upper Gulf of California and is the only fish species commer-cially caught in the continental slope of the Mexican Pacific (Cutshallet al., 1978; Ressler et al., 1991; Mazorra-Manzano et al., 2008). Thehighest individual THg concentrations in this species were found inliver, mainly in 2016. Sex was not determinant for most of the com-parisons for this species, possibly due to the variability of the number ofspecimens for each sex and the detoxification of Hg during the releaseof the gonads by the females, since most of the samples were takenduring the spawning season (December-March; Smith, 1995). On theother hand, the differences observed in THg concentrations betweensampling years could be related to variations in oceanographic condi-tions, since vertical and horizontal migrations, as well as feeding habitsof M. productus are affected by environmental factors, mainly tem-perature (Ressler et al., 1991). Between 2015 and 2016, a very strong“El Niño-ENSO” event occurred, increasing the average water tem-perature in the sea in the East Pacific and affecting the behavior ofpopulations of different species (McClatchie et al., 2016; Iskandar et al.,2018; NOAA, 2018). A relationship between latitude and Hg con-centration in M. productus was previously observed, possibly influencedby the presence of sub-populations with different horizontal migrationintervals (Cutshall et al., 1978). However, the THg concentrations ofhake from GC and MTP in 2017 were not different, but in both ecor-egions, liver had higher THg concentrations than muscle. This findingand the differences observed between GC and BC species may be evi-dence that Hg contamination in the study area corresponds to a verticalpattern instead of a latitudinal one. Further studies considering agreater geographical range of sampling sites are desirable to better
Fig. 6. Comparison of the total mercury (THg) concentration between tissues and/or sexes of some fish species from northern Mexico, in the Eastern Pacific. Eachpair of equal capital letters indicate comparisons with significant differences. a: Hydrolagus colliei, b: Sebastolobus altivelis, c: Nezumia liolepis, d: Nezumia stelgidolepis.
E. Cruz-Acevedo et al. Deep-Sea Research Part I 144 (2019) 52–62
58

understand the regional patterns of Hg contamination.
4.2. Regional variations in THg concentrations
The THg concentrations in muscle were similar to those reported forshallow water fishes from northwestern Mexican Pacific (García-Hernández et al., 2007, 2018; Ruelas-Inzunza and Páez-Osuna, 2005;Ruelas-Inzunza et al., 2011, 2013; Zamora-Arellano et al., 2017). Incontrast, some liver THg concentrations of organisms from GC werehigher than previously recorded from shallow water fishes (Ruelas-Inzunza et al., 2013). Our results, therefore, might indicate a highercontamination by Hg in the upper slope of this ecoregion, compared
with its continental shelf (Kružíková et al., 2013) and it is possiblyrelated to a greater bioavailability of organic Hg (Sunderland andMason, 2007; Di Giulio and Hinton, 2008; Batrakova et al., 2014).
The differential bioaccumulation of THg between BC and GC speciesmay indicate different amounts of Hg entering the environment and/ordifferences in their local transport and deposition processes (Batrakovaet al., 2014). The hydrothermal vents located in GC and BC (around27°N and 32°N, respectively; Prol-Ledesma et al., 2004, DOF, 2009b),could indeed be a natural source of Hg for marine biota (García-Hernández et al., 2015), by releasing heavy metals from the earth'scrust, as has been demonstrated in other regions of the world (Pruskiand Dixon, 2003; Dixon et al., 2004; Martins et al., 2006). Regarding
Fig. 7. Comparison of the total mercury concentration (THg) between years, tissues and sexes of the Pacific Hake (Merluccius productus) from the Gulf of California(GC; a: 2014, b: 2015, c: 2016, d: 2017) and the Montereyan Pacific Transition (MPT; e: 2017), f: Liver/muscle index. Each pair of equal capital letters indicatecomparisons with significant differences.
E. Cruz-Acevedo et al. Deep-Sea Research Part I 144 (2019) 52–62
59
anthropogenic factors, the Colorado River transports heavy metals andPersistent Organic Compounds (OCPs) from the USA and the agri-cultural valleys of Mexicali and San Luis Río Colorado to GC (Hincket al., 2007; García-Hernandez et al., 2013). Urban settlements (DiGiulio and Hinton, 2008) and mining located around the Peninsula ofBaja California (Alpers et al., 2005; Servicio Geológico Mexicano,2016a, 2016b; García-Hernández et al., 2015) can also be importantsources of Hg for both ecoregions.
Marine currents move large quantities of Hg in the ocean(Sunderland and Mason, 2007; Batrakova et al., 2014). The CaliforniaCurrent brings water from the North Pacific to BC (Hickey, 1979;Durazo and Baumgartner, 2002) and, considering that central Cali-fornia is one of the most contaminated areas by Hg in the USA (Faireyet al., 1998; Choe and Gill, 2003; Alpers et al., 2005), the marine cir-culation is a possible source of Hg into the Mexican Pacific. Thenorthern GC circulation is different from the rest of the Eastern Pacific,dominated by strong horizontal and vertical circulation processes andhas a limited water exchange with the adjacent regions (Álvarez-Borrego and Schwartzlose, 1979; Álvarez-Borrego, 2008). Besidesdepth, these particularities in the oceanographic conditions of GC coulddetermine a greater deposition of Hg in comparison with BC, which is amore dynamic region with seasonal variations in circulation (Lynn andSimpson, 1987; Durazo and Baumgartner, 2002; Wilkinson et al.,2009).
5. Conclusions
The presence of THg concentrations that can affect the health of theorganisms, the recording of values above different thresholds of per-missible limits for human consumption and the regional differences inthe Hg bioaccumulation patterns, point out that Hg contamination canbe relevant in the health of deep-sea fish communities of the northernPacific of Mexico. In this regard, the higher concentrations found in theliver of GC species could represent recent exposures to Hg, so it is ne-cessary to continue with the evaluation of Hg contamination in thisecoregion.
Acknowledgments
The authors thank Instituto Nacional de Pesca y Acuacultura(INAPESCA) for supporting the “Merluza program” during the fishingprospecting (2014 and 2016). We also thank Comunidad yBiodiversidad (COBI), Environmental Defense Fund Mexico (EDF-Mexico) and Michel Hendrickx, director of the TALUD project, for do-nating the fishes used in this work. We thank Jazmin Anahi SanchezAguirre for translating the document into English, and Beatriz YañezRivera, German Leyva, Raúl Enrique Lara Mendoza and Luis AlbertoGarcía Beltrán for their help in the sampling of specimens. Specialthanks to Sandra Parker, Alicia Billings, Nick Tolimieri and all the crewfrom the NOAA involved in the 2017 Hake Winter Survey. We ac-knowledge the students and crew of the RV ‘El Puma’ who participatedin the TALUD cruises. This paper was supported by Consejo Nacional deCiencia y Tecnología (CONACyT) Basic Science 2014 project No.243735 and partly supported by CONACyT project No. 179467. E.C.A.is the recipient of a Ph.D. fellowship (CONACyT grant 366866).
Author contributions
ECA, JGH, MBL and HAV contributed to the conception and designof the study. DIAR, JGH and HAV managed the donation of the samples.DIAR led the hake prospecting cruises in the Gulf of California. HAVcoordinated the fish sampling during the TALUD project. ECA, JGH andDAM performed the analytical procedures and organized the database.ECA performed the statistical analysis. ECA, JGH and MBL wrote thefirst draft of the manuscript. All authors contributed to manuscript re-vision, read and approved the submitted version.
Declarations of interest
None.
Appendix A. Supplementary material
Supplementary data associated with this article can be found in theonline version at doi:10.1016/j.dsr.2019.01.002.
References
Abreu, S.N., Pereira, E., Vale, C., Duarte, A.C., 2000. Accumulation of mercury in sea bassfrom a contaminated lagoon (Ria de Aveiro, Portugal). Mar. Pollut. Bull. 40,293–297. https://doi.org/10.1016/S0025-326X(99)00187-3.
Alpers, C.N., Hunerlach, M.P., May, J.T., Hothem, R.L., 2005. Mercury contaminationfrom historical gold mining in California. Publ. US Geol. Surv. 61, 7.
Álvarez-Borrego, S., Schwartzlose, R., 1979. Masas de agua del Golfo de California. Cienc.Mar. 6, 43–63. https://doi.org/10.7773/cm.v6il.350.
Álvarez-Borrego, S., 2008. Oceanografía de la Región de las Grandes Islas, In: Danemann,G.D., Ezcurra, E. (Eds.), Bahía de Los Ángeles. Recursos Naturales y Comunidad.Línea Base 2007. Secretaría de Medio Ambiente y Recursos Naturales, pp. 45–65.
Augelli, M.A., Munoz, R.A.A., Richter, E.M., Cantagallo, M.I., Agnes, L., 2007. Analyticalprocedure for total mercury determinations in fishes and shrimps by chron-opotentiometric stripping analysis at gold film electrodes after microwave digestion.Food Chem. 101, 579–584. https://doi.org/10.1016/j.foodchem.2006.02.017.
Batrakova, N., Travnikov, O., Rozovskaya, O., 2014. Chemical and physical transforma-tions of mercury in the ocean: a review. Ocean Sci. 10, 1047–1063. https://doi.org/10.1016/S0025-326X(99)00187-310.5194/os-10-1047-2014.
Beckvar, N., Dillon, T.M., Read, L.B., 2005. Approaches for linking whole-body fish tissueresidues of mercury or DDT to biological effects thresholds. Environ. Toxicol. Chem.24, 2094–2105. https://doi.org/10.1016/S0025-326X(99)00187-310.1897/04-284R.1.
Benjamini, Y., Hochberg, Y., 1995. Controlling the false discovery rate: a practical andpowerful approach to multiple testing. J. R. Stat. Soc. 57, 289–300. https://doi.org/10.2307/2346101.
Bervoets, L., Blust, R., 2003. Metal concentrations in water, sediment and gudgeon (Gobiogobio) from a pollution gradient: relationship with fish condition factor. Environ.Pollut. 126, 9–19. https://doi.org/10.1016/S0269-7491(03)00173-8.
Boening, D.W., 2000. Ecological effects, transport, and fate of mercury: a general review.Chemosphere 40, 1335–1351. https://doi.org/10.1016/S0045-6535(99)00283-0.
Booth, S., Zeller, D., 2005. Mercury, food webs, and marine mammals: implications ofdiet and climate change for human health. Environ. Health Perspect. 113, 521–526.https://doi.org/10.1289/ehp.7603.
Burger, J., Fossi, C., McClellan-Green, P., Orlando, E.F., 2007. Methodologies, bioindi-cators, and biomarkers for assessing gender-related differences in wildlife exposed toenvironmental chemicals. Environ. Res. 104, 135–152. https://doi.org/10.1016/j.envres.2006.08.002.
Chambers, J.M., Hastie, T., 1993. Statistical models in S, Chapman & Hall, - Wadsworth &Brooks/Cole computer science series, New York.
Chiu, K.H., Mok, H.K., 2011. Study on the accumulation of heavy metals in shallow-waterand deep-sea hagfishes. Arch. Environ. Contam. Toxicol. 60, 643–653. https://doi.org/10.1007/s00244-010-9572-8.
Choe, K.Y., Gill, G.A., 2003. Distribution of particulate, colloidal, and dissolved mercuryin San Francisco Bay estuary. 2. Monomethyl mercury. Limnol. Oceanogr. 48,1547–1556. https://doi.org/10.4319/lo.2003.48.4.1547.
Cifuentes, R., González, J., Montoya, G., Jara, A., Ortíz, N., Piedra, P., Habit, E., 2012.Relación longitud-peso y factor de condición de los peces nativos del río San Pedro(cuenca del río Valdivia, Chile). Gayana (Concepc.) 76, 86–100. https://doi.org/10.4067/S0717-65382012000100009.
Cossa, D., Harmelin-Vivien, M., Mellon-Duval, C., Loizeau, V., Averty, B., Crochet, S.,Chou, L., Cadiou, J.F., 2012. Influences of bioavailability, trophic position, andgrowth on methylmercury in hakes (Merluccius merluccius) from NorthwesternMediterranean and Northeastern Atlantic. Environ. Sci. Technol. 46, 4885–4893.https://doi.org/10.1021/es204269w.
Cruz-Acevedo, E., Betancourt-Lozano, M., Aguirre-Villaseñor, H., 2017. Distribution ofthe deep-sea genus Bathypterois (Pisces: Ipnopidae) in the Eastern central Pacific. Rev.Biol. Trop. 65, 89–101. https://doi.org/10.15517/rbt.v65i1.23726.
Cruz-Acevedo, E., Aguirre-Villaseñor, H., Tolimieri, N., 2018. Deep-sea fish assemblages(300–2100 m) in the Eastern Pacific off Northern Mexico. Mar. Ecol. Prog. Ser. 592,225–242. https://doi.org/10.3354/meps12502.
Cutshall, N.H., Naidu, J.R., Pearcy, W.G., 1978. Mercury concentrations in Pacific hake,Merluccius productus (Ayres), as a function of length and latitude. Science 200,1489–1491. https://doi.org/10.1126/science.663631.
De Mendiburu, F., 2016. agricolae: Statistical procedures for agricultural research [Rpackage]. ⟨https://cran.r-project.org/package=agricolae⟩ (accesed 09.13.18).
Di Giulio, R.T., Hinton, D.E. (Eds.), 2008. The Toxicology of Fishes. CRC Press: Taylor &Francis Group, Boca Raton. https://doi.org/10.1016/0278-6915(91)90171-3.
Dixon, D.R., Pruski, A.M., Dixon, L.R.J., 2004. The effects of hydrostatic pressure changeon DNA integrity in the hydrothermal-vent mussel Bathymodiolus azoricus: im-plications for future deep-sea mutagenicity studies. Mutat. Res. - Fundam. Mol. Mech.Mutagen. 552, 235–246. https://doi.org/10.1016/j.mrfmmm.2004.06.026.
DOF, 2009a. Norma Oficial Mexicana NOM-242-SSA1-2009, Productos y servicios.
E. Cruz-Acevedo et al. Deep-Sea Research Part I 144 (2019) 52–62
60
Productos de la pesca frescos, refrigerados, congelados y procesados. Especificacionessanitarias y métodos de prueba [WWW document]. Secretaría de Gobernación,Mexico City. ⟨http://dof.gob.mx/nota_detalle.php?Codigo=5177531&fecha=10/02/2011⟩ (accesed 12.08.17).
DOF, 2009b. Decreto por el que se declara área natural protegida, con el carácter desantuario, la porción marina conocida como Ventilas Hidrotermales de la Cuenca deGuaymas y de la Dorsal del Pacífico Oriental, localizadas en el Golfo de California yen el Pacífico Norte, respectivamente [WWW document]. Secretaría de Gobernación,Mexico City. ⟨http://dof.gob.mx/nota_detalle.php?Codigo=5093568&fecha=05/06/2009⟩ (accesed 12.07.17).
Durazo, R., Baumgartner, T., 2002. Evolution of oceanographic conditions off BajaCalifornia: 1997–1999. Prog. Oceanogr. 54, 7–31. https://doi.org/10.1016/S0079-6611(02)00041-1.
EPA, 1996. Method 7472: Mercury in aqueous samples and extracts by Anodic StrippingVoltammetry (ASV) [WWW document]. United States Environmental ProtectionAgency, USA. ⟨https://www.epa.gov/sites/production/files/2015-12/documents/7472.pdf⟩ (accesed 07.12.17).
EPA, 1997. Mercury Study Report to Congress, Mercury study report to congress. EPA-452/R-97-003. United States Environmental Protection Agency, USA.
Fairey, R., Roberts, C., Jacobi, M., Lamerdin, S., Clark, R., Downing, J., Long, E., Hunt, J.,Anderson, B., Newman, J., Tjeerdema, R., Stephenson, M., Wilson, C., 1998.Assessment of sediment toxicity and chemical concentrations in the San Diego Bayregion, California, USA. Environ. Toxicol. Chem. 17, 1570–1581. https://doi.org/10.1002/etc.5620170819.
FishBase, 2017. FishBase [WWW page]. ⟨http://www.fishbase.org/search.php⟩. (accesed12.08.17).
Froese, R., 2006. Cube law, condition factor and weight-length relationships: history,meta-analysis and recommendations. J. Appl. Ichthyol. 22, 241–253. https://doi.org/10.1111/j.1439-0426.2006.00805.x.
García-Hernández, J., Cadena-Cárdenas, L., Betancourt-Lozano, M., García-De-La-Parra,L.M., García-Rico, L., Márquez-Farías, F., 2007. Total mercury content found in edibletissues of top predator fish from the Gulf of California, Mexico. Toxicol. Environ.Chem. 89, 507–522. https://doi.org/10.1080/02772240601165594.
García-Hernández, J., Glenn, E.P., Flessa, K., 2013. Identification of chemicals of poten-tial concern (COPECs) in anthropogenic wetlands of the Colorado River delta. Ecol.Eng. 59, 52–60. https://doi.org/10.1016/j.ecoleng.2013.04.045.
García-Hernández, J., Hurtado, L.A., Leyva-García, G., Güido-Moreno, A., Aguilera-Márquez, D., Mazzei, V., Ferrante, M., 2015. Isopods of the genus Ligia as potentialbiomonitors of trace metals from the gulf of California and pacific coast of the BajaCalifornia peninsula. Ecotoxicol. Environ. Saf. 112, 177–185. https://doi.org/10.1016/j.ecoenv.2014.11.002.
García-Hernández, J., Ortega-Vélez, M.I., Contreras-Paniagua, A.D., Aguilera-Márquez,D., Leyva-García, G., Torre, J., 2018. Mercury concentrations in seafood and theassociated risk in women with high fish consumption from coastal villages of Sonora,Mexico. Food Chem. Toxicol. 120, 367–377. https://doi.org/10.1016/j.fct.2018.07.029.
Giacomino, A., Ruo Redda, A., Squadrone, S., Rizzi, M., Abete, M.C., La Gioia, C., Toniolo,R., Abollino, O., Malandrino, M., 2017. Anodic stripping voltammetry with goldelectrodes as an alternative method for the routine determination of mercury in fish.Comp. Spectrosc. Approaches Food Chem. 221, 737–745. https://doi.org/10.1016/j.foodchem.2016.11.111.
Harris, H.H., 2003. The chemical form of mercury in fish (1203–1203). Science 301.https://doi.org/10.1126/science.1085941.
Havelková, M., Dušek, L., Némethová, D., Poleszczuk, G., Svobodová, Z., 2008.Comparison of mercury distribution between liver and muscle - A biomonitoring offish from lightly and heavily contaminated localities. Sensors 8, 4095–4109. https://doi.org/10.3390/s8074095.
Health Canada, 2017. Health Canada’s Maximum Levels for Chemical Contaminants inFoods [WWW Document]. ⟨https://www.canada.ca/en/health-canada/services/food-nutrition/food-safety/chemical-contaminants/maximum-levels-chemical-contaminants-foods.html⟩ (accessed 11 January 2017).
Helsel, D.R., 2012. Statistics for censored environmental data using Minitab® and R, 2nded. John Wiley & Sons, Inc, Hoboken, New Jersey. https://doi.org/10.1002/9781118162729.
Hendrickx, M.E., 2012. In: Zamorano, P., Hendrickx, M.E., Caso, M. (Eds.), Operacionesoceanográficas en aguas profundas: los retos del pasado, del presente y del proyectoTALUD en el Pacífico Mexicano (1989-2009). Biodiversidad y Comunidades DelTalud Continental Del Pacífico Mexicano. Instituto Nacional de Ecología, México, pp.23–104.
Hickey, B.M., 1979. The California Current System–hypotheses and facts. Prog. Oceanogr.8, 191–279. https://doi.org/10.1016/0079-6611(79)90002-8.
Hinck, J.E., Blazer, V.S., Denslow, N.D., Echols, K.R., Gross, T.S., May, T.W., Anderson,P.J., Coyle, J.J., Tillitt, D.E., 2007. Chemical contaminants, health indicators, andreproductive biomarker responses in fish from the Colorado River and its tributaries.Sci. Total Environ. 378, 376–402. https://doi.org/10.1016/j.scitotenv.2007.02.032.
Hoff, G.R., Buckley, T.W., Drazen, J.C., Duncan, K.M., 2000. Biology and ecology ofNezumia liolepis and N. stelgidolepis from the west coast of North America. J. Fish. Biol.57, 662–680. https://doi.org/10.1006/jfbi.2000.1343.
Hoffman, D.J., Rattner, B.A., Burton Jr, G.A., Cairns Jr, J.,, 2002. Handbook of ecotox-icology, 2nd ed. Lewis, Boca Raton.
Iskandar, I., Lestari, D., Utari, P., Sari, Q., Setiabudidaya, D., Mardiansyah, W., Supardi,Rozirwan, 2018. How strong was the 2015/2016 El Niño event? J. Phys. Conf. Ser.1011. https://doi.org/10.1088/1742-6596/1011/1/012030.
Kružíková, K., Kenšová, R., Sedláčková, L., Jarkovský, J., Poleszczuk, G., Svobodová, Z.,2013. The correlation between fish mercury liver/muscle ratio and high and lowlevels of mercury contamination in Czech localities. Int. J. Electrochem. Sci. 8, 45–56.
Livingston, P. a., Bailey, K.M., 1985. Trophic role of the Pacific whiting, Merluccius pro-ductus. Mar. Fish. Rev. 47, 16–22.
Lynn, R.J., Simpson, J.J., 1987. The California Current system: the seasonal variability ofits physical characteristics. J. Geophys. Res. 92, 12947–12966. https://doi.org/10.1029/JC092iC12p12947.
Lundebye, A.K., Langston, W.J., Depledge, M.H., 1997. Stress proteins and conditionindex as biomarkers of tributyltin exposure and effect in mussels. Ecotoxicology 6,127–136. https://doi.org/10.1023/A:1018662324296.
Martins, I., Costa, V., Porteiro, F.M., Colaço, A., Santos, R.S., 2006. Mercury concentra-tions in fish species caught at Mid-Atlantic Ridge hydrothermal vent fields. Mar. Ecol.Prog. Ser. 320, 253–258. https://doi.org/10.3354/meps320253.
Mazorra-Manzano, M.A., Pacheco-Aguilar, R., Ramirez-Suarez, J.C., García-Sánchez, G.,2008. Pacific whiting (Merluccius productus) underutilization in the Gulf of California:muscle autolytic activity characterization. Food Chem. 107, 106–111. https://doi.org/10.1016/j.foodchem.2007.07.056.
McClatchie, S., Goericke, R., Leising, A.W., Auth, T.D., Bjorkstedt, E., Robertson, R.,Brodeur, R.D., Du, X., Daly, E.A., 2016. State of the California Current 2015–16:Comparisons With the 1997–98 El Niño. Calif. Coop. Ocean. Fish. Investig. Rep. 57,5–61.
Metrohm, 2014. Determination of mercury at the rotating gold electrode by anodicstripping voltammetry [WWW document]. Application Bulletin 96/5 e. Metrohm.⟨https://www.metrohm.com/en/applications/AB-096⟩ (accesed 05.10.17).
Mormede, S., Davies, I., 2001. Heavy metal concentrations in commercial deep-sea fishfrom the Rockall Trough. Cont. Shelf Res. 21, 899–916. https://doi.org/10.1016/S0278-4343(00)00118-7.
Nelson, J.S., 2006. Fishes of the world, 4th ed. John Wiley & Sons, Inc, Edmonton.NOAA, 2018. El Niño/Southern Oscillation (ENSO) [WWW Document]. National Oceanic
and Atmospheric Administration, USA. ⟨http://origin.cpc.ncep.noaa.gov/products/analysis_monitoring/ensostuff/ONI_v5⟩. php (accessed 30 August 2018).
Pethybridge, H., Cossa, D., Butler, E.C.V., 2010. Mercury in 16 demersal sharks fromsoutheast Australia: biotic and abiotic sources of variation and consumer healthimplications. Mar. Environ. Res. 69, 18–26. https://doi.org/10.1016/j.marenvres.2009.07.006.
Pethybridge, H., Butler, E.C.V., Cossa, D., Daley, R., Boudou, A., 2012. Trophic structureand biomagnification of mercury in an assemblage of deepwater chondrichthyansfrom southeastern Australia. Mar. Ecol. Prog. Ser. 451, 163–174. https://doi.org/10.3354/meps09593.
Prol-Ledesma, R.M., Canet, C., Torres-Vera, M.A., Forrest, M.J., Armienta, M.A., 2004.Vent fluid chemistry in Bahía Concepción coastal submarine hydrothermal system,Baja California Sur, Mexico. J. Volcanol. Geotherm. Res. 137, 311–328. https://doi.org/10.1016/j.jvolgeores.2004.06.003.
Pruski, A.M., Dixon, D.R., 2003. Toxic vents and DNA damage: first evidence from anaturally contaminated deep-sea environment. Aquat. Toxicol. 64, 1–13. https://doi.org/10.1016/S0166-445X(03)00010-9.
R Core Team, 2017. R: language and environment for statistical computing [WWWdocument]. R Foundation for Statistical Computing, Vienna, Austria. ⟨https://www.r-project.org/⟩ (accessed 7 December 2017).
Ramos-Santiago, E., Gil-López, H.A., Labastida-Che, A., Gómez-Ortega, R., 2010.Reproducción y madurez gonádica de la lisa Mugil cephalus en las costas de Oaxaca yChiapas. Cienc. Pesq. 18, 79–89.
Ressler, P.H., Holmes, J.A., Fleischer, G.U.Y.W., Thomas, R.E., Cooke, K.C., 1991. PacificHake , Merluccius productus , Autecology: a Timely review. Mar. Fish. Rev. 69, 1–24.
Ruelas-Inzunza, J., Páez-Osuna, F., 2005. Mercury in fish and shark tissues from twocoastal lagoons in the Gulf of California, Mexico. Bull. Environ. Contam. Toxicol. 74,294–300. https://doi.org/10.1007/s00128-004-0583-x.
Ruelas-Inzunza, J., Páez-Osuna, F., Ruiz-Fernández, A.C., Zamora-Arellano, N., 2011.Health risk associated to dietary intake of mercury in selected coastal areas ofMexico. Bull. Environ. Contam. Toxicol. 86, 180–188. https://doi.org/10.1007/s00128-011-0189-z.
Ruelas-Inzunza, J., Escobar-Sánchez, O., Patrón-Gómez, J., Moreno-Sánchez, X.G.,Murillo-Olmeda, A., Spanopoulos-Hernández, M., Corro-Espinosa, D., 2013. Mercuryin muscle and liver of ten ray species from Northwest Mexico. Mar. Pollut. Bull. 77,434–436. https://doi.org/10.1016/j.marpolbul.2013.09.010.
Scheuhammer, A.M., Basu, N., Evers, D.C., Heinz, G.H., Sandheinrich, M.B., Bank, M.S.,2012. Ecotoxicology of mercury in fish and wildlife: recent advances. In: Bank, M.S.(Ed.), Mercury in the environment. University of California Press, Los Angeles, pp.223–238. https://doi.org/10.1525/california/9780520271630.003.0011.
SGM, 2016a. Panorama minero del estado de Baja California Sur [WWW document].Servicio Geológico Mexicano, Mexico. ⟨http://www.sgm.gob.mx/pdfs/BAJA_CALIFORNIA_SUR.pdf⟩ (accesed 03.05.18).
SGM, 2016b. Panorama minero del estado de Baja California [WWW document]. ServicioGeológico Mexicano, Mexico. ⟨http://www.sgm.gob.mx/pdfs/BAJA_CALIFORNIA.pdf⟩ (accesed 03.05.18).
Smith, P.E., 1995. Development of the population biology of the Pacific hake, Merlucciusproductus. CalCOFI Rep. 36, 144–152.
Strimmer, K., 2008. fdrtool: a versatile R package for estimating local and tail area-basedfalse discovery rates. Bioinformatics 24, 1461–1462. https://doi.org/10.1093/bioinformatics/btn209.
Sunderland, E.M., Mason, R.P., 2007. Human impacts on open ocean mercury con-centrations. Glob. Biogeochem. Cycles 21, GB4022. https://doi.org/10.1029/2006GB002876.
Sunderland, E.M., Krabbenhoft, D.P., Moreau, J.W., Strode, S.A., Landing, W.M., 2009.Mercury sources, distribution, and bioavailability in the North Pacific Ocean: insightsfrom data and models. Glob. Biogeochem. Cycles 23, 1–14. https://doi.org/10.1029/2008GB003425.
Tobergte, D.R., Curtis, S., 2013. Microwave assisted acid digestion of sileceous and
E. Cruz-Acevedo et al. Deep-Sea Research Part I 144 (2019) 52–62
61

organically based matrices. J. Chem. Inf. Model. 53, 1689–1699. https://doi.org/10.1017/CBO9781107415324.004.
UN, 2017. Minamata Convention on Mercury [WWW Document], United NationsEnvironment Programme. ⟨http://www.mercuryconvention.org/Portals/11/documents/Booklets/COP1%20version/Minamata-Convention-booklet-eng-full.pdf⟩(accesed 03.05.18).
UNEP, 2002. Global Mercury Assessment. United Nations Environment Programme,Geneva, Switzerland.
Walker, C.H., Sibly, R.M., Hopkin, S.P., Peaka, D.B., 2012. Principles of Ecotoxicology,
4th ed. CRC Press, Boca Raton.Wilkinson, T.A.C., Wiken, E., Bezaury-Creel, J., Hourigan, T.F., Agardy, T., Hermann, H.,
Janishevski, L., Madden, C., Morgan, L., Padilla, M., 2009. Marine Ecoregions ofNorth America. Commission for Environmental Cooperation, Montreal, Canada.
Zamora-Arellano, N.Y., Ruelas-Inzunza, J., García-Hernández, J., Ilizaliturri-Hernández,C.A., Betancourt-Lozano, M., 2017. Linking fish consumption patterns and health riskassessment of mercury exposure in a coastal community of NW Mexico. Hum. Ecol.Risk Assess. Int. J. 23, 1505–1521. https://doi.org/10.1080/10807039.2017.1329622.
E. Cruz-Acevedo et al. Deep-Sea Research Part I 144 (2019) 52–62
62