Embed Size (px)
Citation preview
Deep water formation in the North Pacific and deglacial CO2 rise 1
2
James W.B. Rae1,2,3,4 *, Michael Sarnthein5, Gavin L. Foster6, Andy Ridgwell2, Pieter M. 3
Grootes7, Tim Elliott1 4
5
1 Bristol Isotope Group, Department of Earth Sciences, University of Bristol, Bristol BS8 1RJ, 6
UK 7
2 BRIDGE, School of Geographical Sciences, University of Bristol, Bristol BS8 1SS, UK 8
3 Division of Geological and Planetary Sciences, California Institute of Technology, Pasadena 9
91125, USA 10
4 Department of Earth and Environmental Sciences, University of St Andrews, St Andrews, 11
KY16 9AL, UK 12
5 Institut für Geowissenschaften, University of Kiel, Kiel D-24098, Germany 13
6 Ocean and Earth Science, National Oceanography Centre Southampton, University of 14
Southampton, Southampton SO14 3ZH, UK 15
7 Institute of Ecosystem Research, University of Kiel, Kiel D-24098, Germany 16
17
Keypoints 18
- Deep water formed in the N Pacific during HS1 reaching 3600 m 19
- Driven by reduced atmospheric freshwater flux during stadial conditions 20
- Model shows N Pacific deep water can account for significant deglacial CO2 rise 21
22
Index terms: Abrupt/rapid climate change; Glacial; Geochemical tracers; Biogeochemical 23 cycles, processes, and modeling; Carbon cycling 24
25
Keywords: Radiocarbon; Boron isotopes; North Pacific; Deglacial CO2; Deep water formation; 26 Atmospheric teleconnections 27
28
2
Abstract 28
Deep water formation in the North Atlantic and Southern Ocean is widely thought to influence 29
deglacial CO2 rise and climate change; here we suggest that deep water formation in the North 30
Pacific may also play an important role. We present paired radiocarbon and boron isotope data 31
from foraminifera from sediment core MD02-2489 at 3640 m in the North East Pacific. These 32
show a pronounced excursion during Heinrich Stadial 1, with benthic-planktic radiocarbon 33
offsets dropping to ~350 years, accompanied by a decrease in benthic δ11B. We suggest this is 34
driven by the onset of deep convection in the North Pacific, which mixes young shallow waters 35
to depth, old deep waters to the surface, and low-pH water from intermediate depths into the 36
deep ocean. This deep water formation event was likely driven by an increase in surface salinity, 37
due to subdued atmospheric/monsoonal freshwater flux during Heinrich Stadial 1. The ability of 38
North Pacific Deep Water (NPDW) formation to explain the excursions seen in our data is 39
demonstrated in a series of experiments with an intermediate complexity Earth system model. 40
These experiments also show that breakdown of stratification in the North Pacific leads to a 41
rapid ~30 ppm increase in atmospheric CO2, along with decreases in atmospheric δ13C and Δ14C, 42
consistent with observations of the early deglaciation. Our inference of deep water formation is 43
based mainly on results from a single sediment core, and our boron isotope data are unavoidably 44
sparse in the key HS1 interval, so this hypothesis merits further testing. However we note that 45
there is independent support for breakdown of stratification in shallower waters during this 46
period, including a minimum in δ15N, younging in intermediate water 14C, and regional warming. 47
We also re-evaluate deglacial changes in North Pacific productivity and carbonate preservation 48
in light of our new data, and suggest that the regional pulse of export production observed during 49
the Bølling-Allerød is promoted by relatively stratified conditions, with increased light 50
3
availability and a shallow, potent nutricline. Overall, our work highlights the potential of NPDW 51
formation to play a significant and hitherto unrealized role in deglacial climate change and CO2 52
rise. 53
54
1. Introduction 55
During the last deglaciation, atmospheric CO2 levels rose in a series of steps, associated with 56
millennial-scale shifts in global climate (EPICA, 2004; Shakun et al., 2012). The magnitude and 57
pacing of CO2 rise points to the deep ocean as the dominant source of carbon (Broecker, 1982), 58
and changes in deep water formation are commonly invoked to explain the release of this carbon 59
to the atmosphere (e.g. Knox and McElroy, 1984; Sarmiento and Toggweiler, 1984; Siegenthaler 60
and Wenk, 1984; Sigman et al., 2010; Sarnthein et al., 2013). At the present day, deep water 61
formation to depths greater than 2000 m takes place in the North Atlantic and Southern Oceans, 62
and mechanisms to explain deglacial climate and CO2 change have thus focused on these regions 63
(Toggweiler et al., 2006; Hain et al., 2010). A paradigm has emerged (Denton et al., 2010) that 64
invokes reduced North Atlantic Deep Water formation as a mechanism for driving cold stadial 65
periods in the Northern Hemisphere (Sarnthein et al., 2000; McManus et al., 2004), such as 66
Henrich Stadial 1 (HS1 ~19-14.7 ka) and the Younger Dryas (YD 12.9-11.8 ka). At these times, 67
the Southern hemisphere is observed to warm (Barker et al., 2009; Pedro et al., 2011), and this 68
“bipolar seesaw” of temperature change is thought to be associated with shifts in atmospheric 69
circulation (Fletcher & Moreno, 2011) and sea ice cover (Fischer et al., 2007). These in turn 70
may cause reduced stratification in the Southern Ocean, with increased upwelling bringing 71
carbon-rich deep waters to the surface (Anderson et al., 2009). Given the inefficiency of 72
phytoplankton productivity in the Southern Ocean, CO2 and nutrients brought to the surface by 73
4
deep mixing are not fully utilised by photosynthesis (François et al., 1997), and CO2 may thus 74
escape from the deep ocean to the atmosphere (Toggweiler et al., 2006; Sigman et al., 2010). 75
76
The role of the North Pacific in this deglacial chain of events has been thought to be less active 77
than those of its polar siblings, the North Atlantic and Southern Ocean (Haug & Sigman, 2009). 78
In contrast to the North Atlantic and Southern Oceans, the North Pacific does not currently form 79
deep water, due to regional density stratification caused by low salinity in surface waters (Figure 80
1; Warren, 1983; Emile-Geay et al., 2003; Ferreira et al., 2010). Although several studies have 81
suggested that North Pacific intermediate water formation increased during glacial and stadial 82
conditions (Kennett & Ingram, 1995; Keigwin, 1998; Matsumoto et al., 2002; Herguera et al., 83
2010; Okazaki et al., 2010), it has been assumed that this did not penetrate deeper than ~2700 m. 84
Thus, while the deep North Pacific has been considered an efficient glacial CO2 store (Galbraith 85
et al., 2007), it has not previously been thought to form deep water or to play a direct role in 86
deglacial CO2 rise (Haug & Sigman, 2009). 87
88
We challenge this view with new data from sediment core MD02-2489 from the deep North 89
Eastern Pacific. We use coupled measurements of the boron isotope (δ11B) and radiocarbon 90
(14C) composition of foraminifera to trace the chemistry of carbon in the deep North Pacific and 91
its exchange with the atmosphere over the last deglaciation. These data are interpreted with 92
support from an Earth system model, and compared to regional proxy data, to provide a new 93
picture of deglacial circulation in the North Pacific, and its role in atmospheric CO2 rise. 94
95
5
2. Regional setting 96
2.1 Circulation 97
The deep North Pacific is ventilated, today, by derivatives of waters from the Southern Ocean 98
and North Atlantic (Reid, 1969; Broecker et al., 1998; Tomczak & Godfrey, 1994). These 99
waters gradually de-densify, upwell, and recirculate southward at mid-depths of the Pacific, 100
creating a large body of old and weakly stratified deep water (Warren & Owens, 1988; Reid, 101
1997; Emile-Geay & Madec, 2008). Local ventilation in the North Pacific is currently limited to 102
intermediate depths (~300-800 m; Talley, 1993). This North Pacific Intermediate Water forms 103
through winter cooling and brine rejection in the Sea of Okhotsk (Talley, 1991; Yasuda et al., 104
2002; Shcherbina et al., 2003), and perhaps also the Alaskan Gyre (Van Scoy et al., 1991), with 105
further modification by subsurface mixing in the Kurile Islands and Kuroshio and Oyashio 106
currents (Talley, 1997). The density (and hence depth penetration) of these locally-ventilated 107
waters is strongly limited by low sea surface salinity in the subpolar gyre (Warren, 1983). 108
Although the surface of the northern North Pacific cools to near freezing in the Winter, salinity is 109
only 32.8, significantly lower than underlying deep water salinities of 34.6 (c.f. equivalent values 110
of 34.7 and 34.9 in the northern North Atlantic; Figure 1a; Emile-Geay et al. 2003). 111
112
The causes of the subpolar North Pacific salinity minimum, and associated stratification, are 113
thoroughly reviewed by Warren (1983) and Emile-Geay et al. (2003), who highlight the local 114
excess of precipitation over evaporation, combined with minimal exchange of subpolar waters 115
with the relatively salty subtropical gyre. This local precipitation occurs mainly in the Westerly 116
storm track, which transfers water vapor from low latitudes and the East Asian Monsoon region 117
6
to the subpolar gyre (Emile-Geay et al., 2003). Other freshwater inputs include monsoonal run-118
off (Wang et al., 2005), and transfer in the trade winds of moisture evaporated from the Atlantic 119
(Broecker et al., 1985). The minimal exchange of water between the subtropical and subpolar 120
gyres is a function of the relatively zonal wind stress in the North Pacific, and the lack of large 121
scale overturning circulation (Emile-Geay et al., 2003; Stommel, 1961). Although some aspects 122
of Pacific freshness are related to basin geometry (Ferreira et al., 2010; Nilsson et al., 2013) and 123
will thus remain constant on glacial-interglacial timescales, the influences of major rain belts and 124
cross-gyre exchange have the potential to change dynamically, and may thus drive significant 125
changes in sea surface salinity and deep water formation in the past (e.g. Boyle & Keigwin, 126
1987; Okazaki et al., 2010). 127
128
2.2 Biogeochemistry 129
The subpolar North Pacific surface is a High Nutrient Low Chlorophyll zone, with abundant 130
major nutrients that are not efficiently used by phytoplankon. Major nutrients are supplied to the 131
surface by intense winter cyclones, alongside extensive upwelling driven by cyclonic wind-stress 132
curl in the subpolar gyre and tidal mixing in the Kurile Island chain (Nakamura et al., 2000; 133
Sarmiento et al., 2004; Tsunogai, 2002; Key et al., 2004). Given the abundance of major 134
nutrients in this region, phytoplankton productivity is limited by light and minor nutrients, such 135
as iron (Boyd et al., 2007). 136
137
At intermediate depths, North Pacific biogeochemistry is characterised by an extensive oxygen 138
minimum zone. These waters also have extremely low pH, due to remineralisation of organic 139
7
carbon into DIC (Figures 1 and S1). Below depths of ~1800 m, pH increases due to 140
remineralisation of CaCO3, which occurs deeper in the water column than organic carbon, and 141
provides a source of alkalinity to deep waters (Figure S1). 142
143
Radiocarbon has a notably different profile than pH, being predominantly controlled by 144
ventilation age, with minimal influence from remineralisation. As a result, depths of ~200-500 145
m have relatively young radiocarbon ages but extremely low pH. In contrast, at the depth of the 146
sediment core described in this study (3640 m), radiocarbon ages are among the oldest in the 147
water column, whereas pH is significantly higher than that at intermediate depths. (Figure 1). 148
149
3. Methods 150
Sediment core MD02-2489 was raised from 3640 m on the Patten Seamount off the Alaskan 151
Margin at 54.39° N, 148.92° W (Figure 1). Its sedimentology is thoroughly described by 152
Gebhardt et al. (2008; their supplementary Figure 2) and shows no notable disturbance 153
(slumping, burrowing etc.) during the deglaciation, though there is some evidence of coring 154
disturbance in the top 50 cm of the core, which prevented us from making core-top 155
measurements. The high sedimentation rate (~20 cm/kyr) and availability of epifaunal benthic 156
foraminifera in MD02-2489 are rare attributes in cores of this depth in the North Pacific, and 157
make MD02-2489 particularly well-suited to this study. 158
159
3.1 Age control 160
8
161
In this study we establish a new age model for MD02-2489 based on correlation of high 162
resolution (2 cm sample spacing) δ18O from planktic foraminifera (Gebhardt et al., 2008) to δ18O 163
from the NGRIP ice core (NGRIPmembers, 2004; Johnsen et al., 1997) on the GICC05 timescale 164
(Rasmussen et al., 2006; Andersen et al., 2006; Svensson et al., 2006) and δ18O from Hulu Cave 165
speleothem records (Wang et al., 2001; Southon et al., 2012; Wu et al., 2009; Figure S2, Table 166
S1). The δ18O features in our data and reference records may be related by: 1) a salinity link 167
between the East Asian Monsoon and North Pacific surface waters (Wang et al., 1999); 2) a 168
temperature link between Greenland and the North Pacific (Hendy & Kennett, 2000; Kiefer et 169
al., 2001; Shen et al., 2010); and/or 3) a North Pacific source of precipitation at NGRIP, 170
especially under glacial conditions (Kiefer et al., 2002; Langen & Vinther, 2009). We note that 171
correlation to either the speleothem or the ice core reference records produces a very similar 172
chronology for our core, and that the removal of either record, or any individual tie point, would 173
have little effect on our age model. The youngest portion of our core (13 – 6 ka) lacks distinct 174
tie points. We thus use conventional radiocarbon dating in this interval, with the Marine09 curve 175
from IntCal09 (Reimer et al., 2009), and a reservoir age of 850 ±100 years for the shallow 176
subsurface habitat of N. pachyderma (s.) (Southon & Fedje, 2003; Hutchinson et al., 2004; Key 177
et al., 2004). This approach is less risky in this interval than for the early deglacial, as deep 178
ocean and atmospheric 14C values are, by this time, much less disparate (Robinson et al., 2005; 179
Skinner et al., 2010; Burke & Robinson, 2012), so changes in ocean circulation are less likely to 180
significantly alter reservoir ages (Southon & Fedje, 2003; Hutchinson et al., 2004). 181
182
9
Age control in MD02-2489 has previously been established using planktic 14C plateau tuning (a 183
technique described by Sarnthein et al., 2007) by Gebhardt et al. (2008), and this has been 184
recently updated by Sarnthein et al. (2013; Figure S3, Table S2). Good agreement is seen 185
between these independent approaches, both of which place the major excursion in our benthic-186
planktic 14C offsets during early HS1 (Figure S3). Furthermore many of our conclusions can be 187
reached in “depth” space by comparing multiproxy data within our core MD02-2489 (Figure 2). 188
Thus choice of age model does not change the main conclusions of our study. 189
190
We also present an updated age model for ODP 887, which is adjacent to our core site. ODP 191
887’s original deglacial age model (Galbraith et al., 2007) was based on conventional 192
radiocarbon dating, assuming a reservoir age of 950 ± 200 years throughout the deglaciation; 193
these age control points were then shifted within their uncertainties to give smooth variations in 194
sedimentation rate. We have updated ODP 887’s age model for the early deglaciation, based on 195
ties between % CaCO3 data at this site and in our adjacent core MD02-2489 (Figure S4, Table 196
S3). This approach is supported by the close proximity of our sites: MD02-2489 is at 54.39° N, 197
148.92° W, 3640 m and ODP 887 is at 54.37° N, 148.45° W, 3647 m (see Figure 1). We note 198
that this revised age model gives excellent agreement between % organic carbon records and 199
planktic radiocarbon data (Figure S4), and gives smoother variations in ODP 887’s 200
sedimentation rate than in the published age model (Galbraith et al., 2007). Furthermore, these 201
tie points remain within the 2σ uncertainties of the published age control points. For the LGM 202
and late deglacial portions of ODP887 we use conventional 14C dating, as these intervals lack 203
distinct tie points. We use the Marine09 curve from IntCal09 (Reimer et al., 2009), with a 204
reservoir age of 1800 ± 250 years in the LGM, as constrained by reservoir ages in our core, and 205
10
reservoir ages of 850 ± 100 years in the late deglacial, as used in our core during the late 206
deglacial and Holocene. Note that, irrespective of the absolute chronology, our approach serves 207
to synchronize these two cores. 208
209
3.2 Proxy background and analysis 210
3.2.1 Radiocarbon 211
The radiocarbon content of dissolved inorganic carbon (DIC) in seawater reflects the exchange 212
of CO2 at the ocean’s surface with the atmosphere, and the subsequent radioactive decay of 14C 213
as deep water circulates within the ocean’s interior. Radiocarbon content may be expressed as a 214
14C age, or in Δ14C units, which gives the 14C /12C ratio of a sample relative to a standard, and 215
corrected for mass dependent isotope fractionation and decay since time of sample formation. 216
Planktic foraminifera record the 14C content of waters in their surface (or shallow subsurface) 217
habitat, which reflects the balance between CO2 exchange with the atmosphere, and upwelling of 218
14C-depleted waters from below. Benthic foraminifera record the 14C content of ambient deep 219
waters, a function of the time since that water left the surface ocean. A reduced 14C offset 220
between benthic and planktic foraminifera may thus act as a sensitive tracer of local deep water 221
formation. Radiocarbon ventilation ages (or reservoir ages) are given here as the difference in 222
14C age between foraminifera and the contemporaneous atmosphere (the 14C content of which 223
changes over time). We use the atmospheric 14C compilation of IntCal09 (Reimer et al., 2009), 224
spliced with the Hulu Cave 14C record for the 15 – 26 ka interval (Southon et al., 2012); reservoir 225
ages associated with the plateau-tuned age model use the Lake Suigetsu 14C record (Ramsey et 226
al., 2012). Note that the foraminiferal 14C reservoir ages given here are not equivalent to the true 227
11
ventilation age of a parcel of water, as they are not calculated via the decay trajectory of 14C 228
(Adkins & Boyle, 1997), and because surface waters, when subducted, have a non-zero 229
radiocarbon age. 230
Radiocarbon measurements were made on planktic foraminifera (N. pachyderma (s.)) and mixed 231
benthic foraminifera (avoiding deep-dwelling infaunal species; Magana et al., 2010) by 232
Accelerator Mass Spectrometry (AMS), on graphite targets of foraminiferal carbonate. Given 233
the sedimentation rate (~20 cm/kyr) and depth (3640 m) of MD02-2489, which results in low 234
flux rates of particulate organic matter, mixing of 14C signals by bioturbation is unlikely to be a 235
significant issue (Trauth et al., 1997). Benthic 14C analyses were therefore made throughout the 236
core, rather than limiting samples to benthic abundance peaks (see Keigwin, 2004). Radiocarbon 237
uncertainties are given at 1SE, in keeping with 14C convention. Analytical uncertainties are 238
around 30 14C years in the late Holocene, increasing to ~100 14C years at the LGM. Δ14C error 239
ellipses are based on a Monte Carlo simulation that combines age and analytical uncertainties, 240
and are typically ~70 ‰. The typical age range of tied features in our planktic δ18O data and the 241
reference ice core and speleothem records is of the order 200 calendar years; we thus use a 242
calendar age uncertainty of 100 years (1 SD) for calculating uncertainty ellipses. Benthic-243
planktic uncertainties are based on the quadratic addition of analytical uncertainties in benthic 244
and planktic 14C, and are around 60 14C years in the late Holocene, and 150 14C years at the LGM 245
(and see also Sarnthein et al., 2013). 246
247
3.2.2 Boron isotopes 248
12
The systematics of boron isotopes in benthic foraminifera are thoroughly described in Rae et al. 249
(2011). In brief, the boron isotope composition (expressed in δ11B notation relative to NIST 951 250
standard; Catanzaro et al., 1970) of epifaunal benthic foraminifera of the genus Cibicidoides has 251
been shown to record the boron isotope composition of the borate ion (B(OH)4-) in seawater. As 252
δ11B of B(OH)4- is a function of seawater pH, Cibicidoides δ11B may be used to trace changes in 253
the carbonate chemistry of bottom water at our core site (Figure S1). 254
Boron isotope analyses were made on samples of 9 - 25 (0.2 - 1.3 mg) oxidatively cleaned C. 255
wuellerstorfi var. by Multi-Collector Inductively Coupled Plasma Mass Spectrometry (Foster, 256
2008; Rae et al., 2011; Foster et al., 2013). Uncertainty is reported at 95 % confidence (2 SD) 257
based on the relationship determined between sample size and long-term reproducibility, and in 258
this dataset is typically ~0.3 ‰ (equivalent to ~0.03 pH units; Rae et al., 2011). Samples for 259
boron isotopes were typically picked from sediment core samples spanning 1 or 2 cm. However 260
to obtain enough foraminifera, the sample centered at 200.5 cm uses material from 189-212 cm, 261
and so is plotted with a broad symbol that spans this range. 262
To calculate pH from our δ11B data, we use the fractionation factor (αB) of 27.2 ‰ (Klochko et 263
al., 2006), δ11Bsw of 39.61 ‰ (Foster et al., 2010), and assume temperature, salinity and pressure 264
at our core site of 0 °C, 35, and 3600 dbar (which gives pKB of 8.71; Dickson, 1990; Rae et al. 265
2011). Note that likely changes to these parameters over the deglaciation at our site have little 266
influence on the δ11B to pH conversion (<0.025 pH units), so our record is driven, primarily, by 267
changes in DIC and alkalinity (see Supplementary Information). Core disturbance prevented us 268
from making core-top δ11B measurements, so we assume that the C. wuellerstorfi at this site 269
accurately record bottom water δ11B of B(OH)4- (and thus pH) within analytical uncertainty of 270
~0.3 ‰ (equivalent to ~0.03 pH units), as shown in other regions (Rae et al. 2011). 271
13
272
3.4 Earth system modelling 273
3.4.1 Model description 274
We ran a set of sensitivity tests with the GENIE Earth system model (Cao et al., 2009) to 275
examine the effect of changes in North Pacific circulation on pH and radiocarbon at our site, and 276
atmospheric CO2, δ13C, and Δ14C. GENIE consists of a three-dimensional non-eddy-resolving 277
frictional geostrophic ocean circulation model, two-dimensional sea ice and energy moisture 278
balance atmospheric models, and incorporates representations of the marine geochemical cycling 279
of carbon and other biologically mediated tracers (Ridgwell et al., 2007). We use a 36×36 equal-280
area horizontal resolution and 16 vertical levels, with the same physics and ocean carbon cycle 281
configuration as described and evaluated in (Cao et al., 2009), except with the addition of an 282
additional iron limitation control on marine productivity (Annan & Hargreaves, 2010). Although 283
GENIE is a low ocean resolution model of intermediate complexity, it is able to successfully 284
capture many of the large scale features of biogeochemical cycling in the modern ocean, 285
including simulating inventories of anthropogenic CO2 and CFCs consistent with observations 286
(Cao et al., 2009). Crucially for this study, GENIE simulates present-day pH and Δ14C 287
distributions in the North Pacific that are in close agreement with observations. Our experiments 288
run under pre-industrial boundary conditions start from the end of a 20,000 year equilibrium 289
spin-up carried out with a prescribed atmospheric pCO2 value of 278 ppm, δ13C of -6.50 ‰ and 290
Δ14C of 0 ‰. 291
3.4.2 Experimental design 292
14
We ran a series of salinity-addition (“anti-hosing”) experiments for the surface North Pacific to 293
explore the geochemical consequences of deep water formation. These experiments are 294
conceptually similar, but in an opposite sense, to the widely used methodology of fresh-water 295
hosing in the North Atlantic to simulate reduced North Atlantic Deep Water formation 296
(Rahmstorf et al., 2005; Liu et al., 2009). Given the relatively low resolution and idealized 297
convection scheme of GENIE, we do not aim to constrain the magnitude or location of salinity 298
forcing required to cause NPDW formation (though we note that NPDW formation has been 299
shown to increase in response to Atlantic freshwater forcing in a variety of more sophisticated 300
models (Krebs & Timmermann, 2007; Okazaki et al., 2010; Hu et al., 2012). Rather, our 301
experiments explore the effect of stratification breakdown on deep water 14C and pH, and 302
atmospheric CO2, and use a wide range of forcing styles and boundary conditions to test the 303
robustness of these results. Atmospheric 14C production is diagnosed consistent with the model 304
spin-up and held constant throughout our perturbation simulations. 305
3.4.3 Salinity Forcing 306
Although several lines of evidence suggest that freshwater input to the surface of the North 307
Pacific was reduced during HS1 and the YD (Section 3.3), there are considerable uncertainties in 308
the spatial pattern, and intensity of these changes. Therefore rather than trying to match any 309
particular record, we simply add salinity instantaneously to the surface of the North Pacific, and 310
run sensitivity tests with a variety of spatial patterns and magnitudes of salinity addition. These 311
include salinity addition at a single grid cell in the east, west or middle of the North Pacific; as a 312
uniform addition to every North Pacific cell north of 51°N; and in a pattern constrained by 313
precipitation minus evaporation (P-E) and/or salinity changes seen in general circulation model 314
(GCM) experiments that mimic Heinrich events in the North Atlantic (Okazaki et al., 2010; 315
15
Krebs & Timmermann, 2007; Eisenman et al., 2009); these tend focus the net rainfall or salinity 316
anomaly in the NE Pacific. For each spatial pattern, we test total magnitudes of salinity forcing 317
equivalent to -0.1, -0.3, -0.5, -0.7 Sv, similar to the magnitudes of freshwater forcing commonly 318
used in North Atlantic hosing experiments (Rahmstorf et al., 2005). 319
3.4.4 Glacial boundary conditions 320
In addition to running anti-hosing experiments under modern boundary conditions, we also test 321
the effect of glacial-like boundary conditions on our model results. To nudge the GENIE model 322
into a more glacial climate state, we reduced the radiative forcing consistent with concentrations 323
of the major greenhouse gases (CO2, CH4, and N2O of 191 ppm, 350 ppb, and 216 ppb, 324
respectively; Monnin et al., 2001; Loulergue et al., 2008; Schilt et al., 2010). In addition, we 325
increased the zonally-averaged planetary albedo profile in the Northern Hemisphere (this version 326
of GENIE, in not including a land surface scheme, can only account for albedo in terms of a 327
fixed net planetary profile plus the effect of sea-ice (Edwards & Marsh, 2005)), and increased 328
average ocean salinity by ~1 PSU. 329
Some studies have suggested that intermediate depths of the North Pacific were better ventilated 330
during the LGM or early HS1 than at present (Keigwin, 1998; Duplessy et al., 1988; Matsumoto 331
et al., 2002; Herguera et al., 2010; Okazaki et al., 2010; Jaccard & Galbraith, 2011), and thus we 332
run a batch of salinity-forcing experiments using a base state with enhanced North Pacific 333
Intermediate Water. We simulate this base state by reducing the prescribed transfer of 334
freshwater from the Atlantic to the Pacific, which in the default model implicitly accounts for the 335
net moisture transport between these basins (Edwards & Marsh, 2005; Marsh et al., 2004). 336
Reducing the freshwater transfer from 0.73 Sv to 0.57 Sv results in a shoaling of NADW in the 337
Atlantic Ocean (as seen in the reconstructions of Curry & Oppo (2005), Sarnthein et al. (2000), 338
16
Lynch-Stieglitz et al. (2007)) and an increase in intermediate water ventilation in the North 339
Pacific. 340
We also run experiments under a glacial base state characterized by increased deep ocean 341
stratification driven by saltier Antarctic-formed deep waters (Adkins et al., 2002; McCave et al., 342
2008; Lund et al., 2011). To simulate this base state we enhance “brine rejection” in the 343
Southern Ocean, by increasing the efficiency with which sea ice formation transfers salinity to 344
the deep ocean (similar to the approach of Bouttes et al., 2010). This results in an expanded 345
volume of saltier southern-sourced water in the Atlantic and Pacific and a shoaling of NADW in 346
the Atlantic Ocean. 347
348
4. Results 349
At the end of the last glacial maximum (LGM), our benthic 14C data are offset below the 350
contemporaneous atmosphere by ~460 ‰ or ~3400 years (Figure 3, 4, S5). This offset is much 351
greater than for modern deep water at this site (~230 ‰ or ~2160 years, Figure 1c; Key et al., 352
2004), indicating significant isolation of DIC from the atmosphere during the LGM. Our glacial 353
δ11B data have values around 15.7 ‰ (Figure 3), indicating a pH of ~7.9. As water column 354
carbonate system data (Figure 1b; Key et al., 2004) give δ11B of B(OH)4- of ~14.9 ‰ (Figure 1) 355
or pH of ~7.75, our benthic δ11B data suggest that the pH of the deep glacial North Pacific was 356
~0.15 higher than modern. 357
358
The key feature of our records occurs during the middle of Heinrich Stadial 1 (HS1) between 359
~17.3 and 16.0 ka. At this time, our benthic-planktic 14C offsets drop from ~1750 to ~350 14C 360
17
years, due to a simultaneous younging in deep waters and an increase in surface reservoir age 361
(Figures 2, 3, 4). Our δ11B record shows a negative excursion of ~0.6 ‰ at this time, equating to 362
a decrease in pH of ~0.075 units, though note that δ11B data resolution is low in this interval. 363
364
Following the mid-HS1 event, benthic-planktic 14C offsets and δ11B increase towards pre-365
excursion values. Then, during the Bølling-Allerød (BA 14.7-12.7 ka), benthic-planktic 14C 366
offsets decrease again, but in contrast to mid HS1, δ11B data show little change. δ11B displays 367
another excursion to lower pH values during the Younger Dryas, but in contrast to HS1, 14C 368
remains relatively constant in this interval (Figure 3). 369
370
5. Discussion 371
5.1 Glacial and deglacial changes in ventilation and carbonate chemistry 372
5.1.1 Deep Ocean carbon storage at the LGM 373
Hypotheses for lowering atmospheric CO2 during glacial periods typically invoke increased DIC 374
storage in the deep ocean, and have often suggested the deep North Pacific as a likely store for 375
this carbon (e.g. Jaccard et al., 2009). This is supported by our benthic 14C data, which have 376
benthic-atmosphere 14C ages among the oldest yet found in the deep ocean at the LGM 377
(Galbraith et al., 2007; Skinner et al., 2010). These poorly ventilated deep waters would have 378
accumulated DIC that was isolated from the atmosphere (Sarnthein et al., 2013), acting as an 379
effective carbon store. The elevated pH at the LGM, implied by the comparison of our δ11B data 380
to modern water column values, suggests that any such increase in DIC storage in the deep North 381
18
Pacific must have been buffered by a greater increase in alkalinity (Figure S1), consistent with 382
regionally enhanced preservation of CaCO3 (Gebhardt et al., 2008; Anderson et al., 2008). 383
Mechanisms that could lead to increased deep Pacific alkalinity include a carbonate 384
compensation response to shoaling of North Atlantic deep water (Broecker & Peng, 1987), 385
increased trapping of deeply remineralised CaCO3 in a more stratified deep ocean (Hain et al., 386
2010), or a decrease in the rain rate ratio of CaCO3 to organic carbon due to changes in 387
productivity (Archer & Maier-Reimer, 1994). As the North Pacific lies at the end of the global 388
overturning circulation (Talley 2013), the operation of any of these processes in upstream 389
regions would be felt at our site. Note that, even though the glacial deep North Pacific had 390
higher pH and thus likely had lower [CO2] than modern, these waters may still act as an effective 391
carbon reservoir that contributed to low atmospheric pCO2. The key point in this regard is that 392
waters likely held higher DIC, rather than the particular form (CO2, HCO3- or CO3
2-) in which 393
this DIC existed. 394
395
5.1.2 Deep water formation during HS1 396
The major feature of our combined 14C and δ11B dataset is the rapid excursion to young benthic 397
radiocarbon ages and low pH during HS1 (Figure 2, 3). We suggest that these excursions are 398
best explained by a millennial-scale deep water formation event in the North Pacific. Our key 399
evidence is the dramatic decrease in benthic-planktic 14C offsets (Figure 2, 3), which is readily 400
explained by the onset of convective mixing between surface and deep waters. This will drive a 401
younging in deep waters, as young surface waters are brought to depth, and an increase in 402
surface reservoir ages, as older deep waters are mixed to the surface (Figure 1e). We note that in 403
the modern ocean, deep to surface water offsets as small as ~350 14C years (as seen in our 404
19
record) are only found near sites of deep water formation in the North Atlantic and Southern 405
Ocean (Key et al., 2004). 406
407
Initiation of deep convection may also explain the low-pH excursion seen in δ11B (see 408
Supplementary Information for further discussion of interpretation of δ11B data). Although, in 409
the modern ocean, newly ventilated deep water is typically associated with relatively high pH, 410
this would not be expected upon initiation of deep water formation in a previously stratified 411
basin. Figure 1 shows that our core site underlies a large body of water at intermediate depth 412
(~200-2000 m) with extremely low pH, derived from remineralisation of organic carbon, and 413
maintained by minimal mixing with higher pH waters above and below. Initiation of deep 414
convective mixing in the North Pacific would entrain the low pH signature of this water to the 415
depth of our core site (Figure 1d). This process is also supported by benthic δ13C data (Gebhardt 416
et al., 2008) from the same core (Figure 4), which show a pronounced decrease at the start of this 417
interval, and then climb to higher values during the deep water formation event. This is 418
consistent with mixing to depth of low-δ13C intermediate waters rich in remineralised carbon, 419
which are gradually replaced by high-δ13C surface waters. 420
421
Although modern waters at our site are ventilated by derivatives of Southern Ocean waters 422
(Reid, 1969; Broecker et al., 1998), we rule out that these data reflect circulation changes 423
originating in the Southern Ocean: the 14C excursion in the deep North Pacific precedes the 424
major changes in Southern Ocean 14C by ~1500 years, attains values ~2200 14C years younger 425
than those at similar depths in the Southern Ocean (Skinner et al., 2010), and shows a return to 426
20
old 14C values at 16.0 ka not observed in deep Southern Ocean 14C records (Burke & Robinson, 427
2012). 428
429
The deep water formation event we infer is pronounced, but short lived. After 16 ka we observe 430
a return to pre-excursion benthic-planktic 14C values, and an increase in δ11B (Figure 3), 431
suggesting a return to more stratified conditions. The rapid increase in benthic 14C age we 432
observe is too quick to be caused by 14C radioactive decay, and must result from re-penetration 433
of old deep waters, likely from the South and East Pacific, to our core site. 434
435
Benthic-planktic 14C offsets decrease again during the BA but don’t reach values as low as in 436
HS1, and δ11B remains relatively high and stable (Figure 3). As this BA 14C shift lags similar 437
changes in the Southern Ocean (Skinner et al., 2010; Burke & Robinson, 2012), and intermediate 438
depth 14C and redox records indicate stratified conditions in the upper water column (Kennett & 439
Ingram, 1995; Okazaki et al., 2010; Hendy & Pedersen, 2005; Figure 4), we attribute this second 440
younging to a rejuvenation in far-field ventilation rather than local vertical mixing, in agreement 441
with previous studies (Galbraith et al., 2007). 442
443
Although the YD shows a similar boron isotope excursion to that in HS1, the available benthic 444
14C data show little change. The YD δ11B excursion may thus reflect a similar mixing event to 445
that inferred during HS1, but with a reduced deep ocean to atmosphere 14C gradient (and hence 446
less impact on deep water 14C) or a spatially different pattern of mixing (see Figure 6). 447
Alternatively, changes taking place in the Southern Ocean at this time may be influencing our 448
21
YD δ11B and 14C data (Skinner et al., 2010; Burke & Robinson, 2012). Currently we cannot 449
distinguish between these scenarios, so we focus the remainder of our discussion on the better 450
constrained HS1 event. 451
452
5.2 NPDW formation in an Earth system model 453
We test our hypothesis that the 14C and δ11B excursions during HS1 may be explained by deep 454
water formation in the North Pacific using the GENIE Earth system model. Upon adding salinity 455
to the surface of the North Pacific we see an increase in the depth and intensity of local deep 456
water formation, with greater magnitudes of salinity addition giving more intense and deeper 457
convection more rapidly. North Pacific deep water formation causes a dramatic increase in Δ14C 458
in the deep NE Pacific in our model, as observed in our benthic 14C data (Figure 5 & 6). This 459
young water spreads south as a deep western boundary current, while waters further south and 460
east stay relatively old (Figure 6, bottom panel). Shallower in the water column there is a slight 461
decrease in Δ14C, due to upwelling of old deep waters and a decrease in atmospheric Δ14C. The 462
largest Δ14C changes at our core site are seen in the experiments where deep water formation 463
occurs nearby (e.g. Figure 6a), or in the experiments where salinity is spread over a larger area 464
(e.g. Figure 6e), which more thoroughly mixes young waters into the deep ocean. 465
466
North Pacific deep water formation also drives a decrease in deep NE Pacific pH in our model, 467
as seen in our δ11B data (Figure 5 & 6). The pattern of pH change in the model is consistent with 468
vertical mixing of the water column as illustrated in Figure 1d, with initially low-pH 469
intermediate waters showing a pronounced increase in pH, and initially high-pH deep waters 470
22
showing a decrease in pH. Experiments using a dye tracer confirm that the pH decrease at the 471
depth of our core site is a result of mixing with low-pH waters from intermediate depths. 472
However we note that the pH decrease is transient, because continued mixing of relatively high-473
pH waters derived from the surface eventually overcomes the low-pH signal of intermediate 474
waters (Figure 5c). For this reason, the most pronounced decreases in deep pH are seen when 475
the onset of deep convection is rapid and relatively focused to a small area (Figure 6a-c). In 476
these experiments, the low-pH signal of intermediate waters is propagated to depth before it can 477
be substantially diluted by mixing with high-pH surface water. Although an increase in salinity 478
is likely to occur over a relatively large area (e.g. Okazaki et al. 2010), convective mixing is, in 479
reality, a relatively localized process (Marshall & Schott, 1999), so it is difficult to assess which 480
of these forcings is most realistic. 481
482
An increase in Δ14C and decrease in pH at the depth of our core is also seen in our experiments 483
using glacial boundary conditions (Figure 5c & 6f-g). The simulation with increased salinity in 484
deep waters (Figure 6g) shows the largest change in Δ14C, as this experiment has the largest 485
initial gradients in Δ14C between the deep ocean and the atmosphere. In contrast, the decrease in 486
pH is somewhat muted in this experiment, as the rapid penetration of newly formed deep waters 487
to depth is inhibited by the presence of saltier bottom waters, and so more mixing between high-488
pH surface waters and low-pH intermediate waters occurs. In the simulation with better 489
ventilated North Pacific intermediate waters (Figure 6f) we also see a slightly muted pH 490
decrease, due to a reduction in the initial size and intensity of the intermediate-depth low-pH 491
zone. However this is in part compensated by a more rapid onset of deep water formation from 492
this better ventilated base state. 493
23
494
Our modelling experiments thus confirm that local deep water formation in the North Pacific is a 495
viable explanation for the HS1 excursions in our 14C and δ11B data, and show that this result is 496
robust across a range of forcing styles and initial model base states. 497
498
5.3 Related proxy records from the deglacial North Pacific 499
5.3.1 Ventilation records 500
Although ventilation to depths >2700 m has not previously been reconstructed in the North 501
Pacific during the deglaciation, deep water formation during HS1 is nonetheless consistent with 502
regional proxy records (Figure 3, 4, S5). For instance, our benthic radiocarbon data are in good 503
agreement with those from adjacent ODP core 887 (Galbraith et al., 2007), but this earlier record 504
misses the HS1 ventilation event due to lack of samples in the critical interval (orange diamonds 505
in Figure 3, 4, S5). At shallower depths (978 - 2700 m), an increase in intermediate water 506
ventilation is seen in several radiocarbon records in the NW Pacific (Okazaki et al., 2010) during 507
the whole of HS1 (~19 – 14.7 ka; green circles in Figure 4 & S5), and is also seen in redox 508
records from intermediate depths of the NE Pacific (Hendy & Pedersen, 2005). We note that 509
these intermediate-depth 14C records show little further younging during the 17.3 – 16.0 ka 510
interval of deep water formation in mid HS1, as they are already young and well-ventilated 511
(Figure 4 & S5). The most pronounced signal of younging on deep water formation is observed 512
at our deep high latitude core site, as these waters were extremely old prior to the deep water 513
formation event, and are close to the high latitude regions where deep water is likely to form. 514
Lund et al. (2011)’s record from 2710 m on the Oregon Margin lies between these two scenarios, 515
24
showing a small and gradual younging between 17.3 – 15.6 ka (purple triangles in Figure S5). 516
This may be explained by the fact that waters at this site are quite old prior to the deep water 517
formation event, but lie farther away from the high latitude formation regions and the likely deep 518
western boundary flow path of NPDW (see Figure 6 & Okazaki et al.,2010). 519
Comparison of the high latitude North Pacific 14C records (benthic 14C data from the Oregon 520
Margin (Lund et al., 2011) and the NW Pacific (Okazaki et al., 2010), and benthic and planktic 521
14C data from our core), shows that regional 14C gradients collapse from a spread of ~1700 14C 522
years or 250 ‰ at the LGM to a range of only ~500 14C years or 60 ‰ during mid HS1 (Figure 4 523
& S5). This convergence is in contrast to a spread of ~1650 years or 150 ‰ in the modern North 524
Pacific, and is more typical of the modern North Atlantic (Key et al., 2004), providing further 525
support for breakdown of stratification at high latitudes and local ventilation of deep waters. 526
Furthermore, waters at ~1800 m in the South China Sea, on the likely flow path of a North 527
Pacific western boundary current, show significant younging during HS1 (Site 17940 in 528
Sarnthein et al., 2013), and there is also some evidence for contemporaneous younging at 2800 m 529
in the Western Equatorial Pacific (Broecker et al., 2008). 530
Recently, sediment core uranium content has been used to argue that post-glacial reventilation of 531
the North Pacific did not occur until the BA (Jaccard & Galbraith, 2013). However authigenic 532
uranium is not a direct proxy for ventilation, and may respond to a variety of factors related to 533
sedimentary redox conditions at various times (Zheng et al., 2002; McManus et al., 2005). For 534
instance, given a low redox state in deep North Pacific sediment prior to HS1, the 1200 year 535
ventilation event we infer may cause only limited re-oxygenation of the sediment column, and 536
any signal of this may be masked by re-precipitation of authigenic uranium following the return 537
of poorly-ventilated deep waters at ~16 ka. Furthermore, the regional pulse of organic carbon 538
25
burial during the BA (Kohfeld & Chase, 2011) has the potential to create a sedimentary redox 539
(Mangini et al., 2001), complicating interpretation of authigenic uranium in the underlying 540
sediments. Although we agree that re-ventilation of the North Pacific from far-field sources did 541
occur during the BA (Galbraith et al., 2007; Figure 3), our data suggest that there was also a 542
pulse of local deep water formation during HS1, and this is unlikely to be recorded by authigenic 543
uranium. 544
545
5.3.2 Surface water signals 546
Additional signals of surface water stratification breakdown have been recorded in the North 547
Pacific during HS1 but not previously linked to the process of deep water formation. δ15N data 548
from ODP 887 (Figure 4c, Galbraith et al., 2008) show a broad negative excursion between ~18 549
– 14.7 ka, with a further decrease around 17 ka, indicating reduced nutrient utilisation and 550
reduced denitrification. Similar signals are also seen in δ15N records in the NW Pacific (Brunelle 551
et al., 2010), and are consistent with decreased stratification in surface waters and increased 552
ventilation of intermediate waters. Reduced surface stratification is also reflected in planktic 14C 553
reservoir ages from our core (Figure 4d), which show an aging at ~17 ka, due to upwelling of old 554
deep waters, and then a younging, as these old waters are replaced by younger surface waters 555
from the south. Finally, warming is observed in a variety of surface temperature proxy records 556
in the North Pacific (Seki et al., 2002; Kiefer & Kienast, 2005; Gebhardt et al., 2008; Pak et al., 557
2012; McClymont et al., 2012), superimposed on the general cooling of HS1 (Figure 4b – the 558
“Atlantic-Pacific seesaw”; Saenko et al., 2004), as would be expected from North Pacific 559
overturning drawing warm subtropical waters northwards. Indeed, this seesaw of Atlantic and 560
Pacific temperature changes may explain the regional differences in Greenland ice core δ18O at 561
26
this time (e.g. NGRIP in the north vs. GISP2 and GRIP in central Greenland; Figure 3a), given 562
the greater proportion of North Pacific moisture at the more northerly sites (Langen & Vinther, 563
2009). 564
565
5.3.3 Productivity and carbonate preservation 566
Our δ11B and 14C data, and new interpretation of the deglacial ventilation of the North Pacific, 567
offer an opportunity to re-evaluate the causes of deglacial productivity and CaCO3 changes in 568
this region. The major feature of deglacial North Pacific productivity proxy records is a pulse of 569
export production during the BA (Figure 7d, e & Kohfeld and Chase, 2011), at a time of relative 570
stratification of the upper water column (Figure 4, 7a, b). In contrast there is little change in 571
productivity over the interval of inferred deep water formation in HS1 (Figure 7d, e & Kohfeld 572
and Chase, 2011). This may be explained by the fact that productivity in the North Pacific is 573
strongly limited by light and micronutrients (Obata et al., 1996; Boyd et al., 2007), and by 574
consideration of likely deglacial changes in major nutrient supply. 575
576
During HS1, increased intermediate water ventilation and input of nutrient-poor subtropical 577
waters will reduce major nutrient concentrations in the subsurface North Pacific (Keigwin, 1998; 578
Okazaki et al., 2010). Thus although reduced stratification will bring more subsurface waters 579
into the euphotic zone, these waters will have reduced nutrient contents. Furthermore, an 580
increase in mixed layer depths will reduce the efficiency of phytoplankton productivity, due to 581
light limitation (Sverdrup, 1953). In contrast during the BA, stratification of surface waters will 582
alleviate light limitation, while reduced intermediate water ventilation may allow subsurface 583
27
nutrient concentrations to increase (Keigwin, 1998). Under these conditions, wind-driven winter 584
mixing may tap into a potent, shallow nutricline, while rapid springtime re-stratification of these 585
warm, fresh waters (Keigwin et al., 1992), will promote a pronounced spring bloom, giving the 586
pulse of export production recorded in BA sediments (Kohfeld & Chase, 2011). The importance 587
of light limitation was also recently highlighted by Lam et al. (2013), who demonstrated that the 588
BA productivity spike was not associated with changes in iron input (Figure 7c). These authors 589
also show that iron input to the North Pacific was significantly reduced following the 590
deglaciation, which explains the fact that productivity is lower in the Holocene than the BA, 591
despite similarly stratified conditions. 592
593
Sedimentary CaCO3 content shows a minimum in the deep North Pacific during HS1 (Figure 594
7f,g; Gebhardt et al., 2008; Galbraith et al., 2007), consistent with the decrease in deep water pH 595
recorded by our δ11B data (Figure 7h). This is followed by a spike in CaCO3 content during the 596
BA. Our δ11B data indicate that deep water pH at the BA wasn’t significantly higher than during 597
the LGM, so this CaCO3 spike cannot be primarily controlled by bottom water saturation state 598
(c.f. Jaccard et al., 2005; note that CaCO3 saturation and pH are tightly coupled at any given 599
site). Instead, the BA peak in CaCO3 is likely the result of the productivity pulse at the BA, 600
which both increases the flux of CaCO3 into sediments (shown with 230Th normalization by 601
Jaccard et al., 2009; Kohfeld and Chase, 2011; and Lam et al., 2013), and also causes improved 602
preservation, via rapid burial of CaCO3 due to high sedimentation rates (Figure 7i). Note the 603
lack of correspondence between δ11B and carbonate preservation during the YD, which can be 604
explained by the reduced sensitivity of sedimentary CaCO3 changes to bottom water carbonate 605
ion saturation under increased absolute CaCO3 contents (Broecker & Peng, 1982). 606
28
607
5.4 Driving mechanisms 608
The onset of deep convection in the North Pacific, as hypothesised from our records, requires an 609
increase in sea surface salinity (Warren, 1983; Boyle & Keigwin, 1987; Talley, 1991; Emile-610
Geay et al., 2003; Gebhardt et al., 2008). Possible drivers include: 1) a decrease in the intensity 611
of the East Asian monsoon (Wang et al., 1999; Wang et al., 2001); 2) a southward shift of the 612
Westerly storm-track (Allen & Anderson, 1993; McGee et al., 2012; Polyak et al., 2012); 3) a 613
southward shift in the trade winds and ITCZ (Leduc et al., 2007; Pahnke et al., 2007); and 4) 614
oceanic salinity feedbacks, in response to reduced North Atlantic Deep Water formation (Saenko 615
et al., 2004). The occurrence of such conditions during HS1 is supported by a variety of datasets 616
(Figure 4 & Broecker and Putnam, 2012), as well as coupled climate model results, which 617
commonly exhibit reduced precipitation relative to evaporation, and increased North Pacific 618
ventilation, in response to cold HS1 conditions and reduced NADW formation in the North 619
Atlantic (Stocker et al., 1992; Saenko et al., 2004; Timmermann et al., 2005; Krebs & 620
Timmermann, 2007; Eisenman et al., 2009; Okazaki et al., 2010; Chikamoto et al., 2012). North 621
Pacific deep water formation is also aided by a closed Bering Strait during HS1 (Hu et al., 2012), 622
and may be further preconditioned by the presence of warm salty waters at depth, overlain by 623
cold fresh waters; the mixing of these waters allows release of potential energy via 624
thermobaricity (Adkins et al., 2005). We suggest that, in response to reduced freshwater flux at 625
the start of the stadial (~19 ka), increased ventilation begins at intermediate depths in the NW 626
Pacific (Okazaki et al., 2010; Figure 4e). This may prime the region for the pulse of deep water 627
formation we observe at 17.3 – 16.0 ka, by drawing in high salinity waters from lower latitudes 628
(Stommel, 1961). Deep water formation may then occur as a threshold response to continued 629
29
salinity forcing, or may be triggered by a further decrease in East Asian Monsoon intensity 630
(Wang et al., 2001) and a southward shift in the Westerlies (Allen & Anderson, 1993; McGee et 631
al., 2012; Polyak et al., 2012), as observed during this interval (Figure 4c,d). 632
633
5.5 Deglacial CO2 rise 634
The inferred North Pacific deep water formation event at 17.3 – 16.0 ka occurs at the same time 635
as the first major rise in atmospheric CO2 during the deglaciation (Figure 3; Monnin et al., 2001; 636
Lourantou et al., 2010; Lemieux-Dudon et al., 2010). Our modelling experiments show an 637
atmospheric CO2 rise of ~30 ppm associated with stratification breakdown in the North Pacific, 638
very similar to the magnitude of the CO2 rise recorded in ice core records at this time (Figure 5 639
& 6). This results from the exposure of carbon-rich deep waters to the surface in a region of low 640
biological pump efficiency, leaking CO2 from the deep ocean to the atmosphere. Associated 641
with the rise of CO2 in the model is a decline in the δ13C of atmospheric CO2 of ~0.35 ‰, and a 642
drop in atmospheric Δ14C of ~50 ‰, which are also in line with available data (Schmitt et al., 643
2012; Reimer et al., 2009; Southon et al., 2012; Figure 5 & 6). 644
645
Significant CO2 rise, δ13C fall and Δ14C fall is seen in response to North Pacific deep water 646
formation across the range of forcing styles and boundary conditions we examine (Figure 6). 647
The largest changes are seen in the experiments with the largest magnitudes of salinity forcing, 648
as this causes deeper and more vigorous deep water formation, more effectively releasing CO2 649
from the deep ocean to the atmosphere. In our experiments using glacial boundary conditions, 650
changes in CO2, δ13C and Δ14C are muted when relatively small salinity forcings are applied. 651
30
This is because better ventilated intermediate waters (Figure 6f) mean that less DIC is initially 652
stored at mid depths of the North Pacific, while denser deep waters (Figure 6g) inhibit the 653
exposure of DIC stored in the abyssal North Pacific. When local mixing does penetrate the 654
abyssal waters (under increased salinity forcing), the changes in atmospheric CO2, δ13C and Δ14C 655
in these glacial-type experiments (Figure 6f-g) are similar to those under modern boundary 656
conditions (Figure 6c). 657
Our experiments show a significant drop in atmospheric Δ14C during this first period of the 658
“mystery interval” (Broecker & Barker, 2007). This is most pronounced in the simulations with 659
salty bottom waters, as these have the largest initial gradient between old deep waters and the 660
atmosphere. However our results also illustrate that a significant drop in atmospheric Δ14C is 661
possible without the presence of an extremely old (> 5000 14C yr) deep ocean carbon reservoir 662
(Broecker et al., 2008), as previously suggested by Burke and Robinson (2012). 663
664
Deep water formation in the North Pacific may thus account for a significant rise in CO2 during 665
early deglaciation. Although the exact timing and magnitude of this CO2 rise will depend on 666
other regions and processes, the previously stratified nature of the North Pacific, with old, DIC-667
rich waters at depth, makes it a sensitive region from which to drive some portion of atmospheric 668
CO2, δ13C and Δ14C change. However despite the North Pacific’s likely contribution to the 669
initial deglacial CO2 rise, other mechanisms must also operate to cause continued CO2 increase, 670
and to maintain CO2 differences between glacials and long-lived interglacials such as the 671
Holocene. Upon restratification to a state similar to the modern (by removal of the salinity 672
forcing in our modeling experiments), the atmospheric CO2 anomaly decreases as DIC re-673
accumulates in the deep Pacific, reaching pre-excursion values within a few thousand years. 674
31
Although some portion of this CO2 drawdown may be countered by carbonate compensation 675
(Broecker & Peng, 1987), it is likely that other mechanisms, such as changes in iron fertilization 676
(Martínez-Garcia et al., 2009) and destratification in the Southern Ocean (Toggweiler et al., 677
2006; Anderson et al., 2009; Burke & Robinson, 2012), must also operate to offset this CO2 fall 678
and to achieve the full observed deglacial CO2 rise. Rather than maintaining a steady state 679
difference in CO2 between glacial and interglacial periods, we suggest that stratification 680
breakdown in the North Pacific may act as a release mechanism for some portion of the carbon 681
stored in the deep ocean during glacial periods. 682
683
6. Conclusions 684
Our deglacial radiocarbon and boron isotope records provide the first evidence of local deep 685
water formation to 3600 m in the North Pacific. This process is reflected in a dramatic younging 686
in benthic-planktic 14C offsets, which reach ~350 years, and a decrease in δ11B, as low-pH waters 687
from intermediate depths are mixed into the deep ocean. Although deep water formation to this 688
depth has not previously been reconstructed in the North Pacific, it is supported by a range of 689
regional proxy records. These include a collapse in regional 14C gradients (Galbraith et al., 2007; 690
Okazaki et al., 2010; Lund et al., 2011; Sarnthein et al., 2013), reduced surface water 691
stratification in δ15N data (e.g. Brunelle et al., 2010), and a regional warming (e.g. Kiefer & 692
Kienast, 2005). 693
694
The ability of North Pacific deep water formation to explain our 14C and δ11B data is supported 695
by our experiments with an Earth system model. Across a range of forcing styles and boundary 696
32
conditions, breakdown of stratification causes a younging in 14C and a decrease in pH at the 697
depth of our core site. These experiments also demonstrate the transient nature of signals of 698
deep water formation in a previously stratified basin: deep ocean pH initially decreases, due to 699
input of low-pH waters from intermediate depths, and then increases, as these waters are 700
replaced by higher pH waters from the surface ocean. Destratification does not give signals that 701
are instantly analogous to modern deep water formation, and this should be considered when 702
interpreting deglacial proxy data. 703
704
Our posited North Pacific deep water formation event occurs during Heinrich Stadial 1, at a time 705
of reduced North Atlantic deep water formation and cold stadial conditions in the North Atlantic 706
(Sarnthein et al., 2000). This supports the concept of an Atlantic-Pacific seesaw of deep water 707
formation and associated climate change (Saenko et al., 2004). Deep water formation in the 708
North Pacific requires an increase in sea surface salinity (Emile-Geay et al., 2003), which was 709
likely driven by a reorganisation of major rain belts in response to stadial conditions (Broecker 710
and Putnam, 2012). A southward shift of the Westerly storm track (Polyak et al., 2012), reduced 711
Atlantic to Pacific freshwater transport in the tropics (Leduc et al., 2007), and a subdued East 712
Asian Monsoon (Wang et al., 1999) may all have played a role, alongside oceanic salinity 713
feedbacks (Krebs & Timmermann, 2007). This highlights the importance of atmospheric 714
freshwater flux in controlling deep water formation (Eisenman et al., 2009). 715
716
Deep water formation in the North Pacific causes significant atmospheric CO2 rise, and a drop in 717
atmospheric δ13C and Δ14C in our model, in line with atmospheric records over this period of the 718
33
early deglaciation (Monnin et al., 2001; Schmitt et al., 2012; Southon et al., 2012). However 719
upon restratification, CO2 values return towards pre-excursion values in a few thousand years. 720
Therefore although North Pacific deep water formation may act as a release mechanism for some 721
portion of a deep ocean CO2 store, other mechanisms – likely involving the Southern Ocean – 722
must also operate to cause continued atmospheric CO2 rise. 723
724
Despite the ability of North Pacific deep water formation to explain our 14C and δ11B data, our 725
hypothesis requires further testing. In particular, our key data are obtained from a single core, 726
and the boron isotope data are sparse during the key interval. Although there is regional support 727
for breakdown of stratification in shallower waters at this time (Okazaki et al., 2010; Brunelle et 728
al., 2010), this does not provide direct evidence for deep water formation. To further test our 729
hypothesis, more data from deep ocean cores, with high-enough resolution to capture a ~1200 730
year-long event, are required. We also encourage further modelling efforts, with higher spatial 731
resolution and different parameterizations of deep water formation, to investigate the impact of 732
NPDW formation on paleoceanographic tracers and atmospheric CO2. 733
734
Finally, we note that CO2 rise during each of the last four deglaciations is associated with a 735
Heinrich Stadial and a pronounced weak monsoon event similar to those seen during HS1 736
(Cheng et al., 2009), and we speculate that part of each of these deglacial CO2 rises may be 737
driven by the mechanism described here (Gebhardt et al., 2008). North Pacific ventilation may 738
thus provide an important feedback on the orbital and millennial-scale triggers of glacial 739
terminations, with the associated CO2 release helping to warm the planet and contribute to a full 740
34
deglaciation. Overall, our work demonstrates a previously unidentified but important role for 741
deep water formation in the North Pacific in deglacial CO2 rise and climate variability, and 742
highlights the fundamental influence of polar ocean stratification versus deep mixing on glacial-743
interglacial climate change. 744
745
746
747
Acknowledgments: The data presented in this paper are available online at 748
[xxxinsertwebaddressxxx]. We thank Jess Adkins, Andrea Burke, Ian Eisenman, Jake Gebbie, 749
Ingrid Hendy, Phoebe Lam, Naomi Levine, Tom Marchitto, Laura Robinson, Tapio Schneider, 750
Andrew Thompson, Derek Vance, Robb Wills, and several anonymous reviewers, for 751
constructive conversations and comments that helped shape the ideas in this manuscript. Chris 752
Charles provided sound editorial advice. This work was supported by: a NERC studentship to 753
JR; a NERC small grant (NE/I017240/1) to AR, GF, and JR; a NOAA/UCAR Climate and 754
Global Change Postdoctoral Fellowship Program, administered by the University Corporation 755
for Atmospheric Research, to JR; a NERC fellowship (NE/C00876X/2) to GF; and a DFG grant 756
(Sa207/48-1) to MS and PG. 757
758 759
35
759
REFERENCE LIST 760
761
Adkins, J. & Boyle, E. (1997) Changing atmospheric Δ14C and the record of deep water. 762 Paleoceanography 12, 337--344. 763
Adkins, J., McIntyre, K., & Schrag, D. (2002) The Salinity, Temperature, and δ18O of the Glacial 764 Deep Ocean. Science 298, 1769-1773. 765
Adkins, J. F., Ingersoll, A. P., & Pasquero, C. (2005) Rapid climate change and conditional 766 instability of the glacial deep ocean from the thermobaric effect and geothermal heating. 767 Quaternary Science Reviews 24, 581--594. 768
Allen, B. D. & Anderson, R. Y. (1993) Evidence from Western North America for Rapid Shifts 769 in Climate During the Last Glacial Maximum. Science 260, 1920--1923. 770
Andersen, K. K., Svensson, A., Johnsen, S. J., Rasmussen, S. O., Bigler, M., Röthlisberger, R., 771 Ruth, U., Siggaard-Andersen, M. L., Peder Steffensen, J., & Dahl-Jensen, D. (2006) The 772 Greenland ice core chronology 2005, 15-42 ka. Part 1: constructing the time scale. Quaternary 773 Science Reviews 25, 3246--3257. 774
Anderson, R., Fleisher, M., Lao, Y., & Winckler, G. (2008) Modern CaCO3 preservation in 775 equatorial Pacific sediments in the context of late-Pleistocene glacial cycles. Mar. Chem. 111, 776 30--46. 777 Anderson, R. F., Ali, S., Bradtmiller, L. I., Nielsen, S. H. H., Fleisher, M. Q., Anderson, B. E., & 778 Burckle, L. H. (2009) Wind-Driven Upwelling in the Southern Ocean and the Deglacial Rise in 779 Atmospheric CO2. Science 323, 1443--1448. 780
Annan, J. D. & Hargreaves, J. C. (2010) Efficient identification of ocean thermodynamics in a 781 physical/biogeochemical ocean model with an iterative Importance Sampling method. Ocean 782 Modelling 32, 205--215. 783
Antonov, J. I., D. Seidov, T. P. Boyer, R. A. Locarnini, A. V. Mishonov, H. E. Garcia, O. K. 784 Baranova, M. M. Zweng, and D. R. Johnson. "World Ocean Atlas 2009, Volume 2: Salinity. S. 785 Levitus, Ed." NOAA Atlas NESDIS 69 (2010). 786
Archer, D. & Maier-Reimer, E. (1994) Effect of deep-sea sedimentary calcite preservation on 787 atmospheric CO2 concentration. Nature 367, 260-263. 788
Asmerom, Y., Polyak, V. J., & Burns, S. J. (2010) Variable winter moisture in the southwestern 789 United States linked to rapid glacial climate shifts. Nature Geosci 3, 114--117. 790
Barker, S., Diz, P., Vautravers, M. J., Pike, J., Knorr, G., Hall, I. R., & Broecker, W. S. (2009) 791 Interhemispheric Atlantic seesaw response during the last deglaciation. Nature 457, 1097--1102. 792
Bouttes, N., Paillard, D., & Roche, D. M. (2010) Impact of brine-induced stratification on the 793 glacial carbon cycle. Clim. Past Discuss. 6, 681--710. 794
Boyd, P. W., Jickells, T., Law, C. S., Blain, S., Boyle, E. A., Buesseler, K. O., Coale, K. H., 795 Cullen, J. J., de Baar, H. J. W., Follows, M., Harvey, M., Lancelot, C., Levasseur, M., Owens, N. 796 P. J., Pollard, R., Rivkin, R. B., Sarmiento, J., Schoemann, V., Smetacek, V., Takeda, S., Tsuda, 797
36
A., Turner, S., & Watson, A. J. (2007) Mesoscale Iron Enrichment Experiments 1993-2005: 798 Synthesis and Future Directions. Science 315, 612-617. 799
Boyle, E. A. & Keigwin, L. (1987) North Atlantic thermohaline circulation during the past 800 20,000 years linked to high-latitude surface temperature. Nature 330, 35--40. 801
Broecker, W. & Barker, S. (2007) A 190 permil drop in atmosphere's Δ14C during the "Mystery 802 Interval'' (17.5 to 14.5 kyr). Earth Planet. Sci. Lett. 256, 90-99. 803
Broecker, W., Clark, E., & Barker, S. (2008) Near constancy of the Pacific Ocean surface to 804 mid-depth radiocarbon-age difference over the last 20 kyr. Earth Planet. Sci. Lett. 274, 322 - 805 326. 806
Broecker, W., Peacock, S., Rubin, S., Walker, S., Weiss, R., Fahrbach, E., Schroeder, M., 807 Mikolajewicz, U., Heinze, C., & Key, R. (1998) How much deep water is formed in the Southern 808 Ocean?. Journal of Geophysical Research 103, 833--15. 809
Broecker, W. & Putnam, A. E. (2012) How did the hydrologic cycle respond to the two-phase 810 mystery interval?. Quaternary Science Reviews 57, 17--25. 811
Broecker, W. S. (1982) Glacial to interglacial changes in ocean chemistry. Progress in 812 Oceanography 11, 151-197. 813
Broecker, W. S. & Peng, T. H. (1987) The role of CaCO3 compensation in the glacial to 814 interglacial atmospheric CO2 change. Global Biogeochem. Cycles 1, 15-29. 815
Broecker, W. S. & Peng, T.-H. (1982) Tracers in the sea. Lamont-Doherty Geological 816 Observatory, Columbia University. 817
Broecker, W. S., Peteet, D. M., & Rind, D. (1985) Does the ocean-atmosphere system have more 818 than one stable mode of operation?. Nature 315, 21--26. 819
Brunelle, B. G., Sigman, D. M., Jaccard, S. L., Keigwin, L. D., Plessen, B., Schettler, G., Cook, 820 M. S., & Haug, G. H. (2010) Glacial/interglacial changes in nutrient supply and stratification in 821 the western subarctic North Pacific since the penultimate glacial maximum. Quaternary Science 822 Reviews 29, 2579--2590. 823
Burke, A. & Robinson, L. F. (2012) The Southern Ocean's Role in Carbon Exchange During the 824 Last Deglaciation. Science 335, 557--561. 825
Cao, L., Eby, M., Ridgwell, A., Caldeira, K., Archer, D., Ishida, A., Joos, F., Matsumoto, K., 826 Mikolajewicz, U., & Mouchet, A. (2009) The role of ocean transport in the uptake of 827 anthropogenic CO2. Biogeosciences 6, 375--390. 828
Catanzaro, E., Champion, C., Garner, E., Marinenko, G., Sappenfield, K., & Shields, W. (1970) 829 Boric acid: isotopic and assay standard reference materials. NBS (US) Spec. Publ. 260, 1--70. 830
Cheng, H., Edwards, R. L., Broecker, W. S., Denton, G. H., Kong, X., Wang, Y., Zhang, R., & 831 Wang, X. (2009) Ice Age Terminations. Science 326, 248--252. 832
Chikamoto, M. O., Menviel, L., Abe-Ouchi, A., Ohgaito, R., Timmermann, A., Okazaki, Y., 833 Harada, N., Oka, A., & Mouchet, A. (2012) Variability in North Pacific intermediate and deep 834 water ventilation during Heinrich events in two coupled climate models. Deep Sea Research Part 835 II: Topical Studies in Oceanography 61, 114--126. 836
37
Curry, W. & Oppo, D. (2005) Glacial water mass geometry and the distribution of δ13C of DIC 837 in the western Atlantic Ocean. Paleoceanography 20, PA1017. 838
Denton, G., Anderson, R., Toggweiler, J., Edwards, R., Schaefer, J., & Putnam, A. (2010) The 839 last glacial termination. Science 328, 1652--1656. 840
Dickson, A.G., Sabine, C.L. and Christian, J.R. (Eds.) (2007). Guide to best practices for ocean 841 CO2 measurements. PICES Special Publication 3, 191 pp. 842
Dickson, A. G. (1990) Thermodynamics of the dissociation of boric acid in synthetic seawater 843 from 273.15 to 318.15 K. Deep Sea Research Part A. Oceanographic Research Papers 37, 755--844 766. 845
Duplessy, J., Shackleton, N., Fairbanks, R., Labeyrie, L., Oppo, D., & Kallel, N. (1988) 846 Deepwater source variations during the last climatic cycle and their impact on the global 847 deepwater circulation. Paleoceanography 3, 343--360. 848
EPICA (2004) Eight glacial cycles from an Antarctic ice core. Nature 429, 623-628. 849 Edwards, N. R. & Marsh, R. (2005) Uncertainties due to transport-parameter sensitivity in an 850 efficient 3-D ocean-climate model. Climate Dynamics 24, 415--433. 851
Eisenman, I., Bitz, C. M., & Tziperman, E. (2009) Rain driven by receding ice sheets as a cause 852 of past climate change. Paleoceanography 24, PA4209. 853
Emile-Geay, J., Cane, M. A., Naik, N., Seager, R., Clement, A. C., & van Geen, A. (2003) 854 Warren revisited: Atmospheric freshwater fluxes and Why is no deep water formed in the North 855 Pacific. J. Geophys. Res 108, 3178. 856
Emile-Geay, J. & Madec, G. (2008) Geothermal heating, diapycnal mixing and the abyssal 857 circulation. Ocean Science Discussions 5. 858
Ferreira, D., Marshall, J., & Campin, J.-M. (2010) Localization of deep water formation: Role of 859 atmospheric moisture transport and geometrical constraints on ocean circulation. Journal of 860 Climate 23, 1456--1476. 861
Fischer, H., Fundel, F., Ruth, U., Twarloh, B., Wegner, A., Udisti, R., Becagli, S., Castellano, E., 862 Morganti, A., & Severi, M. (2007) Reconstruction of millennial changes in dust emission, 863 transport and regional sea ice coverage using the deep EPICA ice cores from the Atlantic and 864 Indian Ocean sector of Antarctica. Earth and Planetary Science Letters 260, 340--354. 865
Fletcher, M.-S. & Moreno, P. I. (2011) Zonally symmetric changes in the strength and position 866 of the Southern Westerlies drove atmospheric CO2 variations over the past 14 k.y.. Geology 39, 867 419--422. 868
Foster, G. (2008) Seawater pH, pCO2 and [CO3=] variations in the Caribbean Sea over the last 869
130 kyr: A boron isotope and B/Ca study of planktic foraminifera. Earth Planet. Sci. Lett. 271, 870 254--266. 871
Foster, G. L., Hönisch, B., Paris, G., Dwyer, G. S., Rae, J. W., Elliott, T., Gaillardet, J., 872 Hemming, N. G., Louvat, P., & Vengosh, A. (2013) Interlaboratory comparison of boron isotope 873 analyses of boric acid, seawater and marine CaCO3 by MC-ICPMS and NTIMS. Chemical 874 Geology 358, 1--14. 875
38
Foster, G. L., Pogge von Strandmann, P. A. E., & Rae, J. W. B. (2010) Boron and magnesium 876 isotopic composition of seawater. Geochem. Geophys. Geosyst. 11, Q08015. 877
François, R., Altabet, M. A., Yu, E. F., Sigman, D. M., Bacon, M. P., Frank, M., Bohrmann, G., 878 Bareille, G., & Labeyrie, L. D. (1997) Contribution of Southern Ocean surface-water 879 stratification to low atmospheric CO2 concentrations during the last glacial period. Nature 389, 880 929--936. 881
Galbraith, E. D., Jaccard, S. L., Pedersen, T. F., Sigman, D. M., Haug, G. H., Cook, M., Southon, 882 J. R., & François, R. (2007) Carbon dioxide release from the North Pacific abyss during the last 883 deglaciation. Nature 449, 890--893. 884
Galbraith, E. D., Kienast, M., Jaccard, S. L., Pedersen, T. F., Brunelle, B. G., Sigman, D. M., & 885 Kiefer, T. (2008) Consistent relationship between global climate and surface nitrate utilization in 886 the western subarctic Pacific throughout the last 500 ka. Paleoceanography 23, PA2212. 887
Gebhardt, H., Sarnthein, M., Grootes, P. M., Kiefer, T., Kuehn, H., Schmieder, F., & Röhl, U. 888 (2008) Paleonutrient and productivity records from the subarctic North Pacific for Pleistocene 889 glacial terminations I to V. Paleoceanography 23, PA4212. 890
Hain, M., Sigman, D., & Haug, G. (2010) Carbon dioxide effects of Antarctic stratification, 891 North Atlantic Intermediate Water formation, and subantarctic nutrient drawdown during the last 892 ice age: Diagnosis and synthesis in a geochemical box model. Global Biogeochem. Cycles 24, 893 GB4023. 894
Haug, G. H. & Sigman, D. M. (2009) Palaeoceanography: Polar twins. Nature Geosci 2, 91--92. 895
Hendy, I. & Pedersen, T. (2005) Is pore water oxygen content decoupled from productivity on 896 the California Margin? Trace element results from Ocean Drilling Program Hole 1017E, San 897 Lucia slope, California. Paleoceanography 20, PA4026. 898
Hendy, I. L. & Kennett, J. P. (2000) Dansgaard-Oeschger cycles and the California Current 899 System: Planktonic foraminiferal response to rapid climate change in Santa Barbara Basin, 900 Ocean Drilling Program hole 893A. Paleoceanography 15, 30-42. 901
Herguera, J. C., Herbert, T., Kashgarian, M., & Charles, C. (2010) Intermediate and deep water 902 mass distribution in the Pacific during the Last Glacial Maximum inferred from oxygen and 903 carbon stable isotopes. Quaternary Science Reviews 29, 1228--1245. 904
Hu, A., Meehl, G. A., Han, W., Abe-Ouchi, A., Morrill, C., Okazaki, Y., & Chikamoto, M. O. 905 (2012) The Pacific-Atlantic seesaw and the Bering Strait. Geophysical Research Letters 39, 906 L03702. 907
Hutchinson, I., James, T. S., Reimer, P. J., Bornhold, B. D., & Clague, J. J. (2004) Marine and 908 limnic radiocarbon reservoir corrections for studies of late-and postglacial environments in 909 Georgia Basin and Puget Lowland, British Columbia, Canada and Washington, USA. 910 Quaternary Research 61, 193--203. 911
Jaccard, S. & Galbraith, E. (2013) Direct ventilation of the North Pacific did not reach the deep 912 ocean during the last deglaciation. Geophysical Research Letters 40, 1--5. 913
Jaccard, S., Galbraith, E., Sigman, D., Haug, G., François, R., Pedersen, T., Dulski, P., & 914 Thierstein, H. (2009) Subarctic Pacific evidence for a glacial deepening of the oceanic respired 915 carbon pool. Earth Planet. Sci. Lett. 277, 156--165. 916
39
Jaccard, S. L. & Galbraith, E. D. (2011) Large climate-driven changes of oceanic oxygen 917 concentrations during the last deglaciation. Nature Geoscience 5, 151--156. 918
Jaccard, S. L., Haug, G. H., Sigman, D. M., Pedersen, T. F., Thierstein, H. R., & Rohl, U. (2005) 919 Glacial/Interglacial Changes in Subarctic North Pacific Stratification. Science 308, 1003-1006. 920
Johnsen, S. J., Clausen, H. B., Dansgaard, W., Gundestrup, N. S., Hammer, C. U., Andersen, U., 921 Andersen, K. K., Hvidberg, C. S., Dahl-Jensen, D., Steffensen, J. P., Shoji, H., Sveinbjörnsdottir, 922 A. E., White, J., Jouzel, J., & Fishe, D. (1997) The δ18O record along the Greenland Ice Core 923 Project deep ice core and the problem of possible Eemian climatic instability. J. Geophys. Res. 924 102, 26397--26410. 925
Keigwin, L. D. (1998) Glacial-age hydrography of the far northwest Pacific Ocean. 926 Paleoceanography 13, 323--339. 927
Keigwin, L. D. (2004) Radiocarbon and stable isotope constraints on Last Glacial Maximum and 928 Younger Dryas ventilation in the western North Atlantic. Paleoceanography 19, PA4012. 929
Keigwin, L. D., Jones, G. A., & Froelich, P. N. (1992) A 15,000 year paleoenvironmental record 930 from Meiji Seamount, far northwestern Pacific. Earth Planet. Sci. Lett. 111, 425--440. 931
Kennett, J. P. & Ingram, B. L. (1995) A 20,000-year record of ocean circulation and climate 932 change from the Santa Barbara basin. Nature 377, 510--514. 933
Key, R. M., Kozyr, A., Sabine, C. L., Lee, K., Wanninkhof, R., Bullister, J. L., Feely, R. A., 934 Millero, F. J., Mordy, C., & Peng, T.-H. (2004) A global ocean carbon climatology: Results from 935 Global Data Analysis Project (GLODAP). Global Biogeochem. Cycles 18, GB4031. 936
Kiefer, T. & Kienast, M. (2005) Patterns of deglacial warming in the Pacific Ocean: a review 937 with emphasis on the time interval of Heinrich event 1. Quaternary Science Reviews 24, 1063-938 1081. 939
Kiefer, T., Lorenz, S., Schulz, M., Lohmann, G., Sarnthein, M., & Elderfield, H. (2002) 940 Response of precipitation over Greenland and the adjacent ocean to North Pacific warm spells 941 during Dansgaard--Oeschger stadials. Terra Nova 14, 295--300. 942
Kiefer, T., Sarnthein, M., Erlenkeuser, H., Grootes, P. M., & Roberts, A. P. (2001) North Pacific 943 Response to Millennial-Scale Changes in Ocean Circulation Over the Last 60 kyr. 944 Paleoceanography 16, 179--189. 945
Klochko, K., Kaufman, A. J., Yao, W., Byrne, R. H., & Tossell, J. A. (2006) Experimental 946 measurement of boron isotope fractionation in seawater. Earth Planet. Sci. Lett. 248, 276-285. 947
Knox, F. & McElroy, M. B. (1984) Changes in atmospheric CO2: influence of the marine biota at 948 high latitude. Journal of Geophysical Research 89, 4629--4637. 949
Kohfeld, K. E. & Chase, Z. (2011) Controls on deglacial changes in biogenic fluxes in the North 950 Pacific Ocean. Quaternary Science Reviews 30, 3350--3363. 951
Krebs, U. & Timmermann, A. (2007) Tropical air-sea interactions accelerate the recovery of the 952 Atlantic meridional overturning circulation after a major shutdown. Journal of Climate 20, 4940-953 -4956. 954
40
Lam, P. J., Robinson, L. F., Blusztajn, J., Li, C., Cook, M. S., McManus, J. F., & Keigwin, L. D. 955 (2013) Transient stratification as the cause of the North Pacific productivity spike during 956 deglaciation. Nature Geoscience 6, 622--626. 957
Langen, P. & Vinther, B. (2009) Response in atmospheric circulation and sources of Greenland 958 precipitation to glacial boundary conditions. Climate Dynamics 32, 1035--1054. 959
Leduc, G., Vidal, L., Tachikawa, K., Rostek, F., Sonzogni, C., Beaufort, L., & Bard, E. (2007) 960 Moisture transport across Central America as a positive feedback on abrupt climatic changes. 961 Nature 445, 908--911. 962
Lee, K., Kim, T.-W., Byrne, R. H., Millero, F. J., Feely, R. A., & Liu, Y.-M. (2010) The 963 universal ratio of boron to chlorinity for the North Pacific and North Atlantic oceans. Geochim. 964 Cosmochim. Acta 74, 1801--1811. 965
Lemieux-Dudon, B., Blayo, E., Petit, J.-R., Waelbroeck, C., Svensson, A., Ritz, C., Barnola, J.-966 M., Narcisi, B. M., & Parrenin, F. (2010) Consistent dating for Antarctic and Greenland ice 967 cores. Quaternary Science Reviews 29, 8--20. 968
Liu, Z., Otto-Bliesner, B. L., He, F., Brady, E. C., Tomas, R., Clark, P. U., Carlson, A. E., 969 Lynch-Stieglitz, J., Curry, W., Brook, E., Erickson, D., Jacob, R., Kutzbach, J., & Cheng, J. 970 (2009) Transient Simulation of Last Deglaciation with a New Mechanism for Bolling-Allerod 971 Warming. Science 325, 310--314. 972
Loulergue, L., Schilt, A., Spahni, R., Masson-Delmotte, V., Blunier, T., Lemieux, B., Barnola, 973 J.-M., Raynaud, D., Stocker, T. F., & Chappellaz, J. (2008) Orbital and millennial-scale features 974 of atmospheric CH4 over the past 800,000 years. Nature 453, 383--386. 975
Lourantou, A., Lavric;, J. V., Köhler, P., Barnola, J.-M., Paillard, D., Michel, E., Raynaud, D., & 976 Chappellaz, J. (2010) Constraint of the CO2 rise by new atmospheric carbon isotopic 977 measurements during the last deglaciation. Global Biogeochem. Cycles 24, GB2015. 978
Lund, D., Adkins, J., & Ferrari, R. (2011) Abyssal Atlantic circulation during the Last Glacial 979 Maximum: Constraining the ratio between transport and vertical mixing. Paleoceanography 26, 980 PA1213. 981
Lund, D. C., Mix, A. C., & Southon, J. (2011) Increased ventilation age of the deep northeast 982 Pacific Ocean during the last deglaciation. Nature Geosci 4, 771--774. 983
Lynch-Stieglitz, J., Adkins, J. F., Curry, W. B., Dokken, T., Hall, I. R., Herguera, J. C., Hirschi, 984 J. J. M., Ivanova, E. V., Kissel, C., Marchal, O., Marchitto, T. M., McCave, I. N., McManus, J. 985 F., Mulitza, S., Ninnemann, U., Peeters, F., Yu, E.-F., & Zahn, R. (2007) Atlantic Meridional 986 Overturning Circulation During the Last Glacial Maximum. Science 316, 66-69. 987
Magana, A. L., Southon, J. R., Kennett, J. P., Roark, E. B., Sarnthein, M., & Stott, L. D. (2010) 988 Resolving the cause of large differences between deglacial benthic foraminifera radiocarbon 989 measurements in Santa Barbara Basin. Paleoceanography 115, PA4102. 990
Mangini, A., Jung, M., & Laukenmann, S. (2001) What do we learn from peaks of uranium and 991 of manganese in deep sea sediments?. Marine Geology 177, 63--78. 992
Marsh, R., Yool, A., Lenton, T. M., Gulamali, M. Y., Edwards, N. R., Shepherd, J. G., Krznaric, 993 M., Newhouse, S., & Cox, S. J. (2004) Bistability of the thermohaline circulation identified 994
41
through comprehensive 2-parameter sweeps of an efficient climate model. Climate Dynamics 23, 995 761--777. 996
Marshall, J. & Schott, F. (1999) Open-ocean convection: Observations, theory, and models. 997 Reviews of Geophysics 37, 1--64. 998
Martínez-Garcia, A., Rosell-Melé, A., Geibert, W., Gersonde, R., Masqué, P., Gaspari, V., & 999 Barbante, C. (2009) Links between iron supply, marine productivity, sea surface temperature, 1000 and CO2 over the last 1.1 Ma. Paleoceanography 24, PA1207. 1001
Matsumoto, K., Oba, T., Lynch-Stieglitz, J., & Yamamoto, H. (2002) Interior hydrography and 1002 circulation of the glacial Pacific Ocean. Quaternary Science Reviews 21, 1693 - 1704. 1003
McCave, I. N., Carter, L., & Hall, I. R. (2008) Glacial-interglacial changes in water mass 1004 structure and flow in the SW Pacific Ocean. Quaternary Science Reviews 27, 1886 - 1908. 1005
McClymont, E. L., Ganeshram, R. S., Pichevin, L. E., Talbot, H. M., Dongen, B. E., Thunell, R. 1006 C., Haywood, A. M., Singarayer, J. S., & Valdes, P. J. (2012) Sea-surface temperature records of 1007 Termination 1 in the Gulf of California: Challenges for seasonal and interannual analogues of 1008 tropical Pacific climate change. Paleoceanography 27, PA2202. 1009
McGee, D., Quade, J., Edwards, R. L., Broecker, W. S., Cheng, H., Reiners, P. W., & Evenson, 1010 N. (2012) Lacustrine cave carbonates: Novel archives of paleohydrologic change in the 1011 Bonneville Basin (Utah, USA). Earth Planet. Sci. Lett. 351, 182--194. 1012
McManus, J., Berelson, W. M., Klinkhammer, G. P., Hammond, D. E., & Holm, C. (2005) 1013 Authigenic uranium: Relationship to oxygen penetration depth and organic carbon rain. 1014 Geochim. Cosmochim. Acta 69, 95-108. 1015
McManus, J. F., François, R., Gherardi, J.-M., Keigwin, L. D., & Brown-Leger, S. (2004) 1016 Collapse and rapid resumption of Atlantic meridional circulation linked to deglacial climate 1017 changes. Nature 428, 834-837. 1018
Monnin, E., Indermühle, A., Dällenbach, A., Flückiger, J., Stauffer, B., Stocker, T. F., Raynaud, 1019 D., & Barnola, J.-M. (2001) Atmospheric CO2 concentrations over the last glacial termination. 1020 Science 291, 112-114. 1021
NGRIPmembers (2004) High-resolution record of Northern Hemisphere climate extending into 1022 the last interglacial period. Nature 431, 147--151. 1023
Nakamura, T., Awaji, T., Hatayama, T., Akitomo, K., Takizawa, T., Kono, T., Kawasaki, Y., & 1024 Fukasawa, M. (2000) The Generation of Large-Amplitude Unsteady Lee Waves by Subinertial 1025 K1 Tidal Flow: A Possible Vertical Mixing Mechanism in the Kuril Straits. Journal of Physical 1026 Oceanography 30, 1601--1621. 1027
Nilsson, J., Langen, P. L., Ferreira, D., & Marshall, J. (2013) Ocean Basin Geometry and the 1028 Salinification of the Atlantic Ocean.. Journal of Climate 26, 6163--6184. 1029
Obata, A., Ishizaka, J., & Endoh, M. (1996) Global verification of critical depth theory for 1030 phytoplankton bloom with climatological in situ temperature and satellite ocean color data. 1031 Journal of Geophysical Research 101, 20657--20. 1032
42
Okazaki, Y., Timmermann, A., Menviel, L., Harada, N., Abe-Ouchi, A., Chikamoto, M. O., 1033 Mouchet, A., & Asahi, H. (2010) Deepwater Formation in the North Pacific During the Last 1034 Glacial Termination. Science 329, 200--204. 1035
Pahnke, K., Sachs, J. P., Keigwin, L., Timmermann, A., & Xie, S. P. (2007) Eastern tropical 1036 Pacific hydrologic changes during the past 27,000 years from D/H ratios in alkenones. 1037 Paleoceanography 22, PA4214. 1038
Pak, D. K., Lea, D. W., & Kennett, J. P. (2012) Millennial scale changes in sea surface 1039 temperature and ocean circulation in the northeast Pacific, 10--60 kyr BP. Paleoceanography 27, 1040 PA1212. 1041
Pedro, J. B., Ommen, T. v., Rasmussen, S., Morgan, V. I., Chappellaz, J., Moy, A. D., Masson-1042 Delmotte, V., & Delmotte, M. (2011) The last deglaciation: timing the bipolar seesaw. Climate 1043 of the Past Discussions 7, 397--430. 1044
Polyak, V. J., Asmerom, Y., Burns, S. J., & Lachniet, M. S. (2012) Climatic backdrop to the 1045 terminal Pleistocene extinction of North American mammals. Geology 40, 1023--1026. 1046
Rae, J. W. B., Foster, G. L., Schmidt, D. N., & Elliott, T. (2011) Boron isotopes and B/Ca in 1047 benthic foraminifera: Proxies for the deep ocean carbonate system. Earth Planet. Sci. Lett. 302, 1048 403--413. 1049
Rahmstorf, S., Crucifix, M., Ganopolski, A., Goosse, H., Kamenkovich, I., Knutti, R., Lohmann, 1050 G., Marsh, R., Mysak, L. A., Wang, Z., & Weaver, A. J. (2005) Thermohaline circulation 1051 hysteresis: A model intercomparison. Geophys. Res. Lett. 32, L23605. 1052
Ramsey, C. B., Staff, R. A., Bryant, C. L., Brock, F., Kitagawa, H., van der Plicht, J., Schlolaut, 1053 G., Marshall, M. H., Brauer, A., & Lamb, H. F. (2012) A complete terrestrial radiocarbon record 1054 for 11.2 to 52.8 kyr BP. Science 338, 370--374. 1055
Rasmussen, S. O., Andersen, K. K., Svensson, A., Steffensen, J. P., Vinther, B. M., Clausen, H. 1056 B., Siggaard-Andersen, M., Johnsen, S. J., Larsen, L. B., & Dahl-Jensen, D. (2006) A new 1057 Greenland ice core chronology for the last glacial termination. J. Geophys. Res 111, D06102. 1058
Rasmussen, S. O., Seierstad, I. K., Andersen, K. K., Bigler, M., Dahl-Jensen, D., & Johnsen, S. 1059 J. (2008) Synchronization of the NGRIP, GRIP, and GISP2 ice cores across MIS 2 and 1060 palaeoclimatic implications. Quaternary Science Reviews 27, 18--28. 1061
Reid, J. L. (1997) On the total geostrophic circulation of the Pacific Ocean: Flow patterns, 1062 tracers, and transports. Progress in Oceanography 39, 263--352. 1063
Reid, J. L. (1969) Preliminary results of measurements of deep currents in the Pacific Ocean. 1064 Nature 221, 848. 1065
Reimer, P. J., Baillie, M. G. L., Bard, E., Bayliss, A., Beck, J. W., Blackwell, P. G., Ramsey, C. 1066 B., Buck, C. E., Burr, G. S., Edwards, R. L., Friedrich, M., Grootes, P.M.., Guilderson, T.P., 1067 Hajdas, I. Heaton, T.J., Hogg, A.G., Hughen, K.A., Kaiser, K.F., Kromer, B., McCormac, F.G., 1068 Manning, S.W., Reimer, R.W., Richards, D.A., Southon, J.R., Talamo, S., Turney, C.S.M., van 1069 der Plicht, J., Wyhenmeyer, C.E. (2009) IntCal09 and Marine09 radiocarbon age calibration 1070 curves, 0-50,000 years cal BP. Radiocarbon 51, 1111-1150. 1071
43
Ridgwell, A., Hargreaves, J., Edwards, N., Annan, J., Lenton, T., Marsh, R., Yool, A., & 1072 Watson, A. (2007) Marine geochemical data assimilation in an efficient Earth System Model of 1073 global biogeochemical cycling. Biogeosciences 4, 87--104. 1074
Robinson, L. F., Adkins, J. F., Keigwin, L. D., Southon, J., Fernandez, D. P., Wang, S.-L., & 1075 Scheirer, D. S. (2005) Radiocarbon Variability in the Western North Atlantic During the Last 1076 Deglaciation. Science 310, 1469-1473. 1077
Saenko, O. A., Schmittner, A., & Weaver, A. J. (2004) The Atlantic--Pacific Seesaw. Journal of 1078 Climate 17, 2033--2038. 1079
Sarmiento, J. & Toggweiler, J. (1984) A new model for the role of the oceans in determining 1080 atmospheric pCO2. Nature 308, 621--624. 1081
Sarmiento, J. L., Gruber, N., Brezinski, M. A., & Dunne, J. P. (2004) High-latitude controls of 1082 thermocline nutrients and low latitude biological productivity. Nature 427, 56-60. 1083
Sarnthein, M. (2011) Northern meltwater pulses, CO2, and changes in Atlantic convection. 1084 Science 331, 156--158. 1085
Sarnthein, M., Grootes, P., Kennett, J., & Nadeau, M. (2007) 14C Reservoir Ages Show 1086 Deglacial Changes in Ocean Currents and Carbon Cycle. Geophysical monograph - AGU 173, 1087 175. 1088
Sarnthein, M., Schneider, B., & Grootes, P. M. (2013) Peak glacial 14C ventilation ages suggest 1089 major draw-down of carbon into the abyssal ocean. Climate of the Past, 9, 2595--2614. 1090
Sarnthein, M., Stattegger, K., Dreger, D., Erlenkeuser, H., Grootes, P., Haupt, B., Jung, S., 1091 Kiefer, T., Kuhnt, W., Pflaumann, U., Schäfer-Neth, C., Schulz, H., Schulz, M., Seidov, D., 1092 Simstich, J., Van Kreveld, S., Vogelsang, E., Völker, A., & Weinelt, M. S. (2000) Fundamentel 1093 modes and abrupt changes in North Atlantic circulation and climate over the last 60 ky - 1094 concepts, reconstruction and numerical modeling. The Northern North Atlantic. Springer Berlin 1095 Heidelberg, 2001. 365-410. 1096
Schilt, A., Baumgartner, M., Schwander, J., Buiron, D., Capron, E., Chappellaz, J., Loulergue, 1097 L., Schüpbach, S., Spahni, R., Fischer, H., & Stocker, T. F. (2010) Atmospheric nitrous oxide 1098 during the last 140,000 years. Earth Planet. Sci. Lett. 300, 33--43. 1099
Schlitzer, R. (2004) Ocean data view. Alfred Wegener Institute for Polar and Marine Research: 1100 Bermerhaven, Germany. 1101
Schmitt, J., Schneider, R., Elsig, J., Leuenberger, D., Lourantou, A., Chappellaz, J., Köhler, P., 1102 Joos, F., Stocker, T. F., Leuenberger, M., & Fischer, H. (2012) Carbon Isotope Constraints on 1103 the Deglacial CO2 Rise from Ice Cores. Science 336, 711--714. 1104
Seki, O., Ishiwatari, R., & Matsumoto, K. (2002) Millennial climate oscillations in NE Pacific 1105 surface waters over the last 82 kyr: New evidence from alkenones. Geophysical Research Letters 1106 29, 2144. 1107
Shakun, J. D., Clark, P. U., He, F., Marcott, S. A., Mix, A. C., Liu, Z., Otto-Bliesner, B., 1108 Schmittner, A., & Bard, E. (2012) Global warming preceded by increasing carbon dioxide 1109 concentrations during the last deglaciation. Nature 484, 49--54. 1110
44
Shcherbina, A. Y., Talley, L. D., & Rudnick, D. L. (2003) Direct observations of North Pacific 1111 ventilation: Brine rejection in the Okhotsk Sea. Science 302, 1952--1955. 1112
Shen, C.-C., Kano, A., Hori, M., Lin, K., Chiu, T.-C., & Burr, G. S. (2010) East Asian monsoon 1113 evolution and reconciliation of climate records from Japan and Greenland during the last 1114 deglaciation. Quaternary Science Reviews 29, 3327--3335. 1115
Siegenthaler, U. & Wenk, T. (1984) Rapid atmospheric CO2 variations and ocean circulation. 1116 Nature 308, 624--626. 1117
Sigman, D. M., Hain, M. P., & Haug, G. H. (2010) The polar ocean and glacial cycles in 1118 atmospheric CO2 concentration. Nature 466, 47--55. 1119
Skinner, L., Fallon, S., Waelbroeck, C., Michel, E., & Barker, S. (2010) Ventilation of the Deep 1120 Southern Ocean and Deglacial CO2 Rise. Science 328, 1147-1151. 1121
Southon, J. & Fedje, D. (2003) A post-glacial record of 14C reservoir ages for the British 1122 Columbia coast. Canadian journal of archaeology 27, 95--111. 1123
Southon, J., Noronha, A. L., Cheng, H., Edwards, R. L., & Wang, Y. (2012) A high-resolution 1124 record of atmospheric 14C based on Hulu Cave speleothem H82. Quaternary Science Reviews 33, 1125 32--41. 1126
Stocker, T. F., Wright, D. G., & Broecker, W. S. (1992) The influence of high-latitude surface 1127 forcing on the global thermohaline circulation. Paleoceanography 7, 529-541. 1128
Stommel, H. (1961) Thermohaline convection with two stable regimes of flow. Tellus 13. 1129
Stuiver, M. & Grootes, P. M. (2000) GISP2 oxygen isotope ratios. Quaternary Research 53, 1130 277--284. 1131
Svensson, A., Andersen, K. K., Bigler, M., Clausen, H. B., Dahl-Jensen, D., Davies, S. M., 1132 Johnsen, S. J., Muscheler, R., Rasmussen, S. O., & Röthlisberger, R. (2006) The Greenland ice 1133 core chronology 2005, 15-42 ka. Part 2: Comparison to other records. Quaternary Science 1134 Reviews 25, 3258--3267. 1135
Sverdrup, H. (1953) On conditions for the vernal blooming of phytoplankton. Journal du Conseil 1136 18, 287--295. 1137
Talley, L. D. (1993) Distribution and formation of North Pacific intermediate water. Journal of 1138 Physical Oceanography 23, 517--517. 1139
Talley, L. D. (1991) An Okhotsk Sea water anomaly: implications for ventilation in the North 1140 Pacific. Deep-Sea Res 38, 5171--5190. 1141
Talley, L. D. (1997) North Pacific Intermediate Water transports in the mixed water region. 1142 Journal of physical oceanography 27, 1795--1803. 1143
Timmermann, A., Krebs, U., Justino, F., Goosse, H., & Ivanochko, T. (2005) Mechanisms for 1144 millennial‐scale global synchronization during the last glacial period. Paleoceanography 20, 1145 PA4008. 1146
Toggweiler, J. R., Russell, J. L., & Carson, S. R. (2006) Midlatitude westerlies, atmospheric 1147 CO2, and climate change during the ice ages. Paleoceanography 21, PA2005. 1148
Tomczak, M. & Godfrey, J. S. (1994) Regional Oceanography: an Introduction. Daya Books. 1149
45
Trauth, M. H., Sarnthein, M., & Arnold, M. (1997) Bioturbational mixing depth and carbon flux 1150 at the seafloor. Paleoceanography 12, 517--526. 1151
Tsunogai, S. (2002) The Western North Pacific Playing a Key Role in Global Biogeochemical 1152 Fluxes. Journal of Oceanography 58, 245--257. 1153
van Heuven, S., Pierrot, D., Rae, J. W. B., Lewis, E., & Wallace, D. W. R. (2009) MATLAB 1154 Program Developed for CO2 System Calculations. ORNL/CDIAC-105b. 1155
Van Scoy, K. A., Olson, D. B., & Fine, R. A. (1991) Ventilation of North Pacific Intermediate 1156 Waters: The Role of the Alaskan Gyre. J. Geophys. Res. 96, 16801--16810. 1157
Wang, L., Sarnthein, M., Erlenkeuser, H., Grimalt, J., Grootes, P., Heilig, S., Ivanova, E., 1158 Kienast, M., Pelejero, C., & Pflaumann, U. (1999) East Asian monsoon climate during the Late 1159 Pleistocene: high-resolution sediment records from the South China Sea. Marine Geology 156, 1160 243--282. 1161
Wang, L., Sarnthein, M., Erlenkeuser, H., Grootes, P. M., Grimalt, J. O., Pelejero, C., & Linck, 1162 G. (1999) Holocene variations in Asian monsoon moisture: a bidecadal sediment record from the 1163 South China Sea. Geophysical Research Letters 26, 2889-2892. 1164
Wang, P., Clemens, S., Beaufort, L., Braconnot, P., Ganssen, G., Jian, Z., Kershaw, P., & 1165 Sarnthein, M. (2005) Evolution and variability of the Asian monsoon system: state of the art and 1166 outstanding issues. Quaternary Science Reviews 24, 595-629. 1167
Wang, Y. J., Cheng, H., Edwards, R. L., An, Z. S., Wu, J. Y., Shen, C.-C., & Dorale, J. A. (2001) 1168 A High-Resolution Absolute-Dated Late Pleistocene Monsoon Record from Hulu Cave, China. 1169 Science 294, 2345--2348. 1170
Warren, B. A. (1983) Why is no deep water formed in the North Pacific?. Journal of Marine 1171 Research 41, 327--347. 1172
Warren, B. A. & Owens, W. B. (1988) Deep currents in the central subarctic Pacific Ocean. 1173 Journal of Physical Oceanography 18, 529--551. 1174
Wu, J. Y., Wang, Y. J., Cheng, H., & Edwards, L. (2009) An exceptionally strengthened East 1175 Asian summer monsoon event between 19.9 and 17.1 ka BP recorded in a Hulu stalagmite. 1176 Science in China Series D: Earth Sciences 52, 360--368. 1177
Yasuda, I., Kouketsu, S., Katsumata, K., Ohiwa, M., Kawasaki, Y., & Kusaka, A. (2002) 1178 Influence of Okhotsk Sea Intermediate Water on the Oyashio and North Pacific Intermediate 1179 Water. J. Geophys. Res. Oceans (1978–2012) 107.C12 (2002): 30-1. 1180
Zheng, Y., Anderson, R. F., van Geen, A., & Fleisher, M. Q. (2002) Remobilization of 1181 authigenic uranium in marine sediments by bioturbation. Geochimica et Cosmochimica Acta 66, 1182 1759--1772. 1183 1184
1185 1186
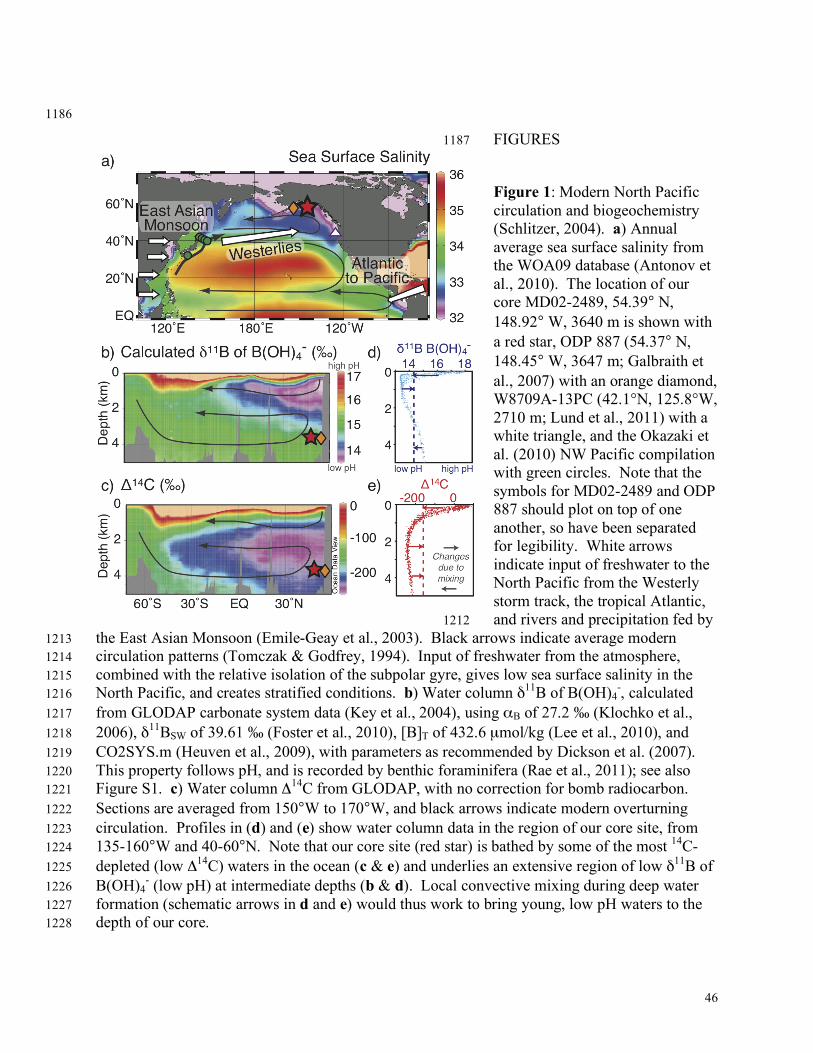
46
1186
FIGURES 1187
1188
Figure 1: Modern North Pacific 1189 circulation and biogeochemistry 1190 (Schlitzer, 2004). a) Annual 1191 average sea surface salinity from 1192 the WOA09 database (Antonov et 1193 al., 2010). The location of our 1194 core MD02-2489, 54.39° N, 1195 148.92° W, 3640 m is shown with 1196 a red star, ODP 887 (54.37° N, 1197 148.45° W, 3647 m; Galbraith et 1198 al., 2007) with an orange diamond, 1199 W8709A-13PC (42.1°N, 125.8°W, 1200 2710 m; Lund et al., 2011) with a 1201 white triangle, and the Okazaki et 1202 al. (2010) NW Pacific compilation 1203 with green circles. Note that the 1204 symbols for MD02-2489 and ODP 1205 887 should plot on top of one 1206 another, so have been separated 1207 for legibility. White arrows 1208 indicate input of freshwater to the 1209 North Pacific from the Westerly 1210 storm track, the tropical Atlantic, 1211 and rivers and precipitation fed by 1212
the East Asian Monsoon (Emile-Geay et al., 2003). Black arrows indicate average modern 1213 circulation patterns (Tomczak & Godfrey, 1994). Input of freshwater from the atmosphere, 1214 combined with the relative isolation of the subpolar gyre, gives low sea surface salinity in the 1215 North Pacific, and creates stratified conditions. b) Water column δ11B of B(OH)4
-, calculated 1216 from GLODAP carbonate system data (Key et al., 2004), using αB of 27.2 ‰ (Klochko et al., 1217 2006), δ11BSW of 39.61 ‰ (Foster et al., 2010), [B]T of 432.6 µmol/kg (Lee et al., 2010), and 1218 CO2SYS.m (Heuven et al., 2009), with parameters as recommended by Dickson et al. (2007). 1219 This property follows pH, and is recorded by benthic foraminifera (Rae et al., 2011); see also 1220 Figure S1. c) Water column Δ14C from GLODAP, with no correction for bomb radiocarbon. 1221 Sections are averaged from 150°W to 170°W, and black arrows indicate modern overturning 1222 circulation. Profiles in (d) and (e) show water column data in the region of our core site, from 1223 135-160°W and 40-60°N. Note that our core site (red star) is bathed by some of the most 14C-1224 depleted (low Δ14C) waters in the ocean (c & e) and underlies an extensive region of low δ11B of 1225 B(OH)4
- (low pH) at intermediate depths (b & d). Local convective mixing during deep water 1226 formation (schematic arrows in d and e) would thus work to bring young, low pH waters to the 1227 depth of our core. 1228
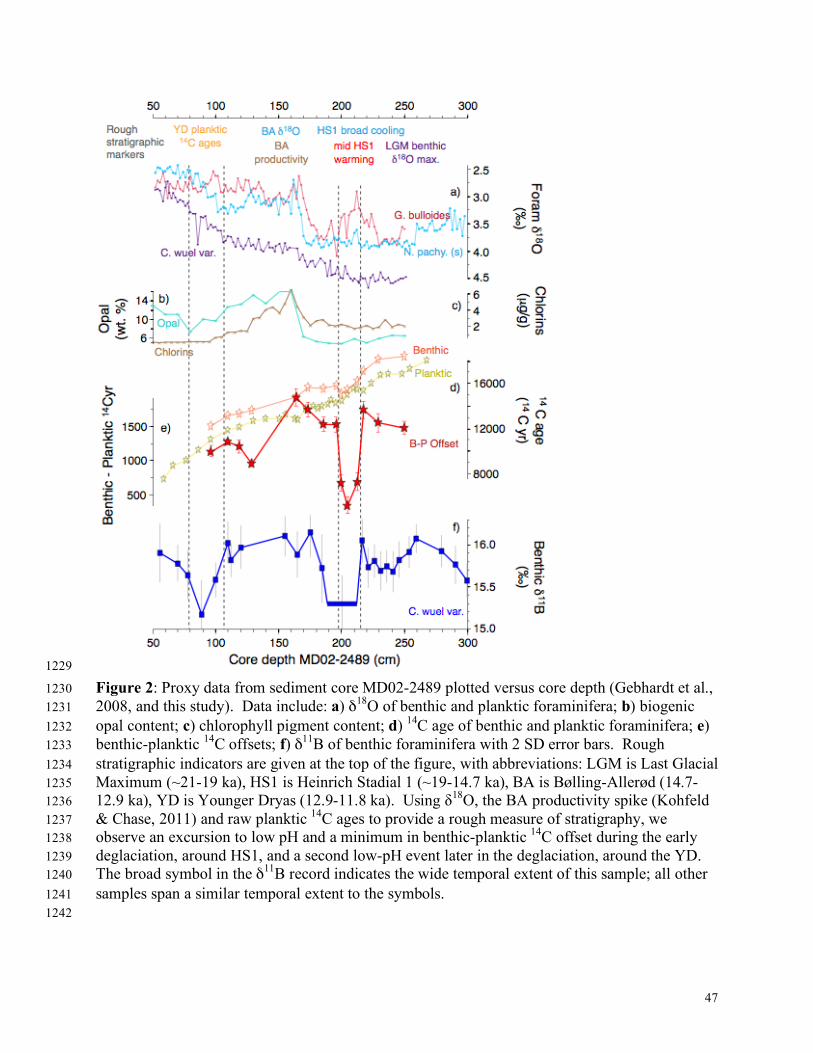
47
1229
Figure 2: Proxy data from sediment core MD02-2489 plotted versus core depth (Gebhardt et al., 1230 2008, and this study). Data include: a) δ18O of benthic and planktic foraminifera; b) biogenic 1231 opal content; c) chlorophyll pigment content; d) 14C age of benthic and planktic foraminifera; e) 1232 benthic-planktic 14C offsets; f) δ11B of benthic foraminifera with 2 SD error bars. Rough 1233 stratigraphic indicators are given at the top of the figure, with abbreviations: LGM is Last Glacial 1234 Maximum (~21-19 ka), HS1 is Heinrich Stadial 1 (~19-14.7 ka), BA is Bølling-Allerød (14.7-1235 12.9 ka), YD is Younger Dryas (12.9-11.8 ka). Using δ18O, the BA productivity spike (Kohfeld 1236 & Chase, 2011) and raw planktic 14C ages to provide a rough measure of stratigraphy, we 1237 observe an excursion to low pH and a minimum in benthic-planktic 14C offset during the early 1238 deglaciation, around HS1, and a second low-pH event later in the deglaciation, around the YD. 1239 The broad symbol in the δ11B record indicates the wide temporal extent of this sample; all other 1240 samples span a similar temporal extent to the symbols. 1241
1242
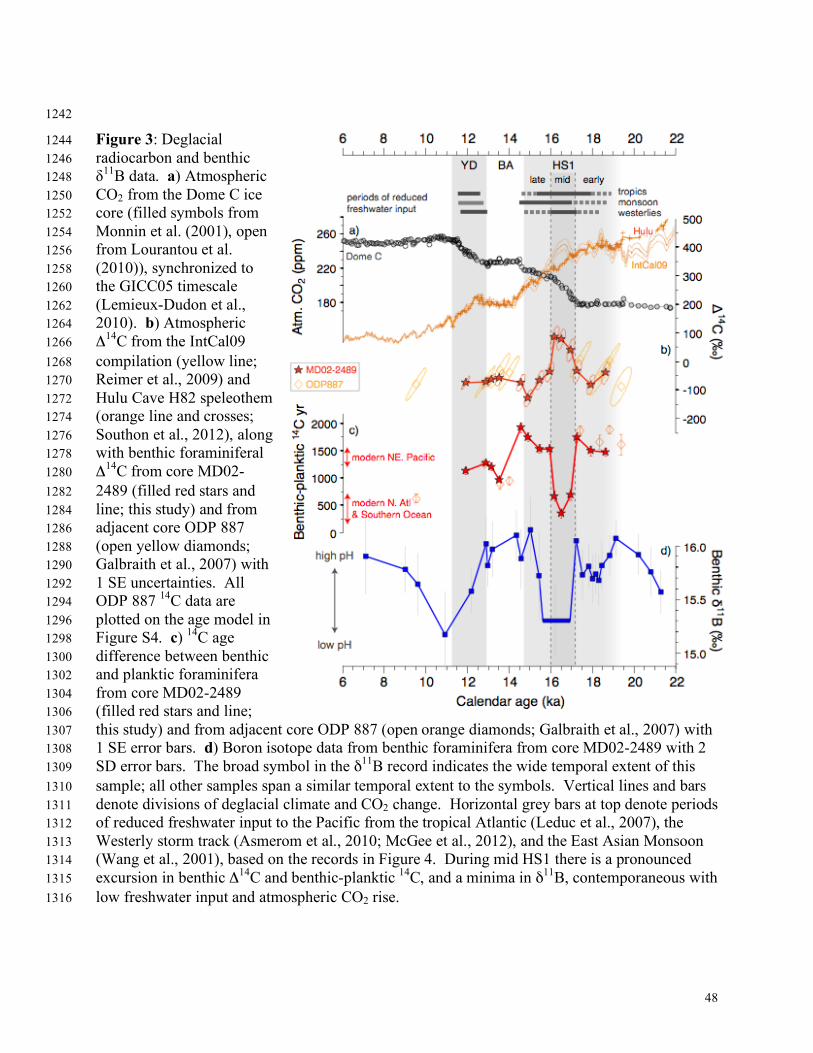
48
1242
Figure 3: Deglacial 1244 radiocarbon and benthic 1246 δ11B data. a) Atmospheric 1248 CO2 from the Dome C ice 1250 core (filled symbols from 1252 Monnin et al. (2001), open 1254 from Lourantou et al. 1256 (2010)), synchronized to 1258 the GICC05 timescale 1260 (Lemieux-Dudon et al., 1262 2010). b) Atmospheric 1264 Δ14C from the IntCal09 1266 compilation (yellow line; 1268 Reimer et al., 2009) and 1270 Hulu Cave H82 speleothem 1272 (orange line and crosses; 1274 Southon et al., 2012), along 1276 with benthic foraminiferal 1278 Δ14C from core MD02-1280 2489 (filled red stars and 1282 line; this study) and from 1284 adjacent core ODP 887 1286 (open yellow diamonds; 1288 Galbraith et al., 2007) with 1290 1 SE uncertainties. All 1292 ODP 887 14C data are 1294 plotted on the age model in 1296 Figure S4. c) 14C age 1298 difference between benthic 1300 and planktic foraminifera 1302 from core MD02-2489 1304 (filled red stars and line; 1306 this study) and from adjacent core ODP 887 (open orange diamonds; Galbraith et al., 2007) with 1307 1 SE error bars. d) Boron isotope data from benthic foraminifera from core MD02-2489 with 2 1308 SD error bars. The broad symbol in the δ11B record indicates the wide temporal extent of this 1309 sample; all other samples span a similar temporal extent to the symbols. Vertical lines and bars 1310 denote divisions of deglacial climate and CO2 change. Horizontal grey bars at top denote periods 1311 of reduced freshwater input to the Pacific from the tropical Atlantic (Leduc et al., 2007), the 1312 Westerly storm track (Asmerom et al., 2010; McGee et al., 2012), and the East Asian Monsoon 1313 (Wang et al., 2001), based on the records in Figure 4. During mid HS1 there is a pronounced 1314 excursion in benthic Δ14C and benthic-planktic 14C, and a minima in δ11B, contemporaneous with 1315 low freshwater input and atmospheric CO2 rise. 1316
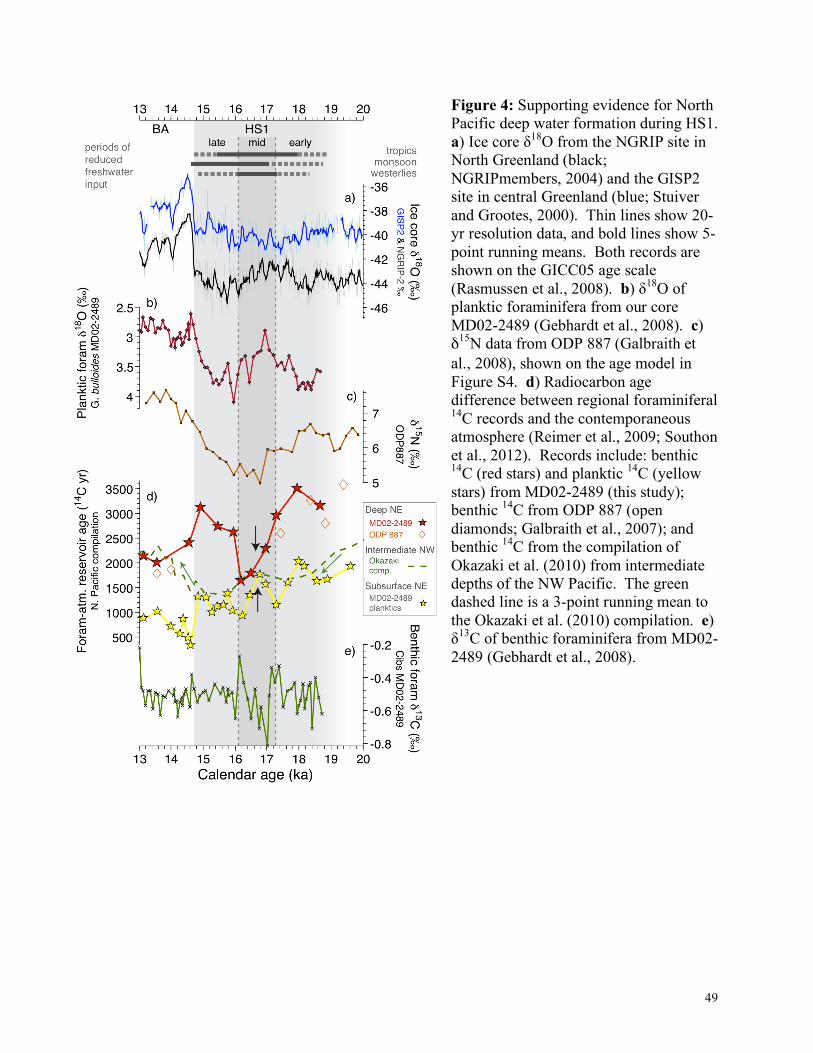
49
Figure 4: Supporting evidence for North 1317 Pacific deep water formation during HS1. 1318 a) Ice core δ18O from the NGRIP site in 1319 North Greenland (black; 1320 NGRIPmembers, 2004) and the GISP2 1321 site in central Greenland (blue; Stuiver 1322 and Grootes, 2000). Thin lines show 20-1323 yr resolution data, and bold lines show 5-1324 point running means. Both records are 1325 shown on the GICC05 age scale 1326 (Rasmussen et al., 2008). b) δ18O of 1327 planktic foraminifera from our core 1328 MD02-2489 (Gebhardt et al., 2008). c) 1329 δ15N data from ODP 887 (Galbraith et 1330 al., 2008), shown on the age model in 1331 Figure S4. d) Radiocarbon age 1332 difference between regional foraminiferal 1333 14C records and the contemporaneous 1334 atmosphere (Reimer et al., 2009; Southon 1335 et al., 2012). Records include: benthic 1336 14C (red stars) and planktic 14C (yellow 1337 stars) from MD02-2489 (this study); 1338 benthic 14C from ODP 887 (open 1339 diamonds; Galbraith et al., 2007); and 1340 benthic 14C from the compilation of 1341 Okazaki et al. (2010) from intermediate 1342 depths of the NW Pacific. The green 1343 dashed line is a 3-point running mean to 1344 the Okazaki et al. (2010) compilation. e) 1345 δ13C of benthic foraminifera from MD02-1346 2489 (Gebhardt et al., 2008). 1347
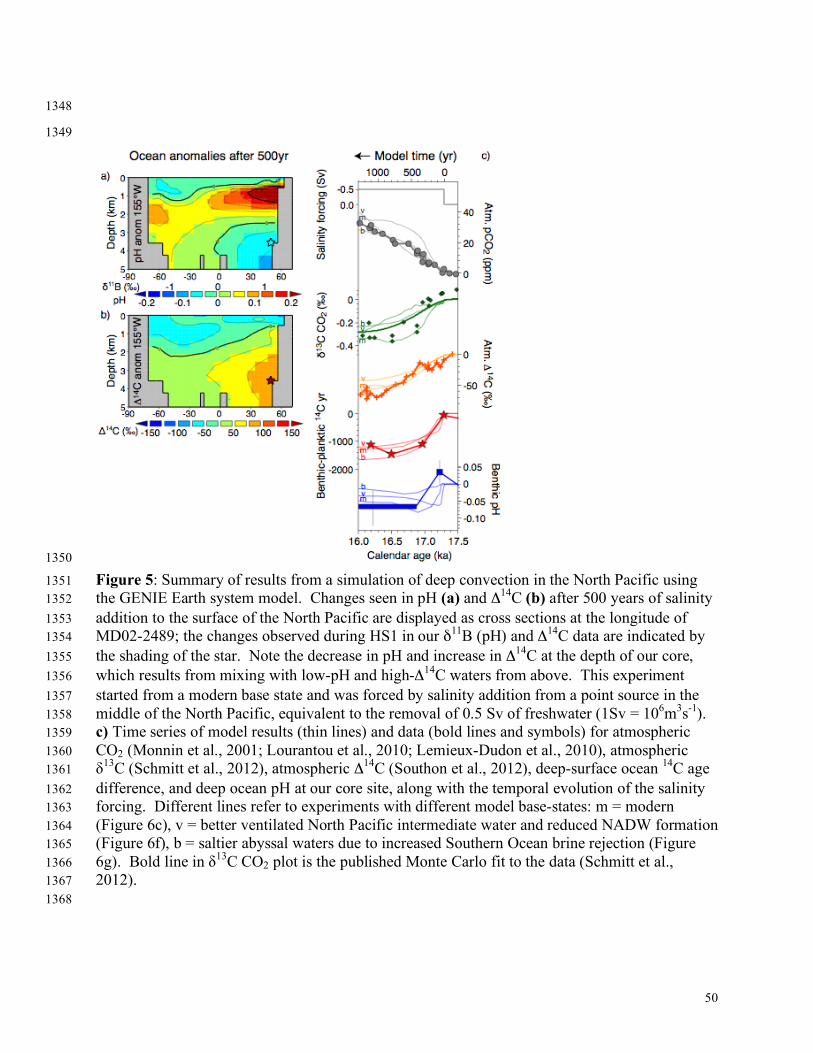
50
1348
1349
1350
Figure 5: Summary of results from a simulation of deep convection in the North Pacific using 1351 the GENIE Earth system model. Changes seen in pH (a) and Δ14C (b) after 500 years of salinity 1352 addition to the surface of the North Pacific are displayed as cross sections at the longitude of 1353 MD02-2489; the changes observed during HS1 in our δ11B (pH) and Δ14C data are indicated by 1354 the shading of the star. Note the decrease in pH and increase in Δ14C at the depth of our core, 1355 which results from mixing with low-pH and high-Δ14C waters from above. This experiment 1356 started from a modern base state and was forced by salinity addition from a point source in the 1357 middle of the North Pacific, equivalent to the removal of 0.5 Sv of freshwater (1Sv = 106m3s-1). 1358 c) Time series of model results (thin lines) and data (bold lines and symbols) for atmospheric 1359 CO2 (Monnin et al., 2001; Lourantou et al., 2010; Lemieux-Dudon et al., 2010), atmospheric 1360 δ13C (Schmitt et al., 2012), atmospheric Δ14C (Southon et al., 2012), deep-surface ocean 14C age 1361 difference, and deep ocean pH at our core site, along with the temporal evolution of the salinity 1362 forcing. Different lines refer to experiments with different model base-states: m = modern 1363 (Figure 6c), v = better ventilated North Pacific intermediate water and reduced NADW formation 1364 (Figure 6f), b = saltier abyssal waters due to increased Southern Ocean brine rejection (Figure 1365 6g). Bold line in δ13C CO2 plot is the published Monte Carlo fit to the data (Schmitt et al., 1366 2012). 1367
1368
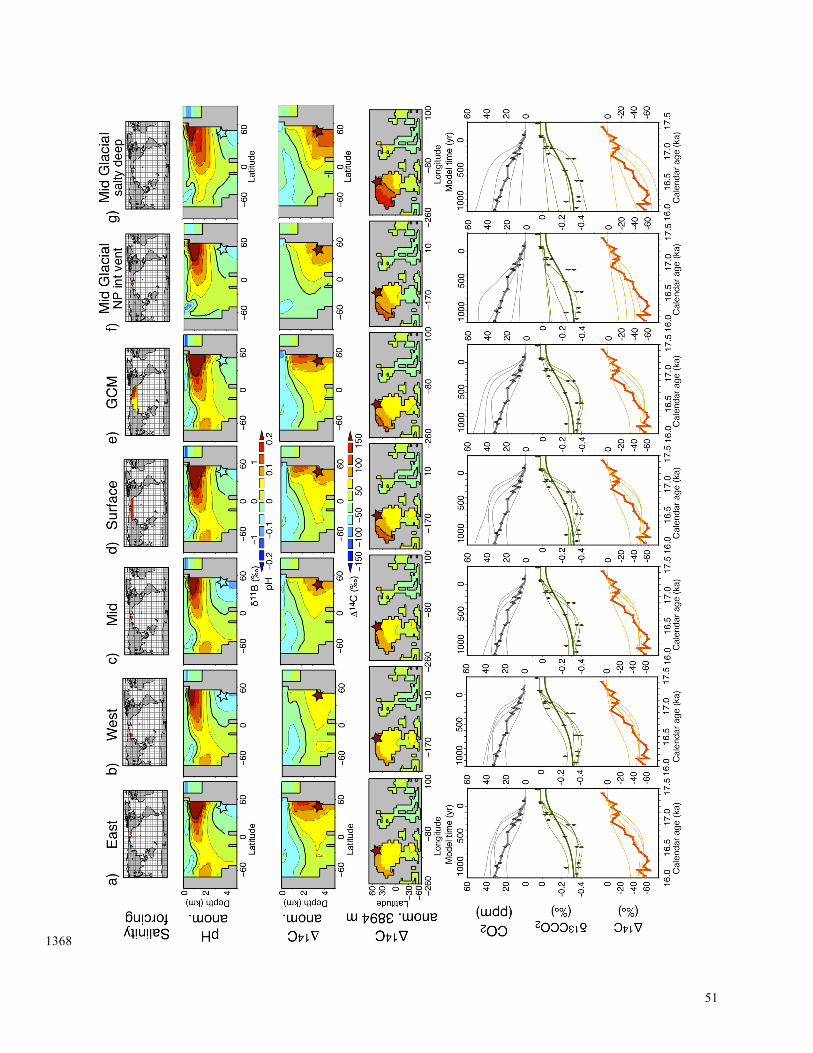
51
1368
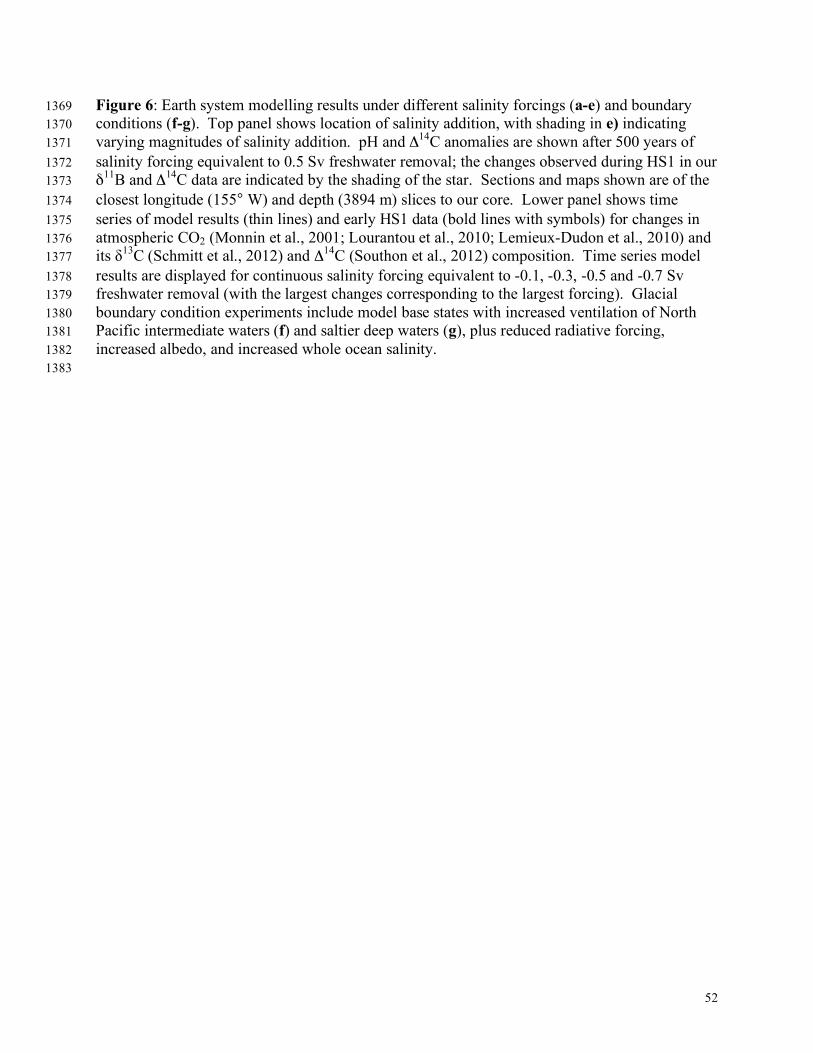
52
Figure 6: Earth system modelling results under different salinity forcings (a-e) and boundary 1369 conditions (f-g). Top panel shows location of salinity addition, with shading in e) indicating 1370 varying magnitudes of salinity addition. pH and Δ14C anomalies are shown after 500 years of 1371 salinity forcing equivalent to 0.5 Sv freshwater removal; the changes observed during HS1 in our 1372 δ11B and Δ14C data are indicated by the shading of the star. Sections and maps shown are of the 1373 closest longitude (155° W) and depth (3894 m) slices to our core. Lower panel shows time 1374 series of model results (thin lines) and early HS1 data (bold lines with symbols) for changes in 1375 atmospheric CO2 (Monnin et al., 2001; Lourantou et al., 2010; Lemieux-Dudon et al., 2010) and 1376 its δ13C (Schmitt et al., 2012) and Δ14C (Southon et al., 2012) composition. Time series model 1377 results are displayed for continuous salinity forcing equivalent to -0.1, -0.3, -0.5 and -0.7 Sv 1378 freshwater removal (with the largest changes corresponding to the largest forcing). Glacial 1379 boundary condition experiments include model base states with increased ventilation of North 1380 Pacific intermediate waters (f) and saltier deep waters (g), plus reduced radiative forcing, 1381 increased albedo, and increased whole ocean salinity. 1382
1383
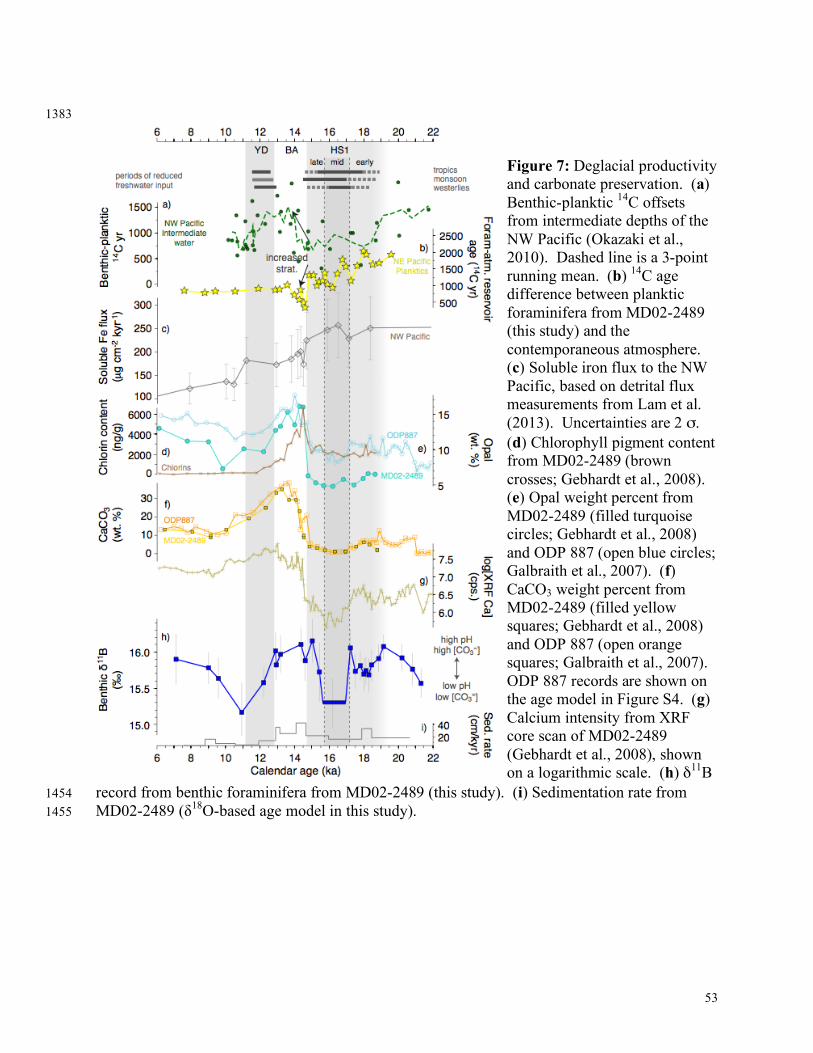
53
1383
1385
Figure 7: Deglacial productivity 1387 and carbonate preservation. (a) 1389 Benthic-planktic 14C offsets 1391 from intermediate depths of the 1393 NW Pacific (Okazaki et al., 1395 2010). Dashed line is a 3-point 1397 running mean. (b) 14C age 1399 difference between planktic 1401 foraminifera from MD02-2489 1403 (this study) and the 1405 contemporaneous atmosphere. 1407 (c) Soluble iron flux to the NW 1409 Pacific, based on detrital flux 1411 measurements from Lam et al. 1413 (2013). Uncertainties are 2 σ. 1415 (d) Chlorophyll pigment content 1417 from MD02-2489 (brown 1419 crosses; Gebhardt et al., 2008). 1421 (e) Opal weight percent from 1423 MD02-2489 (filled turquoise 1425 circles; Gebhardt et al., 2008) 1427 and ODP 887 (open blue circles; 1429 Galbraith et al., 2007). (f) 1431 CaCO3 weight percent from 1433 MD02-2489 (filled yellow 1435 squares; Gebhardt et al., 2008) 1437 and ODP 887 (open orange 1439 squares; Galbraith et al., 2007). 1441 ODP 887 records are shown on 1443 the age model in Figure S4. (g) 1445 Calcium intensity from XRF 1447 core scan of MD02-2489 1449 (Gebhardt et al., 2008), shown 1451 on a logarithmic scale. (h) δ11B 1453
record from benthic foraminifera from MD02-2489 (this study). (i) Sedimentation rate from 1454 MD02-2489 (δ18O-based age model in this study). 1455
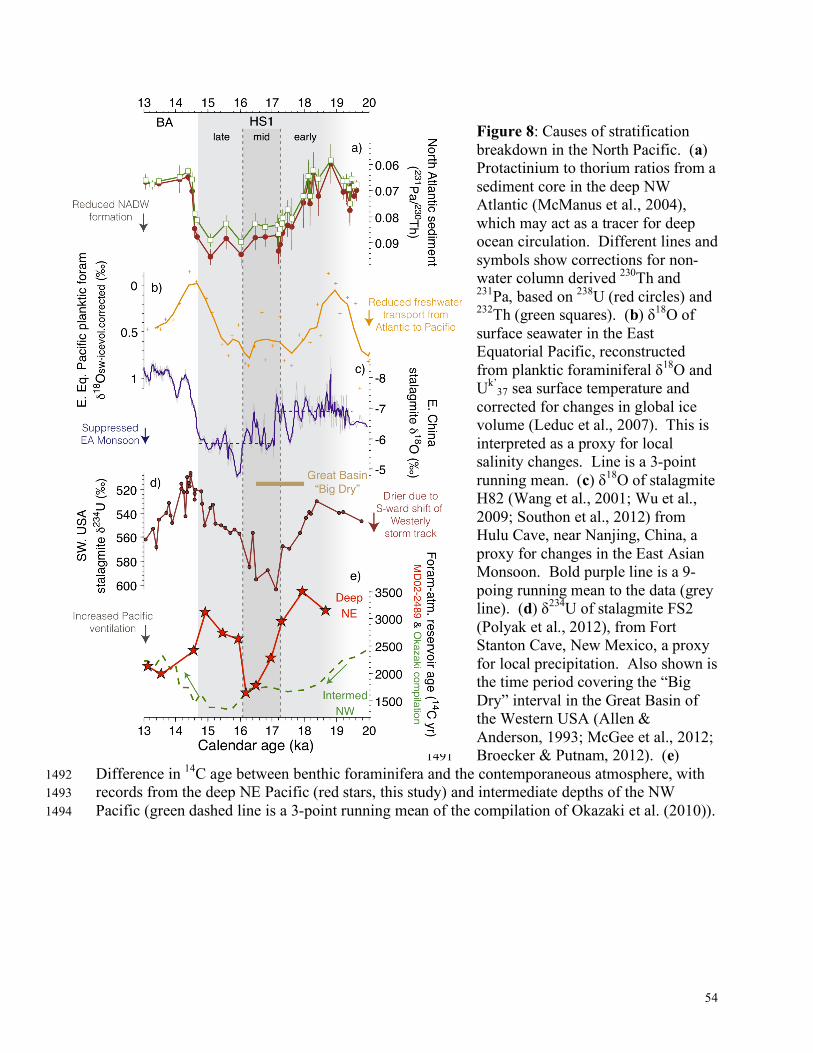
54
1456
Figure 8: Causes of stratification 1457 breakdown in the North Pacific. (a) 1458 Protactinium to thorium ratios from a 1459 sediment core in the deep NW 1460 Atlantic (McManus et al., 2004), 1461 which may act as a tracer for deep 1462 ocean circulation. Different lines and 1463 symbols show corrections for non-1464 water column derived 230Th and 1465 231Pa, based on 238U (red circles) and 1466 232Th (green squares). (b) δ18O of 1467 surface seawater in the East 1468 Equatorial Pacific, reconstructed 1469 from planktic foraminiferal δ18O and 1470 Uk’
37 sea surface temperature and 1471 corrected for changes in global ice 1472 volume (Leduc et al., 2007). This is 1473 interpreted as a proxy for local 1474 salinity changes. Line is a 3-point 1475 running mean. (c) δ18O of stalagmite 1476 H82 (Wang et al., 2001; Wu et al., 1477 2009; Southon et al., 2012) from 1478 Hulu Cave, near Nanjing, China, a 1479 proxy for changes in the East Asian 1480 Monsoon. Bold purple line is a 9-1481 poing running mean to the data (grey 1482 line). (d) δ234U of stalagmite FS2 1483 (Polyak et al., 2012), from Fort 1484 Stanton Cave, New Mexico, a proxy 1485 for local precipitation. Also shown is 1486 the time period covering the “Big 1487 Dry” interval in the Great Basin of 1488 the Western USA (Allen & 1489 Anderson, 1993; McGee et al., 2012; 1490 Broecker & Putnam, 2012). (e) 1491
Difference in 14C age between benthic foraminifera and the contemporaneous atmosphere, with 1492 records from the deep NE Pacific (red stars, this study) and intermediate depths of the NW 1493 Pacific (green dashed line is a 3-point running mean of the compilation of Okazaki et al. (2010)). 1494
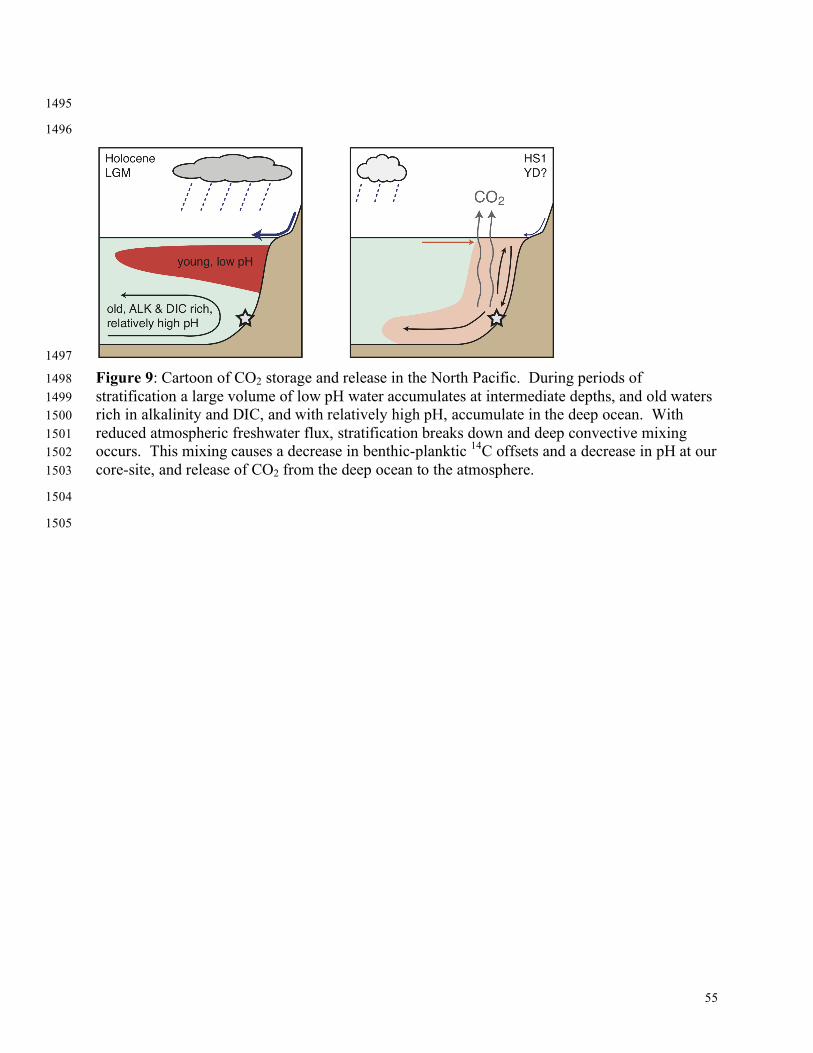
55
1495
1496
1497
Figure 9: Cartoon of CO2 storage and release in the North Pacific. During periods of 1498 stratification a large volume of low pH water accumulates at intermediate depths, and old waters 1499 rich in alkalinity and DIC, and with relatively high pH, accumulate in the deep ocean. With 1500 reduced atmospheric freshwater flux, stratification breaks down and deep convective mixing 1501 occurs. This mixing causes a decrease in benthic-planktic 14C offsets and a decrease in pH at our 1502 core-site, and release of CO2 from the deep ocean to the atmosphere. 1503
1504
1505