Embed Size (px)
Citation preview

Progress in Oceanography 135 (2015) 77–90
Contents lists available at ScienceDirect
Progress in Oceanography
journal homepage: www.elsevier .com/ locate /pocean
Deepwater redox changes in the southern Okinawa Troughsince the last glacial maximum
http://dx.doi.org/10.1016/j.pocean.2015.04.0070079-6611/� 2015 Elsevier Ltd. All rights reserved.
⇑ Corresponding author. Tel.: +86 21 6598 9130; fax: +86 21 6598 6278.E-mail address: [email protected] (S. Yang).
Yanguang Dou a, Shouye Yang b,⇑, Chao Li b, Xuefa Shi c, Jihua Liu c, Lei Bi b
a Key Laboratory of Marine Hydrocarbon Resources and Environmental Geology, Ministry of Land and Resources, Qingdao Institute of Marine Geology, Qingdao 266071, Chinab State Key Laboratory of Marine Geology, Tongji University, Shanghai 200092, Chinac Key Laboratory of Marine Sedimentology & Environmental Geology, First Institute of Oceanography, State Oceanic Administration (SOA), Qingdao 266071, China
a r t i c l e i n f o
Article history:Received 9 March 2014Received in revised form 9 April 2015Accepted 20 April 2015Available online 25 April 2015
a b s t r a c t
In this study, rare earth element (REE) was treated as a paleo-redox proxy to investigate the changes ofdepositional environment in the southern Okinawa Trough since the last glacial maximum. Theacid-leachable fraction (leachate) of the sediments recovered from the ODP Site 1202B is dominatedby biogenic and authigenic components while detrital contamination is minor. The significant enrich-ment of middle REE suggests a large contribution from authigenic Mn oxyhydroxides and cerium (Ce)anomaly can indicate deepwater redox change. The REE parameters including Ce anomaly in the leachateexhibit remarkable and abrupt changes in the early Holocene (�9.5 ka) and during LGM (�20 ka). Anincrease of Ce anomaly at 28–22 ka implies the suboxic deepwater condition probably caused byincreased primary productivity. Weak positive Ce anomalies during the last glacial maximum anddeglaciation suggest an oxic depositional environment responding to the enhanced deepwater ventila-tion with the advection of the North Pacific Intermediate Water and/or South China Sea IntermediateWater into the trough. A decrease of Ce anomaly in the early Holocene might be caused by the intrusionand strengthening of the Kuroshio Current in the trough that enhanced the water stratification andinduced a gradual development of suboxic depositional condition. Furthermore, an abrupt change ofchemical composition at ca. 4 ka probably indicates a decrease of dissolved oxygen in deepwater and aweakening of ventilation in the Okinawa Trough. This study suggests that REE proxy can provide newinsights into the linkage among surface current, deepwater circulation and sediment record in the con-tinental margin where terrigenous input dominates.
� 2015 Elsevier Ltd. All rights reserved.
Introduction
The Okinawa Trough (OT) that extends from the Lanyang Plainof northeast Taiwan to southwest Kyushu Islands, Japan, is aback-arc basin connecting the continental shelf of the East ChinaSea (ECS) and the northwestern Pacific (Sibuet et al., 1998;Fig. 1). As a semi-enclosed basin, the trough has a maximum waterdepth of about 2716 m in the south. The deep water is dominatedby two water masses, i.e. the North Pacific Intermediate Water(NPIW; 400–1500 m in water depth) originating from theOkhotsk Sea and western subpolar gyre (Talley, 1991; Yasuda,1997; Dickson et al., 2000; You et al., 2000), and the South ChinaSea Intermediate Water (SCSIW) in relation to AntarcticaIntermediate Water (AAIW) (Qu and Lindstrom, 2004; Chen,2005). The NPIW and AAIW enter the Okinawa Trough by way oftwo major currents: a deeper part of the Kuroshio within the
channel east of Taiwan (sill depth 600–800 m; mixing of ca. 45%NPIW and 55% SCSIW), and a branch of the Ryukyu CurrentSystem within the Kerama Gap (sill depth 110 m; mixing of ca.75% NPIW and 25% SCSIW) (Chen and Wang, 1998; Nakamuraet al., 2013). These topography-related current structures and asso-ciated water exchanges carry a large amount of heat to themid-latitudes, and thus the intermediate and deep waters in theOkinawa Trough are significantly different from those in othermarginal seas (Nakamura et al., 2013).
The North Pacific waters at intermediate to deep depths (1000–2000 m) have experienced drastic changes in water ventilationduring the late Quaternary (Curry et al., 1988; Keigwin, 1998;Matsumoto et al., 2002). Carbon isotope (d13C) data of benthic for-aminifera suggests a stronger ventilation at the depth of 700–2600 m in the Pacific during the last glacial maximum (LGM) thantoday, which was related to the formation of NPIW (Duplessy et al.,1988). The stable isotopic (d13C and d18O) data also suggest thatduring glaciation the ventilated watermass existed at intermediatedepths in the far northwester Pacific (Keigwin, 1998). The NPIW

Sea
YSCC
CDW
26
118 E 122
29
0 m501002005001000200030004000500060007000
YSWC
TWC
ZFC
CChina
Changjiang
East
Ch
ina
Sea
Ryukyu
Isands
Taiw
an
Taibei
126 130
23
32N
ODP 1202B
Kuroshio
Curre
nt
Philippine Sea
MD-012403
MD-012404
E017
121 6°121 8°
122.0°122.2°
122.4°
122.6°
2000
1000
0
-1000
-200024.6°N 24.8 25.0° 25.2° 25.4° 25.6°
Lan-Yang River
Dep
th (
m)
E
Qiantangjiang
Minjiang
Oujiang
Jiulongjiang
Yellow Sea
Taiw
an S
trait
Trou
ghOkinawa
ODP 1202B
Fig. 1. A schematic map showing the East China Sea with the locations of Hole ODP 1202B and other reference cores including MD-012403 (Kao et al., 2005), MD-012404 (Kaoet al., 2006) and E017 (Xiang et al., 2007). The oceanic circulations are from Huh and Su (1999). ZFCC: Zhenjiang and Fujian Coastal Current; TWC: Taiwan Warm Current;YSCC: Yellow Sea Coastal Current; YSWC: Yellow Sea Warm Current; CDW: Changjiang Dilute Water. Topography of the Southern Okinawa Trough is from Wei (2006). Themap is generated from the digital data compiled with exaggerated elevation (Liu et al., 1998). Three canyons (A, B, and C) indicate major conduits that supply sediments to thesouthern trough.
78 Y. Dou et al. / Progress in Oceanography 135 (2015) 77–90
was stronger and well ventilated, and the area of its formation wasexpanded to the Bering Sea during Heinrich Event 1 (H1), but theformation became weaker during the Bølling/Allerød (B/A) warmperiod (Rella et al., 2012). While neodymium isotope (dNd) recordssuggest that the increased flow of AAIW intruded into the Pacificduring the cold episodes of Heinrich Stadial 1 (HS1) and YoungerDryas (YD) (Huang et al., 2014). Therefore, the intermediate watersin the OT that were predominately sourced from the NPIW andAAIW might have enhanced the ventilation with the intrusion ofoxygenized bottom water during the LGM than that at present.
However, some studies suggest that the OT was dominated bythe low-salinity surface water and low-oxygen bottom water dur-ing last glaciations with lowstands of sea level (Li et al., 2005; Kaoet al., 2005; Xiang et al., 2007; Yu et al., 2009), primarily because ofphysiographic isolation of the OT from the North Pacific Ocean(Ujiié et al., 1991). During the last glaciation, the mainstream ofthe Kuroshio Current might have migrated to the east of theRyukyu Islands rather than flowing into the OT because of thelowered sea level and/or the hypothetical emergence of aRyukyu–Taiwan land bridge (Ujiié et al., 1991, 2003; Ijiri et al.,2005). The migration or shutting down of the Kuroshio Currentblocked the surface water exchange. Under this circumstance,deepwater formation and vertical ventilation might have ceasedand consequently caused anoxic conditions in deepwater (Limet al., 2011). Therefore, despite numerous studies on paleoceanog-raphy and paleoenvironmental changes in the OT (Jian et al., 2000;Ujiié et al., 1991, 2003; Li et al., 2005; Kao et al., 2005, 2006; Xianget al., 2007; Diekmann et al., 2008; Dou et al., 2010a,b, 2012), thechanges of circulation and redox condition of deepwater in theOT since the last glacial maximum remain unclear.
In recent years, rare earth elements (REEs) are widely used totrace paleoceanographic changes, e.g. Ce-anomaly being treatedas a powerful proxy for redox condition of bottom water(German and Elderfield, 1990; German et al., 1991; Murray et al.,1991a; Kato et al., 2002; Pattan et al., 2005; Xiong et al., 2012),
for tectonic and stratigraphic reconstruction (Murray et al., 1990,1991b), for diagenetic processes (Murray et al., 1991a; Caetanoet al., 2009) and eustatic sea-level change (Wilde et al., 1996). Inthis study, REEs and other elements in the sediments recoveredfrom ODP Site 1202B were measured, with the major purpose toreconstruct the paleo-redox changes and deepwater circulationsin the southern OT since the LGM.
Materials and methods
The piston Hole 1202B was collected from the southern OT onthe northern flank of the I-Lan Ridge (24�48.240N, 122�30.010E) ata water depth of 1274 m, during Ocean Drilling Program (ODP)Leg 195 in 2001 (Fig. 1; Wei, 2006). This study focused on theupper section of Hole 1202B, 0–110 mbsf (meters below sea floor),and a high-resolution age model was established on the basis ofoxygen isotopic composition and accelerator mass spectrometryradiocarbon dating (AMS14C) of planktonic foraminifera (Weiet al., 2005). The sediments of the upper 110 m are predominantlycomposed of mud, occasionally with very fine sand and silt layers,which provides a late Quaternary record of hemipelagic sedimen-tation in continental margin (Huang et al., 2005). The depositionalage at 110 mbsf is estimated at 28 ka, and the bulk sedimentationrate averages at about 0.39 cm/yr, which is much higher than thoseobserved in the northern and central trough (Ikehara, 1995). Theclay mineral and grain size compositions of the core sedimentshave been reported by Diekmann et al. (2008).
A total of 109 subsamples were collected from Hole 1202B at1 m interval for the uppermost 110 m. The samples werefreeze-dried and ground in an agate mortar. To separate biogenicand authigenic components from the bulk samples, about 0.2 gbulk sediment samples were leached with 20 ml 1 N hydrochloricacid (HCl) for 24 h at 50 �C. The 1 N HCl-leaching method used inthis study was stated by Freydier et al. (2001). After leaching with
Y. Dou et al. / Progress in Oceanography 135 (2015) 77–90 79
1 N HCl, the residues of the leached samples were completelydigested with concentrated HF–HNO3–HClO4 in an airtight Tefloncontainer as described by Dou et al. (2010a). Concentrations ofmajor elements (Al, Ti, Mn, Fe, P) and trace elements (includingREEs) were respectively determined by ICP-AES (IRIS Advantage)and ICP-MS (PQ3, Thermo Elemental) in the State Key Laboratoryof Marine Geology at Tongji University. For elemental analysis,the differences between the determined and certified elementalconcentrations of geostandards (GSR-5, GSR-6, and GSR-9) wereless than 5%. The leaching efficiency was checked by measuringthe concentrations of major elements in the leachate and residualfractions of these geostandards. The recoveries of the measuredtotal concentrations were estimated to be above 90%.
Biogenic silica (opal) was determined with the method byMortlock and Froelich (1989). Silica was extracted with analkaline solution (1 N NaOH), and the concentration of dissolvedsilica was determined by spectrophotometry using the modifiedmolybdate-blue method (Hansen and Koroleff, 1999); the valueswere expressed as %SiOPAL. The relative precision is about 4–10%for samples with less than 10% of biogenic opal.
Measurements of total organic carbon (TOC) and total nitrogen(TN) in all samples were performed on an organic element analyzer(Vario Cube CN, Germany) in the State Key Laboratory of MarineGeology at Tongji University, after processing the bulk sampleswith 1 N HCl to remove calcium carbonate. The concentrations oftotal carbon (TC) were determined on the freeze-dried sedimentspreviously rinsed by deionized water. Considering the weight lossof bulk samples during the acid leaching, the real TOC contents inthe bulk samples were calibrated by the following equation:measured TOC � (12 � TC)/(12 � TOC). The calibrated TOC concen-trations were reported in this study and also for the calculationof TOC/TN weight ratio. The contents of calcium carbonatewere roughly estimated by TC and TOC contents: CaCO3
(%) = (TC � TOC) � 100/12. For monitoring the analytic error, the
0Fe (%)
1 2 3 4
24
26
28
0
2
4
6
8
10
12
14
16
18
20
22
Al (%)
Age
(ka
)
Mn (μg/g
0 .4 .8 1.2 1.6 200 400 600
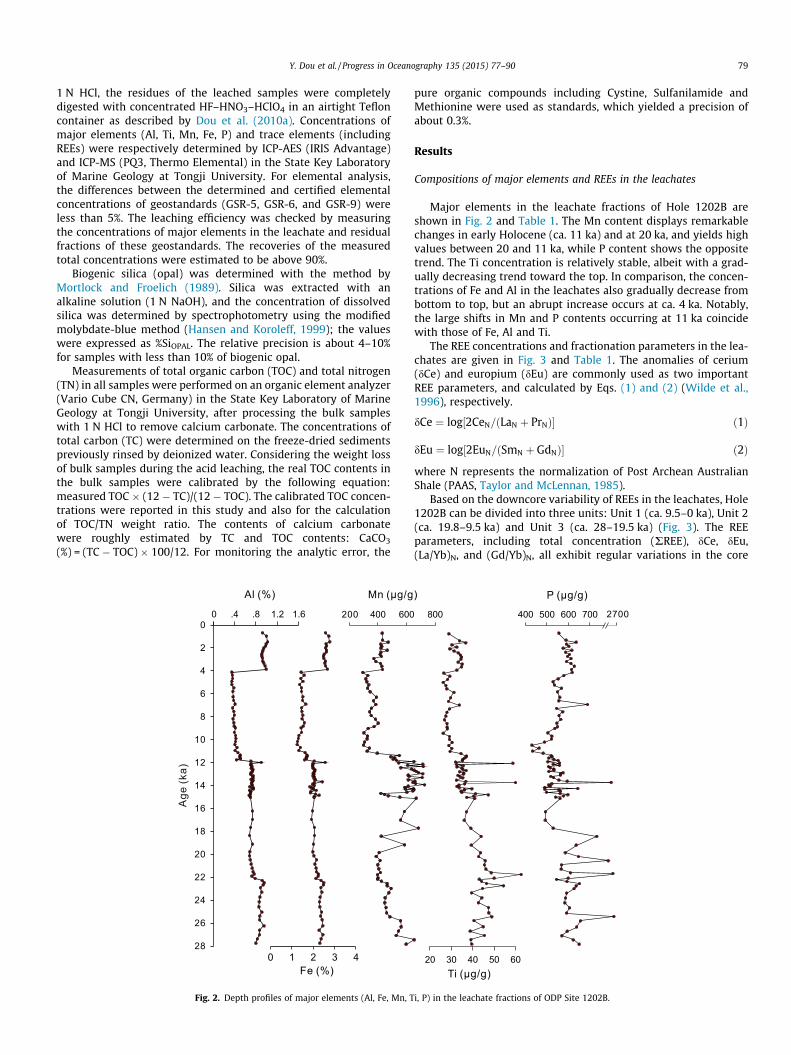
Fig. 2. Depth profiles of major elements (Al, Fe, Mn, T
pure organic compounds including Cystine, Sulfanilamide andMethionine were used as standards, which yielded a precision ofabout 0.3%.
Results
Compositions of major elements and REEs in the leachates
Major elements in the leachate fractions of Hole 1202B areshown in Fig. 2 and Table 1. The Mn content displays remarkablechanges in early Holocene (ca. 11 ka) and at 20 ka, and yields highvalues between 20 and 11 ka, while P content shows the oppositetrend. The Ti concentration is relatively stable, albeit with a grad-ually decreasing trend toward the top. In comparison, the concen-trations of Fe and Al in the leachates also gradually decrease frombottom to top, but an abrupt increase occurs at ca. 4 ka. Notably,the large shifts in Mn and P contents occurring at 11 ka coincidewith those of Fe, Al and Ti.
The REE concentrations and fractionation parameters in the lea-chates are given in Fig. 3 and Table 1. The anomalies of cerium(dCe) and europium (dEu) are commonly used as two importantREE parameters, and calculated by Eqs. (1) and (2) (Wilde et al.,1996), respectively.
dCe ¼ log½2CeN=ðLaN þ PrNÞ� ð1Þ
dEu ¼ log½2EuN=ðSmN þ GdNÞ� ð2Þ
where N represents the normalization of Post Archean AustralianShale (PAAS, Taylor and McLennan, 1985).
Based on the downcore variability of REEs in the leachates, Hole1202B can be divided into three units: Unit 1 (ca. 9.5–0 ka), Unit 2(ca. 19.8–9.5 ka) and Unit 3 (ca. 28–19.5 ka) (Fig. 3). The REEparameters, including total concentration (RREE), dCe, dEu,(La/Yb)N, and (Gd/Yb)N, all exhibit regular variations in the core
P (μg/g)
Ti (μg/g)
)
20 30 40 50 60
800 400 500 600 700 2700
i, P) in the leachate fractions of ODP Site 1202B.

Table 1Contents of TOC and CaCO3, and TOC/TN weight ratios in the bulk sediments; Ti and Al2O3 concentrations in the residues after 1 N HCl leaching; major elemental and REEs concentrations in the leachates for Hole 1202B.
Depth(mbsf)
Bulk sediments (%) 1 N HClresidues
1 N HCl leachates
TOC(%)
TOC/TN
CaCO3
(%)Ti(lg/g)
Al2O3
(%)Al(%)
Fe(%)
Mn(lg/g)
P (lg/g)
Ti(lg/g)
Ba(lg/g)
La(lg/g)
Ce(lg/g)
Pr(lg/g)
Nd(lg/g)
Sm(lg/g)
Eu(lg/g)
Gd(lg/g)
Tb(lg/
Dy(lg/g)
Ho(lg/g)
Er(lg/g)
Tm(lg/g)
Yb(lg/g)
Lu(lg/g)
1.01 1.14 9.53 2.97 5887 18.04 0.92 2.58 430.4 556.1 28.8 21.42 4.31 10.40 1.26 5.53 1.52 0.37 1.71 0.25 1.21 0.21 0.54 0.06 0.41 0.061.93 0.96 8.64 3.09 5653 17.28 0.99 2.74 433.1 588.8 33.8 21.79 4.70 11.23 1.36 5.95 1.63 0.40 1.80 0.26 1.31 0.22 0.57 0.07 0.44 0.062.95 1.05 9.02 2.56 5471 16.69 1.02 2.78 472.7 636.1 36.7 23.29 5.03 11.91 1.43 6.32 1.71 0.41 1.89 0.28 1.36 0.23 0.59 0.07 0.47 0.063.94 0.94 7.97 3.13 5329 16.78 0.99 2.61 420.8 590.6 30.3 21.53 4.45 10.65 1.29 5.72 1.60 0.38 1.74 0.26 1.28 0.22 0.55 0.07 0.44 0.064.97 0.91 7.89 3.81 5427 16.53 0.98 2.63 426.9 602.5 32.6 24.10 4.67 11.02 1.34 5.99 1.59 0.38 1.76 0.26 1.27 0.21 0.54 0.07 0.43 0.065.89 1.11 10.05 2.42 5457 16.74 0.95 2.58 421.5 575.1 29.2 19.81 4.48 10.59 1.27 5.68 1.55 0.38 1.73 0.26 1.24 0.21 0.55 0.07 0.42 0.066.91 0.86 7.34 4.17 5420 16.43 0.93 2.63 465.2 616.2 31.3 19.78 4.66 10.99 1.34 5.84 1.52 0.38 1.72 0.26 1.26 0.22 0.55 0.07 0.44 0.067.88 0.77 7.03 5.04 5453 16.50 0.92 2.63 421.1 586.9 33.3 19.77 4.54 10.89 1.29 5.79 1.54 0.37 1.71 0.25 1.23 0.22 0.54 0.07 0.43 0.068.95 0.86 8.33 4.80 5391 16.39 0.91 2.52 415.8 605.0 34.2 20.82 4.65 10.95 1.32 5.73 1.54 0.37 1.69 0.25 1.24 0.21 0.55 0.07 0.42 0.069.91 0.91 8.83 4.96 5346 16.30 0.91 2.48 425.0 595.6 34.8 21.48 5.09 11.95 1.41 6.18 1.61 0.38 1.75 0.25 1.27 0.22 0.56 0.07 0.45 0.06
10.95 0.88 7.77 4.76 5295 16.21 0.92 2.49 372.1 612.4 34.4 23.78 4.80 11.42 1.37 5.96 1.57 0.37 1.72 0.25 1.25 0.21 0.55 0.07 0.43 0.0611.89 1.05 8.89 4.15 5468 16.75 0.92 2.58 386.0 591.2 33.2 20.16 4.70 11.24 1.34 5.85 1.56 0.37 1.70 0.25 1.22 0.21 0.53 0.07 0.42 0.0612.48 0.93 8.25 5.45 5464 16.25 0.94 2.54 419.0 612.0 35.1 22.27 5.10 12.13 1.43 6.22 1.62 0.38 1.80 0.26 1.28 0.22 0.56 0.07 0.46 0.0613.41 0.84 6.88 6.50 5460 16.17 0.97 2.59 427.6 627.9 34.8 21.73 5.39 12.65 1.51 6.56 1.71 0.40 1.86 0.27 1.36 0.23 0.60 0.07 0.47 0.0714.47 0.80 6.88 6.50 5563 16.69 0.99 2.67 432.5 614.3 32.5 27.32 5.17 12.29 1.46 6.37 1.69 0.41 1.84 0.27 1.34 0.23 0.58 0.07 0.46 0.0715.39 0.92 8.02 5.06 5221 17.45 0.35 1.44 294.3 618.0 26.4 13.76 4.39 10.58 1.24 5.49 1.46 0.35 1.60 0.24 1.18 0.20 0.51 0.06 0.41 0.0616.41 0.86 7.40 6.10 5107 16.59 0.36 1.59 329.0 578.7 29.3 20.44 4.85 11.77 1.37 6.05 1.61 0.38 1.74 0.26 1.28 0.22 0.55 0.07 0.44 0.0617.46 0.87 7.58 6.11 5097 17.05 0.36 1.42 315.2 552.7 28.2 23.63 4.95 11.93 1.39 6.03 1.59 0.37 1.72 0.25 1.25 0.22 0.54 0.07 0.42 0.0618.39 0.88 7.70 5.11 5280 17.76 0.35 1.53 322.4 528.3 26.2 23.14 4.18 10.25 1.21 5.35 1.49 0.36 1.62 0.24 1.16 0.20 0.49 0.06 0.39 0.0619.41 0.85 6.69 5.69 5213 17.27 0.35 1.37 336.0 535.4 27.4 19.68 4.64 11.44 1.33 5.82 1.53 0.36 1.67 0.24 1.19 0.21 0.52 0.06 0.42 0.0620.47 0.87 8.21 5.30 5268 17.56 0.38 1.46 328.3 568.2 27.8 20.66 4.44 10.78 1.28 5.65 1.58 0.37 1.70 0.25 1.21 0.21 0.52 0.06 0.40 0.0621.45 0.95 9.04 4.83 5300 17.41 0.37 1.46 345.6 549.0 31.2 20.76 4.68 11.41 1.32 5.80 1.54 0.36 1.69 0.25 1.22 0.21 0.54 0.07 0.42 0.0622.92 0.90 10.00 4.90 5174 17.02 0.37 1.52 389.7 559.7 29.7 22.00 5.30 12.81 1.48 6.38 1.64 0.38 1.80 0.26 1.30 0.23 0.57 0.07 0.46 0.0723.89 0.93 8.55 5.10 5267 17.27 0.38 1.51 369.2 555.6 28.6 21.17 4.83 11.80 1.37 5.97 1.60 0.37 1.75 0.25 1.24 0.22 0.56 0.07 0.44 0.0624.87 1.04 10.09 4.16 5063 16.63 0.41 1.66 385.5 689.2 33.7 23.51 5.67 13.54 1.57 6.85 1.74 0.41 1.92 0.27 1.38 0.24 0.62 0.07 0.49 0.0725.92 1.00 9.38 4.16 5148 16.98 0.36 1.46 354.6 544.9 29.2 20.01 4.81 11.67 1.33 5.88 1.52 0.36 1.64 0.24 1.18 0.21 0.54 0.06 0.43 0.0626.88 1.03 7.71 3.69 5130 17.14 0.38 1.48 342.5 573.6 27.9 23.04 4.97 11.98 1.39 6.17 1.64 0.39 1.78 0.26 1.29 0.22 0.57 0.07 0.45 0.0627.89 0.95 8.93 4.30 5095 16.74 0.39 1.52 353.5 556.4 27.4 23.87 5.10 12.35 1.42 6.19 1.60 0.36 1.72 0.25 1.25 0.22 0.57 0.07 0.44 0.0628.91 0.97 8.76 4.07 5206 17.29 0.37 1.48 383.7 564.6 26.7 23.94 4.64 11.22 1.32 5.82 1.57 0.37 1.71 0.25 1.24 0.21 0.54 0.07 0.43 0.0629.95 0.87 8.63 4.97 5230 16.87 0.38 1.59 402.8 545.9 28.0 26.19 4.58 11.11 1.30 5.70 1.54 0.37 1.70 0.25 1.24 0.21 0.55 0.07 0.43 0.0630.89 0.87 8.70 4.35 5224 17.08 0.39 1.54 373.5 549.2 28.0 25.93 4.59 11.15 1.31 5.74 1.55 0.37 1.70 0.25 1.23 0.21 0.54 0.07 0.41 0.0631.38 0.87 7.52 4.73 5013 16.84 0.41 1.44 333.1 536.9 28.1 25.97 4.63 11.16 1.30 5.81 1.54 0.37 1.67 0.25 1.22 0.21 0.55 0.07 0.42 0.0632.86 0.83 7.50 4.87 4803 15.52 0.39 1.46 302.1 504.1 26.2 17.83 5.21 12.56 1.45 6.40 1.66 0.39 1.78 0.26 1.29 0.22 0.56 0.07 0.44 0.0633.92 0.76 7.30 5.38 5060 16.15 0.42 1.34 327.7 522.8 29.1 17.39 6.11 14.80 1.68 7.18 1.77 0.40 1.91 0.27 1.34 0.24 0.59 0.07 0.47 0.0634.88 0.93 9.36 3.52 5143 16.32 0.42 1.31 324.4 521.3 29.1 16.77 6.87 16.73 1.88 8.00 1.94 0.43 2.05 0.29 1.43 0.25 0.63 0.08 0.48 0.0735.88 0.99 8.99 3.23 5135 16.56 0.42 1.27 307.1 488.8 30.4 13.92 6.87 16.65 1.88 8.00 1.90 0.42 2.03 0.28 1.41 0.25 0.63 0.08 0.50 0.0736.91 1.09 8.65 1.94 5214 16.63 0.41 1.26 299.8 430.1 28.8 11.34 6.80 16.64 1.87 7.73 1.84 0.41 1.93 0.28 1.35 0.23 0.60 0.07 0.46 0.0637.89 1.06 10.02 2.28 3824 14.99 0.44 1.41 340.8 463.0 30.2 12.79 7.87 18.96 2.12 8.85 2.09 0.46 2.16 0.31 1.53 0.27 0.69 0.08 0.54 0.0738.87 0.97 8.12 3.00 5182 16.52 0.41 1.33 324.3 432.8 29.4 11.63 7.36 17.74 1.99 8.12 1.89 0.42 2.01 0.28 1.41 0.24 0.62 0.08 0.49 0.0739.91 1.15 10.11 1.34 5197 16.53 0.46 1.63 396.3 482.5 34.5 12.68 8.15 19.54 2.17 9.10 2.11 0.47 2.21 0.31 1.56 0.27 0.71 0.09 0.56 0.0841.93 0.92 8.39 1.97 5270 17.04 0.51 1.71 550.4 519.8 37.1 12.72 9.43 22.59 2.50 10.49 2.42 0.53 2.59 0.36 1.80 0.31 0.81 0.10 0.64 0.0942.88 1.02 8.43 1.18 5255 17.17 0.49 1.73 490.6 524.4 36.7 12.41 9.01 21.91 2.41 10.23 2.38 0.53 2.48 0.36 1.78 0.31 0.80 0.10 0.62 0.0943.88 0.91 8.35 2.47 5334 17.64 0.50 1.68 518.1 508.0 35.9 12.08 9.22 22.47 2.48 10.43 2.40 0.53 2.54 0.37 1.79 0.32 0.81 0.10 0.64 0.0944.91 0.97 8.46 2.08 5366 17.87 0.51 1.70 507.4 532.3 35.2 12.52 9.51 22.92 2.51 10.58 2.47 0.54 2.56 0.37 1.81 0.32 0.82 0.10 0.65 0.0945.87 0.75 6.80 2.34 4986 15.85 0.43 1.60 530.5 551.8 35.2 11.40 8.60 20.59 2.28 9.50 2.22 0.49 2.36 0.34 1.67 0.30 0.78 0.10 0.60 0.0946.88 1.02 9.25 2.19 5841 17.01 0.71 2.05 652.4 504.6 32.0 15.63 9.83 23.89 2.70 11.24 2.59 0.58 2.75 0.40 1.95 0.34 0.89 0.11 0.70 0.1047.91 0.96 8.73 2.82 6206 18.26 0.90 2.56 546.5 558.8 58.8 18.30 10.43 24.74 2.86 11.85 2.72 0.61 2.94 0.41 2.05 0.37 0.91 0.12 0.74 0.1048.97 0.89 7.84 3.61 5856 17.17 0.71 1.99 714.1 529.4 32.5 16.46 10.16 24.52 2.76 11.39 2.64 0.57 2.79 0.39 1.96 0.35 0.90 0.11 0.72 0.1049.88 0.84 8.29 4.10 5879 16.96 0.69 1.99 608.9 558.2 35.6 16.14 10.01 24.00 2.71 11.26 2.60 0.57 2.74 0.39 1.94 0.34 0.90 0.11 0.71 0.1050.90 0.89 7.86 3.99 5897 17.28 0.72 1.98 717.8 507.3 32.6 16.79 10.37 24.85 2.80 11.53 2.66 0.58 2.80 0.40 1.99 0.35 0.92 0.11 0.73 0.1051.85 0.91 8.06 3.88 5813 16.94 0.72 1.99 561.2 515.3 34.9 16.70 10.43 24.90 2.83 11.66 2.68 0.58 2.80 0.40 2.00 0.35 0.92 0.11 0.73 0.10
80Y.D
ouet
al./Progressin
Oceanography
135(2015)
77–90
g)

Table 1 (continued)
Depth(mbsf)
Bulk sediments (%) 1 N HClresidues
1 N HCl leachates
TOC(%)
TOC/TN
CaCO3
(%)Ti(lg/g)
Al2O3
(%)Al(%)
Fe(%)
Mn(lg/g)
P (lg/g)
Ti(lg/g)
Ba(lg/g)
La(lg/g)
Ce(lg/g)
Pr(lg/g)
Nd(lg/g)
Sm(lg/g)
Eu(lg/g)
Gd(lg/g)
Tb(lg/g)
yg/g)
Ho(lg/g)
Er(lg/g)
Tm(lg/g)
Yb(lg/g)
Lu(lg/g)
52.91 0.92 8.46 3.31 5967 16.98 0.71 2.00 636.4 532.5 35.3 16.36 10.06 24.06 2.73 11.23 2.59 0.57 2.72 0.39 95 0.34 0.90 0.11 0.72 0.1053.89 0.95 8.74 3.45 5879 17.07 0.75 2.08 652.9 532.6 36.9 17.57 10.93 26.15 2.94 12.13 2.78 0.60 2.91 0.41 08 0.37 0.96 0.12 0.77 0.1154.87 0.95 8.29 3.66 5860 17.58 0.74 2.08 668.9 508.8 33.8 17.53 11.25 27.14 3.03 12.44 2.87 0.63 2.99 0.43 13 0.38 0.99 0.12 0.78 0.1155.88 0.90 7.82 3.89 6328 18.81 0.72 2.05 684.2 574.8 35.8 16.91 10.54 25.26 2.83 11.71 2.67 0.59 2.85 0.40 02 0.36 0.92 0.11 0.73 0.1056.87 0.90 8.87 3.66 5711 16.46 0.70 2.01 713.9 562.5 35.6 16.30 9.95 23.90 2.68 11.18 2.52 0.55 2.72 0.38 91 0.33 0.87 0.11 0.71 0.1057.86 0.94 7.94 3.67 5909 17.58 0.70 2.04 612.4 562.9 33.1 16.52 10.34 25.12 2.78 11.48 2.61 0.57 2.82 0.40 98 0.35 0.91 0.11 0.72 0.1058.91 1.00 8.59 3.38 4679 13.89 0.75 1.99 618.4 517.4 34.1 17.89 11.18 26.84 2.98 12.37 2.83 0.61 2.94 0.41 09 0.37 0.97 0.12 0.79 0.1159.89 0.91 8.33 4.16 5953 17.83 0.74 2.06 709.8 530.9 35.4 17.77 11.19 26.74 3.00 12.41 2.77 0.62 2.97 0.42 11 0.37 0.97 0.12 0.79 0.1161.89 1.00 8.91 3.54 5725 16.67 0.71 2.11 613.3 556.0 32.3 16.88 10.98 26.37 2.94 12.12 2.75 0.60 2.94 0.41 07 0.37 0.96 0.12 0.78 0.1162.87 0.87 8.49 4.68 6028 17.53 0.75 2.08 659.4 594.4 36.8 17.47 10.90 26.21 2.93 12.15 2.74 0.60 2.90 0.41 08 0.36 0.95 0.12 0.75 0.1163.90 1.03 9.07 3.27 5777 17.19 0.73 2.43 645.0 2705.3 62.9 17.19 10.09 24.88 2.74 11.33 2.62 0.57 2.79 0.39 99 0.35 0.91 0.12 0.74 0.1064.87 0.99 9.99 4.65 5847 17.11 0.71 2.05 664.1 522.9 36.2 16.86 10.79 25.90 2.91 12.05 2.75 0.59 2.87 0.41 05 0.36 0.94 0.12 0.78 0.1165.88 0.96 9.71 3.84 5762 16.89 0.72 1.97 726.8 508.2 33.6 16.98 10.48 25.23 2.82 11.63 2.67 0.58 2.80 0.40 01 0.35 0.92 0.12 0.75 0.1066.92 1.03 9.63 4.68 5745 17.08 0.73 2.06 611.3 515.6 32.6 18.67 11.70 27.96 3.11 12.90 2.94 0.64 3.10 0.44 22 0.39 1.03 0.13 0.81 0.1267.96 1.29 11.88 1.60 5903 17.43 0.68 1.85 587.6 489.9 33.7 17.51 10.34 25.00 2.79 11.60 2.60 0.57 2.81 0.39 97 0.35 0.92 0.11 0.73 0.1068.88 0.92 9.44 4.15 5922 17.31 0.75 2.01 649.9 643.5 39.3 18.66 11.41 27.53 3.08 12.59 2.89 0.64 3.08 0.44 17 0.38 1.00 0.13 0.80 0.1169.40 0.97 9.08 3.71 5862 17.30 0.72 1.93 594.3 489.8 36.1 16.99 10.29 24.85 2.80 11.59 2.67 0.59 2.82 0.40 97 0.35 0.92 0.12 0.74 0.1069.87 0.80 7.77 5.20 5875 17.20 0.75 2.02 652.2 555.5 36.0 20.23 11.49 27.12 3.05 12.57 2.88 0.63 3.04 0.43 19 0.39 1.02 0.13 0.83 0.1270.88 1.39 12.15 0.21 5710 17.38 0.68 2.15 644.7 563.3 34.5 19.37 10.18 24.64 2.76 11.51 2.66 0.59 2.84 0.41 05 0.37 0.98 0.12 0.79 0.1171.88 0.92 9.13 5.16 5872 17.49 0.71 1.89 603.5 498.5 34.8 17.94 10.59 25.29 2.82 11.65 2.64 0.58 2.78 0.40 97 0.35 0.90 0.11 0.71 0.1072.88 0.83 9.15 4.92 5334 17.50 0.70 1.88 420.6 561.4 41.3 18.27 8.76 21.16 2.40 9.90 2.37 0.53 2.51 0.36 82 0.32 0.85 0.10 0.69 0.1073.89 0.89 8.99 6.46 5636 17.96 0.70 2.12 446.7 598.0 46.6 18.14 8.93 21.57 2.44 10.29 2.44 0.54 2.61 0.38 88 0.34 0.91 0.11 0.74 0.1074.89 0.79 8.86 7.81 5582 18.31 0.67 2.28 472.8 577.1 40.4 18.30 8.59 21.29 2.36 9.96 2.40 0.54 2.53 0.37 89 0.34 0.88 0.11 0.71 0.1075.89 0.85 8.11 6.85 5715 17.34 0.69 2.06 554.6 540.5 37.2 18.80 9.69 23.46 2.62 10.90 2.57 0.57 2.71 0.39 95 0.35 0.92 0.12 0.74 0.1076.88 0.91 9.35 5.16 5990 17.38 0.70 2.05 667.8 561.2 40.9 20.94 10.58 25.99 2.93 12.09 2.77 0.62 2.97 0.43 15 0.38 1.01 0.13 0.81 0.1178.89 0.94 9.89 5.30 6034 17.57 0.73 1.97 585.4 493.0 37.1 20.12 10.93 26.29 2.93 12.22 2.81 0.62 2.96 0.42 10 0.38 0.97 0.12 0.78 0.1179.91 0.98 9.62 3.42 5981 17.47 0.73 1.92 559.4 492.7 36.0 18.57 10.28 24.67 2.80 11.55 2.69 0.60 2.84 0.41 01 0.36 0.94 0.12 0.74 0.1080.89 0.88 8.54 3.51 5881 17.17 0.70 2.06 683.5 529.5 39.1 21.11 10.88 26.48 2.95 12.25 2.82 0.63 3.02 0.43 14 0.38 1.01 0.13 0.82 0.1281.86 0.99 9.89 4.53 5592 16.85 0.68 2.06 424.2 732.1 44.0 19.99 8.10 19.78 2.24 9.37 2.28 0.51 2.40 0.35 75 0.31 0.80 0.10 0.65 0.0982.91 0.79 7.51 7.74 5920 17.35 0.73 2.02 586.8 636.4 39.3 21.17 10.10 24.53 2.75 11.41 2.64 0.59 2.79 0.40 01 0.36 0.93 0.12 0.77 0.1183.89 0.93 9.37 3.24 5309 17.18 0.68 1.99 409.7 585.8 43.7 20.66 8.17 19.64 2.22 9.39 2.22 0.50 2.38 0.34 75 0.31 0.81 0.10 0.66 0.0984.88 0.78 8.53 7.69 5447 17.93 0.68 2.04 388.7 647.0 42.7 20.82 7.92 19.43 2.18 9.15 2.16 0.49 2.30 0.33 68 0.30 0.78 0.10 0.64 0.0985.91 0.89 9.66 6.61 5207 17.46 0.69 2.16 415.9 785.6 45.9 23.04 7.92 19.34 2.17 9.12 2.18 0.50 2.35 0.34 71 0.30 0.80 0.10 0.64 0.0986.97 0.81 8.81 7.26 5430 17.90 0.71 2.08 399.2 567.9 45.5 22.14 7.97 19.42 2.17 9.11 2.16 0.48 2.29 0.33 68 0.30 0.77 0.10 0.63 0.0988.01 0.93 8.80 6.17 5431 17.84 0.73 2.14 405.9 566.4 46.2 28.08 8.13 19.70 2.22 9.37 2.26 0.49 2.38 0.34 70 0.31 0.80 0.10 0.66 0.0989.41 0.78 7.40 6.96 5343 17.39 0.74 2.16 418.3 609.2 48.6 24.06 8.22 19.70 2.24 9.42 2.26 0.50 2.38 0.34 74 0.31 0.82 0.10 0.66 0.0990.40 0.72 7.91 7.10 5500 17.76 0.77 2.25 397.4 1370.4 65.8 23.02 7.76 18.57 2.10 8.92 2.11 0.47 2.23 0.33 63 0.29 0.77 0.10 0.62 0.0991.88 0.91 9.80 6.78 5394 18.05 0.72 2.23 401.1 598.9 50.0 23.62 8.19 19.40 2.22 9.35 2.24 0.50 2.35 0.34 74 0.31 0.81 0.10 0.65 0.0992.43 0.78 7.57 7.64 5539 18.05 0.78 2.13 397.9 544.8 43.1 21.40 7.61 18.07 2.05 8.52 2.00 0.46 2.15 0.31 58 0.27 0.72 0.09 0.59 0.0893.37 0.78 8.39 7.28 5571 17.97 0.92 2.37 424.6 593.3 44.1 24.05 8.31 19.59 2.23 9.41 2.23 0.50 2.34 0.33 75 0.30 0.79 0.10 0.64 0.0994.37 0.80 7.70 7.56 5546 17.91 0.95 2.49 465.0 651.8 46.4 25.06 8.72 20.45 2.33 9.80 2.27 0.51 2.42 0.35 76 0.31 0.83 0.10 0.66 0.0995.38 0.79 8.25 7.25 5536 17.59 0.93 2.49 465.0 636.3 54.4 24.29 8.15 18.92 2.16 9.15 2.14 0.49 2.29 0.33 67 0.30 0.79 0.10 0.63 0.0996.47 0.76 8.11 8.01 5543 17.53 0.88 2.37 493.0 626.6 44.6 22.79 8.15 19.07 2.22 9.17 2.19 0.49 2.35 0.34 71 0.30 0.79 0.10 0.65 0.0997.37 0.72 7.66 7.94 5453 17.46 0.91 2.41 477.0 591.5 39.4 23.80 8.23 19.45 2.22 9.38 2.22 0.51 2.35 0.34 72 0.31 0.80 0.10 0.65 0.0998.39 0.76 7.41 8.03 5403 17.38 0.87 2.32 450.3 586.4 44.2 22.53 8.34 19.46 2.24 9.42 2.23 0.49 2.35 0.34 69 0.30 0.80 0.10 0.64 0.0999.39 0.82 8.60 6.80 5321 17.62 0.86 2.30 448.0 583.3 42.6 23.02 8.23 19.24 2.19 9.25 2.20 0.49 2.31 0.33 69 0.30 0.78 0.10 0.64 0.09
100.41 0.80 8.30 7.36 5466 17.65 0.85 2.31 457.1 605.8 47.4 22.44 8.23 19.74 2.22 9.29 2.24 0.50 2.37 0.34 71 0.31 0.81 0.10 0.65 0.09101.48 0.71 7.34 7.55 5652 17.40 0.91 2.40 461.6 591.2 47.4 22.63 8.46 19.82 2.28 9.59 2.29 0.50 2.42 0.35 76 0.31 0.81 0.10 0.66 0.09102.39 0.82 7.90 6.39 5733 17.25 0.87 2.35 484.7 886.2 48.9 20.72 7.86 18.23 2.14 9.07 2.19 0.50 2.33 0.34 71 0.30 0.78 0.10 0.62 0.09103.29 0.82 9.45 7.73 5739 17.15 0.87 2.42 559.4 656.3 40.6 21.91 8.47 19.61 2.27 9.60 2.28 0.51 2.41 0.35 77 0.32 0.85 0.10 0.69 0.09104.69 0.72 8.10 8.18 5796 17.20 0.95 2.46 562.4 638.4 44.9 24.87 8.98 20.60 2.41 10.20 2.38 0.54 2.51 0.37 85 0.33 0.87 0.11 0.70 0.10105.69 0.87 8.88 7.28 5684 16.84 0.87 2.28 543.9 594.3 38.8 21.49 8.37 19.24 2.27 9.54 2.27 0.51 2.40 0.35 78 0.31 0.83 0.10 0.66 0.09
(continued on next page)
Y.Dou
etal./Progress
inO
ceanography135
(2015)77–
9081
D(l
1.2.2.2.1.1.2.2.2.2.1.2.2.2.1.2.1.2.2.1.1.1.1.1.2.2.2.2.1.2.1.1.1.1.1.1.1.1.1.1.1.1.1.1.1.1.1.1.1.1.1.1.

Tabl
e1
(con
tinu
ed)
Dep
th(m
bsf)
Bu
lkse
dim
ents
(%)
1N
HC
lre
sidu
es1
NH
Cl
leac
hat
es
TOC
(%)
TOC
/TN
CaC
O3
(%)
Ti (lg/
g)A
l 2O
3
(%)
Al
(%)
Fe (%)
Mn
(lg/
g)P
(lg/
g)Ti ( l
g/g)
Ba
(lg/
g)La (l
g/g)
Ce
(lg/
g)Pr (l
g/g)
Nd
(lg/
g)Sm (l
g/g)
Eu (lg/
g)G
d(l
g/g)
Tb (lg/
g)D
y(l
g/g)
Ho
(lg/
g)Er (l
g/g)
Tm (lg/
g)Y
b(l
g/g)
Lu (lg/
g)
106.
710.
838.
177.
3057
6317
.02
0.87
2.46
528.
556
9.3
45.4
21.7
78.
5319
.67
2.31
9.66
2.28
0.52
2.44
0.36
1.79
0.31
0.84
0.10
0.68
0.10
107.
680.
829.
407.
5558
6117
.15
0.82
2.38
653.
962
2.7
39.2
21.2
38.
6720
.07
2.35
9.92
2.32
0.52
2.49
0.36
1.84
0.32
0.86
0.11
0.69
0.10
108.
690.
869.
878.
1357
8216
.99
0.80
2.31
597.
265
0.3
39.5
20.9
48.
4519
.57
2.28
9.66
2.31
0.52
2.42
0.35
1.78
0.32
0.85
0.11
0.69
0.10
109.
691.
049.
985.
9558
1017
.06
0.91
2.50
589.
163
7.3
46.8
22.5
18.
8420
.39
2.39
10.0
52.
360.
542.
520.
371.
830.
330.
870.
110.
700.
1011
0.79
0.79
9.24
7.81
5610
16.8
10.
822.
3356
8.1
624.
539
.420
.62
8.58
19.9
22.
339.
812.
330.
522.
470.
361.
810.
320.
850.
110.
680.
10
82 Y. Dou et al. / Progress in Oceanography 135 (2015) 77–90
with a remarkable and abrupt change occurring in early Holocene(�9.5 ka) and LGM (Fig. 3). The Unit 1 has significantly low valuesof total REE concentrations, dCe and (La/Yb)N but higher of dEu and(Gd/Yb)N, compared to the underlying Unit 2. The Unit 3 has sim-ilar REE compositions relative to Unit 2 except lower RREE and dCevalues (Fig. 3).
The PAAS-normalized REE patterns in the leachates show a sig-nificant enrichment of middle REEs (MREE, Sm to Tb) relative tolight REEs (LREE, La to Nd) and heavy REEs (HREE, Dy to Lu)(Fig. 4). The MREE enrichment is also witnessed by higher valuesof (Gd/Yb)N (Fig. 3). Although the REE patterns of Unit 1 are overallsimilar with those of Unit 2 and Unit 3, the MREE enrichments aremore obvious in Unit 1 (Fig. 4).
Variations of biogenic components over the last 28 kyr
Biogenic proxies including contents of TOC, TN, biogenic car-bonate and opal primarily reflect the combined effects of produc-tivity, preservation (dissolution), diagenesis, and differential shelfexport from the continent. These proxies are also used to assessproductivity in the surface water of the OT (Chang et al., 2009).In this study, the TOC contents vary within a narrow range from0.7% to 1.4% and average at 1.0%, which is a little higher than thoseof southern OT sediments (Kao et al., 2005, 2006; Chang et al.,2009). Relatively low TOC contents are observed in the lower part,and higher contents occur in the deglacial and Holocene sediments,especially at ca.16–10 ka and 4–0 ka. The TOC/TN ratios range from6.7 to 12.2 and exhibit a similar variation with TOC contents(Fig. 5).
Opal (biogenic silica) content in sediment can indicate diatomproductivity in surface ocean because siliceous microorganismssuch as diatoms and radiolarians are major contributors of opal.The opal contents in Hole 1202B sediments range from 0.9% to2.3%, with an average of 1.2%. High opal contents (most >1.5%)occur in the lower part and a gradual decrease was observed atca. 14–10 ka (Fig. 5). The calcium carbonate contents (calculatedby Ca concentrations in the leachates) are high in the lower part(ca. 28–20 ka) and low in the middle portion (ca. 20–11 ka), witha mean value of 7.1%. The carbonate composition in the OT is pre-dominantly controlled by terrestrial sediment dilution, not by car-bonate dissolution (Chang et al., 2009). The contents of Ba show anabrupt change during the early Holocene (Fig. 5). Ba in the lea-chates cannot be ascribed to marine barite, because the dilutedHCl solution was unable to dissolve it (Piper, 1974; Guichardet al., 1979). In summary, the records of CaCO3 and Ba records inthe core sediments are not reliable proxies of primary productivityconsidering the huge terrigenous input to this river-dominatedcontinental slope.
Discussions
Estimation of detrital contamination in the leachate fraction
Leaching extraction with 1 N HCl acid has been regarded as anefficient method to separate authigenic/biogenic componentsincluding carbonates, phosphates and most Fe–Mn oxyhydroxidesfrom lithogenic fractions (mostly silicates) in sediment (Freydieret al., 2001; Li et al., 2003; Sutherland, 2002; Wei et al., 2006;Sutherland and Tack, 2008; Dou et al., 2010a). Some studies, how-ever, found that the leaching by diluted HCl may attack the latticestructures of co-existing clay minerals (Eisenhauer et al., 1999;Bayon et al., 2002) and result in detrital contamination in theleachates. Therefore, it is essential to evaluate the detrital contam-ination in the leachate fractions before using it as the indicator ofoceanic environmental change.

δEuƩREE (ppm)
0
2
4
6
8
10
12
14
16
18
20
22
24
26
28
(La/Yb)N
(Gd/Yb)N
Age
(ka
)
δCe.02 .04-.02 0.00 .6 .8 1.0 1.2
20 30 40 50 60 70 -.03 0.00 .03 .06 1.8 2.1 2.4 2.7
Unit 1
Unit 2
Unit 3
Fig. 3. Downcore variations of REE fractionation parameters in the leachate fractions of ODP Site 1202B. Units 1, 2 and 3 see the text for the details. RREE indicates total REEconcentrations.
Sam
ples
/PA
AS
.001
.01
.05
.1
.2
.5
1
2
5
10
REE
.05
.1
.2
.5
1
Unit 1Unit 2Unit 3
La Ce Pr Nd Sm Eu Gd Tb Dy Ho Er Tm Yb LuLa Ce Pr Nd Sm Eu Gd Tb Dy Ho Er Tm Yb Lu
REE
1 M HCl leachate
Range
deepwater in the PacificFe-Mn oxyhydroxides
authigenic phosphate
Unit 1Unit 2Unit 3
Fig. 4. PAAS-normalized REE distribution patterns of the leachates of Hole 1202B and comparison with those of the deepwater in the pacific (Alibo and Nozaki, 2000), Fe–Mncoatings of Core DGKS9604 (unpublished data), and authigenic phosphate (Piper et al., 1988).
Y. Dou et al. / Progress in Oceanography 135 (2015) 77–90 83
Aluminum in marine sediment is predominantly bound interrigenous components but is also influenced by biogenic material(mainly opal) in high productivity areas (Murray et al., 1993;Dymond et al., 1997), while Ti is generally believed to indicateterrigenous abundance in marine sediment. Al/Ti ratios in theleachates of the core sediments vary from 116 to 328, much higherthan in PAAS (16.7; Taylor and McLennan, 1985), in the residues andthe bulk composition of the Changjiang sediment (16.5) (Fig. 6),
which indicates the dissolution of some Al-silicate minerals or anon-detrital source for the excess Al (Dymond et al., 1997). In thisstudy, Al in the leachates probably derives from biogenic sourcesconsidering the extremely low Ti contents (26.2–65.8 ppm;Table 1, Fig. 6) in the leachates. Therefore, it is inferred that nosignificant detrital contamination occurred during the leachingwith 1 N HCl solution. Despite this, Ti content in the leachates isprimarily derived from two sources, authigenic/biogenic and

Age
(ka
)
Opal (%)1.8 2.4
TOC (%)1.6
0
2
4
6
8
10
12
14
16
18
20
22
24
26
28
Ba (ppm).6 1.2.4 .8 1.2 0 10 20 30
TOC/TN CaCO (%)3
Unit 1
Unit 2
Unit 3
3 6 9 12 15 2 4 6 8 10
Fig. 5. Downcore variations of biogenic elements including CaCO3 (calculated by Ca contents) and Ba in the leachates, TOC and opal contents and TOC/TN ratios in the bulksediments.
Al/T
i
Residue:~16.5
Alexcess
PAAS:~16.7Al/Ti:
4~12 ka
20 30 40 50 60 70-50
0
50
100
150
200
250
300
350
400
Changjiang:~16.5
Ti (ppm)
Detrital end-member
Fig. 6. Correlation plot between Ti and Al/Ti in the leachates. The mean values of Al/Ti in the residual faction, PAAS and modern Changjiang sediments (Taylor andMcLennan, 1985; Yang et al., 2004) are also included for comparison.
84 Y. Dou et al. / Progress in Oceanography 135 (2015) 77–90
lithogenic (residue) fractions of the sediments. Thus, a simple twoend-member mixing model was developed to quantify the contri-butions of detrital contamination in the leachates. The followingequation was extrapolated by using the mean Ti contents in bio-genic materials (�3 ppm, Dymond et al., 1997) and in the residuesof Hole 1202B (5511 ppm, Table 1).
Detritus % ¼ ðTileachate � TibiogenicÞ=ðTiresidue � TibiogenicÞ � 100 ð3Þ
According to this equation, the contributions of detritus and bio-genic components to the leachates were estimated to be 0.4–1.1%and 98.9–99.6%, respectively. This suggests that the detrital con-tamination in the leachates is very low, and the extraction with1 N HCl can basically represent the authigenic/biogenic componentsof the sediments at Hole 1202B.
Potential carrier phases of REEs in the leachates
Determining the carrier phases (minerals and organic matter) ofREEs can provide insights into the processes for REE accumulationin sediments (Xiong et al., 2012). Previous studies suggest thatchemical treatments with diluted HCl can leach most of the authi-genic/biogenic materials from the bulk sediment into the lea-chates, such as carbonate, phosphate, Fe–Mn oxides, andorganic-bound materials except for biogenic opal (Freydier et al.,2001; Sutherland, 2002; Li et al., 2003). Therefore, the REEs compo-sition in the leachates of Hole 1202B sediment is not dominated bybiogenic opal and detrital contamination, given that the very lowcontents of biogenic opal and detrital component in the leachates.Authigenic removal from the water column and early diagenesismay be one major process that potentially controls the enrichmentand depletion of REEs in the marine sediments (Sholkovitz, 1988).
The leachates of Hole 1202B exhibit significant MREE enrich-ment, as reflected by high (Gd/Yb)N ratios of 2.1–2.5 (Figs. 3 and4). The potential authigenic/biogenic phases in the leachates areassociated with the components containing Mn, Ca, P, Fe, and Ba(Figs. 2 and 3). Poor correlations are observed between REE andCaCO3, Fe, P concentrations (Fig. 7), suggesting that carbonate, ironoxyhydroxides and phosphate may not be important carriers forthe MREE enrichment in the leachates. Furthermore, MREE enrich-ment in this study cannot be ascribed to marine barite, because thediluted HCl solution was unable to dissolve it (Piper, 1974;Guichard et al., 1979). In addition, it is unlikely that depositionalorganic matter controls the MREE enrichment because of the lowTOC contents (0.71–2.18%) in the bulk sediments.
The MREE enrichment is a striking feature observed in marineauthigenic Fe–Mn phases, such as ferromanganese nodules andcrusts (Nath et al., 1992; Kuhn et al., 1998; Takahashi et al.,2000), Fe–Mn coatings (Palmer, 1985; Palmer and Elderfield,1986; Bayon et al., 2002, 2004), and manganese micronodules(Addy, 1979). The PAAS-normalized REE patterns in the leachates

20
30
40
50
60
70
CaCO (%)3
ΣR
EE
(pp
m)
4
5
6
7
8
9
10
Fe (%)
ΣM
RE
E (
ppm
)
4
5
6
7
8
9
10
Mn (μg/g)
ΣM
RE
E (
ppm
)
20
30
40
50
60
70
P (μg/g)
ΣR
EE
(pp
m)
Mn (μg/g)
Unit 1Unit 2Unit 3
δCe
P (μg/g)
y=869.14x+4.42612R =0.6915
y=-0.565x+0.00532R =0.2011
-.01
0.00
.01
.02
.03
.04
0.00
.01
.02
.03
.04
δCe
Unit 1Unit 2Unit 3
3 4 5 6 7 8 9 10 .8 1.2 1.6 2.0 2.4 2.8 3.2
200 300 400 500 600 700 800 400 500 600 700 800
400 500 600 700 800 200 300 400 500 600 700 800
Fig. 7. The correlation plots of total REE concentration (RREE) and dCe with CaCO3, Fe, Mn and P contents in the leachates.
Y. Dou et al. / Progress in Oceanography 135 (2015) 77–90 85
of Hole 1202B are similar to the Fe–Mn coatings of Core DGKS9604(unpublished data) in the middle OT (Fig. 4), suggesting theco-precipitation of REE with Mn and/or Fe oxyhydroxides. The highpositive correlation of RREE with Mn (correlation coefficientR2 = 0.7) and poor correlation between RREE and Fe (Fig. 7) appar-ently suggest that the MREE enrichment is primarily associatedwith Mn oxyhydroxides rather than with Fe authigenic phases.
In addition, the HREE enrichment relative to the Fe–Mn coatingsof Core DGKS9604 (Fig. 4) may be caused by authigenic phos-phates, as revealed in modern northwest Pacific bottom waters(Fig. 4; Piper et al., 1988; Pattan et al., 2005). Negative correlationbetween dCe and P and weak correlation between Ca and P (Fig. 7)indicate that the HREE enrichment in the leachates may be partlyresulted from authigenic phosphate but not by biogenic apatite.To summarize, the strong MREE enrichment in the leachates isindicative of a large REE contribution from Mn oxyhydroxides,while HREE enrichment (relative to Fe–Mn oxyhydroxides) is sug-gestive of a small contribution from authigenic phosphate. The REE
fractionation patterns observed in this study are overall consistentwith previous studies (Pattan et al., 2005; Takebe, 2005; Xionget al., 2012).
Ce anomaly indicates redox conditions
The anomaly of Ce in seawater is a sensitive proxy for redoxcondition (German and Elderfield, 1989). In suboxic marine envi-ronments, Ce4+ is reduced to Ce3+, in which state it behaves simi-larly to other trivalent REEs, resulting in minimal fractionationand little or no Ce anomaly in REE distributions. In comparison,Ce3+ is oxidized to Ce4+ in oxic marine environments, in whichstate it tends to be rapidly scavenged by colloids in suspension(German and Elderfield, 1989; German et al., 1991) or by Fe- andMn-oxyhydroxides in the sediment (Alibo and Nozaki, 1999;Nozaki, 2009). Such scavenging imparts a distinct negative Ceanomaly to seawater and a positive Ce anomaly to Fe–Mn oxyhy-droxides. Therefore, if the marine sediment inherits the

86 Y. Dou et al. / Progress in Oceanography 135 (2015) 77–90
Ce-anomaly from the ambient seawater without serious modifica-tion during and after deposition, the paleo-redox condition ofocean bottom water can be reconstructed by using this method(Wang et al., 1986; Liu et al., 1988; Kato et al., 2002). It is notewor-thy that various factors including detrital input, diagenetic alter-ation, and REE exchange between pore water and sediment, mayobscure the original Ce anomaly (German and Elderfield, 1990;Murray et al., 1991a,b; MacLeod and Irving, 1996; Holser, 1997;Pattan et al., 2005). In view of these uncertainties, it must be cau-tious to use Ce anomaly as an indicator of paleo-redox condition ofbottom water in marine sediments.
In the leachates of Hole 1202B, Ce anomaly exhibits subtle butsystematic changes. The three units show nearly neutral, weakpositive and nearly neutral Ce anomalies from bottom to top,respectively (Fig. 3). The Ce anomaly of Unit 3 gradually increasesfrom 0.006 to 0.03 (average 0.017), while Unit 1 exhibits a decreas-ing trend within a narrow range from 0.025 to 0.003 (average0.014). Weak positive Ce anomaly in the leachates can be attribu-ted to the authigenic components in the sediments, mostly Mnoxyhydroxides as suggested above. Marine authigenic Fe–Mn oxy-hydroxides of hydrogenous origin commonly show positive Ceanomaly owing to the oxidation of Ce3+ to Ce4+ in seawater andits subsequent uptake as CeO2 by metalliferous nodules or coatings(Piper, 1974; de Carlo, 1991; Nath et al., 1992). High Mn contentsin Unit 2 sediments further suggest that weak but obvious positiveCe anomalies in this unit might be caused by the presence of authi-genic manganese oxyhydroxides.
In general, young marine authigenic phosphate is characterizedby a negative Ce anomaly (Piper, 1974; Piper et al., 1988; MacLeodand Irving, 1996). Toyoda et al. (1990) and Toyoda and Masuda(1991) suggested that a positive Ce anomaly in Pacific pelagic sed-iments is caused by preferential scavenging of Ce from seawater tothe sediment, which results in a negative Ce anomaly incorporat-ing into phosphate phase. The neutral and weak positive Ceanomalies observed in this study further imply that the authigenicphosphate contributes minor to the REE composition in theleachates.
Previous studies suggest that a weak Ce anomaly can also resultfrom smectite formation in sediment by weathering of submarinevolcanic rocks and glass (Desprairies and Bonnot-Courtois, 1980;Tlig and Steinberg, 1982). This cannot be one possible reason forCe anomaly in this study because of very low detrital contamina-tion in the leachates. In conclusion, the Ce anomaly in the leachates
ƩREE(ppm)20 30 40 50 6070
Mn (%)
.80 .70 .60 .50 .40
P(%)
Age
(ka
)
Sedi rate (m/ka)2Opal flux (g/cm /ka)
0 .02.04.06.080 4 8 12 0 11 22 33 44
TOC flux (g
0 7 14
Fig. 8. Downcore variations of total REE concentrations (RREE), dCe, Mn, P in the leachatein the SCS for the past 21 kyr (Huang et al., 2014); degree of pyritization (DOP) data fro
is likely to reflect redox condition of deepwater, not determined bypost-depositional diagenetic alteration. Therefore, the weak butobvious positive Ce anomaly of Unit 2 suggests more oxic condi-tion of deepwater from the LGM to the deglacial period, whilethe gradual decreasing/increasing of Ce anomaly in Unit 1 andUnit 3 indicates a relatively suboxic depositional condition sincethe early Holocene and before the LGM.
Changes in redox conditions and deepwater circulation since the LGM
Redox condition in the water column is primarily determinedby the interaction of lateral ventilation of deep water, vertical over-turn (i.e., thermohaline circulation), and primary productivity(Arthur and Sageman, 1994; Piper and Isaacs, 1995; Dean et al.,1997). High primary productivity and enhanced water-columnstratification favor more reducing bottom waters, but strong lateralventilation of deep waters can counteract these effects (Xionget al., 2012). In view of the seawater depth of the study area(1274 m), deepwater circulation in the southern OT is predomi-nately controlled by the North Pacific Intermediate (NPIW)(400–1500 m, Dickson et al., 2000), which originates fromOkhotsk Sea and western subpolar gyre (Talley, 1991; Yasuda,1997; You et al., 2000), and/or the SCSIW (350–1350 m, Chen,2005) which is closely related to the Antarctic IntermediateWater (AAIW) (Chen and Wang, 1998; Chen, 2005). The NPIW ischaracterized by a salinity minimum (as low as 33.8) and lowoxygen (50–150 lmol/kg), while the AAIW has a salinity minimum(34.3–34.5) and high oxygen (200–250 lmol/kg) (Tomczak andGodfrey, 1994; Dickson et al., 2000). This distinct difference ofoxygen content between NPIW and AAIW (SCSIW) makes it possi-ble to distinguish deepwater ventilation by the redox-sensitiveproxy, Ce anomaly, in response to dissolved oxygen change ofthe water masses.
In this study, the results based on sedimentary geochemistrysuggest that more oxic deep water has formed in the southernOT during the last deglacial period. Weak but obviously positiveCe anomaly might be related to the increased advection ofNPIW/SCSIW into the OT, which coincides with previous studies(Duplessy et al., 1988; Keigwin, 1998; Okazaki et al., 2010;Huang et al., 2014). The observations on d13C of benthic foramini-fera in the continental slope east of Okinawa Island (GH08-2004;Kubota et al., 2014) and eNd data from the South China Sea(Huang et al., 2014), verified the increasing contribution of the
Unit 3
0 10 20 30 40
DOP(%)
TS (%)0.01 0.1
NPIWδCe
0.00.01 .02 .03 .04
δCe
-5.0 -7.0 -9.0
ɛNd AAIW
Unit 1
Unit 2
2/cm /ka)
21 28
-0.200.20.4
13Benthic δ C
s, opal content in the bulk sediments of ODP Site 1202B; eNd record from SO17940-2m Kao et al. (2006); total sulfur (TS) record from Kao et al. (2005).

Salinity34.3 34.6 34.934.0
Dissolved O (mg/L)2
KuroshioCurrent
Intermediateand deep water
Surface water
28
-100
0
Temperature ( )1.5 3.5 5.5 7.50 7 14 21
-1100
-1000
-900
-800
-700
-600
-500
-400
-300
-200
Wat
erde
pth
(m)
Fig. 9. Modern water column profiles (unpublished data, observed on October 28,2014) of temperature, salinity, dissolved oxygen in the southern Okinawa Trough(127.74�E, 28.71�N; 1036 m in water depth). These profiles allow the delineation ofwater masses, such as surface water, Kuroshio Current, intermediate and deepwater.
Y. Dou et al. / Progress in Oceanography 135 (2015) 77–90 87
NPIW and AAIW during the last deglacial period than in theHolocene (Fig. 8). Our paleoproductivity data of Hole 1202B showthe highest mass accumulation rates (MAR) of opal and TOCbetween 15 and 11 ka as compared to the LGM and Holocene(Fig. 8). The peak fluxes of opal and TOC confirmed the enhancedproductivity during the last deglacial period. Nevertheless, theincreased productivity was offset by enhanced deepwater ventila-tion that provided additional oxygen to maintain a higher redoxpotential at the sediment–water interface.
On the other side, the lower value of Ce anomaly since the earlyHolocene might indicate the decreased advection of NPIW/SCSIW
(
High primaryproductivity
strong ventilation of deep water
relative oxic deep water
(A) LGM to deglaciation
.01 .02 .03 .04
10
12
14
16
18
20
22
δCe
Age
(ka
)
Mnoxyhydroxides
Okinawa Trough
intrusion of NPIW
Fig. 10. A schematic map showing two different states of seawater circulation and hydDuring the last glacial maximum to deglacial periods, the deepwater was strongly ventildeepwater condition as evidenced by increasing Ce anomaly and authigenic Mn oxyhystrengthening of Kuroshio Current and weakening of deepwater ventilation, which resauthigenic Mn oxyhydroxides.
into the OT, which corresponds well with the low-oxygen condi-tions of modern intermediate/deep water we observed. Themodern physical oceanographic observations (unpublished data)suggest that the intermediate/deep water below the KuroshioCurrent in the southern OT has lower temperature (4–5 �C) anddissolved oxygen concentrations (2.2–2.6 mg/l) (Fig. 9). These lessoxygenized intermediate/deep waters also reflect the decreasedinput of NPIW/SCSIW, which accounts for a relatively suboxicdepositional condition since the early Holocene.
The oceanic circulation and water ventilation in the northPacific at intermediate to deep depths (1000–2000 m) have experi-enced drastic changes during the late Quaternary (Curry et al.,1988; Keigwin, 1998; Matsumoto et al., 2002). d13C data of benthicforaminifera suggests stronger ventilation in the Pacific during theLGM at the depth of 700–2600 m than today, which is tightlyrelated to the formation of NPIW (Duplessy et al., 1988). Bothd13C and d18O compositions also suggest that during glaciation abetter ventilated watermass occurred at intermediate depths inthe far northwester Pacific (Keigwin, 1998). Recently, a detailedinvestigation combining radiocarbon ventilation ages and climatemodel simulations suggests that the North Pacific deepwater wasformed during the Heinrich Stadial 1 (HS1: �17.5–15 kyr BP)(Okazaki et al., 2010). However, SCSIW production during theLGM is poorly constrained. More recently, Huang et al. (2014)inferred a stronger flow of the AAIW during the last deglacial per-iod than in the Holocene on the basis of neodymium isotopic data(eNd) data from the South China Sea, which suggests the enhancedSCSIW during the deglacial period (Fig. 8). Accordingly, theseobservations imply that the intermediate water (NPIW/SCSIW)ventilation in the study area was possibly stronger during theLGM and the last deglacial period than at present.
Evidences for redox changes provided by Ce anomaly of Hole1202B sediments suggest a more oxic condition of deep water inthe southern OT during the last deglacial period (Unit 2) and agradual development of suboxic depositional condition since theearly Holocene and before the LGM (Unit 1 and Unit 3; Figs. 8and 10). However, other evidences for redox changes provided bybenthic foraminifera and biogeochemical data (total sulfur anddegree of pyritization in sediment, Fig. 8) suggest that the bottomwater in southern OT was probably more reducing during the LGMthan in the Holocene (Li et al., 2005; Kao et al., 2006). Sedimentarysulfur and pyrite formation may be influenced by many factors,
weak ventilation of deep water
Kuroshio Current
suboxicdeep water
B) Early Holocene to present
0.00 .01 .02 .03 .040
2
4
6
8
10
δCe
Age
(ka
)
Okinawa Trough
Mnoxyhydroxides
Low primaryproductivity
rodynamics in the southern Okinawa Trough since the last glacial maximum. (A)ated with the intrusion of North Pacific Intermediate Water, which caused the oxicdroxides. (B) During the Holocene, the enhanced stratification happened with theults in suboxic deepwater condition shown as weak Ce anomaly and decreasing

88 Y. Dou et al. / Progress in Oceanography 135 (2015) 77–90
especially the post-depositional diagenetic alteration (e.g. sulfatereduction) and organic carbon oxidation pathway (Berner, 1985;Schenau et al., 2002). Furthermore, it is still questionable whetherthe species of benthic foraminifera are reliable proxies for redoxcondition because they are closely related to organic carbon sink-ing fluxes (Xiang et al., 2007).
The main axis of the poor-nutrition Kuroshio Current hasreturned to the OT in the early Holocene (Ujiié et al., 1991; Xianget al., 2007; Diekmann et al., 2008; Dou et al., 2010a,b, 2012).Such a shift might result in the enhanced water-column stratifica-tion and weak exchange rate of deep water mass, and thus, causedintensification of reducing conditions of deepwater during theHolocene (Fig. 10). Suboxic depositional condition in theHolocene is supported by the very low dissolved oxygen (about60 lM) at a depth of 1000 m in the OT (Usui et al., 1998).Relatively low primary productivity in the surface ocean duringthe Holocene cannot exert a significant control on deepwater redoxcondition. Furthermore, many elements, such as Al, Fe, P, Mn anddCe in the leachates showed abrupt changes at 4 ka (Figs. 2 and3). These fluctuations are coeval with the occurrence of benthicforaminifera Chilostomella spp. recorded in the Okinawa Trough(Xiang et al., 2007), which indicated a low-oxygen andpoorly-ventilated watermass. It is noteworthy that the Ce anomalysuggests a suboxic depositional condition before the LGM (Unit 3,Fig. 8), which is likely to be the result of decreased advection ofNPIW/SCSIW into the OT.
Though the strength and initiating mechanism of the changingdeepwater circulation remain to be clarified more, yet this researchbased on multiple proxies offers new insights and evidences intothe linkage among surface current, deepwater hydrodynamicsand sediment record in the OT. The intermediate water circulationin the Pacific is an important sink and reservoir of anthropogenicCO2 given that the dissolved inorganic carbon (DIC) is high in theNPIW and AAIW (Tsunogai et al., 1993) and AAIW (McNeil et al.,2001). It is hypothesized that during the last glacial period, oldercarbon was release to the atmosphere from the deep Pacificthrough changes in ocean circulation (Kubota et al., 2014).Therefore, our results from the Okinawa Trough support that thebetter-ventilated NPIW during the glaciation might have playedan important role in modulating the climate and paleoceano-graphic environments in the north Pacific Ocean (Duplessy et al.,1988; Keigwin, 1998).
Conclusions
The paleo-redox signals recorded in the leachate fraction ofHole ODP Site 1202B sediments were extracted to reconstructdeepwater circulation in the Okinawa Trough during the lastglacial period. Major conclusions can be summarized as follows:
After 1 N HCl leaching, the leachates is dominated by biogenicand authigenic components (98.9–99.6%) and detrital contamina-tion is minor (0.4–1.1%). The REE parameters in the leachatesexhibit regular variations with a remarkable and abrupt changeoccurring in the early Holocene (ca. 9.5 ka). The significant MREEenrichment in the PAAS-normalized patterns is indicative of thecontribution from authigenic manganese oxyhydroxides, whilethe HREE enrichment relative to Fe–Mn oxyhydroxides is probablycaused by authigenic phosphate. The positive Ce anomaly in theleachates is predominantly determined by authigenic Mnoxyhydroxides.
The weak positive Ce anomaly during the last deglacial periodsuggests a more oxic condition of bottom water in the OT, whichmay be caused by the enhanced advection of NPIW/SCSIW result-ing in better ventilation of the deepwater. Moreover, the sinkingflux of organic matter was offset by the enhanced deepwater
circulation that provided additional oxygen to maintain a higherredox potential at the sediment–water interface.
The relative lower value of Ce anomaly during the Holocene andbefore the LGM may reflect a gradual development of suboxicdepositional condition. Strengthening of the Kuroshio Current dur-ing the Holocene resulted in enhanced water-column stratificationand lower exchange rates of water mass, which consequentlycaused the reducing condition of deepwater. Abrupt changes ofmany elements including Al, Fe, P, Mn and Ce anomaly at 4 kaprobably indicate a further decrease of dissolved oxygen andenhanced ventilation in the Okinawa Trough.
This study based on elemental geochemistry in theacid-leachable fraction of marine sediments provides new insightsinto the linkage among surface current, deepwater circulation andsediment record in the continental margin where terrigenousinputs dominate and land–sea interaction is strong during the lateQuaternary.
Acknowledgments
We acknowledge Ocean Drilling Program (ODP) for the samplesof Hole ODP1202B. We thank Zhilei Sun for the help in data anal-ysis. This work was supported by the National Natural ScienceFoundation of China (grant nos. 41225020, 41376049 and41106058), the National Basic Research Program of China(2013CB429704), the open foundations of State Key Laboratory ofMarine Geology, Tongji University (grant no. MGK1202) and ofthe Key Laboratory of Marine Sedimentology & EnvironmentalGeology, State Ocean Administration (grant no. MASEG201202).
References
Addy, S.K., 1979. Rare earth element patterns in manganese nodules andmicronodules from northwest Atlantic. Geochimica et Cosmochimica Acta 43,1105–1115.
Alibo, D.S., Nozaki, Y., 1999. Rare earth elements in seawater: particle association,shale-normalization, and Ce oxidation. Geochimica et Cosmochimica Acta 63,363–372.
Alibo, D.S., Nozaki, Y., 2000. Dissolved rare earth elements in the South China Sea:geochemical characterization of the water masses. Journal of GeophysicalResearch – Oceans 105, 28771–28783.
Arthur, M.A., Sageman, B.B., 1994. Marine black shales: depositional mechanismsand environments of ancient deposits. Annual Review of Earth and PlanetarySciences 22, 499–551.
Bayon, G., German, C.R., Boella, R.M., Milton, J.A., Taylor, R.N., Nesbitt, R.W., 2002. Animproved method for extracting marine sediment fractions and its applicationto Sr and Nd isotopic analysis. Chemical Geology 187, 179–199.
Bayon, G., German, C.R., Burton, K.W., Nesbitt, R.W., Rogers, N., 2004. SedimentaryFe–Mn oxyhydroxides as paleoceanographic archives and the role of aeolianflux in regulating oceanic dissolved REE. Earth and Planetary Science Letters224, 477–492.
Berner, R.A., 1985. Sulphate reduction, organic matter decomposition and pyriteformation. Philosophical Transactions of the Royal Society of London A315(1531), 25–38.
Caetano, M., Prego, R., Vale, C., de Pablo, H., Marmolejo-Rodríguez, J., 2009. Record ofdiagenesis of rare earth elements and other metals in a transitional sedimentaryenvironment. Marine Chemistry 116, 36–46.
Chang, Y-Pin, Chen, M.-T., Yokoyama, Y., Matsuzaki, H., Thompson, W.G., Kao, S.-J.,Kawahata, H., 2009. Monsoon hydrography and productivity changes in the EastChina Sea during the past 100,000 years: Okinawa Trough evidence(MD012404). Paleoceanography 24, PA3208. http://dx.doi.org/10.1029/2007PA001577.
Chen, C.-T.A., 2005. Tracing tropical and intermediate waters from the South ChinaSea to the Okinawa Trough and beyond. Journal of Geophysical Research 110,C05012. http://dx.doi.org/10.1029/2004JC002494.
Chen, C.-T.A., Wang, S.L., 1998. Influence of intermediate water in the westernOkinawa Trough by the outflow from the South China Sea. Journal ofGeophysical Research 103, 12683–12688.
Curry, W.B., Duplessy, J.C., Labeyrie, L.D., Shackleton, N.J., 1988. Changes in thedistribution of d13C of deep water RCO2 between the last glaciation and theHolocene. Paleoceanography 3, 317–341.
de Carlo, E.H., 1991. Paleoceanographic implications of rare earth elementvariability within a Fe–Mn crust from the central Pacific Ocean. MarineGeology 98, 449–467.

Y. Dou et al. / Progress in Oceanography 135 (2015) 77–90 89
Dean, W., Gardner, J.V., Piper, D.Z., 1997. Inorganic geochemical indicators ofglacial-interglacial changes in productivity and anozia on the Californiacontinental margin. Geochimica et Cosmochimica Acta 61, 4507–4518.
Desprairies, A., Bonnot-Courtois, C., 1980. Relation entre la composition dessmectites d’alteration sous-marine et leur cortege de terres rares. Earth andPlanetary Science Letters 48, 124–130.
Dickson, R., Hurrell, J., Bindoff, N., Wong, A., Arbic, B., Owens, B., Imawaki, S.,Yashayaev, I., 2000. The world during WOCE. In: Siedler, G., Church, J., Gould, J.(Eds.), Ocean Circulation and Climate, Intermediate Geophysics Series, vol. 77,pp. 557–585.
Diekmann, B., Hofmann, J., Henrich, R., Fütterer, D.K., Röhl, U., Wei, K.-Y., 2008.Detrital sediment supply in the southern Okinawa Trough and its relation tosea-level and Kuroshio dynamics during the late Quaternary. Marine Geology255, 83–95.
Dou, Y.G., Yang, S.Y., Liu, Z.X., Clift, P.D., Shi, X.F., Yu, H., Berne, S., 2010a. Provenancediscrimination of siliciclastic sediments in the middle Okinawa Trough since 30ka: constraints from rare earth element compositions. Marine Geology 275,212–220.
Dou, Y.G., Yang, S.Y., Liu, Z.X., Clift, P.D., Shi, X.F., Yu, H., Berne, S., 2010b. Claymineral evolution in the middle Okinawa Trough since 28 ka: implications forsediment provenance and paleoenvironmental change. Palaeogeography,Palaeoclimatology, Palaeoecology 288, 108–117.
Dou, Y.G., Yang, S.Y., Liu, Z.X., Li, J., Shi, X.F., Yu, H., Berne, S., 2012. Sr–Nd isotopicconstraints on terrigenous sediment provenances and Kuroshio Currentvariability in the Okinawa Trough during the late Quaternary.Palaeogeography, Palaeoclimatology, Palaeoecology 356–366, 38–47.
Duplessy, J.C., Shachleton, N.J., Fairbanks, R.G., Labeyrie, L., Oppo, D., Kallel, N., 1988.Deepwater source variations during the last climatic cycle and their impact onthe global deepwater circulation. Paleoceanography 3, 343–360.
Dymond, J., Collier, R., McManus, J., Honjo, S., Manganini, S., 1997. Can thealuminum and titanium contents of ocean sediments be used to determine thepaleoproductivity of the oceans? Paleoceanography 12, 586–593.
Eisenhauer, A., Meyer, H., Rachold, V., Tutken, T., Wiegand, B., Hansen, B.T.,Spielhagen, R.F., Lindemann, F., Kassens, H., 1999. Grain size separation andsediment mixing in Arctic Ocean sediments: evidence from the strontiumisotope systematic. Chemical Geology 158, 173–188.
Freydier, R., Michard, A., De Lange, G., Thomson, J., 2001. Nd isotopic compositionsof Eastern Mediterranean sediments: tracers of the Nile influence duringsapropel S1 formation? Marine Geology 177, 45–62.
German, C.R., Elderfield, H., 1989. Rare earth elements in Saanich Inlet, BritishColumbia, a seasonally anoxic basin. Geochimica et Cosmochimica Acta 53,2561–2571.
German, C.R., Elderfield, H., 1990. Application of the Ce anomaly as a paleoredoxindicator: the ground rules. Paleoceanography 5, 823–833.
German, C.R., Holliday, B.P., Elderfield, H., 1991. Redox cycling of rare earthelements in the suboxic zone of the Black Sea. Geochimica et CosmochimicaActa 55, 3553–3558.
Guichard, F., Church, T.M., Treuil, M., Jaffrezic, H., 1979. Rare earth in barites:distribution and effects on aqueous partitioning. Geochimica et CosmochimicaActa 43, 983–997.
Hansen, H., Koroleff, F., 1999. Determination of nutrients. In: Grasshoff, K.,Kremling, K., Ehrhardt, M. (Eds.), Methods of Seawater Analysis. Wiley-VCM,Weinheim, pp. 159–228.
Holser, W., 1997. Evaluation of the application of rare-earth elements topaleoceanography. Palaeogeography, Palaeoclimatology, Palaeoecology 132,309–323.
Huang, C.-Y., Chiu, Y.-L., Zhao, M., 2005. Core description and preliminarysedimentological study of Site 1202D, Leg 195, in southern Okinawa Trough.Terrestrial Atmosphere and Oceanic Science 16, 19–44.
Huang, K.-F., You, C.-F., Chung, C.-H., Lin, Y.-H., Li, Z.F., 2014. Tracing the Nd isotopeevolution of North Pacific Intermediate and Deep Waters through the lastdeglaciation from South China Sea sediments. Journal of Asian Earth Sciences79, 564–573.
Huh, C.A., Su, C.C., 1999. Sedimentation dynamics in the East China Sea elucidatedfrom 210Pb, 137Cs and 239,240Pu. Marine Geology 160, 183–196.
Ijiri, A., Wang, L., Oba, T., Kawahata, H., Huang, C.Y., Huang, C.Y., 2005.Paleoenvironmental changes in the northern area of the East China Seaduring the past 42,000 years. Palaeogeography, Palaeoclimatology,Palaeoecology 219, 239–261.
Ikehara, K., 1995. Depositional pattern of the Okinawa Trough as revealed by 3.5kHz sub-bottom profiler and cored data. In: Tsunogai, S. et al. (Eds.), GlobalFluxes of Carbon and Its Related Substances in the Coastal Sea-Ocean-Atmosphere System. M. and J. International, Yokohama, pp. 58–62.
Jian, Z., Wang, P., Saito, Y., Wang, J., Pflaumann, U., Oba, T., Cheng, X., 2000. Holocenevariability of the Kuroshio Current in the Okinawa Trough, northwestern PacificOcean. Earth and Planetary Science Letters 184, 305–319.
Kao, S.J., Horng, C.S., Hsu, S.C., Wei, K.Y., Chen, J., Lin, Y.S., 2005. Enhanced deepwatercirculation and shift of sedimentary organic matter oxidation pathway in theOkinawa Trough since the Holocene. Geophysical Research Letters 32, L15609.http://dx.doi.org/10.1029/2005GL023139.
Kao, S.J., Roberts, A.P., Hsu, S.C., Chang, Y.P., Lyons, W.B., Chen, M.T., 2006. Monsoonforcing, hydrodynamics of the Kuroshio Current, and tectonic effects onsedimentary carbon and sulfur cycling in the Okinawa Trough since90 ka. Geophysical Research Letters 33, L05610. http://dx.doi.org/10.1029/2005GL025154.
Kato, Y., Nakao, K., Isozaki, Y., 2002. Geochemistry of Late Permian Triassic pelagiccherts from southwest Japan: implications for an oceanic redox change.Chemical Geology 182, 15–34.
Keigwin, L.D., 1998. Glacial-age hydrography of the far northwest Pacific Ocean.Paleoceanography 13, 323–339.
Kubota, Y., Kimoto, K., Itaki, T., Yokoyama, Y., Miyairi, Y., Matsuzaki, H., 2014.Variations in intermediate and deep ocean circulation in the subtropicalnorthwestern Pacific from 26 ka to present based on a new calibration for Mg/Ca in benthic foraminifera. Climate of the Past Discuss 10, 1265–1303.
Kuhn, T., Bau, M., Blum, N., Halbach, P., 1998. Origin of negative Ce anomalies inmixed hydrothermal–hydrogenetic Fe–Mn crusts from the Central Indian Ridge.Earth and Planetary Science Letters 163, 207–220.
Li, X.H., Wei, G.J., Shao, L., Liu, Y., Liang, X.R., Jian, Z.M., Sun, M., Wang, P.X., 2003.Geochemical and Nd isotopic variations in sediments of the South China Sea: aresponse to Cenozoic tectonism in SE Asia. Earth and Planetary Science Letters211, 207–220.
Li, T.G., Xiang, R., Sun, R.T., Cao, Q.Y., 2005. Benthic foraminifera and bottom waterevolution in the middle-southern Okinawa Trough during the last 18 ka. Sciencein China Series D: Earth Sciences 48, 805–814.
Lim, D., Xu, Z.K., Choi, J.Y., Kim, S.Y., Kim, E.H., Kang, S., Jung, H., 2011.Paleoceanographic changes in the Ulleung Basin, East (Japan) Sea, during thelast 20,000 years: evidence from variations in element composition of coresediments. Progress in Oceanography 88, 101–115.
Liu, Y.G., Miah, M.R.U., Schmitt, R.A., 1988. Cerium: a chemical tracer for paleo-oceanic redox conditions. Geochimica et Cosmochimica Acta 52, 1361–1371.
Liu, C.-S., Liu, S.Y., Lallemand, S.E., Lundberg, N., Reed, D., 1998. Digital elevationmodel offshore Taiwan and its tectonic implications. Terrestrial Atmosphereand Oceanic Science 9, 705–738.
MacLeod, K.G., Irving, A.J., 1996. Correlation of cerium anomalies with indicators ofpaleoenvironment. Journal of Sedimentary Research 66, 948–955.
Matsumoto, K., Oba, T., Lynch-Stieglitz, J., Yamamoto, H., 2002. Interior hydrographyand circulation of the glacial Pacific Ocean. Quaternary Science Reviews 21,1693–1704.
McNeil, B.I., Tilbrook, B., Matear, R.J., 2001. Accumulation and uptake ofanthropogenic CO2 in the Southern Ocean, south of Australia between 1968and 1996. Journal of Geophysical Research 106, 31431–31445.
Mortlock, R.A., Froelich, P.N., 1989. A simple method for the rapid determination ofbiogenic opal in the pelagic marine sediment. Deep-Sea Research 36, 1415–1426.
Murray, R.W., Buchholtz Brink, M.R., Brink, M.R., Jones, D.L., Gerlach, D.C., Russ III,G.P., 1990. Rare earth elements as indicators of different marine depositionalenvironments in chert and shale. Geology 18, 268–271.
Murray, R.W., Buchholtz Brink, M.R., Brink, M.R., Gerlach, D.C., Russ III, G.P., Jones,D.L., 1991a. Rare earth, major and trace elements in chert from the Franciscancomplex and Monterey group, California: assessing REE sources to fine grainedmarine sediments. Geochimica et Cosmochimica Acta 55, 1875–1895.
Murray, R.W., Buchholtz ten Brink, M.R., Brumsack, H.J., Gerlach, D.C., Russ III, G.P.,1991b. Rare earth elements in Japan sea sediments and diagenetic behavior ofCe/Ce⁄: results from ODP Leg 127. Geochimica et Cosmochimica Acta 55, 2453–2466.
Murray, R.W., Leinen, M., Isern, A.R., 1993. Biogenic flux of Al to sediment in thecentral equatorial Pacific-Ocean: evidence for increased productivity duringglacial periods. Paleoceanography 8, 651–670.
Nakamura, H., Nishina, A., Liu, Z.J., Tanaka, F., Wimbush, M., Park, J.-H., 2013.Intermediate and deep water formation in the Okinawa Trough. Journal ofGeophysical Research 118, 6881–6893.
Nath, B.N., Balaram, V., Sudhakar, M., Plüger, W.L., 1992. Rare earth elementgeochemistry of ferromanganese deposits from the Indian Ocean. MarineChemistry 38, 185–208.
Nozaki, Y., 2009. Rare earth elements and their isotopes. In: Steele, J., Thorpe, S.,Turekian, K. (Eds.), Encyclopedia of Ocean Sciences. Academic Press, New York,pp. 653–665.
Okazaki, Y., Timmermann, A., Menviel, L., Harada, N., Abe-Ouchi, A., Chikamoto,M.O., Mouchet, A., Asahi, H., 2010. Deepwater formation in the north Pacificduring the last glacial termination. Science 329, 200–204.
Palmer, M.R., 1985. Rare earth elements in foraminifera tests. Earth and PlanetaryScience Letters 73, 285–298.
Palmer, M.R., Elderfield, H., 1986. Rare earth elements and neodymium isotopes inferromanganese oxide coatings of Cenozoic foraminifera from the AtlanticOcean. Geochimica et Cosmochimica Acta 50, 409–417.
Pattan, J.N., Pearce, N.J.G., Mislankar, P.G., 2005. Constraints in using cerium-anomaly of bulk sediments as an indicator of paleo-bottom water redoxenvironment: a case study from the Central Indian Ocean Basin. ChemicalGeology 221, 260–278.
Piper, D.Z., 1974. Rare earth elements in ferromanganese nodules and other marinephases. Geochimica et Cosmochimica Acta 38, 1007–1022.
Piper, D.Z., Isaacs, C.M., 1995. Minor elements in Quaternary sediment from the Seaof Japan: a record of surface-water productivity and intermediate-water redoxconditions. GSA Bulletin 107 (January), 54–67.
Piper, D.Z., Baedecker, P.A., Crock, J.G., Burnett, W.C., Loebner, B.J., 1988. Rare-earthelements in the phosphatic-enriched sediment of the Peru Shelf. MarineGeology 80, 269–285.
Qu, T., Lindstrom, E.J., 2004. Northward intrusion of antarctic intermediate water inthe Western Pacific. Journal of Physical Oceanography 34, 2104–2118.
Rella, S.F., Tada, R., Nagashima, K., Ikehara, M., Itaki, T., Ohkushi, K., Sakamoto, T.,Harada, N., Uchida, M., 2012. Abrupt changes of intermediate water properties

90 Y. Dou et al. / Progress in Oceanography 135 (2015) 77–90
on the northeastern slope of the Bering Sea during the last glacial anddeglacial period. Paleoceanography 27, PA3203. http://dx.doi.org/10.1029/2011PA002205.
Schenau, S.J., Passier, H.F., Reichart, G.J., de Lange, G.J., 2002. Sedimentary pyriteformation in the Arabian Sea. Marine Geology 185, 393–402.
Sholkovitz, E.R., 1988. Rare earth elements in the sediments of the North AtlanticOcean, Amazon Delta, and East China Sea: reinterpretation of terrigenous inputpatterns to the oceans. American Journal of Science 288, 236–281.
Sibuet, J.C., Deffontaines, B., Hsu, S.K., Thareau, N., Formal, J.P., Liu, C.S., the ACTparty, 1998. Okinawa Trough backarc basin: early tectonic and magmaticevolution. Geophysical Research Letters 103, 30245–30267.
Sutherland, R.A., 2002. Comparison between non-residual Al Co, Cu, Fe, Mn, Ni, Pband Zn released by a three-step sequential extraction procedure and a dilutehydrochloric acid leach for soil and road deposited sediment. AppliedGeochemistry 17, 353–365.
Sutherland, R.A., Tack, F.M.G., 2008. Extraction of labile metals from solid media bydilute hydrochloric acid. Environmental Monitoring and Assessment 138, 119–130.
Takahashi, Y., Shimizu, H., Usui, A., Kagi, H., Nomura, M., 2000. Direct observation oftetravalent cerium in ferromanganese nodules and crusts by X-ray-absorptionnear-edge structure (XANES). Geochimica et Cosmochimica Acta 64, 2929–2935.
Takebe, M., 2005. Carriers of rare earth elements in Pacific deep-sea sediments.Journal of Geology 113, 201–215.
Talley, L.D., 1991. An Okhotsk Sea anomaly: implication for ventilation in the NorthPacific. Deep Sea Research: Part A 38 (Suppl. 1A), S171–S190.
Taylor, S.R., McLennan, S.M., 1985. The Continental Crust: Its Composition andEvolution. Blackwell Scientific Publications, Oxford, pp. 1–190.
Tlig, S., Steinberg, M., 1982. Distribution of rare earth elements (REE) in sizefractions of recent sediments of the Indian Ocean. Chemical Geology 37, 317–333.
Tomczak, M., Godfrey, J.S., 1994. Regional Oceanography: An Introduction.Pergamon Press.
Toyoda, K., Masuda, A., 1991. Chemical leaching of pelagic sediments: identificationof the carrier of Ce anomaly. Geochemical Journal 25, 95–119.
Toyoda, K., Nakamura, Y., Masuda, A., 1990. Rare earth elements of Pacific pelagicsediments. Geochimica et Cosmochimica Acta 54, 1093–1103.
Tsunogai, S., Ono, T., Watanabe, S., 1993. Increase in total carbonate in the westernNorth Pacific water and a hypothesis on the missing sink of anthropogeniccarbon. Journal of Oceanography 49, 305–315.
Ujiié, H., Tanaka, Y., Ono, T., 1991. Late Quaternary paleoceanographic record fromthe middle Ryukyu Trench slope, northwest Pacific. Marine Micropaleontology18, 115–128.
Ujiié, Y., Hjiie, H., Taira, A., Nakamura, T., Oguri, K., 2003. Spatial and temporalvariability of surface water in the Kuroshio source region, Pacific Ocean, overthe past 21,000 years: evidence from planktonic foraminifera. MarineMicropaleontology 49, 335–364.
Usui, T., Koike, I., Ogura, N., 1998. Vertical profiles of nitrous oxide and dissolvedoxygen in marine sediments. Marine Chemistry 59, 253–270.
Wang, Y.L., Liu, Y.G., Schmitt, R.A., 1986. Rare earth geochemistry of south Atlanticdeep sediments, Ce anomaly change at 54 My. Geochimica et CosmochimicaActa 50, 1337–1355.
Wei, K.Y., 2006. Leg 195 synthesis: site 1202–Late Quaternary sedimentation andpaleoceanography in the southern Okinawa Trough. In: Shinohara, M.,Salisbury, M.H., Richter, C. (Eds.), Proceedings of the Ocean Drilling Program,Scientific Results, vol. 195, pp. 1–31.
Wei, K.-Y., Mii, H., Huang, C.-Y., 2005. Age model and oxygen isotope stratigraphy ofSite ODP 1202 in the southern Okinawa Trough, northwestern Pacific.Terrestrial Atmosphere and Oceanic Science 16, 1–17.
Wei, G.J., Li, X.H., Liu, Y., Shao, L., Liang, X.R., 2006. Geochemical record of chemicalweathering and monsoon climate change since the early Miocene in the SouthChina Sea. Paleoceanography 21, PA4214. http://dx.doi.org/10.1029/2006PA001300.
Wilde, P., Quinby-Hunt, M.S., Erdtmann, B.D., 1996. The whole-rock ceriumanomaly: a potential indicator of eustatic sea-level changes in shales of theanoxic facies. Sedimentary Geology 101, 43–53.
Xiang, R., Sun, Y., Li, T., Oppo, D.W., Chen, M., Zheng, F., 2007. Paleoenvironmentalchange in the middle Okinawa Trough since the last deglaciation: evidencefrom the sedimentation rate and planktonic foraminifera record.Palaeogeography, Palaeoclimatology, Palaeoecology 243, 378–393.
Xiong, Z.F., Li, T.G., Algeo, T., Chang, F.M., Yin, X.B., Xu, Z.K., 2012. Rare earth elementgeochemistry of laminated diatom mats from tropical West Pacific: evidence formore reducing bottom waters and higher primary productivity during the LastGlacial Maximum. Chemical Geology 296–297, 103–118.
Yang, S.Y., Jung, H.S., Li, C.X., 2004. Two unique weathering regimes in theChangjiang and Huanghe drainage basins: geochemical evidence from riversediments. Sedimentary Geology 164, 19–34.
Yasuda, I., 1997. The origin of the North Pacific Intermediate Water. Journal ofGeophysical Research 102, 893–909.
You, Y., Suginohara, N., Fukasawa, M., Yasuda, I., Kaneko, I., Yoritaka, H., Kawamiya,M., 2000. Roles of the Okhotsk Sea and Gulf of Alaska in forming the NorthPacific Intermediate Water. Journal of Geophysical Research 105, 3253–3280.
Yu, H., Liu, Z.X., Berné, S., Jia, G.D., Xiong, Y.Q., Dickens, G.R., Wei, G.J., Shi, X.F., Liu,J.P., Chen, F.J., 2009. Variations in temperature and salinity of the surface waterabove the middle Okinawa Trough during the past 37 kyr. Palaeogeography,Palaeoclimatology, Palaeoecology 281, 154–164.