Embed Size (px)
Citation preview

Table of Contents:
SCOPE OF THIS ADDENDUM 2 DISTRIBUTION OF PROJECTS AND DEFAULTS 3 DEFAULT RATE ANALYSIS 4 APPENDIX I: GLOSSARY 11 MOODY’S RELATED RESEARCH 12 ACKNOWLEDGEMENT 12
Analyst Contacts:
NEW YORK +1.212.553.1653
Kevin Kelhoffer +1.212.553.7252 Vice President [email protected]
LONDON +44.20.7772.5454
Andrew Davison +44.20.7772.5552 Senior Vice President [email protected]
SPECIAL COMMENT
INFRASTRUCTURE OCTOBER 18, 2013
Default and Recovery Rates for Project Finance Bank Loans, 1983–2011 Addendum
This Special Comment (the “Addendum”) is an addendum to Moody’s study published in February 2013 examining the default and recovery performance of unrated project finance bank loans (the “Study”1). The Study is based on aggregate data (the “Study Data Set”) from a consortium of leading sector lenders, comprising 4,067 projects that account for some 53.6% of all project finance transactions originated globally during a 28 year period from January 1, 1983 to December 31, 2011. This Addendum publishes additional information about the performance of infrastructure projects (based on a broad definition of infrastructure, “Broad Infrastructure”2), subsets of that universe of projects comprised of those with availability-based revenues and PFI/PPP3 projects, and the overlap of those two subsets.
We highlight our key findings below:
» For Availability-Based projects4 and Availability-Based PFI/PPP projects:
– Marginal default rates (the likelihood that a performing obligor at the start of a year will default in that year) are consistently low over time from financial close.
– Marginal default rates in Europe, OECD countries and worldwide are comparable to marginal default rates for issuers rated higher than Baa3 at all durations from financial close.
» For Broad Infrastructure projects and PFI/PPP projects:
– Marginal default rates tend to decline over time from financial close.
– Marginal default rates for PFI/PPP projects in Europe, OECD countries and worldwide are border-line investment-grade for the initial year following financial close, and are comparable to marginal default rates for issuers rated Baa3 or higher thereafter.
1 See Moody’s Special Comment: “Default and Recovery Rates for Project Finance Bank Loans, 1983–2011,” February 2013. 2 “Broad Infrastructure” comprises those projects categorized as Infrastructure projects in the Study, to which we have added Power Transmission and Distribution
projects from the Study Data Set. 3 Public Private Partnerships (“PPPs”) including projects procured under the UK Government’s Private Finance Initiative (“PFIs”). This Addendum reports on PFI/PPP
projects within Broad Infrastructure. 4 The term “Availability-Based” refers to a project that earns the majority of its revenue from an availability-based payment stream for operating and maintaining an asset
in accordance with contracted levels of performance, and hence the project’s revenue stream is not materially exposed to volume/traffic risk or price risk. This Addendum reports on Availability-Based projects and Availability-Based PFI/PPP projects within Broad Infrastructure.

INFRASTRUCTURE
2 OCTOBER 18, 2013
SPECIAL COMMENT: DEFAULT AND RECOVERY RATES FOR PROJECT FINANCE BANK LOANS, 1983–2011 ADDENDUM
– Marginal default rates for Broad Infrastructure projects in Europe, OECD countries and worldwide are border-line investment-grade for the first four years following financial close, and are comparable to marginal default rates for issuers rated Baa3 or higher thereafter.
– Marginal default rates in Europe are lower than marginal default rates in OECD countries; and both are lower than marginal default rates worldwide.
» For Broad Infrastructure projects, PFI/PPP projects, Availability-Based projects, and Availability-Based PFI/PPP projects:
– Average ultimate recovery rates are better than the average ultimate recovery rate of 80.3% for the entire Study Data Set.
Scope of this Addendum
This Addendum should be read in conjunction with the Study. We emphasize that the data set for this Addendum is the same as the Study Data Set, i.e. aggregate data from a consortium of banks relating to the historical credit performance of unrated project finance bank loans.5
In this Addendum, we examine the historical default and recovery behavior of Broad Infrastructure projects, and of certain types of projects falling within Broad Infrastructure.
In our analysis of industry sectors within the Study, we apply the term “Infrastructure” to refer more specifically to social and transportation infrastructure assets and services procured using project finance. For the purpose of this Addendum, the term “Broad Infrastructure” comprises those projects categorized as Infrastructure projects in the Study, to which we have added Power Transmission and Distribution projects from the Study Data Set.
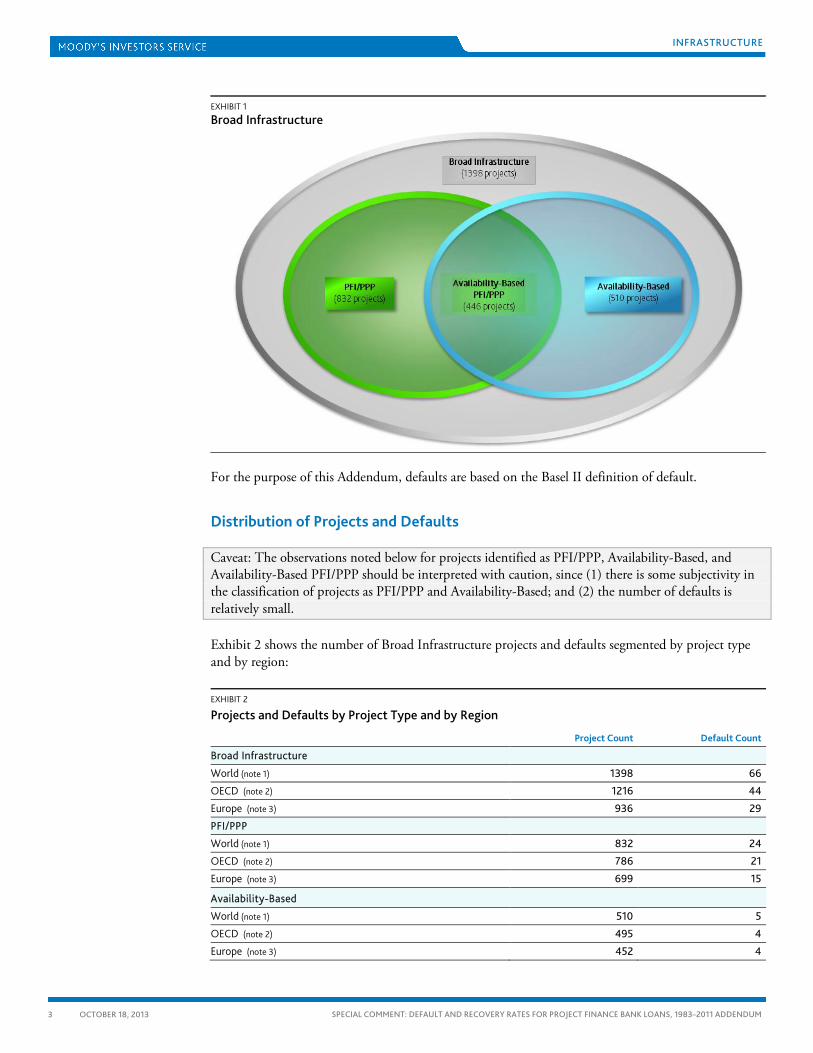
In this Addendum we analyze the historical credit performance of 1,398 Broad Infrastructure projects, a subset of 832 PFI/PPP projects within the category of Broad Infrastructure, an additional subset of 510 Availability-Based projects within the Broad Infrastructure category and the universe of 446 projects that are both Availability-Based and PFI/PPP projects. This breakdown of project type is illustrated in Exhibit 1 below. We further segment our analysis regionally into projects throughout the world, projects in OECD countries and projects within the European Economic Area.
5 This is different from Moody’s own data on the historical credit performance of long-term infrastructure debts rated by Moody’s, which we reported on in our Special
Comment: “Infrastructure Default and Recovery Rates, 1983-2012H1” , December 2012.
INFRASTRUCTURE
3 OCTOBER 18, 2013
SPECIAL COMMENT: DEFAULT AND RECOVERY RATES FOR PROJECT FINANCE BANK LOANS, 1983–2011 ADDENDUM
EXHIBIT 1
Broad Infrastructure
For the purpose of this Addendum, defaults are based on the Basel II definition of default.
Distribution of Projects and Defaults
Caveat: The observations noted below for projects identified as PFI/PPP, Availability-Based, and Availability-Based PFI/PPP should be interpreted with caution, since (1) there is some subjectivity in the classification of projects as PFI/PPP and Availability-Based; and (2) the number of defaults is relatively small.
Exhibit 2 shows the number of Broad Infrastructure projects and defaults segmented by project type and by region:
EXHIBIT 2
Projects and Defaults by Project Type and by Region
Project Count Default Count
Broad Infrastructure
World (note 1) 1398 66
OECD (note 2) 1216 44
Europe (note 3) 936 29
PFI/PPP
World (note 1) 832 24
OECD (note 2) 786 21
Europe (note 3) 699 15
Availability-Based World (note 1) 510 5
OECD (note 2) 495 4
Europe (note 3) 452 4
INFRASTRUCTURE
4 OCTOBER 18, 2013
SPECIAL COMMENT: DEFAULT AND RECOVERY RATES FOR PROJECT FINANCE BANK LOANS, 1983–2011 ADDENDUM
EXHIBIT 2
Projects and Defaults by Project Type and by Region
Project Count Default Count
Availability-Based PFI/PPP
World (note 1) 446 5
OECD (note 2) 439 4
Europe (note 3) 406 4
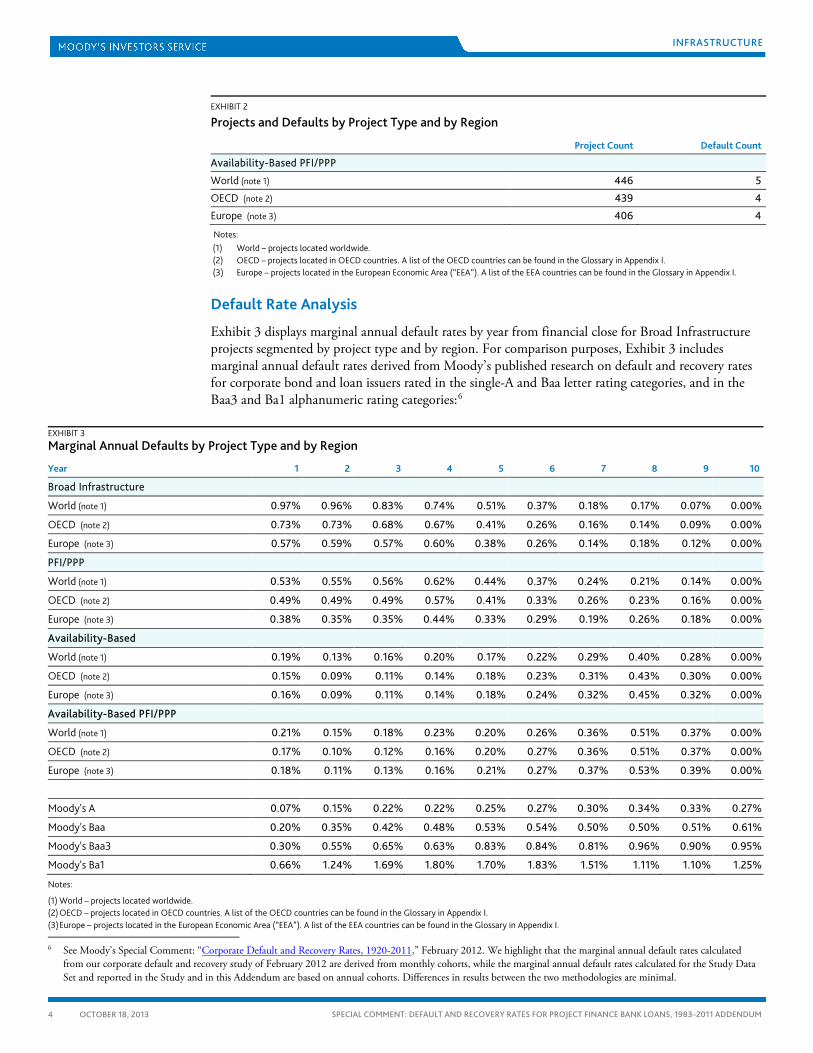
Notes: (1) World – projects located worldwide. (2) OECD – projects located in OECD countries. A list of the OECD countries can be found in the Glossary in Appendix I. (3) Europe – projects located in the European Economic Area (“EEA”). A list of the EEA countries can be found in the Glossary in Appendix I.
Default Rate Analysis
Exhibit 3 displays marginal annual default rates by year from financial close for Broad Infrastructure projects segmented by project type and by region. For comparison purposes, Exhibit 3 includes marginal annual default rates derived from Moody’s published research on default and recovery rates for corporate bond and loan issuers rated in the single-A and Baa letter rating categories, and in the Baa3 and Ba1 alphanumeric rating categories:6
EXHIBIT 3 Marginal Annual Defaults by Project Type and by Region
Year 1 2 3 4 5 6 7 8 9 10
Broad Infrastructure
World (note 1) 0.97% 0.96% 0.83% 0.74% 0.51% 0.37% 0.18% 0.17% 0.07% 0.00%
OECD (note 2) 0.73% 0.73% 0.68% 0.67% 0.41% 0.26% 0.16% 0.14% 0.09% 0.00%
Europe (note 3) 0.57% 0.59% 0.57% 0.60% 0.38% 0.26% 0.14% 0.18% 0.12% 0.00%
PFI/PPP
World (note 1) 0.53% 0.55% 0.56% 0.62% 0.44% 0.37% 0.24% 0.21% 0.14% 0.00%
OECD (note 2) 0.49% 0.49% 0.49% 0.57% 0.41% 0.33% 0.26% 0.23% 0.16% 0.00%
Europe (note 3) 0.38% 0.35% 0.35% 0.44% 0.33% 0.29% 0.19% 0.26% 0.18% 0.00%
Availability-Based
World (note 1) 0.19% 0.13% 0.16% 0.20% 0.17% 0.22% 0.29% 0.40% 0.28% 0.00%
OECD (note 2) 0.15% 0.09% 0.11% 0.14% 0.18% 0.23% 0.31% 0.43% 0.30% 0.00%
Europe (note 3) 0.16% 0.09% 0.11% 0.14% 0.18% 0.24% 0.32% 0.45% 0.32% 0.00%
Availability-Based PFI/PPP
World (note 1) 0.21% 0.15% 0.18% 0.23% 0.20% 0.26% 0.36% 0.51% 0.37% 0.00%
OECD (note 2) 0.17% 0.10% 0.12% 0.16% 0.20% 0.27% 0.36% 0.51% 0.37% 0.00%
Europe (note 3) 0.18% 0.11% 0.13% 0.16% 0.21% 0.27% 0.37% 0.53% 0.39% 0.00%
Moody's A 0.07% 0.15% 0.22% 0.22% 0.25% 0.27% 0.30% 0.34% 0.33% 0.27%
Moody's Baa 0.20% 0.35% 0.42% 0.48% 0.53% 0.54% 0.50% 0.50% 0.51% 0.61%
Moody's Baa3 0.30% 0.55% 0.65% 0.63% 0.83% 0.84% 0.81% 0.96% 0.90% 0.95%
Moody's Ba1 0.66% 1.24% 1.69% 1.80% 1.70% 1.83% 1.51% 1.11% 1.10% 1.25%
Notes:
(1) World – projects located worldwide. (2) OECD – projects located in OECD countries. A list of the OECD countries can be found in the Glossary in Appendix I. (3) Europe – projects located in the European Economic Area (“EEA”). A list of the EEA countries can be found in the Glossary in Appendix I. 6 See Moody’s Special Comment: “Corporate Default and Recovery Rates, 1920-2011,” February 2012. We highlight that the marginal annual default rates calculated
from our corporate default and recovery study of February 2012 are derived from monthly cohorts, while the marginal annual default rates calculated for the Study Data Set and reported in the Study and in this Addendum are based on annual cohorts. Differences in results between the two methodologies are minimal.
INFRASTRUCTURE
5 OCTOBER 18, 2013
SPECIAL COMMENT: DEFAULT AND RECOVERY RATES FOR PROJECT FINANCE BANK LOANS, 1983–2011 ADDENDUM
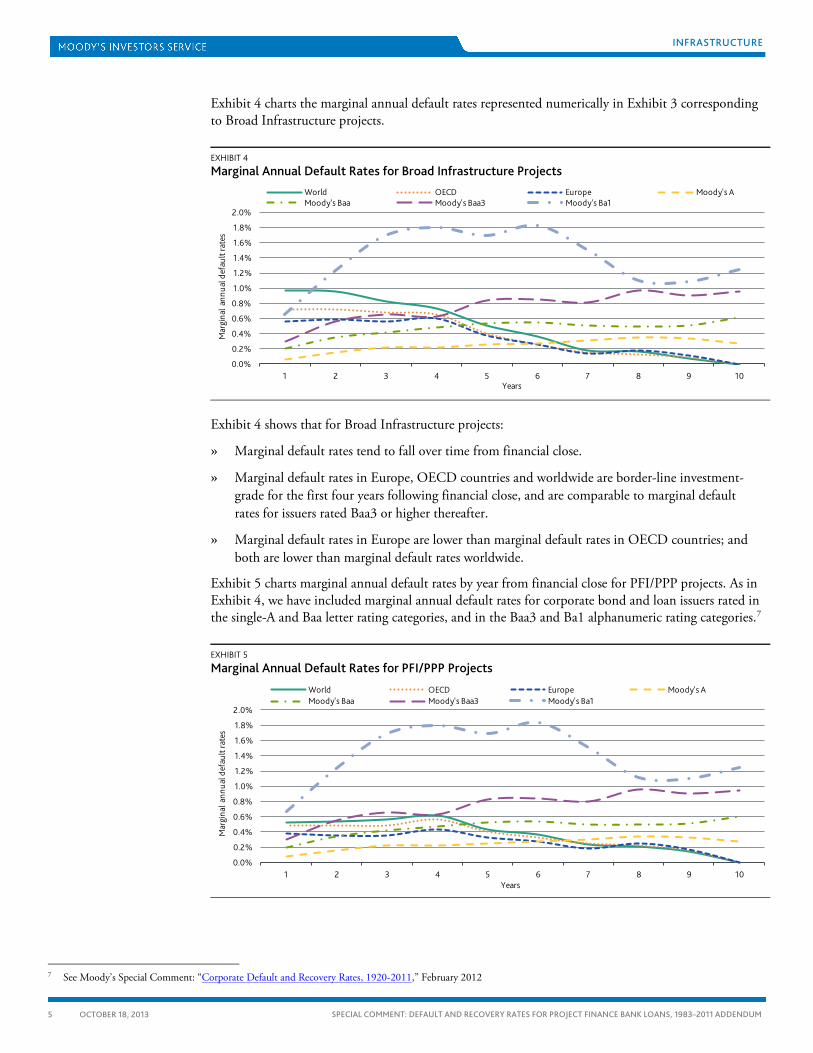
Exhibit 4 charts the marginal annual default rates represented numerically in Exhibit 3 corresponding to Broad Infrastructure projects.
EXHIBIT 4
Marginal Annual Default Rates for Broad Infrastructure Projects
Exhibit 4 shows that for Broad Infrastructure projects:
» Marginal default rates tend to fall over time from financial close.
» Marginal default rates in Europe, OECD countries and worldwide are border-line investment-grade for the first four years following financial close, and are comparable to marginal default rates for issuers rated Baa3 or higher thereafter.
» Marginal default rates in Europe are lower than marginal default rates in OECD countries; and both are lower than marginal default rates worldwide.
Exhibit 5 charts marginal annual default rates by year from financial close for PFI/PPP projects. As in Exhibit 4, we have included marginal annual default rates for corporate bond and loan issuers rated in the single-A and Baa letter rating categories, and in the Baa3 and Ba1 alphanumeric rating categories.7
EXHIBIT 5
Marginal Annual Default Rates for PFI/PPP Projects
7 See Moody’s Special Comment: “Corporate Default and Recovery Rates, 1920-2011,” February 2012
0.0%
0.2%
0.4%
0.6%
0.8%
1.0%
1.2%
1.4%
1.6%
1.8%
2.0%
1 2 3 4 5 6 7 8 9 10
Mar
gina
l ann
ual d
efau
lt ra
tes
Years
World OECD Europe Moody's AMoody's Baa Moody's Baa3 Moody's Ba1
0.0%
0.2%
0.4%
0.6%
0.8%
1.0%
1.2%
1.4%
1.6%
1.8%
2.0%
1 2 3 4 5 6 7 8 9 10
Mar
gina
l ann
ual d
efau
lt ra
tes
Years
World OECD Europe Moody's AMoody's Baa Moody's Baa3 Moody's Ba1
INFRASTRUCTURE
6 OCTOBER 18, 2013
SPECIAL COMMENT: DEFAULT AND RECOVERY RATES FOR PROJECT FINANCE BANK LOANS, 1983–2011 ADDENDUM
Exhibit 5 shows that for PFI/PPP projects:
» Marginal default rates tend to fall over time from financial close.
» Marginal default rates in Europe, OECD countries and worldwide are border-line investment-grade for the initial year following financial close, and are comparable to issuers rated Baa3 or higher thereafter.
» Marginal default rates in Europe are lower than marginal default rates in OECD countries; and both are lower than marginal default rates worldwide.
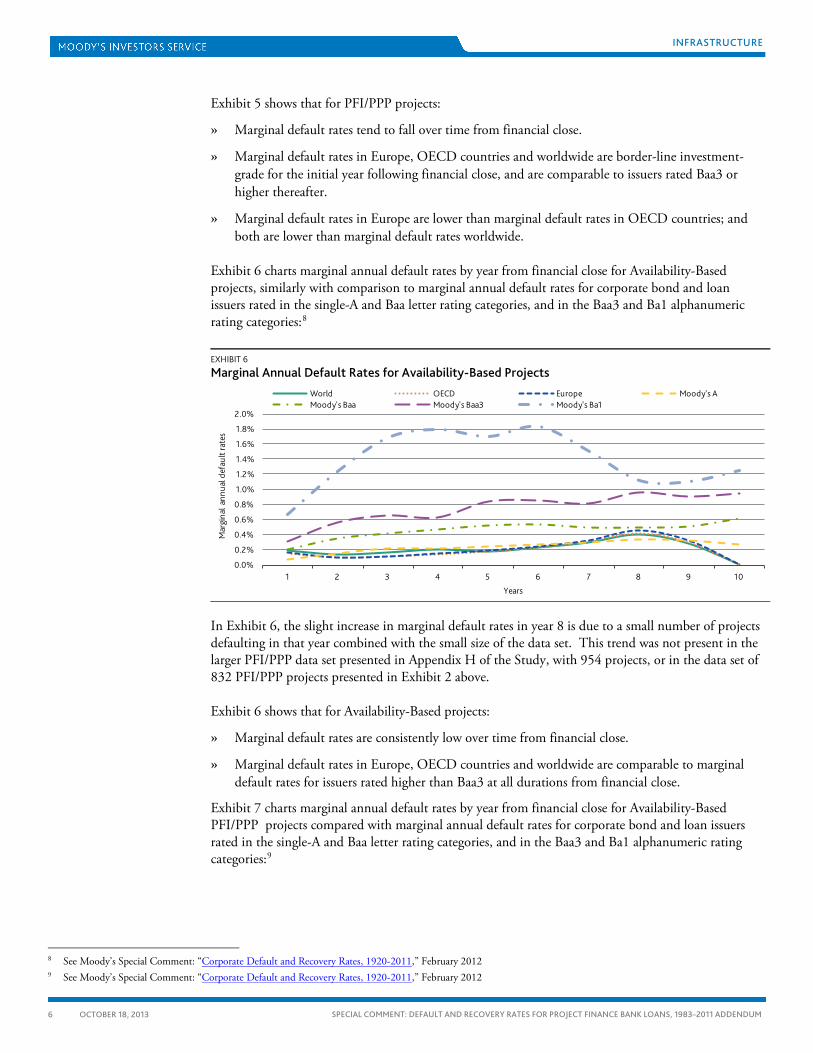
Exhibit 6 charts marginal annual default rates by year from financial close for Availability-Based projects, similarly with comparison to marginal annual default rates for corporate bond and loan issuers rated in the single-A and Baa letter rating categories, and in the Baa3 and Ba1 alphanumeric rating categories:8
EXHIBIT 6
Marginal Annual Default Rates for Availability-Based Projects
In Exhibit 6, the slight increase in marginal default rates in year 8 is due to a small number of projects defaulting in that year combined with the small size of the data set. This trend was not present in the larger PFI/PPP data set presented in Appendix H of the Study, with 954 projects, or in the data set of 832 PFI/PPP projects presented in Exhibit 2 above.
Exhibit 6 shows that for Availability-Based projects:
» Marginal default rates are consistently low over time from financial close.
» Marginal default rates in Europe, OECD countries and worldwide are comparable to marginal default rates for issuers rated higher than Baa3 at all durations from financial close.
Exhibit 7 charts marginal annual default rates by year from financial close for Availability-Based PFI/PPP projects compared with marginal annual default rates for corporate bond and loan issuers rated in the single-A and Baa letter rating categories, and in the Baa3 and Ba1 alphanumeric rating categories:9
8 See Moody’s Special Comment: “Corporate Default and Recovery Rates, 1920-2011,” February 2012 9 See Moody’s Special Comment: “Corporate Default and Recovery Rates, 1920-2011,” February 2012
0.0%
0.2%
0.4%
0.6%
0.8%
1.0%
1.2%
1.4%
1.6%
1.8%
2.0%
1 2 3 4 5 6 7 8 9 10
Mar
gina
l ann
ual d
efau
lt ra
tes
Years
World OECD Europe Moody's AMoody's Baa Moody's Baa3 Moody's Ba1
INFRASTRUCTURE
7 OCTOBER 18, 2013
SPECIAL COMMENT: DEFAULT AND RECOVERY RATES FOR PROJECT FINANCE BANK LOANS, 1983–2011 ADDENDUM
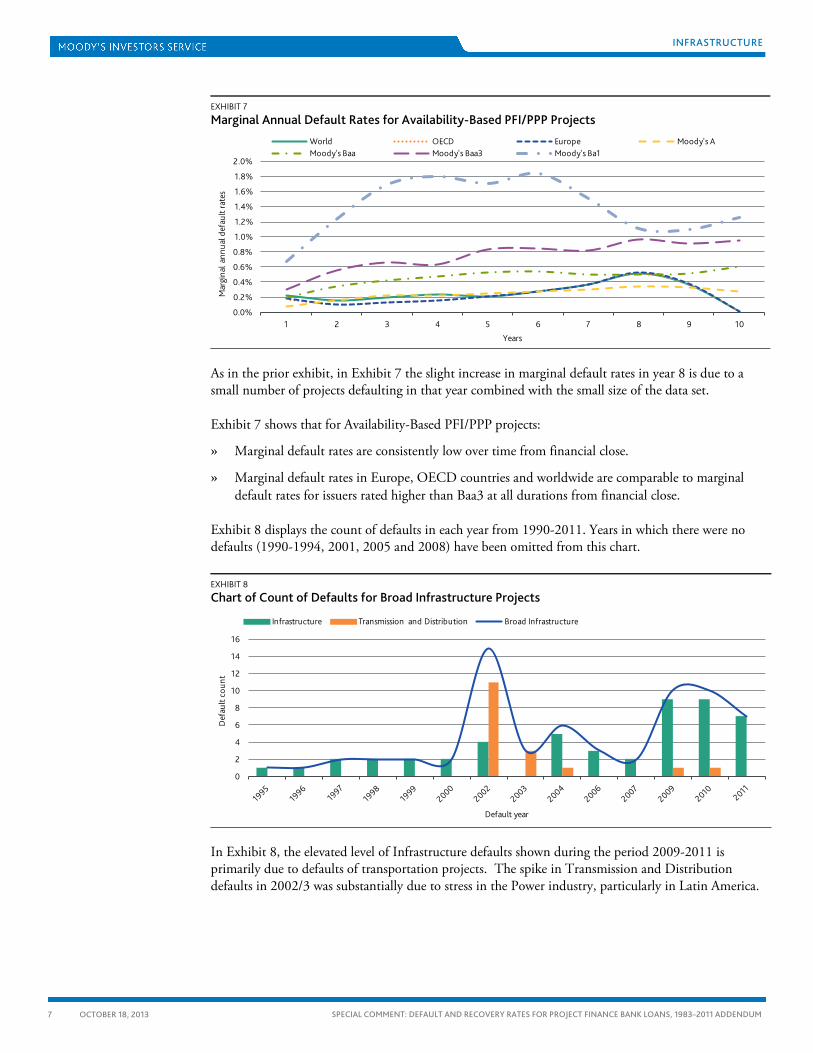
EXHIBIT 7
Marginal Annual Default Rates for Availability-Based PFI/PPP Projects
As in the prior exhibit, in Exhibit 7 the slight increase in marginal default rates in year 8 is due to a small number of projects defaulting in that year combined with the small size of the data set.
Exhibit 7 shows that for Availability-Based PFI/PPP projects:
» Marginal default rates are consistently low over time from financial close.
» Marginal default rates in Europe, OECD countries and worldwide are comparable to marginal default rates for issuers rated higher than Baa3 at all durations from financial close.
Exhibit 8 displays the count of defaults in each year from 1990-2011. Years in which there were no defaults (1990-1994, 2001, 2005 and 2008) have been omitted from this chart.
EXHIBIT 8
Chart of Count of Defaults for Broad Infrastructure Projects
In Exhibit 8, the elevated level of Infrastructure defaults shown during the period 2009-2011 is primarily due to defaults of transportation projects. The spike in Transmission and Distribution defaults in 2002/3 was substantially due to stress in the Power industry, particularly in Latin America.
0.0%
0.2%
0.4%
0.6%
0.8%
1.0%
1.2%
1.4%
1.6%
1.8%
2.0%
1 2 3 4 5 6 7 8 9 10
Mar
gina
l ann
ual d
efau
lt ra
tes
Years
World OECD Europe Moody's AMoody's Baa Moody's Baa3 Moody's Ba1
0
2
4
6
8
10
12
14
16
Def
ault
coun
t
Default year
Infrastructure Transmission and Distribution Broad Infrastructure

INFRASTRUCTURE
8 OCTOBER 18, 2013
SPECIAL COMMENT: DEFAULT AND RECOVERY RATES FOR PROJECT FINANCE BANK LOANS, 1983–2011 ADDENDUM
Exhibit 9 displays the percentage of projects that defaulted in each year.
EXHIBIT 9
Percentage of Broad Infrastructure Defaults by Year
Broad Infrastructure PFI/PPP Availability-Based Availability-Based PFI/PPP
Default year World
(note 1) OECD
(note 2) Europe
(note 3) World
(note 1) OECD
(note 2) Europe
(note 3) World
(note 1) OECD
(note 2) Europe
(note 3) World
(note 1) OECD
(note 2) Europe
(note 3)
1987 0.00% 0.00% 0.00% 0.00% 0.00% 0.00% 0.00% 0.00% 0.00% 0.00% 0.00% 0.00%
1988 0.00% 0.00% 0.00% 0.00% 0.00% 0.00% 0.00% 0.00% 0.00% 0.00% 0.00% 0.00%
1989 0.00% 0.00% 0.00% 0.00% 0.00% 0.00% 0.00% 0.00% 0.00% 0.00% 0.00% 0.00%
1990 0.00% 0.00% 0.00% 0.00% 0.00% 0.00% 0.00% 0.00% 0.00% 0.00% 0.00% 0.00%
1991 0.00% 0.00% 0.00% 0.00% 0.00% 0.00% 0.00% 0.00% 0.00% 0.00% 0.00% 0.00%
1992 0.00% 0.00% 0.00% 0.00% 0.00% 0.00% 0.00% 0.00% 0.00% 0.00% 0.00% 0.00%
1993 0.00% 0.00% 0.00% 0.00% 0.00% 0.00% 0.00% 0.00% 0.00% 0.00% 0.00% 0.00%
1994 0.00% 0.00% 0.00% 0.00% 0.00% 0.00% 0.00% 0.00% 0.00% 0.00% 0.00% 0.00%
1995 2.60% 2.60% 5.60% 7.70% 10.00% 20.00% 0.00% 0.00% 0.00% 0.00% 0.00% 0.00%
1996 2.20% 2.20% 0.00% 0.00% 0.00% 0.00% 0.00% 0.00% 0.00% 0.00% 0.00% 0.00%
1997 3.00% 3.00% 5.60% 3.80% 4.50% 6.30% 0.00% 0.00% 0.00% 0.00% 0.00% 0.00%
1998 2.20% 2.20% 2.30% 3.10% 0.00% 0.00% 5.60% 0.00% 0.00% 8.30% 0.00% 0.00%
1999 1.30% 1.30% 1.40% 0.00% 0.00% 0.00% 0.00% 0.00% 0.00% 0.00% 0.00% 0.00%
2000 1.00% 1.00% 0.00% 0.00% 0.00% 0.00% 0.00% 0.00% 0.00% 0.00% 0.00% 0.00%
2001 0.00% 0.00% 0.00% 0.00% 0.00% 0.00% 0.00% 0.00% 0.00% 0.00% 0.00% 0.00%
2002 5.10% 5.10% 0.00% 0.60% 0.00% 0.00% 0.00% 0.00% 0.00% 0.00% 0.00% 0.00%
2003 0.90% 0.90% 0.00% 0.00% 0.00% 0.00% 0.00% 0.00% 0.00% 0.00% 0.00% 0.00%
2004 1.60% 1.60% 1.70% 1.20% 1.20% 1.30% 1.40% 1.50% 1.50% 1.60% 1.70% 1.70%
2005 0.00% 0.00% 0.00% 0.00% 0.00% 0.00% 0.00% 0.00% 0.00% 0.00% 0.00% 0.00%
2006 0.60% 0.60% 0.20% 0.80% 0.80% 0.30% 0.00% 0.00% 0.00% 0.00% 0.00% 0.00%
2007 0.30% 0.30% 0.40% 0.50% 0.50% 0.50% 0.00% 0.00% 0.00% 0.00% 0.00% 0.00%
2008 0.00% 0.00% 0.00% 0.00% 0.00% 0.00% 0.00% 0.00% 0.00% 0.00% 0.00% 0.00%
2009 1.20% 1.20% 1.00% 1.00% 1.00% 0.90% 0.60% 0.60% 0.60% 0.60% 0.60% 0.60%
2010 1.10% 1.10% 0.60% 0.60% 0.70% 0.20% 0.00% 0.00% 0.00% 0.00% 0.00% 0.00%
2011 0.80% 0.80% 0.70% 0.30% 0.20% 0.20% 0.00% 0.00% 0.00% 0.00% 0.00% 0.00%
Notes: (1) World – projects located worldwide. (2) OECD – projects located in OECD countries. A list of the OECD countries can be found in the Glossary in Appendix I. (3) Europe – projects located in the European Economic Area (“EEA”). A list of the EEA countries can be found in the Glossary in Appendix I.
Exhibit 10 compares average ultimate recovery rates for Broad Infrastructure projects segmented by project type and by region. For comparison purposes, we have included average ultimate recovery rate data derived from Moody’s published research on default and recovery rates for corporate bonds and loans. 10
Caveat: The average ultimate recovery rates noted below for Availability-Based projects and for Availability-Based PFI/PPP projects should be interpreted with caution since the number of defaults for each is relatively small.
10 See Moody’s Special Comment: “Corporate Default and Recovery Rates, 1920-2011,” February 2012

INFRASTRUCTURE
9 OCTOBER 18, 2013
SPECIAL COMMENT: DEFAULT AND RECOVERY RATES FOR PROJECT FINANCE BANK LOANS, 1983–2011 ADDENDUM
EXHIBIT 10
Comparison of Average Ultimate Recovery Rates for Broad Infrastructure Projects
Average Recovery Standard Deviation
All Corporate Loans 68.4% 31.8%
Corporate Senior Secured Loans 80.3% 30.6%
Broad Infrastructure
World (note 1) 84.3% 21.2%
OECD (note 2) 88.2% 21.7%
Europe (note 3) 91.0% 21.5%
PFI/PPP
World (note 1) 83.9% 24.3%
OECD (note 2) 85.4% 25.0%
Europe (note 3) 85.9% 26.2%
Availability-Based
World (note 1) 83.2% 15.9%
OECD (note 2) 90.5% 13.4%
Europe (note 3) 90.5% 13.4%
Availability-Based PFI/PPP
World (note 1) 83.2% 15.9%
OECD (note 2) 90.5% 13.4%
Europe (note 3) 90.5% 13.4%
Notes: (1) World – projects located worldwide. (2) OECD –projects located in OECD countries. A list of the OECD countries can be found in the Glossary in Appendix I. (3) Europe – projects located in the European Economic Area (“EEA”). A list of the EEA countries can be found in the Glossary in Appendix I.
Exhibit 11 charts the information in Exhibit 10
EXHIBIT 11
Variability of Ultimate Recovery Rates
Average Recovery ±1 standard deviation (capped at 100%)
INFRASTRUCTURE
10 OCTOBER 18, 2013
SPECIAL COMMENT: DEFAULT AND RECOVERY RATES FOR PROJECT FINANCE BANK LOANS, 1983–2011 ADDENDUM
The Availability-Based and Availability-Based PFI/PPP projects experienced higher average ultimate recoveries with lower volatility, when compared with the corporate loan data set as well as Broad Infrastructure.

INFRASTRUCTURE
11 OCTOBER 18, 2013
SPECIAL COMMENT: DEFAULT AND RECOVERY RATES FOR PROJECT FINANCE BANK LOANS, 1983–2011 ADDENDUM
Appendix I: Glossary
Availability-Based The term “Availability-Based” refers to a project that earns the majority of its revenue from an availability-based payment stream for operating and maintaining an asset in accordance with contracted levels of performance, and hence the project’s revenue stream is not materially exposed to volume/traffic risk or price risk. This Addendum reports on Availability-Based projects, and Availability-Based PFI/PPP projects within Broad Infrastructure.
Broad Infrastructure “Broad Infrastructure” comprises those projects categorized as Infrastructure projects in the Study, to which we have added Power Transmission and Distribution projects from the Study Data Set.
European Economic Area The European Economic Area (EEA) unites the EU Member States and the three EEA EFTA States (Iceland, Liechtenstein and Norway) Additional information can be found on the following website: http://www.efta.int/eea EU Member States include: Austria, Belgium, Bulgaria, Croatia, Cyprus, Czech Republic, Denmark, Estonia, Finland, France, Germany, Greece, Hungary, Ireland, Italy, Latvia, Lithuania, Luxembourg, Malta, Netherlands, Poland, Portugal, Romania, Slovakia, Slovenia, Spain, Sweden and the United Kingdom. Additional information can be found on the following website: http://europa.eu/about-eu/countries/
OECD Organization for Economic Co-operation and Development. There are currently 34 OECD member countries: Australia, Austria, Belgium, Canada, Chile, the Czech Republic, Denmark, Estonia, Finland, France, Germany, Greece, Hungary, Iceland, Ireland, Israel, Italy, Japan, Korea, Luxembourg, Mexico, the Netherlands, New Zealand, Norway, Poland, Portugal, the Slovak Republic, Slovenia, Spain, Sweden, Switzerland, Turkey, the United Kingdom and the United States.
PFI A public sector procurement structured under the UK Government’s Private Finance Initiative. This Addendum reports on PFI/PPP projects within Broad Infrastructure.
Project Finance We reproduce below the Basel II definition of Project Finance: 218 In general, a corporate exposure is defined as a debt obligation of a corporation, partnership, or proprietorship. Banks are
permitted to distinguish separately exposures to small- and medium-sized entities (SME), as defined in paragraph 273. 219 Within the corporate asset class, five sub-classes of specialized lending (SL) are identified. Such lending possesses all the
following characteristics, either in legal form or economic substance: » The exposure is typically to an entity (often a special purpose entity (SPE)) which was created specifically to finance
and/or operate physical assets; » The borrowing entity has little or no other material assets or activities, and therefore little or no independent capacity to
repay the obligation, apart from the income that it receives from the asset(s) being financed; » The terms of the obligation give the lender a substantial degree of control over the asset(s) and the income that it
generates; and » As a result of the preceding factors, the primary source of repayment of the obligation is the income generated by the
asset(s), rather than the independent capacity of a broader commercial enterprise. 220. The five sub-classes of specialized lending are project finance, object finance, commodities finance, income-producing real
estate, and high-volatility commercial real estate. Each of these sub-classes is defined below. Project finance 221. Project finance (PF) is a method of funding in which the lender looks primarily to the revenues generated by a single project,
both as the source of repayment and as security for the exposure. This type of financing is usually for large, complex and expensive installations that might include, for example, power plants, chemical processing plants, mines, transportation infrastructure, environment, and telecommunications infrastructure. Project finance may take the form of financing of the construction of a new capital installation, or refinancing of an existing installation, with or without improvements.
222. In such transactions, the lender is usually paid solely or almost exclusively out of the money generated by the contracts for the facility’s output, such as the electricity sold by a power plant. The borrower is usually an SPE that is not permitted to perform any function other than developing, owning, and operating the installation. The consequence is that repayment depends primarily on the project’s cash flow and on the collateral value of the project’s assets. In contrast, if repayment of the exposure depends primarily on a well established, diversified, credit-worthy, contractually obligated end user for repayment, it is considered a secured exposure to that end-user....”
PPP A public sector procurement structured as a Public Private Partnership. This Addendum reports on PFI/PPP projects within Broad Infrastructure.

INFRASTRUCTURE
12 OCTOBER 18, 2013
SPECIAL COMMENT: DEFAULT AND RECOVERY RATES FOR PROJECT FINANCE BANK LOANS, 1983–2011 ADDENDUM
Moody’s Related Research
Special Comments:
» Default and Recovery Rates for Project Finance Bank Loans, 1983–2011, February 2013 (149603)
» Corporate Default and Recovery Rates, 1920-2011, February 2012 (140015)
» Infrastructure Default and Recovery Rates, 1983-2012H1, December 2012 (146791)
To access any of these reports, click on the entry above. Note that these references are current as of the date of publication of this report and that more recent reports may be available. All research may not be available to all clients.
Acknowledgement
Moody's wishes to acknowledge and thank each of the banks in the Bank Group for supporting and contributing to this Addendum to the Study.
INFRASTRUCTURE
13 OCTOBER 18, 2013
SPECIAL COMMENT: DEFAULT AND RECOVERY RATES FOR PROJECT FINANCE BANK LOANS, 1983–2011 ADDENDUM
Report Number: 158288
Authors Andrew Davison Kevin Kelhoffer
Senior Production Associate Ginger Kipps
© 2013 Moody’s Investors Service, Inc. and/or its licensors and affiliates (collectively, “MOODY’S”). All rights reserved.
CREDIT RATINGS ISSUED BY MOODY'S INVESTORS SERVICE, INC. (“MIS”) AND ITS AFFILIATES ARE MOODY’S CURRENT OPINIONS OF THE RELATIVE FUTURE CREDIT RISK OF ENTITIES, CREDIT COMMITMENTS, OR DEBT OR DEBT-LIKE SECURITIES, AND CREDIT RATINGS AND RESEARCH PUBLICATIONS PUBLISHED BY MOODY’S (“MOODY’S PUBLICATIONS”) MAY INCLUDE MOODY’S CURRENT OPINIONS OF THE RELATIVE FUTURE CREDIT RISK OF ENTITIES, CREDIT COMMITMENTS, OR DEBT OR DEBT-LIKE SECURITIES. MOODY’S DEFINES CREDIT RISK AS THE RISK THAT AN ENTITY MAY NOT MEET ITS CONTRACTUAL, FINANCIAL OBLIGATIONS AS THEY COME DUE AND ANY ESTIMATED FINANCIAL LOSS IN THE EVENT OF DEFAULT. CREDIT RATINGS DO NOT ADDRESS ANY OTHER RISK, INCLUDING BUT NOT LIMITED TO: LIQUIDITY RISK, MARKET VALUE RISK, OR PRICE VOLATILITY. CREDIT RATINGS AND MOODY’S OPINIONS INCLUDED IN MOODY’S PUBLICATIONS ARE NOT STATEMENTS OF CURRENT OR HISTORICAL FACT. CREDIT RATINGS AND MOODY’S PUBLICATIONS DO NOT CONSTITUTE OR PROVIDE INVESTMENT OR FINANCIAL ADVICE, AND CREDIT RATINGS AND MOODY’S PUBLICATIONS ARE NOT AND DO NOT PROVIDE RECOMMENDATIONS TO PURCHASE, SELL, OR HOLD PARTICULAR SECURITIES. NEITHER CREDIT RATINGS NOR MOODY’S PUBLICATIONS COMMENT ON THE SUITABILITY OF AN INVESTMENT FOR ANY PARTICULAR INVESTOR. MOODY’S ISSUES ITS CREDIT RATINGS AND PUBLISHES MOODY’S PUBLICATIONS WITH THE EXPECTATION AND UNDERSTANDING THAT EACH INVESTOR WILL MAKE ITS OWN STUDY AND EVALUATION OF EACH SECURITY THAT IS UNDER CONSIDERATION FOR PURCHASE, HOLDING, OR SALE.
ALL INFORMATION CONTAINED HEREIN IS PROTECTED BY LAW, INCLUDING BUT NOT LIMITED TO, COPYRIGHT LAW, AND NONE OF SUCH INFORMATION MAY BE COPIED OR OTHERWISE REPRODUCED, REPACKAGED, FURTHER TRANSMITTED, TRANSFERRED, DISSEMINATED, REDISTRIBUTED OR RESOLD, OR STORED FOR SUBSEQUENT USE FOR ANY SUCH PURPOSE, IN WHOLE OR IN PART, IN ANY FORM OR MANNER OR BY ANY MEANS WHATSOEVER, BY ANY PERSON WITHOUT MOODY’S PRIOR WRITTEN CONSENT.
All information contained herein is obtained by MOODY’S from sources believed by it to be accurate and reliable. Because of the possibility of human or mechanical error as well as other factors, however, all information contained herein is provided “AS IS” without warranty of any kind. MOODY'S adopts all necessary measures so that the information it uses in assigning a credit rating is of sufficient quality and from sources MOODY'S considers to be reliable including, when appropriate, independent third-party sources. However, MOODY’S is not an auditor and cannot in every instance independently verify or validate information received in the rating process. Under no circumstances shall MOODY’S have any liability to any person or entity for (a) any loss or damage in whole or in part caused by, resulting from, or relating to, any error (negligent or otherwise) or other circumstance or contingency within or outside the control of MOODY’S or any of its directors, officers, employees or agents in connection with the procurement, collection, compilation, analysis, interpretation, communication, publication or delivery of any such information, or (b) any direct, indirect, special, consequential, compensatory or incidental damages whatsoever (including without limitation, lost profits), even if MOODY’S is advised in advance of the possibility of such damages, resulting from the use of or inability to use, any such information. The ratings, financial reporting analysis, projections, and other observations, if any, constituting part of the information contained herein are, and must be construed solely as, statements of opinion and not statements of fact or recommendations to purchase, sell or hold any securities. Each user of the information contained herein must make its own study and evaluation of each security it may consider purchasing, holding or selling.
NO WARRANTY, EXPRESS OR IMPLIED, AS TO THE ACCURACY, TIMELINESS, COMPLETENESS, MERCHANTABILITY OR FITNESS FOR ANY PARTICULAR PURPOSE OF ANY SUCH RATING OR OTHER OPINION OR INFORMATION IS GIVEN OR MADE BY MOODY’S IN ANY FORM OR MANNER WHATSOEVER.
MIS, a wholly-owned credit rating agency subsidiary of Moody’s Corporation (“MCO”), hereby discloses that most issuers of debt securities (including corporate and municipal bonds, debentures, notes and commercial paper) and preferred stock rated by MIS have, prior to assignment of any rating, agreed to pay to MIS for appraisal and rating services rendered by it fees ranging from $1,500 to approximately $2,500,000. MCO and MIS also maintain policies and procedures to address the independence of MIS’s ratings and rating processes. Information regarding certain affiliations that may exist between directors of MCO and rated entities, and between entities who hold ratings from MIS and have also publicly reported to the SEC an ownership interest in MCO of more than 5%, is posted annually at www.moodys.com under the heading “Shareholder Relations — Corporate Governance — Director and Shareholder Affiliation Policy.”
For Australia only: Any publication into Australia of this document is pursuant to the Australian Financial Services License of MOODY’S affiliate, Moody’s Investors Service Pty Limited ABN 61 003 399 657AFSL 336969 and/or Moody’s Analytics Australia Pty Ltd ABN 94 105 136 972 AFSL 383569 (as applicable). This document is intended to be provided only to “wholesale clients” within the meaning of section 761G of the Corporations Act 2001. By continuing to access this document from within Australia, you represent to MOODY’S that you are, or are accessing the document as a representative of, a “wholesale client” and that neither you nor the entity you represent will directly or indirectly disseminate this document or its contents to “retail clients” within the meaning of section 761G of the Corporations Act 2001. MOODY’S credit rating is an opinion as to the creditworthiness of a debt obligation of the issuer, not on the equity securities of the issuer or any form of security that is available to retail clients. It would be dangerous for retail clients to make any investment decision based on MOODY’S credit rating. If in doubt you should contact your financial or other professional adviser.