Embed Size (px)
Citation preview
Accepted Manuscript
Defect structure and hardness in nanocrystalline CoCrFeMnNi High-Entropy Alloyprocessed by High-Pressure Torsion
Anita Heczel, Megumi Kawasaki, János L. Lábár, Jae-il Jang, Terence G. Langdon,Jenő Gubicza
PII: S0925-8388(17)31165-9
DOI: 10.1016/j.jallcom.2017.03.352
Reference: JALCOM 41390
To appear in: Journal of Alloys and Compounds
Received Date: 18 November 2016
Revised Date: 30 March 2017
Accepted Date: 31 March 2017
Please cite this article as: A. Heczel, M. Kawasaki, J.L. Lábár, J.-i. Jang, T.G. Langdon, J. Gubicza,Defect structure and hardness in nanocrystalline CoCrFeMnNi High-Entropy Alloy processed by High-Pressure Torsion, Journal of Alloys and Compounds (2017), doi: 10.1016/j.jallcom.2017.03.352.
This is a PDF file of an unedited manuscript that has been accepted for publication. As a service toour customers we are providing this early version of the manuscript. The manuscript will undergocopyediting, typesetting, and review of the resulting proof before it is published in its final form. Pleasenote that during the production process errors may be discovered which could affect the content, and alllegal disclaimers that apply to the journal pertain.

MANUSCRIP
T
ACCEPTED
ACCEPTED MANUSCRIPT
1
Defect structure and hardness in nanocrystalline CoCrFeMnNi High-Entropy Alloy
processed by High-Pressure Torsion
Anita Heczel1, Megumi Kawasaki2,3, János L. Lábár1,4, Jae-il Jang2, Terence G. Langdon3,5,
Jenő Gubicza1*
1Department of Materials Physics, Eötvös Loránd University, Budapest, Hungary
2Division of Materials Science and Engineering, Hanyang University, Seoul, Republic of Korea
3 Departments of Aerospace & Mechanical Engineering and Materials Science, University of Southern California, Los Angeles, CA 90089-1453, U.S.A.
4Institute for Technical Physics and Materials Science, Centre for Energy Research, Hungarian Academy of Sciences, Budapest, Hungary
5Materials Research Group, Faculty of Engineering and the Environment, University of Southampton, Southampton SO17 1BJ, U.K.
*Corresponding author: Tel: + 36-1-372-2876, Fax: +36-1-372-2811,
e-mail: [email protected]
Abstract
An equiatomic CoCrFeMnNi High-Entropy Alloy (HEA) produced by arc melting was
processed by High-Pressure Torsion (HPT). The evolution of the microstructure during HPT
was investigated after ¼, ½, 1 and 2 turns using electron backscatter diffraction and
transmission electron microscopy. The spatial distribution of constituents was studied by
energy-dispersive X-ray spectroscopy. The dislocation density and the twin-fault probability
in the HPT-processed samples were determined by X-ray line profiles analysis. It was found
that the grain size was gradually refined from ~60 µm to ~30 nm while the dislocation density
and the twin-fault probability increased to very high values of about 194 × 1014 m−2 and 2.7%,
respectively, at the periphery of the disk processed for 2 turns. The hardness evolution was
measured as a function of the distance from the center of the HPT-processed disks. After 2
turns of HPT, the microhardness increased from ~1440 MPa to ~5380 MPa at the disk
periphery where the highest straining is achieved. The yield strength was estimated as one-
third of the hardness and correlated to the microstructure.
Keywords: High-Entropy Alloy, High-Pressure Torsion, X-ray Diffraction, Dislocations,
Twin faults, Hardness

MANUSCRIP
T
ACCEPTED
ACCEPTED MANUSCRIPT
2
1. Introduction
Conventional solid solutions are generally based on one principle element and other alloying
atoms are added only in small concentrations for the improvement of properties. In the last
decade, a new type of alloy concept, known as high entropy alloys (HEAs), was proposed
[1,2]. HEAs are disordered solid solutions, containing five or more principal elements in
equal or near-equal atomic ratios, in which all the atomic concentrations are between 5% and
35%. The configurational entropy of a disordered solid solution is maximized by mixing a
large number of alloying elements at near-equimolar concentrations and the high entropy of
mixing stabilizes the disordered solid solution phases. These alloys are currently a focus of
materials science due to their outstanding properties, such as high hardness and strength, good
resistance to thermal softening, oxidation, wear and corrosion [1-6]. The high strength of
HEA materials is caused by the strong resistance of the disordered crystal lattice to
dislocation motion [7]. Therefore, a very high yield strength can be observed even for HEAs
with large grain sizes [7]. It was shown that during plastic deformation (e.g., in uniaxial
compression or impact loading) of HEAs at room-temperature, a large density of dislocations
is formed which gives an additional contribution to hardening in agreement with the well-
known Taylor formula [7,8]. Therefore, plastic deformation at high strains may improve the
strength of HEAs considerably.
Severe plastic deformation (SPD) is an effective tool for increasing the strength of
materials [9,10]. During SPD processing both grain refinement and an increase in dislocation
density may contribute to hardening. High-pressure torsion (HPT) is one of the most effective
SPD techniques for achieving high strength in structural materials [11]. HPT processing is
expected to yield an additional improvement in hardness of HEAs. Indeed, HPT-straining for
a face-centered cubic (fcc) CoCrFeNiMn HEA resulted in an improvement in hardness due to
the reduction of grain size into the nanocrystalline regime [12]. In an Al0.3Cu0.5CoCrFeNi
HEA, HPT processing led to both significant grain refinement to about 50 nm and
homogenization of the elemental distribution [13]. It should be noted that annealing at
appropriate temperatures after HPT may yield additional hardening due to the formation of
secondary phase particles, as with an ordered body-centered cubic phase in fcc Al0.3CoCrFeNi
HEA [14].
One of the most frequently studied HEAs has the composition of CoCrFeNiMn. The
crystal structure and the mechanical properties of this alloy have been studied intensively [15-
19]. However, the evolution of the lattice defects, such as dislocations or twin-faults, during
HPT and their influence on the mechanical behaviour have not been investigated. In the
MANUSCRIP
T
ACCEPTED
ACCEPTED MANUSCRIPT
3
present work, the effect of HPT processing on the microstructure and the hardness of an
equimolar CoCrFeMnNi HEA material was investigated. The evolution of the grain size, the
dislocation density and the twin-fault probability was determined at the center and the
periphery of the disks processed by HPT up to 2 turns. The detailed characterization of the
lattice defect structure was carried out with a combination of X-ray line profile analysis
(XLPA), electron backscatter diffraction (EBSD) and transmission electron microscopy
(TEM). The hardness was determined as a function of both distance from the center of the
HPT disk and numbers of turns. The relationship between the hardness and the microstructure
for the HPT-processed equimolar CoCrFeMnNi HEA is discussed in detail.
2. Material and experimental procedures
2.1. Sample processing
A HEA material with the composition of Co20Cr20Fe20Mn20Ni20 (in at.%) was prepared by
arc-melting of a mixture of pure metals (purity > 99 wt.%) in a Ti-gettered high-purity Ar
atmosphere. The ingots were remelted at least four times to promote chemical homogeneity.
The melted alloys were then drop-cast into a mold with dimensions of 10 mm × 10 mm × 60
mm. The as-cast samples (disks having a diameter of ~10 mm and a thickness of ~0.8 mm)
were subjected to HPT at room temperature (RT) under quasi-constrained conditions [20]
using a rate of 1 rpm under a pressure of 3.0 GPa. The applied numbers of turns were 1/4, 1/2,
1 and 2.
2.2. Electron microscopy
The microstructure was studied in the initial as-cast sample as well as at the center and the
periphery of the HPT processed disks where the imposed strain values were the lowest and the
highest, respectively, for any given turn. The evolution of the microstructure was investigated
by electron backscatter diffraction (EBSD) using an FEI Quanta 3D scanning electron
microscope (SEM). The step size varied between 25 and 250 nm depending on the dimensions
of the images. Before the EBSD investigation the surface was mechanically polished with
1200, 2500 and 4000 grit SiC abrasive papers and then the polishing was continued with a
colloidal silica suspension (OP-S) with a particle size of 40 nm. Finally, the surface was
electropolished at 25 V and 1 A using an electrolyte with a composition of 70% ethanol, 20%
glycerine and 10% perchloric acid (in vol.%). At the periphery of the disks processed for 1/2,
1 and 2 turns, EBSD was not capable of evaluating the strongly refined and distorted
microstructure. Therefore, transmission electron microscopy (TEM) investigations were

MANUSCRIP
T
ACCEPTED
ACCEPTED MANUSCRIPT
4
applied for the determination of the grain size at the disk peripheries for 1/2, 1 and 2
revolutions. The TEM foils were thinned first by mechanical grinding to a thickness of 50 µm
and then they were ion milled using an Ar ion beam at an inclination angle of 5° until
perforation. The ion milling was conducted at 7 keV and 2 mA with continuous cooling of the
sample by liquid nitrogen. The TEM images were taken using a Philips CM-20 transmission
electron microscope operating at 200 kV. The twin faults inside the nanocrystals formed due
to HPT were studied with a higher magnification using a JEOL-3010 transmission electron
microscope operating at 300 kV. The TEM pictures were detected by a GATAN Orius CCD
camera using Digital Micrograph software. The spatial distribution of the chemical elements
was measured by energy-dispersive X-ray spectroscopy (EDS) in SEM.
2.3. X-ray diffraction
The average lattice parameter for the HEA samples was investigated by X-ray diffraction
(XRD) using a Philips Xpert Θ–2Θ powder diffractometer operating at 40 kV and 30 mA with
CuKα radiation (wavelength: λ = 0.15418 nm). The measured XRD patterns indicate that all
the studied samples have face-centered cubic (fcc) structure. The average lattice parameter
was determined from the diffraction peak positions using the Nelson–Riley method [21].
The lattice defect structure in the center and the peripheral parts of the HPT-processed
disks was studied by X-ray line profile analysis (XLPA). The X-ray line profiles were
measured using a high-resolution diffractometer with CoKα1 radiation (wavelength: λ =
0.1789 nm). Two-dimensional imaging plates detected the Debye–Scherrer diffraction rings.
The diffraction profiles were evaluated by the Convolutional Multiple Whole Profile
(CMWP) method [22]. In this method, the diffraction pattern is fitted by the sum of a
background spline and the convolution of the instrumental pattern and the theoretical line
profiles. The details of the measurement of the instrumental pattern and its significance in the
XLPA evaluation are discussed in section 3.3. The CMWP method gives the diffraction
domain size, the dislocation density and the twin fault probability with good statistics, where
the twin fault probability in fcc materials is defined as the relative fraction of twin boundaries
among the {111} lattice planes. The area-weighted mean diffraction domain size (<x>area),
the dislocation density (ρ) and the twin fault probability (β) were obtained from the fitting.
The <x>area was calculated from the median (m) and the log-normal variance (σ2) of the
diffraction domain size distribution as: <x>area = m exp (2.5 σ2). It is noted that the size of the
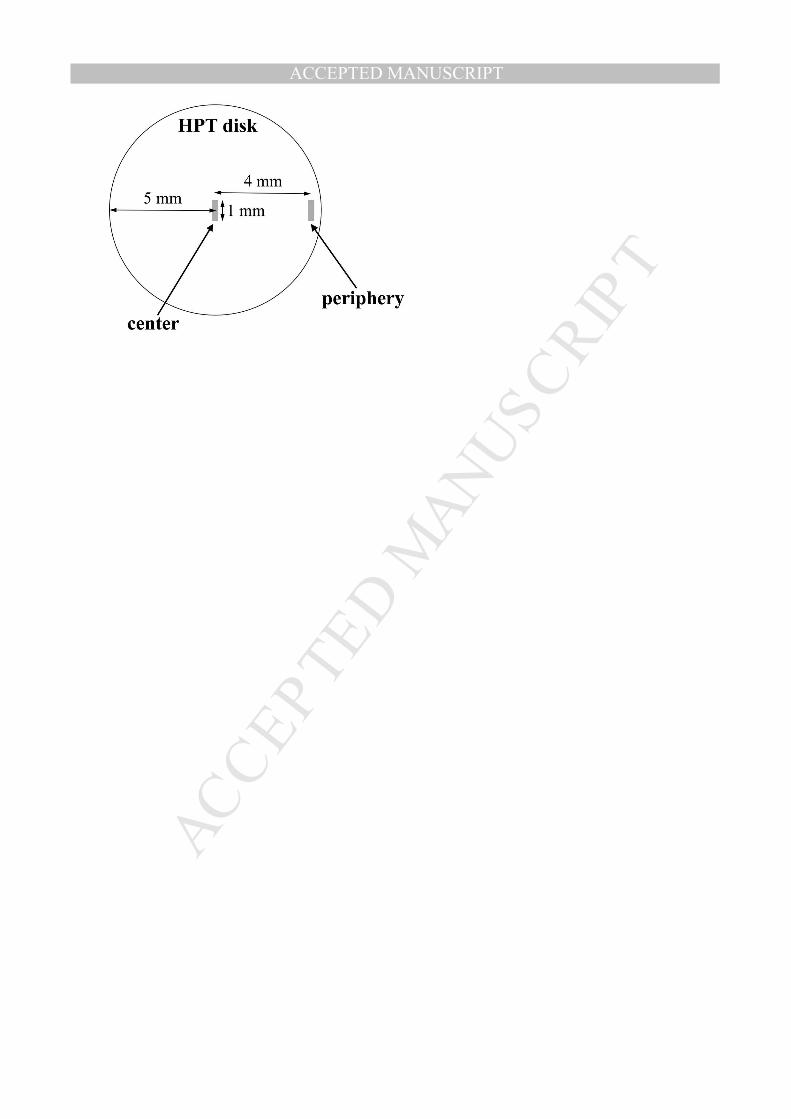
X-ray beam spot on the sample surface was about 1 × 0.3 mm2, as shown in Fig. 1. Therefore,
the results obtained in the disk center should be considered as an average for distances from

MANUSCRIP
T
ACCEPTED
ACCEPTED MANUSCRIPT
5
the center between -0.5 and 0.5 mm. At the periphery, the XLPA measurement was carried
out at 1 mm from the edge and therefore at a distance of 4 mm from the disk center.
2.4. Hardness testing
The microhardness along the radius of the HPT disks was measured using a Zwick Roell ZHµ
Vickers indenter with an applied load of 500 g and a dwell time of 10 s. The spacing between
the neighbouring indents was 0.5 mm.
3. Results
3.1. Microstructure and elemental distribution in the as-cast material
The measured X-ray diffractograms indicated that the initial material is a single phase face-
centered cubic (fcc) structure with a lattice parameter of a = 0.3599 ± 0.0001 nm. Neither the
structure nor the lattice parameter changed during HPT. Figs. 2a and b show EBSD and back-
scattered electron (BSE) SEM images for the as-cast microstructure, respectively. In the
EBSD image, a preferred crystallographic orientation of the grains is not observed (see Fig.
2a). The grains were considered as the regions in the EBSD images bounded by high-angle
grain boundaries (HAGBs) with misorientations larger than 15°. In the initial sample, the
grain size values have a broad distribution between 10-250 µm with a number-weighted
average value of ~60 µm. The EDS analysis performed at different areas revealed that the
elemental fractions deviate slightly from the nominal equimolar chemical composition.
Namely, the atomic concentrations for Co, Cr, Fe, Mn and Ni are 20.1 ± 1.3, 20.9 ± 3.7, 20.4
± 3.0, 19.4 ± 4.5 and 19.3 ± 3.3 at.%, respectively, as measured on twenty five randomly
selected areas in the initial sample. The uncertainties of the values were calculated from the
differences in the concentrations obtained on the various areas. The BSE images in Figs. 2b
and c reveal a dendritic-like microstructure in the initial sample. The fractions of the five
constituents in the as-cast CoCrFeMnNi were determined along the white dotted line
(perpendicular to the dendritic arms) in Fig. 2c by EDS and the results are shown in Fig. 2d.
An inhomogeneous spatial distribution of the five chemical elements with a periodicity of ~8
µm is revealed. The atomic concentrations of Co, Cr and Fe vary in a complementary manner
with the Ni and Mn contents. Thus, where the Co, Cr and Fe concentrations increase to 22-23
at.%, the Ni and Mn fractions decrease to 16-18 at.%. The largest concentration fluctuations
were observed for Fe and Mn. This result is in accordance with former studies (e.g., [23])
which showed that the dendritic areas in an as-cast CoCrFeMnNi HEA are enriched in Co, Cr
and Fe and depleted of Ni and Mn.

MANUSCRIP
T
ACCEPTED
ACCEPTED MANUSCRIPT
6
3.2. Evolution of the microstructure and the elemental distribution during HPT
Figs. 3a, b and c show the microstructures at the center, half radius and periphery of the HPT
disk processed for 1/4 revolution. The number-weighted average grain size was measured as
~33 µm in the center of the disk which is smaller by a factor of two than in the as-cast
specimen (see Fig. 3a). The microstructure at the half-radius was studied only for this sample
as previous investigations on CoCrFeMnNi HEA suggested that significant twinning occurs
in this material even at small shear strains (above the shear strain of 0.5 [15]). Indeed, Fig. 3b
reveals considerable twinning at the half-radius of the sample processed for 1/4 turn. The
twins are indicated by white arrows in the figure. The average twin boundary spacing is about
1 µm. It is noted that the shear strain for the location shown in Fig. 3b is about 5.6 which is
much higher than the above mentioned critical shear strain for twinning in CoCrFeMnNi
HEA. Fig. 3c shows that the number-weighted average grain size was reduced to ~233 nm at
the periphery of the disk. The two orders of magnitude smaller grain size at the periphery
compared to the center in the disk processed by 1/4 turn indicates a very rapid grain
refinement in this HEA with increasing shear strain during HPT processing. The grain size
values obtained by microscopic methods are listed in Table 1.
Figs. 4a-c show EBSD images taken at the centers of the disks processed by HPT for
1/2, 1 and 2 turns, respectively. Table 1 reveals that between 1/4 and 1/2 turns the number-
weighted average grain size in the disk center decreased to about 19 µm. Between 1/2 and 1
turn, the grain size was refined from ~19 to ~4.8 µm in the center of the HPT-processed disks.
After 2 turns, the number-weighted average grain size decreased to ~3.7 µm in the disk
center. In addition to the grain refinement, twins were also formed inside the grains as
illustrated for 1 turn in Fig. 4d which was obtained by magnifying a part of Fig. 4b. The Σ3
boundaries in Fig. 4d are represented by thick black lines and some twinned regions are
indicated by white arrows. The mean spacing between the twin boundaries is ~3 µm, as
estimated from the EBSD images.
As already mentioned, due to the heavily distorted microstructure at the disk
peripheries for 1/2, 1 and 2 turns, the microstructures at these locations were investigated by
TEM. Figs. 5a, b and c show representative dark-field (DF) TEM images for the samples
processed by 1/2, 1 and 2 turns. The average grain sizes determined from the TEM images
MANUSCRIP
T
ACCEPTED
ACCEPTED MANUSCRIPT
7
were ~37, ~34 and ~27 nm for 1/2, 1 and 2 turns, respectively. About one hundred and fifty
grains were evaluated for the calculation of the average grain size.
The bright-field TEM images in Fig. 6 illustrate that twin faults with a high frequency
were formed inside the nanograins at the periphery of the disk processed by 1 turn of HPT.
Some nanotwinned lamellae are indicated by black arrows. The twin fault spacing varies
between 1 and 10 nm in the nanocrystals shown in Fig. 6. By comparison, in the center of the
same disk the twin boundary spacing was about ~3 µm as shown in Fig. 4d. This observation
suggests that, in addition to the decrease in grain size, the twin fault frequency was enhanced
significantly with increasing imposed strain in HPT processing.
The elemental distributions were also investigated in the center and the periphery of
the disks processed by the lowest (1/4) and the highest (2) numbers of HPT turns. The EDS
results are shown in Fig. 7. The inhomogeneous chemical element distribution in the initial
material was inherited in the HPT-processed samples (see Fig. 3). Due to HPT processing,
although the frequency of concentration oscillations decreased, the concentration differences
did not change considerably (compare Figs. 2d and 7d). Similar to the initial state, the atomic
concentrations of Co, Cr and Fe vary in a complementary way with the Ni and Mn contents
and the largest concentration fluctuations were observed for Fe and Mn.
3.3. Microstructure of the HPT-processed HEA samples from XLPA
The initial as-cast CoCrFeMnNi HEA exhibited broader X-ray diffraction peaks than the
profiles measured on a standard LaB6 standard material. Most probably, this broadening is
caused by the chemical inhomogeneities in the present as-cast HEA sample (see Fig. 2d). The
heterogeneous chemical composition yields a variation in the lattice spacings which leads to
an X-ray diffraction profile broadening even in the as-cast HEA sample before HPT. As
shown by the EDS analysis, the magnitude of the concentration fluctuations do not decrease
during HPT, therefore the chemical inhomogeneities alone would have caused similar
diffraction peak broadening for the HPT-processed samples as in the initial state. However, in
addition to this effect the peaks measured on the HPT disks broadened also due to the increase
of the lattice defect (e.g., dislocations and twin faults) density and the reduction of the
diffraction domain size. The diffraction peak caused by these effects can be referred to as the
microstructural profile. Since only moderate chemical heterogeneities were observed in the
present HEA samples, therefore it was assumed that the microstructure is not influenced by
the slightly different chemical compositions in the various volumes of the material. With this
condition, the microstructural X-ray diffraction profile components scattered from the
MANUSCRIP
T
ACCEPTED
ACCEPTED MANUSCRIPT
8
different regions with various concentrations have the same profile shape except that their
positions and intensities are different due to the various lattice spacings and volumes.
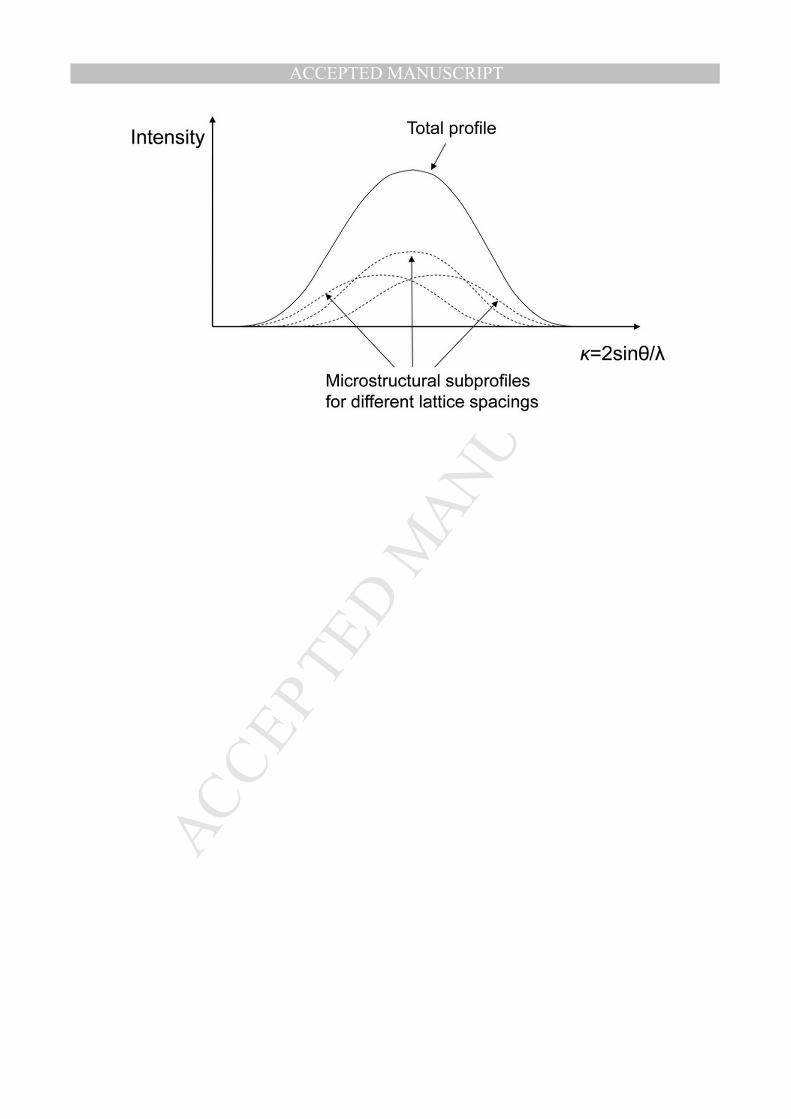
Fig. 8 shows schematically how these profile components build up the measured
diffraction peak. Accordingly, the total intensity profile (����) can be expressed as:
���� = �������� − ����, (1)
where � and g are the modulus of the scattering and diffraction vectors, respectively (� =
2���� �⁄ while � = 2����� �⁄ where � and �� are the scattering and Bragg angles,
respectively). ��� − �� are the subprofiles caused by the microstructure and normalized to
a unit peak intensity. ���� is the density distribution function of the diffraction vector caused
by the chemical heterogeneities which reflects the distribution of the lattice spacings (d) since
� = 1 �⁄ . According to eq. (1), the total intensity can be given as:
���� = ���� ∗ ����, (2)
where ∗ represents convolution. If the instrumental effect is also taken into account, the
diffraction peak profile can be obtained as:
���� = ����� ∗ ���� ∗ ����, (3)
where ����� is the instrumental profile. As the lattice defect density in the coarse-grained
initial as-cast material is negligible compared to the HPT-processed samples, the profiles
measured for the initial specimen (��������) gives ����� ∗ ����. Therefore, the total intensity
is expressed as:
���� = �������� ∗ ���� = �������� ∗ ���� ∗ ����� ∗ ������, (4)
where ���� , ����� and ������ are the intensity profiles for diffraction domain size,
dislocations and twin faults, respectively. In the XLPA evaluation of the HPT-processed
samples, the diffraction peaks were fitted by the convolution if the intensity profile measured
on the initial sample and the peak functions calculated theoretically for the effects of the
diffraction domain size, dislocations and twin faults. In this evaluation, it is assumed that HPT
processing does not produce a considerable reduction in the concentration fluctuations, in
accordance with the EDS measurements, so that the profile measured on the initial specimen
is also a good approximation for ����� ∗ ���� in the HPT-processed samples.
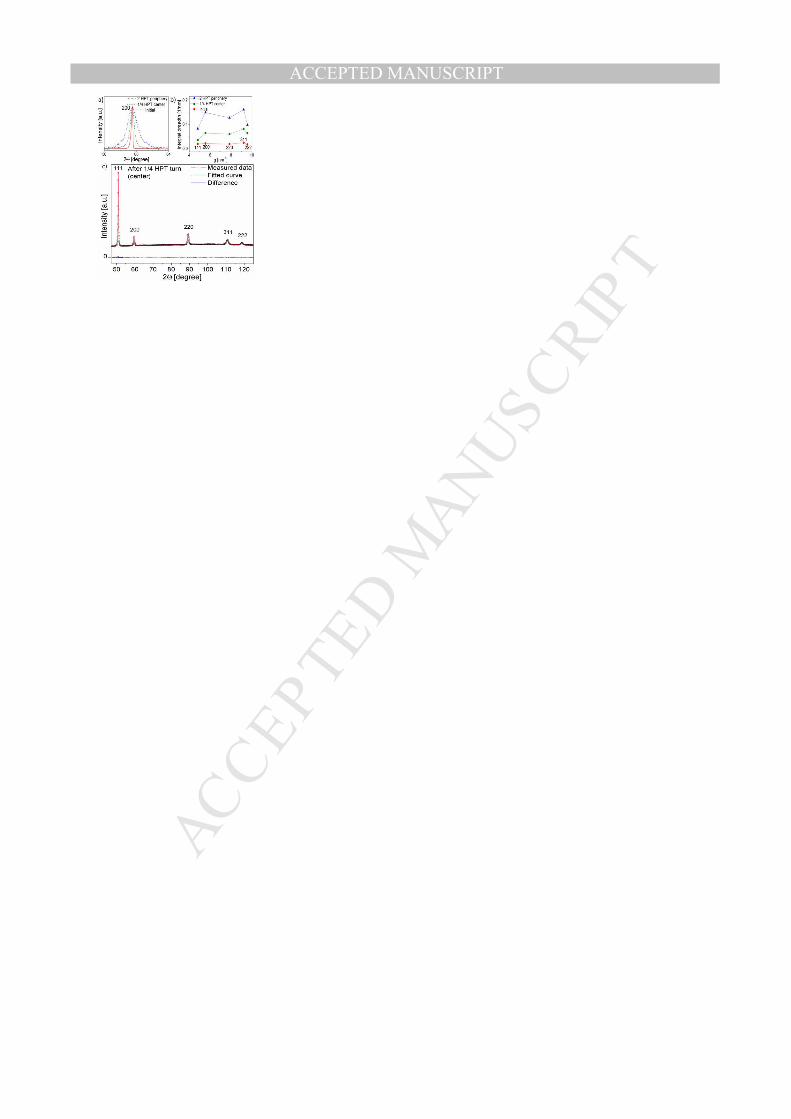
Fig. 9a shows reflection 200 for the initial material and the two HPT-processed states
for the lowest (in the center of the disk processed for 1/4 turn) and the highest (at the
periphery of the disk processed for 2 turns) imposed strains. The peak broadening of the
initial sample is caused by the instrumental broadening and the chemical heterogeneities, as
discussed above. The latter effect yielded a slightly asymmetric peak shape, as revealed in

MANUSCRIP
T
ACCEPTED
ACCEPTED MANUSCRIPT
9
Fig. 9a. HPT processing led to a significant increase in the profile breadth even in the center
of the disk processed for 1/4 turn. The peak broadening further increased for the periphery
after 2 turns due to the much larger deformation. The dependence of the peak breadths on the
diffraction order (on the indices hkl) can be visualized by plotting the integral breadth of the
profiles (the total area under the peak divided by the peak height) as a function of the modulus
of the diffraction vector, g (Williamson-Hall plot) [24,25]. Fig. 9b shows Williamson-Hall
plots for the initial material, the center of the disk processed for ¼ turn and the periphery of
the disk processed for 2 turns. The significantly non-monotonous variation of the integral
breadth as a function of g for the HPT-processed samples is caused by the lattice defects such
as dislocations and twin-faults. For dislocations with mixed edge/screw character, the
breadths of 200, 220 and 222 reflections are close to each other, while the width of 311
reflection is much larger [25]. This can be observed for the measurement obtained at the
center of the disk processed for 1/4 turn. At the same time, the relatively large peak breadth of
reflection 200 for the periphery of the disk processed for 2 turns suggests considerable twin-
fault probability. For dislocations, the dependence of peak broadening on the reflection
indices hkl can be taken into account by the average contrast factors. The average contrast
factors for reflection hkl, hklC , can be calculated numerically from the anisotropic elastic
constants of the crystal [25]. The values of the elastic constants c11, c12 and c44 are 172, 108
and 92 GPa, respectively, for the present HEA composition [26].
The average contrast factor can be expressed as:
( )
++
++−=2222
222222
00 1lkh
lhlkkhqCC hhkl , (5)
where 00hC is the contrast factor for reflection h00 and q depends on the edge/screw character
of dislocations. The values of 00hC for edge and screw dislocations were calculated as 0.278
and 0.283, respectively, using program ANIZC [27]. The values of q for edge and screw
dislocations were obtained as 1.5 and 2.3, respectively. Using the average contrast factors, the
diffraction domain size, the dislocation density and the twin fault probability can be
determined by fitting the calculated theoretical patterns to the experimental diffractograms
using the CMWP procedure [22,28]. Fig. 9c shows a CMWP fitting for the center of the disk
processed by 1/4 turn.
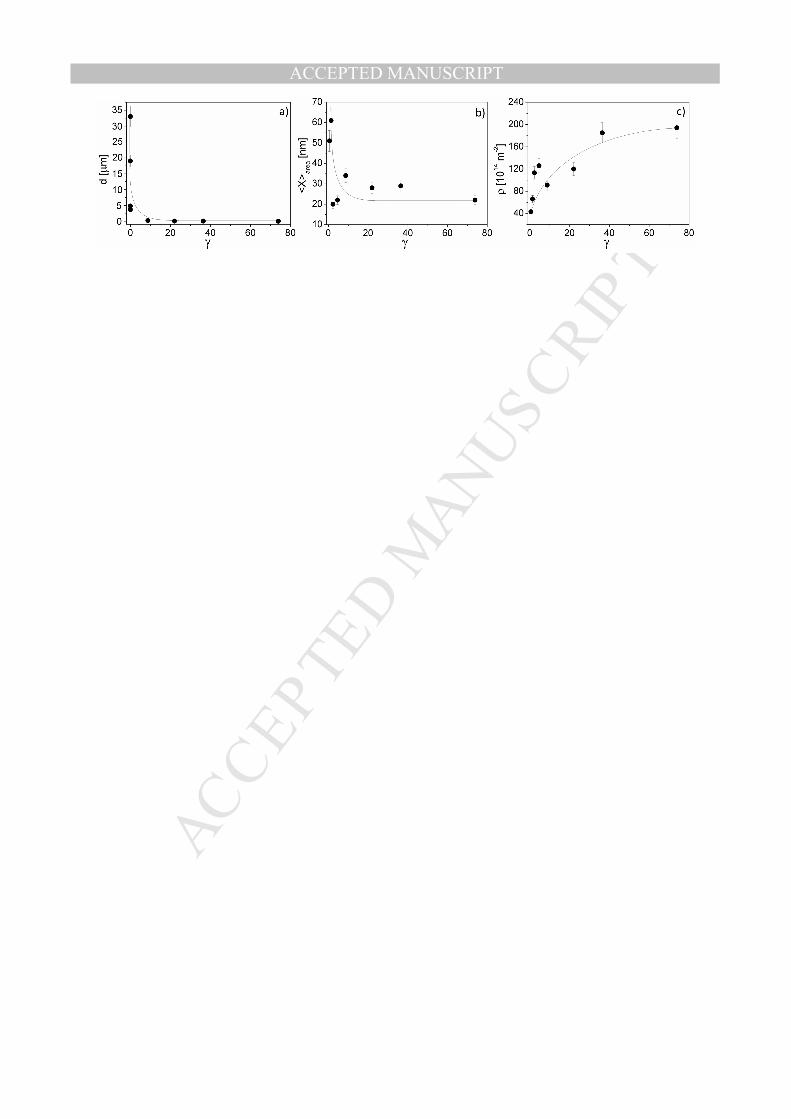
The average diffraction domain size, dislocation density and twin fault probability
determined for the center and the periphery of the disks processed by 1/4, 1/2, 1 and 2 turns of
HPT are listed in Table 1. It can be seen that the dislocation density is very large (~43 × 1014

MANUSCRIP
T
ACCEPTED
ACCEPTED MANUSCRIPT
10
m-2) in the center of the disk processed by 1/4 turn, while the grain structure was only slightly
refined (the grain size decreased from ~60 µm to ~33 µm as shown by the EBSD study in
section 3.2). The dislocation density increased with increasing numbers of HPT turns up to 1
revolution in both the center and the periphery of the disks. Between 1 and 2 turns only a
slight difference between the dislocation density values was observed. The maximum
dislocation densities with the values of ~126 × 1014 m-2 and ~194 × 1014 m-2 were measured in
the center and the periphery of the disk processed for 2 turns, respectively. It can be seen from
Table 1 that the difference between the dislocation densities in the center and the periphery
remained significant even after 2 turns of HPT, and this is similar to the hardness values
presented in the next section.
For the center parts of all disks and also in the peripheries after 1/4 and 1/2 turns, the
twin fault probability remained under the detection limit of XLPA (about 0.1% which
corresponds to a twin fault spacing of ~200 nm). This observation is not in contradiction with
the detection of twin faults in the EBSD images taken in the centers of the disks processed by
1 and 2 turns (for 1 turn see Fig. 4d) since the twin fault spacing is ~3 µm which is much
larger than the upper limit of detection in XLPA. However, considerable twin fault probability
values (β) of ~2.2% and ~2.7% were observed in the peripheral parts of the disks processed
by 1 and 2 turns, respectively. These values correspond to a mean twin fault spacing of about
8-10 nm which is in accordance with the twin fault spacing observed by TEM (see section
3.2). The twin fault spacing can be calculated from β as 100·d111/β where d111 is the lattice
spacing for planes {111}. The deviation of the twin fault spacing determined by TEM from
the value obtained by XLPA can be attributed to the much larger volume studied by the latter
method. The high twin fault probability at the periphery of the disk processed by 2 turns is in
accordance with the relatively large breadth of reflection 200 in the Williamson-Hall plot (see
Fig. 9b) as discussed above.
The diffraction domain size is very small (~51 nm) in the center of the disk processed
by 1/4 turn. This value is about three orders of magnitude smaller than the grain size
measured by EBSD. The difference between the diffraction domain size obtained by XLPA
and the grain size determined by microscopic methods in SPD-processed materials is a well
known phenomenon. The diffraction domains are equivalent to the volumes scattering X-rays
coherently. Dislocation patterns inside the grains may break the coherency of X-rays. Low-
angle grain boundaries and dipolar dislocation walls are typical examples which fragment
grains into small diffraction domains. The high dislocation density yielded a small diffraction
domain size in the center of the HEA sample processed by 1/4 turn. With increasing distance

MANUSCRIP
T
ACCEPTED
ACCEPTED MANUSCRIPT
11
from the center and the numbers of turns, the grain size was strongly reduced while only a
small decrease in the diffraction domain size was detected. Therefore, the difference between
the grain and diffraction domain sizes decreased with increasing strain during HPT. For the
peripheries of the disks processed by 1/2, 1 and 2 turns, the grain and diffraction domain sizes
agree within the experimental error. The smallest grain and diffraction domain sizes were 20-
30 nm which were achieved after 1/2 turn at the periphery of the HPT disk.
The grain size determined by EBSD or TEM, the diffraction domain size and the
dislocation density obtained by XLPA were plotted in Figs. 10a, b and c, respectively, as a
function of shear strain given as γ = 2πrN/h, where r, h and N are the distance from the center,
the thickness of the HPT processed disk and the number of turns, respectively. It should be
noted that, due to the 1 mm height of the X-ray spot on the illuminated surface, for the
diffraction domain sizes and the dislocation densities determined in the center of the disks the
shear strain was obtained by averaging the strain values obtained for distances from the disk
center between -0.5 and 0.5 mm. For the dislocation densities and diffraction domain sizes
measured near the periphery, the shear strain was determined at 4 mm from the disk center
(see Fig. 1). Fig. 10 shows that the grain and the diffraction domain sizes saturated even at the
shear strain of ~10 while the dislocation density reached its maximum value only at the shear
strain of ~40. It is noted that, although the nominal value of the shear strain is zero in the
center of the disks, the grain size decreased considerably with increasing numbers of turns
(see Table 1). This discrepancy can be explained by the spread of plastic deformation into the
center from the neighboring regions due to the stress field of dislocations developed out of the
disk center. This induced plasticity causes grain refinement even in the disk center.
3.4. Hardness evolution during HPT
Fig. 11a shows the hardness evolution along the disk diameter as a function of the number of
rotations. The undeformed specimen has a hardness of about 1440 MPa. After 1/4 turn of
HPT there is a large gradient in the hardness along the disk radius. In the center and the
periphery, the hardness values are ~2400 and ~4860 MPa, respectively. Further straining up to
1/2 turn yielded a slight hardening in both the center and the periphery. In addition, the hard
regions at the periphery expanded towards the disk center as shown in Fig. 11a. Between 1/2
and 1 turn of HPT, the hardness increased from ~2520 MPa to ~3180 MPa in the center of the
disks. At the periphery, the hardness was enhanced to ~5220 MPa. Moreover, the hard regions
expanded further towards the disk center. Between 1 and 2 turns of HPT, only a slight
increase of the hardness was detected. The maximum value of the hardness was measured at
MANUSCRIP
T
ACCEPTED
ACCEPTED MANUSCRIPT
12
the periphery of the disk processed by 2 turns (~5380 MPa). However, even after 2 turns of
HPT a relatively low hardness remained in the disk center. It is probable that higher numbers
of turns may yield a complete saturation of hardness with a large value along the disk radius.
Fig. 11b shows that the hardness values measured at different distances from the disk
centers for various numbers of turns follow a unified trend if they are plotted as a function of
the shear strain. Specifically, this trend shows the general hardness evolution associated with
strain hardening observed in many commercial purity metals and simple alloys after HPT
processing. A recent report summarizes the different models of hardness evolution in various
metallic materials processed by HPT [29]. It should be noted that the hardness increased in
the disk center with increasing number of turns although the nominal shear strain there is
zero. This can be explained by the spread of plasticity from the neighboring regions into the
disk center (see section 3.3).
4. Discussion
4.1. Evolution of lattice defect structure in CoCrFeMnNi HEA during HPT
The defect structure in the CoCrFeMnNi HEA was mainly studied by XLPA. For
conventional metals and alloys, the diffraction peak profiles are broadened primarily due to
the instrumental effect, the finite diffraction domain size, dislocations and planar faults. At the
same time, in HEAs the chemical heterogeneities may yield spatial variations of the lattice
constant which give an additional contribution to X-ray line broadening. Without the
knowledge of this broadening effect, the real values of the dislocation density and the twin
fault probability cannot be determined by XLPA. In section 3.3, a simple solution was
proposed for taking into account the broadening effect of moderate chemical heterogeneities
in the evaluation of diffraction peak profiles of severely deformed HEAs. In this method, the
pattern measured on the initial coarse-grained HEA was used as an instrumental diffractogram
instead of the pattern measured on the line profile standard material (and thus on LaB6). For
the present CoCrFeMnNi HEA, the peak breadths of the initial HEA sample were three times
larger than the line widths for the LaB6 standard. In this modified analysis, it was assumed
that the lattice defect structure does not depend strongly on the chemical composition in the
material, which is certainly valid only for slight concentration fluctuations as in the present
case. This method can be used for any plastically deformed HEA. It should be noted,
however, that there may be HEA samples for which the chemical heterogeneities are very
low, therefore the diffractogram measured on LaB6 can be used as an instrumental pattern in
the line profile analysis. For instance, our recent study on a Ti20Zr20Hf20Nb20Ta20 HEA

MANUSCRIP
T
ACCEPTED
ACCEPTED MANUSCRIPT
13
revealed no significant difference between the peak breadths measured on the initial coarse-
grained sample and the LaB6 standard material due to the negligible concentration
fluctuations in the HEA specimen.
It was found for the present CoCrFeMnNi HEA that for low shear strains of HPT (in
the center part of the disk processed by ¼ turn) the dislocation density increased to very high
values (1015-1016 m-2) while the grain size was only slightly refined. This observation suggests
that the rate of increase of the dislocation density is higher than for the grain refinement. A
fast increase in the dislocation density without considerable grain refinement was also
observed during compression of another HEA with the equimolar composition of
TiZrHfNbTa in earlier work [7]. The high dislocation densities in plastically deformed HEAs,
even at low strains, can be explained by a reduced annihilation rate of dislocations during
plastic deformation which may be caused by the high stress required for dislocation motion in
highly-alloyed HEA materials. In addition, for the present CoCrFeMnNi HEA the low
stacking fault energy (SFE, 19 mJ/m2 [30]) also contributed to the very high dislocation
density. The low SFE results in a dissociation of dislocations into partials which obstructs the
annihilation mechanisms of dislocations as in cross slip and climb [31]. Therefore, both the
high concentrations of the different alloying elements and the low SFE are the reasons for the
very high dislocation density (~194 × 1014 m-2) after 2 turns of HPT. In addition, the high twin
fault probability inside the nanograins after 1-2 turns (2.2-2.7%) was also caused mainly by
the low SFE of this HEA. A similar twin fault probability (about 2%) was also obtained for a
HPT processed 4N purity Ag with a similar SFE (~16 mJ/m2) [32]. The saturation dislocation
density achieved in the Ag sample (~154 × 1014 m-2) was also close to the value measured for
the present HEA material (~194 × 1014 m-2). Therefore, it seems that the low SFE of
CoCrFeMnNi HEA is a deterministic factor in the evolution of the defect structure during
HPT. It is noted that a recently published study [33] showed that in a CoCrFeMnNi HEA the
value of SFE may have a spatial dependence due to the variation of local chemical
composition. This effect yields a different degree of dislocation dissociation into partials. It
was revealed that in the CoCrFeMnNi HEA deformed to a plastic strain of 5% the splitting
distance between the partials in dissociated dislocations varies between 1 and 9 nm. The mean
and the standard deviation of the splitting distance were 5 and 2 nm, respectively. These
values are in reasonable agreement with the splitting distances in Ag (~2.5 and ~6.3 nm for
screw and edge dislocations, respectively [34]) with similar SFE.
It should be noted that the present results are in accordance with former studies on
HPT-processed CoCrFeMnNi HEA. In the investigation performed by Schuh et al. [15] the

MANUSCRIP
T
ACCEPTED
ACCEPTED MANUSCRIPT
14
applied HPT pressure was higher (7.8 GPa) while the rate of deformation was lower (0.2 rpm)
than in these experiments (3.0 GPa and 1 rpm). Despite the different HPT conditions, the
saturation grain size (~50 nm) and hardness (~5100 MPa) were very close to the values
obtained in this study (~30 nm and ~5380 MPa). In addition, the threshold shear strain for
hardness saturation was observed as ~50 in earlier work. [15] which is very close to the value
determined in this study (~45, see Fig. 11b). Concerning lattice defects formed during HPT,
both the former and the present studies revealed the significance of twinning in plastic
deformation of CoCrFeMnNi HEA even for low numbers of turns (see Fig. 3b). Considerable
twin formation was also observed in cold rolled and tensile tested CoCrFeMnNi HEA [35,36].
The critical shear strain for twinning was determined as ~0.5 [15,36], therefore the
observation of significant twinning even at the half-radius of the disk processed for 1/4 turn
(where the shear strain is ~5.6) is in accordance with the results presented in the literature.
XLPA is unable to observe twin faults for low numbers of HPT turns since this method can
detect twin boundaries only if their average spacing is lower than ~200 nm. Therefore, XLPA
gives considerable twin fault probability only for the periphery of the disks processed by 1
and 2 turns, despite the significant twinning for lower numbers of turns. It should also be
noted that the lower twin fault probability for small numbers of HPT turns does not represent
necessarily a lower contribution of twinning to plasticity as the shear strain caused by
twinning is determined by the volume of the twinned regions and not by the amount of twin
boundaries.
Our study also revealed a very high twin fault probability at the peripheries of the
disks processed by 1 and 2 turns where the shear strain reached the values of ~36 and ~74,
respectively. This observation differs from the results of Schuh et al. [15] who only scarcely
detected twins inside the nanograins in CoCrFeMnNi HEA deformed by HPT up to the shear
strain of ~50. This apparent contradiction can be attributed to the blurry scanning TEM
(STEM) image used for the study of twinning in the former work (see Fig. 3a in Ref. [15]). In
the present study, the method of XLPA was used for the determination of twin fault
probability which has a much better statistics than STEM. The volume studied by XLPA is at
least six orders of magnitude larger than that investigated by STEM in [15]. Moreover, the
good quality TEM images in Fig. 6 visualized the existence of twin faults with high density in
the CoCrFeMnNi HEA processed by HPT up to high strain values. It should be emphasized
again that XLPA works well only above a certain limit of twin fault probability (~0.1% which
corresponds to an average twin spacing of ~200 nm).

MANUSCRIP
T
ACCEPTED
ACCEPTED MANUSCRIPT
15
4.2. Strengthening mechanisms in the HPT-processed CoCrFeMnNi HEA
In order to reveal the underlying strengthening mechanisms in the present HEA processed by
HPT, the yield strength was estimated as one-third of the hardness in the center and the
periphery and then compared with the values calculated as the sum of the dislocation and
grain size hardening contributions. It is noted that the ratio of the hardness and the yield
strength depends on the work hardening behavior of the material as the hardness measurement
itself causes a plastic strain of 8% in the sample. Therefore, one-third of the hardness gives
the flow stress at the plastic strain of 8% instead of the yield strength. However, for severely
deformed materials additional straining after SPD usually yields only a slight hardening, and
thus one-third of the hardness is an acceptable approximation of the yield strength. In the
following, the strength contributions of dislocations and grain size are calculated. The yield
strength caused by dislocations can be obtained from the Taylor equation as [37]:
���� !" = #$�%&'( , (6)
where α is a constant describing the strengthening effect for a unit density of dislocations, G
is the shear modulus, b is the modulus of the Burgers vector calculated as the lattice parameter
divided by the square-root of two for fcc crystals (0.255 nm for the present HEA) and MT is
the Taylor factor (3.06 was selected as a strong texture was not observed). According to a
previous study on a CoCrFeMnNi HEA [26,38], the value of the shear modulus was chosen as
~80 GPa. The influence of grain size on yield strength can be described by the Hall–Petch
relationship [39,40]:
�)* = +
√� , (7)
where k is a constant depending on the investigated material and d is the average grain size.
Assuming a simple linear additivity of the hardening contributions of dislocations and
grain size, the yield strength can be calculated as:
�� = �- + ���� !" + �)* , (8)
where σ0 is the friction stress describing the resistance of the defect-free lattice against plastic
deformation. The value of σ0 was taken as ~200 MPa in accordance with previous studies on
the CoCrFeMnNi HEA [26,41,42]. In eqs. (6-8), there are two unknown parameters for the
present HEA, namely α and k in the Taylor and Hall-Petch equations, respectively. These
values were determined by searching for the best agreement between the estimated yield
strength and the values calculated from eq. (8) for the center and the periphery of the disks
processed by 1/4, 1/2, 1 and 2 turns (thus. altogether eight studied locations). It should be
noted that, due to the 1 mm height of the X-ray spot on the illuminated surface, the estimated

MANUSCRIP
T
ACCEPTED
ACCEPTED MANUSCRIPT
16
yield strength was obtained by averaging the strength values obtained for distances from the
disk center between -0.5 and 0.5 mm. At the periphery, the strength determined at +/- 4 mm
from the disk center was taken as the estimated value (see Fig. 1). It is also noted that for the
periphery of the disks processed for 1 and 2 turns the grains were highly twinned as indicated
by the XLPA and TEM observations, therefore the twin boundary spacing was substituted for
the grain size in the Hall-Petch relationship. The twin boundary spacing was calculated from
the twin fault probability determined by XLPA using the equation given in section 3.3.
Former studies [e.g., 43,44] showed that the same value of k can be used in the Hall-Petch
relationship for both the grain size and the twin boundary spacing. Although twin boundaries
were also observed inside the coarse grains by EBSD (as in Fig. 4d), they were included in the
HAGBs and therefore their effect was taken into account in the calculation of the average
grain size.
The difference between the estimated and calculated yield strength was minimised by
varying the values of α and k using the method of least squares. This procedure gave 0.16 ±
0.02 and 21 ± 2 MPa·µm1/2 for α and k, respectively. With these values, a relatively good
agreement between the estimated and calculated yield strength values was achieved, as shown
in Fig. 12. The estimated and the calculated yield strength values are listed in Table 2. The
contributions of dislocations and grain/twin size to the yield strength are also listed. It can be
seen that dislocations have a much higher hardening effect than the grain/twin size. The
dislocation hardening parameter α for the present HPT-processed HEA samples has a
relatively low value compared to other metals. For example, it was reported that α varies
between 0.17 and 0.3 for Cu deformed at different strains [45]. A similar range was observed
for SPD-processed fcc metals with different stacking fault energies [46]. The smaller values
of α were obtained for materials with lower SFEs. For instance, for ultrafine-grained Ag
processed by equal-channel angular pressing the value of α was 0.17 which is very close to
the value determined for the CoCrFeMnNi HEA in this study. In addition, the SFE values are
also similar: 16 [46] and 19 mJ/m2 [30] for Ag and the CoCrFeMnNi HEA, respectively. As
discussed earlier [46], the low SFE leads to a higher degree of dislocation dissociation which
impedes the clustering of dislocations. It was shown previously [47] that the less clustered the
dislocation structure, so the lower the value of α. Therefore, the low SFE of the CoCrFeMnNi
HEA appears to make a significant contribution to the relatively small value of α.
5. Summary and conclusions
MANUSCRIP
T
ACCEPTED
ACCEPTED MANUSCRIPT
17
The evolution of the defect structure, grain size and hardness during HPT processing of an
equiatomic CoCrFeMnNi HEA was studied. The following conclusions were obtained:
1. In the initial sample, the average grain size was determined as ~60 µm. After 2 turns
of HPT, the grain size was refined to ~30 nm at the periphery of the disk. At the same
time, in the disk center the grain size was reduced only to ~4 µm after 2 turns,
indicating a high sensitivity of grain refinement on the gradient in shear strain along
the disk radius.
2. The dislocation density increased rapidly with increasing numbers of turns in HPT
processing. After ¼ turn, high dislocation densities with values of ~43 and ~91 × 1014
m-2 were detected in the center and the periphery of the HPT disk, respectively.
Further straining up to 2 turns increased the dislocation density to ~126 and ~194 ×
1014 m-2 in the center and the periphery, respectively. The high shear strains at the
edge of the disks processed by 1 and 2 turns of HPT yielded large twin fault
probabilities of ~2.2-2.7%.
3. Similar to the microstructure, there was a large gradient in the hardness along the disk
radius. After ¼ turn of HPT, the hardness increased from ~1440 MPa to ~2400 and
~4860 MPa in the center and the periphery of the disk, respectively. Even after 2 turns
of HPT a large gradient in hardness remained along the disk radius. The maximum
hardness value at the periphery of the disk processed by 2 HPT turns was measured as
~5380 MPa.
4. A good correlation between the estimated and the calculated yield strength values was
achieved using α = 0.16 and k = 21 MPa·µm1/2 in the Taylor and Hall-Petch terms of
yield strength. The relatively small value of α was attributed to the low SFE of the
CoCrFeMnNi HEA since the clustering of highly dissociated dislocations in low SFE
materials is hindered and the less clustered dislocation structure usually yields a small
value of α in the Taylor equation.
Acknowledgements
This work was supported by the Hungarian Scientific Research Fund, OTKA, Grant No. K-
109021. The authors are grateful to Mr. Gábor Varga and Dr. Zoltán Dankházi for performing
EBSD experiment. This work was also supported in part by the NRF Korea funded by MoE
under Grant No. NRF-2016R1A6A1A03013422 and by MSIP under Grant No. NRF-
2016K1A4A3914691 (MK) and in part by the National Science Foundation of the United
States under Grant No. DMR-1160966 (TGL).

MANUSCRIP
T
ACCEPTED
ACCEPTED MANUSCRIPT
19
References
[1] J.W. Yeh, S.K. Chen, S.J. Lin, J.Y. Gan, T.S. Chin, T.T. Shun, C.H. Tsau, S.Y. Chang,
Nanostructured high-entropy alloys with multiple principal elements: novel alloy design
concepts and outcomes, Adv. Eng. Mater. 6 (2004) 299–303.
[2] B. Cantor, I.T.H. Chang, P. Knight, A.J.B. Vincent, Microstructural development is
equiatomic multicomponent alloys, Mater. Sci. Eng. A 375-377 (2004) 213–218.
[3] D.B. Miracle, J.D. Miller, O.N. Senkov, C. Woodward, M.D. Uchic, J. Tiles, Exploration
and development of high entropy alloys for structural applications, Entropy 16 (2014) 494–
525.
[4] Z. Zou, H. Ma, R. Spolenak, Ultrastrong ductile and stable high-entropy alloys at small
scales, Nature Comm. 6 (2015) 1–6.
[5] Y. Zhang, T.T. Zuo, Z. Tang, M.C. Gao, K.A. Dahmen, P.K. Liaw, Z.P. Lu,
Microstructures and properties of high-entropy alloys, Prog. Mater. Sci. 61 (2014) 1–93.
[6] O.N. Senkov, J. Scott, S. Senkova, Microstructure and elevated temperature properties of
a refractory TaNbHfZrTi alloy, J. Mater. Sci. 47 (2012) 4062–4074.
[7] G. Dirras, J. Gubicza, A. Heczel, L. Lilensten, J.-P. Couzinié, L. Perrière, Y. Guillot, A.
Hocini, Microstructural investigation of plastically deformed Ti20Zr20Hf20Nb20Ta20
high entropy alloy by X-ray diffraction and transmission electron microscopy, Mater. Char.
108 (2015) 1–7.
[8] G. Dirras , H. Couque, L. Lilensten, A. Heczel, D. Tingaud, J.-P. Couzinié, L. Perrière, J.
Gubicza, I. Guillot, Mechanical behavior and microstructure of Ti20Hf20Zr20Ta20Nb20
high-entropy alloy loaded under quasi-static and dynamic compression conditions, Mater.
Char. 111 (2016) 106–113
[9] T.G. Langdon, Twenty-five years of ultrafine-grained materials: Achieving exceptional
properties through grain refinement, Acta Mater. 61 (2013) 7035–7059.
[10] R.Z. Valiev, A.P. Zhilyaev, T.G. Langdon, Bulk Nanostructured Materials,
Fundamentals and Applications, John Wiley & Sons, Inc., Hoboken, New Jersey, 2014.
[11] A.P. Zhilyaev, T.G. Langdon, Using high-pressure torsion for metal processing:
Fundamentals and applications, Prog. Mater. Sci. 53 (2008) 893–979.
[12] D.H. Lee, I.C. Choi, M.Y. Seok, J. He, Z. Lu, J.Y. Suh, M. Kawasaki, T.G. Langdon,
J.I. Jang, Nanomechanical behavior and structural stability of a nanocrystalline
CoCrFeNiMn high-entropy alloy processed by high-pressure torsion, J. Mater. Res. 30
(2015) 2804–2815.
MANUSCRIP
T
ACCEPTED
ACCEPTED MANUSCRIPT
20
[13] H. Yuan, M.-H. Tsai, G. Sha, F. Liu, Z. Horita, Y. Zhu, J.T. Wang, Atomic-scale
homogenization in an fcc-based high-entropy alloy via severe plastic deformation, J.
Alloys Compd. 686 (2016) 15–23.
[14] Q.H. Tang, Y. Huang, Y.Y. Huang, X.Z. Liao, T.G. Langdon, P.Q. Dai, Hardening of
an Al0.3CoCrFeNi high entropy alloy via high-pressure torsion and thermal annealing,
Mater. Lett. 151 (2015) 126–129.
[15] B. Schuh, F. Mendez-Martin, B. Völker, E.P. George, H. Clemens, R. Pippan, A.
Hohenwarter, Mechanical properties, microstructure and thermal stability of a
nanocrystalline CoCrFeMnNi high-entropy alloy after severe plastic deformation, Acta
Mater. 96 (2015) 258–268.
[16] D.H. Lee, M.Y. Seok, Y. Zhao, I.C. Choi, J. He, Z. Lu, J.Y. Suh, U. Ramamurty, M.
Kawasaki, T.G. Langdon, J.I. Jang, Spherical nanoindentation creep behavior of
nanocrystalline and coarse-grained CoCrFeMnNi high-entropy alloys, Acta Mater. 109
(2016) 314–322.
[17] Y. Ma, G.J. Peng, D.H. Wen, T.H. Zhang, Nanoindentation creep behavior in a
CoCrFeCuNi high-entropy alloy film with two different structure states, Mater. Sci. Eng. A
621 (2015) 111–117.
[18] J.Y. He, W.H. Liu, H. Wang, Y. Wu, X.J. Liu, T.G. Nieh, Z.P. Lu, Effects of Al
addition on structural evolution and tensile properties of the FeCoNiCrMn high-entropy
alloy system, Acta Mater. 62 (2014) 105–113.
[19] K.Y. Tsai, M.H. Tsai, J.W. Yeh, Sluggish diffusion in Co-Cr-Fe-Mn-Ni high-entropy
alloys, Acta Mater. 61 (2013) 4887–4897.
[20] R.B. Figueiredo, P.H.R. Pereira, M.T.P. Aguilar, P.R. Cetlin, T.G. Langdon, Using
finite element modelling to examine the flow processes in quasi-constrained high-pressure
torsion, Acta Mater. 60 (2012) 3190-3198.
[21] J. Nelson, D. Riley, An experimental investigation of extrapolation methods in the
derivation of accurate until-cell dimensions of crystals, Proc. Phys. Soc. Lond. 57 (1945)
160–177.
[22] G. Ribárik, J. Gubicza, T. Ungár, Correlation between strength and microstructure of
ball-milled Al–Mg alloys determined by X-ray diffraction, Mater. Sci. Eng. A 387–389
(2004) 343–347.
[23] G.A. Salishchev, M.A. Tikhonovsky, D.G. Shaysultanov, N.D. Stepanov, A.V.
Kuznetsov, I.V. Kolodiy, A.S. Tortika, O.N. Senkov, Effect of Mn and V on structure and

MANUSCRIP
T
ACCEPTED
ACCEPTED MANUSCRIPT
21
mechanical properties of high-entropy alloys based on CoCrFeNi system, J. Alloys
Compd. 591 (2014) 11–21.
[24] E.J. Mittemeijer, U. Welzel, The “state of the art” of the diffraction analysis of
crystallite size and lattice strain, Z. Kristallogr. 223 (2008) 552–560.
[25] T. Ungár, I. Dragomir, Á. Révész, A. Borbély, The contrast factors of dislocations in
cubic crystals: the dislocation model of strain anisotropy in practice, J. Appl. Cryst. 32
(1999) 992–1002.
[26] B. Gludovatz, E.P. George, R.O. Ritchie, Processing, Microstructure and Mechanical
Properties of the CrMnFeCoNi, JOM, Vol. 67, No. 10 (2015) 2262–2270.
[27] A. Borbély, J. Dragomir-Cernatescu, G. Ribárik, T. Ungár, Computer program ANIZC
for the calculation of diffraction contrast factors of dislocations in elastically anisotropic
cubic, hexagonal and trigonal crystals, J. Appl. Cryst. 36 (2003) 160-162.
[28] T. Ungár, J. Gubicza, G. Ribárik, A. Borbély, Crystallite Size-Distribution and
Dislocation Structure Determined by Diffraction Profile Analysis: Principles and Practical
Application to Cubic and Hexagonal Crystals, J. Appl. Cryst. 34 (2001) 298–310.
[29] M. Kawasaki, Different models of hardness evolution in ultrafine-grained materials
processed by high-pressure torsion, J. Mater. Sci. 49 (2014) 18-34.
[30] A.J. Zaddach, C. Niu, C.C. Koch, D.L. Irving, Mechanical properties and stacking
fault energies of NiFeCrCoMn high-entropy alloy, JOM 65 (2013) 1780–1789.
[31] J. Gubicza, N. Q. Chinh, J. L. Lábár, Z. Hegedűs, T. G. Langdon, Principles of self-
annealing in silver processed by equal-channel angular pressing: The significance of a very
low stacking fault energy, Mater. Sci. Eng. A. 527 (2010) 752-760.
[32] Z. Hegedűs, J. Gubicza, M. Kawasaki, N.Q. Chinh, Zs. Fogarassy, T.G. Langdon,
Microstructure of low stacking fault energy silver processed by different routes of severe
plastic deformation, J. Alloys Compd. 536S (2012) S190– S193.
[33] T.M. Smith, M.S. Hooshmand, B.D. Esser, F. Otto, D.W. McComb, E.P. George, M.
Ghazisaeidi, M.J. Mills, Atomic-scale characterization and modeling of 60° dislocations in
a high-entropy alloy, Acta Mater. 110 (2016) 352-363.
[34] J. Gubicza, Defect Structure in Nanomaterials, Woodhead Publishing, Cambridge,
UK, 2012.
[35] F. Otto, N.L. Hanold, E.P. George, Microstructural evolution after thermomechanical
processing in an equiatomic, single-phase CoCrFeMnNi high-entropy alloy with special
focus on twin boundaries, Intermetallics 54 (2014) 39-48.
MANUSCRIP
T
ACCEPTED
ACCEPTED MANUSCRIPT
22
[36] G. Laplanche, A. Kostka, O.M. Horst, G. Eggeler, E.P. George, Microstructure
evolution and critical stress for twinning in the CrMnFeCoNi high-entropy alloy, Acta
Materialia 118 (2016) 152-163.
[37] G.I. Taylor, Plastic strain in metals, J. Inst. Met. 62 (1938) 307-324.
[38] G. Laplanche, P. Gadaud, O. Horst, F. Otto, G. Eggeler, E.P. George, Temperature
dependencies of the elastic moduli and thermal expansion coefficient of an equiatomic,
single-phase CoCrFeMnNi high-entropy alloy, J. Alloys Compd. 623 (2015) 348-353.
[39] N.J. Petch, The cleavage strength of polycrystals, J. Iron Steel Inst. 173 (1953) 25–28.
[40] E.O. Hall, The deformation and ageing of mild steel; discussion of results, Proc. Phys.
Soc. Lond. B 64, (1951) 47–753.
[41] A. Gali, E.P. George, Tensile properties of high- and medium-entropy alloys,
Intermetallics 39 (2013) 74-78.
[42] F. Otto, A. Dlouhy, C. Somsen, H. Bei, G. Eggeler, E.P. George, The influences of
temperature and microstructure on the tensile properties of a CoCrFeMnNi high-entropy
alloy, Acta Mater. 61 (2013) 5743-5755.
[43] K. Lu, L. Lu, S. Suresh, Strengthening materials by engineering coherent internal
boundaries at the nanoscale, Science 324 (2009) 349-352.
[44] B.B. Rath, M.A. Imam, C.S. Pande, Nucleation and growth of twin interfaces in fcc
metals and alloys, Mater. Phys. Mech. 1 (2000) 61-66.
[45] E. Schafler, K. Simon, S. Bernstorff, P. Hanák, G. Tichy, T. Ungár, M.J. Zehetbauer,
Second order phase transformation of the dislocation structure during plastic deformation
determined by in situ synchrotron X-ray diffraction, Acta Mater. 53 (2005) 315–322.
[46] J. Gubicza, N. Q. Chinh, J.L. Lábár, S. Dobatkin, Z. Hegedűs, T. G. Langdon,
Correlation between microstructure and mechanical properties of severely deformed
metals, J. Alloys Compd. 483 (2009) 271-274.
[47] F. Hernández Olivares, J. Gil Sevillano, A quantitative assessment of forest-hardening
in FCC metals, Acta metall. 35 (1987) 631-641.

MANUSCRIP
T
ACCEPTED
ACCEPTED MANUSCRIPT
23
Figure and table captions
Fig. 1: Schematic depiction of the X-ray beam spot on the HPT-processed disks.
Fig. 2: (a) EBSD image and (b) SEM-BSE picture for the initial as-cast sample. A part of (b)
is shown in a higher magnification in (c). The chemical composition was investigated by EDS
along the white dotted line in (c). The fractions of the five constituents versus the position
along the dotted line are shown in (d).
Fig. 3: EBSD images showing the microstructures at (a) the center, (b) the half-radius and (c)
the periphery of the HEA disk processed by ¼ turn of HPT. The white arrows in (b) indicate
twins formed due to HPT deformation.
Fig. 4: EBSD images showing the center of the disks in the HEA sample after (a) 1/2, (b) 1
and (c) 2 turns of HPT. The thick black lines in (d) represent Σ3 boundaries and some twin
crystals are indicated by white arrows. The color code for the maps is shown in the inset in
Fig. 4a.
Fig. 5: TEM images showing at the periphery of the disks processed by (a) ½, (b) 1(c) and 2
turns of HPT.
Fig. 6: Bright-field TEM images showing twinned grains at the periphery of the disk
processed by 1 turn of HPT.
Fig. 7: The spatial distribution of the constituents in (a) the center and (b) the periphery of the
CoCrFeMnNi HEA disk processed for ¼ turn and in (c) the center and (d) the periphery for 2
turns of HPT.
Fig. 8: Schematic showing that the total diffraction profile can be visualized as a sum of
individual microstructural profiles scattered from regions with different lattice spacings. � is
the modulus of the scattering vector.
Fig. 9: (a) Reflection 200 for the initial material, as well as for the center and the periphery, of
the disks processed for ¼ and 2 turns of HPT, respectively. (b) the integral breadth versus the

MANUSCRIP
T
ACCEPTED
ACCEPTED MANUSCRIPT
24
momentum of the diffraction vector, g (Williamson-Hall plot), for the initial material, as well
as for the center and the periphery of the disks processed for ¼ and 2 turns of HPT,
respectively. (c) CMWP fitting for the center of the disk processed by ¼ turn.
Fig. 10: (a) The grain size determined by EBSD or TEM, (b) the diffraction domain size and
(c) the dislocation density obtained by XLPA as a function of shear strain imposed by HPT.
Fig. 11: The Vickers microhardness versus the distance from the center (a) and the shear
strain (b) for disks processed by HPT for ¼, ½, 1 and 2 turns. The hardness plotted in (b) was
calculated as the average of the two values obtained for the same distance from center. The
dashed line shows the average hardness for the initial sample without HPT. The error bars
indicate the uncertainties in the hardness values.
Fig. 12: The estimated yield strength versus the values calculated from eq. (8) for the center
and the periphery of the disks processed by ¼, ½, 1 and 2 turns.
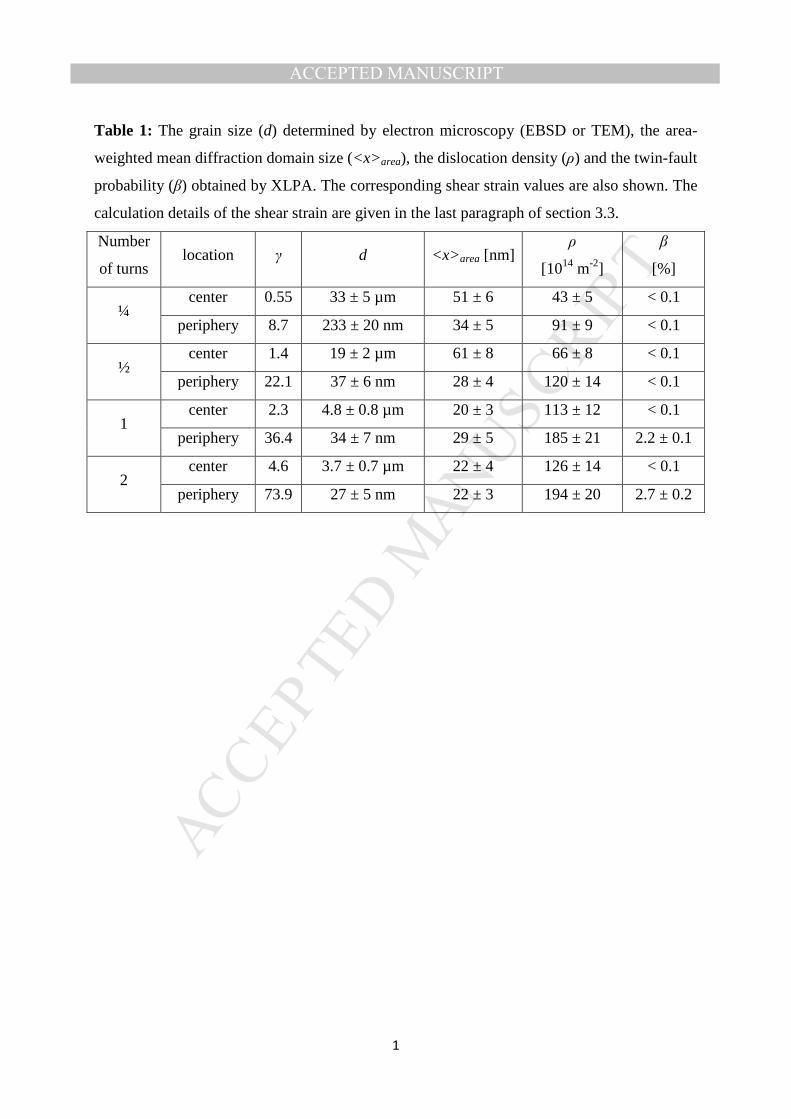
Table 1: The grain size (d) determined by electron microscopy (EBSD or TEM), the area-
weighted mean diffraction domain size (<x>area), the dislocation density (ρ) and the twin-fault
probability (β) obtained by XLPA. The corresponding shear strain values are also shown. The
calculation details of the shear strain are given in the last paragraph of section 3.3.
Table 2. The contributions of dislocations (σTaylor) and grain/twin size (σHP) to the yield
strength calculated from the Taylor and Hall-Petch relationships according to eqs. (6) and (7),
respectively, and the value of the friction stress (σ0). The calculated yield strength (σcalculated)
was obtained as the sum of the σ0, σTaylor and σHP, while the estimated values (σestimated) were
determined as one-third of the hardness. The corresponding shear strain values are also
shown. The calculation details of the shear strain are given in the last paragraph of section 3.3.
MANUSCRIP
T
ACCEPTED
ACCEPTED MANUSCRIPT
1
Table 1: The grain size (d) determined by electron microscopy (EBSD or TEM), the area-
weighted mean diffraction domain size (<x>area), the dislocation density (ρ) and the twin-fault
probability (β) obtained by XLPA. The corresponding shear strain values are also shown. The
calculation details of the shear strain are given in the last paragraph of section 3.3.
Number
of turns location γ d <x>area [nm]
ρ
[1014 m-2]
β
[%]
¼ center 0.55 33 ± 5 µm 51 ± 6 43 ± 5 < 0.1
periphery 8.7 233 ± 20 nm 34 ± 5 91 ± 9 < 0.1
½ center 1.4 19 ± 2 µm 61 ± 8 66 ± 8 < 0.1
periphery 22.1 37 ± 6 nm 28 ± 4 120 ± 14 < 0.1
1 center 2.3 4.8 ± 0.8 µm 20 ± 3 113 ± 12 < 0.1
periphery 36.4 34 ± 7 nm 29 ± 5 185 ± 21 2.2 ± 0.1
2 center 4.6 3.7 ± 0.7 µm 22 ± 4 126 ± 14 < 0.1
periphery 73.9 27 ± 5 nm 22 ± 3 194 ± 20 2.7 ± 0.2

MANUSCRIP
T
ACCEPTED
ACCEPTED MANUSCRIPT
2
Table 2. The contributions of dislocations (σTaylor) and grain/twin size (σHP) to the yield
strength calculated from the Taylor and Hall-Petch formulas according to eqs. (6) and (7),
respectively, and the value of the friction stress (σ0). The calculated yield strength (σcalculated)
was obtained as the sum of the σ0, σTaylor and σHP, while the estimated values (σestimated) were
determined as one-third of the hardness. The corresponding shear strain values are also
shown. The calculation details of the shear strain are given in the last paragraph of section 3.3.
Location γ σTaylor
[MPa]
σHP
[MPa]
σ0
[MPa]
σcalculated
[MPa]
σestimated
[MPa]
¼ turn, center 0.55 654 ± 97 4 ± 1 200 858 ± 98 841 ± 50
¼ turn, periphery 8.7 949 ± 145 44 ± 6 200 1193 ± 151 1540 ± 103
½ turn, center 1.4 810 ± 121 5 ± 1 200 1015 ± 122 921 ± 66
½ turn, periphery 22.1 1092 ± 162 109 ± 16 200 1401 ± 178 1627 ± 107
1 turn, center 2.3 1056 ± 158 10 ± 1 200 1266 ± 159 1223 ± 78
1 turn, periphery 36.4 1357 ± 196 192 ± 28 200 1749 ± 224 1676 ± 97
2 turn, center 4.6 1117 ± 167 11 ± 2 200 1328 ± 169 1292 ± 93
2 turn, periphery 73.9 1387 ± 203 251 ± 32 200 1838 ± 235 1758 ± 100
MANUSCRIP
T
ACCEPTED
ACCEPTED MANUSCRIPT
MANUSCRIP
T
ACCEPTED
ACCEPTED MANUSCRIPT

MANUSCRIP
T
ACCEPTED
ACCEPTED MANUSCRIPT

MANUSCRIP
T
ACCEPTED
ACCEPTED MANUSCRIPT

MANUSCRIP
T
ACCEPTED
ACCEPTED MANUSCRIPT

MANUSCRIP
T
ACCEPTED
ACCEPTED MANUSCRIPT
MANUSCRIP
T
ACCEPTED
ACCEPTED MANUSCRIPT
MANUSCRIP
T
ACCEPTED
ACCEPTED MANUSCRIPT
MANUSCRIP
T
ACCEPTED
ACCEPTED MANUSCRIPT
MANUSCRIP
T
ACCEPTED
ACCEPTED MANUSCRIPT

MANUSCRIP
T
ACCEPTED
ACCEPTED MANUSCRIPT

MANUSCRIP
T
ACCEPTED
ACCEPTED MANUSCRIPT

MANUSCRIP
T
ACCEPTED
ACCEPTED MANUSCRIPT
Highlights
• The microstructure and the hardness in HPT processed CoCrFeMnNi HEA were
studied
• The dislocation density increased up to 194 × 1014 m−2 after 2 turns of HPT
• The grain size decreased to 27 nm at the periphery of the disk processed by 2 turns
• After 2 turns the twin fault probability increased to 2.7% at the disk periphery
• The hardness increased from 1440 MPa to 5380 MPa due to 2 turns of HPT