Embed Size (px)
Citation preview
1
DEFINING AND MEASURING FAIRNESS IN FINANCIALCONTRIBUTION TO THE HEALTH SYSTEM1❁
Christopher JL MurrayFelicia Knaul
Philip MusgroveKe Xu
Kei Kawabata
GPE Discussion Paper Series : No.24
EIP/GPE/FARWorld Health Organization
1We would like to acknowledge the support received from the National Institute of Agingthrough an Inter-Agency Agreement with WHO that was used to undertake a part of this work.We would also like to thank David Evans, Julio Frenk, Emmanuela Gakidou, PatriciaHernández and Jean Pierre Poullier for comments, suggestions and inputs; Ana MylenaAguilar, Juan Pablo Ortiz and Paola Zuñiga for outstanding research assistance; the team ofresearchers at WHO working on the WHO-NHA calculations; and Gabriella Covino andNankhonde Kasonde for support in editing and production.
2
I. IntroductionOne of the challenges common to all social systems is to achieve fairness in thedistribution of the financing burden, and protection from the risk of financial loss. For health systems, this goal is of particular importance and especially difficult toachieve due to the catastrophic and unpredictable nature of some expenditures.Societies have long demonstrated a special concern about how health systems arefinanced.(Behrman 1995;Londoño & Frenk 1997;World Health Organization2000)Much of the public discourse in countries undertaking health sector reform isfocused on the design of health system financing and its fairness.(Londoño & Frenk1997;Wagstaff A & Van Doorslaer E 1998)
The purpose of this paper is to present a definition, a measure and an index of fairnessin financial contribution to the health system. Our notion of fairness is not a concernabout the extent to which contributions to the cost of the health system acrosshouseholds redistribute income. Starting from a society’s efforts to redistributeincome, there are, nevertheless, important considerations of fairness that we try todefine and quantify. Three issues are critical to this concept of fairness: avoidingcatastrophic payments by households, horizontal equity and (to some extent)progressivity of contribution. Further, our approach separates financing fromutilisation, so that fairness in financial contribution is determined independently of thehealth status of the individual or household or the use of health services.
Our definition, measure and index of fairness in financial contribution are designedand developed to be applicable across and within countries with varying types ofhealth systems and at different stages of development and of the health transition. Theindex can be used as a tool to analyse changes over time within countries such as theresults of health reform, economic crises, or policies such as decentralisation. Someempirical applications considering differences across countries and relating these tothe organisation of health systems are discussed in companion publications.(WorldHealth Organization 2000;Xu et al. 2000)
The paper is divided into eight sections. The second section describes the overallWHO Framework for Measuring Health System Performance, for which the measureof fair finance was designed. The third section provides some background informationon health system financing arrangements. The fourth section is a brief review of theliterature on equity in health finance. Section five discusses the conceptual andtheoretical aspects of our measure of fairness of health financing. Section six exploresthe properties of the measure and index using simulation analysis. The seventh sectiongives detailed information on the construction of the measure. The final sectionprovides a summary, conclusions and a discussion of future applications.
II. WHO Framework for Assessing Health System PerformanceThe measure of fairness of financing presented here is part of a framework beingapplied by the World Health Organisation to assist countries to assess the overallperformance of their health systems. The framework sets out three intrinsic goals:improving health, enhancing the responsiveness of the system to the legitimateexpectations of the population; and assuring fairness in financial contribution. For thefirst two goals, we are concerned both with raising their level and improving theirdistribution. . Health and responsiveness are addressed in more detail in other papers.(Murray CJL & Frenk J 1999;World Health Organization 2000)
3
For financing, we consider only the distribution, not the level, as there is no consensuson what the level of health spending should be. The intrinsic goals of the WHOframework do not include either increasing or decreasing the amount spent on health.While the level of health spending is clearly an important determinant of theoutcomes of a health system on all three intrinsic goals, it is not an intrinsic goal inand of itself. Societies must choose the appropriate level of financing for the healthsystem. Given a level of spending, however, every society will want the greatestamount of the socially desired mix of health, responsiveness and fairness in financialcontribution possible; this is the concept of performance or efficiency. The choice ofthe level of total financing is a very important policy choice but unlike health,responsiveness, and fairness in financial contribution, more consumption ofhealthcare is not unequivocally better.
Fairness in financial contribution is an intrinsic goal of a health system because it is adesired outcome in and of itself. Fairness in financial contribution may also improveaccess to health care and health outcomes, but this instrumental role of fair financingis a separate issue. Consider two systems, both having exactly the same level ofhealth, the same distribution of health, the same responsiveness and the samedistribution of responsiveness. But in one, many households pay catastrophic sharesof their effective non-subsistence income for health and in the other no householdmakes catastrophic payments. Most would agree that the system that protectshouseholds from catastrophic payment is more fair and to be preferred. The goal of fairness in financial contribution is nested within a framework of overallhealth system performance in which it is not the only intrinsic goal. A system inwhich all households contribute 0% of their income to health is fairly financed, butwould do very poorly in the goals of producing health and responsiveness. Similarly,a system financed entirely through out-of-pocket payments where the poor pay verylittle because healthcare is unaffordable may score relatively well on financial fairnessbut will do poorly on the level and distribution of health and responsiveness. The inclusion of fairness in financing as an intrinsic goal is mirrored by generalpreferences regarding the goals of health systems. In a survey where respondents wereasked to weight the relative importance of all five aspects of health systemperformance, fairness in financial contribution is considered by respondents to be asimportant as achieving higher levels of health and greater equality in the distributionof health. Each of these goals received a weight of 20-25%.(Gakidou, Frenk, &Murray 2000)
III. Diversity of Health Financing SystemsThe household is the basic unit of analysis for this and many other studies offinancing. While funds for health services may flow from households, employers andgovernments, it is households or individuals who ultimately own the productiveresources in a society. (Fuchs V.R. 1988;Iglehart J.K. 1999)Funds for health servicesare extracted from households through such means as payroll deductions, incometaxes, value-added taxes incorporated into the purchase price of goods and services,out of pocket payments for health care, and private insurance premiums. As Fuchs(Fuchs V.R. 1988) writes: “The most basic point, often obscured in publicdiscussions, is that the public must pay for care under any system of finance. …theultimate cost falls on families and individuals even when the payment mechanismmakes it appear that the bills are being sent elsewhere.”
4
There are four main types of financing for health: government-raised (through generaland specific taxes); social insurance contributions (often levied through payroll andother taxes, as well as other contributions); private insurance contributions; and out-of-pocket payments. The first three types of finance are pre-paid, involve asubstantial degree of risk pooling and can protect both rich and poor from catastrophicand impoverishing health expenditures. Contributions are often a function of income.It is important to emphasize that government-financed and social insurance schemescan, but do not necessarily, protect all citizens. Particular groups are often excludedsuch as the poor, recent immigrants or informal workers.
Within the categories of government-raised and social insurance, there is alsosubstantial variation across countries. Most countries rely on a mix of value-added,income, excise and other taxes. The structure of each tax system reflects thepreferences of each country for solidarity and progressivity, as well as the economicstructure and wealth of the economy. Some countries rely heavily on general taxationas compared to a social insurance or social security scheme. Further, countries vary inthe proportion of the population covered by social security through payroll taxes,depending on the size of the formal labour market. Social security may be financedfrom general or payroll taxes, and there may be redistribution away from, or toward,those individuals that are insured. In most cases, social insurance is paid for bydedicated payroll taxes where a fixed proportion goes to finance health care forworkers and their families. Some countries supplement this with funds collectedthrough general taxes, while others use funds from payroll collections to financepublic health programs that also cover the informal population.
Private payments are of two types: private insurance premiums and out-of-pocketpayments. Private insurance can protect individuals from catastrophic expenditures,but coverage, access and risk pooling are often limited. Private insurance is typically agood available only to the rich in poor countries, the healthy and those that live inurban areas. Out of pocket payments are typically made at point-of-service and theindividual consumers choose, as a function of income, how much they are willing andable to purchase. Catastrophic, and potentially impoverishing, expenditures arisebecause households will sell assets and borrow from future potential earnings in orderto purchase care. The financing of out of pocket payments is, in fact, often severelyconstrained by the individual or household access to credit and borrowing. Necessarycare is forgone and expenditures are zero if the cost of care exceeds the ability to payat the time of service. Further, out of pocket payments are the most fragmented acrossindividual consumers, with no possibility of pooling risks. Out of pocket financing ofhealth is the most likely reason that would characterize unfair distributions of healthfinancing, and to generate severe financial losses and risk of impoverishment forsome families. This is particularly evident in countries where other financing optionsare restricted to the rich, and out of pocket payments are the only option for the poor.
5
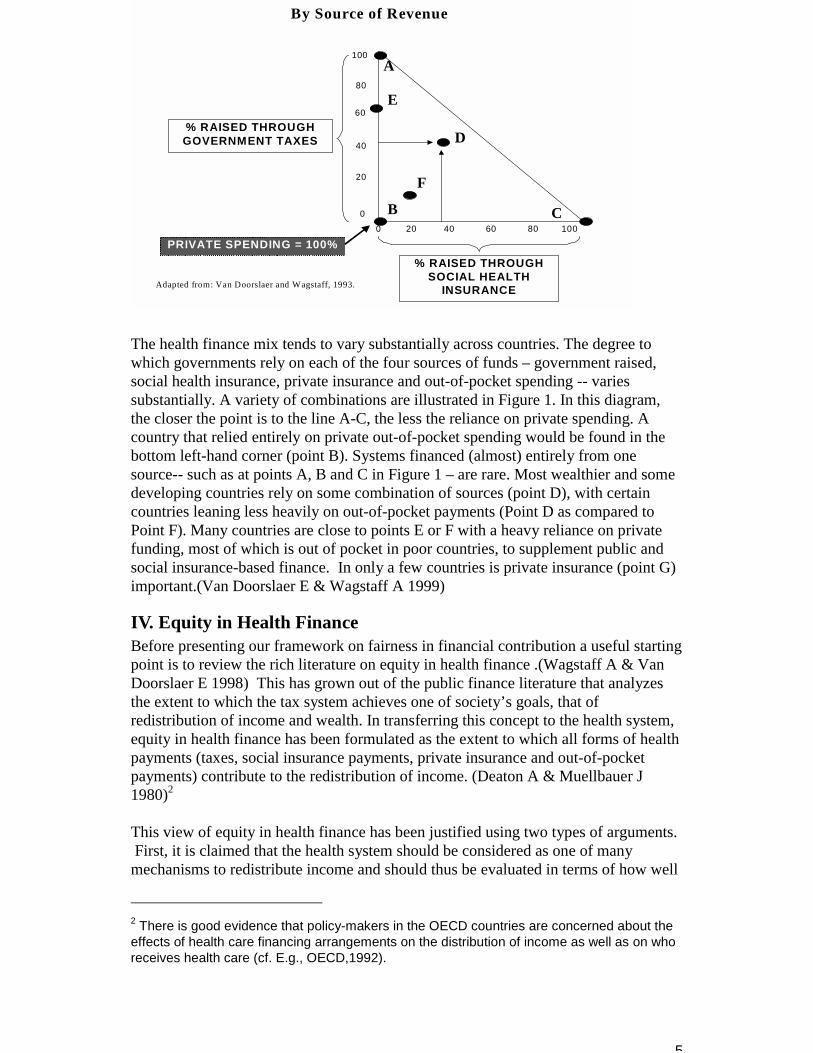
g gBy Source of Revenue
% RAISED THROUGHGOVERNMENT TAXES
% RAISED THROUGHSOCIAL HEALTH
INSURANCE
0 20 40 8060 100
0
20
40
60
80
100A
D
C
F
E
B
PRIVATE SPENDING = 100%
Adapted from: Van Doorslaer and Wagstaff, 1993.
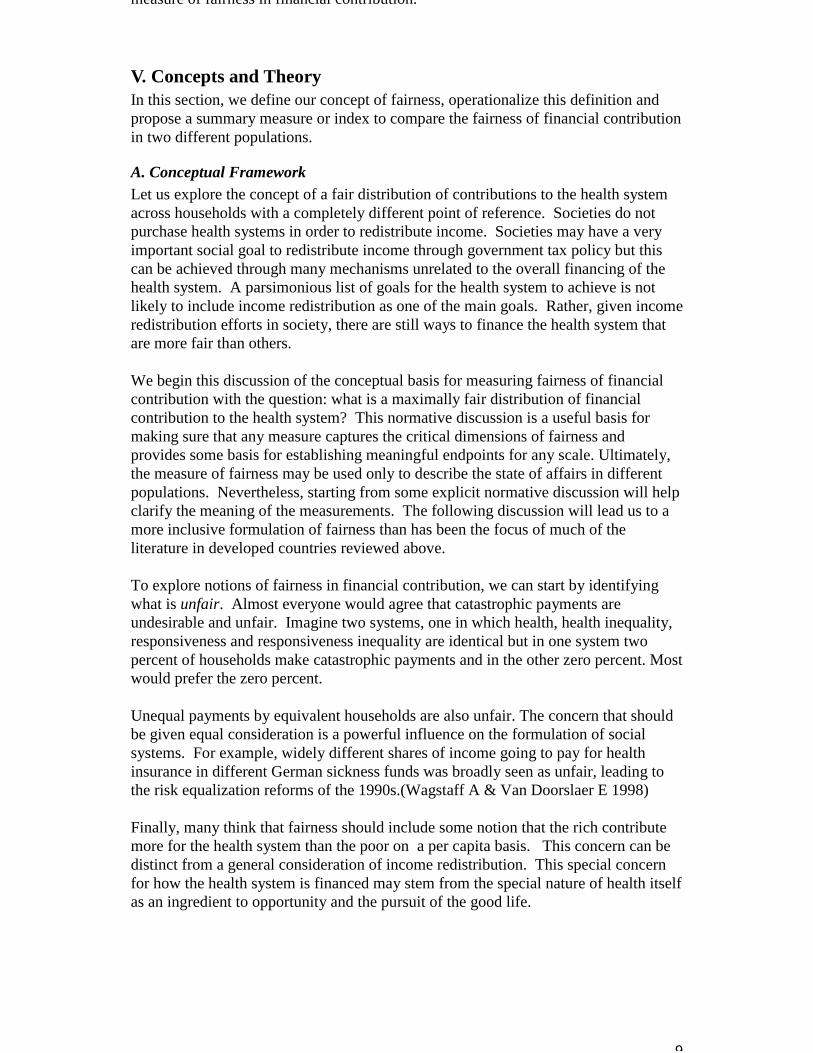
The health finance mix tends to vary substantially across countries. The degree towhich governments rely on each of the four sources of funds – government raised,social health insurance, private insurance and out-of-pocket spending -- variessubstantially. A variety of combinations are illustrated in Figure 1. In this diagram,the closer the point is to the line A-C, the less the reliance on private spending. Acountry that relied entirely on private out-of-pocket spending would be found in thebottom left-hand corner (point B). Systems financed (almost) entirely from onesource-- such as at points A, B and C in Figure 1 – are rare. Most wealthier and somedeveloping countries rely on some combination of sources (point D), with certaincountries leaning less heavily on out-of-pocket payments (Point D as compared toPoint F). Many countries are close to points E or F with a heavy reliance on privatefunding, most of which is out of pocket in poor countries, to supplement public andsocial insurance-based finance. In only a few countries is private insurance (point G)important.(Van Doorslaer E & Wagstaff A 1999)
IV. Equity in Health FinanceBefore presenting our framework on fairness in financial contribution a useful startingpoint is to review the rich literature on equity in health finance .(Wagstaff A & VanDoorslaer E 1998) This has grown out of the public finance literature that analyzesthe extent to which the tax system achieves one of society’s goals, that ofredistribution of income and wealth. In transferring this concept to the health system,equity in health finance has been formulated as the extent to which all forms of healthpayments (taxes, social insurance payments, private insurance and out-of-pocketpayments) contribute to the redistribution of income. (Deaton A & Muellbauer J1980)2
This view of equity in health finance has been justified using two types of arguments. First, it is claimed that the health system should be considered as one of manymechanisms to redistribute income and should thus be evaluated in terms of how well
2 There is good evidence that policy-makers in the OECD countries are concerned about theeffects of health care financing arrangements on the distribution of income as well as on whoreceives health care (cf. E.g., OECD,1992).
6
it achieves this intrinsic goal. The second argument is instrumental: health systemsthat redistribute income are likely to give more access to the poor and thus lead tobetter health outcomes. This latter view leads naturally to a related set of analyses onthe distribution of the benefits of health services.
As Van Doorslaer, Wagstaff et al.(Van Doorslaer E & Wagstaff A 1999) note, themost inclusive measure of equity in health finance is the total effect of healthfinancing contributions on the redistribution of income. One way to capture this neteffect is to compare the Gini coefficient of household income prior to health systempayments with the Gini coefficient of household income after health systemcontributions. The total re-distributive effect can be conceptually and quantitativelydivided into the contributions of vertical equity and horizontal equity.3 Verticalequity is the extent to which the rich pay more for the health system than the poor. Horizontal equity is the extent to which households with the same income pay thesame amount to the health system.
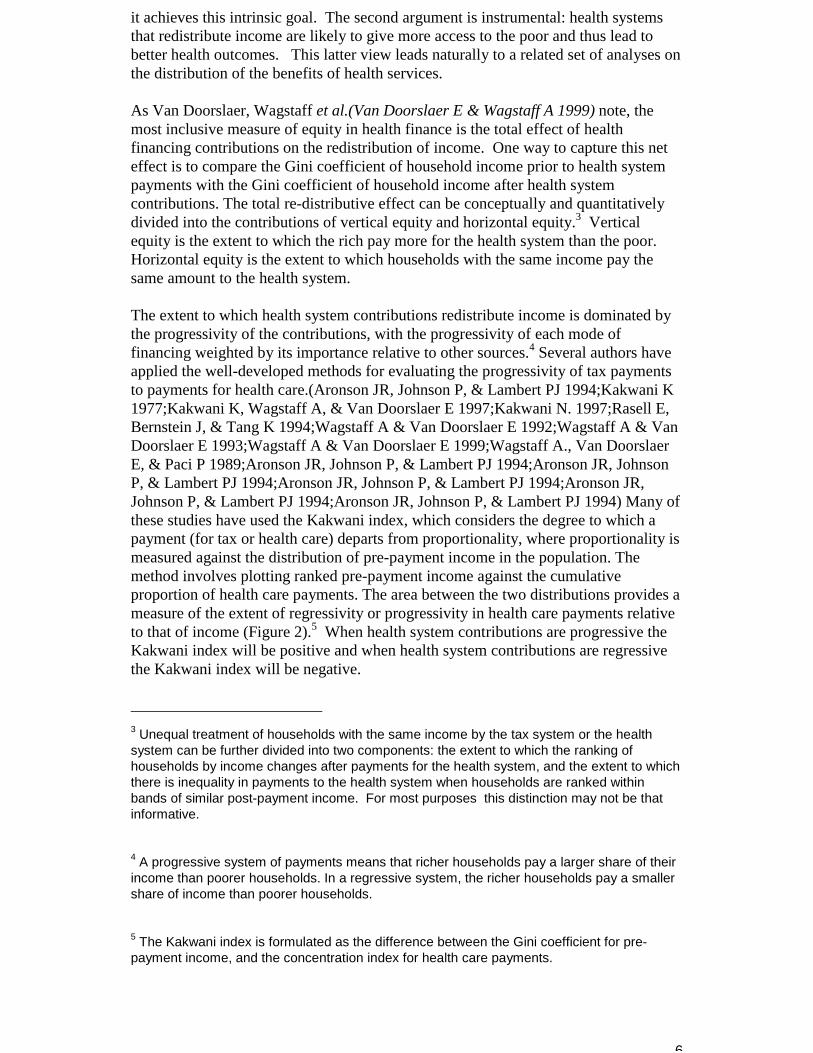
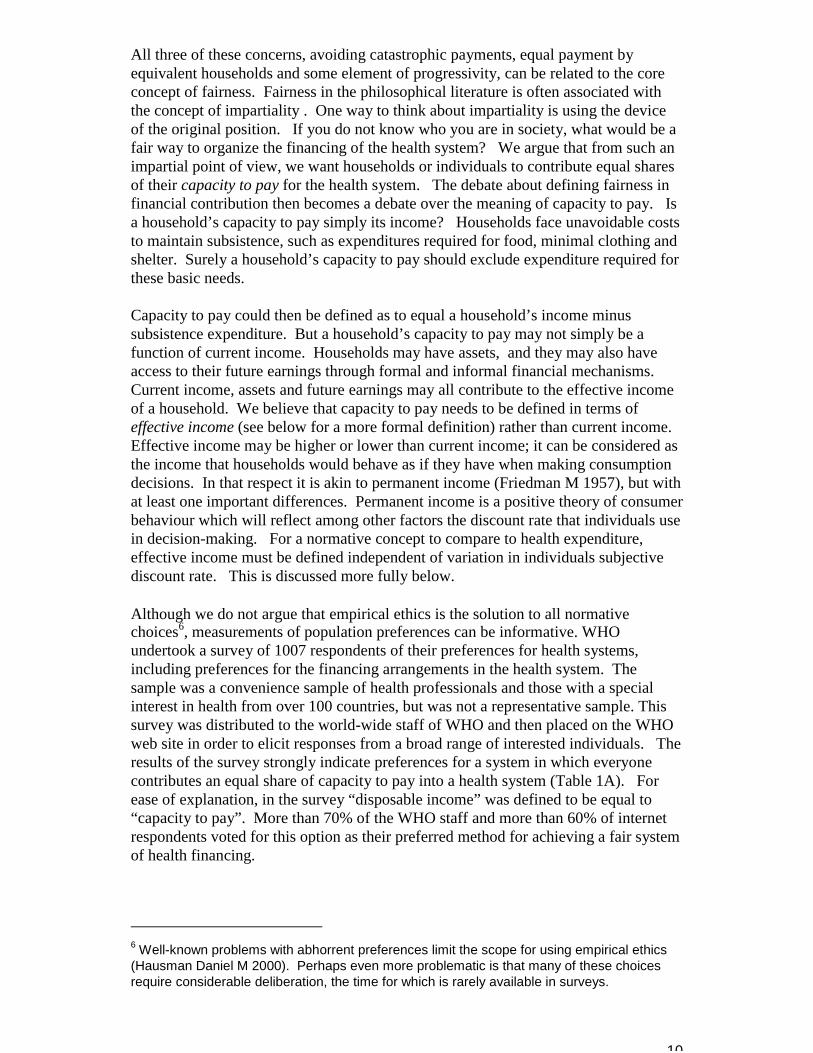
The extent to which health system contributions redistribute income is dominated bythe progressivity of the contributions, with the progressivity of each mode offinancing weighted by its importance relative to other sources.4 Several authors haveapplied the well-developed methods for evaluating the progressivity of tax paymentsto payments for health care.(Aronson JR, Johnson P, & Lambert PJ 1994;Kakwani K1977;Kakwani K, Wagstaff A, & Van Doorslaer E 1997;Kakwani N. 1997;Rasell E,Bernstein J, & Tang K 1994;Wagstaff A & Van Doorslaer E 1992;Wagstaff A & VanDoorslaer E 1993;Wagstaff A & Van Doorslaer E 1999;Wagstaff A., Van DoorslaerE, & Paci P 1989;Aronson JR, Johnson P, & Lambert PJ 1994;Aronson JR, JohnsonP, & Lambert PJ 1994;Aronson JR, Johnson P, & Lambert PJ 1994;Aronson JR,Johnson P, & Lambert PJ 1994;Aronson JR, Johnson P, & Lambert PJ 1994) Many ofthese studies have used the Kakwani index, which considers the degree to which apayment (for tax or health care) departs from proportionality, where proportionality ismeasured against the distribution of pre-payment income in the population. Themethod involves plotting ranked pre-payment income against the cumulativeproportion of health care payments. The area between the two distributions provides ameasure of the extent of regressivity or progressivity in health care payments relativeto that of income (Figure 2).5 When health system contributions are progressive theKakwani index will be positive and when health system contributions are regressivethe Kakwani index will be negative.
3 Unequal treatment of households with the same income by the tax system or the healthsystem can be further divided into two components: the extent to which the ranking ofhouseholds by income changes after payments for the health system, and the extent to whichthere is inequality in payments to the health system when households are ranked withinbands of similar post-payment income. For most purposes this distinction may not be thatinformative.
4 A progressive system of payments means that richer households pay a larger share of theirincome than poorer households. In a regressive system, the richer households pay a smallershare of income than poorer households.
5 The Kakwani index is formulated as the difference between the Gini coefficient for pre-payment income, and the concentration index for health care payments.
7
The analysis of progressivity using the Kakwani index has been applied to a number ofOECD countries.(Rasell E, Bernstein J, & Tang K 1994;Wagstaff A & Van Doorslaer E1993;Wagstaff A & Van Doorslaer E 1999;Wagstaff A., Van Doorslaer E, & Paci P1989;Wagstaff A., Van Doorslaer E, & Paci P 1989) These studies find that direct taxesare progressive in all developed countries, while indirect taxes are generally regressive.Social insurance is progressive in countries where coverage is universal, and regressivein those that exclude the higher income groups. Private insurance is regressive incountries such as the United States and Switzerland, because premiums are not relatedto income but are constant or related to risks. For those who purchase it, privateinsurance is often the sole source of coverage. Even when the poor do not buy insurance,the distribution can be regressive among those who do buy, because of the largedifferences in income.
A common finding of these studies is that out-of-pocket payment is regressive. It isparticularly so in countries where pre-paid health care does not cover the low-incomegroups. The overall findings show that in countries where health financing ispredominantly private, either via insurance or out-of-pocket payments, the system ismost regressive. Social insurance-based countries are mixed, depending on whetherthe higher income groups are permitted to opt out of the system. Tax-financedsystems are proportional or mildly progressive.
Several authors have analysed changes over time, the impact of reforms or proposedchanges in health financing within countries such as the United States, theNetherlands and Australia. These studies have measured the extent to which changesin financing have generated or would generate more or less progressive healthfinancing regimes.(Holahan J & Zedlewski S 2000;Lairson DR, Hindson P, &Hauquitz A 1995;Wagstaff A & Van Doorslaer E 1998)
Cumulative percent of population
Figure 2: Kakwani Index of Progressivity
Health contributionconcentration curve
Lorenz Curve of income*pre health contribution
Cum
ulat
ive
per
cent
of i
ncom
e* a
nd o
f hea
lth p
aym
ents
Adapted from: Van Doorslaer and Wagstaff, 1993.*May be income, expenditure, or some other measure of capacity to pay.
100
00
8
Information on vertical equity in developing countries is scarce. Several studies haveshown that in some countries, all families, including the poor, spend a high share oftheir budget on out of pocket health spending.(Hotchkiss DR et al. 1998) In Thailandand Mexico, the poor spend a higher proportion of their income on out-of-pockethealth spending than the rich. Further, the regressivity of out-of-pocket spending isrelated to the degree to which populations are covered by pre-paid insurance schemes.(Frenk J, Lozano R, & González Block MA. 1994;Pannarunothai & Mills 1997)Astudy of Jamaica, Ghana, Côte d’Ivoire, Peru and Bolivia using Living StandardMeasurement Surveys, concluded that health financing channelled through the publicsector did little to ameliorate inequalities in spending and access to health care.(BakerJL & van der Gaag J 1993) Efforts are under-way to extend the work on theprogressivity of health financing in OECD countries to the developing world,particularly to Latin America and the Caribbean. Some early results from thesestudies have shown a heavy reliance on out-of-pocket payment that varies from 30 to60% of health finance. Further, out-of-pocket payments are regressive in a number ofcountries, and exacerbate the existing inequalities in the distribution of income.(Gonzalez Pier E & Parker S 1999;Lasprilla E, ObandoC, & Encalad E Lasprilla C1999;Suarez RM 1999;Valladares R & Barillas E 1999)A recent study of healthfinancing in Mexico using Kakwani indices found that overall the system is close toneutral, out of pocket spending is regressive and other sources of finance tend to besomewhat progressive.(Gonzalez Pier E & Parker S 1999)
When health system payments differ for households with the same income, the impacton income redistribution is less than if households of the same income paid the sameamount. This is a central issue in studies of horizontal equity within the context of thetotal re-distributive effect. Empirical studies of this effect in OECD countries show itto be relatively small. There are few studies of the effect of horizontal equity onincome redistribution in developing countries. Although not part of the equity in health finance literature, another type of study thatis relevant to fairness of financial contribution attempts to quantify the extent ofcatastrophic or impoverishing payments for healthcare.(Frenk J, Lozano R, &González Block MA. 1994) While few such studies exist, impoverishment has beenrecognized as a critical dimension for policy. In summary, work to date relevant to evaluating the fairness of financial contributionhas proceeded in three main directions. First, the dominant conceptual framework isto analyze equity of the health financing system by its contribution to incomeredistribution. In practice, this means a focus on progressivity. This work has clearlybeen important, useful and influential, but the concept of fairness is much broaderthan this concern for income redistribution. For example, most would agree thatwhen households face catastrophic payments to purchase needed healthcare that thisis undesirable and unfair. Yet, catastrophic payments for rich households mightactually improve the distribution of income and catastrophic payments for a smallnumber of poor households would have a negligible effect on overall incomedistribution. Second, most of the empirical work has been on developed countrysystems. Third, the recent trend in the literature is to link analyses of payments to thehealth system to the analysis of the distribution of the benefits of the health system. In the WHO Framework for Health Systems Performance Assessment, the ultimateimpact of the distribution of healthcare resources should be captured in the
9
measure of fairness in financial contribution.
V. Concepts and TheoryIn this section, we define our concept of fairness, operationalize this definition andpropose a summary measure or index to compare the fairness of financial contributionin two different populations.
A. Conceptual FrameworkLet us explore the concept of a fair distribution of contributions to the health systemacross households with a completely different point of reference. Societies do notpurchase health systems in order to redistribute income. Societies may have a veryimportant social goal to redistribute income through government tax policy but thiscan be achieved through many mechanisms unrelated to the overall financing of thehealth system. A parsimonious list of goals for the health system to achieve is notlikely to include income redistribution as one of the main goals. Rather, given incomeredistribution efforts in society, there are still ways to finance the health system thatare more fair than others.
We begin this discussion of the conceptual basis for measuring fairness of financialcontribution with the question: what is a maximally fair distribution of financialcontribution to the health system? This normative discussion is a useful basis formaking sure that any measure captures the critical dimensions of fairness andprovides some basis for establishing meaningful endpoints for any scale. Ultimately,the measure of fairness may be used only to describe the state of affairs in differentpopulations. Nevertheless, starting from some explicit normative discussion will helpclarify the meaning of the measurements. The following discussion will lead us to amore inclusive formulation of fairness than has been the focus of much of theliterature in developed countries reviewed above.
To explore notions of fairness in financial contribution, we can start by identifyingwhat is unfair. Almost everyone would agree that catastrophic payments areundesirable and unfair. Imagine two systems, one in which health, health inequality,responsiveness and responsiveness inequality are identical but in one system twopercent of households make catastrophic payments and in the other zero percent. Mostwould prefer the zero percent.
Unequal payments by equivalent households are also unfair. The concern that shouldbe given equal consideration is a powerful influence on the formulation of socialsystems. For example, widely different shares of income going to pay for healthinsurance in different German sickness funds was broadly seen as unfair, leading tothe risk equalization reforms of the 1990s.(Wagstaff A & Van Doorslaer E 1998)
Finally, many think that fairness should include some notion that the rich contributemore for the health system than the poor on a per capita basis. This concern can bedistinct from a general consideration of income redistribution. This special concernfor how the health system is financed may stem from the special nature of health itselfas an ingredient to opportunity and the pursuit of the good life.
10
All three of these concerns, avoiding catastrophic payments, equal payment byequivalent households and some element of progressivity, can be related to the coreconcept of fairness. Fairness in the philosophical literature is often associated withthe concept of impartiality . One way to think about impartiality is using the deviceof the original position. If you do not know who you are in society, what would be afair way to organize the financing of the health system? We argue that from such animpartial point of view, we want households or individuals to contribute equal sharesof their capacity to pay for the health system. The debate about defining fairness infinancial contribution then becomes a debate over the meaning of capacity to pay. Isa household’s capacity to pay simply its income? Households face unavoidable coststo maintain subsistence, such as expenditures required for food, minimal clothing andshelter. Surely a household’s capacity to pay should exclude expenditure required forthese basic needs. Capacity to pay could then be defined as to equal a household’s income minussubsistence expenditure. But a household’s capacity to pay may not simply be afunction of current income. Households may have assets, and they may also haveaccess to their future earnings through formal and informal financial mechanisms. Current income, assets and future earnings may all contribute to the effective incomeof a household. We believe that capacity to pay needs to be defined in terms ofeffective income (see below for a more formal definition) rather than current income. Effective income may be higher or lower than current income; it can be considered asthe income that households would behave as if they have when making consumptiondecisions. In that respect it is akin to permanent income (Friedman M 1957), but withat least one important differences. Permanent income is a positive theory of consumerbehaviour which will reflect among other factors the discount rate that individuals usein decision-making. For a normative concept to compare to health expenditure,effective income must be defined independent of variation in individuals subjectivediscount rate. This is discussed more fully below.
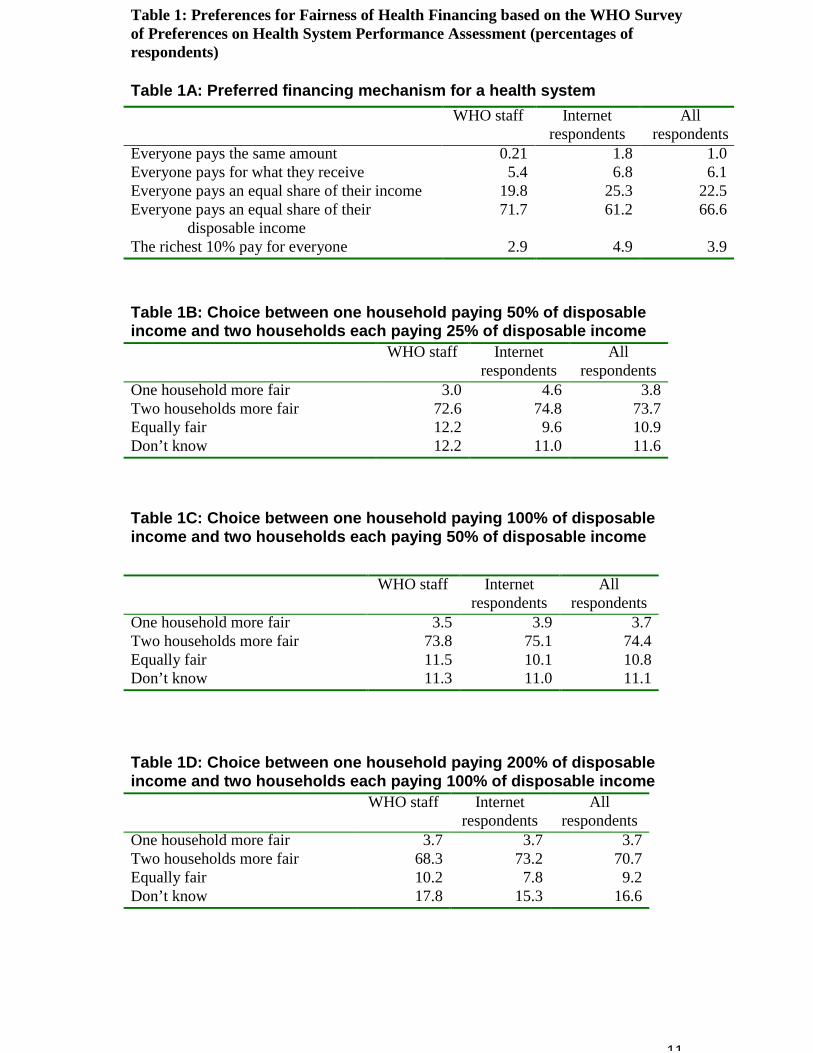
Although we do not argue that empirical ethics is the solution to all normativechoices6, measurements of population preferences can be informative. WHOundertook a survey of 1007 respondents of their preferences for health systems,including preferences for the financing arrangements in the health system. Thesample was a convenience sample of health professionals and those with a specialinterest in health from over 100 countries, but was not a representative sample. Thissurvey was distributed to the world-wide staff of WHO and then placed on the WHOweb site in order to elicit responses from a broad range of interested individuals. Theresults of the survey strongly indicate preferences for a system in which everyonecontributes an equal share of capacity to pay into a health system (Table 1A). Forease of explanation, in the survey “disposable income” was defined to be equal to“capacity to pay”. More than 70% of the WHO staff and more than 60% of internetrespondents voted for this option as their preferred method for achieving a fair systemof health financing.
6 Well-known problems with abhorrent preferences limit the scope for using empirical ethics(Hausman Daniel M 2000). Perhaps even more problematic is that many of these choicesrequire considerable deliberation, the time for which is rarely available in surveys.
11
Table 1: Preferences for Fairness of Health Financing based on the WHO Surveyof Preferences on Health System Performance Assessment (percentages ofrespondents)
Table 1A: Preferred financing mechanism for a health systemWHO staff Internet
respondentsAll
respondentsEveryone pays the same amount 0.21 1.8 1.0Everyone pays for what they receive 5.4 6.8 6.1Everyone pays an equal share of their income 19.8 25.3 22.5Everyone pays an equal share of their
disposable income71.7 61.2 66.6
The richest 10% pay for everyone 2.9 4.9 3.9
Table 1B: Choice between one household paying 50% of disposableincome and two households each paying 25% of disposable income
WHO staff Internetrespondents
Allrespondents
One household more fair 3.0 4.6 3.8Two households more fair 72.6 74.8 73.7Equally fair 12.2 9.6 10.9Don’t know 12.2 11.0 11.6
Table 1C: Choice between one household paying 100% of disposableincome and two households each paying 50% of disposable income
WHO staff Internetrespondents
Allrespondents
One household more fair 3.5 3.9 3.7Two households more fair 73.8 75.1 74.4Equally fair 11.5 10.1 10.8Don’t know 11.3 11.0 11.1
Table 1D: Choice between one household paying 200% of disposableincome and two households each paying 100% of disposable income
WHO staff Internetrespondents
Allrespondents
One household more fair 3.7 3.7 3.7Two households more fair 68.3 73.2 70.7Equally fair 10.2 7.8 9.2Don’t know 17.8 15.3 16.6
12
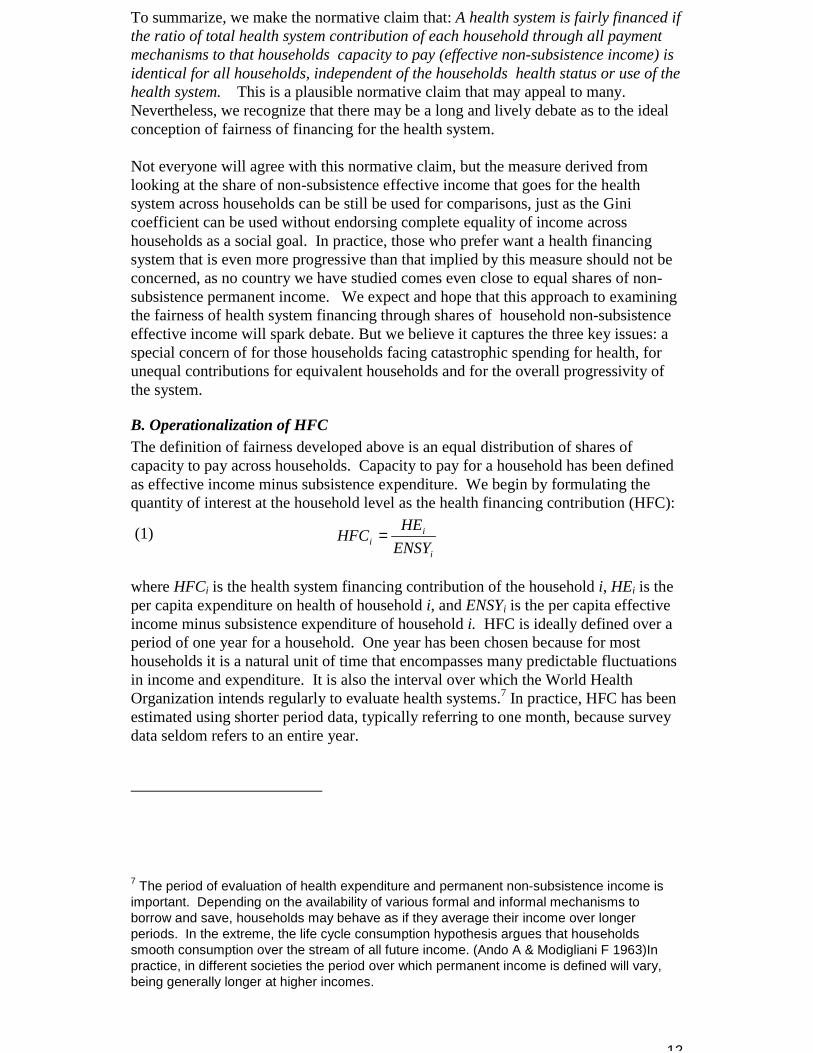
To summarize, we make the normative claim that: A health system is fairly financed ifthe ratio of total health system contribution of each household through all paymentmechanisms to that households capacity to pay (effective non-subsistence income) isidentical for all households, independent of the households health status or use of thehealth system. This is a plausible normative claim that may appeal to many. Nevertheless, we recognize that there may be a long and lively debate as to the idealconception of fairness of financing for the health system.
Not everyone will agree with this normative claim, but the measure derived fromlooking at the share of non-subsistence effective income that goes for the healthsystem across households can be still be used for comparisons, just as the Ginicoefficient can be used without endorsing complete equality of income acrosshouseholds as a social goal. In practice, those who prefer want a health financingsystem that is even more progressive than that implied by this measure should not beconcerned, as no country we have studied comes even close to equal shares of non-subsistence permanent income. We expect and hope that this approach to examiningthe fairness of health system financing through shares of household non-subsistenceeffective income will spark debate. But we believe it captures the three key issues: aspecial concern of for those households facing catastrophic spending for health, forunequal contributions for equivalent households and for the overall progressivity ofthe system.
B. Operationalization of HFCThe definition of fairness developed above is an equal distribution of shares ofcapacity to pay across households. Capacity to pay for a household has been definedas effective income minus subsistence expenditure. We begin by formulating thequantity of interest at the household level as the health financing contribution (HFC):
(1) i
ii ENSY
HEHFC =
where HFCi is the health system financing contribution of the household i, HEi is theper capita expenditure on health of household i, and ENSYi is the per capita effectiveincome minus subsistence expenditure of household i. HFC is ideally defined over aperiod of one year for a household. One year has been chosen because for mosthouseholds it is a natural unit of time that encompasses many predictable fluctuationsin income and expenditure. It is also the interval over which the World HealthOrganization intends regularly to evaluate health systems.7 In practice, HFC has beenestimated using shorter period data, typically referring to one month, because surveydata seldom refers to an entire year.
7 The period of evaluation of health expenditure and permanent non-subsistence income isimportant. Depending on the availability of various formal and informal mechanisms toborrow and save, households may behave as if they average their income over longerperiods. In the extreme, the life cycle consumption hypothesis argues that householdssmooth consumption over the stream of all future income. (Ando A & Modigliani F 1963)Inpractice, in different societies the period over which permanent income is defined will vary,being generally longer at higher incomes.
13
The numerator (HEi) includes all financial contributions to the health systemattributable to the household through taxes, social security contributions, privateinsurance, and direct, out-of-pocket payments. These include financial outlays that thehousehold itself is not necessarily aware of paying, such as the share of sales or value-added taxes that governments then devote to health. For taxes that are not earmarkedand for social security contributions, total household payments must be multiplied bythe share of these revenues that ultimately goes to finance the health system. 8
To operationalize the denominator of HFC, we need to define effective income andsubsistence expenditure. Our notion of effective income is meant to reflect householdtendencies to smooth consumption over time, taking account of expected variationsin income over the course of the year, their assets (allowing for saving or non-saving)and their future earnings potential. There is a rich literature in economics offeringdifferent theories of how households make consumption decisions. For example, inthe life cycle income hypothesis, households are assumed to smooth theirconsumption over the life cycle, such that expected consumption is equal in allsubsequent time periods. One formulisation of this theory of consumption behaviourthat is adapted to the circumstances of health is:
(2)
=
=
+
++= l
t
tt
l
t
ttt0
0
P
PYAYC
1
10
1 δ
δ
Where C0 is the consumption of a household at time t = 0, given complete access tomechanisms to smooth consumption and consume assets, Yt is the income at time t >0, Pt is the probability of being alive in each future year, Ao is the net value of assets(savings or debts) at time t = 0, and δ is 1/(1+r), where r is the market interest ordiscount rate, equal for all households .
The life cycle hypothesis is a positive theory of consumer behaviour. In this context,the discount rate must be the discount rate of the individual or household. However,for the purposes of defining the capacity to pay of a household, we do not want to usethe subjective present value of future consumption, but rather the financial presentvalue. In other words, the discount rate should be the market rate of interest. The lifecycle income hypothesis is particularly important for three sets of circumstances:when households face predictable fluctuations in income during the course of theyear, when their income in future years is expected to change and when they havepositive assets or negative assets (debts). A household is likely to consume in a year,more or less, than it earns, in all of these circumstances.
8 Two potentially important sources of finance for the health system in some countries, donorassistance and government non-tax revenue through the sale of assets such as oil, needfurther discussion. Donor assistance is paid for by households in other countries throughvoluntary contributions or taxes; therefore, we do not include donor assistance in thedefinition of household health expenditure in the recipient country. Oil revenue or the sale ofany other national asset is a more difficult issue. One argument holds that national assets areowned equally by all households. Thus government revenues from their sale should beattributed in equal amounts to all households. Such financing would appear to be extremelyregressive because the same dollar value of sales for a poor household would be a muchlarger share of income than for a rich household. Alternatively, it can be argued that sale ofassets should be treated in the same way as donor assistance and not attributed tohouseholds in the analysis of fairness in financial contribution, so that it has no effect on themeasure. A third possibility is to attribute in proportion to the capacity to pay, so the effect isneutral.
14
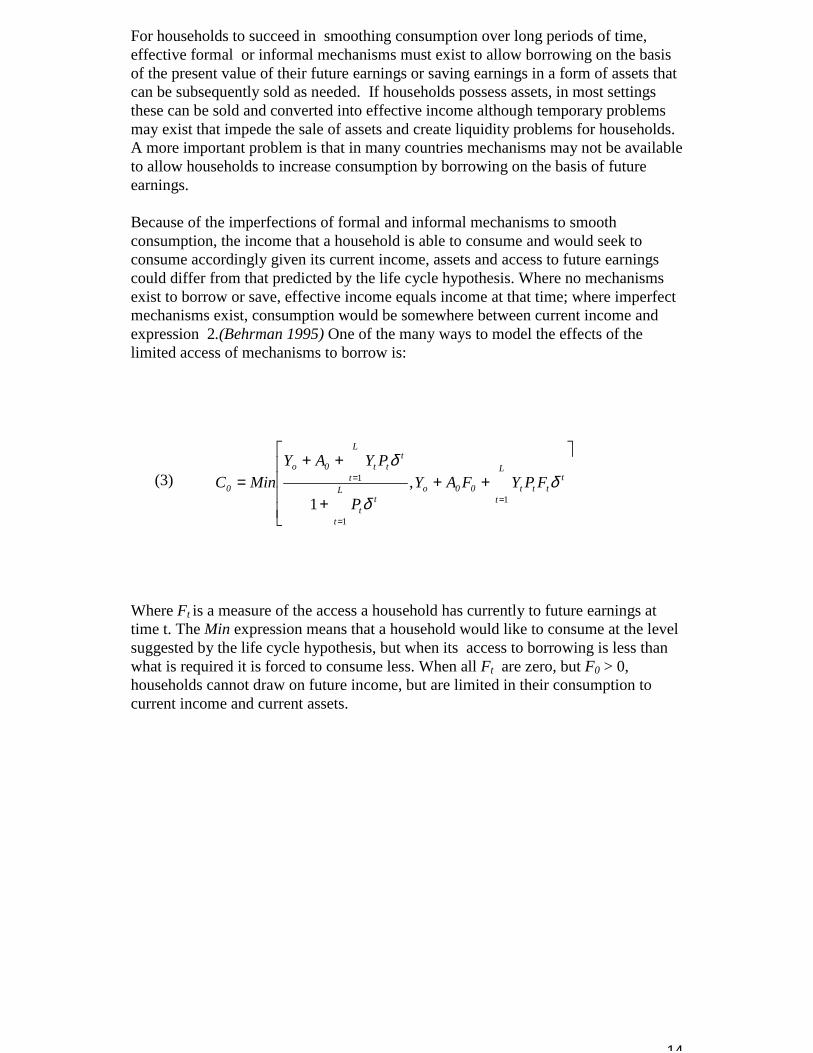
For households to succeed in smoothing consumption over long periods of time,effective formal or informal mechanisms must exist to allow borrowing on the basisof the present value of their future earnings or saving earnings in a form of assets thatcan be subsequently sold as needed. If households possess assets, in most settingsthese can be sold and converted into effective income although temporary problemsmay exist that impede the sale of assets and create liquidity problems for households. A more important problem is that in many countries mechanisms may not be availableto allow households to increase consumption by borrowing on the basis of futureearnings. Because of the imperfections of formal and informal mechanisms to smoothconsumption, the income that a household is able to consume and would seek toconsume accordingly given its current income, assets and access to future earningscould differ from that predicted by the life cycle hypothesis. Where no mechanismsexist to borrow or save, effective income equals income at that time; where imperfectmechanisms exist, consumption would be somewhere between current income andexpression 2.(Behrman 1995) One of the many ways to model the effects of thelimited access of mechanisms to borrow is:
(3) 0C
�
����
�
�
+++
++=
=
=
=L
t
tttt00oL
t
tt
L
t
ttt0o
FPYFAYP
PYAYMin
1
1
1 ,1
δδ
δ
Where Ft is a measure of the access a household has currently to future earnings attime t. The Min expression means that a household would like to consume at the levelsuggested by the life cycle hypothesis, but when its access to borrowing is less thanwhat is required it is forced to consume less. When all Ft are zero, but F0 > 0,households cannot draw on future income, but are limited in their consumption tocurrent income and current assets.
15
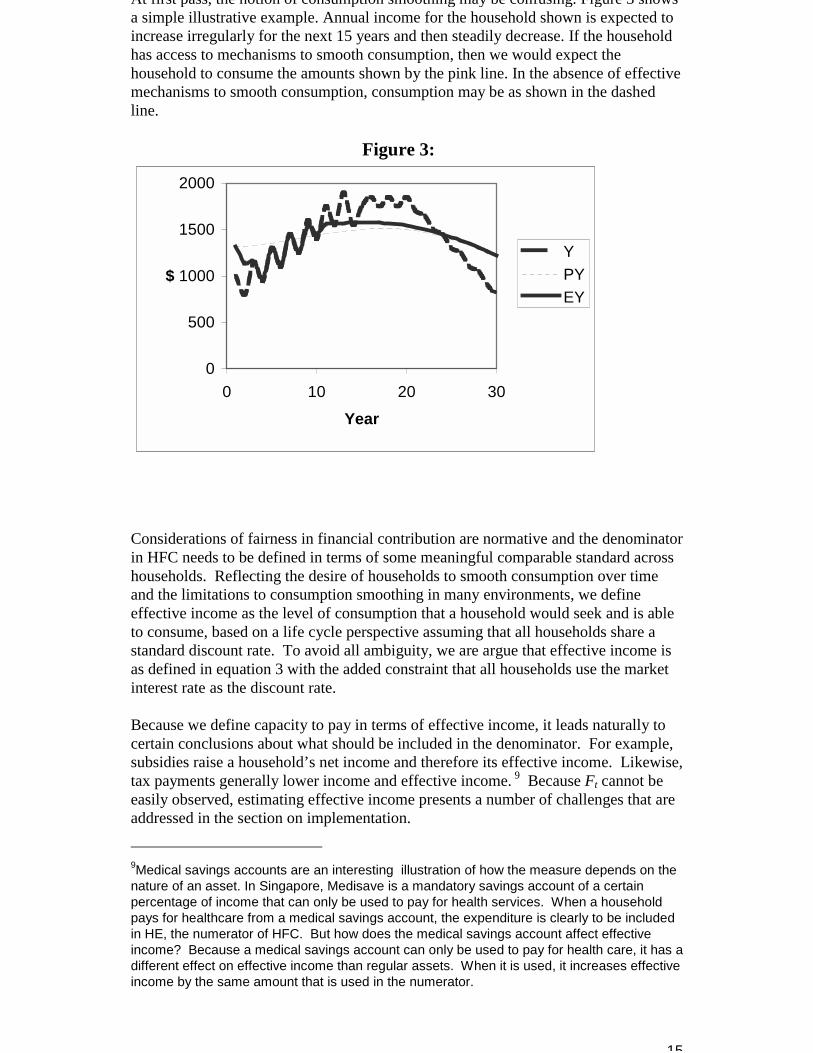
At first pass, the notion of consumption smoothing may be confusing. Figure 3 showsa simple illustrative example. Annual income for the household shown is expected toincrease irregularly for the next 15 years and then steadily decrease. If the householdhas access to mechanisms to smooth consumption, then we would expect thehousehold to consume the amounts shown by the pink line. In the absence of effectivemechanisms to smooth consumption, consumption may be as shown in the dashedline.
Figure 3:
0
500
1000
1500
2000
0 10 20 30Year
$YPYEY
Considerations of fairness in financial contribution are normative and the denominatorin HFC needs to be defined in terms of some meaningful comparable standard acrosshouseholds. Reflecting the desire of households to smooth consumption over timeand the limitations to consumption smoothing in many environments, we defineeffective income as the level of consumption that a household would seek and is ableto consume, based on a life cycle perspective assuming that all households share astandard discount rate. To avoid all ambiguity, we are argue that effective income isas defined in equation 3 with the added constraint that all households use the marketinterest rate as the discount rate. Because we define capacity to pay in terms of effective income, it leads naturally tocertain conclusions about what should be included in the denominator. For example,subsidies raise a household’s net income and therefore its effective income. Likewise,tax payments generally lower income and effective income. 9 Because Ft cannot beeasily observed, estimating effective income presents a number of challenges that areaddressed in the section on implementation. 9Medical savings accounts are an interesting illustration of how the measure depends on thenature of an asset. In Singapore, Medisave is a mandatory savings account of a certainpercentage of income that can only be used to pay for health services. When a householdpays for healthcare from a medical savings account, the expenditure is clearly to be includedin HE, the numerator of HFC. But how does the medical savings account affect effectiveincome? Because a medical savings account can only be used to pay for health care, it has adifferent effect on effective income than regular assets. When it is used, it increases effectiveincome by the same amount that is used in the numerator.
16
The second step in defining capacity to pay is to define expenditure required forsubsistence. There is an extensive literature on basic needs which addresses thisquestion .(Sen A 1981;Sen A 1984;Sen A 1985;Streeten P et al. 1981)Clearly,subsistence expenditure for the purposes of defining HFC should not includeexpenditure on health even if it is seen as essential. Subsistence minimally includesexpenditure on food, basic shelter and minimal clothing. Implementation of thedefinition of subsistence will address the important problem of using definitions thatare comparable across populations. Household composition will have an important effect on total subsistenceexpenditure. The capacity to pay and thus HFC will, therefore, reflect differencesacross households in their composition. In principle, it will be important to developestimates of actual subsistence requirements for different households that reflect thecomposition of households and their circumstances. Expenditure required forsubsistence can vary with local events. For example, during a famine the fraction ofincome required to purchase subsistence needs may increase dramatically. Theconceptualization of HFC as effective non-subsistence income (ENSY) captures theseeffects.
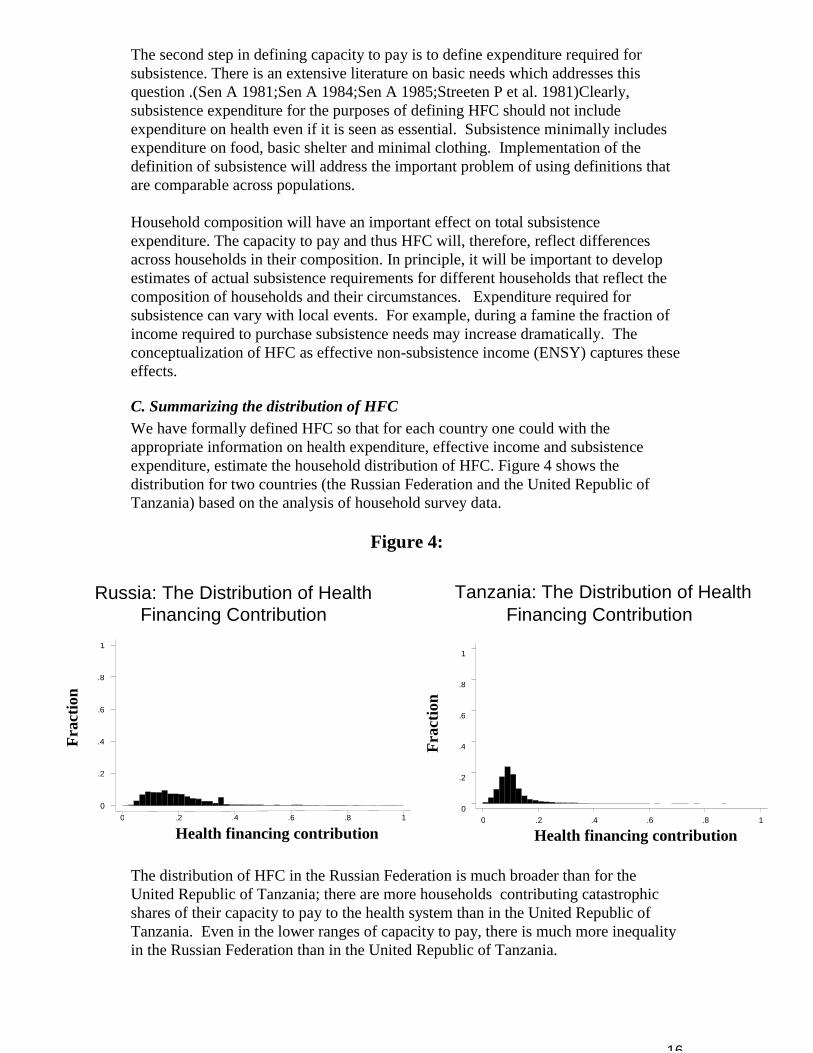
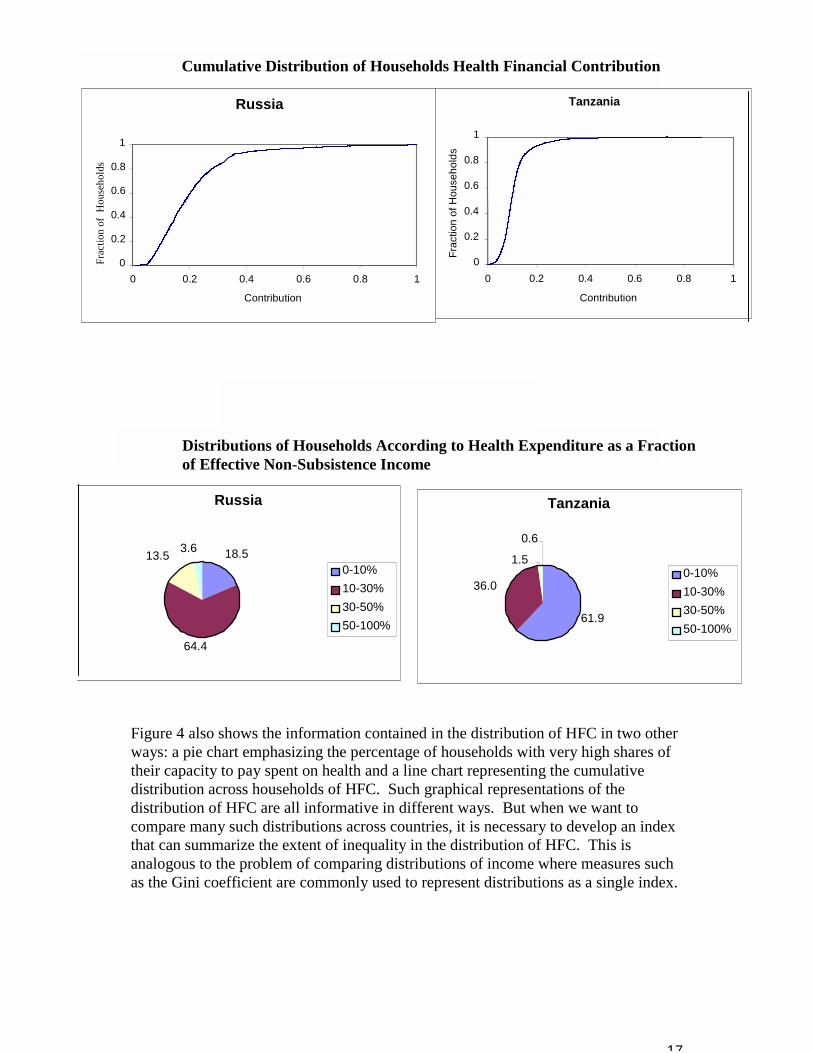
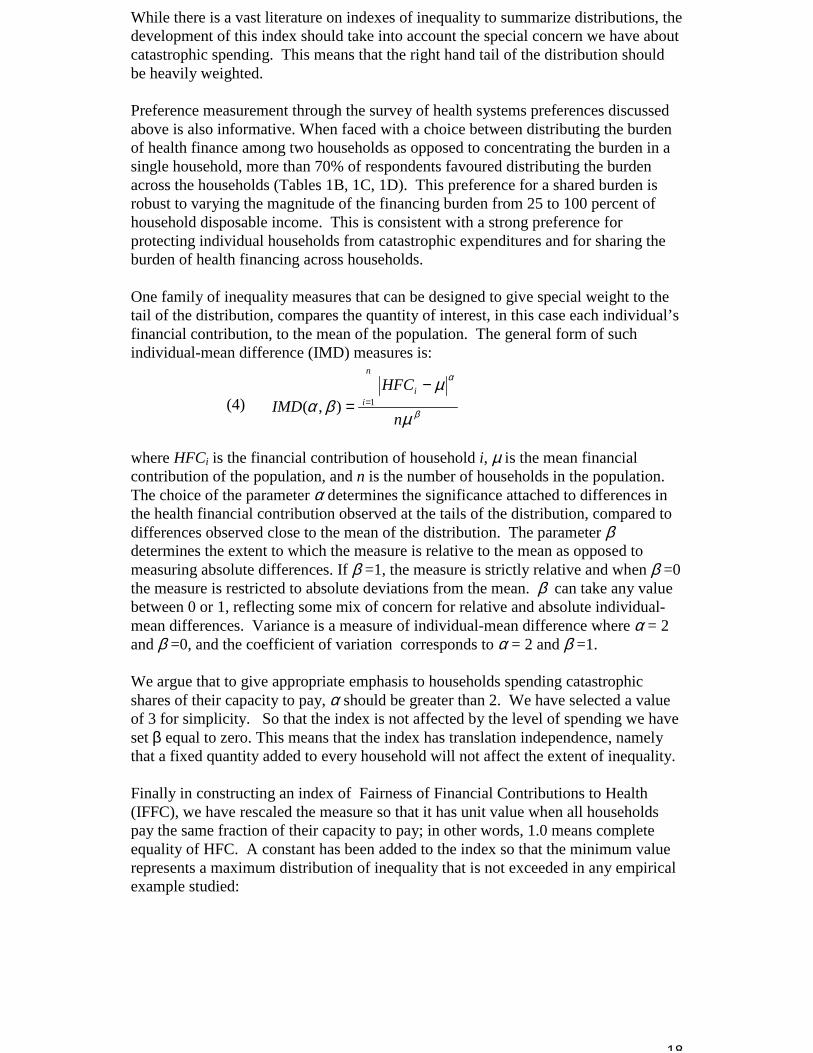
C. Summarizing the distribution of HFCWe have formally defined HFC so that for each country one could with theappropriate information on health expenditure, effective income and subsistenceexpenditure, estimate the household distribution of HFC. Figure 4 shows thedistribution for two countries (the Russian Federation and the United Republic ofTanzania) based on the analysis of household survey data.
Figure 4:
The distribution of HFC in the Russian Federation is much broader than for theUnited Republic of Tanzania; there are more households contributing catastrophicshares of their capacity to pay to the health system than in the United Republic ofTanzania. Even in the lower ranges of capacity to pay, there is much more inequalityin the Russian Federation than in the United Republic of Tanzania.
Russia: The Distribution of HealthFinancing Contribution
Frac
tion
Health financing contribution0 .2 .4 .6 .8 1
0
.2
.4
.6
.8
1
Tanzania: The Distribution of HealthFinancing Contribution
Frac
tion
Health financing contribution0 .2 .4 .6 .8 1
0
.2
.4
.6
.8
1
17
Figure 4 also shows the information contained in the distribution of HFC in two otherways: a pie chart emphasizing the percentage of households with very high shares oftheir capacity to pay spent on health and a line chart representing the cumulativedistribution across households of HFC. Such graphical representations of thedistribution of HFC are all informative in different ways. But when we want tocompare many such distributions across countries, it is necessary to develop an indexthat can summarize the extent of inequality in the distribution of HFC. This isanalogous to the problem of comparing distributions of income where measures suchas the Gini coefficient are commonly used to represent distributions as a single index.
Tanzania
61.9
36.0
1.5
0.6
0-10%10-30%30-50%50-100%
Russia
18.5
64.4
13.5 3.6
0-10%10-30%30-50%50-100%
Distributions of Households According to Health Expenditure as a Fractionof Effective Non-Subsistence Income
Cumulative Distribution of Households Health Financial Contribution
Russia
0
0.2
0.4
0.6
0.8
1
0 0.2 0.4 0.6 0.8 1
Contribution
Frac
tion
of H
ouse
hold
sTanzania
0
0.2
0.4
0.6
0.8
1
0 0.2 0.4 0.6 0.8 1
Contribution
Frac
tion
of H
ouse
hold
s
18
While there is a vast literature on indexes of inequality to summarize distributions, thedevelopment of this index should take into account the special concern we have aboutcatastrophic spending. This means that the right hand tail of the distribution shouldbe heavily weighted. Preference measurement through the survey of health systems preferences discussedabove is also informative. When faced with a choice between distributing the burdenof health finance among two households as opposed to concentrating the burden in asingle household, more than 70% of respondents favoured distributing the burdenacross the households (Tables 1B, 1C, 1D). This preference for a shared burden isrobust to varying the magnitude of the financing burden from 25 to 100 percent ofhousehold disposable income. This is consistent with a strong preference forprotecting individual households from catastrophic expenditures and for sharing theburden of health financing across households.
One family of inequality measures that can be designed to give special weight to thetail of the distribution, compares the quantity of interest, in this case each individual’sfinancial contribution, to the mean of the population. The general form of suchindividual-mean difference (IMD) measures is:
(4) β
α
µ
µβα
n
HFCIMD
n
ii
=
−= 1),(
where HFCi is the financial contribution of household i, µ is the mean financialcontribution of the population, and n is the number of households in the population. The choice of the parameter α determines the significance attached to differences inthe health financial contribution observed at the tails of the distribution, compared todifferences observed close to the mean of the distribution. The parameter βdetermines the extent to which the measure is relative to the mean as opposed tomeasuring absolute differences. If β =1, the measure is strictly relative and when β =0the measure is restricted to absolute deviations from the mean. β can take any valuebetween 0 or 1, reflecting some mix of concern for relative and absolute individual-mean differences. Variance is a measure of individual-mean difference where α = 2and β =0, and the coefficient of variation corresponds to α = 2 and β =1.
We argue that to give appropriate emphasis to households spending catastrophicshares of their capacity to pay, α should be greater than 2. We have selected a valueof 3 for simplicity. So that the index is not affected by the level of spending we haveset β equal to zero. This means that the index has translation independence, namelythat a fixed quantity added to every household will not affect the extent of inequality.
Finally in constructing an index of Fairness of Financial Contributions to Health(IFFC), we have rescaled the measure so that it has unit value when all householdspay the same fraction of their capacity to pay; in other words, 1.0 means completeequality of HFC. A constant has been added to the index so that the minimum valuerepresents a maximum distribution of inequality that is not exceeded in any empiricalexample studied:
19
(5)
�
����
�
� −−= =
n
HFCHFCIFFC
n
ii
125.041 1
3
We have compared results for a number of countries using some alternative values ofα. For example, there is little impact of changing α from 2 to 3. We expect tocontinue work in this area in order to explore the properties of other indexes tosummarize the distribution of HFC. We also intend to investigate individualpreferences further as a basis for guiding the selection of the parameters and rescalingof the index.
D. Other aspects of the distribution of HFCAs with any measure, there are some issues that are not captured in the distribution ofHFC or in the IFFC. It is important to note that the distribution of HFC will notshow if a poor household chooses not to purchase healthcare because it isunaffordable. In this sense, a fair distribution of HFC may mask a situation wherepoor households have opted out of the system and are not receiving needed healthservices. This lack of financial access to needed services will reduce overall health ofthe population and increase health inequality. It is also likely to reduceresponsiveness and increase responsiveness inequality. This simply emphasizes theimportance of judging the overall equity of a health system in terms of the distributionof health, responsiveness and financial contribution. The relation between the distribution of HFC and the extent of financial riskprotection in a population is important. Measures of financial risk protection such asthe coverage of insurance are difficult to interpret because the benefits packages, co-payments and premiums for insurance vary so much within and across populations.The ex post distribution of health expenditure across households is a good estimatorof the average ex ante distribution of financial risk in the population. In other words,in a very large sample, the distribution of health expenditure last year (the ex postdistribution) will equal the average ex ante distribution of financial risk acrosshouseholds. Because health expenditure is in the numerator of HFC, changes in theex ante distribution of financial risk will be reflected in changes in the distribution ofHFC. Nevertheless, it is important to recognize that the distribution of HFC may notcapture all the inequality in the distribution of ex ante financial risk protection. However, if average ex ante financial risk is correlated with effective income orsubsistence payments then the distribution of HFC will reflect these differences. Weconclude that because the ex post distribution of expenditure can be measured throughhousehold surveys and the ex ante distribution of financial risk is extremely difficultto measure, the distribution of HFC is a convenient and feasible measure of fairness infinancial contribution and of ex ante financial risk protection.
VI. Measurement Properties of the IFFCIn this section, we will use a hypothetical population to illustrate the properties of theIFFC: the distributions of income per capita, ex ante health expenditure risk, and foodexpenditure per capita are based on real populations. We use simulations that areexplained in more detail below to show how the distribution of HFC acrosshouseholds would change as prepayment mechanisms are introduced in a population
20
and as the progressivity of the fees or prepayments is increased. These simulationsalso allow us to explore the phenomenon of opting out and to contrast themeasurement properties of the IFFC and the widely used measure of vertical equity,the Kakwani index.
To calculate the distribution of HFC across households in a population, we needinformation on income, subsistence expenditure, and the risk of health expenditure. Health expenditure risk is a function of the available technology and its cost and therisk of illness. We have developed the simulations for a population of 2000households, which can be considered equivalent to monitoring fairness of financialcontribution in a larger population using a random sample survey of 2000 households. The assumed distributions of the key quantities have been developed from averagedresults from selected households surveys to make sure they are realistic.10,11
One important phenomenon that we want to present in these simulations is thathouseholds may need to borrow in order to pay for healthcare, because healthexpenditure exceeds the capacity of a household to pay. In the simulations, we haveassumed that households faced with a health expenditure that is three times greaterthan capacity to pay will choose to not pay and not to receive care.
Table 2 summarizes the base case when there is no prepayment to allow risk pooling. In the base case, 5.7% of households are spending more than 50% of their capacity topay for health. Four households in a thousand (0.4%) are choosing not to purchasecare because it is unaffordable. The IFFC is 0.347 and the Kakwani index is –0.3,showing how out-of-pocket payment is highly regressive. The figure of 5.7% ofhouseholds facing catastrophic payment is high, but lower than that found in a numberof countries in real survey results.(Xu et al. 2000)10Per capita income is simulated using a log normal distribution with quartiles at $US 562, 838(median) and 1251, corresponding to a mean of $US1000 and a standard deviation of$US650. The subsistence share is a decreasing share of total household expenditure and theparameters are drawn from the household survey data mentioned above. The formula forsubsistence expenditure (percentage spent on food) is :
(6) )ln(*exp( ii incomepctfd βα +=
Where α== 2.24 and β== -0.5Health expenditure risk is simulated using a log normal distribution with quartiles at $US 14,25 (median) and 67, corresponding to a mean of $US60 and a standard deviation of $US100.The mean corresponds to an average of 6% health expenditure across countries. Again, thedistribution is parameterised using survey data for out of pocket expenditure. Using realisedexpenditure as a proxy for ex ante health expenditure risk has certain caveats. These twovariables will tend to coincide, at least ex post, when there is risk pooling. Still, using therealised expenditure from survey data does not provide information on the risk from healthneeds, but only the distribution of those needs that actually resulted in expenditure. The riskassociated with actual health need may be either less or more that realised expenditure. Inthe absence of independent data on medical needs, we draw a distribution from the surveydata
11In this simulation, we assume that the distribution of ex ante health expenditure risk is thesame for all households. In fact, the distribution may be shifted to the right for poorerhouseholds because they have worse health status. This covariance between the ex antedistribution of health expenditure risk and income per capita is not included in this illustration.
21
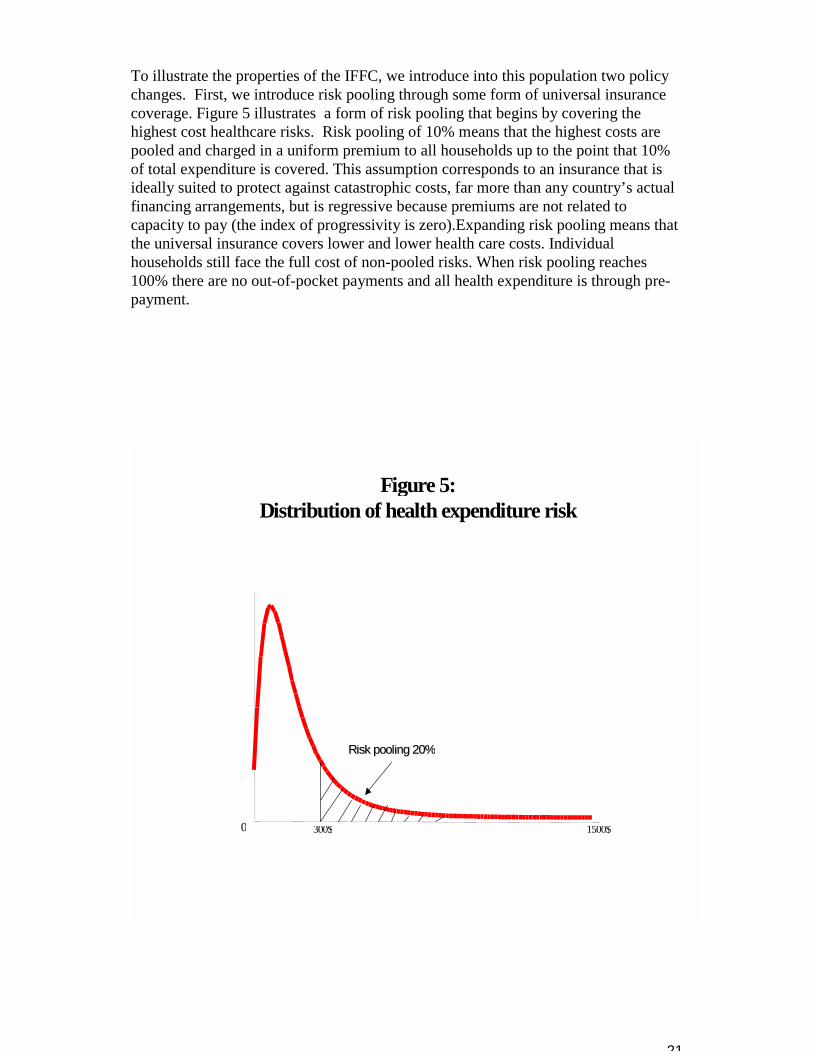
To illustrate the properties of the IFFC, we introduce into this population two policychanges. First, we introduce risk pooling through some form of universal insurancecoverage. Figure 5 illustrates a form of risk pooling that begins by covering thehighest cost healthcare risks. Risk pooling of 10% means that the highest costs arepooled and charged in a uniform premium to all households up to the point that 10%of total expenditure is covered. This assumption corresponds to an insurance that isideally suited to protect against catastrophic costs, far more than any country’s actualfinancing arrangements, but is regressive because premiums are not related tocapacity to pay (the index of progressivity is zero).Expanding risk pooling means thatthe universal insurance covers lower and lower health care costs. Individualhouseholds still face the full cost of non-pooled risks. When risk pooling reaches100% there are no out-of-pocket payments and all health expenditure is through pre-payment.
Figure 5:Distribution of health expenditure risk
0 1500$300$
Risk pooling 20%Risk pooling 20%
22
Figure 6:
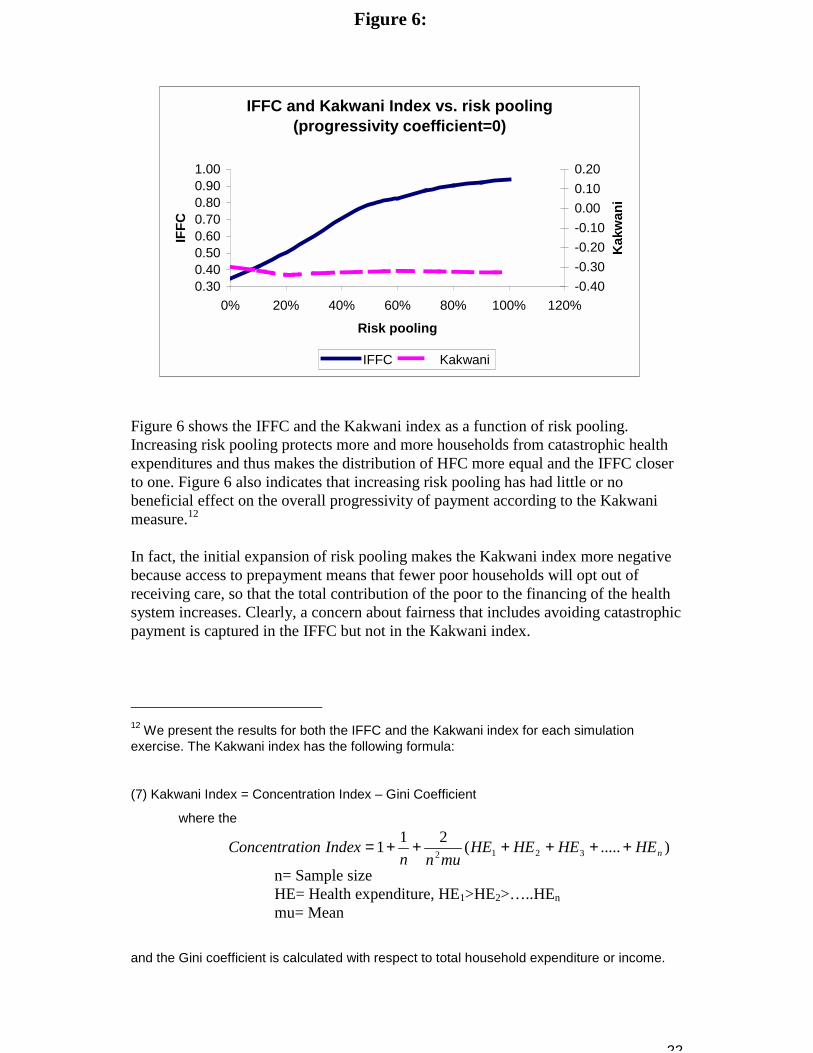
Figure 6 shows the IFFC and the Kakwani index as a function of risk pooling. Increasing risk pooling protects more and more households from catastrophic healthexpenditures and thus makes the distribution of HFC more equal and the IFFC closerto one. Figure 6 also indicates that increasing risk pooling has had little or nobeneficial effect on the overall progressivity of payment according to the Kakwanimeasure.12
In fact, the initial expansion of risk pooling makes the Kakwani index more negativebecause access to prepayment means that fewer poor households will opt out ofreceiving care, so that the total contribution of the poor to the financing of the healthsystem increases. Clearly, a concern about fairness that includes avoiding catastrophicpayment is captured in the IFFC but not in the Kakwani index.
12 We present the results for both the IFFC and the Kakwani index for each simulationexercise. The Kakwani index has the following formula:
(7) Kakwani Index = Concentration Index – Gini Coefficient
where the
).....(211 3212 nHEHEHEHEmunn
IndexionConcentrat ++++++=
n= Sample sizeHE= Health expenditure, HE1>HE2>…..HEnmu= Mean
and the Gini coefficient is calculated with respect to total household expenditure or income.
IFFC and Kakwani Index vs. risk pooling(progressivity coefficient=0)
0.300.400.500.600.700.800.901.00
0% 20% 40% 60% 80% 100% 120%
Risk pooling
IFFC
-0.40-0.30-0.20-0.100.000.100.20
Kak
wan
i
IFFC Kakwani
23
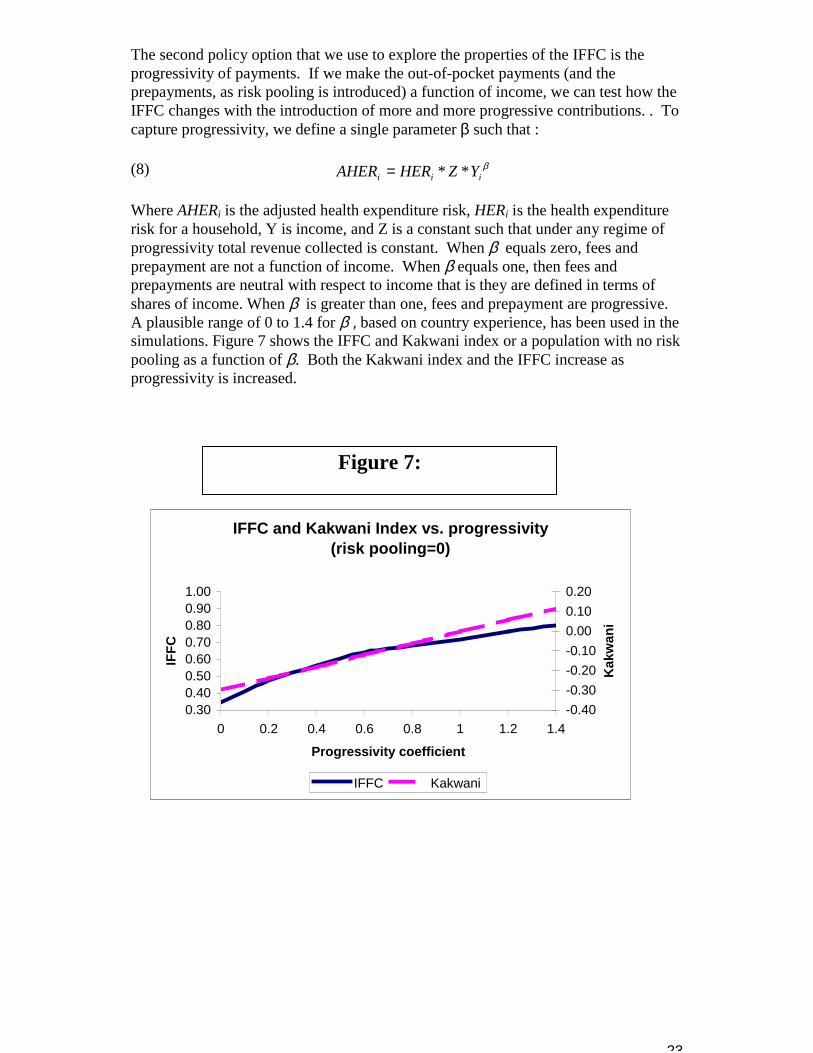
The second policy option that we use to explore the properties of the IFFC is theprogressivity of payments. If we make the out-of-pocket payments (and theprepayments, as risk pooling is introduced) a function of income, we can test how theIFFC changes with the introduction of more and more progressive contributions. . Tocapture progressivity, we define a single parameter β such that :
(8) βiii YZHERAHER **=
Where AHERi is the adjusted health expenditure risk, HERi is the health expenditurerisk for a household, Y is income, and Z is a constant such that under any regime ofprogressivity total revenue collected is constant. When β equals zero, fees andprepayment are not a function of income. When β equals one, then fees andprepayments are neutral with respect to income that is they are defined in terms ofshares of income. When β is greater than one, fees and prepayment are progressive. A plausible range of 0 to 1.4 for β=, based on country experience, has been used in thesimulations. Figure 7 shows the IFFC and Kakwani index or a population with no riskpooling as a function of β. Both the Kakwani index and the IFFC increase asprogressivity is increased.
IFFC and Kakwani Index vs. progressivity(risk pooling=0)
0.300.400.500.600.700.800.901.00
0 0.2 0.4 0.6 0.8 1 1.2 1.4
Progressivity coefficient
IFFC
-0.40-0.30-0.20-0.100.000.100.20
Kak
wan
i
IFFC Kakwani
Figure 7:
24
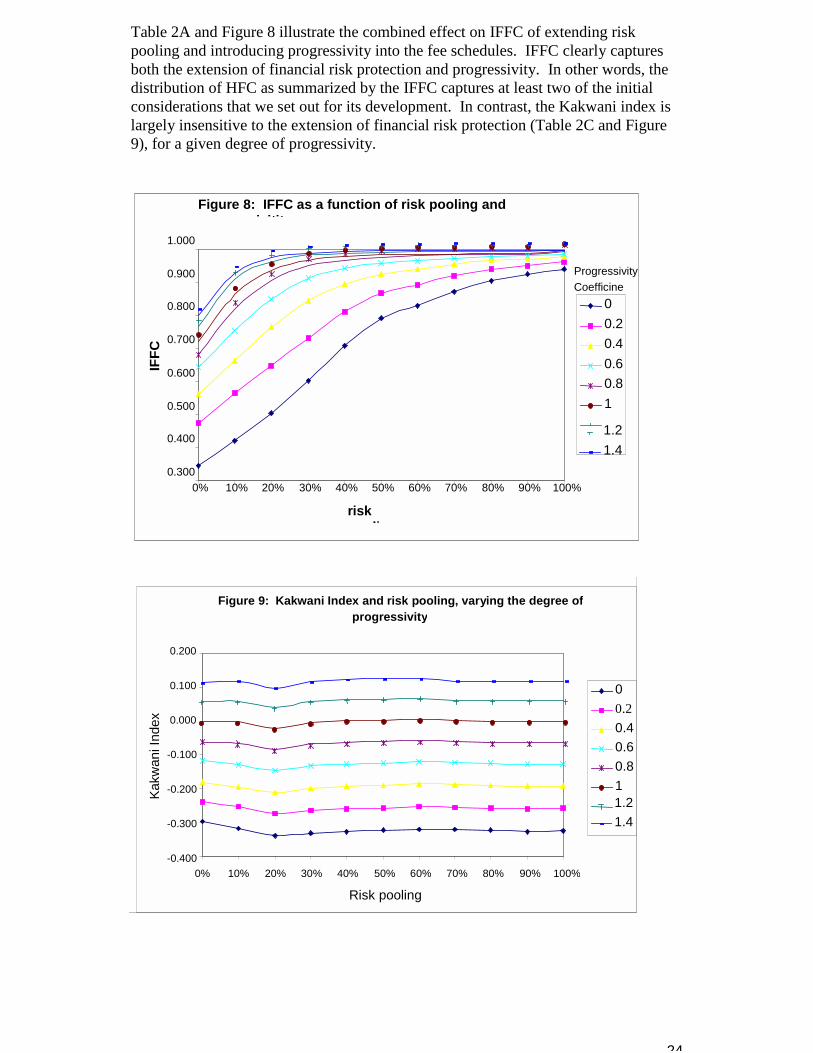
Table 2A and Figure 8 illustrate the combined effect on IFFC of extending riskpooling and introducing progressivity into the fee schedules. IFFC clearly capturesboth the extension of financial risk protection and progressivity. In other words, thedistribution of HFC as summarized by the IFFC captures at least two of the initialconsiderations that we set out for its development. In contrast, the Kakwani index islargely insensitive to the extension of financial risk protection (Table 2C and Figure9), for a given degree of progressivity.
Figure 8: IFFC as a function of risk pooling andi itit
0.300
0.400
0.500
0.600
0.700
0.800
0.900
1.000
0% 10% 20% 30% 40% 50% 60% 70% 80% 90% 100%
riskli
IFFC
00.20.40.60.81
1.21.4
ProgressivityCoefficinet
Figure 9: Kakwani Index and risk pooling, varying the degree ofprogressivity
-0.400
-0.300
-0.200
-0.100
0.000
0.100
0.200
0% 10% 20% 30% 40% 50% 60% 70% 80% 90% 100%
Risk pooling
Kakw
ani I
ndex
00.20.40.60.811.21.4
25
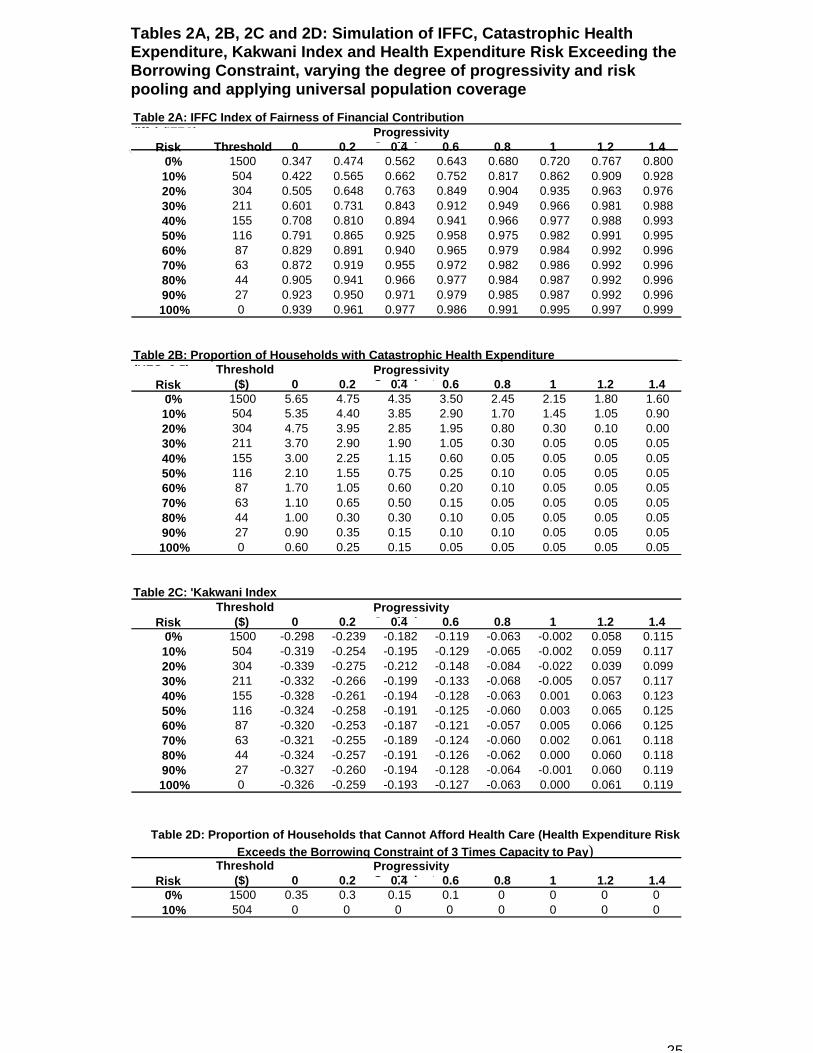
Tables 2A, 2B, 2C and 2D: Simulation of IFFC, Catastrophic HealthExpenditure, Kakwani Index and Health Expenditure Risk Exceeding theBorrowing Constraint, varying the degree of progressivity and riskpooling and applying universal population coverageTable 2A: IFFC Index of Fairness of Financial Contribution(iff ) (IFFC) Progressivity
C ffi i tRiskli
Threshold 0 0.2 0.4 0.6 0.8 1 1.2 1.40% 1500 0.347 0.474 0.562 0.643 0.680 0.720 0.767 0.80010% 504 0.422 0.565 0.662 0.752 0.817 0.862 0.909 0.92820% 304 0.505 0.648 0.763 0.849 0.904 0.935 0.963 0.97630% 211 0.601 0.731 0.843 0.912 0.949 0.966 0.981 0.98840% 155 0.708 0.810 0.894 0.941 0.966 0.977 0.988 0.99350% 116 0.791 0.865 0.925 0.958 0.975 0.982 0.991 0.99560% 87 0.829 0.891 0.940 0.965 0.979 0.984 0.992 0.99670% 63 0.872 0.919 0.955 0.972 0.982 0.986 0.992 0.99680% 44 0.905 0.941 0.966 0.977 0.984 0.987 0.992 0.99690% 27 0.923 0.950 0.971 0.979 0.985 0.987 0.992 0.996100% 0 0.939 0.961 0.977 0.986 0.991 0.995 0.997 0.999
Table 2B: Proportion of Households with Catastrophic Health Expenditure(HFC 0 5) Threshold Progressivity
C ffi i tRiskli
($) 0 0.2 0.4 0.6 0.8 1 1.2 1.40% 1500 5.65 4.75 4.35 3.50 2.45 2.15 1.80 1.6010% 504 5.35 4.40 3.85 2.90 1.70 1.45 1.05 0.9020% 304 4.75 3.95 2.85 1.95 0.80 0.30 0.10 0.0030% 211 3.70 2.90 1.90 1.05 0.30 0.05 0.05 0.0540% 155 3.00 2.25 1.15 0.60 0.05 0.05 0.05 0.0550% 116 2.10 1.55 0.75 0.25 0.10 0.05 0.05 0.0560% 87 1.70 1.05 0.60 0.20 0.10 0.05 0.05 0.0570% 63 1.10 0.65 0.50 0.15 0.05 0.05 0.05 0.0580% 44 1.00 0.30 0.30 0.10 0.05 0.05 0.05 0.0590% 27 0.90 0.35 0.15 0.10 0.10 0.05 0.05 0.05100% 0 0.60 0.25 0.15 0.05 0.05 0.05 0.05 0.05
Table 2C: 'Kakwani IndexThreshold Progressivity
C ffi i tRiskli
($) 0 0.2 0.4 0.6 0.8 1 1.2 1.40% 1500 -0.298 -0.239 -0.182 -0.119 -0.063 -0.002 0.058 0.11510% 504 -0.319 -0.254 -0.195 -0.129 -0.065 -0.002 0.059 0.11720% 304 -0.339 -0.275 -0.212 -0.148 -0.084 -0.022 0.039 0.09930% 211 -0.332 -0.266 -0.199 -0.133 -0.068 -0.005 0.057 0.11740% 155 -0.328 -0.261 -0.194 -0.128 -0.063 0.001 0.063 0.12350% 116 -0.324 -0.258 -0.191 -0.125 -0.060 0.003 0.065 0.12560% 87 -0.320 -0.253 -0.187 -0.121 -0.057 0.005 0.066 0.12570% 63 -0.321 -0.255 -0.189 -0.124 -0.060 0.002 0.061 0.11880% 44 -0.324 -0.257 -0.191 -0.126 -0.062 0.000 0.060 0.11890% 27 -0.327 -0.260 -0.194 -0.128 -0.064 -0.001 0.060 0.119100% 0 -0.326 -0.259 -0.193 -0.127 -0.063 0.000 0.061 0.119
Threshold ProgressivityC ffi i tRisk
li($) 0 0.2 0.4 0.6 0.8 1 1.2 1.4
0% 1500 0.35 0.3 0.15 0.1 0 0 0 010% 504 0 0 0 0 0 0 0 0
Table 2D: Proportion of Households that Cannot Afford Health Care (Health Expenditure RiskExceeds the Borrowing Constraint of 3 Times Capacity to Pay)
26
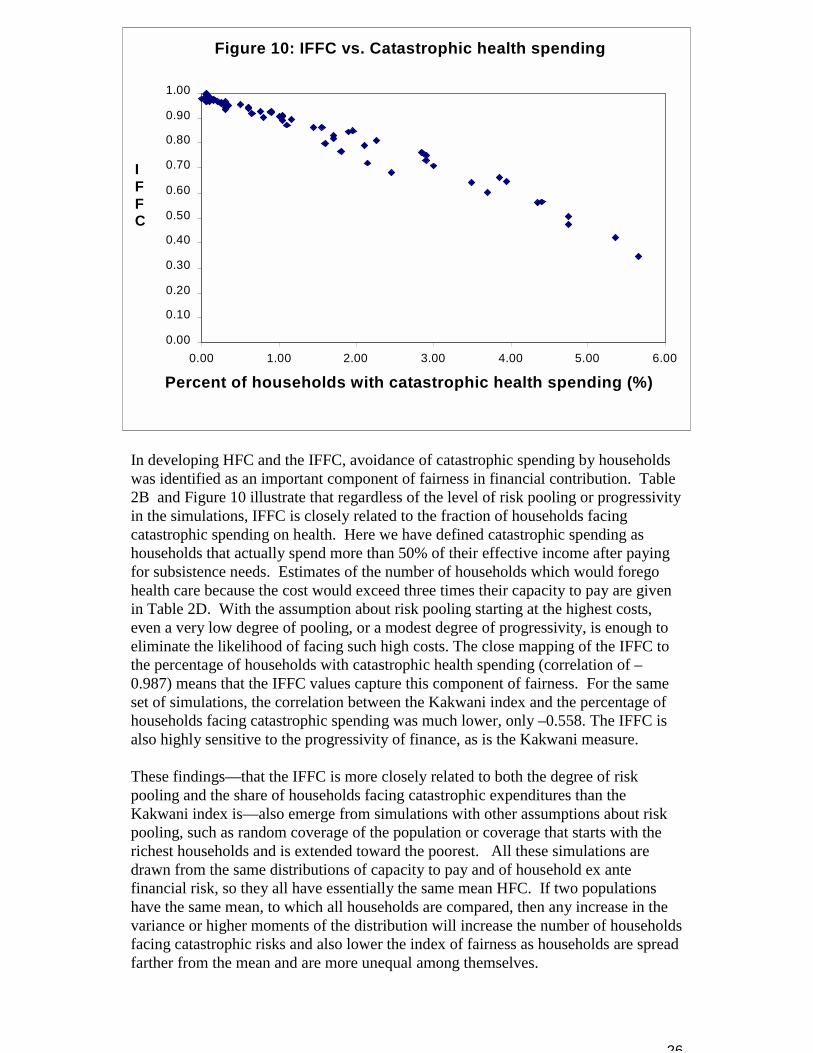
Figure 10: IFFC vs. Catastrophic health spending
0.00
0.10
0.20
0.30
0.40
0.50
0.60
0.70
0.80
0.90
1.00
0.00 1.00 2.00 3.00 4.00 5.00 6.00
Percent of households with catastrophic health spending (%)
IFFC
In developing HFC and the IFFC, avoidance of catastrophic spending by householdswas identified as an important component of fairness in financial contribution. Table2B and Figure 10 illustrate that regardless of the level of risk pooling or progressivityin the simulations, IFFC is closely related to the fraction of households facingcatastrophic spending on health. Here we have defined catastrophic spending ashouseholds that actually spend more than 50% of their effective income after payingfor subsistence needs. Estimates of the number of households which would foregohealth care because the cost would exceed three times their capacity to pay are givenin Table 2D. With the assumption about risk pooling starting at the highest costs,even a very low degree of pooling, or a modest degree of progressivity, is enough toeliminate the likelihood of facing such high costs. The close mapping of the IFFC tothe percentage of households with catastrophic health spending (correlation of –0.987) means that the IFFC values capture this component of fairness. For the sameset of simulations, the correlation between the Kakwani index and the percentage ofhouseholds facing catastrophic spending was much lower, only –0.558. The IFFC isalso highly sensitive to the progressivity of finance, as is the Kakwani measure. These findings—that the IFFC is more closely related to both the degree of riskpooling and the share of households facing catastrophic expenditures than theKakwani index is—also emerge from simulations with other assumptions about riskpooling, such as random coverage of the population or coverage that starts with therichest households and is extended toward the poorest. All these simulations aredrawn from the same distributions of capacity to pay and of household ex antefinancial risk, so they all have essentially the same mean HFC. If two populationshave the same mean, to which all households are compared, then any increase in thevariance or higher moments of the distribution will increase the number of householdsfacing catastrophic risks and also lower the index of fairness as households are spreadfarther from the mean and are more unequal among themselves.
27
When populations with different means are compared, the association between IFFCand the risk of catastrophic expenditure is naturally weakened, because if allhouseholds are tightly clustered around a high mean value of HFC there will be littleinequality but there can still be a large number facing high expenditure risks. Simulations in which all values of HFC are doubled, continue to show a strongcorrelation as progressivity and risk pooling are varied, but there is less correlationwhen simulations with high and low means are compared. Nonetheless, the index offairness is related to catastrophic risk even over a range of mean HFC from under fourpercent to over 20 percent, when 21 countries are compared .(Xu et al. 2000) Highaverage contributions, as a share of capacity to pay, tend to be associated empiricallywith high variance in the distribution, so that both IFFC and catastrophic risk aregreater than for distributions with lower means and less variation among households.
Further analyses and policy simulations for particular populations will be helpful indelineating the measurement properties of HFC and the summary across households,the IFFC.
This discussion has contrasted the IFFC with the Kakwani index, because healthsystem financing is often judged by the degree of progressivity alone and becauseprogressivity is usually the dominant component of the total re-distributive effect ofhealth care financing .(Van Doorslaer E & Wagstaff A 1999) The full re-distributiveeffect can be written as:
(9) RHVRE −−= )1( g
gkV−
=
where K is the Kakwani index, g is the mean share of health spending in totalhousehold expenditure, equivalent to HFC except for the adjustment for subsistencespending, H is the effect of horizontal inequity and R is the effect of re-orderinghouseholds, compared to the distribution prior to paying for health care (zero if nosuch re-ranking occurs). The re-distributive effect can be computed for each sourceof finance separately as well as for the total. In the simulations reported here, only thetotal effect is considered, but since out-of-pocket payments have a large negative re-distributive effect (worsening inequality of HFC) while risk pooling has a positiveeffect (reducing inequality), the overall effect depends on the degree of risk pooling aswell as on the progressivity of both modes of finance.
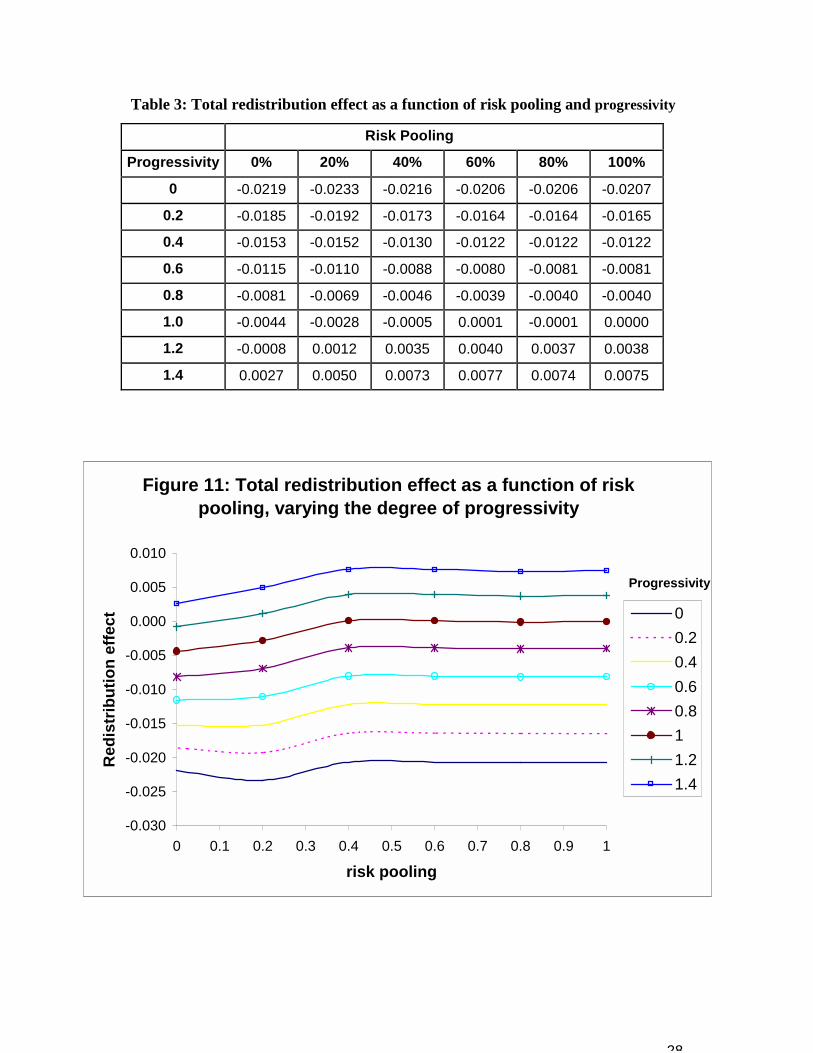
Table 3 and Figure 11 show the results of the simulation: the total income re-distributive effect is strongly related to progressivity, but is largely insensitive to thedegree of risk pooling, even when risk pooling is assumed to cover the largestexpenditures preferentially. The pattern in Figure 11 resembles that for the Kakwaniindex alone, in Figure 9, except that for degrees of progressivity greater than 0.2, there-distributive effect always improves at risk pooling is extended. In contrast, theKakwani index always worsens as pooling increases from zero to 20 percent becausemore households become able to spend on health. As with the Kakwani index, thetotal re-distributive effect bears little relation to the risk of catastrophic spendingwhen risk pooling starts with the highest expenditures, and no relation at all if riskpooling is random or favors the rich over the poor.
28
Table 3: Total redistribution effect as a function of risk pooling and progressivity
Risk Pooling
Progressivity 0% 20% 40% 60% 80% 100%
0 -0.0219 -0.0233 -0.0216 -0.0206 -0.0206 -0.0207
0.2 -0.0185 -0.0192 -0.0173 -0.0164 -0.0164 -0.0165
0.4 -0.0153 -0.0152 -0.0130 -0.0122 -0.0122 -0.0122
0.6 -0.0115 -0.0110 -0.0088 -0.0080 -0.0081 -0.0081
0.8 -0.0081 -0.0069 -0.0046 -0.0039 -0.0040 -0.0040
1.0 -0.0044 -0.0028 -0.0005 0.0001 -0.0001 0.0000
1.2 -0.0008 0.0012 0.0035 0.0040 0.0037 0.0038
1.4 0.0027 0.0050 0.0073 0.0077 0.0074 0.0075
Figure 11: Total redistribution effect as a function of risk pooling, varying the degree of progressivity
-0.030
-0.025
-0.020
-0.015
-0.010
-0.005
0.000
0.005
0.010
0 0.1 0.2 0.3 0.4 0.5 0.6 0.7 0.8 0.9 1
risk pooling
Red
istr
ibut
ion
effe
ct 00.20.40.60.811.21.4
Progressivity
29
In summary, we have demonstrated that the IFFC reflects the extent of catastrophicspending in the population, the progressivity of payments and the extent of financialrisk pooling. One set of simulations is not sufficient to demonstrate all the propertiesof the distribution of HFC and the IFFC. Further analyses and policy simulations forparticular populations will be helpful in delineating their measurement properties
VII. Estimating the Distribution of Health Financing ContributionIn order to measure HFC, particularly across countries, a number of data sources
and several simplifying assumptions are required. This section first discusses datarequirements and then provides detailed information on the mechanics of calculatingHFC using survey data. These reflect the empirical work that is presentedelsewhere.(Xu et al. 2000) The final part of this section discusses some of the datalimitations.
A. Data RequirementsHFC is based primarily on information gathered through national householdsurveys, combined with detailed information on the rules governing taxation andsocial security payments for health, and National Health Accounts (NHA)estimates .(Van Doorslaer E & Wagstaff A 1999) National household surveys arerequired that include household or individual-level data on income, totalexpenditure, and expenditure on specific goods and services (especially food, outof pocket expenditure on health, and private health insurance premiums). Thesedata are usually available from particular classes of surveys:
National Income and Expenditure Surveys (IES) undertaken by most countries ona sporadic basis often with the primary purpose of measuring income inequalityand basic expenditure patterns(Poullier JP & Hernandez P 2000);
� multipurpose, multilevel surveys such as Living Standard MeasurementSurveys (LSMS) or the Surveys of Quality of Life undertaken by manydeveloping countries on a sporadic basis, often with the support of amultilateral agency such as the World Bank;
� National Health Surveys or Demographic and Health Surveys (DHS)undertaken regularly by many developed and developing countries anddesigned to measure health status, but sometimes also including measures ofhealth spending; and
� Specific surveys of health expenditure that are available for only a fewcountries.
These surveys sometimes report spending on direct (but not indirect) taxes. Wherethey do not, government tax documents and other published material is consultedand the tax schedule is used to estimate taxes paid by a household on the basis ofits reported income, wealth and consumption. This is complemented withinformation regarding social security and health insurance laws that provideinformation on premiums and other contributions to the health system. NHAfigures (compiled by WHO for all countries) provide estimates of variouscomponents of health expenditure from private and public sources.(Van DoorslaerE & Wagstaff A 1999) NHA estimates also provide a benchmark to check thereliability of the survey data on health expenditures by comparing them to nationalaggregates. Health Systems Profiles that describe the structure and financing ofthe health system are also necessary.
30
B. Estimating HFCHealth expenditure, the numerator of HFC, can be estimated with data from
household surveys, tax and social insurance schedules and national health accounts. Thedenominator of HFC requires estimates of effective income and subsistence expenditure.The simplest way to estimate effective income is to assume that households do not haveaccess to any mechanisms to smooth consumption. In the terms of equation (3), Fa andall Ft are assumed to be zero. Expenditure is then the best estimate of effective income. For simplicity in the first round of estimation we have adopted this approach; morerefined approaches will be adopted in the future. In a similar fashion, we have estimatedsubsistence expenditure as simply equal to food expenditure.
In summary, as an interim strategy to estimate HFC, we have adopted the followingformula for the contribution of household i:
(9) i
i
i
i
FoodaTaxEXPHS
paytoCapacityspendinghealthTotal
HFCi)( −+
==
The term aTax in the denominator represents taxes paid by the family that are notincluded in expenditure, plus social security contributions; the calculation is explainedin detail below. In the formulas that follow, the subscript i refers to information at thehousehold level and N refers to information at the national level. All figure are monthly,and where other periods are reported, these are simply scaled. If the survey is conductedover more than one month and the inflation rate is high over these months, allexpenditures are deflated to a common month according to the Consumer Price Index(CPI).
The numerator of HFC, total household health spending (HSi), is the sum ofprepayment and out of pocket payment to the health system. There are three componentsin the calculation of prepayment:
(10) ( ) iiii PRVWscalarSSHTGSHprepay ++= )(*
The first component of prepayment (TGSHi), is the share of total government spendingwhich is used for health at the national level, which is estimated as the ratio of totalpublic spending on health (PSHN) to total government spending (TGSN), both net ofsocial security payments to health (SSHN). This is then multiplied by total governmentrevenue derived from the individual household, to give an estimate of the household’scontribution to government spending on health. The full expression for TGSHi isformalised as:
(11) ( )iN
i otherVATINCTAXXScalarSSHTGSSSHPSHTGSH )(*)(* ++�
��
�
−−=
where (INCTAX + VAT + other) is the estimate of the household’s contribution to totalgovernment revenue. This is adjusted by a scalar, X, to take account of the fact that thesum of estimated revenues from all households in the survey may not match the nationalaccounts estimates of public revenues, just as the survey may not provide accurateestimates of total private consumption or GDP. The calculation of X is described below.
31
Total government revenue incorporates all payments towards the financing of the healthsystem through tax revenue (mainly income tax, sales and value-added tax and othertaxes) and non-tax revenue. The estimation of each component depends on the amountof household-level data available from the household survey. Usually income tax(INCTAXi) and value-added tax (including sales taxes, VAT) contributions fromhouseholds can be calculated directly from the survey. Excise and property tax payments(otheri) are sometimes provided.
Whenever income tax (INCTAXi) was not available directly from the survey, it wasestimated from reported income from all sources including salaries and non-salaryearnings (in-kind benefits) from all employment (including second job if relevant),combined with the country’s tax schedule information. Not all individuals who aresubject actually pay income tax. A reasonable assumption is that only the formal sectoremployees pay income tax, and that they can be identified using job classificationquestions from the survey. Evasion cannot be estimated but is assumed to be difficult forformal sector salaries. VAT and excise taxes are easier to assign to the various categoriesof good and services purchased by the household, by applying the corresponding tax ratesto each family’s expenditure pattern using the survey data. Other taxes (such ascorporate tax, import taxes or property tax), excise and property tax when not reportedin the survey, and non-tax revenue are estimated based on the tax information that isavailable in the survey.The scalar X in equation (11) is used to assign non-tax and other tax revenue back to thehousehold, according to the following formula:
(12) ++
−=
i
NN
otherVATINCTAXGDPsGDPSSHTGS
XScalar)(
*)/)(()(
where GDPs is the estimate of GDP given by the survey. It is calculated as the weightedsum of all household expenditure over the share of total private consumption (PC) toGDP (at the national level). When household surveys do not provide weights, the ratioof sample population to total population is used to inflate the survey expenditure data tothe country level.
(13) N
is GDPPC
EXPGDP
)/(=
We assume that total household consumption is equivalent to total private consumption.Strictly speaking, this is not the case since private consumption is the market value of allgoods and services purchased, or received as income in-kind, by households and non-profit institutions (NGOs). The latter part not being captured in the household survey, wemay underestimate total private consumption at the national level if the non-profitinstitution component is large.
Substituting from equation (13) into equation (12) shows that the numerator of (12) isjust
(14) (TGS – SSH)N * SUMi EXPi/PCN
that is, total government non-social security revenue adjusted for the discrepancybetween survey and national accounts estimates of private consumption. Substituting
32
from equation (12) into equation (11) then shows that the estimate of a household’s taxcontribution to financing health is just that household’s share of reported total taxpayments in the survey, adjusted for the discrepancy with national accounts, multipliedby the share of total public spending on health to total government spending, both net ofsocial security spending on health.
The second component of prepayment in equation (10), is the total adjusted social healthinsurance premium of the household:
(15) )(* WScalarSSHi
The household social health insurance premium (SSHi) is computed using the samealgorithm as for the income tax calculation. Survey data are used if available. When thisis not the case, the contribution rate (provided in social security/social health insurancelaws) is applied to individual-level data on salaries. The assumption is that only formalsector employees, or full-time permanent workers, pay social health insurance. Weassume that the employer’s contribution is borne by the employees in the form of reducedsalaries. For the computation, this implies that the employer’s contribution rate shouldbe added to that of that of the employee. While this assumption is strong, it simplifies theanalysis and the comparison across countries and has been used in previous research(Wagstaff A & Van Doorslaer E 1999). It is important to stress that only the portion ofsocial security contributions attributable to health is incorporated in the calculations. Aswith income tax, the social health insurance premium is assigned back to the householdby summing over all individuals in the household who pay social health insurancepremiums.
Survey data on social insurance contributions do not always coincide with NHA data.These discrepancies are essentially the result of under- or over-reporting of socialsecurity contributions in the survey data. Where this type of reporting bias arises it mustbe corrected. We use a scalar adjustment to ensure consistency between these twosources. The scalar is computed using the same adjustment as in X for discrepanciesbetween survey and national accounts estimates of GDP. The share of social security onhealth at the national level ((SSH/GDP)N), is divided by the sum of estimated socialsecurity contributions to health at the household level (SSHi):
(16) =i
Ns
SSHGDPSSHGDP
WScalar)/(*
)(
The third component of prepayment s the total private health insurance premium of thehousehold (PRVi). Household contributions to private health insurance are oftenavailable from the household survey.
In some countries, employers also contribute to the private health insurance on behalf oftheir employees. In such cases we include the employer’s contribution if the informationis available. Where this information is not available, a bias is introduced, particularly insome developed countries where private health insurance is a dominant form of healthservice financing and the employer subsidises a share of the premium. Where thisinformation is missing, we underestimate this component of prepayment. To avoidintroducing an upward bias in private health insurance premiums, refunds or creditsgranted by insurance companies in the period prior to the survey should be deducted fromhousehold private health insurance premiums for the same period. Unfortunately, sincethe reimbursement may refer to payments in an earlier period not covered by the survey,
33
this adjustment can lead to negative estimates of insurance payments and is still difficultto implement with short-period data.We now discuss the estimation of out of pocket spending on health (OOPi) in the HFCnumerator. Out of pocket payment includes all categories of health-related expensesrecorded at the time the household received the service. Typically these include doctor’sconsultation fees, purchases of medication and hospital bills. Although spending onalternative and/or traditional medicine is included in the computation of out of pocketspending when it is available from the survey, expenditure on transport to receive healthcare services is excluded13. Tax deductions for health expenditures are incorporatedimplicitly where household survey data are available on total income taxes. In othercases, this requires a refinement of the calculations that is typically very difficult givenavailable data and due to the fact that deductions are often applicable over a period oftime that spans more than a calendar year.
The HFC denominator is a measure of the household’s effective income minussubsistence expenditure. The proxy that we use to calculate capacity to pay is total,household per capita expenditure (EXPi) net of household per capita food expenditure(Foodi). The denominator excludes tax payments except for general tax and socialinsurance payments that can be attributed to the household as contributions for health. Total household expenditure is the amount spent on all goods and services by thehousehold, including in-kind spending and the consumption of household-made products.This information is available directly from the household survey and is aggregated to amonthly value.Foodi is the amount spend on all foodstuffs by the household, including the family’s ownfood production. Food expenditure was computed by summing all the items consideredto be non-luxury goods. The definition excludes expenditure on alcoholic beverages,tobacco, and eating outside of the household (restaurants). The household’s adjusted tax payment and its contribution to social security on health(aTaxi) is calculated using the following formula:
(17)
[ ] )(**)(*)()1)((*)( WScalariSSHSSHTGSSSHPSH
XScalariotheriINCTAXXScalariEXCISEiVATiaTax +−−
++−+= ����
Adjustments are made for household tax payment and social security contributions. Toavoid double-counting VAT and excise tax which is already included in reportedexpenditure, these values are adjusted by the X scalar (defined above). Income tax andother relevant taxes not integrated in expenditure are also adjusted using the X scalar forthe same reasons as those discussed above for the numerator. Likewise, social securitycontribution for health is adjusted with the W scalar. 14
13 This assumption is consistent with the National Health Accounts method of calculating out of pocketpayments.14 Note that only social security on health is included in aTax as the total payment to social security was not availablefor some countries.
34
C. Data LimitationsAvailable data present several limitations, of which the most serious are related to the
recall period for out of pocket health spending and for expenditure. Most surveys providethis information on a monthly basis, which does not give an adequately long period overwhich to measure the risk of health expenditure. It is impossible to discern from a one-month period, if high health expenditure is a repeated incident or an isolated event.Further, without repeated and longer-run measures, it is impossible to apply an adequatetime horizon to expenditures across all households as we only have data on householdsthat actually spent in a particular month. If the sample is large enough, and expenditurepatterns do not display seasonally (an unlikely assumption), then this will not be an issue.What is required to answer these questions better are surveys that ask about both monthlyexpenditures, which will tend to minimise recall bias, and longer periods such as a year.
Another important point is that our calculations do not include subsidies. This isbecause very few countries have household-level information on subsidies in the surveysthat include information on health spending. The exclusion of subsidies could generatebiases in both the numerator and the denominator of HFC. In future analyses, usingparticular countries for which the necessary data are available, we will explore the issueof subsidies in greater detail.
VIII. DiscussionHow the health system is financed can have a profound effect on individuals’ accessto healthcare and thus on health, health inequalities, responsiveness andresponsiveness inequalities. Beyond this instrumental role of how a health system isfinanced, we argue that that fairness in financial contribution is an intrinsic goal of thehealth system. Fairness in financial contribution is a different construct that thetraditional focus of the literature on equity in health finance, which measures theextent to which payments for the health system redistribute income. Taking as givensociety’s efforts to redistribute income, some systems are still financed more fairlythan others. This notion of fairness should capture the extent to which the systemavoids households making catastrophic payments for health, the extent to whichindividuals in similar circumstances contribute the same amount and the extent towhich the rich bear some of the costs of the poor.
These elements of fairness are captured by examining each household’s contributionto the health system through taxes, social insurance, private insurance and out-of-pocket payments as a share of its capacity to pay. Capacity to pay is a household’seffective income minus expenditure required for subsistence needs. We argue thatwhen shares of capacity to pay are equalized across households then a systemachieves fairness in financial contribution. The distribution of HFC acrosshouseholds can be summarized using an index, the IFFC. The distribution of HFC and the summary index, the IFFC, have been calculated for anumber of countries.(Xu et al. 2000)This empirical application of the concepts in thispaper demonstrates the feasibility and utility of this measurement. Nevertheless, anumber of issues remain that will benefit from further work and refinement. Thesefall naturally into three types of issues: estimating HFC from survey data; alternativesummary indexes of the distribution of HFC; and sub-national application of theanalysis of fairness in financial contribution.
35
Several estimation issues need to be addressed. First, the working assumption thathouseholds have no access, in any country, to their future earnings so that expenditureis a good estimate of effective income needs to be relaxed. As a first step, the boundsof effective income could be estimated by calculating consumption as if thepermanent income hypothesis applied. The sensitivity of the distribution of HFC tousing the permanent income hypothesis estimates could be examined. Second,subsidies, which can be an important component of household income in somecountries. e.g. housing subsidies, should be estimated if possible. Third,inconsistencies between household surveys and national health accounts need to beinvestigated and solutions standardized.
The IFFC has been designed as a summary of the distribution of HFC acrosshouseholds to emphasize the right-hand tail of the distribution – households facingcatastrophic payments. Further work to inform the selection of the parameters in theIFFC should include measurement of key population preferences. In addition tostrengthening the empirical basis for selecting the parameters in the IFFC, thecommunicability of the measure to the general public, media and policy makers needsto be explored. For example, the IFFC is closely related to the fraction of householdsfacing catastrophic spending, so simpler variants of the IFFC may be adequate forsome policy uses.
Future research will include a number of new empirical applications, as wellextensions of existing work to additional countries. Using before and after measures,we will apply the IFFC to analyse the success of health financing reforms in achievinggreater fairness. IFFC is also highly applicable to the study of particular componentsof health systems, such as: the comparison of fairness of the portion of finance thatcomes from general taxes or social insurance to out of pocket payments; drugspending as compared to hospitalisation or other sub-sectors; and, geographicvariation. Another interesting avenue for future research is to consider the level offairness de jure (based on legislation or constitutional rights) versus de facto given theactual distribution of health payments, where the latter do not depend on assumingthat de jure provisions actually determine households’ contributions.
36
References
Ando A & Modigliani F 1963, "The Life Cycle Hypothesis of Saving: AggreateImplication and Tests", American economic review, vol. 53, pp. 55-84.
Aronson JR, Johnson P, & Lambert PJ 1994, "Re-dristributive Effect and UnequalIncome Tax Treatment", The Economic Journal, vol. 104, pp. 262-270.
Baker JL & van der Gaag J. Equity in Health Care and Health Care Financing:Evidence From Five Developing Countries. Equity in the Finance and Delivery ofHealth Care: An International Perspective , 356-395. 1993.Ref Type: Journal (Full)
Behrman, P. Health Sector Reform in Developing Countries: Making HealthDevelopment Sustainable. 1995.Ref Type: Generic
Deaton A & Muellbauer J 1980, Economics and Consumer Behaviour CambridgeUniversity Press.
Frenk J, Lozano R, & González Block MA. 1994, "Economía y Salud: Propuesta parael Avance del Sistema de Salud en México.Informe Final.", Fundación Mexicanapara la Salud.
Friedman M 1957, A Theory of the Consumption Function, Princeton UniversityPress.
Fuchs V.R. Who Shall Live? Health, Economics, and Social Choice. 1988.Ref Type: Generic
Gakidou, E. E., Frenk, J., & Murray, C. J. L. 2000, Measuring preferences on healthsystem performance assessment, World Health Organization, Geneva, Switzerland,20.
Gonzalez Pier E & Parker S 1999, Equity in the Finance and Delivery of Health Care:Results from Mexico.
Hausman Daniel M 2000, Why not just ask? "Empirical Ethics and the Role of EthicalReflection".
Holahan J & Zedlewski S 2000, "Who Pays for Health Care in the United States?Implications for Health Care Reform", Inquiryno. 29, pp. 231-248.
Hotchkiss DR, RousJJ, Karmacharya K, & Sangraula P 1998, "Household HealthExpenditures in Nepal:Implications for Health Care Financing Reform", HealthPolicy.Plan., vol. 13,no. 4, pp. 371-383.
Iglehart J.K. The American Health Care System-Expenditures. 1999.Ref Type: Generic
Kakwani K 1977, "Measurement of Tax Progressity: An International Comparison",The Economic Journal, vol. 87, pp. 71-80.
37
Kakwani K, Wagstaff A, & Van Doorslaer E 1997, "Socio-Economic Inequalities inHealth:Measurement,Computation and Statiscal Inference.", Oxford Review ofEconomic Policy, vol. 77, pp. 87-103.
Kakwani N., W. A. V. D. E. 1997, "Socio Economic Inequalities in Health:Measurement, Computation and Statistical Inference", Journal of Econometrics, vol.1997, pp. 87-103.
Lairson DR, Hindson P, & Hauquitz A 1995, "Equity of Health Care in Australia",Social Science and Medicine, vol. 41,no. 4, pp. 475-482.
Lasprilla E, ObandoC, & Encalad E Lasprilla C 1999, Health Sector Inequalities andPoverty in Ecuador.
Londoño, J. & Frenk, J. Structured Pluralism: Towards an Innovative Model forHealth System Reform in Latin America. 1997.Ref Type: Generic
Murray CJL & Frenk J. A WHO framework for health system performanceassessment. 1999. Geneva, World Health Organization. Global Programme onEvidence for Health Policy Discussion Paper No. 6.Ref Type: Generic
Pannarunothai, S. & Mills, A. 1997, "The poor pay more: health-related inequality inThailand", Soc Sci Med, vol. 44,no. 12, pp. 1781-1790.
Pauly MV 1992, "Fairness and Feasibility in National Health Care Systems", HealthEconmics, vol. 1,no. 93.
Poullier JP & Hernandez P 2000, Estimates of National Health Accounts. Aggregatesfor 191 countries in 1997.
Rasell E, Bernstein J, & Tang K 1994, "The Impact of Health Care Financing onFamily Budgets.", International Journal of Health Services, vol. 24, pp. 691-714.
Sen A 1981, Poverty and Famines: An Essay on Entitlement and Deprivation.
Sen A 1984, Goods and People.
Sen A 1985, The Standard of Living.
Streeten P, Burkhi S, Al Haq M, Hicks N, & Stewart F 1981, First Things First:Meeting Basic Needs in Developing Countries, Oxford University Press.
Suarez RM 1999, Summary of Results and Policy Implications Health SystemsInequalities and Poverty in Latin America and the Caribbean.
Valladares R & Barillas E 1999, Health Sector Inequalities and Poverty inGuatemala.
Van Doorslaer E & Wagstaff A 1999, "The Re-dristributive Effect of Health CareFinancing in Twelve OECD Countries.", Journal of Health Economics, vol. 18, pp.291-313.
38
Wagstaff A & Van Doorslaer E 1992, "Equity in the Delivery of Health Care: SomeInternational Comparisons", Journal of Health Economics, vol. 11, pp. 389-411.
Wagstaff A & Van Doorslaer E 1993, Equity in the Finance and Delivery of HealthCare:An International Perspective Oxford Medical Publications.
Wagstaff A & Van Doorslaer E 1998, "Equity in Health Finance and Delivery,".
Wagstaff A & Van Doorslaer E 1999, "Equity in the Finance of Health Care: SomeFurther international Comparisons", Journal of Health Economics, vol. 18, pp. 263-290.
Wagstaff A., Van Doorslaer E, & Paci P 1989, "Equity in the Finance and Delivery ofHealth Care: Some Tentative Cross-Country Comparisons", Oxford Review ofEconomic Policy, vol. 5, pp. 89-112.
World Health Organization 2000, World Health Report 2000: Health Systems:Improving Performance, World Health Organization, Geneva, Switzerland.
Xu, K., Lydon, P., Ortiz de Iturbide, J., Musgrove, P., Knaul, F., Kawabata, K.,Florez, C. E., John, J., Wibulpolprasert, S., Waters, H., & Tansel, A. 2000, Analysis ofthe fairness of financial contribution in 21 countries, World Health Organization,Geneva, Switzerland, 25.