Embed Size (px)
Citation preview
REVIEW ARTICLE
Defining and measuring urban sustainability: a reviewof indicators
Lu Huang . Jianguo Wu . Lijiao Yan
Received: 6 January 2015 / Accepted: 22 April 2015 / Published online: 8 May 2015
� Springer Science+Business Media Dordrecht 2015
Abstract
Context The sustainability of urban areas is essential
to the sustainability of regions, nations, and the world
as a whole. Urban sustainability indicators (USIs) can
play an important role in advancing the science and
practice of sustaining urban systems.
Objectives We review the key concepts of urban
sustainability and commonly used indicators for
gauging the state and progress of urban sustainability,
and discuss how USIs can be further improved from a
landscape ecology perspective.
Methods This review is based primarily on peer-
reviewed journal papers, as well as books, and
documents published by international organizations,
governmental agencies, and research institutions. We
systematically examine what USIs actually measure
and whether they are adequate for gauging urban
sustainability, and then discuss major problems and
challenges as well as ways forward in developing and
applying USIs.
Results Numerous USIs have been developed, in-
cluding single composite indices and indicator sets.
This paper focuses on three indicator sets and ten
composite indices. Eight of them cover all the three
dimensions of sustainability (environment, economy,
and society), and five cover two of the three. Five of
them measure strong sustainability, and eight only
indicate weak sustainability.
Conclusions Urban sustainability indicators abound,
and so do problems with them. These include technical
issues of normalization, weighting, and aggregation
(upscaling), as well as conceptual issues of indicator
selection, boundary delineation, heterogeneity, scale,
and strong versus weak sustainability. To overcome
these problems, principles and methods in landscape
ecology—particularly those of landscape metrics,
spatial scaling, and landscape sustainability—have
much to offer, and this represents a challenging and
fruitful research direction for both landscape and
urban scientists in the coming decades.
Keywords Urbanization � Urban sustainability
indicators � Indicator frameworks � Sustainable cities �Landscape sustainability
Electronic supplementary material The online version ofthis article (doi:10.1007/s10980-015-0208-2) contains supple-mentary material, which is available to authorized users.
L. Huang � L. Yan (&)
Institute of Ecological Planning and Landscape Design,
College of Life Sciences, Zhejiang University,
Hangzhou 310058, China
e-mail: [email protected]
J. Wu
School of Life Sciences & School of Sustainability,
Arizona State University, Tempe, AZ 85287, USA
J. Wu
Center for Human-Environment System Sustainability
(CHESS), State Key Laboratory of Earth Surface
Processes and Resource Ecology (ESPRE), Beijing
Normal University, Beijing 100875, China
123
Landscape Ecol (2015) 30:1175–1193
DOI 10.1007/s10980-015-0208-2
Introduction
The world has become increasingly urban, and this
trend will continue in the foreseeable future. Only 2 %
of the world population lived in urban areas in 1800,
but this number increased to 14 % in 1900, 29 % in
1950, 47 % in 2000, and over 50 % in 2008 (Wu et al.
2014). The world population is projected to be 70 %
urban by 2050 and 100 % urban by 2092 (Batty 2011).
While urbanization is often positively correlated with
socioeconomic development, it has resulted in a
number of environmental problems (Grimm et al.
2008; Pickett et al. 2011; Liu et al. 2014;Wu 2014). As
the world continues to urbanize, the sustainability of
urban areas must take a central stage in both science
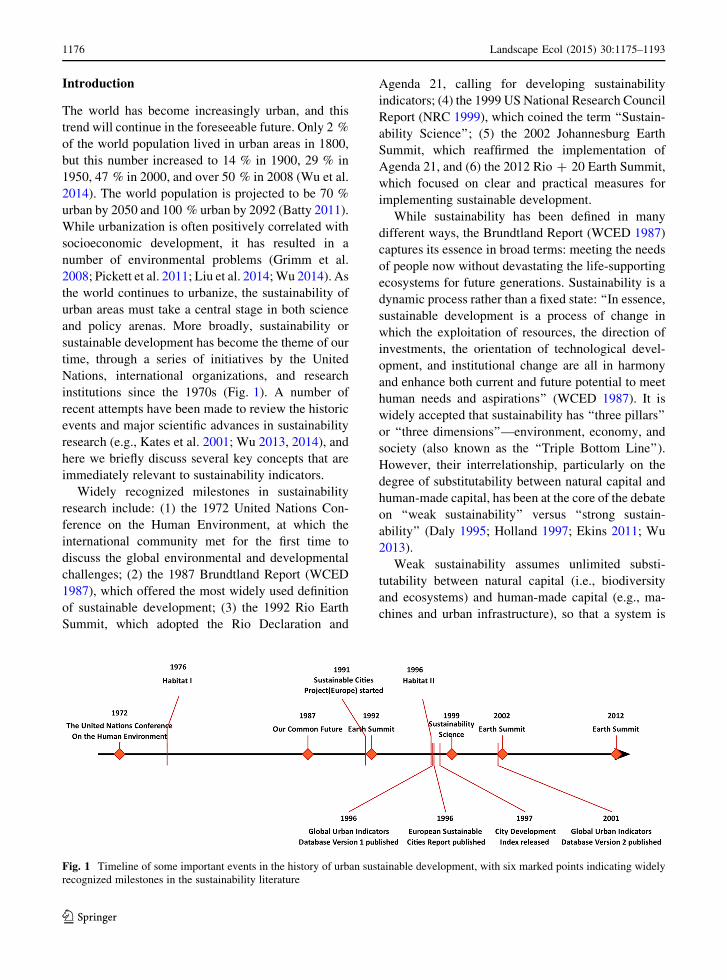
and policy arenas. More broadly, sustainability or
sustainable development has become the theme of our
time, through a series of initiatives by the United
Nations, international organizations, and research
institutions since the 1970s (Fig. 1). A number of
recent attempts have been made to review the historic
events and major scientific advances in sustainability
research (e.g., Kates et al. 2001; Wu 2013, 2014), and
here we briefly discuss several key concepts that are
immediately relevant to sustainability indicators.
Widely recognized milestones in sustainability
research include: (1) the 1972 United Nations Con-
ference on the Human Environment, at which the
international community met for the first time to
discuss the global environmental and developmental
challenges; (2) the 1987 Brundtland Report (WCED
1987), which offered the most widely used definition
of sustainable development; (3) the 1992 Rio Earth
Summit, which adopted the Rio Declaration and
Agenda 21, calling for developing sustainability
indicators; (4) the 1999 US National Research Council
Report (NRC 1999), which coined the term ‘‘Sustain-
ability Science’’; (5) the 2002 Johannesburg Earth
Summit, which reaffirmed the implementation of
Agenda 21, and (6) the 2012 Rio ? 20 Earth Summit,
which focused on clear and practical measures for
implementing sustainable development.
While sustainability has been defined in many
different ways, the Brundtland Report (WCED 1987)
captures its essence in broad terms: meeting the needs
of people now without devastating the life-supporting
ecosystems for future generations. Sustainability is a
dynamic process rather than a fixed state: ‘‘In essence,
sustainable development is a process of change in
which the exploitation of resources, the direction of
investments, the orientation of technological devel-
opment, and institutional change are all in harmony
and enhance both current and future potential to meet
human needs and aspirations’’ (WCED 1987). It is
widely accepted that sustainability has ‘‘three pillars’’
or ‘‘three dimensions’’—environment, economy, and
society (also known as the ‘‘Triple Bottom Line’’).
However, their interrelationship, particularly on the
degree of substitutability between natural capital and
human-made capital, has been at the core of the debate
on ‘‘weak sustainability’’ versus ‘‘strong sustain-
ability’’ (Daly 1995; Holland 1997; Ekins 2011; Wu
2013).
Weak sustainability assumes unlimited substi-
tutability between natural capital (i.e., biodiversity
and ecosystems) and human-made capital (e.g., ma-
chines and urban infrastructure), so that a system is
Fig. 1 Timeline of some important events in the history of urban sustainable development, with six marked points indicating widely
recognized milestones in the sustainability literature
1176 Landscape Ecol (2015) 30:1175–1193
123
considered sustainable as long as its total amount of
capital stocks is not decreasing (Pearce and Atkinson
1993; Hamilton and Clemens 1999; Pillarisetti 2005;
Fischer et al. 2007; Greasley et al. 2014). In other
words, depleted natural resources can be replaced with
human-made substitutes, and degraded ecosystem
services can be replaced by some equivalent forms
derived from human-made capital. In this case, rapid
urbanization with fast economic growth and declining
environmental quality may be considered sustainable.
By contrast, strong sustainability assumes that human-
made and natural capital are not substitutes but
‘‘basically complements’’ (Daly 1995), or that ‘‘sub-
stitutability of manufactured for natural capital is
seriously limited by such environmental characteris-
tics as irreversibility, uncertainty and the existence of
‘critical’ components of natural capital, which make a
unique contribution to welfare’’ (Ekins and Simon
1999; Ekins et al. 2003). In this case, urban develop-
ment cannot be sustainable without a healthy
environment.
Since the early 2000s, a transdisciplinary science of
sustainability (or sustainability science) has emerged,
focusing on the dynamic relationship between nature
and society (NRC 1999; Kates et al. 2001; Clark and
Dickson 2003; Wu 2013). Sustainability indicators
(SIs) are indispensable in the science and practice of
sustainability (Wu and Wu 2012). SIs are variables
that provide information on the state and performance
of human-environmental systems, with time dimen-
sion, limits, or targets of their values specified
(Meadows 1998). The Rio Summit in 1992 called for
the development of SIs, and since then a number of
international organizations, governmental agencies,
and research institutions have responded, producing a
voluminous literature on SIs (Moldan and Billharz
1997; Meadows 1998; Hak et al. 2007; Bell and Morse
2008; Wu and Wu 2012). Most of the SIs have been
used at the global, national, and local community
levels, without considering spatial patterns of local
and regional landscapes.
Sustainability has provided a common theme that
unites ecological, geographical, and social sciences,
leading to the emergence of landscape sustainability
science (Wu 2013) and land system science (Turner
et al. 2007, 2013; Verburg et al. 2013). In particular,
urban sustainability is becoming ‘‘an inevitable goal’’
of research in landscape and urban studies (Wu 2010).
Urban sustainability indicators (USIs) have an
important role to play because of their simplicity in
math and ease of use. Many USIs exist, but a
systematic review from a landscape sustainability
perspective is lacking. Thus, the main goal of this
paper is to review the progress in the development of
urban sustainability measures, discuss the pros and
cons of commonly used USIs, and suggest ways to
move forward. To achieve this goal, we will address
the following specific questions: What does urban
sustainability really means? What are the commonly
used USIs? What aspects of sustainability do they
measure, or are they adequate for gauging urban
sustainability? How can we further improve USIs and
their applications from a landscape sustainability
perspective?
Urban sustainability
As a focus of sustainable development, urban sustain-
ability has become increasingly prominent on political
agendas and scientific studies during the recent
decades (Fig. 1). Following the 1972 United Nations
Conference on the Human Environment, the first
United Nations Conference on Human Settlements
(Habitat I) was held in Vancouver, Canada in 1976;
European Commission initiated the Sustainable Cities
Project in 1991; the internationally-known communi-
ty-based urban sustainability project, Sustainable
Seattle, was formed in 1992; the 2nd United Nations
Conference on Human Settlements (Habitat II) was
held in Istanbul, Turkey in 1996; the European
Commission published the European Sustainable
Cities Report also in 1996, documenting the past
efforts and future visions for promoting sustainability
in European urban settings. During the past decade,
urban sustainability efforts have mushroomed across
the world (Shen et al. 2011; Wu 2014).
How urban sustainability is defined certainly
affects how its indicators are derived. Urban sustain-
ability has been defined in various ways, with different
criteria and emphases (Table 1). Most of the defini-
tions are derivations from those of sustainability,
focusing on the improvement of long-term human
wellbeing by balancing the three dimensions of
sustainability, minimizing resource consumption and
environmental damage, maximizing resource use
efficiency, and ensuring equity and democracy. For
example, European Environment Agency set five
Landscape Ecol (2015) 30:1175–1193 1177
123
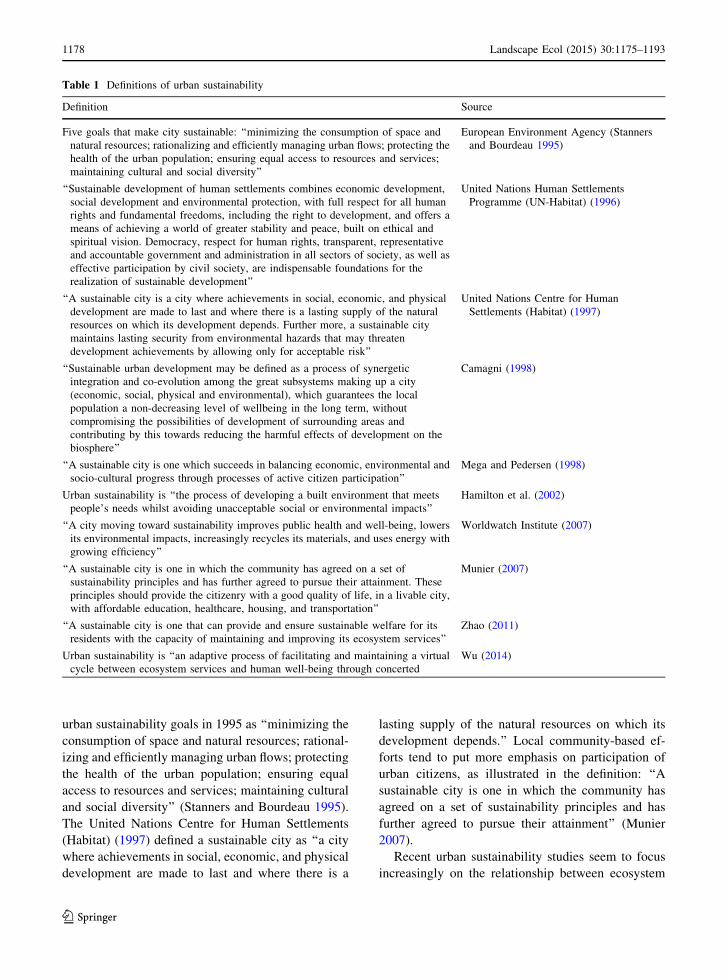
urban sustainability goals in 1995 as ‘‘minimizing the
consumption of space and natural resources; rational-
izing and efficiently managing urban flows; protecting
the health of the urban population; ensuring equal
access to resources and services; maintaining cultural
and social diversity’’ (Stanners and Bourdeau 1995).
The United Nations Centre for Human Settlements
(Habitat) (1997) defined a sustainable city as ‘‘a city
where achievements in social, economic, and physical
development are made to last and where there is a
lasting supply of the natural resources on which its
development depends.’’ Local community-based ef-
forts tend to put more emphasis on participation of
urban citizens, as illustrated in the definition: ‘‘A
sustainable city is one in which the community has
agreed on a set of sustainability principles and has
further agreed to pursue their attainment’’ (Munier
2007).
Recent urban sustainability studies seem to focus
increasingly on the relationship between ecosystem
Table 1 Definitions of urban sustainability
Definition Source
Five goals that make city sustainable: ‘‘minimizing the consumption of space and
natural resources; rationalizing and efficiently managing urban flows; protecting the
health of the urban population; ensuring equal access to resources and services;
maintaining cultural and social diversity’’
European Environment Agency (Stanners
and Bourdeau 1995)
‘‘Sustainable development of human settlements combines economic development,
social development and environmental protection, with full respect for all human
rights and fundamental freedoms, including the right to development, and offers a
means of achieving a world of greater stability and peace, built on ethical and
spiritual vision. Democracy, respect for human rights, transparent, representative
and accountable government and administration in all sectors of society, as well as
effective participation by civil society, are indispensable foundations for the
realization of sustainable development’’
United Nations Human Settlements
Programme (UN-Habitat) (1996)
‘‘A sustainable city is a city where achievements in social, economic, and physical
development are made to last and where there is a lasting supply of the natural
resources on which its development depends. Further more, a sustainable city
maintains lasting security from environmental hazards that may threaten
development achievements by allowing only for acceptable risk’’
United Nations Centre for Human
Settlements (Habitat) (1997)
‘‘Sustainable urban development may be defined as a process of synergetic
integration and co-evolution among the great subsystems making up a city
(economic, social, physical and environmental), which guarantees the local
population a non-decreasing level of wellbeing in the long term, without
compromising the possibilities of development of surrounding areas and
contributing by this towards reducing the harmful effects of development on the
biosphere’’
Camagni (1998)
‘‘A sustainable city is one which succeeds in balancing economic, environmental and
socio-cultural progress through processes of active citizen participation’’
Mega and Pedersen (1998)
Urban sustainability is ‘‘the process of developing a built environment that meets
people’s needs whilst avoiding unacceptable social or environmental impacts’’
Hamilton et al. (2002)
‘‘A city moving toward sustainability improves public health and well-being, lowers
its environmental impacts, increasingly recycles its materials, and uses energy with
growing efficiency’’
Worldwatch Institute (2007)
‘‘A sustainable city is one in which the community has agreed on a set of
sustainability principles and has further agreed to pursue their attainment. These
principles should provide the citizenry with a good quality of life, in a livable city,
with affordable education, healthcare, housing, and transportation’’
Munier (2007)
‘‘A sustainable city is one that can provide and ensure sustainable welfare for its
residents with the capacity of maintaining and improving its ecosystem services’’
Zhao (2011)
Urban sustainability is ‘‘an adaptive process of facilitating and maintaining a virtual
cycle between ecosystem services and human well-being through concerted
Wu (2014)
1178 Landscape Ecol (2015) 30:1175–1193
123
services and human wellbeing (Wu 2010; Elmqvist
et al. 2013; Nassauer et al. 2014; Wu 2014). Wu
(2014) defined urban sustainability as ‘‘an adaptive
process of facilitating and maintaining a virtual cycle
between ecosystem services and human wellbeing
through concerted ecological, economic, and social
actions in response to changes within and beyond the
urban landscape’’.
Urban sustainability indicators (USIs)
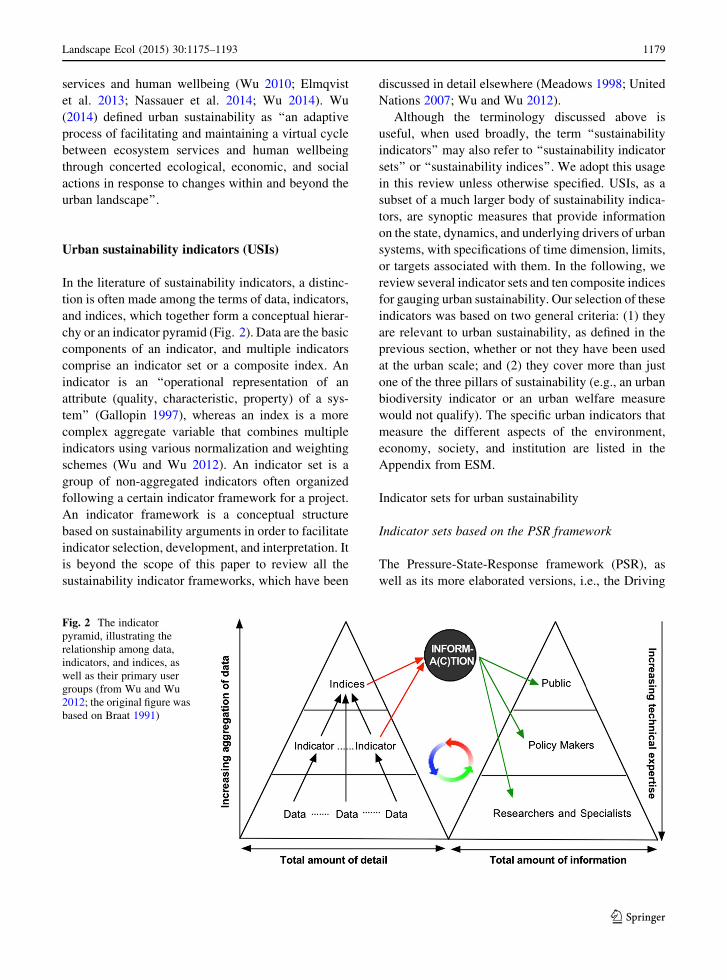
In the literature of sustainability indicators, a distinc-
tion is often made among the terms of data, indicators,
and indices, which together form a conceptual hierar-
chy or an indicator pyramid (Fig. 2). Data are the basic
components of an indicator, and multiple indicators
comprise an indicator set or a composite index. An
indicator is an ‘‘operational representation of an
attribute (quality, characteristic, property) of a sys-
tem’’ (Gallopin 1997), whereas an index is a more
complex aggregate variable that combines multiple
indicators using various normalization and weighting
schemes (Wu and Wu 2012). An indicator set is a
group of non-aggregated indicators often organized
following a certain indicator framework for a project.
An indicator framework is a conceptual structure
based on sustainability arguments in order to facilitate
indicator selection, development, and interpretation. It
is beyond the scope of this paper to review all the
sustainability indicator frameworks, which have been
discussed in detail elsewhere (Meadows 1998; United
Nations 2007; Wu and Wu 2012).
Although the terminology discussed above is
useful, when used broadly, the term ‘‘sustainability
indicators’’ may also refer to ‘‘sustainability indicator
sets’’ or ‘‘sustainability indices’’. We adopt this usage
in this review unless otherwise specified. USIs, as a
subset of a much larger body of sustainability indica-
tors, are synoptic measures that provide information
on the state, dynamics, and underlying drivers of urban
systems, with specifications of time dimension, limits,
or targets associated with them. In the following, we
review several indicator sets and ten composite indices
for gauging urban sustainability. Our selection of these
indicators was based on two general criteria: (1) they
are relevant to urban sustainability, as defined in the
previous section, whether or not they have been used
at the urban scale; and (2) they cover more than just
one of the three pillars of sustainability (e.g., an urban
biodiversity indicator or an urban welfare measure
would not qualify). The specific urban indicators that
measure the different aspects of the environment,
economy, society, and institution are listed in the
Appendix from ESM.
Indicator sets for urban sustainability
Indicator sets based on the PSR framework
The Pressure-State-Response framework (PSR), as
well as its more elaborated versions, i.e., the Driving
Fig. 2 The indicator
pyramid, illustrating the
relationship among data,
indicators, and indices, as
well as their primary user
groups (from Wu and Wu
2012; the original figure was
based on Braat 1991)
Landscape Ecol (2015) 30:1175–1193 1179
123
force-State-Response framework (DSR) and the Driv-
ing force-Pressure-State-Impact-Response framework
(DPSIR), is one of the earliest and most widely used
indicator frameworks developed by the Organization
for Economic Co-operation and Development (OECD
1993). In this framework, indicators are developed and
organized according to pressures or/and driving forces
(primarily representing anthropogenic processes),
system state or/and impacts (focusing on the current
conditions of and impacts on the environment), and
responses (pertaining to societal actions and reactions
to changes in system state and driving forces). The
PSR framework has been used more frequently for
developing environment-centered indicator sets.
Most of the earlier efforts for USIs followed the
PSR framework by OECD which pioneered in the
development of indicators for urban areas (Alberti
1996). Based on the PSR framework, for example, the
European Environment Agency (EEA) developed an
urban indicator set in 1995, with pressure indicators
(e.g., industry, transport, population growth, waste
production, and other drivers of change), state indica-
tors (e.g., conditions of the environment and natural
resources such as biodiversity and air and water
quality), and response indicators (e.g., legislations,
regulations, and economic instruments) (http://www.
eea.europa.eu/publications/92-826-5409-5). More re-
cent examples of the PSR-based urban indicator sets
include those for urban areas in general (Olewiler
2006) and for particular places—such as Taiwan
(Huang and Chen 2002) and the Chinese city of
Mianyang (Zhao et al. 2014). These indicator sets
share many of the same urban indicators, but also have
some particularly relevant to the urban area under
study.
Indicator sets based on the theme-oriented framework
The theme-based framework is a more flexible con-
ceptual structure that organizes indicators according to
four dimensions of sustainability (environment, econ-
omy, society, and institutions) and around key themes
or issues of policy relevance. Examples of themes
include equity, health, and education for the social
dimension; biodiversity and air/water quality for the
environmental dimension; economic structure and
consumption/production patterns for the economic
dimension; and institutional frameworks (the systems
of formal laws and regulations as well as informal
conventions and norms that shape socioeconomic
activities) for the institutional dimension. The most
influential indicator set based on this framework has
been the one developed in 2001 and revised in 2007 by
the United Nations Commission on Sustainable
Development, which includes 14 themes, 44 sub-
themes, 50 core indicators, and a total of 96 indicators
(United Nations 2007). Although the theme-based
framework was originally designed for developing
national-level sustainability indicators, it can also be
used for gauging urban sustainability on multiple
scales.
One of the early indicator sets for sustainable cities
developed by the World Health Organization (WHO)
in 1994—the Healthy Cities Indicators (HCI)—basi-
cally fits the theme-based framework. The HCI set
contains indicators pertain to environmental, eco-
nomic, social, and health-related issues of cities. The
European Foundation for the Improvement of Living
and Working Conditions (Eurofound; an autonomous
body of the European Union) published its urban
sustainability indicator set, following a similar frame-
work that considered global change, social justice,
economic growth, citizen participation, and urban
safety for medium-sized cities in Europe (Mega and
Pedersen 1998). The World Bank has established the
Global City Indicators Facility (GCIF), consisting of
measures of a range of city services and quality of life
factors under 20 themes. The United Nations Human
Settlements Programme (UN-Habitat) also has estab-
lished the Global Urban Indicators Database, includ-
ing indicators of shelter, social development,
environmental management, economic development,
and governance. In addition, a large number of cities in
developed and developing countries have adopted the
theme-based framework to develop indicator sets for
assessing the sustainability of individual cities and
urban regions (Huang et al. 1998; Lee and Huang
2007; Tanguay et al. 2010).
Indicator sets based on the material and energy flow
framework
To assess sustainability, it is crucial to keep track of
the input, output, and internal dynamics of energy and
materials within systems, ranging from a local society
to a nation state and the entire world (NRC 2004). To
operationalize these accounting procedures, the mate-
rial and energy flow-based framework of various
1180 Landscape Ecol (2015) 30:1175–1193
123
forms has been developed during the past few decades.
The economy-wide material flow accounting (EW-
MFA), which came to the fore in the 1990s, provides
such a framework based on which indicator sets have
been constructed (Eurostat 2001; Bringezu et al. 2003;
Haberl et al. 2004; Fischer-Kowalski et al. 2011).
In the urban context, the inflows, outflows, and
internal flows of material and energy in a city have
often been referred to as ‘‘urban metabolism’’ (Wol-
man 1965). Comparing urban material dynamics to
organismic (or ecosystem) metabolism echoes the
long tradition of the city-as-organism analogy (going
through the birth-growth-maturation-death cycle) in
urban ecology.While criticized by some (Golubiewski
2012), the urban metabolism approach has been
widely used in urban ecology and industrial ecology
as it provides a useful framework for analyzing
resource consumption and waste production in urban
systems, as well as facilitating the linkage between the
environment and economy (Decker et al. 2000; Huang
and Hsu 2003; Kennedy et al. 2011; Pincetl et al.
2012). Compared toMFA, urban metabolism is a more
specific form of the material and energy flow frame-
work with an explicit focus on cities. It has been used
as a conceptual basis for developing USIs, such as
urban ecological footprints (Rees and Wackernagel
1996) and urban metabolic indicator sets (Kennedy
et al. 2014).
Also consistent with the material and energy flows
framework, Life Cycle Assessment (LCA) is a
systems approach to assessing the environmental
impacts associated with a product or service, from
raw material extraction, through production and use,
to waste disposal (Finnveden et al. 2009; Baumann
2010). The methodology of LCA was mainly devel-
oped in the 1990s in the engineering community, but
has become increasingly cross-disciplinary by incor-
porating elements from social, economic, environ-
mental, and management sciences (Finnveden et al.
2009; Baumann 2010; Powers et al. 2012). LCA
provides a framework for developing specific indica-
tors related directly to the different phases in the life
cycle of a product or service, following a cradle-to-
grave accounting of resource use and environmental
impacts. An important recent development in LCA,
particularly relevant to urban sustainability, is the
integration of the techniques of LCA with the
conceptual model of urban metabolism (Chester
et al. 2012; Pincetl et al. 2012; Goldstein et al.
2013). Also, incorporating land use and land cover
change explicitly in LCA is another promising
research area which will make LCA-based methods
more effective for landscape and regional sustain-
ability analysis (Eddy and Gergel 2015).
Single composite indices
Ecological Footprint
Ecological Footprint (EF) is an area-based indicator
that focuses on the environmental dimension of
sustainability, implying that a sustainable society
should operate within its environmental carrying
capacity (Rees 1996). Specifically, EF is defined as
the land (and water) area that is needed to provide all
the energy and material resources consumed and to
absorb all the wastes discharged in order to support a
population or an activity, given prevailing technology
and resource management practices (Rees 1996;
Wackernagel and Rees 1996). Comparing the actual
EF to the available biocapacity of a place of concern
provides an indication of whether the environmental
carrying capacity of that place is exceeded. To
quantify both the demands and supplies of the
renewable resources generated by land and water, a
productivity-weighted areal unit—the ‘‘global hec-
tare’’—is used in the calculation of EF (Table 2). One
global hectare is a normalized value based on the
average productivity of all biologically productive
land and water of the world in a given year. The
consumption of natural resources of different kinds,
from energy to biomass, can be converted to global
hectares.
Since the early 1990s, EF has become a widely used
indicator of human impacts on the environment across
a wide range of scales, from individual humans and
activities to the entire world (Wackernagel and Rees
1996; Luck et al. 2001; Wieldmann and Barrett 2010).
For example, based on a global-level EF analysis
Wackernagel et al. (2002) reported that human
demands for ecosystem goods have exceeded the
earth’s regenerative capacity since the 1980s onward,
overshooting the global biocapacity by 20 % in 1999.
EF has had a long tradition of focusing on cities since
its inception (Rees and Wackernagel 1996). At the
urban scale, EF can keep track of a city’s demands for
food, water, and other natural resources as well as its
natural capital, providing a useful measure of its
Landscape Ecol (2015) 30:1175–1193 1181
123
environmental sustainability. A number of case stud-
ies of sustainability assessment using EF on national,
regional, municipal, and local scales have been
compiled by the Global Footprint Network (http://
www.footprintnetwork.org).
The popularity of EF has been met with criticisms,
pointing to the abstraction of the area-based measure-
ment, the demarcation of spatial boundaries, and the
lack of consideration of technological change, equity
issues, and policy prescriptions (van den Bergh and
Verbruggen 1999; Ayres 2000; Moffatt 2000; Fiala
2008; van den Bergh and Grazi 2010). In response to
some of the criticisms, Rees (2000) admitted that
‘‘certainly eco-footprinting is not all-inclusive’’ and
‘‘does not produce a complete picture of ecological
sustainability’’. He concluded that the limited scope of
EF does not invalidate the method for what it does
measure; but rather it only suggests that EF calcula-
tions most likely underestimate the actual human
appropriations of ecosystem goods (Rees 2000).
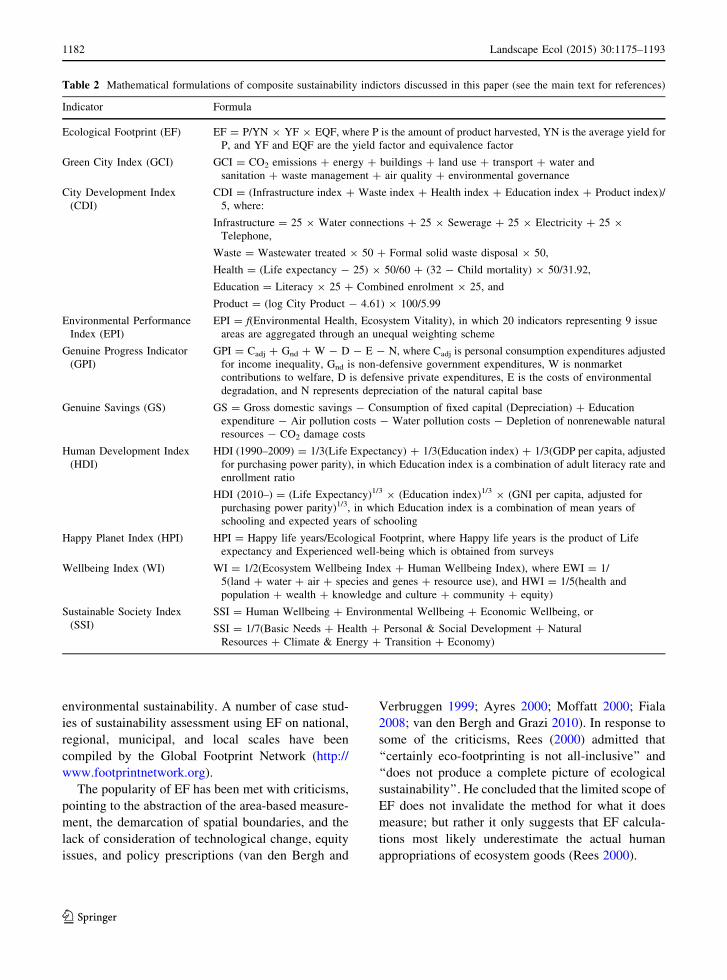
Table 2 Mathematical formulations of composite sustainability indictors discussed in this paper (see the main text for references)
Indicator Formula
Ecological Footprint (EF) EF = P/YN 9 YF 9 EQF, where P is the amount of product harvested, YN is the average yield for
P, and YF and EQF are the yield factor and equivalence factor
Green City Index (GCI) GCI = CO2 emissions ? energy ? buildings ? land use ? transport ? water and
sanitation ? waste management ? air quality ? environmental governance
City Development Index
(CDI)
CDI = (Infrastructure index ? Waste index ? Health index ? Education index ? Product index)/
5, where:
Infrastructure = 25 9 Water connections ? 25 9 Sewerage ? 25 9 Electricity ? 25 9
Telephone,
Waste = Wastewater treated 9 50 ? Formal solid waste disposal 9 50,
Health = (Life expectancy - 25) 9 50/60 ? (32 - Child mortality) 9 50/31.92,
Education = Literacy 9 25 ? Combined enrolment 9 25, and
Product = (log City Product - 4.61) 9 100/5.99
Environmental Performance
Index (EPI)
EPI = f(Environmental Health, Ecosystem Vitality), in which 20 indicators representing 9 issue
areas are aggregated through an unequal weighting scheme
Genuine Progress Indicator
(GPI)
GPI = Cadj ? Gnd ? W - D - E - N, where Cadj is personal consumption expenditures adjusted
for income inequality, Gnd is non-defensive government expenditures, W is nonmarket
contributions to welfare, D is defensive private expenditures, E is the costs of environmental
degradation, and N represents depreciation of the natural capital base
Genuine Savings (GS) GS = Gross domestic savings - Consumption of fixed capital (Depreciation) ? Education
expenditure - Air pollution costs - Water pollution costs - Depletion of nonrenewable natural
resources - CO2 damage costs
Human Development Index
(HDI)
HDI (1990–2009) = 1/3(Life Expectancy) ? 1/3(Education index) ? 1/3(GDP per capita, adjusted
for purchasing power parity), in which Education index is a combination of adult literacy rate and
enrollment ratio
HDI (2010–) = (Life Expectancy)1/3 9 (Education index)1/3 9 (GNI per capita, adjusted for
purchasing power parity)1/3, in which Education index is a combination of mean years of
schooling and expected years of schooling
Happy Planet Index (HPI) HPI = Happy life years/Ecological Footprint, where Happy life years is the product of Life
expectancy and Experienced well-being which is obtained from surveys
Wellbeing Index (WI) WI = 1/2(Ecosystem Wellbeing Index ? Human Wellbeing Index), where EWI = 1/
5(land ? water ? air ? species and genes ? resource use), and HWI = 1/5(health and
population ? wealth ? knowledge and culture ? community ? equity)
Sustainable Society Index
(SSI)
SSI = Human Wellbeing ? Environmental Wellbeing ? Economic Wellbeing, or
SSI = 1/7(Basic Needs ? Health ? Personal & Social Development ? Natural
Resources ? Climate & Energy ? Transition ? Economy)
1182 Landscape Ecol (2015) 30:1175–1193
123
Green City Index
Green City Index (GCI) was developed by the
Economist Intelligence Unit in cooperation with
Siemens (EIU-Siemens) for assessing and comparing
the world cities in terms of their ‘‘environmental
performance’’ (http://www.siemens.com/entry/cc/en/
greencityindex.htm). Since 2009, the EIU-Siemens
project has assessed more than 120 cities around the
world, and produced a series of reports with GCI
rankings of these cities by region (African Green City
Index, Asian Green City Index, European Green City
Index, German Green City Index, Latin American
Green City Index, and U.S. and Canada Green City
Index). The cities were chosen on the basis of their size
and prominence, most of which are national capitals
and metropolises with large populations and business
centers.
GCI includes about 30 indicators of 9 categories,
including CO2 emissions, energy, buildings, land use,
transport, water and sanitation, waste management, air
quality, and environmental governance (Table 2).
About half of the indicators in GCI are quantitative
based on data usually from official public sources
(e.g., CO2 emissions, water consumption, air pollu-
tion), and the other half are qualitative assessments of
environmental policies (e.g., investment in renewable
energy, traffic-congestion-reduction policies, and air
quality codes). The specific formulation of GCI varies
somewhat between the regions, accounting for data
availability and unique challenges in each region. The
European Green City Index was developed earlier,
consisting of 16 quantitative and 14 qualitative
indicators, and its methodology was then adapted for
developing the GCI of the other regions. Different
from the European GCI, the African GCI includes
indicators measuring access to electricity, potable
water, and information. So far, GCI has been promoted
almost exclusively by the EIU-Siemens project, and is
yet to be taken up by other researchers.
Environmental Performance Index
Environmental Performance Index (EPI), formerly
called Environmental Sustainability Index (ESI), was
developed by the Center for Environmental Law and
Policy at Yale University and Columbia University’s
Center for International Earth Science Information
Network, in collaboration with the World Economic
Forum and the European Commission’s Joint Re-
search Center (http://epi.yale.edu). EPI is constructed
based on two broad themes (or policy objectives):
protection of human health from environmental harm
and protection of ecosystems, with 9 issue areas (i.e.,
agriculture, air quality, biodiversity and habitat, cli-
mate and energy, fisheries, forests, health impacts,
water resources, and water and sanitation). Altogether,
20 indicators are used to quantify the 9 issue areas of
the two themes, and then aggregated into one single
index of EPI (Table 2). In the process of aggregation,
the weights of the indicators, issue areas, and overall
policy objectives are determined according to their
relevance to policy issues and data quality: higher
relevance corresponds to higher weights and less re-
liable data to lower weights (Hsu et al. 2014).
EPI has been used to measure how well different
countries are meeting internationally established tar-
gets and how they compare with each other. It focuses
on the environment dimension of sustainability, as the
name itself suggests, but has a strong emphasis on
policy issues that cut across social and institutional
dimensions. Although EPI has been used primarily at
the national level, it can be used for assessing the
sustainability of cities and urban regions after the issue
areas and associated indicators are properly modified
to address urban issues. However, this is yet to be
done.
Genuine Progress Indicator
Recognizing that GDP is an indicator of economic
growth but not sustainable development, efforts to
‘‘green’’ GDP mushroomed since the early 1990s (Wu
and Wu 2010; Kubiszewski et al. 2013). In addition to
economic activities, resource consumption and envi-
ronmental damage, completely ignored in GDP, are
explicitly considered in the formulations of Green
GDP measures. A prominent sustainability indicator
of this kind is Genuine Progress Indicator (GPI),
which is composed of more than 20 individual
indicators covering the environmental, economic,
and social dimensions of sustainability (Talberth
et al. 2006). GPI accounts for both conventional
economic transactions and nonmarket natural and
social benefits, explicitly distinguishing between
positive and negative impacts of economic activities
on human wellbeing (Table 2; Posner and Costanza
2011). GPI is the revised version of Index of
Landscape Ecol (2015) 30:1175–1193 1183
123
Sustainable Economic Welfare (ISEW), proposed by
Daly and Cobb (1989). Both GPI and ISEW are
derived from the national accounts of the transactions
deemed directly relevant to human wellbeing, includ-
ing the positive economic contributions of household
and volunteer work and the negative influences of
pollution, commuting, crime, and family breakdown.
The main differences between the two are related to
data availability and users’ preferences for valuation
methods (Lawn 2003). In recent years, however, GPI
has been used more frequently than other Green GDP
measures (Lawn 2003; Kubiszewski et al. 2013).
Although ISEW and GPI were originally designed
to measure progress at the national level, they have
been used at multiple scales (Posner and Costanza
2011). For example, as the first user of Green GDP at
the national level, China released its environmentally
adjusted GDP in 2006, concluding that the economic
loss of environmental damages accounted for 3 % of
its total GDP in 2004 (Wu and Wu 2010). The State of
Maryland of the United States has adapted GPI to
measure how development activities impact long-term
prosperity (http://www.dnr.maryland.gov/mdgpi/).
GPI has also been applied at the city level, including
several American cities (Costanza et al. 2004; Vene-
toulis and Cobb 2004), Chinese cities (Wen et al.
2007; Zhang et al. 2008), and Canadian cities
(Anielski and Johannessen 2009).
Genuine savings
Genuine savings (GS) were proposed as an indicator of
sustainable development, based on the idea that ‘‘the
level of overall capital stock should be non-decreas-
ing’’ for a sustainable nation state (Pearce and
Atkinson 1993). The wealth of a country can only be
increased by net savings, not necessarily by GDP, and
the calculation of net savings must consider resource
depletion and environmental degradation, as well as
changes in technologies and human resources. Thus,
GS measures the net change in the whole range of
assets important for economic development, including
produced assets, natural resources, environmental
quality, human resources, and foreign assets (Table 2;
Hamilton and Clemens 1999; Pillarisetti 2005; Dietz
and Neumayer 2007; Greasley et al. 2014).
GS represents another way of ‘‘greening’’ GDP or
national accounts by subtracting the values of natural
resource consumption and depletion, costs of pollution
damages (including those related to human health),
and deducting net foreign borrowing, as well as by
treating expenditures on education as saving rather
than as consumption (increasing human capital)
(World Bank 1997). GS and GPI are conceptually
similar, but technically different. GPI focuses on the
‘‘flows’’ of transactions, whereas GS measures
changes in stocks or different kinds of capital, showing
the resources available for the future (Rogers and
Srinivasan 2007). Although not as widely as GPI, GS
has also been used in assessing urban sustainability,
including a number of cities in China, India, and the
United States (Wen et al. 2005; Rogers and Srinivasan
2007; Zhang et al. 2008).
Human Development Index
Human Development Index (HDI) was developed by
the United Nations Development Programme (UNDP)
in the 1990s to assess the levels of human and social
development of different countries around the world
(http://hdr.undp.org/en/content/human-development-
index-hdi). As a composite index, HDI is computed as
the arithmetic mean or geometric mean of three nor-
malized sub-indices: life expectancy, education and
standard of living (Table 2). Since 1990, UNDP has
released the Human Development Report annually,
with all countries ranked by their values of HDI. HDI
is arguably the most widely used among all sustain-
ability indicators so far because it captures the most
essential elements of human wellbeing and because it
is easy to compute and interpret. Its mathematical
formulation clearly indicates that HDI considers the
economic and social dimensions, but omits the envi-
ronmental dimension. As a measure of human well-
being, however, HDI has been quite popular (e.g.,
Leigh and Wolfers 2006; Raudsepp-Hearne et al.
2010). In addition to its widespread applications at the
national level, HDI has also been used for assessing
the sustainability or ‘‘prosperity’’ of major cities
around the world during the recent years (UN-Habitat
2012).
Happy Planet Index
HappyPlanet Index (HPI)was first developed in 2006by
the New Economics Foundation (NEF), which directly
relates human wellbeing to human consumption of
natural resources (http://www.happyplanetindex.org/).
1184 Landscape Ecol (2015) 30:1175–1193
123
The index is calculated as the ratio of Happy Life Years
(happiness-adjusted life expectancy) to environmental
impact (measured by Ecological Footprint), and essen-
tially measures ‘‘the ecological efficiency with which
human wellbeing is delivered’’ (New Economics Foun-
dation 2009). The formulation of HPI is based on the
assumption that human wellbeing should be measured
not only in terms of longevity but also quality of life, and
that a sustainable world can only be achieved by simul-
taneously increasing human wellbeing and reducing
human ecological footprints (Table 2). NEF, the creator
of HPI, has computed HPI for 143 countries, covering
99 % of the world’s population. The results show that
richer developed nations tend to have higher HPI values,
and that some less wealthy countries also are quite
‘‘happy’’, but with a much smaller per capita ecological
footprint (New Economics Foundation 2009). While
HPI has been used only on the national level, as Mega
(2013) suggested, it can, and should, be used for
assessing urban sustainability. Its simple mathematical
formulation seems readily applicable to cities or urban
regions.
Wellbeing Index and barometer of sustainability
Wellbeing Index (WI), also known as the Barometer of
Sustainability, was developed as a tool for measuring
and communicating a society’s wellbeing and progress
toward sustainability through the sponsorship of
World Conservation Union (IUCN) in the 1990s
(Prescott-Allen 1997, 2001). Different from the
three- or four-dimensional framework, WI is based
on a dual framework that has only two dimensions—
people and ecosystems—which are considered equally
important, so that the wellbeing of a human-environ-
ment system is determined simultaneously by the
wellbeing of both people and the ecosystems that
people depend on. This dual framework is based on the
assumption that dividing the people component
further unjustifiably reduces the weight of the envi-
ronment—for example, ‘‘the triple framework reduces
the weight of the environment to a third; the quadruple
framework reduces it to a quarter’’ (Prescott-Allen
2001, pp. 291). The WI framework was often
explained through the metaphor of the Egg of Well-
being: ‘‘The ecosystem surrounds and supports people
much as the white of an egg surrounds and supports the
yolk. Just as an egg can be good only if both the yolk
and white are good, so a society can be well and
sustainable only if both people and the ecosystem are
well’’ (Prescott-Allen 2001, pp. 4–5).
Thus, WI is a compound index with two compo-
nents: Human Wellbeing Index (HWI) and Ecosystem
Wellbeing Index (EWI) (Table 2). HWI is the average
of indicators measuring the wellbeing of people from
five aspects: health and population, wealth, knowledge
and culture, community, and equity. HWI reflects
socioeconomic conditions more realistically than
monetary indices such as GDP and represents human
wellbeing more comprehensively than HDI. EWI is
the average of indicators measuring the ecosystem
conditions in terms of land, water, air, species and
genes, and resource use. The result of WI can be
presented as a single value (i.e., the arithmetic average
of EWI and HWI) or, more meaningfully, as a two-
dimensional graph, with EWI as the X-axis and HWI
as the Y-axis. Both axes are scaled from 0 to 100 and
divided into five equal bands: Bad, Poor, Medium,
OK, and Good. The overall wellbeing of a system is
indicated by the intersection between EWI and HWI,
and this plot is called the ‘‘Barometer of Sustain-
ability’’ (Prescott-Allen 2001). On the barometer, the
axis with the lower score always overrides the other
axis, meaning that the overall wellbeing is determined
by either EWI or HWI whichever is lower. In other
words, no tradeoff or substitution is allowed between
human wellbeing and ecosystem wellbeing.
As the first global assessment of sustainability, the
WI method was used to compare the wellbeing of 180
countries (Prescott-Allen 2001). The method can be
used at any level, ranging from a municipality to the
entire world. However,WI has not been widely used in
the past decade when many new sustainability indi-
cators have mushroomed.
City Development Index
City Development Index (CDI) was developed in 1997
by the Urban Indicators Programme of the United
Nations Human Settlements Programme (UN-Habi-
tat), in order to rank cities of the world according to
their level of development (UN-Habitat 2002). CDI is
composed of five sub-indices: Infrastructure, Waste,
Health, City product, and Education (Table 2). Each
sub-index is further composed of multiple indicators:
(1) Infrastructure that considers water availability,
sewerage, access to electricity, and telephone avail-
ability; (2) Waste that includes wastewater treatment
Landscape Ecol (2015) 30:1175–1193 1185
123
and solid waste disposal; (3) Health that considers life
expectancy and child mortality; (4) City product
which is analogous to GDP at the city level; and (5)
Education that combines literacy and school enroll-
ment. All the indicators are aggregated using weights
that are determined by Principal Component Analysis
and experts’ opinions (UN-Habitat 2002).
CDI is a measure of urban development and access
to urban facilities by individuals, and seems effective
to evaluate urban poverty and urban governance. In
particular, the components of health, education and
infrastructure are useful for measuring poverty out-
comes, and the components of infrastructure, waste
and city product are pertinent to the effectiveness of
urban governance. The result of CDI can be presented
as a radar diagram to visually show how well the
different components do, and also to facilitate com-
parisons among different cities and regions. The
United Nations Human Settlements Programme has
computed CDI for 232 cities in 113 countries around
the world to assess the urban conditions and trends
between 1993 and 1998 (UN-Habitat 2002). The
developer of CDI has regarded it as ‘‘the best single
measure of the level of development in cities’’ (UN-
Habitat 2002, p. 3).
Sustainable Society Index and Sustainable City Index
Sustainable Society Index (SSI) is a highly aggregated
sustainability index which was developed in 2006 by
the Sustainable Society Foundation, a non-profit
organization based in the Netherlands (http://www.
ssfindex.com). The original formulation of SSI in-
cludes 22 indicators under 5 categories: personal de-
velopment, clean environment, well-balanced society,
sustainable use of resources, and sustainable world
(Van de Kerk and Manuel 2008). The latest version of
SSI now is organized hierarchically according to 3
‘‘wellbeing dimensions’’, 7 categories, and 21 indi-
cators (http://www.ssfindex.com) (Table 2). The three
wellbeing dimensions (and categories) are Human
Wellbeing (Basic needs, Health, and Personal and
social development), Environmental Wellbeing (Nat-
ural resources, and Climate and energy), and Eco-
nomic Wellbeing (Transition and Economy). Each
category has 2 or 3 indicators which are aggregated
into a single index. SSI was originally developed and
has been used for national-level analysis (computed
for more than 150 countries), but recent efforts have
been made to apply it at regional and local levels
(http://www.ssfindex.com/about-ssf/).
In particular, based on SSI, the Sustainable Society
Foundation developed the Sustainable City Index
(SCI) in January of 2014, which had the same 3
wellbeing dimensions, 7 categories, and 16 indicators.
SCI has recently been revised, with modified dimen-
sions, categories, and indicators (www.gdindex.nl).
The revised SCI 2.0 now has 9 categories: Basic needs,
Personal development, and Social development (the
dimension of Human wellbeing), Environment and
nature, Resource efficiency, Energy efficiency, and
Transport efficiency (the dimension of Environmental
wellbeing and resource circularity), and Work and
Public finance (the dimension of Economic wellbe-
ing). There are 24 indicators associated with the 9
categories which emphasize personal and social de-
velopment, environmental quality, resource and en-
ergy use efficiency, and several other prominent issues
in cities. The indicators are aggregated into the single
index of SCI through a geometric averaging scheme.
The range of values of SCI goes from 1 to 10. SCI has
been used to rank all 403 cities in the Netherlands in
2014. Of all these cities, the highest score is 5.8, the
lowest score is 3.1, and the average score is 4.8, sug-
gesting there is much room for sustainability im-
provements (http://www.gdindex.nl).
Discussion
From the above review, it is clear that there is no lack
of USIs, which have been developed from different
conceptual frameworks and for different purposes. In
this section, we discuss several issues on the problems,
challenges, and ways forward in the use of USIs,
particularly from the perspective of landscape sus-
tainability science (Wu 2013).
What do USIs really measure?
By definition, USIs are supposed to gauge the state and
processes of urban sustainability. But do they each
measure all the three dimensions of sustainability?
What kind of sustainability do they actually measure:
weak sustainability or strong sustainability? Of all the
USIs reviewed in this paper, eight of them cover all the
three dimensions, and five consider only two of the
three dimensions (Fig. 3). Specifically, indicator sets
1186 Landscape Ecol (2015) 30:1175–1193
123
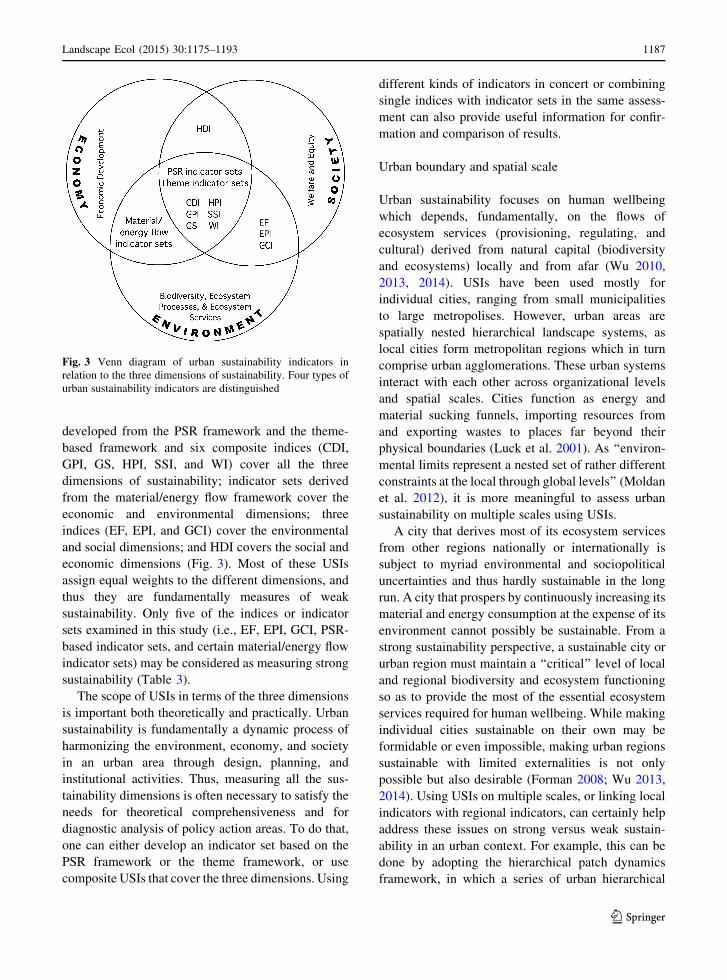
developed from the PSR framework and the theme-
based framework and six composite indices (CDI,
GPI, GS, HPI, SSI, and WI) cover all the three
dimensions of sustainability; indicator sets derived
from the material/energy flow framework cover the
economic and environmental dimensions; three
indices (EF, EPI, and GCI) cover the environmental
and social dimensions; and HDI covers the social and
economic dimensions (Fig. 3). Most of these USIs
assign equal weights to the different dimensions, and
thus they are fundamentally measures of weak
sustainability. Only five of the indices or indicator
sets examined in this study (i.e., EF, EPI, GCI, PSR-
based indicator sets, and certain material/energy flow
indicator sets) may be considered as measuring strong
sustainability (Table 3).
The scope of USIs in terms of the three dimensions
is important both theoretically and practically. Urban
sustainability is fundamentally a dynamic process of
harmonizing the environment, economy, and society
in an urban area through design, planning, and
institutional activities. Thus, measuring all the sus-
tainability dimensions is often necessary to satisfy the
needs for theoretical comprehensiveness and for
diagnostic analysis of policy action areas. To do that,
one can either develop an indicator set based on the
PSR framework or the theme framework, or use
composite USIs that cover the three dimensions. Using
different kinds of indicators in concert or combining
single indices with indicator sets in the same assess-
ment can also provide useful information for confir-
mation and comparison of results.
Urban boundary and spatial scale
Urban sustainability focuses on human wellbeing
which depends, fundamentally, on the flows of
ecosystem services (provisioning, regulating, and
cultural) derived from natural capital (biodiversity
and ecosystems) locally and from afar (Wu 2010,
2013, 2014). USIs have been used mostly for
individual cities, ranging from small municipalities
to large metropolises. However, urban areas are
spatially nested hierarchical landscape systems, as
local cities form metropolitan regions which in turn
comprise urban agglomerations. These urban systems
interact with each other across organizational levels
and spatial scales. Cities function as energy and
material sucking funnels, importing resources from
and exporting wastes to places far beyond their
physical boundaries (Luck et al. 2001). As ‘‘environ-
mental limits represent a nested set of rather different
constraints at the local through global levels’’ (Moldan
et al. 2012), it is more meaningful to assess urban
sustainability on multiple scales using USIs.
A city that derives most of its ecosystem services
from other regions nationally or internationally is
subject to myriad environmental and sociopolitical
uncertainties and thus hardly sustainable in the long
run. A city that prospers by continuously increasing its
material and energy consumption at the expense of its
environment cannot possibly be sustainable. From a
strong sustainability perspective, a sustainable city or
urban region must maintain a ‘‘critical’’ level of local
and regional biodiversity and ecosystem functioning
so as to provide the most of the essential ecosystem
services required for human wellbeing. While making
individual cities sustainable on their own may be
formidable or even impossible, making urban regions
sustainable with limited externalities is not only
possible but also desirable (Forman 2008; Wu 2013,
2014). Using USIs on multiple scales, or linking local
indicators with regional indicators, can certainly help
address these issues on strong versus weak sustain-
ability in an urban context. For example, this can be
done by adopting the hierarchical patch dynamics
framework, in which a series of urban hierarchical
Fig. 3 Venn diagram of urban sustainability indicators in
relation to the three dimensions of sustainability. Four types of
urban sustainability indicators are distinguished
Landscape Ecol (2015) 30:1175–1193 1187
123
levels (e.g., single city—city cluster—urban region—
nation state) is explicitly identified, and USIs are
applied at each and every hierarchical level (Wu 1999;
Li et al. 2013). Such multi-scale analysis not only
provides deeper insight into the sustainability of
individual urban systems, but also critical information
for urban and regional planning across scales.
Indicator selection
Using USIs involves the selection of individual
indicators to measure specific aspects of each sustain-
ability dimension. A large pool of such urban indica-
tors for different themes is available for selection,
many of which have been used in a number of case
studies (Appendix from ESM). The choices of the
component indicators for a particular sustainability
index or indicator set directly affect the results and
conclusions. Unfortunately, the selection process is
‘‘inherently very subjective’’ and ‘‘much depends
upon a value judgment as to what is important’’
(Morse et al. 2001). To reduce arbitrariness in the
selection process, we recommend that the PSR and
theme-based frameworks be followed. In addition to
covering the three pillars, project objectives, scale,
and strong versus weak sustainability also need to be
considered. Given the subjective nature of selecting
indicators, urban sustainability assessment should
emphasize the use of widely recognized urban indi-
cators, with clearly articulated justifications.
USIs based on the Triple Bottom Line and, more
generally, multi-dimensional concepts of sustainability
may be considered as fundamentally measuring weak
sustainability. But this does not have to be the case. The
recognition of multiple dimensions of sustainability
itself, without assigning equal weights to them, is not
necessarily a weak sustainability perspective. In fact,
the strong sustainability perspective cannot be articulat-
ed without invoking multiple types of capital or
sustainability dimensions. Nevertheless, the distinction
between weak and strong sustainability has important
implications for urban sustainability assessment be-
cause whether or not a USI or a group of USIs is
adequate depends on what kind of sustainability is
intended to be achieved. As discussed earlier, weak
sustainability is eventually not sustainable (Daly 1995;
Wu 2013), although weak sustainability indicators can
be useful. To avoid misleading interpretations, howev-
er, we argue that an urban sustainability assessment
should include at least one strong sustainability indica-
tor (e.g. EF or GCI). Thus, the concept of the ‘‘Critical
Natural Capital’’ and the associated ‘‘sustainability
gap’’ approach (also Ekins and Simon 1999; Ekins et al.
2003; Ekins 2011) are quite useful in urban sustain-
ability assessment.
Weighting and aggregation
Using USIs also involves a series of technical steps
from the acquisition and processing of data to the
computation and presentation of the indicator results
(Fig. 2). The values of component indicators usually
are normalized for compatibility (e.g., everything is
monetized in GPI and GS, but standardized to the unit
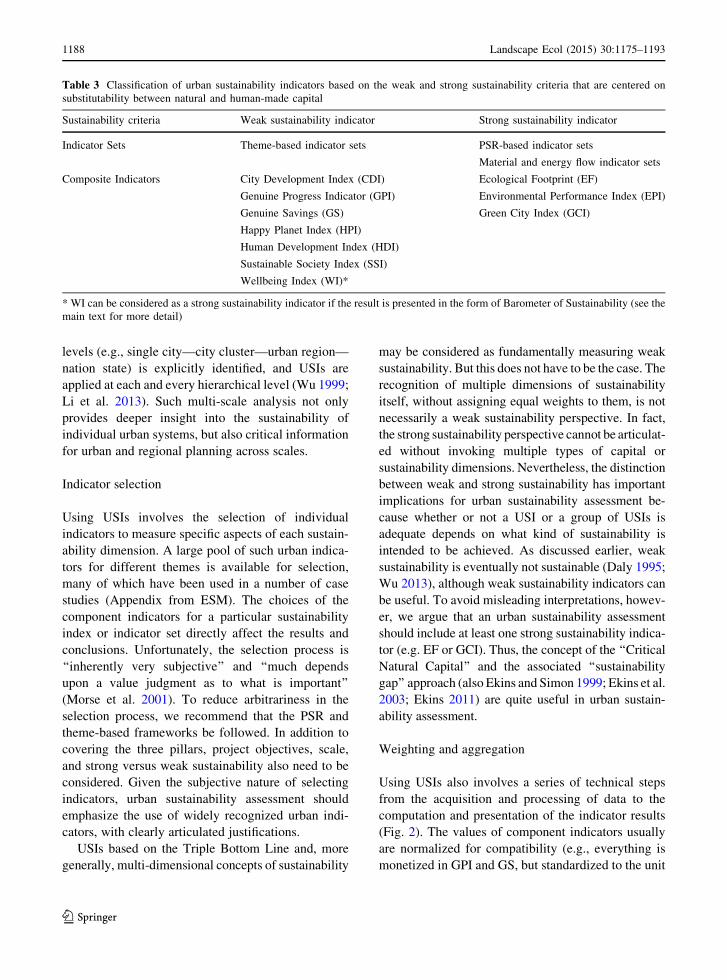
Table 3 Classification of urban sustainability indicators based on the weak and strong sustainability criteria that are centered on
substitutability between natural and human-made capital
Sustainability criteria Weak sustainability indicator Strong sustainability indicator
Indicator Sets Theme-based indicator sets PSR-based indicator sets
Material and energy flow indicator sets
Composite Indicators City Development Index (CDI) Ecological Footprint (EF)
Genuine Progress Indicator (GPI) Environmental Performance Index (EPI)
Genuine Savings (GS) Green City Index (GCI)
Happy Planet Index (HPI)
Human Development Index (HDI)
Sustainable Society Index (SSI)
Wellbeing Index (WI)*
* WI can be considered as a strong sustainability indicator if the result is presented in the form of Barometer of Sustainability (see the
main text for more detail)
1188 Landscape Ecol (2015) 30:1175–1193
123
of global hectares in EF), and then weights are
assigned to indicators which are aggregated into theme
indicators (or sub-indices). In the case of composite
indices, such as those in Tables 2 and 3, sub-indices
are further aggregated into single values (Fig. 2).
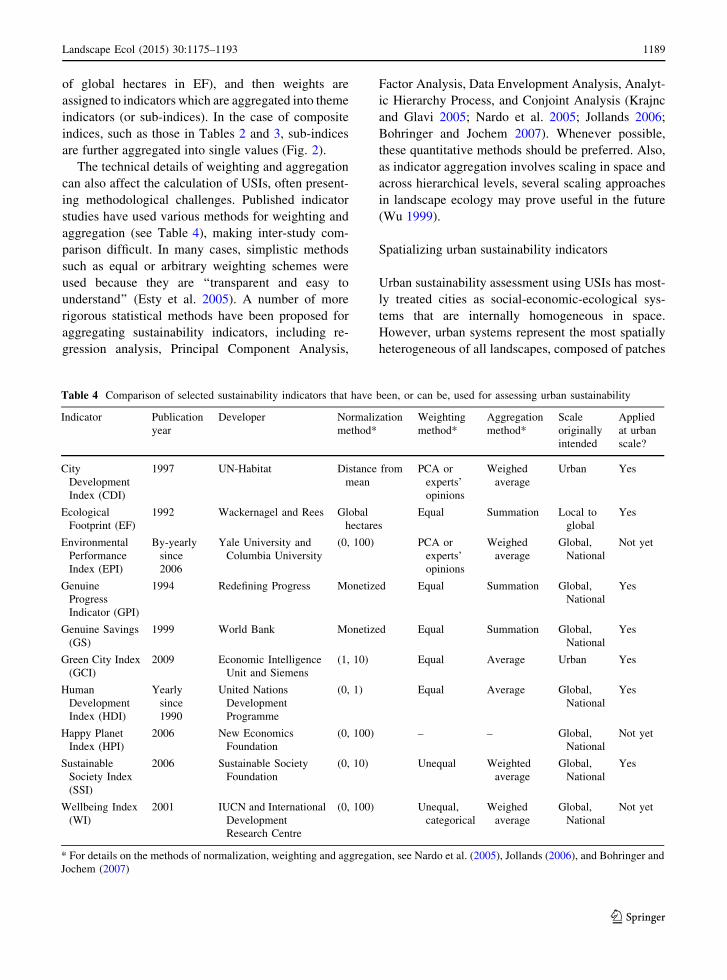
The technical details of weighting and aggregation
can also affect the calculation of USIs, often present-
ing methodological challenges. Published indicator
studies have used various methods for weighting and
aggregation (see Table 4), making inter-study com-
parison difficult. In many cases, simplistic methods
such as equal or arbitrary weighting schemes were
used because they are ‘‘transparent and easy to
understand’’ (Esty et al. 2005). A number of more
rigorous statistical methods have been proposed for
aggregating sustainability indicators, including re-
gression analysis, Principal Component Analysis,
Factor Analysis, Data Envelopment Analysis, Analyt-
ic Hierarchy Process, and Conjoint Analysis (Krajnc
and Glavi 2005; Nardo et al. 2005; Jollands 2006;
Bohringer and Jochem 2007). Whenever possible,
these quantitative methods should be preferred. Also,
as indicator aggregation involves scaling in space and
across hierarchical levels, several scaling approaches
in landscape ecology may prove useful in the future
(Wu 1999).
Spatializing urban sustainability indicators
Urban sustainability assessment using USIs has most-
ly treated cities as social-economic-ecological sys-
tems that are internally homogeneous in space.
However, urban systems represent the most spatially
heterogeneous of all landscapes, composed of patches
Table 4 Comparison of selected sustainability indicators that have been, or can be, used for assessing urban sustainability
Indicator Publication
year
Developer Normalization
method*
Weighting
method*
Aggregation
method*
Scale
originally
intended
Applied
at urban
scale?
City
Development
Index (CDI)
1997 UN-Habitat Distance from
mean
PCA or
experts’
opinions
Weighed
average
Urban Yes
Ecological
Footprint (EF)
1992 Wackernagel and Rees Global
hectares
Equal Summation Local to
global
Yes
Environmental
Performance
Index (EPI)
By-yearly
since
2006
Yale University and
Columbia University
(0, 100) PCA or
experts’
opinions
Weighed
average
Global,
National
Not yet
Genuine
Progress
Indicator (GPI)
1994 Redefining Progress Monetized Equal Summation Global,
National
Yes
Genuine Savings
(GS)
1999 World Bank Monetized Equal Summation Global,
National
Yes
Green City Index
(GCI)
2009 Economic Intelligence
Unit and Siemens
(1, 10) Equal Average Urban Yes
Human
Development
Index (HDI)
Yearly
since
1990
United Nations
Development
Programme
(0, 1) Equal Average Global,
National
Yes
Happy Planet
Index (HPI)
2006 New Economics
Foundation
(0, 100) – – Global,
National
Not yet
Sustainable
Society Index
(SSI)
2006 Sustainable Society
Foundation
(0, 10) Unequal Weighted
average
Global,
National
Yes
Wellbeing Index
(WI)
2001 IUCN and International
Development
Research Centre
(0, 100) Unequal,
categorical
Weighed
average
Global,
National
Not yet
* For details on the methods of normalization, weighting and aggregation, see Nardo et al. (2005), Jollands (2006), and Bohringer and
Jochem (2007)
Landscape Ecol (2015) 30:1175–1193 1189
123
and corridors of different kinds and sizes (e.g.,
backyards, parking lots, parks, central business dis-
tricts, residential areas, schools, rivers, and roads).
Urban systems are patchy not only environmentally
but also economically and socially. To accurately
assess urban sustainability, therefore, spatial hetero-
geneity within a city and the broader urban region
needs to be considered (Wu 2010). In other words,
USIs need to be ‘‘spatialized’’.
How does the spatial pattern of cities and
metropolitan regions affect the sustainability of these
urban systems? This is an important question for urban
ecologists and planners as well as landscape and
sustainability scientists. Numerous studies in the
landscape ecology literature have shown that the
composition and configuration of urban landscapes
both may have substantial influences on ecological
and socioeconomic processes, or vice versa. To help
spatialize USIs, we need to further integrate USIs with
landscape pattern analysis, with an emphasis on
ecosystem services and human wellbeing in changing
landscapes (Wu 2013, 2014). There are two simple
ways to move forward: computing USIs with spatially
explicit data representing the spatial patterns of
environmental, economic, and social conditions; and
combining landscape metrics with USIs in the same
assessment. There are examples of both approaches
(e.g., Morse et al. 2011; Jones et al. 2013; Potschin and
Haines-Young 2013; Iverson et al. 2014), and more
studies are needed.
Conclusions
Urban sustainability indicators include both indicator
sets and composite indices that are suitable for
assessing the sustainability of urban systems. While
there seems no lack of USIs, their applications have
suffered from both technical and conceptual inconsis-
tencies. To move forward with urban sustainability
assessment using USIs, we make the following
suggestions: (1) Use the PSR or theme-based frame-
works to guide the selection of urban indicators, and
cover all three dimensions of sustainability with
generally accepted urban indicators; (2) Be clear
about what kind of sustainability—weak or strong
sustainability—is being gauged; (3) Include at least
one strong sustainability indicator in the assessment
by combining indicator sets and composite indices; (4)
Follow rigorous procedures for normalization, weight-
ing, and aggregation; (5) Adopt a multi-scale strategy
to consider hierarchical linkages between local cities
and urban regions; and (6) Spatialize USIs to consider
landscape patterns and the flows of ecosystem services
in changing environments.
Acknowledgments We thank three reviewers for their
comments and suggestions on an earlier version of this paper.
JW’s research in urban ecology and urban sustainability has been
supported in part by the U.S. National Science Foundation
through Central Arizona-Phoenix Long-Term Ecological
Research (DEB 9714833, DEB-0423704, and BCS-1026865)
and the ChineseMinistry of Science and Technology through the
National Basic Research Program of China (2014CB954303,
2014CB954300).
References
Alberti M (1996) Measuring urban sustainability. Environ Im-
pact Assess Rev 16:381–424
Anielski M, Johannessen H (2009) The Edmonton 2008 Gen-
uine Progress Indicator Report, Edmonton
Ayres RU (2000) Commentary on the utility of the ecological
footprint concept. Ecol Econ 32:347–349
Batty M (2011) When all the world’s a city. Environment and
Planning A 43(4):765–772
Baumann H (2010) Life cycle assessments (LCAs). In: Chris-
tensen K, Fogel D, Wagner G, Whitehouse P (eds) Berk-
shire encyclopedia of sustainability, vol II., The business of
sustainabilityBerkshire Publishing, Great Barrington,
pp 309–314
Bell S, Morse S (2008) Sustainability indicators: measuring the
immeasurable?. Earthscan, London
BohringerC, JochemPEP (2007)Measuring the immeasurable—
a survey of sustainability indices. Ecol Econ 63(1):1–8
Braat L (1991) The predictive meaning of sustainability indi-
cators. In: Kuik O, Verbruggen H (eds) In search of indi-
cators of sustainable development. Kluwer Academic
Publishers, Dordrecht, pp 57–70
Bringezu S, Schutz H, Moll S (2003) Rational for and inter-
pretation of economy-wide materials flow analysis and
derived indicators. J Ind Ecol 7:43–64
Camagni R (1998) Sustainable urban development: definition
and reasons for a research programme. Int J Environ Pollut
10(1):6–27
Chester M, Pincetl S, Allenby B (2012) Avoiding unintended
tradeoffs by integrating life-cycle impact assessment with
urbanmetabolism.CurrOpinEnvironSustain 4(4):451–457
Clark WC, Dickson NM (2003) Sustainability science: the
emerging research program. Proceedings of the National
Academy of Sciences (USA), vol 100, pp. 8059–8061
Costanza R, Erickson J, Fligger K, Adams A, Adams C, Alt-
schuler B, Balter S, Fisher B, Hike J, Kelly J, Kerr T,
McCauley M, Montone K, Rauch M, Schmiedeskamp K,
Saxton D, Sparacino L, Tusinski W, Williams L (2004)
1190 Landscape Ecol (2015) 30:1175–1193
123
Estimates of the Genuine Progress Indicator (GPI) for
Vermont, Chittenden County and Burlington, from 1950 to
2000. Ecol Econ 51(1–2):139–155
Daly HE (1995) OnWilfred Beckerman’s critique of sustainable
development. Environ Values 4:49–55
Daly HE, Cobb J (1989) For the common good: redirecting the
economy towards community, the environment, and a
sustainable future. Beacon Press, Boston
Decker EH, Elliott S, Smith FA, Blake DR, Rowland FS (2000)
Energy and material flow through the urban ecosystem.
Annu Rev Energy Environ 25:685–740
Dietz S, Neumayer E (2007) Corruption, the resource curse and
genuine saving. Environ Dev Econ 12:33–53
Eddy IMS, Gergel SE (2015) Why landscape ecologists should
contribute to life cycle sustainability approaches. Land-
scape Ecol. doi:10.1007/s10980-014-0135-7
Ekins P (2011) Environmental sustainability: from environ-
mental valuation to the sustainability gap. Prog Phys Geog
35(5):629–651
Ekins P, Simon S (1999) The sustainability gap: a practical
indicator of sustainability in the framework of the national
accounts. Int J Sustain Dev 2:32–58
Ekins P, Simon S, Deutsch L, Folke C, De Groot R (2003) A
framework for the practical application of the concepts of
critical natural capital and strong sustainability. Ecol Econ
44:165–185
Elmqvist T, Fragkias M, Goodness J, Guneralp B, Marcotullio
PJ, McDonald RI, Parnell S, Schewenius M, Sendstad M,
Seto KC, Wilkinson C (eds) (2013) Urbanization, biodi-
versity and ecosystem services: challenges and opportu-
nities. Springer, Dordrecht
Esty DC, Levy MA, Srebotnjak T, de Sherbinin A (2005) En-
vironmental Sustainability Index: Benchmarking National
Environmental Stewardship. Yale Center for Environ-
mental Law & Policy, New Haven
Eurostat (2001) Economy-wide material flow accounts and
derived indicators: a methodological guide. Office for
Official Publications of the European Communities,
Luxembourg
Fiala N (2008) Measuring sustainability: Why the ecological
footprint is bad economics and bad environmental science.
Ecol Econ 67:519–525
Finnveden G, Hauschild MZ, Ekvall T, Guinee J, Heijungs R,
Hellweg S, Koehler A, Pennington D, Suh S (2009) Recent
developments in life cycle assessment. J Environ Manag
91:1–21
Fischer J, Manning AD, Steffen W, Rose DB, Daniell K, Felton
A, Garnett S, Gilna B, Heinsohn R, Lindenmayer DB,
MacDonald B, Mills F, Newell B, Reid J, Robin L, Sherren
K,Wade A (2007)Mind the sustainability gap. Trends Ecol
Evol 22(12):621–624
Fischer-Kowalski M, Krausmann F, Giljum S, Lutter S, Mayer
A, Bringezu S, Moriguchi Y, Schutz H, Schandl H, Weisz
H (2011) Methodology and indicators of economy-wide
material flow accounting: state of the art and reliability
across sources. J Ind Ecol 15:855–875
Forman RTT (2008) Urban regions: ecology and planning be-
yond the city. Cambridge University Press, Cambridge
Gallopin GC (1997) Indicators and their use: information for
decision-making. In: Moldan B, Billharz S (eds) Sustain-
ability indicators. Wiley, New York, pp 13–28
Goldstein B, Birkved M, Quitzau MB, Hauschild M (2013)
Quantification of urban metabolism through coupling with
the life cycle assessment framework: concept development
and case study. Environ Res Lett 8(3):035024
Golubiewski N (2012) Is there a metabolism of an urban
ecosystem? An ecological critique. Ambio 41(7):751–764
Greasley D, Hanley N, Kunnas J, McLaughlin E, Oxley L,
Warde P (2014) Testing genuine savings as a forward-
looking indicator of future well-being over the (very) long-
run. J Environ Econ Manag 67(2):171–188
Grimm NB, Faeth SH, Golubiewski NE, Redman CL, Wu J, Bai
X, Briggs JM (2008) Global change and the ecology of
cities. Science 319(5864):756–760
Haberl H, Fischer-Kowalski M, Krausmann F, Weisz H, Wini-
warter V (2004) Progress towards sustainability? What the
conceptual framework of material and energy flow ac-
counting (MEFA) can offer. Land Use Policy 21:199–213
Hak T, Moldan B, Dahl AL (eds) (2007) Sustainability Indica-
tors: a scientific assessment. Island Press, Washington, D.C
Hamilton K, Clemens M (1999) Genuine savings rates in de-
veloping countries. World Bank Econ Rev 13(2):333–356
Hamilton A, Mitchell G, Yli-Karjanmaa S (2002) The
BEQUEST toolkit: a decision support system for urban
sustainability. Buil Res Inform 30(2):109–115
Holland A (1997) Substitutability: or, why strong sustainability
is weak and absurdly strong sustainability is not absurd. In:
Foster J (ed) Valuing nature? Ethics, economics and the
environment. Routledge, London, pp 119–134
Hsu A, Emerson J, Levy M, Sherbinin Ad, Johnson L, Malik O,
Schwartz J, Jaiteh M (2014) The 2014 Environmental Per-
formance Index. Yale Center for Environmental Law &
Policy,NewHaven.Available fromhttp://www.epi.yale.edu
Huang S-L, Chen L-L (2002) Urban indicators as measurement
of Taiwan’s sustainability. In: Douglas I, Huang S-L (eds)
Urbanization, East Asia and habitat II. Chung-Hua Insti-
tution of Economic Research, Taipei, pp 237–254
Huang SL, Hsu WL (2003) Materials flow analysis and emergy
evaluation of Taipei’s urban construction. Landsc Urban
Plan 63(2):61–74
Huang SL,Wong JH, Chen TC (1998) A framework of indicator
system for measuring Taipei’s urban sustainability. Landsc
Urban Planning 42(1):15–27
Iverson L, Echeverria C, Nahuelhual L, Luque S (2014)
Ecosystem services in changing landscapes: an introduc-
tion. Landscape Ecol 29(2):181–186
Jollands N (2006) How to aggregate sustainable development
indicators: a proposed framework and its application. In-
tern J Agricul Resour Govern Ecol 5:18–34
JonesKB,ZurliniG,KienastF, Petrosillo I, EdwardsT,WadeT,Li
B-l, Zaccarelli N (2013) Informing landscape planning and
design for sustaining ecosystem services from existing spatial
patterns and knowledge. Landscape Ecol 28(6):1175–1192
Kates RW, Clark WC, Corell R, Hall JM, Jaeger CC, Lowe I,
McCarthy JJ, Schellnhuber HJ, Bolin B, Dickson NM,
Faucheux S, Gallopin GC, Grubler A, Huntley B, Jager J,
Jodha NS, Kasperson RE, Mabogunje A, Matson P,
Mooney H, Moore III B, O’Riordan T, Svedin U (2001)
Sustainability Science. Science 292:641–642
Kennedy C, Pincetl S, Bunje P (2011) The study of urban
metabolism and its applications to urban planning and
design. Environ Pollut 159(8–9):1965–1973
Landscape Ecol (2015) 30:1175–1193 1191
123
Kennedy C, Stewart ID, Ibrahim N, Facchini A, Mele R (2014)
Developing a multi-layered indicator set for urban meta-
bolism studies in megacities. Ecol Ind 47:7–15
Krajnc D, Glavi P (2005) A model for integrated assessment of
sustainable development. Resour Conserv Recycl
43(2):189–208
Kubiszewski I, Costanza R, Franco C, Lawn P, Talberth J,
Jackson T, Aylmer C (2013) Beyond GDP: measuring and
achieving global genuine progress. Ecol Econ 93:57–68
Lawn PA (2003) A theoretical foundation to support the Index
of Sustainable Economic Welfare (ISEW), Genuine Pro-
gress Indicator (GPI), and other related indexes. Ecol Econ
44:105–118
Lee Y-J, Huang C-M (2007) Sustainability index for Taipei.
Environ Impact Assess Rev 27(6):505–521
Leigh A, Wolfers J (2006) Happiness and the human develop-
ment index: Australia is not a paradox. Aust Econ Rev
39(2):176–184
Li C, Li J, Wu J (2013) Quantifying the speed, growth modes,
and landscape pattern changes of urbanization: a hierar-
chical patch dynamics approach. Landscape Ecol
28:1875–1888
Liu ZF, He CY, Zhou YY, Wu JG (2014) How much of the
world’s land has been urbanized, really? A hierarchical
framework for avoiding confusion. Landscape Ecol
29:763–771
Luck M, Jenerette GD, Wu J, Grimm NB (2001) The urban
funnel model and the spatially heterogeneous ecological
footprint. Ecosystems 4:782–796
Meadows D (ed) (1998) Indicators and information systems for
sustainable development. Sustainability Institute, Hartland
Four Corners
Mega V (2013) Insights from the future: trends, risks, and op-
portunities. Springer, New York
Mega V, Pedersen J (1998) Urban Sustainability Indicators.
European Foundation for the Improvement of Living and
Working Conditions, Dublin
Moffatt I (2000) Ecological footprints and sustainable devel-
opment. Ecol Econ 32:359–362
Moldan B, Billharz S (eds) (1997) Sustainability indicators:
report of the project on indicators of sustainable develop-
ment. Wiley, New York
Moldan B, Janouskova S, Hak T (2012) How to understand and
measure environmental sustainability: Indicators and tar-
gets. Ecol Ind 17:4–13
Morse S, McNamara N, Acholo M, Okwoli B (2001) Sustain-
ability indicators: the problem of integration. Sustain Dev
9:1–15
Morse S, Vogiatzakis I, Griffiths G (2011) Space and sustain-
ability: potential for landscape as a spatial unit for assess-
ing sustainability. Sustain Dev 19:30–48
Munier N (2007) Handbook on urban sustainability. Springer,
Dordrecht
Nardo M, Saisana M, Saltelli A, Tarantola S (2005) Tools for
composite indicators building. European Commission,
EUR 21682 EN, Institute for the Protection and Security of
the Citizen, Ispra
Nassauer JI, Wu JG, Xiang WN (2014) Actionable urban
ecology in China and the world: integrating ecology and
planning for sustainable cities. Landsc Urban Plan
125:207–208
New Economics Foundation (2009) THE HAPPY PLANET
INDEX 2.0
NRC (1999) Our common journey: a transition toward sus-
tainability. National Academy Press, Washington D.C
NRC (2004) Materials count: the case for material flows ana-
lysis. National Academies Press, Washington D.C
OECD (1993) OECD Core set of indicators for environmental
performance reviews. Organization for Economic Co-op-
eration and Development, Paris
Olewiler N (2006) Environmental sustainability for urban areas:
the role of natural capital indicators. Cities 23(3):184–195
Pearce DW, Atkinson GD (1993) Capital theory and the mea-
surement of sustainable development: an indicator of
‘‘weak’’ sustainability. Ecol Econ 8:103–108
Pickett STA, Cadenasso ML, Grove JM, Boone CG, Groffman
PM, Irwin E, Kaushal SS, Marshall V, McGrath BP, Nilon
CH, Pouyat RV, Szlavecz K, Troy A, Warren P (2011)
Urban ecological systems: scientific foundations and a
decade of progress. J Environ Manag 92(3):331–362
Pillarisetti JR (2005) The World Bank’s ‘genuine savings’
measure and sustainability. Ecol Econ 55(4):599–609
Pincetl S, Bunje P, Holmes T (2012) An expanded urban
metabolism method: toward a systems approach for
assessing urban energy processes and causes. Landsc Ur-
ban Plan 107(3):193–202
Posner SM, Costanza R (2011) A summary of ISEW and GPI
studies at multiple scales and new estimates for Baltimore
City, Baltimore County, and the State of Maryland. Ecol
Econ 70(11):1972–1980
Potschin M, Haines-Young R (2013) Landscapes, sustainability
and the place-based analysis of ecosystem services.
Landscape Ecol 28(6):1053–1065
Powers CM, Dana G, Gillespie P, Gwinn MR, Hendren CO,
Long TC, Wang A, Davids JM (2012) Comprehensive
environmental assessment: a meta-assessment approach.
Environ Sci Technol 46:9202–9208
Prescott-Allen R (1997) Barometer of sustainability. In: Moldan
B, Billharz S, Matravers R (eds) Sustainability indicators: a
report on the project on indicators of sustainable develop-
ment. Wiley, Chichester, pp 133–137
Prescott-Allen R (2001) The wellbeing of nations: a country-by-
country index of quality of life and the environment. Island
Press, Washington, Covelo, London
Raudsepp-Hearne C, Peterson GD, Tengo M, Bennett EM,
Holland T, Benessaiah K, MacDonald GK, Pfeifer L
(2010) Untangling the environmentalalist’s paradox: why
is human well-being increasing as ecosystem services de-
grade? Bioscience 60:576–589
Rees WE (1996) Revisiting carrying capacity: area-based indi-
cators of sustainability. Popul Environ: J Interdiscip Stud
17(3):195–215
Rees WE (2000) Eco-footprint analysis: merits and brickbats.
Ecol Econ 32(3):371–374
Rees W, Wackernagel M (1996) Urban ecological footprints:
Why cities cannot be sustainable and why they are a key to
sustainability. Environ Impact Assess Rev 16:223–248
Rogers P, Srinivasan S (2007) Comparing sustainable cities:
examples from China, India and the USA. In: Keiner M
(ed) Sustainable development in China: Wishful thinking
or reality? Monsenstein and Vannerdat, Munich,
pp 85–110
1192 Landscape Ecol (2015) 30:1175–1193
123
Shen L-Y, Jorge Ochoa J, Shah MN, Zhang X (2011) The ap-
plication of urban sustainability indicators—a comparison
between various practices. Habitat Intern 35(1):17–29
Stanners D, Bourdeau P (1995) Europe’s environment: the
DobriS assessment. Eur Environ Agency, Copenhagen
Talberth J, Cobb C, Slattery N (eds) (2006) The Genuine Pro-
gress Indicator 2006: a tool for sustainable development.
Redefining progress, The nature of economics. http://www.
rprogress.org
Tanguay GA, Rajaonson J, Lefebvre J-Fo, Lanoie P (2010)
Measuring the sustainability of cities: an analysis of the use
of local indicators. Ecol Indic 10(2):407–418
Turner II BL, Lambin EF, Reenberg A (2007) The emergence of
land change science for global environmental change and
sustainability. Proceedings of the National Academy of
Sciences, vol 104, pp. 20666–20671
Turner BL II, Janetos AC, Verburg PH, Murray AT (2013) Land
system architecture: using land systems to adapt and
mitigate global environmental change. Glob Environ
Change 23(2):395–397
UN-Habitat (2002) Global Urban Indicators Database Version
2. United Nations Human Settlements Programme
UN-Habitat (2012) State of the World’s Cities 2012/2013:
Prosperity of Cities. United Nations Human Settlements
Programme
United Nations (2007) Indicators of sustainable development:
guidelines and methodologies, 3rd edn. United Nations,
New York
United Nations Centre for Human Settlements (Habitat) (1997)
Regional development planning and management of ur-
banization: experiences from developing countries. United
Nations Centre for Human Settlements, Nairobi
United Nations Human Settlements Programme (UN-Habitat)
(1996) The habitat agenda goals and principles, commit-
ments and the global plan of action. http://www.un-
documents.net/ha-1.htm
Van de Kerk G,Manuel AR (2008) A comprehensive index for a
sustainable society: the SSI—the Sustainable Society In-
dex. Ecol Econ 66(2–3):228–242
van den Bergh JCJM, Grazi F (2010) On the policy relevance of
ecological footprints. Environ Sci Technol 44:4843–4844
van den Bergh JCJM, Verbruggen H (1999) Spatial sustain-
ability, trade and indicators: an evaluation of the ‘eco-
logical footprint’. Ecol Econ 29:61–72
Venetoulis J, Cobb C (2004) The Genuine Progress Indicator
1950–2002 (2004 Update). San Francisco
Verburg PH, Erb K-H, Mertz O, Espindola G (2013) Land
System Science: between global challenges and local re-
alities. Curr Opin Environ Sustain 5(5):433–437
Wackernagel M, Rees WE (1996) Our ecological footprint:
reducing human impact on the earth. New Society Pub-
lishers, British Columbia
Wackernagel M, Schulz NB, Deumling D, Linares AC, Jenkins
M, Kapos V, Monfreda C, Loh J, Myers N, Norgaard R,
Randers J (2002) Tracking the ecological overshoot of the
human economy. Proceedings of the National Academy of
Sciences (USA) 99:9266–9271
WCED (1987) Our common future. Oxford University Press,
New York
Wen ZG, Zhang KM, Huang L, Du B, Chen WQ, Li W (2005)
Genuine saving rate: an integrated indicator to measure
urban sustainable development towards an ecocity. Int J
Sustain Dev World Ecol 12(2):184–196
Wen Z, Zhang K, Du B, Li Y, LiW (2007) Case study on the use
of genuine progress indicator to measure urban economic
welfare in China. Ecol Econ 63:463–475
Wieldmann T, Barrett J (2010) A review of the ecological
footprint indicator—perceptions and methods. Sustain-
ability 2:1645–1693
Wolman A (1965) The metabolism of cities. Sci Am
213(3):179–190
World Bank (1997) Expanding the measure of wealth: indica-
tors of environmentally sustainable development. The
World Bank, Washington, D.C.
Worldwatch Institute (2007) State of the world: our urban fu-
ture. W.W. Norton & Company, New York, London
Wu JG (1999) Hierarchy and scaling: extrapolating information
along a scaling ladder. Can J Remote Sens 25(4):367–380
Wu JG (2010) Urban sustainability: an inevitable goal of land-
scape research. Landscape Ecol 25(1):1–4
Wu JG (2013) Landscape sustainability science: ecosystem
services and human well-being in changing landscapes.
Landscape Ecol 28(6):999–1023
Wu JG (2014) Urban ecology and sustainability: The state-of-
the-science and future directions. Landsc Urban Plan
125:209–221
Wu JG, Wu T (2010) Green GDP. In: Christensen K, Fogel D,
Wagner G, Whitehouse P (eds) Berkshire encyclopedia of
sustainability, vol II., The business of sustainabilityBerk-
shire Publishing, Great Barrington, pp 248–250
Wu JG, Wu T (2012) Sustainability indicators and indices: an
overview. In: Madu CN, Kuei C (eds) Handbook of Sus-
tainable Management. Imperial College Press, London,
pp 65–86
Wu JG, Xiang W-N, Zhao JZ (2014) Urban ecology in China:
Historical developments and future directions. Landsc
Urban Plan 125:222–233
Zhang K, Wen Z, Du B, Song G (2008) A multiple-indicators
approach to monitoring urban sustainable development. In:
Carreiro MM, Song YC, Wu JG (eds) Ecology, planning
and management of urban forests: international perspec-
tives. Springer, New York, pp 35–52
Zhao JZ (2011) Towards sustainable cities in China: analysis
and assessment of some Chinese Cities in 2008. Springer,
New York
Zhao CR, Zhou B, Su X (2014) Evaluation of urban eco-secu-
rity—a case study of Mianyang City, China. Sustainability
6(4):2281–2299
Landscape Ecol (2015) 30:1175–1193 1193
123