Embed Size (px)
Citation preview
Defining antigen-specific plasmablast and memoryB cell subsets in human blood after viral infectionor vaccinationAli Ellebedy, Emory UniversityKatherine J.L. Jackson, Stanford UniversityHaydn Kissick, Emory UniversityHelder I. Nakaya, Emory UniversityCarl W. Davis, Emory UniversityKrishna M. Roskin, Stanford UniversityAnita K. McElroy, Emory UniversityChristine M. Oshansky, St Jude Childrens Research HospitalRivka Elbein, Emory UniversityShine Thomas, Emory University
Only first 10 authors above; see publication for full author list.
Journal Title: Nature ImmunologyVolume: Volume 17, Number 10Publisher: Nature Publishing Group | 2016-10-01, Pages 1226-1234Type of Work: Article | Post-print: After Peer ReviewPublisher DOI: 10.1038/ni.3533Permanent URL: https://pid.emory.edu/ark:/25593/rwtcj
Final published version: http://dx.doi.org/10.1038/ni.3533
Copyright information:© 2016 Nature America, Inc. All rights reserved.
Accessed December 18, 2021 1:31 AM EST
Defining antigen-specific plasmablast and memory B cell subsets in blood following viral infection and vaccination of humans
Ali H. Ellebedy1,2,11, Katherine J.L. Jackson9,11, Haydn T. Kissick2,6, Helder I. Nakaya5,10, Carl W. Davis1,2, Krishna M. Roskin9, Anita K. McElroy3,7, Christine M. Oshansky8, Rivka Elbein4, Shine Thomas4, George M. Lyon4, Christina F. Spiropoulou7, Aneesh K. Mehta4, Paul G. Thomas8, Scott D. Boyd9,11, and Rafi Ahmed1,2,11
1Emory Vaccine Center, School of Medicine, Emory University, Atlanta, GA 30322
2Department of Microbiology and Immunology, School of Medicine, Emory University, Atlanta, GA 30322
3Department of Pediatrics, School of Medicine, Emory University, Atlanta, GA 30322
4Division of Infectious Diseases, School of Medicine, Emory University, Atlanta, GA 30322
5Department of Pathology, School of Medicine, Emory University, Atlanta, GA 30322
6Department of Urology, School of Medicine, Emory University, Atlanta, GA 30322
7Viral Special Pathogens Branch, US Centers for Disease Control and Prevention, Atlanta, GA, 30333
8Department of Immunology, St. Jude Children’s Research Hospital, Memphis, TN, 38105
9Department of Pathology, Stanford University, Stanford, CA 94305
10Department of Clinical and Toxicological Analyses, School of Pharmaceutical Sciences, University of Sao Paulo, Sao Paulo 05508-000, Brazil
Abstract
Antigen-specific B cells bifurcate into antibody secreting cells (ASC) and memory B cells after
infection or vaccination. ASCs or plasmablasts have been extensively studied in humans but less is
known about B cells that get activated but do not differentiate into early plasmablasts. Here, we
Users may view, print, copy, and download text and data-mine the content in such documents, for the purposes of academic research, subject always to the full Conditions of use: http://www.nature.com/authors/editorial_policies/license.html#terms
Corresponding authors: Scott D. Boyd ([email protected]), Rafi Ahmed ([email protected]).11These authors contributed equally.
Accession codes. GEO: Microarray data, GSE68245. SRA: BCR deep sequencing data, SRP075992.
AUTHOR CONTRIBUTIONSA.E., K.J.L.J., S.D.B. and R.A. designed the study, interpreted data and wrote the paper. A.E. performed most of the experiments. K.J.L.J. performed NGS sequencing of IGH repertoire and devised, undertook and interpreted repertoire data analysis. K. M. R. processed repertoire sequence data. H.K. and H.N. analyzed the microarray data. C.W.D. and A.K.M. helped in data analysis and interpretation. C.O., R.E., S.T., G.L., C.S., A.M., and P.T. helped in collecting and processing the clinical samples.
COMPETING FINANCIAL INTERESTSThe authors declare no competing financial interests.
HHS Public AccessAuthor manuscriptNat Immunol. Author manuscript; available in PMC 2017 February 15.
Published in final edited form as:Nat Immunol. 2016 October ; 17(10): 1226–1234. doi:10.1038/ni.3533.
Author M
anuscriptA
uthor Manuscript
Author M
anuscriptA
uthor Manuscript
define the phenotype and transcriptional program of an antigen-specific B cell subset, referred to
as activated B cells (ABC), that is distinct from ASCs and is committed to the memory B cell
lineage. ABCs were detected in humans after infection with Ebola virus or influenza virus and
also after vaccination. By simultaneously analyzing antigen-specific ASCs and ABCs in human
blood after influenza vaccination we interrogated the clonal overlap and extent of somatic
hypermutation (SHM) in the ASC (effector) and ABC (memory) lineages. Longitudinal tracking
of vaccination-induced HA-specific clones revealed minimal increase in SHM over time
suggesting that repeated annual immunization may have limitations in enhancing the quality of
influenza-specific antibody.
INTRODUCTION
Antigen-specific B cells proliferate and differentiate into antibody secreting cells (ASCs) or
maintain the B cell program and become memory cells after infection or vaccination1,2. The
fate of responding B cells is tightly controlled by the expression levels of a network of
transcription factors; Blimp-1, IRF4 and XBP-1 drive the differentiation of B cells into
ASCs and induce the expression of the molecular machinery required for antibody secretion,
whereas Pax5, IRF8 and Bcl-6 are among a set of transcription factors that help B cells
maintain their identity3.
We previously demonstrated that a transient burst of antigen-specific ASCs could be
detected in peripheral blood shortly after influenza vaccination and after influenza and
dengue viral infections in humans4–6. Defining the phenotype of the ASC subset paved the
way for our group and others to interrogate the repertoire of B cell responses in humans.
ASCs have also been used to rapidly generate human monoclonal antibodies (mAbs) that
can be utilized as therapeutics and for diagnostics6–8. In the past few years, the dynamics,
magnitude, and specificity of the ASC response in peripheral blood after a variety of
vaccinations and infections in humans have been extensively studied9.
Apart from ASCs, antigen-specific human memory B cells (MBCs) can also be detected in
peripheral blood6,10,11. These memory cells are usually identified either indirectly by
culturing peripheral blood mononuclear cells (PBMCs) under various conditions to drive
their differentiation into ASCs, or by using fluorescently labeled antigens. In this study, we
define a subset of antigen-specific B cells that is phenotypically, transcriptionally and
functionally distinct from ASCs, that we refer to as activated B cells (ABCs). We
demonstrate that ABCs could be detected in peripheral blood after influenza virus and Ebola
virus infections and after influenza immunization in humans. Sequencing of antibody heavy
chain (IGH) rearrangements showed that clones present among hemagglutinin (HA)-specific
ABCs isolated at days 7 or 14 post-influenza immunization were detected in the MBC
compartment three months after vaccination, at higher frequency than in pre-vaccination
samples. The magnitude and duration of the ABC response compared to the ASC response
was substantially larger when considered over the course of the infection or vaccination,
indicating that ABCs may be a particularly useful population for capturing the
comprehensive repertoire of vaccine-induced antigen-specific B cell responses.
Ellebedy et al. Page 2
Nat Immunol. Author manuscript; available in PMC 2017 February 15.
Author M
anuscriptA
uthor Manuscript
Author M
anuscriptA
uthor Manuscript
RESULTS
Defining B cell subsets after influenza immunization
We previously demonstrated that antigen-specific ASCs peak in peripheral blood around day
seven post-influenza immunization in humans6. We wanted to examine whether any other
subset of antigen-specific B cells distinct from ASCs could be detected in the blood after
vaccination. We hypothesized that, similar to ASCs, all recently antigen-engaged B cells
would be actively proliferating. We used CD71 as a surface marker to label proliferating
peripheral blood B cells after immunization with the inactivated seasonal trivalent influenza
vaccine (TIV). From the isotype-switched, proliferating B cells, defined as
CD3−CD14−CD16−CD19+IgD−CD71hi cells isolated 7 days after vaccination, we identified
two subsets: CD38hiCD20− and CD38int-loCD20hi cells (Fig. 1a). Markers of the former
population are typical of those of ASCs, while we referred to the other population as
activated B cells or ABCs. Both populations were positive for Ki67, confirming that cells
were dividing (Fig. 1b).
We confirmed the identity and specificity of the ASC subset by direct ex vivo ELISPOT
(Fig. 1c and Supplementary Fig. 1a). The majority (~82%) of IgG+ ASCs were antigen-
specific. ABCs, however, did not spontaneously secrete antibodies under the same
conditions (Fig. 1c). ABCs differentiated into IgG-secreting cells when cultured in the
presence of autologous CD19− cells as feeders (Fig. 1d and Supplementary Fig. 1b).
Approximately 45% of the IgG+ ABCs were specific to influenza vaccine (Fig. 1d).
Similar to ASCs, ABCs were larger in size compared to naïve B cells (Fig. 1e). In contrast to
ASCs, ABCs did not downregulate CD19 relative to naïve B cells (Fig. 1e). ABCs showed
higher expression of CD27 and lower expression of CD21 relative to naïve B cells
(IgD+CD27−) (Fig. 1e).
Down-regulation of the B cell transcription factor Pax5 is one of the earliest events of ASC
differentiation12–14. Pax5 expression measured by intracellular staining and flow cytometry
was significantly lower in ASCs in comparison to naïve B cells and ABCs (Fig. 1f). In
contrast, IRF4 expression was highest in ASCs compared to naïve B cells and ABCs (Fig.
1g). IRF8 is a transcription factor that antagonizes plasma cell differentiation15. Similar to
Pax5, IRF8 expression was significantly lower in ASCs in comparison to naïve B cells and
ABCs (Fig. 1h). These data demonstrate that following influenza immunization in humans,
two functionally and phenotypically distinct antigen-specific B cell subsets can be detected
in peripheral blood.
Detecting ABCs after influenza and Ebola virus infections
After characterizing ABCs following influenza vaccination, we sought to define this
population after influenza infection. We examined cryopreserved PBMCs from two patients
with confirmed 2009 pandemic H1N1 influenza virus infection16. Blood was first collected
at the day of enrollment (Day 0) and at several time points thereafter (on or about days 4, 7,
11, and 27 after enrollment). At days 3 and 11 after enrollment, ASCs (CD20−CD71+) and
ABCs (CD20hiCD71+) could be distinguished among isotype-switched B cells (Fig. 2a).
Ellebedy et al. Page 3
Nat Immunol. Author manuscript; available in PMC 2017 February 15.
Author M
anuscriptA
uthor Manuscript
Author M
anuscriptA
uthor Manuscript
B cell responses to influenza in adults are dominated by recall responses6,17. We wanted to
test whether we could detect ABCs and ASCs in blood in the course of a primary immune
response in humans. We had the unique opportunity to examine the immune responses in
four patients (EVD02, EVD05, EVD09 and EVD15) infected with the Ebola virus18,19. The
four patients were cared for in the Serious Communicable Diseases Unit at Emory
University Hospital18,19. Among CD19+ cells, we were able to clearly distinguish both
ASCs (CD20−CD71hi) and ABCs (CD20hiCD71+) during the early phase of the infection
(Fig. 2b). A massive B cell response was observed in all patients approximately two to three
weeks after onset of symptoms, with ABCs and ASCs comprising almost half of peripheral
blood B cells in three out of the four patients (Fig. 2b). The percentages of ABCs and ASCs
(of CD19+ cells) were 14.8 and 29.3 in EVD02, 31.4 and 33.3 in EVD05, 14.4 and 36.8 in
EVD09, and 16.2 and 4.14 in EVD15, respectively (Fig. 2b). As the infection progressed,
the percentage of B cells with the ABC phenotype increased while those with the ASC
phenotype decreased (Fig. 2c). These data clearly demonstrate that ABCs could be detected
in peripheral blood shortly after viral infection in humans, including after primary
infections. It also shows that ABCs can originate from memory B cells (influenza) or naïve
B cells (Ebola).
ABCs are transcriptionally distinct from ASCs and MBCs
To define the transcriptional program of ABCs, we analyzed the gene expression profile of
ABCs and compared it with those of ASCs, naïve B cells and resting MBCs. We isolated
these B cell populations by flow cytometry from four individuals seven days after
immunization with the 2013/14 TIV (Supplementary Fig. 2). Unsupervised hierarchical
clustering showed that both proliferating B cell subsets (ABCs and ASCs) grouped
differently from the resting ones (Naïve and MBCs) (Fig. 3a). Importantly, the four ABC
samples formed a distinct cluster, indicating that the differences in gene expression between
ABCs and all other B cell subsets were sufficiently robust to be reproducible in the four
individuals (Fig. 3a).
Expression analysis revealed 192 genes that were differentially upregulated in the ABC
subset (Fig. 3b, Supplementary Table 1). A substantial number of these genes encode
proteins that are involved in antigen presentation (for example, HLA-DRA, HLA-DMA,
HLA-DPA1, NCF2, CD1C and CTSH), and in B cell antigen receptor (BCR) signaling
(CD19, RFTN1, CSK and PRKCB). To validate the array results we examined the
expression of some of these differentially expressed genes at the protein level (Fig. 3c).
Consistent with the array results, surface protein expression of CD20, TLR10 and CD52 was
highest on ABCs (Fig. 3c). Conversely, there were 760 genes differentially upregulated in
ASCs (Fig. 3b). These genes included PRDM1, IRF4 and XBP1, which encode the key
transcription factors that control ASC generation, maintenance, and antibody secretion.
Genes encoding proteins involved in extracellular protein synthesis and secretion (TRAM1,
SEC61B and KDELR1) were also substantially upregulated in ASCs (Fig. 3b).
To better understand the interactions between these differentially expressed genes and to put
them into biological context, we performed gene set enrichment analysis (GSEA) on pre-
ranked gene lists using previously described Blood Transcription Modules (BTMs) as gene
Ellebedy et al. Page 4
Nat Immunol. Author manuscript; available in PMC 2017 February 15.
Author M
anuscriptA
uthor Manuscript
Author M
anuscriptA
uthor Manuscript
sets20,21. This analysis confirmed that the differentially expressed genes in ABCs were
mostly associated with antigen processing and presentation and BCR signaling (Fig. 3d,e).
Differentially expressed genes in ASCs were associated with a plasma cell signature and the
molecular machinery essential for antibody secretion (Fig. 3d). We next examined the genes
that were differentially expressed between ABC and resting MBC subsets. We found that
those genes were mainly associated with cell cycle regulation, antigen presentation, BCR
signaling and MAP kinase signaling (Fig. 3f). These data clearly demonstrate that ABCs
represent a transcriptionally distinct subset from ASCs and resting MBCs.
Dynamics of influenza HA-specific B cell responses
To further examine the specificity and dynamics of ABCs after influenza vaccination, we
used the HA protein of influenza virus to label antigen-specific cells after seasonal influenza
vaccination. The HA used was derived from the 2009 pandemic H1N1 virus (A/California/
7/2009), which has been included as a component in all human seasonal influenza vaccines
formulations since the 2009/10 season. Two populations of HA-binding cells were clearly
identified among isotype-switched B cells seven days after vaccination: HA-positive CD20−
cells (or HA-positive ASCs) and HA-positive CD20hi (or HA-positive ABCs) (Fig. 4a–e).
Lower HA binding intensity observed on HA-positive ASCs in comparison to HA-positive
ABCs is probably a result of the lower density of surface BCR expression on ASCs
compared to ABCs (Fig. 4a). HA-positive ABCs were Pax5hi and IRF4lo while HA-positive
ASCs were Pax5lo and IRF4hi (Fig. 4b).
The identity and specificity of HA-positive ASCs was confirmed by ex vivo ELISPOT
where more than 90% of the IgG-secreting cells were specific to the H1 HA (Supplementary
Fig. 3a). In contrast, no IgG-secreting cells were detected with sorted HA-positive ABCs
confirming that they are not differentiated into ASCs (Supplementary Fig. 3a). However,
after culturing HA-positive ABCs, we found that 62% of these cells secreted HA-binding
antibodies (Supplementary Fig. 3b).
At day 14, HA-positive ASCs were no longer detectable in blood. In contrast, the frequency
of HA-positive CD20hi isotype-switched B cells was highest at this time point (Fig. 4c).
Both HA-positive ASCs and HA-positive ABCs detected at day 7 showed high expression of
the proliferation marker CD71 (Fig. 4d). CD71 and CD20 expression remained relatively
high on HA-positive ABCs at days 14 & 30 in comparison to naïve B cells (Fig. 4d). Three
months after vaccination, CD71 expression on HA-positive memory B cells was
indistinguishable from that on naïve B cells (Fig. 4d). We next examined the dynamics of
HA-positive ABCs and HA-positive ASCs following influenza infection. Four days after
enrollment, HA-positive ASCs (CD20−) and HA-positive ABCs (CD20hi) could be
identified among isotype-switched B cells (Fig. 4e). These data demonstrate that HA-
positive ABCs and ASCs could be clearly distinguished in peripheral blood shortly after
influenza vaccination and infection in humans.
HA-specific clones span ABCs and ASCs
We next wanted to determine whether similar or distinct B cell clones constitute the ABC
and ASC compartments isolated after influenza vaccination. To address this question, we
Ellebedy et al. Page 5
Nat Immunol. Author manuscript; available in PMC 2017 February 15.
Author M
anuscriptA
uthor Manuscript
Author M
anuscriptA
uthor Manuscript
sequenced the immunoglobulin heavy chain (IGH) genes from HA-positive and HA-negative
ABCs at days 7 and 14, and from ASCs isolated at day 7 (peak of ASC response) from three
donors following immunization with the 2014/15 seasonal TIV (Supplementary Fig. 4).
Down-regulation of surface Ig expression in differentiating ASCs likely results in
underestimation of the number of antigen-specific cells. Approximately 90% of IgG-
secreting ASCs from day 7 are specific to TIV by ELISPOT (data not shown), therefore we
considered IgG lineages from the ASC pool to be representative of the vaccine-induced
clonal lineages in subsequent analyses. B cell clonal lineages were defined by IGH rearrangements that shared variable and joining gene segment usage (referred to hereafter as
IGHV and IGHJ), and encoding complementarity-determining region 3 (CDR3) of equal
length and similar CDR3 nucleotide sequence, clustering at a 90% identity threshold using
single linkage clustering.
An average of 33% (range: 20.1% – 41%) of the day 7 HA-positive ABC clonal lineages
were also present among day 7 IgG+ ASCs, while 20% (range: 10.4% – 26.7%) of the day
14 HA-positive ABC clonal lineages were detected in day 7 IgG+ ASC clonal lineages (Fig.
5a, top). H1 HA-positive ABCs represent only a fraction of the total response to all the
different antigens derived from the three influenza strains (H1N1, H3N2 and influenza B)
included in seasonal TIV preparations. Therefore, we also examined the clonal overlap
between total (HA-positive and HA-negative) ABCs and IgG+ ASCs. Among total ABC
clonal lineages, we found that 34.4% (range: 21.8% – 52.6%) of day 7 ABCs, and 24%
(range: 16% – 29.1%) of day 14 ABCs were present in the day 7 IgG+ ASCs (Fig. 5a,
bottom). These data show that many B cell clones have members in both of these two
distinct phenotypic subsets, but the majority of clones are found in one subset only.
We next determined the frequency of each of the clonal lineages within the ABC and ASC
pools. The clone frequencies within each pool were positively correlated, suggesting that the
extent of clonal expansion in each compartment was similar (Fig. 5b). The accumulation of
somatic hypermutations (SHMs) in the antibody IGH rearrangement provides information
about the cell division history within a clonal lineage. The average IGHV SHM frequency
within responding ASCs and ABCs was 7% and 6.5%, respectively (Fig. 5c). These ABC
and ASC SHM frequencies were similar to those observed among pre-existing memory B
cells, suggesting that MBCs are the likely precursors for both cell subsets. We then assessed
the SHM frequencies within the clonal lineages shared between the ABC and ASC pools,
and as shown in Fig. 5c the SHM frequencies were strikingly similar between the two
compartments. This match in SHM frequencies was observed regardless of the extent of
SHM frequency (Fig. 5c). Collectively, these data suggest that part of the vaccine-induced
ABC and ASC clonal lineages have originated from the same memory B cells and later
diverged into distinct fates.
HA-specific ABCs are clonally related to MBCs
To determine the fate of ABCs, we tracked ABC clonal lineages for three months following
TIV vaccination in two separate cohorts (Supplementary Fig. 5). In the first cohort we sorted
total ABCs and ASCs from three donors seven days after immunization with the 2013/14
TIV. We also sorted HA-positive ABCs from day 14 (peak of ABC expansion). To gather
Ellebedy et al. Page 6
Nat Immunol. Author manuscript; available in PMC 2017 February 15.
Author M
anuscriptA
uthor Manuscript
Author M
anuscriptA
uthor Manuscript
mutational data from additional B cell clone members, we analyzed the IGH repertoire
within total PBMCs from day 0 (before vaccination) and days 28 and 90 post-vaccination.
We tracked HA-positive clonal lineages (sorted at day 14) at various time points
(Supplementary Fig. 6). A relatively small percentage (average 1%, range: 0.34% – 2%) of
the HA-positive day 14 ABC lineages were detectable prior to vaccination. This percentage
increased at one-week post-vaccination; an average of 11.6% (range: 4.4% – 23.3%) of the
HA-positive day 14 ABC lineages were detectable among D7 ABC lineages (Supplementary
Fig. 6). 10% and 8.8% of day 14 HA-positive ABC clonal lineages persisted in peripheral
blood and were detectable at days 28 and 90 post-vaccination, respectively, suggesting that
these clones had now become part of the resting MBC population (Supplementary Fig. 6).
To further explore the kinetics and clonal relationship between ABC and resting MBCs in
humans after influenza vaccination, we analyzed the corresponding repertoires in three
additional donors during the 2014/15 influenza season. HA-positive ABCs were sorted from
days 7 and 14, as well as MBCs from day 0 and days 14, 28 and 90 after vaccination (Fig. 6a
and Supplementary Fig. 5b). HA-positive clonal lineages present in the ABC populations
were found to persist as resting memory B cells, with an average of 36.25% (range: 12 –
55.6%) of day 7 HA-positive ABC lineages and an average of 26.7% (range: 21.5 – 36.0%)
of day 14 HA-positive ABC lineages detected at day 90 after vaccination (Fig. 6a,b). We
examined the persistence of total ABC-derived lineages from day 7 and day 14, and found
that the percentages of total ABC lineages still detectable at day 90 post-vaccination were
similar to the percentages of HA-positive ABC lineages (Fig. 6a,b). Both ASC and ABC
lineages were detectable at a low percentage among pre-vaccination MBCs. An average of
11.7%, (range 4.6% – 19.2%) of IgG+ ASC lineages, and 8%, (range 2.1% – 12.1%) of day
14 ABC lineages were detected in the pre-vaccination memory pool (Fig. 6a, b).
Importantly, the ABC and ASC clonal lineages were largely distinct from resting MBCs
sorted at day 14 (Fig. 6b). The percentage of total ABC lineages that included day 14 resting
MBCs ranged from 0.3% (donors 4 and 8) – 3.2% (donor 6). The frequency of HA-positive
lineages in the day 14 resting MBC pool was very low, and ranged from 0.4% (donor 4) –
4.7% (donor 6) (Fig. 6b). The data, therefore, indicate that the ABC clones are enriched for
vaccine-induced lineages, and that few members of these clonal lineages remain in a non-
activated state in the blood at day 14 after vaccination. Taken together, our data clearly show
that ABC clonal lineages contribute to the resting MBC population.
Minimal impact on SHM frequency by seasonal TIV vaccination
We next wanted to investigate how the extent of SHM of HA-positive ABCs changes over
time after seasonal TIV vaccination. To address this question we longitudinally tracked HA-
positive ABC clonal lineages and then compared the SHM frequencies within the IGHV segments measured at various time points before and after vaccination. HA-positive ABCs
substantially expanded from day 0 to day 7, and reached their peak at day 14 after
vaccination (Fig. 7a). From the six donors we analyzed, we did not detect any substantial
differences in IGHV SHM frequencies measured prior to vaccination, early after vaccination
(days 7 and 14) and those measured at day 90 (Fig. 7b and Supplementary Fig. 7a). This
result was consistent with the SHM frequencies of individual HA-positive ABC clonal
Ellebedy et al. Page 7
Nat Immunol. Author manuscript; available in PMC 2017 February 15.
Author M
anuscriptA
uthor Manuscript
Author M
anuscriptA
uthor Manuscript
lineages from donors 4 and 6 (Fig. 7c, d), and from donors 157, 162, 163 and 8
(Supplementary Fig. 7b) measured at various time points before and after vaccination. The
initial SHM frequency within individual HA-positive ABC clonal lineages did not seem to
have an impact on whether the descendants of that particular lineage will gain more
mutation at later time points after vaccination. For example, all five HA-positive ABC clonal
lineages tracked from baseline to day 90 after vaccination in donor 4 did not substantially
gain any increase in SHM frequency despite the differences in their starting frequencies
(Fig. 7c). Longitudinal tracking of HA-specific ABC clones revealed minimal gain in SHM
following seasonal influenza immunization.
DISCUSSION
Memory B cells and long-lived plasma cells provide a remarkably stable humoral immune
memory that can last for a lifetime22,23. Appropriate induction of both cell populations is
therefore essential for optimal efficacy of prophylactic vaccines. Plasmablasts or ASCs in
peripheral blood following infection and vaccination of humans have recently been
extensively characterized9. In the current study we define an antigen-specific human
activated B cell subset (referred to as ABCs) that is phenotypically, transcriptionally and
functionally distinct from ASCs. ABCs could be detected within seven days of influenza
vaccination in adults, and shortly following influenza and Ebola viral infections. High-
throughput sequencing of the ABC immunoglobulin gene repertoire allowed us to track
ABC clonal lineages, revealing that these lineages persisted in peripheral blood up to 90
days after vaccination (the latest time point measured in these experiments), suggesting that
ABCs contribute to the memory B cell pool. Similar to ASCs, ABCs could be used for
unbiased interrogation of the antigen-specific B cell repertoire following infection and
vaccination of humans, and also as a source for procuring therapeutic mAbs. These ABC-
derived mAbs may differ from those derived from ASCs in terms of quality and
specificity24.
20–30% of the ABC clonal lineages are shared with the ASC compartment, indicating that
while some clones adopt both phenotypes, it may be more common for individual clones to
be polarized to an ASC or ABC phenotype in a vaccine response. This percentage could be
an underestimate due to the limited number of individual B cell members of antigen-specific
clones that are captured in the volume of blood sampled for research studies. In our previous
influenza vaccination and infection studies4,6,17 we reported that antigen-specific IgG-
secreting cells that possessed high IGH SHM frequencies dominated the ASC response, and
attributed this result to the likely MBC origin of these ASCs. Here, we show that HA-
positive ABC lineages possessed SHM loads similar to both ASCs and to the pre-
vaccination MBC pool, suggesting that ABCs are also derived from MBCs. This notion was
confirmed by tracking of HA-positive lineage members from the pre-vaccination MBC
compartment into the post-vaccination ABC, ASC and MBC populations.
Memory B cells, by definition, are quiescent25. This is why we make the distinction between
the Ki67+ and CD71hi ABC subset and resting MBCs. This is consistent with our
observation that very few ABC clonal lineages were detectable in the resting MBC
compartment isolated at day 14 after vaccination. Conversely, starting from days 28 and 90
Ellebedy et al. Page 8
Nat Immunol. Author manuscript; available in PMC 2017 February 15.
Author M
anuscriptA
uthor Manuscript
Author M
anuscriptA
uthor Manuscript
after vaccination (after the immune reaction had subsided) we detected up to 60% of the
ABC clonal lineages in the resting MBC compartment. The delayed kinetics of ABCs are
consistent with previous reports demonstrating delayed peaking of antigen-specific MBCs in
comparison to ASCs following tetanus and influenza immunization6,26. This difference in
timing following infection or vaccination may reflect a preference for the immune system to
first rapidly generate ASCs whose antibodies directly engage the foreign antigens. ABCs
could have greater capacity to mutate their BCRs as indicated by the higher expression of
AID relative to ASCs (data not shown), however, we did not detect substantial mutational
load differences between these two subsets. Overall, our data supports a model where
antigenic stimulation drives naïve or resting memory B cells to undergo a rapid clonal
expansion. Some of of the expanded cells terminally differentiate into ASCs. The rest of the
progeny, ABCs, are released into the circulation more slowly. Over time ABCs down-
regulate the activation markers, and join the resting MBC pool.
Perhaps the most intriguing finding in the current study is that the majority of responding B
cell clones did not experience a substantial increase in SHM frequency over time following
TIV immunization. These data suggest that while the tens of millions of seasonal influenza
vaccine doses administered every year have the capability of boosting B cell responses
quantitatively, the impact on the quality of these responses is minimal. One possible
explanation is that the TIV-induced B cells could have originated from pre-existing MBCs
with already high affinity receptors. Our cohorts were all adults with probable existing
MBCs elicited by prior exposures to influenza antigens, such as the 2009 pandemic H1 HA,
included in the seasonal influenza vaccine used in the current study. So perhaps the lack of
novel epitopes being engaged by responding B cells has contributed to the minimal changes
observed in SHM frequencies. Alternatively, the vaccine antigen amount may have been too
limited to support a persistent germinal center reaction from which more highly mutated
clones could have emerged. Finally, it is important to note that the TIV vaccine used was
non-adjuvanted. It will be important to examine whether adjuvants could change the
dynamics of affinity maturation associated with seasonal influenza vaccination in humans.
Defining and studying ABCs along with ASCs in humans will reveal the intrinsic
differences between the cells constituting these two compartments, which in turn would
enhance our understanding of the longevity of vaccine-induced B cell responses.
Methods
Patients
All studies were approved by the Institutional Review Boards of Emory University, St. Jude
Children’s Research Hospital, the University of Tennessee Health Science Center/Le
Bonheur Children’s Hospital, and by the US Centers for Disease Control (CDC). Written
consent was obtained from all patients. All work with Ebola specimens was performed in the
CDC BSL-4 laboratory space. For the influenza vaccination studies, all subjects were
healthy adults 18–49 years of age. Peripheral blood mononuclear cells (PBMCs) were
isolated using Vacutainer tubes (BD) for immediate use or cryopreserved.
Ellebedy et al. Page 9
Nat Immunol. Author manuscript; available in PMC 2017 February 15.
Author M
anuscriptA
uthor Manuscript
Author M
anuscriptA
uthor Manuscript
Vaccines
Trivalent, inactivated seasonal influenza vaccines or TIV (2012/13, 2013/14 and 2014/15
seasons) were obtained from Sanofi Pasteur Inc.
Antigens
For ELISPOT, we either used the TIV vaccine (diluted 1:20) or recombinant H1 HA protein
derived from the pH1N1 (A/California/06/2009) influenza virus. HA was obtained from the
Biodefense and Emerging Infections (BEI) research repository. For HA staining, we used the
HA1 subunit from H1 HA of A/California/06/2009 (H1N1) that was expressed in 293 T
cells. HA molecules were biotinylated using the EZ-Link Micro NHS-PEG4-Biotinylation
kit (Thermo-Fisher). Excess biotin was removed using the Zeba Spin Desalting Columns
(Pierce).
Flow cytometry and cell sorting
Flow cytometry analysis was performed using either fresh or cryo-preserved PBMCs. For
the Ebola samples, whole blood was incubated with appropriate surface antibody mix for 30
min then 1x FACS/Lyse (BD) was added to each sample. After a 5-min incubation, the
sample was centrifuged to pellet cells and pellets were washed twice in PBS prior to data
collection. For influenza vaccination and infection samples, PBMCs were resuspended in
PBS supplemented with 2% FBS and 1mM EDTA. Cells were stained for 30 min at 4 °C for
surface markers. For analyzing the intracellular IRF4, IRF8 and Pax5 molecules, cells were
further fixed and permeabilized (eBioscience), and then incubated with antibodies for 1 h at
25°C. All reagents for flow cytometry staining are listed in Supplementary Table 2. Flow
cytometry data were analyzed using FlowJo software.
HA staining
293 cells-expressed HA1 subunit of the pH1N1 H1 HA was biotinylated (EZ-Link™ Sulfo-
NHS-Biotin, Life Technologies). PBMCs were incubated the biotinylated HA for 30 min at
4 °C prior to staining with APC-conjugated streptavidin.
ELISPOT and memory B cell assay
Direct ELISPOT to enumerate the number of either total IgG-secreting, vaccine-specific and
recombinant HA-specific plasmablasts present in the PBMC samples. Basically, dilutions of
washed PBMCs incubated in supplemented RPMI were incubated in ELISPOT plates for 18
h. After washing the plates, secreted antibodies were detected with anti-human IgG-biotin
(Jackson ImmunoResearch) and avidin-D-HRP (Vector Laboratories) and developed with
AEC substrate (Sigma) before analysis on an ELISPOT counter (Cellular Technologies
Ltd.). Differentiation of ABCs to ASCs was done by culturing cells with autologous 105
CD19− PBMCs R-10 supplemented with phosphothiolated CpG ODN-2006, CD40L (R&D)
and IL-21 (Peprotech). After culture for 6 d the cells were washed and quantified by
ELISPOT assay.
Ellebedy et al. Page 10
Nat Immunol. Author manuscript; available in PMC 2017 February 15.
Author M
anuscriptA
uthor Manuscript
Author M
anuscriptA
uthor Manuscript
Gene expression array
From four subjects, 104 cells of either naïve B cells, memory B cells (MBCs), ABCs, ASCs
were sorted seven days after influenza vaccination into RLT-Plus buffer (Qiagen). Total
RNA was isolated using the Rneasy micro kit from Qiagen. After RNA amplification
(Nugen), the genome-wide transcriptional profiles of both populations were assessed using
the HumanHT-12 v4 Expression Bead Chip (Illumina). Data were quantile normalized
before analysis.
Gene expression analysis
Hierarchical cluster analysis was performed using the top 15,000 probes with highest
variance across all samples (Euclidean distance and Ward’s criterion). To assess the
uncertainty in cluster analysis, we run Pvclust R package with 5,000 bootstrap resampling27.
To identify genes whose expression was specifically high in one B cell subset compared to
others, we performed a student’s t-test (P < 0.05 and mean fold-change > 1.5) between any
given two cell subsets28. Genes were classified as highly expressed in one subset if they
were up-regulated in this subset compared to at least 2 other subsets (out of 3 possible
comparisons). We performed gene set enrichment analysis (GSEA) on pre-ranked gene lists
using Blood Transcription Modules (BTMs) as gene sets. Expression of each gene across all
samples was normalized by z score transformation and the mean z score of each subset was
used to generate the pre-ranked gene lists. Probes representing the same gene symbol were
collapsed by taking the z score with highest absolute value. Nominal P-values and
normalized enrichment scores for the BTMs were generated running GSEA with 1,000
permutations. Cytoscape was used to display the gene network29.
Deep sequencing of IGH repertoires from influenza vaccine response
For the first cohort of vaccinees (2012–13 and 2013–14 seasons), RNA was purified with a
Qiagen Rneasy micro kit from: 1) PMBCs from pre-vaccination, days 28 and 90 post-
vaccination, 2) Flow sorted ASCs and ABCs isolated at day 7 post-vaccination, and 3) Flow
sorted H1-specific ABCs isolated at day 14 post-vaccination. For the second cohort of
vaccinees (2014–15 season) RNA was purified from: 1) PBMCs from pre-vaccination day 0,
and post-vaccination days 7, 14, 28 and 90, 2) Flow sorted H1-positive and H1-negative
ASCs and ABCs from day 7 post-vaccination, 3) Flow sorted HA-positive and HA-negative
ABCs from day 14 post-vaccination, 4) Flow sorted memory B cells isolated prior to
vaccination and at days 14, 28 (sorted for HA-positive and HA-negative) and 90 after
vaccination, and 5) Naïve B cells flow sorted prior to vaccination. cDNA was synthesized
with Superscript II enzyme (Life Technologies) and priming by random hexamers.
Templates were amplified by PCR using Biomed IGHV primers in the framework 1 (FR1)
region and isotype-specific primers for IgG, IgM and IgA located in the first exon of the
constant regions. These primers also encoded approximately half of the Illumina linker
sequences needed for cluster generation and sequencing on the Illumina MiSeq instrument.
Sample identity was encoded by 8-nucleotide multiplex identifier barcodes in each primer.
For Illumina cluster recognition, four randomized nucleotides were encoded in the primers
immediately after the Illumina linker sequence in the constant region primers. Each antibody
isotype for each sample was amplified in a separate PCR reaction, to prevent formation of
Ellebedy et al. Page 11
Nat Immunol. Author manuscript; available in PMC 2017 February 15.
Author M
anuscriptA
uthor Manuscript
Author M
anuscriptA
uthor Manuscript
cross-isotype chimeric PCR products. PCR was carried out with AmpliTaq Gold (Roche)
following the manufacturer’s instructions, and used a program of: 94°C 7 min, 35 cycles of
(94°C 30 sec, 58°C 45 sec, 72°C 120 sec), and final extension at 72°C for 10 min. A second
PCR step was used to add the remaining portion of the Illumina linkers to the amplicons,
and was carried out with the Qiagen Multiplex PCR kit (Qiagen) according to the
manufacturer’s instructions, using 0.4 microliter of the first PCR product as template in a
30-microliter reaction. The PCR program for the second PCR step was 94°C 15 min, 12
cycles of (94°C 30 sec, 60°C 45 sec, 72°C 90 sec), and final extension at 72°C for 10 min.
The products of each PCR reaction were quantitated, pooled in equimolar amounts,
electrophoresed on agarose gels, and gel extracted with QIAquick kits (Qiagen). High-
throughput sequencing was performed on an Illumina MiSeq instrument using 600-cycle
sequencing kits.
Analysis of vaccine response lGH clonal lineages
Paired-end reads from Illumina sequencing were merged using FLASH30 and samples were
de-multiplexed according to the primer-encoded barcodes. Only exact, full-length matches
to barcodes were permitted. Reads were aligned using a local installation of IgBLAST31 to
determine features such as germline IGHV, IGHD and IGHJ gene usage, to define
framework and complementarity determining regions and to identify mutation positions.
Non-productive sequences that encoded either stop codons or had out-of-frame IGHJ were
discarded from analysis, along with those that encoded CDR3 segments shorter than five
residues (as these could not be reliably assigned to lineages). Antibody isotype subclasses
were identified by exact matching to the CH1 sequence upstream of the primer used for
amplification. For each donor, the clonal lineages were inferred from IGH rearrangements
across the available samples by single linkage clustering of the CDR3 nucleotide sequences
with a 90% identity threshold for IGH sequences that shared IGHV and IGHJ gene
assignment (ignoring IGHV or IGHJ allele) and CDR3 length. HA-binding lineages were
defined as clonal lineages for which a member in any phenotypic B cell subset was shown to
bind HA in flow cytometry experiments; for lineages that had members detected in both
HA-positive and HA-negative populations from flow sorting, we considered the lineage to
be HA-binding if at least 10 reads were detected in the HA-positive samples, and at least
10% of total reads from the lineage in sorted cells were found in the HA-positive
populations. IgG-expressing ASC lineages were defined as those containing members
expressing IgG subtypes IgG1, IgG2 or IgG3. IGHV mutation percentages were calculated
for the region spanning FR1 through the end of FR3. In summarizing IGHV mutation
frequencies in B cell subsets, the mean mutation frequency was calculated for each B cell
clone, then the median of these means over all clones was determined. The distribution of
clonal lineage members across the different sample points was visualized using Circos32.
Statistics
Statistical analyses (described in context) were performed using GraphPad Prism and R.
Supplementary Material
Refer to Web version on PubMed Central for supplementary material.
Ellebedy et al. Page 12
Nat Immunol. Author manuscript; available in PMC 2017 February 15.
Author M
anuscriptA
uthor Manuscript
Author M
anuscriptA
uthor Manuscript
Acknowledgments
We thank Robert Karaffa and Sommer Durham for excellent technical assistance. This work was funded in parts by National Institutes of Health (NIH)/National Institute of Allergy and Infectious Diseases (NIAID) contract number HHSN266200700006C, grants 1P01AI097092, U19AI117891 and Advanced Immunization Technologies (ADITEC) #280873, European Union (to R.A.), and by grants U19AI09525801, UM1AI100663, and U01AI104342 (to S.D.B.). A.E. is supported by the training grant (T32AI074492) from the National Institute of Allergy and Infectious Diseases. H.I.N. receives investigator fellowship from CNPq, Brazil. The content is solely the responsibility of the authors and does not necessarily represent the official views of the National Institute of Allergy and Infectious Diseases or the National Institutes of Health or that of the Centers for Disease Control and Prevention.
References
1. Tangye SG, Tarlinton DM. Memory B cells: effectors of long-lived immune responses. Eur J Immunol. 2009; 39:2065–2075. [PubMed: 19637202]
2. McHeyzer-Williams M, Okitsu S, Wang N, McHeyzer-Williams L. Molecular programming of B cell memory. Nat Rev Immunol. 2012; 12:24–34.
3. Singh H, Khan AA, Dinner AR. Gene regulatory networks in the immune system. Trends Immunol. 2014; 35:211–218. [PubMed: 24768519]
4. Wrammert J, et al. Broadly cross-reactive antibodies dominate the human B cell response against 2009 pandemic H1N1 influenza virus infection. J Exp Med. 2011; 208:181–193. [PubMed: 21220454]
5. Wrammert J, et al. Rapid and massive virus-specific plasmablast responses during acute dengue virus infection in humans. J Virol. 2012; 86:2911–2918. [PubMed: 22238318]
6. Wrammert J, et al. Rapid cloning of high-affinity human monoclonal antibodies against influenza virus. Nature. 2008; 453:667–671. [PubMed: 18449194]
7. Corti D, et al. A neutralizing antibody selected from plasma cells that binds to group 1 and group 2 influenza A hemagglutinins. Science. 2011; 333:850–856. [PubMed: 21798894]
8. Thomson CA, et al. Pandemic H1N1 Influenza Infection and Vaccination in Humans Induces Cross-Protective Antibodies that Target the Hemagglutinin Stem. Front Immunol. 2012; 3:87. [PubMed: 22586427]
9. Wilson PC, Andrews SF. Tools to therapeutically harness the human antibody response. Nat Rev Immunol. 2012; 12:709–719. [PubMed: 23007571]
10. Pinna D, Corti D, Jarrossay D, Sallusto F, Lanzavecchia A. Clonal dissection of the human memory B-cell repertoire following infection and vaccination. Eur J Immunol. 2009; 39:1260–1270. [PubMed: 19404981]
11. Frölich D, et al. Secondary immunization generates clonally related antigen-specific plasma cells and memory B cells. J Immunol Baltim Md 1950. 2010; 185:3103–3110.
12. Medina KL, Singh H. Genetic networks that regulate B lymphopoiesis. Curr Opin Hematol. 2005; 12:203–209. [PubMed: 15867576]
13. Nutt SL, Heavey B, Rolink AG, Busslinger M. Commitment to the B-lymphoid lineage depends on the transcription factor Pax5. Nature. 1999; 401:556–562. [PubMed: 10524622]
14. Nutt SL, Kee BL. The transcriptional regulation of B cell lineage commitment. Immunity. 2007; 26:715–725. [PubMed: 17582344]
15. Xu H, et al. Regulation of bifurcating B cell trajectories by mutual antagonism between transcription factors IRF4 and IRF8. Nat Immunol. 2015; 16:1274–1281. [PubMed: 26437243]
16. Oshansky CM, et al. Mucosal immune responses predict clinical outcomes during influenza infection independently of age and viral load. Am J Respir Crit Care Med. 2014; 189:449–462. [PubMed: 24308446]
17. Li GM, et al. Pandemic H1N1 influenza vaccine induces a recall response in humans that favors broadly cross-reactive memory B cells. Proc Natl Acad Sci U S A. 2012; 109:9047–9052. [PubMed: 22615367]
18. Lyon GM, et al. Clinical care of two patients with Ebola virus disease in the United States. N Engl J Med. 2014; 371:2402–2409. [PubMed: 25390460]
Ellebedy et al. Page 13
Nat Immunol. Author manuscript; available in PMC 2017 February 15.
Author M
anuscriptA
uthor Manuscript
Author M
anuscriptA
uthor Manuscript
19. McElroy AK, et al. Human Ebola virus infection results in substantial immune activation. Proc Natl Acad Sci U S A. 2015; 112:4719–4724. [PubMed: 25775592]
20. Li S, et al. Molecular signatures of antibody responses derived from a systems biology study of five human vaccines. Nat Immunol. 2014; 15:195–204. [PubMed: 24336226]
21. Subramanian A, et al. Gene set enrichment analysis: a knowledge-based approach for interpreting genome-wide expression profiles. Proc Natl Acad Sci U S A. 2005; 102:15545–15550. [PubMed: 16199517]
22. Amanna IJ, Carlson NE, Slifka MK. Duration of humoral immunity to common viral and vaccine antigens. N Engl J Med. 2007; 357:1903–1915. [PubMed: 17989383]
23. Crotty S, et al. Cutting edge: long-term B cell memory in humans after smallpox vaccination. J Immunol Baltim Md 1950. 2003; 171:4969–4973.
24. Purtha WE, Tedder TF, Johnson S, Bhattacharya D, Diamond MS. Memory B cells, but not long-lived plasma cells, possess antigen specificities for viral escape mutants. J Exp Med. 2011; 208:2599–2606. [PubMed: 22162833]
25. Takemori T, Kaji T, Takahashi Y, Shimoda M, Rajewsky K. Generation of memory B cells inside and outside germinal centers. Eur J Immunol. 2014; 44:1258–1264. [PubMed: 24610726]
26. Odendahl M, et al. Generation of migratory antigen-specific plasma blasts and mobilization of resident plasma cells in a secondary immune response. Blood. 2005; 105:1614–1621. [PubMed: 15507523]
27. Suzuki R, Shimodaira H. Pvclust: an R package for assessing the uncertainty in hierarchical clustering. Bioinforma Oxf Engl. 2006; 22:1540–1542.
28. Nakaya HI, et al. Systems biology of vaccination for seasonal influenza in humans. Nat Immunol. 2011; 12:786–795. [PubMed: 21743478]
29. Saito R, et al. A travel guide to Cytoscape plugins. Nat Methods. 2012; 9:1069–1076. [PubMed: 23132118]
30. Magoč T, Salzberg SL. FLASH: fast length adjustment of short reads to improve genome assemblies. Bioinforma Oxf Engl. 2011; 27:2957–2963.
31. Ye J, Ma N, Madden TL, Ostell JM. IgBLAST: an immunoglobulin variable domain sequence analysis tool. Nucleic Acids Res. 2013; 41:W34–40. [PubMed: 23671333]
32. Krzywinski M, et al. Circos: an information aesthetic for comparative genomics. Genome Res. 2009; 19:1639–1645. [PubMed: 19541911]
Ellebedy et al. Page 14
Nat Immunol. Author manuscript; available in PMC 2017 February 15.
Author M
anuscriptA
uthor Manuscript
Author M
anuscriptA
uthor Manuscript
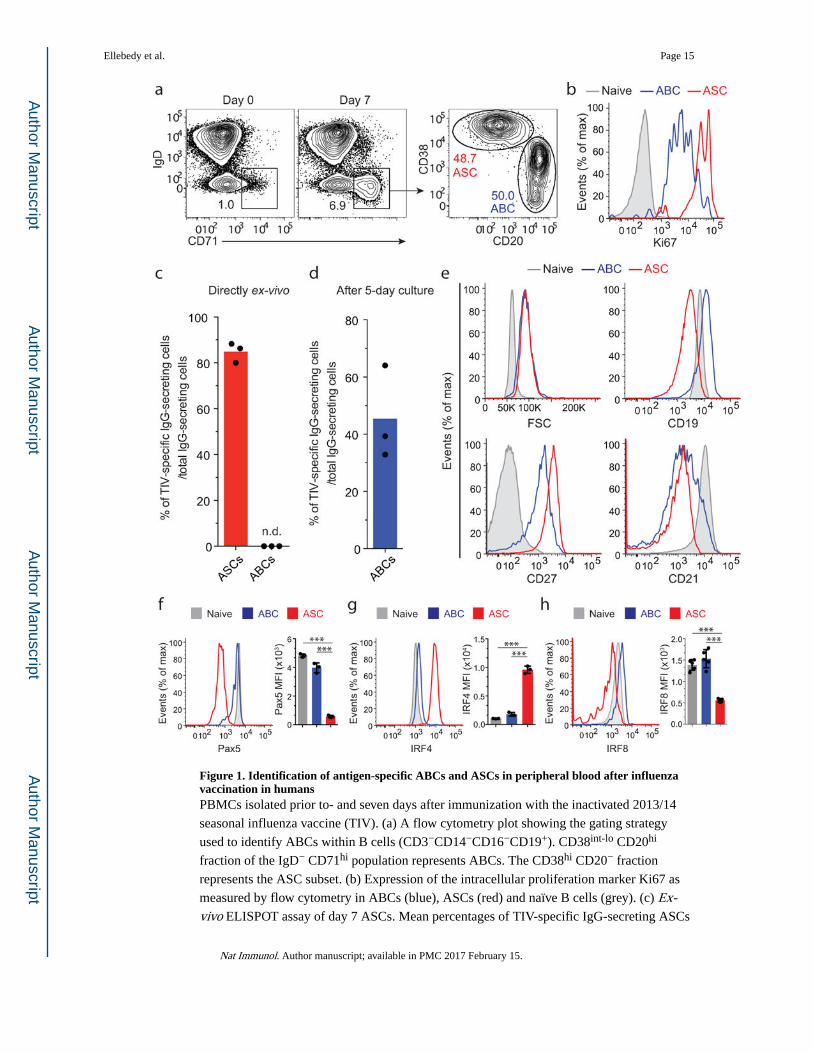
Figure 1. Identification of antigen-specific ABCs and ASCs in peripheral blood after influenza vaccination in humansPBMCs isolated prior to- and seven days after immunization with the inactivated 2013/14
seasonal influenza vaccine (TIV). (a) A flow cytometry plot showing the gating strategy
used to identify ABCs within B cells (CD3−CD14−CD16−CD19+). CD38int-lo CD20hi
fraction of the IgD− CD71hi population represents ABCs. The CD38hi CD20− fraction
represents the ASC subset. (b) Expression of the intracellular proliferation marker Ki67 as
measured by flow cytometry in ABCs (blue), ASCs (red) and naïve B cells (grey). (c) Ex-vivo ELISPOT assay of day 7 ASCs. Mean percentages of TIV-specific IgG-secreting ASCs
Ellebedy et al. Page 15
Nat Immunol. Author manuscript; available in PMC 2017 February 15.
Author M
anuscriptA
uthor Manuscript
Author M
anuscriptA
uthor Manuscript
is shown (n = 3). N.D., not detectable. (d) Mean percentage of TIV-specific day 7 IgG-
secreting ABCs (detected by ELISPOT) is shown (n = 3). ABCs were cultured for five days
(see Methods) and then added on plates coated with either the TIV antigen or anti-human
IgG. (e) Histogram plots showing the differences in forward scatter (FSC) and expression of
CD19, CD27, and CD21 among ABCs (blue), ASCs (red) and naïve B cells (grey). (f-h)
Expression of Pax5 (f), IRF4 (g) and IRF8 (h) in ABCs, ASCs and naïve B cells. Bar graphs
show the mean of Pax5, IRF8 and IRF4 MFI in the three populations (n = 3). *** =
p<0.0001. p<0.0001 (unpaired t-test (f–h)). Data represent at least two independent
experiments.
Ellebedy et al. Page 16
Nat Immunol. Author manuscript; available in PMC 2017 February 15.
Author M
anuscriptA
uthor Manuscript
Author M
anuscriptA
uthor Manuscript
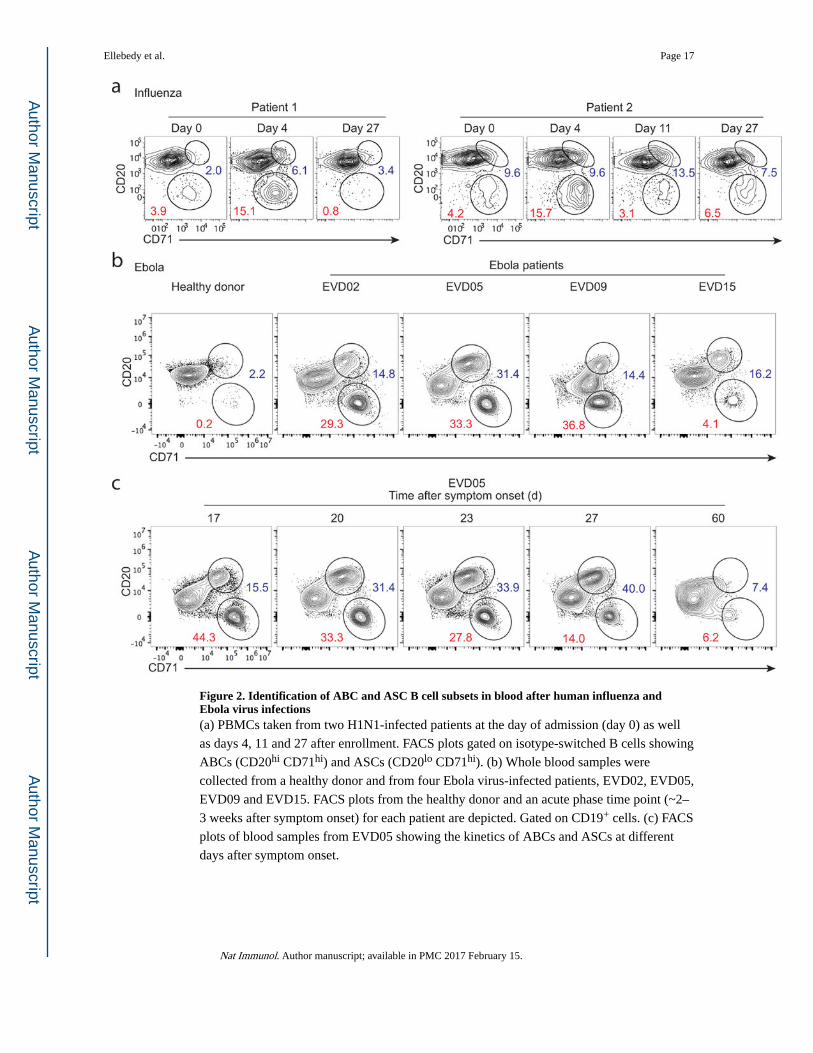
Figure 2. Identification of ABC and ASC B cell subsets in blood after human influenza and Ebola virus infections(a) PBMCs taken from two H1N1-infected patients at the day of admission (day 0) as well
as days 4, 11 and 27 after enrollment. FACS plots gated on isotype-switched B cells showing
ABCs (CD20hi CD71hi) and ASCs (CD20lo CD71hi). (b) Whole blood samples were
collected from a healthy donor and from four Ebola virus-infected patients, EVD02, EVD05,
EVD09 and EVD15. FACS plots from the healthy donor and an acute phase time point (~2–
3 weeks after symptom onset) for each patient are depicted. Gated on CD19+ cells. (c) FACS
plots of blood samples from EVD05 showing the kinetics of ABCs and ASCs at different
days after symptom onset.
Ellebedy et al. Page 17
Nat Immunol. Author manuscript; available in PMC 2017 February 15.
Author M
anuscriptA
uthor Manuscript
Author M
anuscriptA
uthor Manuscript
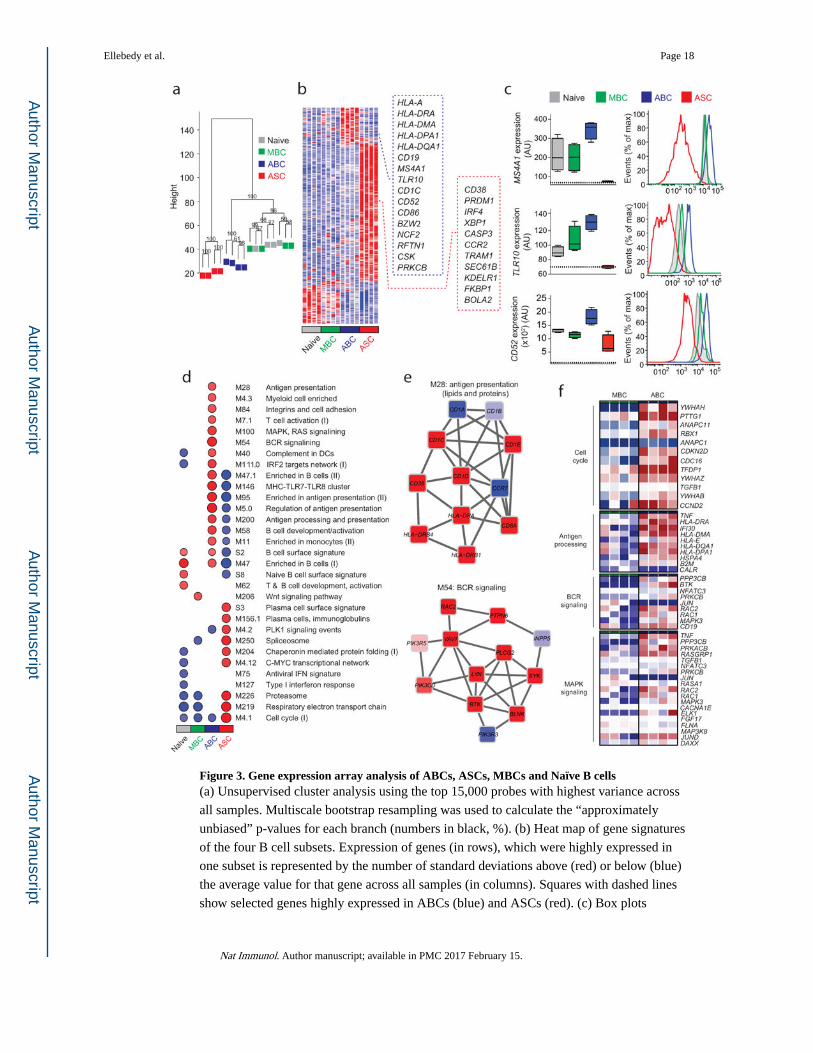
Figure 3. Gene expression array analysis of ABCs, ASCs, MBCs and Naïve B cells(a) Unsupervised cluster analysis using the top 15,000 probes with highest variance across
all samples. Multiscale bootstrap resampling was used to calculate the “approximately
unbiased” p-values for each branch (numbers in black, %). (b) Heat map of gene signatures
of the four B cell subsets. Expression of genes (in rows), which were highly expressed in
one subset is represented by the number of standard deviations above (red) or below (blue)
the average value for that gene across all samples (in columns). Squares with dashed lines
show selected genes highly expressed in ABCs (blue) and ASCs (red). (c) Box plots
Ellebedy et al. Page 18
Nat Immunol. Author manuscript; available in PMC 2017 February 15.
Author M
anuscriptA
uthor Manuscript
Author M
anuscriptA
uthor Manuscript
showing expression of MS4A1, TLR10 and CD52 in the four B cell subsets. Histogram plots
showing surface protein expression of CD20, TLR10 and CD52 on the indicated B cell
subsets. (d) GSEA analysis showing the Blood Transcription Modules whose expression
activity is higher (red) or lower (blue) in one B cell subset compared to others (nominal p-
value < 0.01, see methods). Circle size (“corrplot” R package) is proportional to the nominal
enrichment score (NES). (e) Genes in BTMs M28 and M54; each ‘edge’ (gray line)
represents a coexpression relationship, as described in 1 colors represent the mean Z score
for ABC samples (red = higher and blue = lower expression on ABCs compared to others).
(f) A heat map showing fold increase (red) or decrease (blue) in gene expression between the
ABCs and MBCs for selected pathways.
Ellebedy et al. Page 19
Nat Immunol. Author manuscript; available in PMC 2017 February 15.
Author M
anuscriptA
uthor Manuscript
Author M
anuscriptA
uthor Manuscript
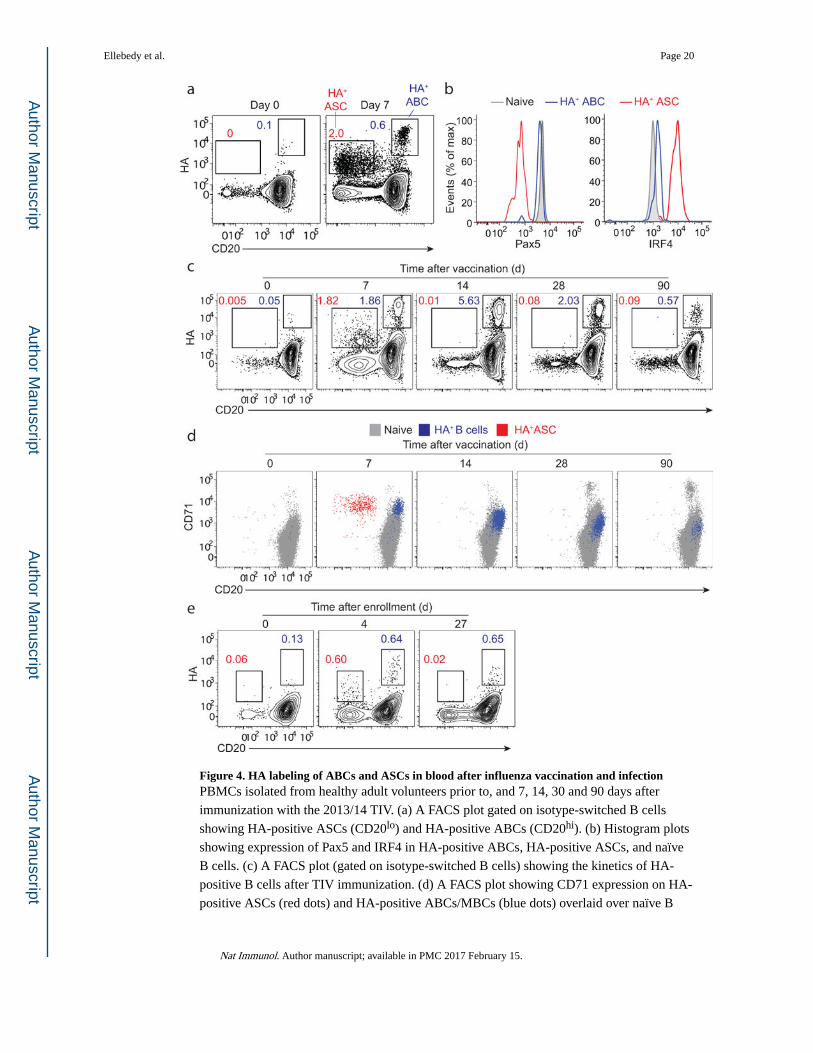
Figure 4. HA labeling of ABCs and ASCs in blood after influenza vaccination and infectionPBMCs isolated from healthy adult volunteers prior to, and 7, 14, 30 and 90 days after
immunization with the 2013/14 TIV. (a) A FACS plot gated on isotype-switched B cells
showing HA-positive ASCs (CD20lo) and HA-positive ABCs (CD20hi). (b) Histogram plots
showing expression of Pax5 and IRF4 in HA-positive ABCs, HA-positive ASCs, and naïve
B cells. (c) A FACS plot (gated on isotype-switched B cells) showing the kinetics of HA-
positive B cells after TIV immunization. (d) A FACS plot showing CD71 expression on HA-
positive ASCs (red dots) and HA-positive ABCs/MBCs (blue dots) overlaid over naïve B
Ellebedy et al. Page 20
Nat Immunol. Author manuscript; available in PMC 2017 February 15.
Author M
anuscriptA
uthor Manuscript
Author M
anuscriptA
uthor Manuscript
cells (grey dots) (e) PBMCs isolated from an influenza-infected patient. FACS plots gated on
isotype-switched B cells showing HA-positive ASCs (CD20lo) and HA-positive ABCs
(CD20hi) at days 0, 4 and 27 after enrollment.
Ellebedy et al. Page 21
Nat Immunol. Author manuscript; available in PMC 2017 February 15.
Author M
anuscriptA
uthor Manuscript
Author M
anuscriptA
uthor Manuscript
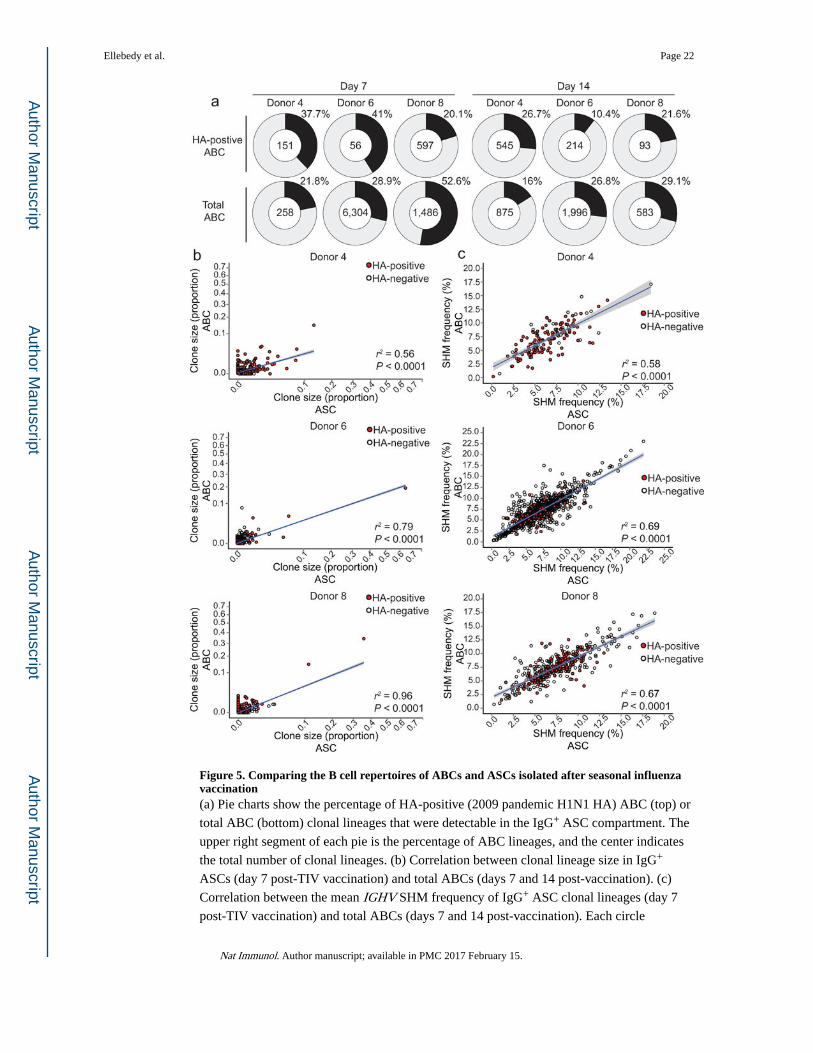
Figure 5. Comparing the B cell repertoires of ABCs and ASCs isolated after seasonal influenza vaccination(a) Pie charts show the percentage of HA-positive (2009 pandemic H1N1 HA) ABC (top) or
total ABC (bottom) clonal lineages that were detectable in the IgG+ ASC compartment. The
upper right segment of each pie is the percentage of ABC lineages, and the center indicates
the total number of clonal lineages. (b) Correlation between clonal lineage size in IgG+
ASCs (day 7 post-TIV vaccination) and total ABCs (days 7 and 14 post-vaccination). (c)
Correlation between the mean IGHV SHM frequency of IgG+ ASC clonal lineages (day 7
post-TIV vaccination) and total ABCs (days 7 and 14 post-vaccination). Each circle
Ellebedy et al. Page 22
Nat Immunol. Author manuscript; available in PMC 2017 February 15.
Author M
anuscriptA
uthor Manuscript
Author M
anuscriptA
uthor Manuscript
represents a clonal lineage; red-filled circles indicate HA-positive clonal lineages and
unfilled circles indicate HA-negative lineages. Linear model regression lines are plotted in
blue with standard error shaded in grey, and the coefficient of determination for the linear
model (r2) and P-values are shown.
Ellebedy et al. Page 23
Nat Immunol. Author manuscript; available in PMC 2017 February 15.
Author M
anuscriptA
uthor Manuscript
Author M
anuscriptA
uthor Manuscript
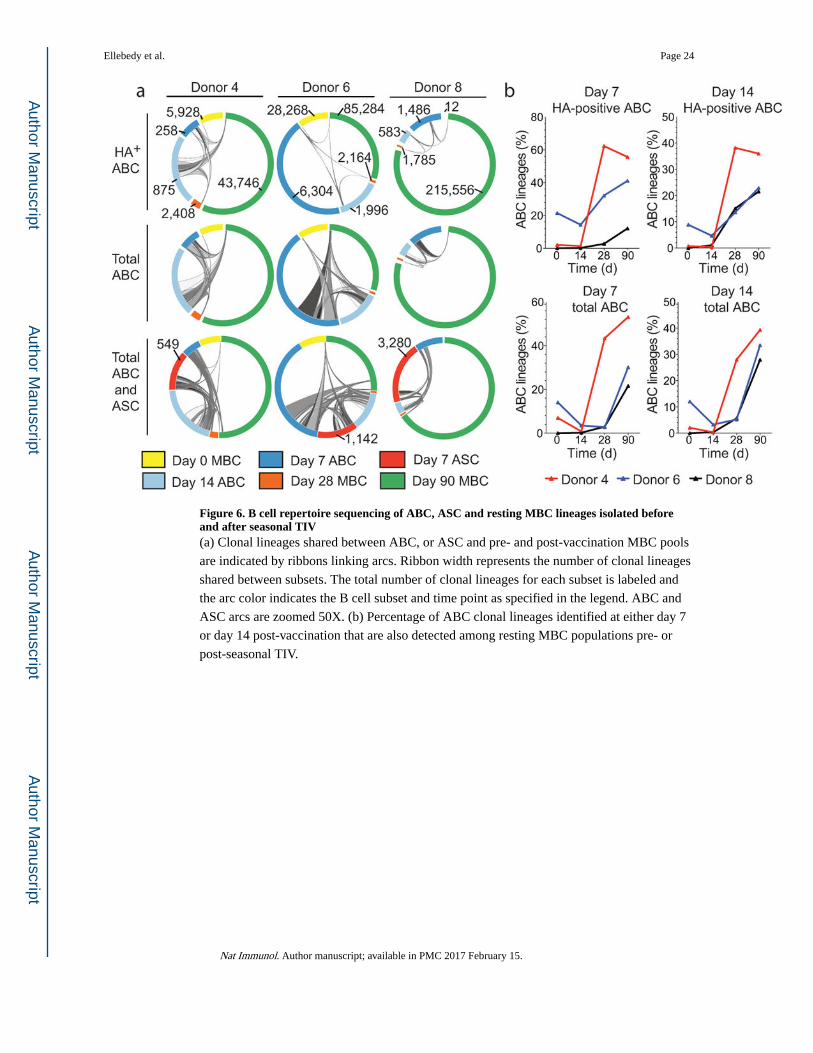
Figure 6. B cell repertoire sequencing of ABC, ASC and resting MBC lineages isolated before and after seasonal TIV(a) Clonal lineages shared between ABC, or ASC and pre- and post-vaccination MBC pools
are indicated by ribbons linking arcs. Ribbon width represents the number of clonal lineages
shared between subsets. The total number of clonal lineages for each subset is labeled and
the arc color indicates the B cell subset and time point as specified in the legend. ABC and
ASC arcs are zoomed 50X. (b) Percentage of ABC clonal lineages identified at either day 7
or day 14 post-vaccination that are also detected among resting MBC populations pre- or
post-seasonal TIV.
Ellebedy et al. Page 24
Nat Immunol. Author manuscript; available in PMC 2017 February 15.
Author M
anuscriptA
uthor Manuscript
Author M
anuscriptA
uthor Manuscript
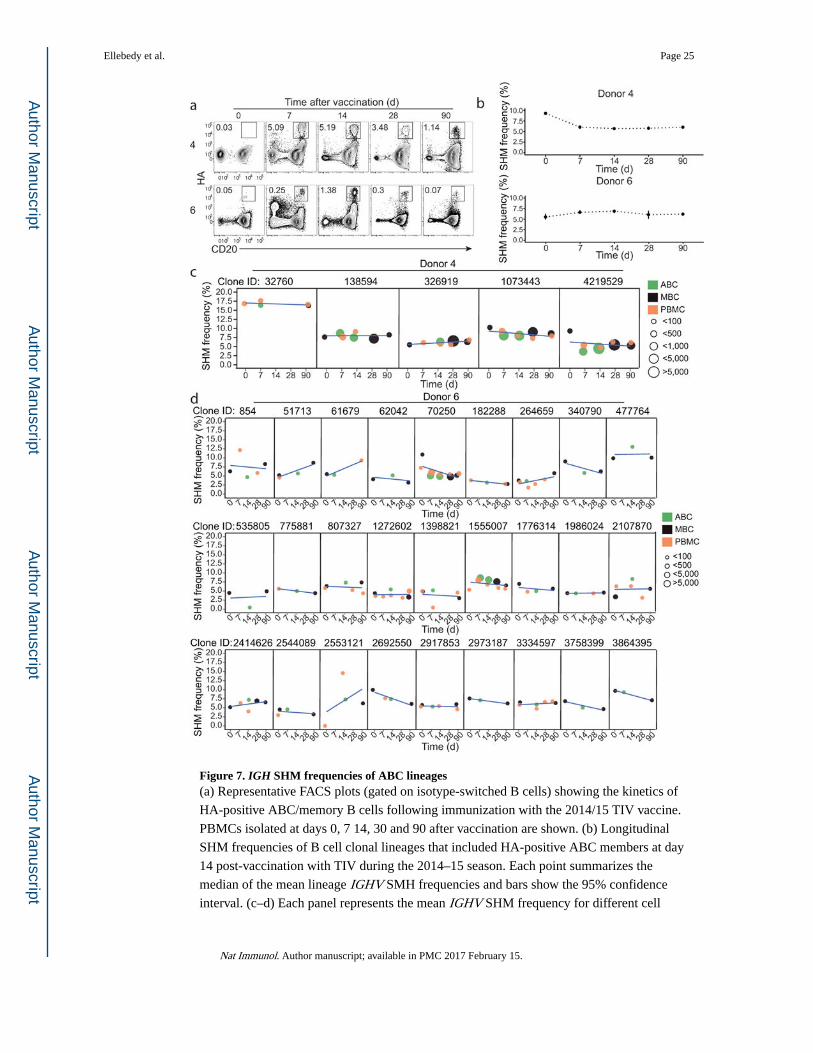
Figure 7. IGH SHM frequencies of ABC lineages(a) Representative FACS plots (gated on isotype-switched B cells) showing the kinetics of
HA-positive ABC/memory B cells following immunization with the 2014/15 TIV vaccine.
PBMCs isolated at days 0, 7 14, 30 and 90 after vaccination are shown. (b) Longitudinal
SHM frequencies of B cell clonal lineages that included HA-positive ABC members at day
14 post-vaccination with TIV during the 2014–15 season. Each point summarizes the
median of the mean lineage IGHV SMH frequencies and bars show the 95% confidence
interval. (c–d) Each panel represents the mean IGHV SHM frequency for different cell
Ellebedy et al. Page 25
Nat Immunol. Author manuscript; available in PMC 2017 February 15.
Author M
anuscriptA
uthor Manuscript
Author M
anuscriptA
uthor Manuscript
subsets and time points for individual clonal lineages from donor 4 (c) and donor 6 (d). The
point color indicates the B cell subset and the point size indicates the number of sequencing
reads for the lineage at a given time point. Linear regression lines are shown in blue.
Ellebedy et al. Page 26
Nat Immunol. Author manuscript; available in PMC 2017 February 15.
Author M
anuscriptA
uthor Manuscript
Author M
anuscriptA
uthor Manuscript