Embed Size (px)
Citation preview
Lappeenranta University of Technology
School of Engineering Science
Chemical Engineering
Chemical and Process Engineering
Saara Laamanen
Defining Surface Chemical and Rheological Properties of Resins for
Curtain Coating
Master’s Thesis
Examiners: Prof. Satu-Pia Reinikainen
D.Sc. Eeva Jernström

TIIVISTELMÄ
Lappeenrannan teknillinen yliopisto
School of Engineering Science
Kemiantekniikka
Chemical and Process Engineering
Saara Laamanen
Verhopäällystyksessä käytettävien hartsien pintakemiallisten ja reologisten
ominaisuuksien määrittäminen
Diplomityö, 2018
143 (+ 29) sivua, 48 (+ 14) kuvaa, 21 (+ 15) taulukkoa ja 5 liitettä
Tarkastajat: Prof. Satu-Pia Reinikainen, TkT Eeva Jernström
Ohjaajat: FT Suvi Pietarinen, FM Sanna Valkonen, FM Mauno Miettinen
Hakusanat: fenoli-formaldehydi hartsit, ligniini, vaneri, verhopäällystys, pintajännitys,
venymäviskositeetti
Fenoli-formaldehydi hartseja käytetään vaneriliimojen raaka-aineena. Biopohjaisella
ligniinillä voidaan korvata osa hartsin myrkyllisestä ja öljypohjaisesta fenolista.
Vaneriliimaus voidaan suorittaa esimerkiksi verhopäällystyksellä. Verhopäällystyksen
haasteena on vakaan ja ehjän verhon muodostuminen, johon voidaan vaikuttaa
päällystysmateriaalin pintakemiallisilla ja reologisilla ominaisuuksilla. Matala pintajännitys
ja korkea venymäviskositeetti edesauttavat verhon muodostumista.
Tässä työssä selvitettiin verhopäällystyksessä käytettävän kaupallisen fenoli-formaldehydi-
ja ligniini-fenoli-formaldehydihartsin pintakemiallisten ja reologisten ominaisuuksien erot,
valittiin hartseille sopivat analyysimenetelmät, joilla ominaisuudet voidaan onnistuneesti
määrittää, sekä tutkittiin eri lisäaineiden vaikutuksia ligniinihartsin ominaisuuksiin.
Lopputuloksena määritettiin toimintakuvaajat lisäaineiden annostusmäärälle, kun
tavoitellaan hartsin korkeaa venymäviskositeettia.

ABSTRACT
Lappeenranta University of Technology
School of Engineering Science
Chemical Engineering
Chemical and Process Engineering
Saara Laamanen
Defining Surface Chemical and Rheological Properties of Resins for Curtain Coating
Master’s Thesis, 2018
143 (+ 29) pages, 48 (+ 14) figures, 21 (+ 15) tables and 5 appendices
Examiners: Prof. Satu-Pia Reinikainen, D.Sc. Eeva Jernström
Supervisors: PhD Suvi Pietarinen, M.Sc. Sanna Valkonen, M.Sc. Mauno Miettinen
Keywords: phenol-formaldehyde resins, lignin, plywood, curtain coating, surface
tension, extensional viscosity
Phenol-formaldehyde resins are used as a raw material for plywood adhesives. Bio-based
lignin can be used as a partial replacement to toxic and petroleum-based phenol. Plywood
gluing can be performed for example by curtain coating. The challenge of curtain coating is
formation of a stable and uniform curtain, which can be affected by surface chemical and
rheological properties of the coating material. Low surface tension and high extensional
viscosity assist successful curtain formation.
In this thesis, the differences in surface chemical and rheological properties of commercial
phenol-formaldehyde resin for curtain coating and lignin-phenol-formaldehyde resin were
determined, suitable analytical methods to successfully measure these properties were
selected, and effects of commercial additives on properties of lignin-phenol-formaldehyde
resin were studied. As final results, operational windows for dosage of additives were
determined, when high extensional viscosity of the resin is pursued.

ACKNOWLEDGEMENTS
This work was carried out in UPM Northern Europe Research Center (NERC),
Lappeenranta, between June and November in 2018. The research center has been a
supportive, open-minded and friendly working environment for the past few years. I'm
grateful for being part of this innovative team of professionals. Special thanks to Lignin
team, which has needed my input, offered interesting tasks and helped to learn and develop
myself during the years. It is a pleasure to work with you daily. Thank you for Suvi
Pietarinen, Sanna Valkonen and Mauno Miettinen for supervising this work. Thank you for
your trust and helpful guides.
I’m also thankful for Satu-Pia Reinikainen and Eeva Jernström from Lappeenranta
University of Technology for supervising this work. Thank you for your important feedback,
support and commitment. I’m grateful for the department of chemical engineering for
offering challenges and successes during the years of studies. LUT, thank you for devoting
to students, building a forerunner state of mind and offering excellent keys for the future.
Five years ago, when moving to Lappeenranta, I was excited and nervous about the new city,
new university and new life. Thank you for KeTeK ry and LTKY that I got to be part of
creating and developing the student life over the years. Thank you for the girls of business-
reinforced Kemistiperhe: Annina, Heini, Anna, Satu, Tuuli and Riikka, without you
Lappeenranta would not have felt like home already from the first days. Thank you also for
my other friends for making the student life unforgettable, and thank you for my friends
from Kauniainen that I'm always able to come back to you.
Thanks to my family, especially to my parents, for always supporting me and trusting the
choices I've made. Thank you for providing a loving environment to grow and even though
you haven't helped with math homework lately, I've learned a lot from you. Last but
definitely not least, thank you Jere. You've always helped me whenever needed and made
me feel better, listened my stories patiently and laughed at my jokes. Thank you.
Saara Laamanen
Lappeenranta, 23.11.2018
5
TABLE OF CONTENTS
1 GRAPHICAL ABSTRACT ......................................................................................... 11
2 INTRODUCTION ....................................................................................................... 11
2.1 Objectives of thesis ............................................................................................... 13
2.2 Scope and outcome of thesis ................................................................................. 13
2.3 Introduction of company ....................................................................................... 14
LITERATURE PART .......................................................................................................... 14
3 PHENOL-FORMALDEHYDE RESIN ....................................................................... 15
3.1 Production of PF resins ......................................................................................... 15
3.2 Properties of PF resins .......................................................................................... 20
3.3 Plywood adhesives ................................................................................................ 23
3.4 Applications .......................................................................................................... 25
4 LIGNIN-PHENOL-FORMALDEHYDE RESIN ........................................................ 26
4.1 Lignin .................................................................................................................... 26
4.2 Applications .......................................................................................................... 31
4.3 Production of LPF resin ........................................................................................ 33
4.4 Properties of LPF resin.......................................................................................... 36
5 CURTAIN COATING ................................................................................................. 37
5.1 Principles of curtain coating.................................................................................. 37
5.2 Formation of curtain .............................................................................................. 40
5.3 Curtain coating resin/adhesive .............................................................................. 45
6 SURFACE CHEMISTRY OF RESINS ...................................................................... 49
6.1 Surface chemical properties .................................................................................. 49
6.2 Additives to affect surface chemistry of resins ..................................................... 56
6.3 Analytical methods ................................................................................................ 60
6.4 Discussion ............................................................................................................. 67
6
7 RHEOLOGY OF RESINS........................................................................................... 68
7.1 Rheological properties .......................................................................................... 69
7.2 Additives to affect rheology of resins ................................................................... 79
7.3 Analytical methods ................................................................................................ 85
7.4 Discussion ............................................................................................................. 91
EXPERIMENTAL PART .................................................................................................... 93
8 MATERIALS ............................................................................................................... 94
8.1 Resins .................................................................................................................... 94
8.2 Additives ............................................................................................................... 95
8.3 Experiments ........................................................................................................... 96
9 METHODS .................................................................................................................. 98
9.1 Determination of general properties of resins ....................................................... 98
9.2 Determination of surface chemical properties of resins ........................................ 99
9.3 Determination of rheological properties of resins ............................................... 100
10 RESULTS AND DISCUSSION ................................................................................ 101
10.1 General properties of resins ............................................................................. 104
10.2 Surface tension ................................................................................................ 105
10.3 Shear rheology ................................................................................................. 110
10.4 Extensional rheology ....................................................................................... 112
10.5 Other analyses ................................................................................................. 130
11 CONCLUSIONS ....................................................................................................... 131
REFERENCES .................................................................................................................. 134
APPENDICES
APPENDIX I: USED ADDITIVES (CLASSIFIED)
APPENDIX II: EXPERIMENTS
APPENDIX III: SURFACE CHEMICAL ANALYSES
APPENDIX IV: RHEOLOGICAL ANALYSES
APPENDIX V: MULTIPLE LINEAR REGRESSION ANALYSIS

7
LIST OF SYMBOLS
A area [m2]
Adry dry coverage [g/m2]
b regression coefficients -
Bo Bond number -
c concentration -
d diameter [m]
E’ storage modulus of complex viscoelastic modulus [mN/m]
E’’ loss modulus of complex viscoelastic modulus [mN/m]
E* complex viscoelastic modulus [mN/m]
F force [N]
Fd correction coefficient -
f correction coefficient -
∆G free energy change [J]
G shear modulus [Pa]
Ge equilibrium modulus [Pa]
G’ storage modulus of complex shear modulus [Pa]
G’’ loss modulus of complex shear modulus [Pa]
G* complex shear modulus [Pa]
g gravitational acceleration [m/s2]
h height [m]
hc curtain thickness [m]
l length [m]
M torque [J]
m mass [kg]
n number of replicates -
P pressure [Pa], [bar]
Q volumetric flow rate per unit width [m2/s]
S spreading coefficient [J/m2]
s distance [m]
r radius of a circle [m]
Re Reynolds number -

8
t time [s]
U velocity [m/s]
u conveyor velocity [m/s], [m/min]
V volume [m3]
vc curtain velocity [m/s]
vd damage propagation velocity [m/s]
v0 nozzle exit velocity of the curtain [m/s]
Wa work of adhesion [J/m2]
Wi work of immersion [J/m2]
We Weber number -
x curtain height [m]
x1, x2 explanatory variables in regression -
y response variable to be modelled -
β correction coefficient -
γ shear strain -, [%]
γL linearity limit [%]
�� shear rate [1/s]
δ phase shift [º]
ε Hencky strain -
𝜀 Hencky strain rate [1/s]
η (shear) viscosity [mPas], [cP]
ηE extensional viscosity [mPas], [cP]
η0 zero-shear viscosity [mPas], [cP]
η* complex viscosity [mPas], [cP]
λ relaxation time [s]
λE elongational relaxation time [s]
θ contact angle [°]
ν kinematic viscosity [m2/s]
ρ density [kg/m3]
∆σ correction coefficient [mN/m]
σ surface tension [mN/m]
σc critical surface tension [mN/m]

9
σLG surface tension at the interface of liquid/gas [mN/m]
σSG surface tension at the interface of solid/gas [mN/m]
σSL surface tension at the interface of solid/liquid [mN/m]
σ+ acid (electron acceptor) parameter of surface tension [mN/m]
σ- base (electron donor) parameter of surface tension [mN/m]
τ shear stress [Pa]
ω angular velocity/frequency [rad/s]

10
LIST OF ABBREVIATIONS
CMC Critical micelle concentration
Df Defoamer
DMC Dry matter content
EXP Experiment
F Formaldehyde
HMW High-molecular-weight
LMW Low-molecular-weight
LPF Lignin-phenol-formaldehyde
MN Number average molecular weight
MW Weight average molecular weight
MLR Multiple linear regression
NaOH Sodium hydroxide
P Phenol
PF Phenol-formaldehyde
R&D Research and development
S/D Surfactant/Defoamer
ST Surface tension
Surf Surfactant

11
1 GRAPHICAL ABSTRACT
Figure 1 In this thesis, characteristics for LPF resin additive composition for curtain
coating of plywood were defined.
2 INTRODUCTION
Major principle in sustainable development is comprehensive use of raw materials in an
energy efficient way. This is important because the global use of available raw material
resources has been excessive and irresponsible, and the fossil resources are at risk of ending
completely (oil and natural gas in approximately 50 years). Demand is to find new bio-based
alternatives for coal- and petroleum-based chemicals (Alén, 2011). Thus, for example forest
industrial companies are converting the conventional paper and pulp mills into biorefineries.
In biorefineries sustainable principles are applied, when wide variety of biomass feedstock
is used for production of biochemicals and other novel bioproducts (Alén, 2011).
One of the new biorefinery products is lignin, a wood component which binds cellulose and
hemicellulose together in wood. Conventionally in kraft pulping, lignin is dissolved into the
cooking liquor. This black liquor is concentrated into higher solids content and burned.
(Alén, 2011) Over the years there has been some end-use applications for black liquor and
lignin, but during the last decades the true potential of lignin has been noticed. The amount
Surface chemistry and rheology
Plywood curtain coating
Requirements
Resins
Properties Determination Modification
12
of potentially available lignin from wood and side streams from pulp industry is 70 million
tons (Dunky, 2003), thus making it also a relatively cheap raw material. Lignin is renewable
and biodegradable, and its complex structure offers multiple end-use possibilities.
Research and development (R&D) in lignin business focuses on separation of lignin from
black liquor and development of new high-value, industrial scale lignin applications. Lignin
can be used for example in wood adhesives. Wood adhesives compose of resins, water, fillers
and required additives. Phenol-formaldehyde (PF) resins are one of the most used resins but
have remarkable disadvantages in toxicity and price. Because of its phenolic nature, lignin
can be applied into resins as a partial replacement to fossil-based phenol, thus forming the
concept of lignin-phenol-formaldehyde (LPF) resins.
Commercial example of use of lignin in PF resins is WISA® BioBond plywood products,
which have been glued with adhesive containing LPF resin technology developed by UPM
Biochemicals. It was launched in the fall of 2017 as a sustainable alternative for production
of plywood and it is an innovative example of circular economy (WISA BioBond, 2018). In
the adhesive of WISA® BioBond products, 50 % of the used phenol is replaced by lignin
and the adhesive retains the same high-quality properties as conventional PF resin-based
adhesives (UPM Biofore, 2018).
The goal of UPM is to adopt WISA® BioBond gluing technology to all of its plywood mills.
In plywood production, multiple adhesive spreading methods are used, most remarkably
roller and curtain coating. Curtain coating of veneer with LPF resin-based adhesive requires
more R&D. For curtain coating in general, low surface tension and high extensional viscosity
of the coating material are required (Beneventi & Guerin, 2005; Birkert et al., 2006). Thus,
successful curtain formation and uniform spreading of the coating material onto the base
material can be achieved. However, the emerging adhesive material for this kind of
application is unique. There is no research available about the resin properties, which are
characteristic for achieving a stable curtain. It is required to find out the suitable analytical
methods for measurement of these properties and the right methods to affect these properties.

13
2.1 Objectives of thesis
This thesis determines the essential surface chemical and rheological properties of resins for
successful application in curtain coating of veneer. One of the objectives of the thesis is to
choose suitable analytical methods for measurement of the surface chemical and rheological
properties for permanent laboratory use. The effect of commercial additives and their dosage
on these essential properties are determined.
The final objective of this thesis is to develop LPF resin composition for adhesive to be used
in curtain coating of veneer in plywood production.
2.2 Scope and outcome of thesis
Scope of this thesis is presented in Figure 2.
Figure 2 Scope of this thesis.
Literature
part
• Comparison of PF and LPF resins
• Production
• Properties
• Principles of curtain coating
• Requirements for stable curtain formation
• Review of surface chemical and rheological properties important for curtain coating
• Selection of analytical methods to measure essential properties
Experimental part
• PF resins for roller and curtain coating (commercial)
• LPF resin (commercial)
• Addition of surfactants and defoamers
• Objective to match properties of PF curtain resin
• Suitable measurements:
• Surface tension
• Shear and extensional rheology
Results
• Resin surface chemical and rheological properties determined
• Analytical methods: pendant drop shape analysis, capillary break-up extensional rheometer
• Additive performance reviewed
• Dosing
• Combinations

14
2.3 Introduction of company
UPM-Kymmene Oyj (UPM) is a forest-based bioindustrial company with six business areas,
sales over 10 billion euros and over 19 000 employees in 46 countries. Business areas include
biorefining in terms of pulp, timber and biofuels, electricity production, self-adhesive labels,
paper and specialty papers and plywood. UPM is a Biofore Company referring to its business
concept of using wood as a raw material in an innovative and efficient way. UPM’s aim is
to develop new high-quality alternatives to non-renewable materials profitably and
responsibly. (UPM-Kymmene Oyj, 2018)
Along with UPM’s business areas, other operations include wood sourcing and forestry, and
UPM Biocomposites and UPM Biochemicals business units. This thesis is done for UPM
Biochemicals, precisely for Lignin business. Related to Lignin business, UPM offers
sustainable solutions such as UPM BioPivaTM softwood kraft lignin powders for lignin-
phenol-formaldehyde resin compositions, to replace their fossil-based raw materials. It is
utilized in WISA® BioBond gluing technology (UPM Biochemicals, 2018).
UPM Northern Europe Research Center (NERC) is located in Lappeenranta, next to Kaukas
mill site. The practical research of this thesis was carried out in NERC. R&D work in NERC
focuses mostly on development of production processes of biochemicals and biofuels, fiber,
paper and pulp (UPM Kaukas, 2018).
LITERATURE PART
Next, phenol-formaldehyde resins are reviewed in detail. Application of lignin in resins is
studied, and resins are compared. Principles of curtain coating, partly based on paper
technology, are studied. Factors affecting formation of stable curtain, surface chemical and
rheological properties, are determined theoretically. Known, available analytical methods
for determination of surface chemical and rheological properties are reviewed. Methods to
affect these properties are determined.

15
3 PHENOL-FORMALDEHYDE RESIN
Resins are viscous liquids occurring in nature and produced synthetically, and used for
adhesive production. Synthetic resins may be for example phenol-, urea- or melamine-
formaldehyde resins (or mixtures of these), epoxy resins or isocyanate resins. Phenol-
formaldehyde (PF) resins were the first synthetically produced polymers to be developed
commercially (Pizzi, 2003b). Since their emergence, their use in the plywood industry grew
rapidly as the most widely used adhesive (Sellers, 1985). Next, production and properties of
PF resins are studied.
3.1 Production of PF resins
Phenolic resins are polycondensation products of the reaction of phenol (C6H5OH, Figure
3A) and formaldehyde (CH2O, Figure 3B). In a condensation reaction, two or more
molecules are combined and water or another simple substance is released. Chemical
structure of phenol-formaldehyde (PF) resins is complex, because phenol as a polyfunctional
molecule may react with formaldehyde in both ortho (two substituents next to each other in
the aromatic ring) and para (two substituents on the opposite ends of the aromatic ring)
positions (Pizzi, 2003b). Phenolic resin chemistry, structure, characteristic reactions and
kinetic behavior has been widely studied in order to achieve specific physical properties for
use in adhesive technology.
Figure 3 Chemical structure of A) phenol (C6H5OH) and B) formaldehyde (CH2O).

16
Condensation reaction of phenol and formaldehyde happens in two phases. Phenol can react
with formaldehyde at three possible ortho or para positions (sites 2, 4 and 6, Figure 3A),
which allows 1-3 formaldehyde units to attach to the aromatic ring. Thus, phenol and
formaldehyde form hydroxymethylolphenol (phenolic alcohol, Figure 4), di- and tri-
alcohols. Formaldehyde can react with two phenols. (Pizzi, 2003b; Morrel, 2014)
Figure 4 Reaction of phenol and formaldehyde to form hydroxymethylphenol in ortho
and para positions, respectively from left to right (Morrel, 2014).
In the second stage of the reaction, upon heating, first linear polymers and then highly-
branched structures are formed (modelled by Halász et al. (2001)). Phenolic alcohols, which
contain reactive hydroxymethylol groups, commonly condense with available reactive
positions in the phenolic ring (ortho or para to the hydroxyl group) to form methylene
bridges. Phenolic alcohols may also condense with other hydroxymethylol groups to form
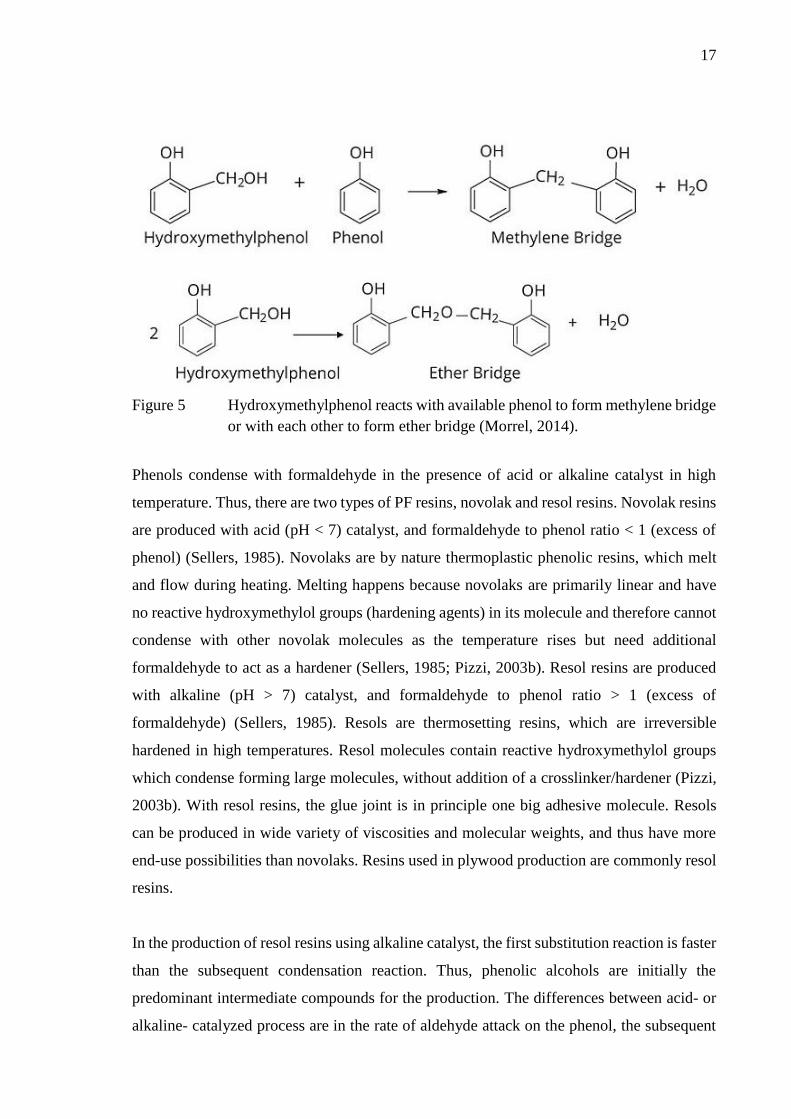
ether links. In both cases water is released. (Pizzi, 2003b; Morrel, 2014) In Figure 5,
methylene bridge and ether bridge are performed.
17
Figure 5 Hydroxymethylphenol reacts with available phenol to form methylene bridge
or with each other to form ether bridge (Morrel, 2014).
Phenols condense with formaldehyde in the presence of acid or alkaline catalyst in high
temperature. Thus, there are two types of PF resins, novolak and resol resins. Novolak resins
are produced with acid (pH < 7) catalyst, and formaldehyde to phenol ratio < 1 (excess of
phenol) (Sellers, 1985). Novolaks are by nature thermoplastic phenolic resins, which melt
and flow during heating. Melting happens because novolaks are primarily linear and have
no reactive hydroxymethylol groups (hardening agents) in its molecule and therefore cannot
condense with other novolak molecules as the temperature rises but need additional
formaldehyde to act as a hardener (Sellers, 1985; Pizzi, 2003b). Resol resins are produced
with alkaline (pH > 7) catalyst, and formaldehyde to phenol ratio > 1 (excess of
formaldehyde) (Sellers, 1985). Resols are thermosetting resins, which are irreversible
hardened in high temperatures. Resol molecules contain reactive hydroxymethylol groups
which condense forming large molecules, without addition of a crosslinker/hardener (Pizzi,
2003b). With resol resins, the glue joint is in principle one big adhesive molecule. Resols
can be produced in wide variety of viscosities and molecular weights, and thus have more
end-use possibilities than novolaks. Resins used in plywood production are commonly resol
resins.
In the production of resol resins using alkaline catalyst, the first substitution reaction is faster
than the subsequent condensation reaction. Thus, phenolic alcohols are initially the
predominant intermediate compounds for the production. The differences between acid- or
alkaline- catalyzed process are in the rate of aldehyde attack on the phenol, the subsequent

18
condensation of the phenolic alcohols and the nature of the condensation reaction. (Pizzi,
2003b)
Resol resins have three stages describing their curing and solubility. A-stage resol is initial
resol, the product of resin cooking. Initial resols are flowing, having low molecular weight,
and they are soluble in water and organic solvents like alcohols. Initial resols withstand
extensive environmental factors (Sellers, 1985). When A-stage resol is heated, it turns into
more viscous and swollen form as the molecular crosslinking initiates, and it is insoluble.
This B-stage resol is called resitol and it is an intermediate stage. C-stage resol, resite, is
achieved by further heating. Resites are greatly polymerized, having high molecular weight,
totally insoluble and thermoset, they do not swell or melt anymore (Sellers, 1985).
Mildly condensed liquid resols have on average less than two phenolic nuclei in the
molecule, whereas solid resols have on average 3-4, but with wider distribution of molecular
sizes. In resols, small amounts of phenol, phenolic alcohols, formaldehyde and water are
also present. Heating causes crosslinking through uncondensed phenolic alcohol groups, and
possibly through reaction of formaldehyde liberated by the breakdown of the ether links.
(Pizzi, 2003b)
Resol condensation (polymerization) reactions depend on resin cooking conditions: molar
ratio of formaldehyde to phenol (F:P), temperature, reaction time, pH, the catalyst (Sellers,
1985) and dry matter content (DMC) of the resin. The higher the F:P ratio, the more
branched/crosslinked structure of the adhesive, and thus better strength and moisture
resistance properties (Sellers, 1985). As an alkaline catalyst for resols for plywood
production, sodium hydroxide (NaOH) is preferred, since it has better water solubility than
for example ammonia-, ammine- and amide-catalyzed phenolic resins. So, sodium
hydroxide maintains the solubility (Pizzi, 2003b) and reduces viscosity (Sellers, 1985) of the
PF resin. The amount of sodium hydroxide also affects the chemical reactivity, speed of cure
and dry-out resistance. The dosage of catalyst can be done in 1-3 phases, so also the
polymerization happens in 1-3 phases. Temperature is the second catalyst for the
polymerization reaction, thus determining the polymer structure of the resin and the curing
speed. The reaction temperature is 80-100 °C (Pizzi, 1994). The DMC affects also the

19
polymerization rate and viscosity of the resin. The reaction time is 1-8 h depending on pH,
F:P ratio, temperature and possible presence of reaction retarders (Pizzi, 1994).
Viscosity of the resin is in relation to polymerization rate. As the polymerization proceeds,
viscosity increases (Morrel, 2014), but the polymerization time has to be sufficient for
molecules to react. The polymerization time and number of polymerization phases affect the
free formaldehyde content of the finished resin and the strength of the polymer structure.
Also stable and efficient mixing of the resin during cooking is critical to ensure controlled
and uniform cross-linking. By lowering the temperature, polymerization can be slowed
down, and higher temperature accelerates the reaction. When the desired viscosity of the
resin has been reached, the temperature is lowered, which stops the polymerization reaction
at the point where the resin is still water-soluble and reactive (Pizzi, 1994). The desired
viscosity is determined based on end-use application of the resin. In the plywood hot-press,
high temperatures are again applied, which allows resin to cure to final C-stage (Sellers,
1985).
Depending on the end-use application, the resin composition varies. Demands for resins may
vary between plywood mills or between countries and continents depending on the final
product (characteristics and requirements based on standards), known technologies for
adhesive application (rollers, curtain, spray or extruder coater) and used raw materials (costs
and availability, for example typically used wood species). Typical resol resin composition
for application in plywood production is presented in Table I (Sellers, 1985).
Table I Typical resol resin chemical ratios and composition for application in
plywood production (modified from Sellers (1985)).
Chemical ratios mol ratio range
F:P 1,9-2,2
NaOH:P 0,4-0,6
Composition DMC % range
PF (excluding NaOH) 25-35
NaOH 2,5-9,5
Starch 0,1-1,0

20
Urea 0-5,0
Methanol 0-4,0
Tackifier 0,01-0,05
Anti-foam agent 0,005-0,1
Plasticizer 0,05-0,5
Wetting agent 0,005-0,1
Curtain additives 0-1,0
Total 40-45
For softwood (conifer) plywood, higher resin alkali content and higher molecular weight are
required when compared to hardwood (broadleaved tree) plywood resin. Thus, softwood
plywood cure at faster rate and hardwood plywood requires longer pressing time. On the
other hand, the cold-press tack (preliminary adhesion) is not as good with hardwood than
with softwood. (Pizzi, 2003b)
3.2 Properties of PF resins
The most remarkable resin properties are viscosity, dry matter content (DMC), pH and gel
time (Sellers, 1985). These properties have an effect on resin end-use possibilities, as already
reviewed in resin cooking conditions. Typically, resins for plywood have DMC of 40-45 %
and viscosity of 150-600 cP at 25 °C (Pizzi, 2003b). Other properties are alkalinity, free
formaldehyde content, phenol and methanol content, molar mass and conductivity.
Properties of PF resins are modified in order to achieve mill specific regulations by varying
the resin composition and cooking conditions.
Special additives may also be added to resin composition to meet performance requirements.
Some commercially utilized chemical additives and their effect on PF resin properties are
summarized in Table II. Additives are a raw material cost, which are desired to be avoided
or minimized to reduce production costs. For example, plasticizers and tackifiers are usually
avoided unless absolutely needed (Sellers, 1985). However, additives are a simple way to
obtain specific properties, and usually the required amount of additive is not high (Table I).
Too high amount of additive causes adverse effects on PF resin performance. Curtain coating
adhesives require special additives and relatively high amount of them, because stable
curtain formation is a challenge hard to overcome with only resin composition adjustments
21
(Sellers, 1985). Additives must be compatible in the resol PF resin environment, for example
high alkalinity (Seller, 1985).
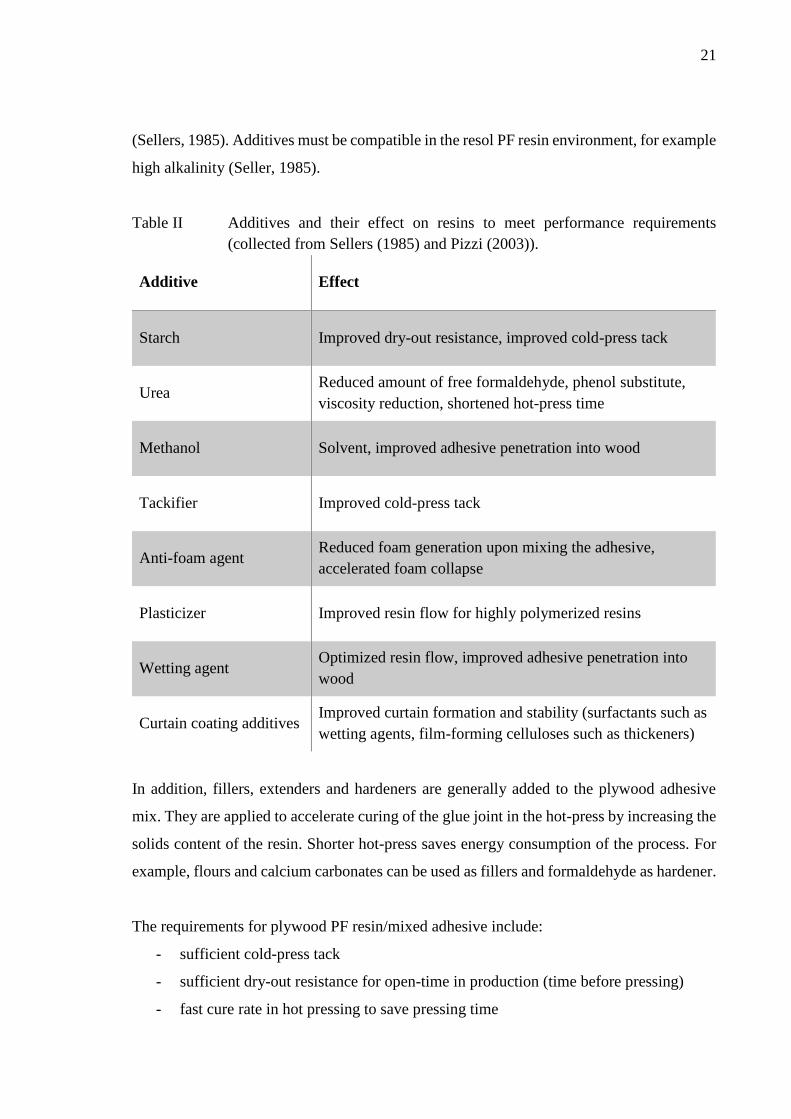
Table II Additives and their effect on resins to meet performance requirements
(collected from Sellers (1985) and Pizzi (2003)).
Additive Effect
Starch Improved dry-out resistance, improved cold-press tack
Urea Reduced amount of free formaldehyde, phenol substitute,
viscosity reduction, shortened hot-press time
Methanol Solvent, improved adhesive penetration into wood
Tackifier Improved cold-press tack
Anti-foam agent Reduced foam generation upon mixing the adhesive,
accelerated foam collapse
Plasticizer Improved resin flow for highly polymerized resins
Wetting agent Optimized resin flow, improved adhesive penetration into
wood
Curtain coating additives Improved curtain formation and stability (surfactants such as
wetting agents, film-forming celluloses such as thickeners)
In addition, fillers, extenders and hardeners are generally added to the plywood adhesive
mix. They are applied to accelerate curing of the glue joint in the hot-press by increasing the
solids content of the resin. Shorter hot-press saves energy consumption of the process. For
example, flours and calcium carbonates can be used as fillers and formaldehyde as hardener.
The requirements for plywood PF resin/mixed adhesive include:
- sufficient cold-press tack
- sufficient dry-out resistance for open-time in production (time before pressing)
- fast cure rate in hot pressing to save pressing time
22
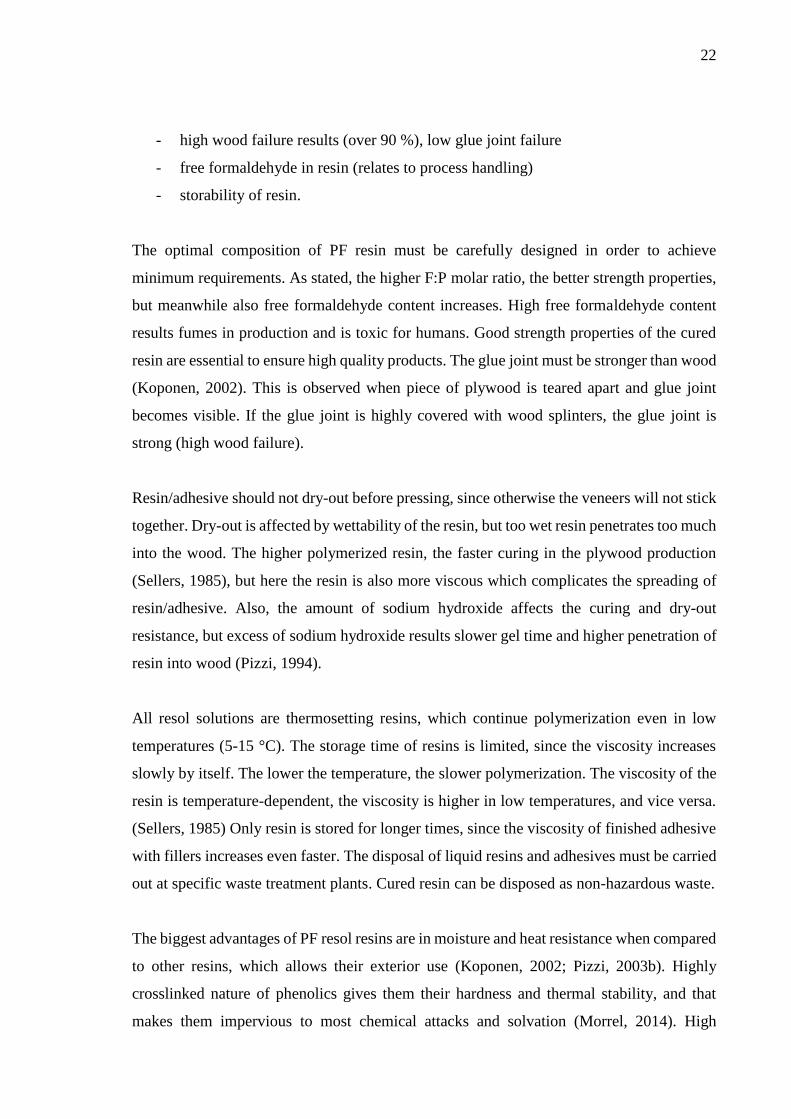
- high wood failure results (over 90 %), low glue joint failure
- free formaldehyde in resin (relates to process handling)
- storability of resin.
The optimal composition of PF resin must be carefully designed in order to achieve
minimum requirements. As stated, the higher F:P molar ratio, the better strength properties,
but meanwhile also free formaldehyde content increases. High free formaldehyde content
results fumes in production and is toxic for humans. Good strength properties of the cured
resin are essential to ensure high quality products. The glue joint must be stronger than wood
(Koponen, 2002). This is observed when piece of plywood is teared apart and glue joint
becomes visible. If the glue joint is highly covered with wood splinters, the glue joint is
strong (high wood failure).
Resin/adhesive should not dry-out before pressing, since otherwise the veneers will not stick
together. Dry-out is affected by wettability of the resin, but too wet resin penetrates too much
into the wood. The higher polymerized resin, the faster curing in the plywood production
(Sellers, 1985), but here the resin is also more viscous which complicates the spreading of
resin/adhesive. Also, the amount of sodium hydroxide affects the curing and dry-out
resistance, but excess of sodium hydroxide results slower gel time and higher penetration of
resin into wood (Pizzi, 1994).
All resol solutions are thermosetting resins, which continue polymerization even in low
temperatures (5-15 °C). The storage time of resins is limited, since the viscosity increases
slowly by itself. The lower the temperature, the slower polymerization. The viscosity of the
resin is temperature-dependent, the viscosity is higher in low temperatures, and vice versa.
(Sellers, 1985) Only resin is stored for longer times, since the viscosity of finished adhesive
with fillers increases even faster. The disposal of liquid resins and adhesives must be carried
out at specific waste treatment plants. Cured resin can be disposed as non-hazardous waste.
The biggest advantages of PF resol resins are in moisture and heat resistance when compared
to other resins, which allows their exterior use (Koponen, 2002; Pizzi, 2003b). Highly
crosslinked nature of phenolics gives them their hardness and thermal stability, and that
makes them impervious to most chemical attacks and solvation (Morrel, 2014). High

23
modulus of elasticity, tensile strength, dimensional stability and low flammability are typical
for PF resins.
PF resins used in Finnish plywood production are not toxic. High alkalinity may cause skin
reactions, eye damage and it may be corrosive to metals. However, the main raw materials,
phenol and formaldehyde, are both acutely toxic chemicals (Merck KGaA, 2017a; Merck
KGaA, 2017b). The exposure to phenol and formaldehyde (via skin, mouth or breathing)
causes death, cancer and mutagenic effect, and is a major risk in resin production. Other
disadvantages are non-renewability of raw materials and their relatively high cost. Phenol is
synthetically produced from crude oil and formaldehyde from natural gas, which both are
fossil-based raw materials (Sellers, 1985). Phenol price is related to oil price and fluctuates.
When compared to urea-formaldehyde resins, PF resins require longer pressing times and
the glue joint is dark by color, which makes it visually less attractive (Pizzi, 1994; Dunky,
2003). However, superior durability properties of PF resin enable multiple end-use
possibilities and maintains the PF resin demand.
3.3 Plywood adhesives
Plywood adhesive composes of resin, water, fillers and possible additives. Resin production
is stopped at the point where it is still liquid, reactive and soluble in water (Koponen, 2002).
A typical plywood adhesive composition is presented in Table III (Pizzi and Ibeh, 2014).
Table III Typical plywood adhesive composition (Pizzi and Ibeh, 2014).
Component Parts per hundred resin
Phenolic resin 100
Water 0-20
Filler 5-10
Extender 0-10
Hardener (formaldehyde) 0-5
Solubilizer (NaOH) 0-10
Fillers, extenders and hardeners are used to accelerate the curing of adhesive in hot-press
and to achieve desired viscosity of the adhesive. Fillers increase the solids content of the
resin and addition of formaldehyde (hardener) accelerates the polymerization reaction of the
PF resin. Powder fillers thicken the adhesive. The thickening phenomenon lasts for a few
hours, which must be taken into account in adhesive preparation. Water is added as a solvent
24
to the adhesive composition to adjust the solids content and viscosity to desired values.
Water evaporates in the hot-press, and thus, the solids of the adhesive finally form the glue
joint. Generally, adhesives are mixed daily in the plywood mills, since storing of resins is
more stable. Proper mixing of the adhesive is important, since homogenous composition of
the resin is critical, but generation of foam is undesired. Special additives may be added to
the resin or adhesive composition and are reviewed more precisely earlier in properties of
PF resins. Resins and additives must be compatible to be applied together (for example high
pH must be considered).
Adhesive is spread onto the veneers, where easy application and uniform and sufficient layer
of adhesive is important. Viscosity of the resin is one of the main parameters in adhesive
spreading. Piled up veneers may not be directly pressed, and adhesive must endure the
production open-time without drying. After the cold-press, preliminary adhesion, tack, must
keep the veneer assembly together. In the hot-press, resin polymerization reaction, curing, is
finished. Hardening characteristics of the resin, reactivity and crosslinking, affect the
pressing temperature and time. If the glue joint is wet after pressing, the pressing temperature
is too low and pressing time too short. Adhesive must not be absorbed too much into the
wood. Here, too moist veneer, too low viscosity of the adhesive and too low pressing
temperature affect the glue joint quality. After the press, glue joint must be stronger than
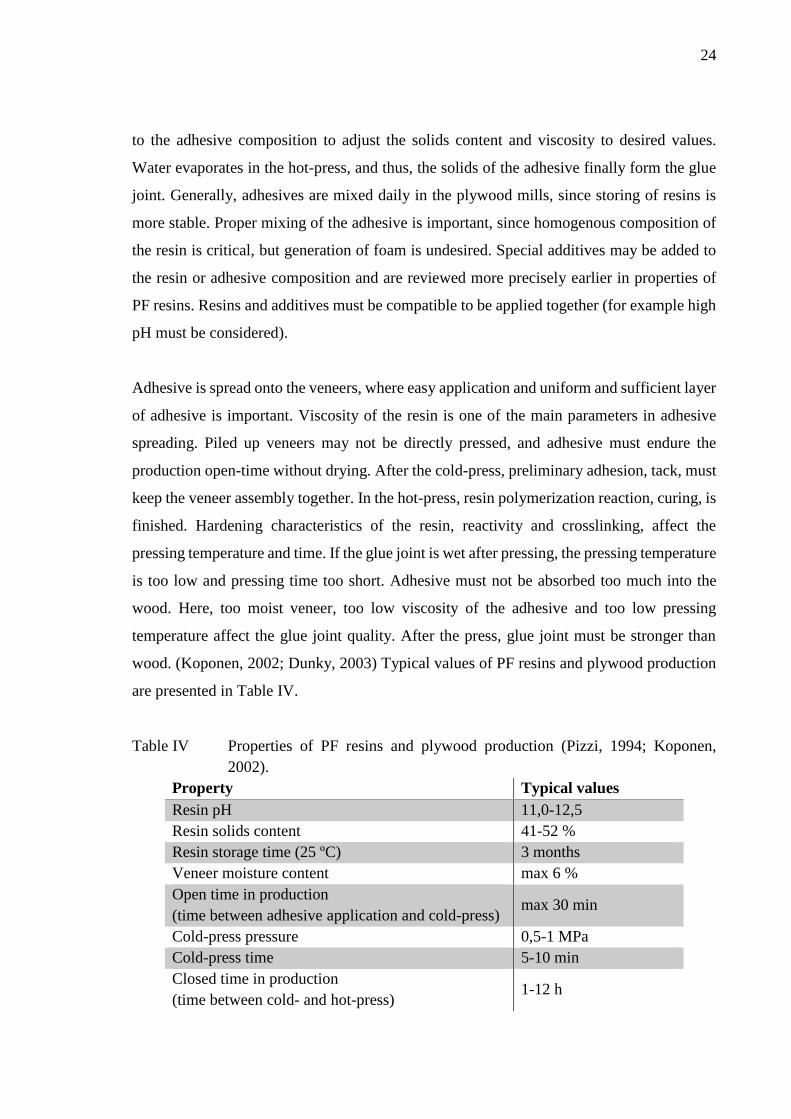
wood. (Koponen, 2002; Dunky, 2003) Typical values of PF resins and plywood production
are presented in Table IV.
Table IV Properties of PF resins and plywood production (Pizzi, 1994; Koponen,
2002).
Property Typical values
Resin pH 11,0-12,5
Resin solids content 41-52 %
Resin storage time (25 ºC) 3 months
Veneer moisture content max 6 %
Open time in production
(time between adhesive application and cold-press) max 30 min
Cold-press pressure 0,5-1 MPa
Cold-press time 5-10 min
Closed time in production
(time between cold- and hot-press) 1-12 h
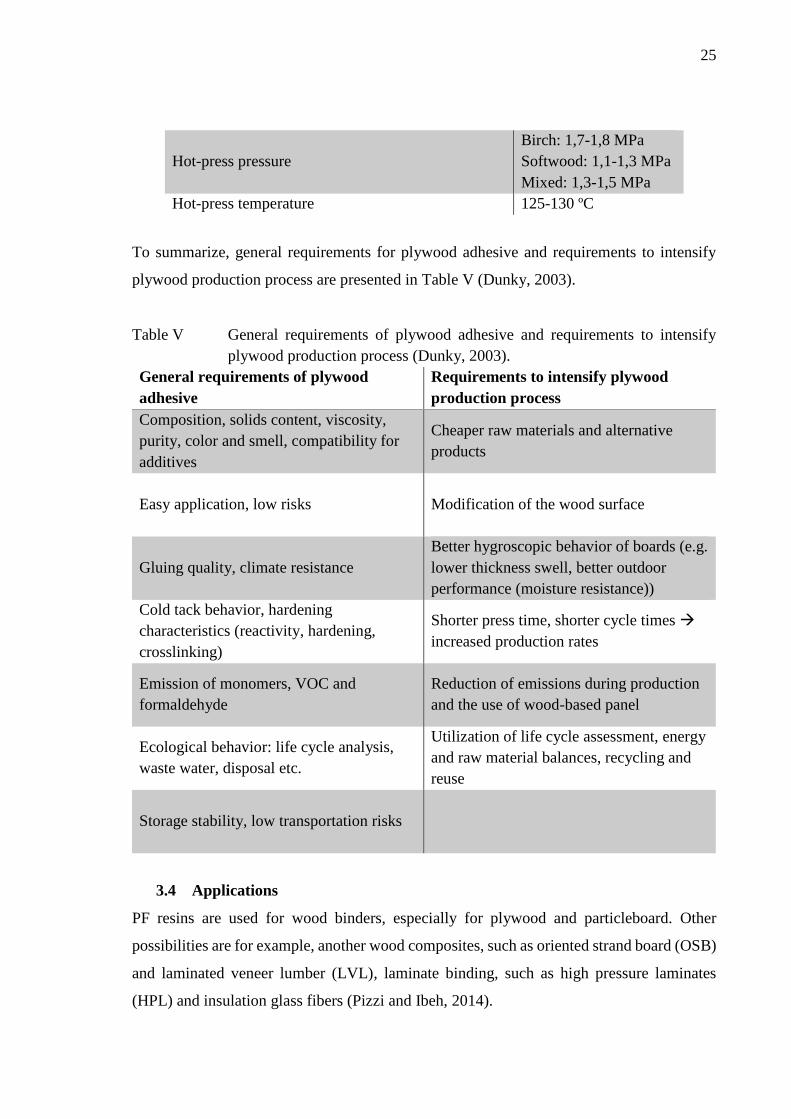
25
Hot-press pressure
Birch: 1,7-1,8 MPa
Softwood: 1,1-1,3 MPa
Mixed: 1,3-1,5 MPa
Hot-press temperature 125-130 ºC
To summarize, general requirements for plywood adhesive and requirements to intensify
plywood production process are presented in Table V (Dunky, 2003).
Table V General requirements of plywood adhesive and requirements to intensify
plywood production process (Dunky, 2003).
General requirements of plywood
adhesive
Requirements to intensify plywood
production process
Composition, solids content, viscosity,
purity, color and smell, compatibility for
additives
Cheaper raw materials and alternative
products
Easy application, low risks Modification of the wood surface
Gluing quality, climate resistance
Better hygroscopic behavior of boards (e.g.
lower thickness swell, better outdoor
performance (moisture resistance))
Cold tack behavior, hardening
characteristics (reactivity, hardening,
crosslinking)
Shorter press time, shorter cycle times
increased production rates
Emission of monomers, VOC and
formaldehyde
Reduction of emissions during production
and the use of wood-based panel
Ecological behavior: life cycle analysis,
waste water, disposal etc.
Utilization of life cycle assessment, energy
and raw material balances, recycling and
reuse
Storage stability, low transportation risks
3.4 Applications
PF resins are used for wood binders, especially for plywood and particleboard. Other
possibilities are for example, another wood composites, such as oriented strand board (OSB)
and laminated veneer lumber (LVL), laminate binding, such as high pressure laminates
(HPL) and insulation glass fibers (Pizzi and Ibeh, 2014).
26
In particleboards, wood chips are generally sprayed with resin, a chip mat is formed and
pressed (Pizzi, 2003b). Particle board resins should thus have relatively low viscosity and
strongly pseudoplastic behavior is preferred (BASF, 2016). Also for OSB resin, lower
viscosity is preferred and for example urea may be added to resin composition to reduce
viscosity (Winterowd et al., 2010). Laminate resins differ remarkably from wood binding
resins. Laminate is composed of stacked, resin impregnated papers. In resin production, it is
not desired to form large polymer chains, the molecular weight and viscosity are kept low.
This is achieved by one polymerization step, cooking in low temperature and long cooking
time, in addition to calm mixing. This way efficient impregnation is achieved.
Phenolic resins can also be applied for example in binding of foundry molds (resol and
novolak resins) and together with other resins (urea-formaldehyde and/or melamine-
formaldehyde) (Pizzi, 2003b). PF resins can be for example applied into the core layers of
multi-layer wood composites and laminates, and other resins can be used for binding the
surface layers. Thus, finished product has good strength and moisture resistance properties,
but the dark color of PF resin can be avoided in the surface.
4 LIGNIN-PHENOL-FORMALDEHYDE RESIN
Lignin is the second most abundant biopolymer after cellulose, located in the cell walls of
plants. However, lignin is largely ignored as a raw material. Purified lignin contains high
number of functional hydroxyl groups, which makes it an attractive target for research and
development (R&D) of new bio-based alternatives for fossil-based chemicals, transportation
fuels, carbon fibers etc. (Alén, 2011; Valmet, 2018). The principles of sustainable
development promote utilizing renewable raw materials energy and cost efficiently.
Application of lignin perfectly fits for this purpose and offers multiple end-use possibilities.
Next, lignin and its application in resins are studied.
4.1 Lignin
Lignin is a wood cell structural component in addition to carbohydrates (cellulose and
hemicellulose). Non-structural components (extractives, some water-soluble organics and
inorganics) represent a minor fraction of wood cells and are mostly composed of low-

27
molecular weight compounds, largely situated outside the cell wall. In the wood cell wall,
also some small amounts of pectins, starch and proteins are present. (Alén, 2011)
The distribution of structural components varies between the different parts of the tree and
wood species. Stem wood is the biggest part of the wood generally utilized for pulping. Stem
wood cellulose, hemicellulose and lignin contents of the wood dry matter content are
approximately 40-45 %, 25-35 % and 20-30 %, respectively. Softwood usually contain less
hemicellulose and more lignin than hardwood. A typical chemical composition of dry stem
wood is presented for both softwood and hardwood in Table VI. It can be concluded that
high molecular mass substances compose 95 % of the wood dry matter and low molecular
mass substances 5 %. Tropical species usually contain more extractives and tropical
hardwood contain more lignin.
When compared to bark of the wood, the amount of extractives, organics and inorganics is
multiple and the amount of structural components is 40-70 %. Forest residue is more similar
to stem wood. With bark and forest residue, the variation between different species is
stronger. Lignin is also available from other plants, referred as non-wood lignocellulosic
materials. These are classified into agricultural residues (for example sugar cane bagasse and
rice straw), natural-growing plants (for example bamboo and reeds) and non-wood crops
grown primarily for their fiber content (for example bast fibers such as jute and hemp). An
average chemical composition of bark, forest residue and non-wood feedstock are presented
in Table VI.
Table VI Chemical composition of dry stem wood for softwood and hardwood, bark
(inner and outer bark), forest residue and non-wood feedstock as percentages
of the feedstock dry matter content (collected from Alén (2011)).
Component Softwood
(pine)
Hardwood
(birch) Bark
Forest
residue
Non-wood
feedstock
Cellulose 40-45 % 40-45 % 20-30 % 35-40 % 30-45 %
Hemicellulose 25-30 % 30-35 % 10-15 % 25-30 % 20-35 %
Lignin 25-30 % 20-25 % 10-25 % 20-25 % 10-25 %
Extractives 3,5 % 3,5 % 5-20 % ~ 5 % 5-15 %
Other organics ~ 1 % ~ 1 % 5-20 % ~ 3 % -
Inorganics 0,5 % 0,5 % 2-5 % ~ 1 % 0,5-10 %
Proteins - - - - 5-10 %
28
A plant cell (wood cell is called fiber) is hollow. The cell wall composes of two layers.
Lumen, central cavity, is surrounded by relatively thick secondary wall layer, which further
composes of three sublayers, S3, S2 and S1, respectively from inside outwards. Sublayers are
separated based on the orientation of their structural elements (microfibrils) and, to some
extent, the chemical composition. Secondary wall layer is surrounded by thin primary wall.
Between adjacent cell primary walls, middle lamella is located. (Alén, 2011)
The middle lamella between the cells and primary wall of the cell composes mostly of lignin
(65 % of the total dry matter content of the layers, softwood) and secondary wall of
polysaccharides (75 % of the total dry matter content of the sublayers, softwood). However,
since the S2 sublayer is the thickest sublayer, most of lignin is actually located in there. (Alén,
2011) From this it can be concluded, that the function of lignin in wood is to bind fibers
together by filling the space between the cells, and to bind cellulose and hemicellulose
together in secondary cell wall. Lignin has complex, three-dimensional structure which
contributes to this function. Highly cross-linked structure offers durability, mechanical
strength and resistance to moisture, UV-radiation and bacterial and fungal attack (Mattinen,
2016).
Lignin is by nature amorphous, heterogenous, hydrophobic, complex polymer. Lignin
aromatic structural elements, phenylpropane units, are cross-linked randomly. (Mattinen,
2016) There are two major classes of lignins: native lignins and technical lignins. Native
lignins can by further divided based on their natural origin and lignin type:
- softwood lignin, referred as guaiacyl lignin
- hardwood lignin, referred as guaiacyl-syringyl lignin
- grass lignin, referred also as guaiacyl-syringyl lignin, but includes also p-
hydroxyphenyl derivatives.
Terms guaiacyl and guaiacyl-syringyl lignins originate from the three basic p-
hydroxycinnamyl alcohols, from which the structural elements are derived for each lignin
type (Alén, 2011; Mattinen, 2016). Majority of lignin structural building blocks are bonded
by either ether linkages (C-O-C) or carbon-carbon linkages (C-C). In addition to these,
numerous miscellaneous linkages and minor structures are known.

29
Technical lignins are industrial by-products, mainly from chemical pulping. Technical
lignins are generally the raw materials for the new generation lignin-based products. The
whole tree is desired to convert into attractive end-products. Thus, lignin separation
technologies have been developed to be integrated with pulp mills, where conventionally
only cellulose and hemicellulose are utilized as pulp. Lignin supply scale-up is thus
relatively simple. Technical lignins are (Alén, 2011):
- kraft lignin (sulphate lignin), derived from kraft (sulphate) pulping of wood
- alkali lignin (soda lignin), derived from soda-AQ pulping of wood
- lignosulphonates, derived from sulphite pulping of wood
- organosolv lignin, derived from organic solvent pulping of wood
- acid hydrolysis lignin, derived from acid hydrolysis processes of wood.
Kraft lignin is the most essential technical lignin to be used as raw material since its
availability from kraft pulping, which is the most widely used pulping technology
worldwide.
One known, commercial example of lignin separation technologies is LignoBoost process
offered by Valmet. LignoBoost is developed to produce kraft lignin from black liquor. In
conventional kraft pulping, lignin is dissolved into the cooking liquor, white liquor,
containing mainly sodium hydroxide and sodium sulphite. Thus, cellulose and hemicellulose
fibers are cleaved. The cooking liquor turns into black liquor, of which dry matter content
approximately 25-31 % is lignin (Alén, 2011). Black liquor is concentrated into higher solids
content and burned, since the calorific value is high. With LignoBoost process, the black
liquor is taken from the evaporation plant, and lignin precipitated with carbon dioxide (CO2).
Lignin is then dewatered, conditioned with acidified wash water and again dewatered,
resulting practically pure lignin cakes. Lignin is usually dried to desired solids content (for
example 65-95 %). LignoBoost increases the capacity of the black liquor evaporation
recovery boiler. Produced lignin is suitable for production of biochemicals, for sulphonation
and removing odorous compounds is possible. LignoBoost plants currently operate at
Domtar (USA) and StoraEnso (Finland). (Valmet, 2018)
Lignin functional groups are methoxyl, phenolic and aliphatic hydroxyl groups and some
terminal aldehyde groups in the side chain. Relatively few phenolic hydroxyl groups are
free, because they tend to bond with adjacent phenylpropane units. (Alén, 2011) Lignin has

30
antioxidant property from the radical scavenging capacity of phenolic groups, and lignin can
act as thermoplastic or thermosetting material due to its aromatic structure (Mattinen, 2016).
Detailed chemical structure of lignin remains unsolved, since the isolation of lignin always
causes partial degradation of lignin. Lignin has complex, irregular structure. Multiple
different schemas of lignin chemical structure have been proposed (Figure 6). Lignin has
variable molecular size due to random cross-linking of the polymer originating from radical-
coupling reactions between phenolic radicals (Calvo-Flores and Dobado, 2010).
Figure 6 Chemical structure of lignin (Glazer and Nikaido, 1995).
Since technical lignins are abundantly available from pulping processes, the price of lignin
is profitable. Lignin as a bio-based, renewable and sustainably sourced raw material is an
attractive alternative for fossil-based chemicals. It is also non-toxic, which is a remarkable
advantage for process safety. Complex structure of lignin is both a possibility and a
disadvantage. Research and development of lignin-based products is challenging, because
the precise chemical structure is not known and thus the compatibility to replace
conventional chemicals or other raw materials is not known. Also, the lignin raw material

31
feedstock is not as constant as with synthetic chemicals. This may result variation also in the
end-product quality. On the other hand, wide variety of functional groups enable multiple
end-use possibilities. Complex structure also is the basis for durability and mechanical
strength.
4.2 Applications
The most essential source of lignin is black liquor from pulping process, since this way the
wood components are completely utilized, and an effective separation technology for lignin
exists (LignoBoost). Apart from burning the black liquor as bioenergy, black liquor has been
used only for a few applications. However, since the economic and environmental potential
of lignin has been noticed, new end-use possibilities have been widely screened and
developed.
Earlier, lignin application has focused on using lignosulfonates. Lignosulphonates can be
used as binders, dispersant agents for pesticides, emulsifiers and heavy-metal sequestrants.
They can for example stabilize emulsions of unmixed liquids (asphalt emulsions, pesticide
formulations, wax emulsions, pigments and dyes) making them highly resistant to break-
down and low toxicity allows their use as binders in animal feed and soil stabilizers in
agriculture. (Calvo-Flores and Dobado, 2010) Synthetic vanillin and dimethylsulfoxide are
also well-known products derived from lignin, but they have only relatively low market
volume (Holladay et al., 2007).
Opportunities of lignin utilization has been categorized by Holladay et al. (2007) and are
presented in Table VII. The focus is nowadays more in high-value products (macromolecules
and aromatics), such as low-molecular-weight (LMW) compounds as an alternative for
petrochemical industry and active carbon and carbon fibers (Calvo-Flores and Dobado,
2010).

32
Table VII End-use opportunities of lignin (collected from Holladay et al. (2007)).
Product type Characteristics Examples
Power, fuel and syngas Lignin used as a carbon
source
Heat, power,
methanol/dimethyl ether,
green gasoline via Fischer-
Tropsch technology, mixed
alcohols
Macromolecules
Lignin isolated as natural,
high-molecular weight
molecule
Vanillin,
dimethylsulfoxide, carbon
fiber, composites,
copolymers, resins,
adhesives
Aromatics and
miscellaneous monomers
Lignin macromolecular
structure degraded but
aromatic nature maintained
Benzene, toluene, xylene,
phenol, lignin monomer
molecules, oxidized lignin
monomers, diacids, polyols
Lignin as a copolymer can be utilized either directly or chemically modify lignin beforehand.
Due to its aromatic nature, lignin can be incorporated into a wide range of reactions, such as
alkylation, methylolation, sulfonation, oxidation and reduction. Without modification lignin
can be used in phenol-formaldehyde (PF) resins as a filler, in polyolefin (polyethylene or
polypropylene) or polyester polymers, as a source for polyurethanes (polyethylene or
polypropylene glycols) and bio-plastics (Calvo-Flores and Dobado, 2010). Chemical
modification contributes to determination of lignin functional groups. Chemically modified
lignin can be used in PF resins as a substitution to phenol. Chemical modification activates
lignin by introducing more reaction sites towards formaldehyde.
Incorporation of lignin into biopolymer adhesives as a reinforcement for biocomposites has
gained maybe most of the R&D interest. Complex structure and reactivity of lignin usually
challenge the blending of lignin with other polymers. Thus, focus is also in improvement of
mixing properties, and in thermal and mechanical strength enhancements. (Mattinen, 2016)
Nonetheless, there are only a few commercial examples of utilization of lignin in modern
day applications. UPM’s WISA® BioBond plywood products have been glued with
adhesive containing LPF resin and it is in industrial scale use. In the adhesive, 50 % of the
used phenol is replaced by kraft lignin and the adhesive retains the same high-quality

33
properties as conventional PF resin-based adhesives. The proportion could be further
increased with BioPivaTM lignin. (UPM Biochemicals, 2018; WISA BioBond, 2018)
Lignin as a raw material has been studied over a century and amount of research required
demonstrates the complexity of lignin utilization. New technologies to convert lignin
economically into high-quality end-products are required. When the commercial
applications expand, supply of lignin can be easily multiplied, since lignin separation plant
is relatively simply to integrate next to a conventional pulp mill. There are approximately 70
million tons of lignin annually available only from the pulp mills, of which only a couple of
percentages are used commercially (Dunky, 2003).
4.3 Production of LPF resin
Due to large consumption and rising prices of fossil resources, increasing concern and
awareness of environmental issues, lignin utilization as phenol substitution in phenol-
formaldehyde (PF) resins has been widely considered. This is due to its amorphous and
aromatic nature, structural phenylpropane units somehow comparable to phenol. During
pulping and isolation of lignin from black liquor, lignin structure degrades but also lignin
water solubility is enabled (Pizzi, 1994). Other possible bio-based alternatives for wood
adhesives are for example tannins, proteins, carbohydrates or unsaturated oils.
Direct reaction of raw lignin with phenol and formaldehyde has performed lignin acting
more like a filler in adhesive composition rather than as a substitute for phenol. This is due
to low reactivity of lignin (macromolecule) when compared to small molecule phenols,
which contain more reactive sites for polymerization reactions (Mattinen, 2016). Practically,
the reactive sites of lignin are already filled. Lignin has only approximately 0,3 reactive sites
in phenylpropane unit, whereas phenol has three reactive sites (Hu et al., 2011; Mankar et
al., 2012), and in addition, those reactive sites may be filled with functional groups.
Rather low-molecular-weight (LMW) lignin should be used in production of lignin-phenol-
formaldehyde (LPF) resins. It can be assumed to be less cross-linked, having naturally more
reactive sites free towards formaldehyde. This has been recognized for example by McVay
et al. (1993), who concluded that LMW lignin has higher reactivity and lower viscosity than
high-molecular-weight (HMW) lignin. Low viscosity of the lignin contributes less to

34
viscosity development of the phenolic resin. LMW lignin was obtained by two-step
ultrafiltration process. However, technical lignins available generally have high-molecular-
weight. Softwood lignins are easier to utilize into PF resins due to open ortho positions in
the chemical structure (Mankar et al., 2012). Lignin can be added at the beginning or during
the cooking procedure, or at the end of the condensation reaction (with a following reaction
step between the lignin and the phenolic resin) (Pizzi and Ibeh, 2014).
As a solution for low reactivity of lignin, methods to chemically modify lignin prior the
application into the resin have been developed. Modification increases the chemical
reactivity of lignin hydroxyl groups, number of reactive sites in lignin towards formaldehyde
or depolymerizes lignin. Modification fastens the polymerization reaction of lignin and
formaldehyde and improves strength properties of the finished adhesive. Most studied lignin
modification methods are methylolation (also known as hydroxymethylation and
hydroxyalkylation), demethylation (also known as dealkylation) and phenolation (Hu et al.,
2011: Laurichesse and Avérous, 2014).
Methylolation introduces hydroxymethyl (-CH2OH) groups to lignin molecule.
Methylolation is performed in alkaline medium, where lignin reacts with formaldehyde.
Major advantage of this method is direct incorporation into PF resol resin preparation. In
phenolation of lignin, phenol condensates with lignin aromatic rings and side chains. As a
result, lignin molecular weight is reduced, and reactive sites are emerged. Phenolation is
performed on acidic medium and used especially for lignosulfonates. After phenolation of
lignin, it is possible to produce both resol and novolak PF resins. Demethylation treatment
removes methyl groups from blocking the reactive aromatic hydroxyl groups in lignin
structure. Demethylation is sulfur-mediated in alkaline medium, and it is possible to remove
one or both methyl groups ortho to phenolic hydroxyl group. (Hu et al., 2011: Laurichesse
and Avérous, 2014)
Another method for increasing the reactivity of lignin is alkalation of lignin (Pietarinen et
al., 2014). In alkalation, lignin is first treated with hydroxide of an alkali metal (for example
NaOH), and heated. It is possible to combine phenolation prior to alkalation or
hydroxymethylation after the alkalation. Alkalation as a method for increasing the reactivity
of lignin has been used especially for plywood adhesive production (Pietarinen et al., 2014).
35
So, in the production of LPF resins, modification of lignin beforehand has been proved
profitable. It would be advantageous, if lignin modification could be integrated into the resin
production process as a first processing step, which is possible at least with methylolation,
phenolation and alkalation methods (McVay,1993; Raskin et al., 2001; Pietarinen et al.,
2014). McVay (1993) used hydroxymethylation for softwood kraft lignin to increase
reactivity prior to PF resin preparation. For hardwood kraft lignin, phenolation was used for
lignin prior to PF resin preparation. Resin production should result a resin with same
properties than conventional PF resin, which would enable functionable adhesive mixing,
spreading and curing in plywood production.
Still, partial substitution of phenol with lignin has been challenging. For example,
modification of organosolv lignin with methylolation, use of lignin separated from
eucalyptus (by acetosolv delignification), oil palm (by kraft and soda pulping), jute sticks
and grass (by soda pulping), use of unmodified or modified kraft lignin (Mankar et al., 2012),
lignosulphonates or pulping liquors (Pizzi, 1994) are widely studied methods to replace
phenol in PF resins. However, during modification, undesirable side reactions may occur
(Laurichesse and Avérous, 2014), highly acidic conditions (especially required for
lignosulphonates modification) may be corrosive to steel reactors (Pizzi, 2003a) and due to
varying lignin feedstock, constant properties for resins are not achieved (Dunky, 2003).
Addition of lignin into resins may affect the resin preparation methods, weaken the adhesive
strength properties, decrease resistance to moisture, slow down the pressing time etc. Also,
lignin function in PF resins has been questioned, whether it actually participates in resin
polymerization reactions, or does it act like a filler despite the addition point and possible
modification (Pizzi and Ibeh, 2014).
In laboratory or pilot scale researches during the past 20 years, approximately 40-70 % of
the weight of the phenol may have been replaced by lignin without remarkable changes in
resin cooking procedures, plywood process conditions or finished resin, adhesive or plywood
quality (Danielson and Simonson, 1998; Pizzi, 2003a; Mankar et al. 2012; Laurichesse and
Avérous, 2014). In patents, approximately 15-30 % of the weight of the phenol replaced by
lignin has been proved successful (Doering, 1992; Raskin et al., 2001; Winterowd et al.,
2010). However, commercialization has not been done extensively.
36
4.4 Properties of LPF resin
The objective of production of lignin-phenol-formaldehyde (LPF) resins is to achieve the
same properties for LPF resin than to conventional phenol-formaldehyde (PF) resins without
lignin. It is desired, that the LPF resin production process does not differ remarkably from
PF resin production process to ensure efficiency. The major differences of LPF resin
production process and properties to PF resins reported are higher viscosity and slower
curing (McVay, 1993).
Generally available high-molecular-weight (HMW) lignin has relatively high viscosity,
which results rapid viscosity development of the resin during cooking. Thus, polymerization
of the resin may not be as developed as with PF resins, even though the same viscosity is
achieved. Viscosity development must be hindered by lower temperature and calm mixing
to control and ensure uniform crosslinking of the substances in resin mixture. Polymerization
degree affects the curing time of the resin, since more polymerized resin cures faster.
Complete substitution of phenol with lignin in PF resins has been hindered due to these
challenges, but research and development is continuing to achieve higher substitution
portions.
These phenomena have been reported for example by Peng and Riedl (1994), Danielson and
Simonson (1998) and Pizzi (1994; 2003a). Peng and Riedl (1994) studied chemical kinetics
(reaction rate and reaction rate constant) of curing reaction of PF resins mixed with
ammonium salt lignin or methylolated ammonium salt lignin fillers. The chemical kinetics
are related to increase of number average molecular weight (Mn). It was discovered, that
viscosity is closely related to weight average molecular weight (Mw). Cure rate of the resin
decreased by the increasing the amount of lignin fillers.
Danielson and Simonson (1998) noticed more rapid viscosity development of LPF resin
when compared to PF resin when producing resin with 50 % phenol substitution with
unmodified kraft lignin. LPF resin polymerization was controlled by lowering the resin
cooking temperature and prolonging the cooking time. LPF resin also required 1 minute
longer hot-pressing time of plywood (or higher temperature), but resulted similar or better
end-product properties than with conventional PF resin.
37
Pizzi (1994; 2003a) reported successful 30 % substitution of phenol with methylolated
lignin, when producing plywood resin, without any performance changes. It was stated, that
there is a possibility to increase the amount of substitution by prolonging the pressing time
and increasing pressing temperature. It can be concluded, that curing of LPF resin differs to
conventional PF resins, and longer pressing times and higher pressing temperatures are
generally required.
5 CURTAIN COATING
Plywood is wood product used for furniture and building material. Plywood composes of
thin (for example 1,5 mm thick) wood sheets, veneers, onto which adhesive is spread.
Adhesive spreading methods can be categorized to contact and non-contact methods. Curtain
coating is one of the non-contact adhesive application methods. Other used coating methods
are for example rollers (requires mechanical contact) and spraying (non-contact). Next,
plywood production is shortly described, curtain coating as an adhesive spreading method
and properties of suitable curtain coating materials are studied more detailed.
5.1 Principles of curtain coating
In plywood production, adhesive is spread onto one or both sides of the veneers and veneers
are cross-piled to enhance mechanical strength of the finished plywood. The number of
veneers for the plywood assembly depends on the desired thickness of the final product.
Veneer piles are first cold-pressed in room temperature and high pressure and later hot-
pressed in high temperature and differencing pressure zones. The high temperature in the
hot press hardens the adhesive finally. Cold press is usually required because after the cold
press it is possible to store the plywood for 1-12 hours and thus effectively use the capacity
of the hot press. After the cold press the veneers already stick together and are easily
movable. (Koponen, 2002)
Curtain coating is one of the methods to spread the adhesive in plywood production. There
are two main types of curtain coaters, slot and slide applicators, of which the slot applicator
(also known as pressure head curtain coater) is more widely used (Sellers, 1985). In Figure
7, a basic slot curtain coater is presented. The adhesive is pumped up to the applicator head,
and the gap at the bottom of the head is closed. When the adjustable gap opens, the adhesive

38
curtain falls freely down as a thin film. The adhesive curtain settles onto one side of the
veneer, when the veneer moves through the curtain on high speed production line. Excess
adhesive is collected into trough straight under the coating head for re-pumping.
Figure 7 Basic slot curtain coater.
In the assembly phase, the required number of similar, coated veneers are cross-piled and
blank surface veneer is placed on top of the plywood. Then the plywood is pressed. Curtain
coating is recommended especially for thick or varying sizes of veneers, which are
impractical to input through the rollers or would often require roller adjustment (Koponen,
2002).
Range of operational parameters for veneer curtain coating are presented in Table VIII,
collected from Sellers (1985).
Table VIII Range of operational parameters for curtain coating of veneer (Sellers, 1985).
Parameter Range Unit
Width of the applicator
(width of the curtain) 660-2440 mm
Positive displacement pump,
operating pressures 1725-3450 kPa
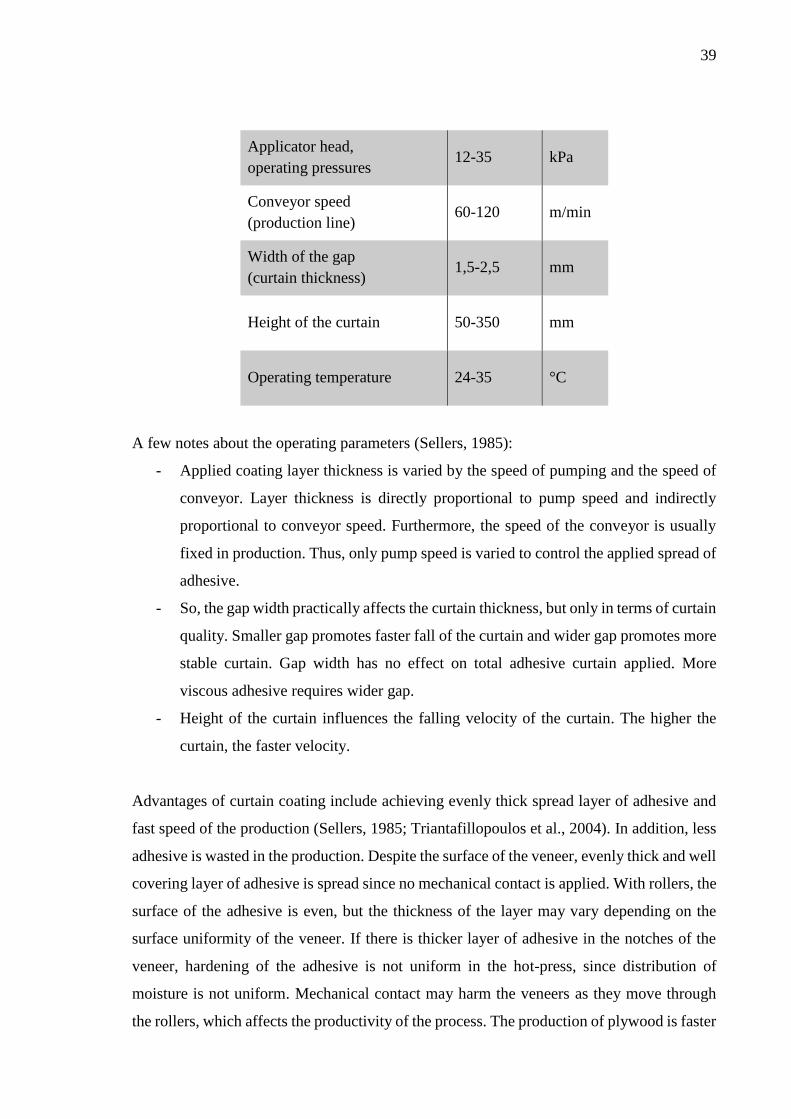
39
Applicator head,
operating pressures 12-35 kPa
Conveyor speed
(production line) 60-120 m/min
Width of the gap
(curtain thickness) 1,5-2,5 mm
Height of the curtain 50-350 mm
Operating temperature 24-35 °C
A few notes about the operating parameters (Sellers, 1985):
- Applied coating layer thickness is varied by the speed of pumping and the speed of
conveyor. Layer thickness is directly proportional to pump speed and indirectly
proportional to conveyor speed. Furthermore, the speed of the conveyor is usually
fixed in production. Thus, only pump speed is varied to control the applied spread of
adhesive.
- So, the gap width practically affects the curtain thickness, but only in terms of curtain
quality. Smaller gap promotes faster fall of the curtain and wider gap promotes more
stable curtain. Gap width has no effect on total adhesive curtain applied. More
viscous adhesive requires wider gap.
- Height of the curtain influences the falling velocity of the curtain. The higher the
curtain, the faster velocity.
Advantages of curtain coating include achieving evenly thick spread layer of adhesive and
fast speed of the production (Sellers, 1985; Triantafillopoulos et al., 2004). In addition, less
adhesive is wasted in the production. Despite the surface of the veneer, evenly thick and well
covering layer of adhesive is spread since no mechanical contact is applied. With rollers, the
surface of the adhesive is even, but the thickness of the layer may vary depending on the
surface uniformity of the veneer. If there is thicker layer of adhesive in the notches of the
veneer, hardening of the adhesive is not uniform in the hot-press, since distribution of
moisture is not uniform. Mechanical contact may harm the veneers as they move through
the rollers, which affects the productivity of the process. The production of plywood is faster

40
and simpler when compared to rollers. Speed of the adhesive application is slower with
rollers, because rotation of big rollers is a restricting factor. With rollers, adhesive is spread
onto both sides of the veneer, so in the assembly phase there is more workload when blank
veneer is placed between the adhesive containing veneers. Simpler production prevents
problems and losses in production, is easy to automatize and reduces maintenance, thus
lowering the production costs (Sellers, 1985; Koponen, 2002).
A major challenge in curtain coating is formation of a stable curtain. This requires special
composition of the coating material and optimized process parameters. Formation of the
curtain is studied next.
5.2 Formation of curtain
When studying the curtain itself, there are three interesting phases to be examined: formation
of the curtain, free fall of the curtain (curtain flow) and collision of the curtain with the base
material (Triantafillopoulos et al., 2004; Beneventi & Guerin, 2005). The curtain must be
stable and uniform to ensure homogenous application of the coating material onto the base
material. The major requirement is that curtain is not supposed to tear at any stage. Rupture
of the curtain results uncovered areas in the base material, which affects the quality of the
finished product.
In curtain coating of paper, an operational window has been presented by applying Reynolds
number (Re) and a speed ratio of the curtain velocity (vc) at the moment of collision to the
base material and the conveyor velocity (u). Reynolds number describes the flow behavior
of the falling curtain, defined for this case (Triantafillopoulos et al., 2004; Birkert et al.,
2006):
𝑅𝑒 =𝜌𝑄
𝜂, (1)
where ρ density of the coating material
Q volumetric flow rate per unit width
η viscosity.

41
Flow rate is defined:
𝑄 = ℎ𝑐𝑣𝑐 , (2)
where hc curtain thickness.
The curtain velocity at the moment of collision with base material can be approximated
(Schweizer, 2004; Birkert et al., 2006):
𝑣𝑐 = √𝑣02 + 2𝑔𝑥, (3)
where v0 nozzle exit velocity of the curtain
g gravitational acceleration
x curtain height, accelerating distance.
For typical industrial curtain heights, v0 is much smaller than the square root term in equation
(3). Thus, v0 can usually be neglected. (Schweizer, 2004)
Operational window for curtain coating (Figure 8) describes the optimal relationship of
process parameters and the challenges related to curtain coating. Outside the operational
window, heel formation, bead pulling and air entrainment take place causing uneven
spreading of the coating material and curtain rupture (Triantafillopoulos et al., 2004).
Operational window can be achieved by modifying the Reynolds number (density and
viscosity of the coating material, flow rate by controlling the pumping) and speed ratio
(height of the curtain, conveyor speed). Weight of the application material and machine
speed has to be suitable, since in paper coating only the required amount of application
material is pumped onto the base paper, and there is no excess material. With low coating
weights, too high and too low machine speeds cause rupture of the curtain. High coating
weights cause overloading of the material at high machine speeds and heel formation at the
collision zone at low machine speeds. (Birkert et al., 2006)

42
Figure 8 Sketch of an operational window for paper curtain coating, Reynolds number
(Re) as a function of ratio of conveyor speed to curtain speed at the moment
of collision (u/vc) (modified from Becerra and Carvalho (2011)).
Thin curtain is vulnerable for surrounding air flows in the production. Slice gap of the curtain
coater is approximately equal to thickness of the curtain. During the curtain fall and
elongation, the curtain becomes thinner. The higher the curtain the more air flow can affect
the curtain. Air bubbles in the curtain material may cause curtain rupture which results
uncovered areas in the base material (Triantafillopoulos et al., 2004). Because of air
entrainment, small air bubbles can remain between the coating and base material, which
affects the quality of finished product. Here, the curtain thickness (slice gap) and height can
be adjusted, and production surroundings can be covered from air flows.
Theoretically there are a few mathematical models to define curtain stability. First, it has
been stated that curtain velocity must be higher than the propagation velocity of the free edge
of the curtain (Triantafillopoulos et al., 2004). Propagation velocity of the free edge (vd)
relates to a hole in the curtain (caused by a disturbance) and its movement. If the hole moves
upstream (vc < vd), the hole will cause curtain rupture. If the hole moves downstream (vc >
vd), the hole will be carried away. Free edge propagation velocity is defined (Schweizer,
2004):
𝑣𝑑 = √2𝜎
𝜌ℎ𝑐, (4)
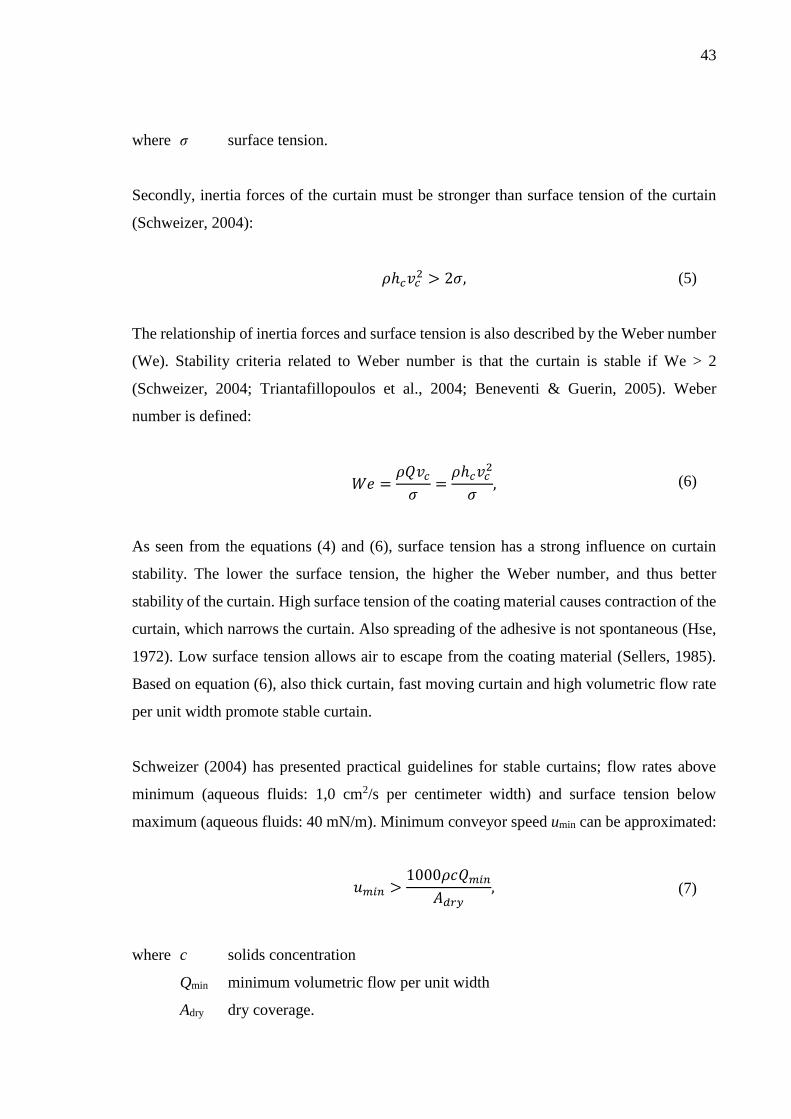
43
where σ surface tension.
Secondly, inertia forces of the curtain must be stronger than surface tension of the curtain
(Schweizer, 2004):
𝜌ℎ𝑐𝑣𝑐2 > 2𝜎, (5)
The relationship of inertia forces and surface tension is also described by the Weber number
(We). Stability criteria related to Weber number is that the curtain is stable if We > 2
(Schweizer, 2004; Triantafillopoulos et al., 2004; Beneventi & Guerin, 2005). Weber
number is defined:
𝑊𝑒 =𝜌𝑄𝑣𝑐
𝜎=
𝜌ℎ𝑐𝑣𝑐2
𝜎, (6)
As seen from the equations (4) and (6), surface tension has a strong influence on curtain
stability. The lower the surface tension, the higher the Weber number, and thus better
stability of the curtain. High surface tension of the coating material causes contraction of the
curtain, which narrows the curtain. Also spreading of the adhesive is not spontaneous (Hse,
1972). Low surface tension allows air to escape from the coating material (Sellers, 1985).
Based on equation (6), also thick curtain, fast moving curtain and high volumetric flow rate
per unit width promote stable curtain.
Schweizer (2004) has presented practical guidelines for stable curtains; flow rates above
minimum (aqueous fluids: 1,0 cm2/s per centimeter width) and surface tension below
maximum (aqueous fluids: 40 mN/m). Minimum conveyor speed umin can be approximated:
𝑢𝑚𝑖𝑛 >1000𝜌𝑐𝑄𝑚𝑖𝑛
𝐴𝑑𝑟𝑦, (7)
where c solids concentration
Qmin minimum volumetric flow per unit width
Adry dry coverage.
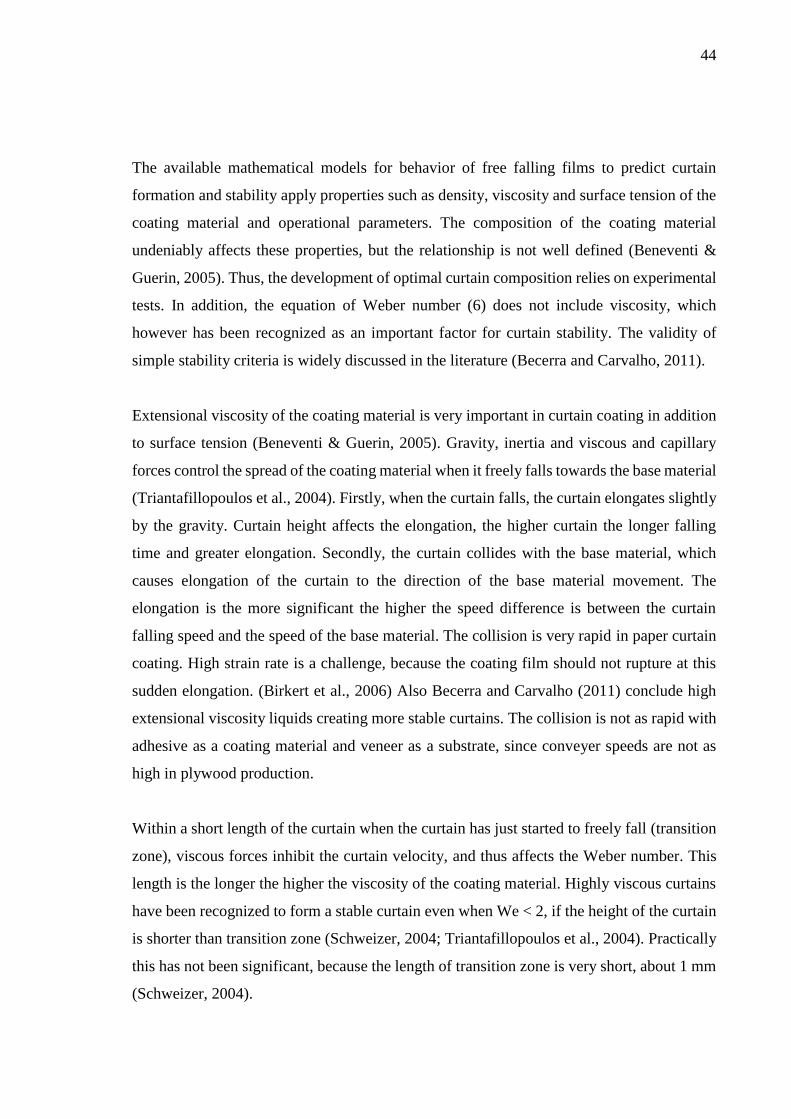
44
The available mathematical models for behavior of free falling films to predict curtain
formation and stability apply properties such as density, viscosity and surface tension of the
coating material and operational parameters. The composition of the coating material
undeniably affects these properties, but the relationship is not well defined (Beneventi &
Guerin, 2005). Thus, the development of optimal curtain composition relies on experimental
tests. In addition, the equation of Weber number (6) does not include viscosity, which
however has been recognized as an important factor for curtain stability. The validity of
simple stability criteria is widely discussed in the literature (Becerra and Carvalho, 2011).
Extensional viscosity of the coating material is very important in curtain coating in addition
to surface tension (Beneventi & Guerin, 2005). Gravity, inertia and viscous and capillary
forces control the spread of the coating material when it freely falls towards the base material
(Triantafillopoulos et al., 2004). Firstly, when the curtain falls, the curtain elongates slightly
by the gravity. Curtain height affects the elongation, the higher curtain the longer falling
time and greater elongation. Secondly, the curtain collides with the base material, which
causes elongation of the curtain to the direction of the base material movement. The
elongation is the more significant the higher the speed difference is between the curtain
falling speed and the speed of the base material. The collision is very rapid in paper curtain
coating. High strain rate is a challenge, because the coating film should not rupture at this
sudden elongation. (Birkert et al., 2006) Also Becerra and Carvalho (2011) conclude high
extensional viscosity liquids creating more stable curtains. The collision is not as rapid with
adhesive as a coating material and veneer as a substrate, since conveyer speeds are not as
high in plywood production.
Within a short length of the curtain when the curtain has just started to freely fall (transition
zone), viscous forces inhibit the curtain velocity, and thus affects the Weber number. This
length is the longer the higher the viscosity of the coating material. Highly viscous curtains
have been recognized to form a stable curtain even when We < 2, if the height of the curtain
is shorter than transition zone (Schweizer, 2004; Triantafillopoulos et al., 2004). Practically
this has not been significant, because the length of transition zone is very short, about 1 mm
(Schweizer, 2004).

45
5.3 Curtain coating resin/adhesive
Curtain coating phenol-formaldehyde (PF) resins and adhesive compositions have been
patented by Clausen et al. (1965), Järvi (1969), Robitschek et al. (1974) and Bond and Moehl
(1975). In the production of resins, formaldehyde:phenol (F:P) molar ratio varies from 1,6
to 2,5 (Clausen et al., 1965; Järvi, 1969; Bond and Moehl, 1975). Example of an PF curtain
coating adhesive composition is performed in Table IX (Robitschek et al., 1974).
Table IX Example of PF adhesive for curtain coating (Robitschek et al., 1974)
Substrate Parts per weight
PF resin 75,86
Water 11,49
Corn cob filler 5,75
Wheat flour thickener 4,6
50 % caustic soda 2,3
All patents concluded requirement of additives to improve curtain-forming qualities of the
adhesive, curtain stability and uniform spreading of the adhesive (Table X).
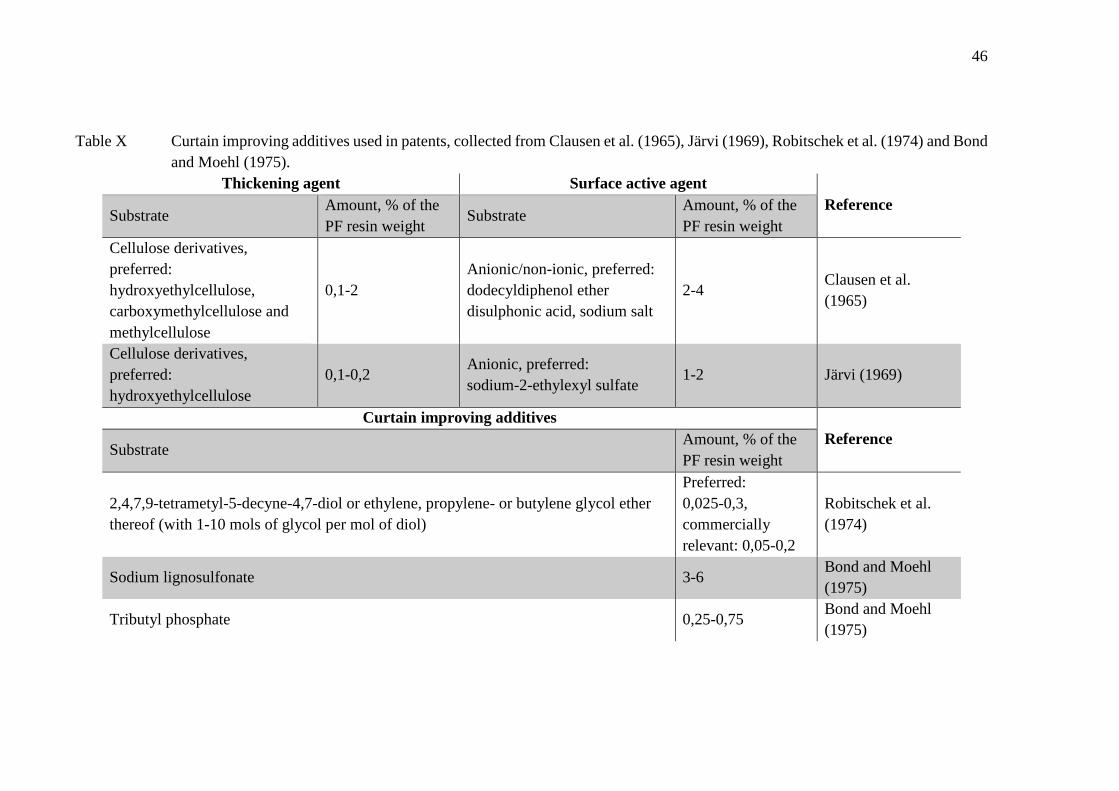
46
Table X Curtain improving additives used in patents, collected from Clausen et al. (1965), Järvi (1969), Robitschek et al. (1974) and Bond
and Moehl (1975).
Thickening agent Surface active agent
Reference Substrate
Amount, % of the
PF resin weight Substrate
Amount, % of the
PF resin weight
Cellulose derivatives,
preferred:
hydroxyethylcellulose,
carboxymethylcellulose and
methylcellulose
0,1-2
Anionic/non-ionic, preferred:
dodecyldiphenol ether
disulphonic acid, sodium salt
2-4 Clausen et al.
(1965)
Cellulose derivatives,
preferred:
hydroxyethylcellulose
0,1-0,2 Anionic, preferred:
sodium-2-ethylexyl sulfate 1-2 Järvi (1969)
Curtain improving additives
Reference Substrate
Amount, % of the
PF resin weight
2,4,7,9-tetrametyl-5-decyne-4,7-diol or ethylene, propylene- or butylene glycol ether
thereof (with 1-10 mols of glycol per mol of diol)
Preferred:
0,025-0,3,
commercially
relevant: 0,05-0,2
Robitschek et al.
(1974)
Sodium lignosulfonate 3-6 Bond and Moehl
(1975)
Tributyl phosphate 0,25-0,75 Bond and Moehl
(1975)

47
Specific viscosity properties of PF adhesives for curtain coating were met by addition of
thickening agent. Clausen et al. (1965) reported absence of a thickening agent requiring a
thinner curtain which causes greater possibility to curtain breaks. Both Clausen et al. (1965)
and Järvi (1969) reported use of mixture of high- and low-molecular-weight PF resins. High-
molecular-weight (HMW) resin is highly advanced, but low-molecular-weight (LMW) resin
provides improved flowing, lower spreading weight and longer open-time durability of the
resin. Järvi (1969) reported viscosity much over 800 cP causing problematic air entrainment.
Viscosity affects spreading of the adhesive and formation of the glue joint. Viscosities of the
patented curtain coating PF resins and adhesives are presented in Table XI. Optimal adhesive
viscosity is regulated by operational parameters of the plywood production. Curtain coating
of softwood requires more adhesive applied than for hardwood due to its porous structure.
Thus, thicker curtain is required. Thicker curtain is obtained by higher viscosity of the
adhesive.
Table XI Viscosity of PF resins and adhesives for curtain coating of veneer (collected
from Clausen et al. (1965), Järvi (1969) and Robitschek et al. (1974)).
Viscosity of the PF resin Viscosity of the adhesive Reference
220-540 cP,
preferred: 300 cP (21 ºC)
300-350 cP (21 ºC) Clausen et al. (1965)
600-800 cP (21 ºC) 220-800 cP,
preferred 500 cP (21-24 ºC)
Järvi (1969)
Not available Example 1600 cP (25 ºC) Robitschek et al. (1974)
Lowered surface tension was found to correlate with better curtain formation. Surface
tension was lowered with surface active agents. Robitschek et al. (1974) reported addition
of 0,01 % of 2,4,7,9-tetrametyl-5-decyne-4,7-diol additive already showing improvement of
curtain stability. Diol additive used was Surfynol 104 produced by AirProducts.
Bond and Moehl (1975) studied especially the importance of surface tension of the PF
adhesive to obtain successful curtain coating. Surface tension values of examples in the
patent are presented in Table XII.
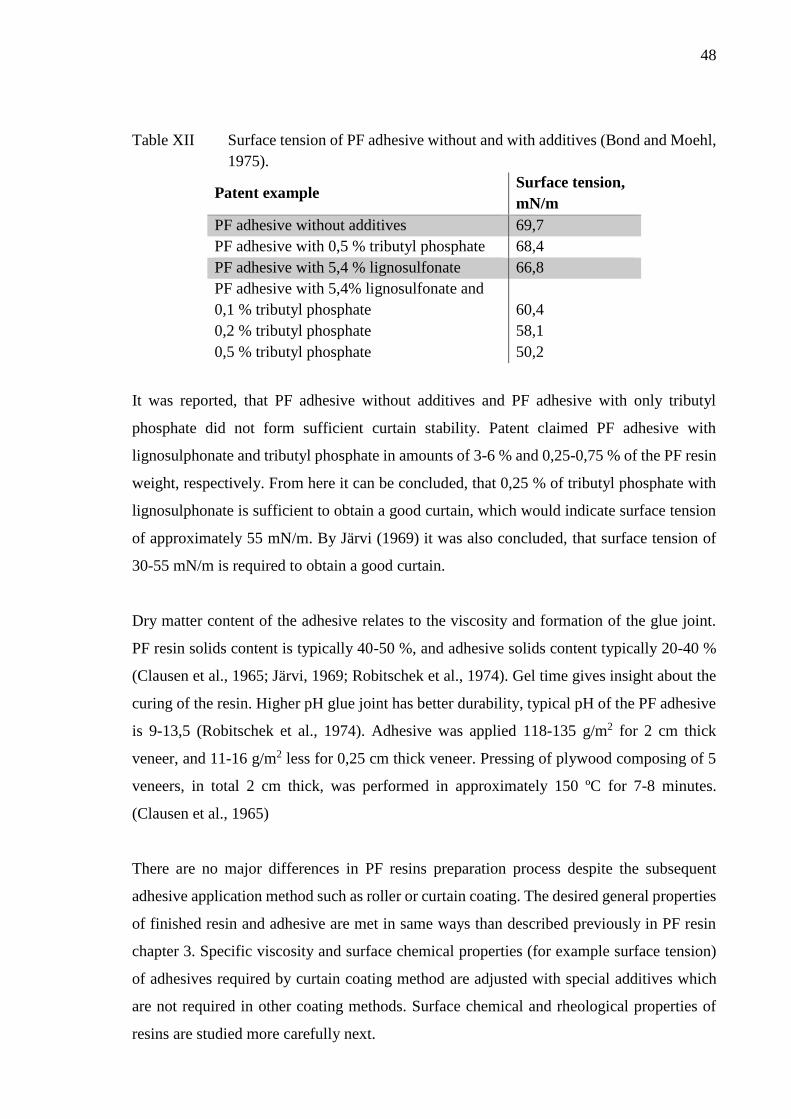
48
Table XII Surface tension of PF adhesive without and with additives (Bond and Moehl,
1975).
Patent example Surface tension,
mN/m
PF adhesive without additives 69,7
PF adhesive with 0,5 % tributyl phosphate 68,4
PF adhesive with 5,4 % lignosulfonate 66,8
PF adhesive with 5,4% lignosulfonate and
0,1 % tributyl phosphate
0,2 % tributyl phosphate
0,5 % tributyl phosphate
60,4
58,1
50,2
It was reported, that PF adhesive without additives and PF adhesive with only tributyl
phosphate did not form sufficient curtain stability. Patent claimed PF adhesive with
lignosulphonate and tributyl phosphate in amounts of 3-6 % and 0,25-0,75 % of the PF resin
weight, respectively. From here it can be concluded, that 0,25 % of tributyl phosphate with
lignosulphonate is sufficient to obtain a good curtain, which would indicate surface tension
of approximately 55 mN/m. By Järvi (1969) it was also concluded, that surface tension of
30-55 mN/m is required to obtain a good curtain.
Dry matter content of the adhesive relates to the viscosity and formation of the glue joint.
PF resin solids content is typically 40-50 %, and adhesive solids content typically 20-40 %
(Clausen et al., 1965; Järvi, 1969; Robitschek et al., 1974). Gel time gives insight about the
curing of the resin. Higher pH glue joint has better durability, typical pH of the PF adhesive
is 9-13,5 (Robitschek et al., 1974). Adhesive was applied 118-135 g/m2 for 2 cm thick
veneer, and 11-16 g/m2 less for 0,25 cm thick veneer. Pressing of plywood composing of 5
veneers, in total 2 cm thick, was performed in approximately 150 ºC for 7-8 minutes.
(Clausen et al., 1965)
There are no major differences in PF resins preparation process despite the subsequent
adhesive application method such as roller or curtain coating. The desired general properties
of finished resin and adhesive are met in same ways than described previously in PF resin
chapter 3. Specific viscosity and surface chemical properties (for example surface tension)
of adhesives required by curtain coating method are adjusted with special additives which
are not required in other coating methods. Surface chemical and rheological properties of
resins are studied more carefully next.

49
6 SURFACE CHEMISTRY OF RESINS
As stated in previous chapter, surface tension of the coating material has an essential role in
successful formation and stability of the free falling curtain. In addition, other surface
chemical phenomena may give useful information about the curtain behavior or adhesive
properties on the veneer surface. Physical chemistry of plywood resin surfaces must be
studied in order to achieve effective application in curtain coating. Methods to affect these
surface chemical properties and analytical methods to measure these properties are
determined. Among the surface chemical analyses, the most potential are selected for the
experimental part of this work.
6.1 Surface chemical properties
Interactions on the surfaces of liquid/liquid, liquid/solid, liquid/gas, gas/solid and solid/solid
phase systems are studied. Surface chemical phenomena are based on free energy at the
interface of two phases. Capillarity concerns interfaces that are sufficiently mobile to assume
an equilibrium state. It deals with macroscopic and statistical behavior of interfaces and it
can be measured as a free energy per unit area or as a force per unit length (Adamson, 1976).
Basic equation describing capillarity has been given by Young and Laplace, which allows
equilibrium surfaces to be treated mathematically (Adamson, 1976):
∆𝑃 =2𝜎
𝑟, (8)
where ∆P pressure difference across the film
σ surface tension
r bubble radius.
Young-Laplace equation (8) conclude, that the smaller the bubble, the greater the pressure
of air inside the bubble when compared to surrounding air pressure. This is due to decrease
of surface energy as the bubble increases, which is balanced by pressure difference across
the film.

50
Interesting phenomena at the interfaces include contact angle, surface free energy and
surface tension. Static contact angle (θ) is the angle of which liquid forms on the surface of
liquid, gas and solid matter, between two liquids or two liquids and a solid. Generally contact
angle is used for measuring the wetting of a solid by a liquid. Here, if θ > 90°, the liquid
does not wet the solid and the surface is hydrophobic. If θ < 90°, the liquid wets partly the
solid and if θ < 10°, the liquid practically wets the solid completely (Figure 9). (Shaw, 1980)
Figure 9 Contact angle, wetting of a surface (Biolin Scientific, 2018a).
Dynamic contact angle is measured when the phase boundary is in actual motion.
Advanced/advancing (for static/dynamic) contact angle is acquired when the drop has
recently expanded, and it approaches the maximum contact angle value. Receded/receding
(for static/dynamic) contact angle is acquired when the drop has recently contracted, and it
approaches the minimum contact angle value. For water, advancing and receding angles are
sensitive to the hydrophobic and hydrophilic domains, respectively. The difference between
the maximum and minimum contact angle values is referred as hysteresis. Hysteresis can be
described, when studying a sessile drop on a tilting surface. When the surface is completely
smooth, the drop will immediately start to move, and there is no difference between
advancing, receding and equilibrium contact angle. However, in practice, the surface is never
completely smooth. When the surface is tilted, drop will stay still, but the advancing contact
angle may be observed on the lowering side of the surface and receding contact angle on the
lifting side of the surface. Hysteresis is caused by contamination of the solid surface or
liquid, surface roughness or surface immobility on macromolecular scale (Adamson, 1976).
When as small contact angle as possible is required, determination of receding angle via
hysteresis is important.

51
Surface free energy and surface tension both describe the free energy of the surface and are
mathematically equivalent (Adamson, 1976). Surface free energy is used for solid surfaces
and surface tension for liquid surfaces. Surface energy composes of polar and dispersive
component. Polar component gives information about the hydrophobicity or hydrophilicity
of the surface. High polar component results small contact angle, and small polar component
results high contact angle, thus surfaces are hydrophobic and hydrophilic, respectively.
Dispersive component gives information about how non-polar substances behave on the
surface. However, also critical surface tension is a useful value to describe wettability of a
solid surface, especially when characterizing low energy surface that are being wetted by
non-polar liquids (Biolin Scientific, 2018b). Both are determined by contact angle
measurements, described more precisely later.
There are three types of wetting that can be studied via components of surface free energy:
1) spreading wetting
2) adhesional wetting
3) immersional wetting.
In spreading wetting, liquid is spreading on the surface of the solid so that the solid/liquid
and liquid/gas interfacial areas increase and the solid/gas interfacial area decreases (Shaw,
1980). The liquid spreads spontaneously over the solid surface when spreading coefficient S
is positive or zero. The spreading coefficient can be determined:
𝑆 = −∆𝐺𝑠
𝐴= 𝜎𝑆𝐺 − (𝜎𝑆𝐿 + 𝜎𝐿𝐺), (9)
where ∆Gs free energy change due to spreading
A interfacial area
σSG surface tension at the interface of solid/gas
σSL surface tension at the interface of solid/liquid
σLG surface tension at the interface of liquid/gas.

52
At equilibrium contact angle θ, liquid spreads an infinitesimal amount further covering extra
area of solid surface, dA. The increase in liquid/gas interfacial area is therefore dA cos(θ).
Thus, the increase of free energy of the system is:
𝑑𝐺 = 𝜎𝑆𝐿 𝑑𝐴 + 𝜎𝐿𝐺 𝑑𝐴 cos (𝜃) − 𝜎𝑆𝐺 𝑑𝐴, (10)
and if the system is at equilibrium, dG = 0, and the following equation is obtained, known
as Young’s equation:
𝜎𝑆𝐿 + 𝜎𝐿𝐺 cos (𝜃) − 𝜎𝑆𝐺 = 0. (11)
Critical surface tension σc is a parameter characterizing the wettability of solid surface. When
a non-polar liquid on a given solid spreads, contact angle decreases as the σLG decreases, and
becomes zero below a certain value of σLG, which is the critical surface tension (Shaw, 1980).
It is the highest value of surface tension of a liquid to completely wet the solid surface (Biolin
Scientific, 2018b).
In adhesional wetting, liquid makes contact with the solid substrate and adheres to it (Shaw,
1980). The interfacial area liquid/gas decreases. The work (free energy) of adhesion Wa is
given by the Dupré equation:
𝑊𝑎 = −∆𝐺𝑎
𝐴= 𝜎𝑆𝐺 + 𝜎𝐿𝐺 − 𝜎𝑆𝐿 , (12)
where ∆Ga free energy change due to adhesion.
When combined to Young’s equation (11), the following equation is obtained, known as
Young-Dupré equation:
𝑊𝑎 = 𝜎𝐿𝐺(1 + cos (𝜃)). (13)
Zero contact angle results that the forces of attraction between liquid and solid are equal or
greater than forces between liquid and liquid (completely wetted solid). Finite contact angle

53
results that the liquid adheres to the solid less than it coheres to itself (partially wetted solid).
Contact angle is always less than 180°, because otherwise it would require Wa = 0 or σLG =
∞.
In immersional wetting, the solid is immersed completely in the liquid (Shaw, 1980). The
interfacial are of liquid/gas remains unchanged. The work (free energy) of immersion due to
immersion of a solid in liquid is:
𝑊𝑖 = −∆𝐺𝑖
𝐴= 𝜎𝑆𝐺 − 𝜎𝑆𝐿 , (14)
where ∆Gi free energy change due to immersion.
When combined to Young’s equation (11), the following equation is obtained:
𝑊𝑖 = 𝜎𝐿𝐺 𝑐𝑜𝑠𝜃. (15)
If σSG > σSL, then θ < 90° and immersional wetting is spontaneous. If σSG < σSL, then θ > 90°
and work must be done to immerse the solid in the liquid.
When studying the equations (9), (12) and (14), it can be noticed that reduction of σSL
facilitates all of these wetting processes (achieving spontaneous spreading and immersion
and smaller contact angle). However, reduction of σLG is not always helpful (Shaw, 1980).
In addition to contact angles, capillary phenomenon, where the driving force is pressure
difference across the surface, is involved in the basic mechanism of wetting in some cases
(Adamson, 1976). Large pressure difference promotes capillarity, and thus wetting. Here,
the Young-Laplace equation (8) is derived into the form (Adamson, 1976):
∆𝑃 =2 𝜎𝐿𝐺 cos (𝜃)
𝑟. (16)
If θ is not zero, then

54
∆𝑃 =2(𝜎𝑆𝐺 − 𝜎𝑆𝐿)
𝑟, (17)
and if θ is zero, then
∆𝑃 =2𝜎𝐿𝐺
𝑟. (18)
Thus, when pursuing large pressure difference, small σSL is desired, based on equation (17).
On the other hand, large σLG is desired based on equation (18).
Wetting of hydrophobic surface can be remarkably increased by the addition of wetting
agents, surface active molecules (Adamson, 1976; Shaw, 1980). Such surfactants are studied
more precisely later. Surface roughness has also an effect on contact angle. If θ < 90°, liquid
will more likely penetrate into the pores and hollows of the solid surface and if θ > 90°,
liquid does not penetrate into the solid.
Surface tension is defined as presence of free energy at the liquid surface. If the interface
studied is between liquid and gas, the phenomenon is referred as surface tension. The excess
energy is formed, because molecules on the surface of the liquid do not interact equally to
all directions but more to the direction of bulk of a liquid (Shaw, 1980). This is illustrated in
Figure 10. Intermolecular interactions are mainly van der Waals forces. Liquid surface
attempts to minimize its own area. If the interface studied is between two liquids, the
phenomenon is referred as interfacial tension. At the interface of two liquids, the imbalance
of intermolecular forces is lower (Shaw, 1980). Surface tension can be defined as static or
dynamic surface tension. Dynamic surface tension is time-dependent surface tension of the
liquid, which approaches the equilibrium values of static surface tension during time. The
lower the dynamic surface tension, the easier the wetting. The time for a liquid to achieve
static surface tension may vary from seconds to hours.

55
Figure 10 Existing interactions of molecules at the surface of the liquid and in the bulk
of the liquid (Biolin Scientific, 2018c).
Critical micelle concentration (CMC) of a surfactant is a point, where physical properties of
the liquid, especially surface tension, undergo a remarkable change (Shaw, 1980). Certain
molecules, amphiphilic molecules, contain two distinct components differing in their affinity
for solutes (Figure 11A). The part of the molecule having affinity for polar solutes is referred
as hydrophilic, and the part having affinity for non-polar solutes is referred as hydrophobic.
When amphiphilic molecules interact with water, the polar part seeks to interact with water
and non-polar part avoids the interaction. There are two ways for amphiphilic molecule to
arrange in such situation, which are presented in Figure 11B and Figure 11C. First, at the
surface of the water, polar part interacts with water and non-polar part locates above the
surface (in air or non-polar liquid). This interrupts the cohesive energy at the surface and
thus lowers the surface tension. Such molecules are wetting agents. Second, molecules form
aggregates, micelles, where polar part is exposed to water and non-polar parts orient towards
the center of the micelle.
Figure 11 A) Amphiphilic molecule. Arrangement of amphiphilic molecules B) at the
surface of water and C) to form micelles. (Biolin Scientific, 2018b)

56
The proportion of molecules present at the surface or as micelles depend on surfactant
concentration. Arrangement at the surfaces is favored at low concentrations, until the surface
becomes “full” and more micelles are arranged. The concentration, where the surface is
completely loaded with surfactants and any further addition will generate only micelles, is
called critical micelle concentration. From this point further, any addition of amphiphilic
molecules generates only micelles and do not further lower the surface tension but stays the
same. Determined CMC is used for optimization of amount of surfactants used and the
change in surface tension after mixing and time required to reach equilibrium can be
determined. CMC affects also other physical properties of the liquid, for example
conductivity, molar conductivity, osmotic pressure and turbidity of the liquid, like presented
in Figure 12. (Shaw, 1980)
Figure 12 The effect of CMC on liquid physical properties: conductivity (κ), surface
tension (σ), osmotic pressure (π), turbidity (τ) and molar conductivity (λ)
(Colloid and Surface Chemistry Virtual Lab, 2018).
6.2 Additives to affect surface chemistry of resins
Surfactants are surface active molecules, which can be applied as chemical additives into the
plywood resin. Wetting phenomenon (contact angle) and surface tension are the most
remarkable surface chemical properties to be modified, and modification can be performed
with wetting agents (Adamson, 1976; Birkert et al., 2006). Wetting agents are amphiphilic
CMC Surfactant concentration
Physi
cal
pro
per
ty
σ

57
molecules, surfactants, promoting displacement of air by liquid at the surface of solid (Shaw,
1980). When surfactants are added to liquid, they spontaneously adsorb at the surface, and
decrease the surface energy (Langevin, 2000). A monolayer is formed, with the polar parts
of the surfactant molecule in contact with water, and the hydrophobic parts in contact with
air (Figure 11b).
Surfactants are classified according to the charge carried by the surface active part of the
molecule to anionic, cationic, non-ionic and ampholytic (zwitterionic) surfactants.
Particularly anionics are used as wetting agents. Hydrophilic part of effective soluble
surfactants is often an ionic group. Ions having a strong affinity for water (electrostatic
attraction to water dipoles) are capable of pulling long hydrocarbon chains into solution with
them. Non-ionic hydrophilic groups may also be strong as a sum of modest affinities of
monomer units in a polymer chain. As an advantage, the lengths of both hydrophilic and
hydrophobic groups can be varied. Irregularly shaped surfactant molecules are often very
good wetting agents since micelle formation is not desired. Thus, relatively high
concentrations of unassociated surfactant molecules can be applied and greater lowering of
both liquid/gas surface tension and solid/liquid surface tension are achieved. (Shaw, 1980)
In addition, two identical, conventional surfactant molecules can be chemically bonded
together by a spacer. Here, even better wetting and lower CMC can be achieved, and
especially dynamic surface tension can be reduced. This is referred as Gemini surfactant
technology (Louis, 2003).
In curtain coating, surfactants allow air to escape from the plywood adhesive and hold the
curtain together for greater distances of fall from the head. 100-460 mm of more falling
distance can be achieved. Amount of surfactants is usually less than 1 % of the resin solution.
Surfactants usually lower the resin viscosity about 50 mPas. For curtain formation, a) diols,
b) 5- to 10-mol ethoxylates which have, or on average have, 8-10 carbons, or c) sodium
sulfate salts, such as octyl, hexyl or alkyl, surfactants are recommended. Surfactants may be
anionic or non-ionic. (Sellers, 1985) Amount of wetting agent is critical, since high
wettability results over-effective soaking into the veneer (Shaw, 1980) and dosage over
CMC of surfactant only increases the costs, and does not improve the performance.

58
Choosing the suitable surfactant is important, since its compatibility to alkaline solutions
(Seller, 1985) and to nature of solid surface (side effects such as toxicity and foaming may
occur) (Shaw, 1980) must be considered. In addition, variables affecting the performance of
surfactants (Triantafillopoulos et al., 2004) are for example:
- chemical structure, chain length and concentration of surfactant molecules
- viscosity of the curtain fluid
- local velocities in the curtain flow field
- age of curtain fluid
- rate at which fresh curtain surface is generated.
As a disadvantage, surfactants may have bubble stabilizing effect called Marangoni effect,
which is caused by their linear structure. So, addition of surfactants may cause undesired
resin/adhesive foaming (Evonik, 2017a). However, especially non-ionic surfactants
(Langevin, 2000) and Gemini surfactants (Louis, 2003) do not favor the foam stabilization.
Prevention of foaming is studied later in this work. Also ecological impact of the surfactants
must be considered, since their poor biodegradability, aquatic toxicity and bioaccumulating
may be remarkable.
Polar liquids (such as water) have strong intermolecular interactions and thus high surface
tensions. In addition to surfactants, any factors decreasing the strength of this interaction will
lower the surface tension (such as increased temperature and contaminants). (Seller, 1985)
Examples of commercial wetting agents/surfactants available for coatings and adhesives
are presented in Table XIII.

59
Table XIII Commercial wetting agents/surfactants available for coatings and adhesives.
Producer Brand Description Reference
BASF SE Efka® Coating additives enabling dispersion of e.g. pigments, foam control at
different process stages and the management of coating surface properties. (BASF, 2018c)
BASF SE Hydropalat® Low foaming substrate wetting agents for waterborne applications.
Additive for e.g. adhesives and industrial coatings.
(BASF, 2013;
2018c)
BYK Additives &
Instruments BYK-3xxx
Surfactants for aqueous e.g. coatings and adhesives. Reduction of surface
tension and improved substrate wetting. (BYK, 2018)
BYK Additives &
Instruments BYK-DYNWET
Substrate wetting agent for aqueous e.g. coatings and adhesives. Low foam
stabilization. Reduces dynamic surface tension and is suitable for high-
speed machines.
(BYK, 2018)
DOW Chemical ECOSURFTM Biodegradable surfactant offering low-foam wetting and additional foam
reduction. (DOW, 2018b)
Evonik Industries Dynol® Superwetting surfactants for the most difficult to wet surfaces, coating
additive. (Evonik, 2017b)
Evonik Industries Syrfynol®
Multi-functional surfactants and defoamers, e.g. low foaming dynamic
wetting agents, molecular defoamers and specialty surfactants, coating
additive.
(Evonik, 2017b)
Evonik Industries TEGOPREN®
TEGO® Surten
Wetting agents for polymer dispersions with excellent performance at high
processing speed. Suitable for water-based adhesives. TEGO® Surten
especially for adhesive curtain coating.
(Evonik, 2017a;
2018)
King Industries,
Inc.
DISPARLON®
AQ-2xx, -5xx
and -7xxx, LS
Leveling, recoatability, wetting and anti-cratering for waterborne systems. (King Industries,
2017)

60
6.3 Analytical methods
Determination of contact angle is performed for non-porous solids with a goniometry or a
tensiometer. Goniometry involves observation of a static or dynamic sessile drop of a test
liquid on a solid substrate (Adamson, 1976). Tensiometer is used for dynamic Wilhelmy
method, where the forces of interaction, when a solid is contacted with the test liquid, are
measured. For porous solids, tensiometer and Washburn’s equation capillary rise method are
combined to determine the contact angle. However, contact angle determination for porous
solids is a challenge due to questioned validity of averaged cos(θ) equation (Adamson,
1976). Contact angle is utilized also for other experimental parameters such as work of
adhesion, work of cohesion, work of spreading and spreading coefficient, work of immersion
and wetting tension.
In determination of surface free energy, uniform, sufficiently thick layer of resin is dried
onto glass piece. Measurement is performed with at least two liquids, which have different
polar and dispersive components. Measurement with 3-5 well characterized wetting liquids
is practically suggested. Onto solid resin surface, different liquid drops are dropped, and
contact angle is measured. Liquids used for measurement may be for example:
- Water: high polar component, low dispersive component
- Ethylene glycol: polar liquid, higher dispersive component than water
- Diiodomethane: polar component zero, high dispersive component
Total surface free energy is determined from the contact angles of different liquids by
equations derived by Fowkes, Wu or Van Oss-Chaudhury and Good (Biolin Scientific,
2017b). Extended Fowkes/OWRK calculation is a geometric mean of dispersive and polar
component. Wu calculation utilizes the same principle than Fowkes, but harmonic mean is
used instead. Theoretically harmonic mean is not as accurate as Fowkes calculation. For
these surface energy determination methods, contact angles of two different liquids are
required. Lewis acid-base approach (Van Oss-Chaudhury-Good method) further divides the
polar component into acid (electron acceptor) and base (electron donor) components. This
is the most accurate method, but also the most sensitive for variations in the measurement.
Contact angles of three liquids are required.
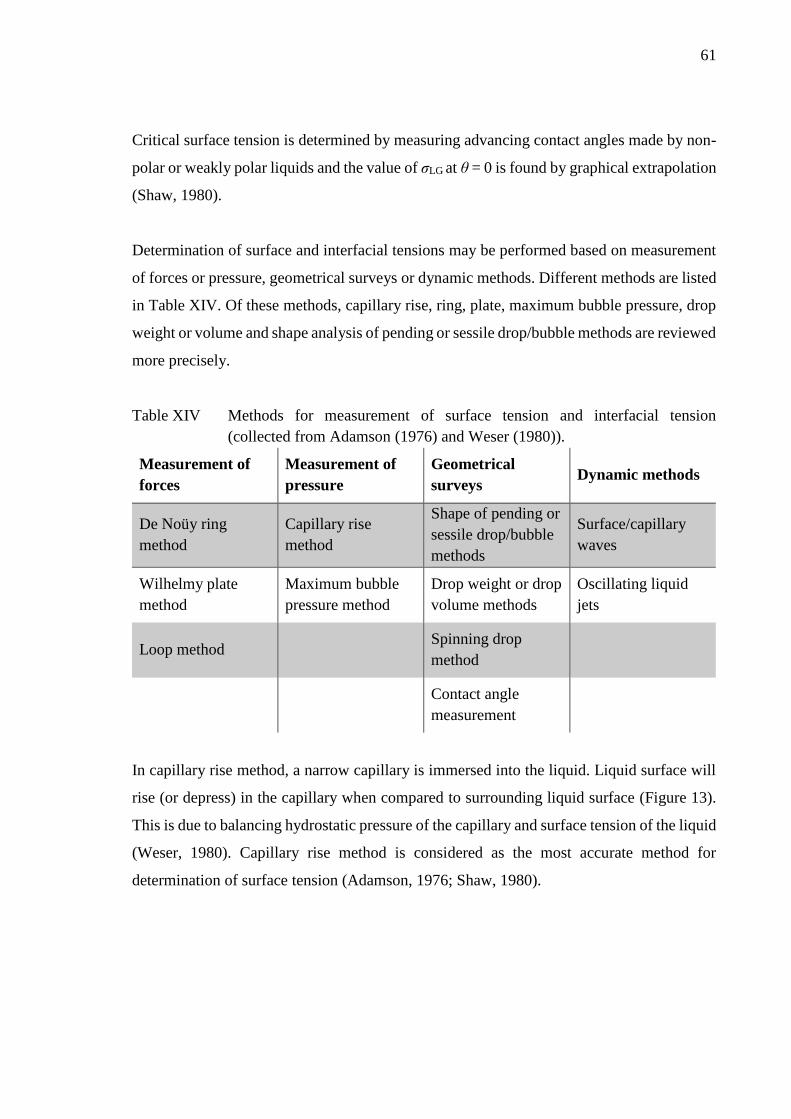
61
Critical surface tension is determined by measuring advancing contact angles made by non-
polar or weakly polar liquids and the value of σLG at θ = 0 is found by graphical extrapolation
(Shaw, 1980).
Determination of surface and interfacial tensions may be performed based on measurement
of forces or pressure, geometrical surveys or dynamic methods. Different methods are listed
in Table XIV. Of these methods, capillary rise, ring, plate, maximum bubble pressure, drop
weight or volume and shape analysis of pending or sessile drop/bubble methods are reviewed
more precisely.
Table XIV Methods for measurement of surface tension and interfacial tension
(collected from Adamson (1976) and Weser (1980)).
Measurement of
forces
Measurement of
pressure
Geometrical
surveys Dynamic methods
De Noüy ring
method
Capillary rise
method
Shape of pending or
sessile drop/bubble
methods
Surface/capillary
waves
Wilhelmy plate
method
Maximum bubble
pressure method
Drop weight or drop
volume methods
Oscillating liquid
jets
Loop method Spinning drop
method
Contact angle
measurement
In capillary rise method, a narrow capillary is immersed into the liquid. Liquid surface will
rise (or depress) in the capillary when compared to surrounding liquid surface (Figure 13).
This is due to balancing hydrostatic pressure of the capillary and surface tension of the liquid
(Weser, 1980). Capillary rise method is considered as the most accurate method for
determination of surface tension (Adamson, 1976; Shaw, 1980).
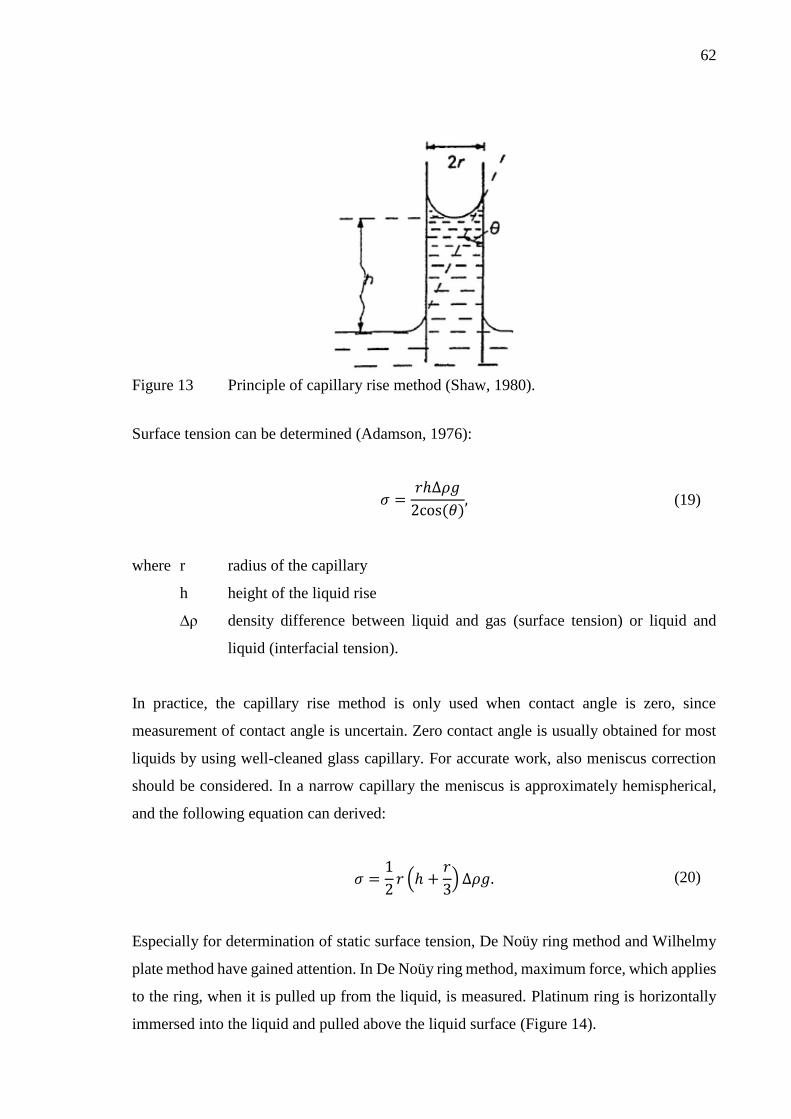
62
Figure 13 Principle of capillary rise method (Shaw, 1980).
Surface tension can be determined (Adamson, 1976):
𝜎 =𝑟ℎ∆𝜌𝑔
2cos (𝜃), (19)
where r radius of the capillary
h height of the liquid rise
∆ρ density difference between liquid and gas (surface tension) or liquid and
liquid (interfacial tension).
In practice, the capillary rise method is only used when contact angle is zero, since
measurement of contact angle is uncertain. Zero contact angle is usually obtained for most
liquids by using well-cleaned glass capillary. For accurate work, also meniscus correction
should be considered. In a narrow capillary the meniscus is approximately hemispherical,
and the following equation can derived:
𝜎 =1
2𝑟 (ℎ +
𝑟
3) ∆𝜌𝑔. (20)
Especially for determination of static surface tension, De Noüy ring method and Wilhelmy
plate method have gained attention. In De Noüy ring method, maximum force, which applies
to the ring, when it is pulled up from the liquid, is measured. Platinum ring is horizontally
immersed into the liquid and pulled above the liquid surface (Figure 14).

63
Figure 14 Steps of De Noüy ring method for determination of maximum force of pull
on the ring and force measured on each step (Biolin Scientific, 2018c).
Surface tension can be determined (Adamson, 1976; Shaw, 1980):
𝜎 =𝛽𝐹𝑚𝑎𝑥
4𝜋𝑟, (21)
where β correction coefficient depending on the shape of the ring and nature of the
interface
Fmax maximum force of pull on the ring.
In Wilhelmy plate measurement, force, which applies to the plate, when it touches the
surface of the liquid, is measured. Platinum plate is vertically immersed to the liquid, but not
completely submerged. The plate is pulled up to the surface of the liquid (zero depth of
immersion, Figure 15).

64
Figure 15 Final step of Wilhelmy plate method for determination of maximum force of
the liquid on plate surface (Biolin Scientific, 2018c).
Surface tension can be determined (Adamson, 1976; Shaw, 1980; Weser, 1980):
𝜎 =𝐹𝑤
𝑙𝑤cos(𝜃), (22)
where FW Wilhelmy force
lw wetted length
Due to complete wetting of the plate, contact angle can be assumed to be zero. The surface
of the plate can also be treated to achieve complete wetting.
For measurement of dynamic surface tension, maximum bubble pressure method is generally
utilized. According to the Young-Laplace equation (8), the pressure inside a gas bubble
increases with decreasing diameter. When producing an air bubble at the tip of a capillary
that is dipped into a liquid, the shape of the bubble changes with the pressure applied to it
(Figure 16). The pressure reaches maximum, when the bubble approaches the shape of a
hemisphere (bubble radius equal to capillary radius) (Adamson, 1976; Weser, 1980).
Dynamic surface tension is obtained as a function of surface age. Viscosity correction may
result errors. For the measurement, density of the liquid is required, and capillary viscosity
should be determined to ensure correct results.

65
Figure 16 Behavior of a bubble at the tip of capillary in determination of maximum
bubble pressure in dynamic surface tension measurement (KRÜSS GmbH,
2018a).
Here, from Young-Laplace equation (8), surface tension is solved. Bubble pressure
tensiometer calculation principle is:
𝜎 = 𝑓𝑟(𝑃𝑚𝑎𝑥 − 𝑃0)
2− ∆𝜎𝑎 − ∆𝜎𝑣, (23)
where f correction coefficient depending on the capillary
Pmax maximum pressure inside the bubble
P0 hydrostatic pressure of the liquid
∆σa coefficient due to aerodynamic resistance of the capillary
∆σv coefficient depending on the viscosity of the liquid.
In the drop weight and drop volume method, drops of a liquid are allowed to detach slowly
from the tip of a vertically mounted capillary. At the moment of detaching, equilibrium
between the gravitation force (making the drop detach) and the adherence force (making the

66
drop stay at the tip due to surface tension) is established. The mass or the volume of the drop
is measured.
Surface or interfacial tensions can be determined (Adamson, 1976; Shaw, 1980):
𝜎 =𝑚𝑑𝑟𝑜𝑝𝑔
2𝜋𝑟𝐹𝑑 =
𝑉𝑑𝑟𝑜𝑝𝜌𝑔
2𝜋𝑟𝐹𝑑 , (24)
where mdrop mass of the drop
Vdrop volume of the drop
Fd correction coefficient due to detachment.
Correcting factor is required, because at the moment of detachment, the drop does not
completely leave the tip, the surface tension forces are seldom vertical and there is a pressure
difference across the curved liquid surface (Shaw, 1980).
In drop/bubble shape analysis, either pendant or sessile drop is optically studied. Pendant
drop of a liquid is formed at the tip of vertically mounted capillary. The shape of a drop
hanging from the tip is determined from the balance of forces which include surface tension
of the liquid.
Surface or interfacial tensions can be determined (Adamson, 1976):
𝜎 =∆𝜌𝑔𝑟0
2
𝛽, (25)
where r2 radius of drop curvature at apex
β shape factor, defined through Young-Laplace equation.
Sessile drop is fixed to a solid, smooth surface. The height of the drop reaches maximum as
the volume of the drop/bubble increases, and it becomes independent of the drop diameter
(Weser, 1980).

67
At this point, surface or interfacial tensions can be simply determined (Adamson, 1976):
𝜎 =∆𝜌𝑔ℎ2
2. (26)
Critical micelle concentration (CMC) can be determined manually by measurement of
surface tensions of liquids with different concentrations of surfactant. Here, the problem is
with waiting a sufficient time for dynamic surface tension to reach static surface tension after
addition of surfactant. Another option is using automatic tensiometer with platinum ring or
plate (Biolin Scientific, 2018a), which adds new dose of surfactant when desired stability or
maximum time of measurement are reached. Surface tension as a function of logarithmic
surfactant concentration is obtained.
6.4 Discussion
To summarize the studied surface chemical properties, Figure 17 is presented.
Figure 17 Summary of surface chemical properties studied in this work, the interface
where they affect and what they describe.
• Property of a solid surface
• Determined by contact angle measurement
• Liquid/solid/gas interface
• Describing wetting (spreading, adhesion & immersion) of the surface and hydrophobicity/hydrophilicity of the surface
Surface free energy
• Liquid/gas or liquid/liquid interface
• Describing the surface area of the liquid
• Dynamic/static surface tension
• Critical surface tension
Surface/interfacial tension
• Function, structure and compatibility
• Critical micelle concentration
• Surface and bulk of the liquid
• Maximum surfactant concentration relevant for surface tension reduction
Surfactants

68
Via surface free energy determination, interesting wetting phenomena could also be
described for resins. This is not widely studied property of coating materials, since coating
materials are liquids and surface free energy is a property of a solid surface. However,
surface free energy of resins has been studied by Matsushita et al. (2006). Thus, it may be
interesting to study surface free energy also in this work.
However, surface tension is widely recognized, interesting property of coating materials. For
curtain coating, it has been stated that dynamic surface tension takes into account curtain
aging (Triantafillopoulos et al., 2004) and since new area is continuously formed (Louis,
2003), it would be applicable for determination of stability of a curtain. However, with resin
as a coating material, it may be irrelevant to measure specifically dynamic surface tension.
This is due to high viscosity of the resin, slow speed of the curtain and the conveyor when
compared to paper coating, and use of veneer as a substrate material. The speed of the curtain
at the moment of collision is slower than in paper coating, and collision itself does not cause
curtain rupture. Measurement of dynamic surface tension is also a challenge for resins.
Generally used maximum bubble pressure method applies a narrow capillary, which is easily
clogged with resin. Surface tension does affect the stability of the curtain, but determination
of static surface tension is more practical for resins. In addition, the falling time of the curtain
is very short (depending on the curtain height, for 50-350 mm curtain, falling time is 100-
270 ms) (Schweizer, 2004). Low surface tension values of the curtain must be reached before
or during the free fall and here static surface tension may be more applicable.
7 RHEOLOGY OF RESINS
Rheology is the science of deformation and flow of substance. Viscosity is a property
describing substance’s resistance to flow. As stated in curtain coating chapter 5, extensional
viscosity of the coating material has an essential role in successful formation and stability of
the free falling curtain. Rheological properties of plywood resins give also insight about the
chemical structure and stability of the material. Thus, also rheology of resins must be studied
in order to achieve effective application in curtain coating. Methods to affect these
rheological properties and analytical methods to measure these properties are studied.
Among the rheological analyses, the most potential are selected for the experimental part of
this work.

69
7.1 Rheological properties
Viscosity is the ratio of shear rate and shear stress (Phan-Thien, 2002). When studying a
fluid between two solid plates, and sliding the upper plate with force F, shear rate and shear
stress can be observed (Figure 18). Fluid moves parallel to upper plate and the speed of the
fluid decreases linearly from velocity U at the top to zero at the bottom. Friction due to
velocity differences between the fluid “layers” gives rise to a force resisting their motion
(normal stress). Shear stress is the force which applies to the fluid, when shearing is applied.
Shear stress applies to the fluid in the direction of plate movement and normal stress is
perpendicular to it. Shear rate is the amount of fluid deformation (strain) over time, when
shearing is applied.
Figure 18 Fluid between two plates, height of the fluid h. Upper plate (area A) moving
at velocity U, when slided with external force F. Velocity gradient du/dh.
Shear stress can be defined (Phan-Thien, 2002; Goodwin and Hughes, 2008):
𝜏 =𝐹
𝐴, (27)
where F tangential force on the top plate
A fluid contact area
and shear rate can be defined (Phan-Thien, 2002; Goodwin and Hughes, 2008):
�� =𝑈
ℎ, (28)
where U velocity of the top plate

70
h fluid height,
and finally, viscosity can be defined (Phan-Thien, 2002):
𝜂 =𝜏
��. (29)
Fluid may have Newtonian or non-Newtonian behavior. For a Newtonian fluid viscous
stresses are linearly proportional to the local strain rate, so viscosity (equation 29) is
constant, depending only on the temperature (Phan-Thien, 2002). Non-Newtonian fluid
becomes thinner or thicker when sheared (viscosity changes when strain rate changes). For
example, water can be assumed to have Newtonian behavior, but highly viscous fluids are
generally non-Newtonian. Rheology focuses on studying non-Newtonian fluids.
Pseudoplasticity is similar to shear thinning, but the system flows noticeably only after the
shear stress exceeds a certain minimum value, yield value. Thixotropy and rheopexy are
time-dependent shear thinning and thickening, respectively. (Shaw, 1980)
In other words, viscosity is Newtonian when the shearing force per unit area (F/A) between
two parallel plates of liquid in relative motion is proportional to the velocity gradient (Figure
18) between the planes (Shaw, 1980):
𝜏 = 𝜂𝑑𝑢
𝑑ℎ, (30)
where η coefficient of shear viscosity.
Coefficient of shear viscosity is defined for streamlined flows for a given temperature and
pressure. For other solutions and dispersions, deviations from Newtonian flow are observed.
The main causes for non-Newtonian flow are the formation of a structure throughout the
system and orientation of asymmetric particles caused by the velocity gradient (Shaw, 1980).
Here, the viscosity studied is precisely called dynamic, shear viscosity. Kinematic viscosity
is the ratio of dynamic viscosity and density of the fluid:

71
𝜈 =𝜂
𝜌. (31)
So, characterization of fluid flow or deformation due to simple shear stress applied is called
shear rheology. The study of extensional flows is called extensional rheology.
Extensional/elongational flow refers to a flow where velocity gradient is diagonal
(accelerating), and it can be planar, uniaxial or biaxial (Barnes et al., 1989). These flows
efficiently stretch the fluid elements. The difference between shear and extensional flow is
presented in Figure 19.
Figure 19 A) Shear flow B) and extensional flow (Willenbacher et al., 2004).
Extensional viscosity (ηE) is a viscosity coefficient when applied stress is extensional stress.
It does not usually reach steady-state. For a Newtonian fluid, extensional viscosity is thrice
its shear viscosity, but for a polymer solution, extensional viscosity may be much higher
than shear viscosity. (Phan-Thien, 2002) The Trouton ratio defines the ratio of extensional
viscosity to the shear viscosity of the fluid:
𝑇𝑟𝑜𝑢𝑡𝑜𝑛 𝑟𝑎𝑡𝑖𝑜 =𝜂𝐸
𝜂0, (32)
where η0 zero-shear viscosity.
Rheological behavior occurs with Newtonian viscous fluids and with Hookean elastic solids.
Most materials exhibit combination of both viscous and elastic characteristics. This
mechanical behavior is called viscoelasticity. Elastic solid deforms by an amount
proportional to the applied stress and maintains a constant deformation as long as the stress
remains constant (Hooke’s law). On removal of stress, the elastic energy stored in the solid
is released and the solid immediately recovers to its original shape. Newtonian liquids do

72
not recover when the stress is removed. When viscoelastic materials are stressed, some of
the energy involved is stored elastically, and the rest is dissipated as heat. So, the system is
partly deformed into non-equilibrium position and partly flowing into new equilibrium
position. (Shaw, 1985)
Viscoelasticity is described by shear modulus (G), which can be defined (Mezger, 2014):
𝐺 =𝜏
𝛾, (33)
where γ shear strain.
Shear strain describes deformation of the system and is defined (Mezger, 2014):
𝛾 =𝑠
ℎ, (34)
where s deflection path.
The higher the value of G the stiffer the material, since the deformation of the material is
small. When a sample is sheared, ideally elastic material (solid) has no time lag between the
applied deformation and resulting shear stress. Viscoelastic material has, however, a time
lag for response signal, which can be measured by oscillatory test producing shear strain and
shear stress sine curves (Figure 20). The time lag is called the phase shift (δ), and it is always
between 0 º and 90 º. Since ideally elastic material has no time lag, δ = 0 º. For ideally viscous
material, δ = 90 º. (Mezger, 2014)

73
Figure 20 Phase shift (δ) between applied shear strain (γ) and resulting shear stress (τ)
(Mezger, 2014).
Complex shear modulus (G*) describes the entire viscoelastic behavior of a sample, the
response of the material to oscillation (deformation/strain) on certain amplitude and
frequency of oscillation (Grillet et al., 2012). Loss/viscous (G’’) and storage/elastic (G’)
moduli are fractions of the complex shear modulus, which describe the liquid- or solid-like
behavior of the material, respectively. Storage modulus describes the stored deformation
energy and loss modulus describes the lost (dissipated) deformation energy. The relationship
between phase shift, complex shear modulus, loss and storage moduli are presented in Figure
21 (Mezger, 2014).
Figure 21 Loss (G’’) and storage (G’) moduli as fractions of complex shear moduli
(G*), using the phase shift angle (δ). Viscous portion of the viscoelastic
behavior is presented on the y-axis and elastic portion on the x-axis. (Mezger,
2014)
Based on Figure 21, the following equation applies:

74
𝐺∗2 = 𝐺′2+ 𝐺′′2
. (35)
Complex viscosity (η*) describes the viscosity of viscoelastic material:
𝜂∗ =𝐺∗
𝜔, (36)
where ω angular frequency of deformation.
Zero-shear viscosity (η0) is the plateau value of complex viscosity at low frequency region.
It is used in calculation of Trouton ratio (equation 32) for viscoelastic material. Zero-shear
viscosity is proportional to molar mass of the polymer.
For viscoelastic solids, storage modulus is higher than loss modulus, thus G’ > G’’. This is
due to links inside the material, chemical bonds or physical-chemical interactions. For
viscoelastic liquids, loss modulus is higher than storage modulus, thus G’’ > G’. Viscoelastic
liquids do not contain such strong bonds between the molecules. Phase transition in the
sample means that samples deforms during the measurement from liquid state to solid state
or vice versa. Phase transition happens in gel point/crossover point, where loss and storage
moduli are equal, G’’ = G’.
Viscoelasticity is linear when the time-dependent compliance (stress/strain) of a material is
independent of the magnitude of the applied stress (Shaw, 1980). This means, that for linear
viscoelastic materials, the response (e.g. stress) is directly proportional to applied signal (e.g.
strain) at any time (Barnes et al., 1989). Linear viscoelasticity has been modeled most
knowingly by Maxwell and Kelvin-Voigt (Barnes et al., 1989; Phan-Thien, 2002). In linear
viscoelastic region, the structure of the sample is not destroyed due to too large deformation
applied (Mezger, 2014). In linear viscoelastic region, G’ (and G’’) are constant regardless of
the strain applied. Limiting value, linearity limit (γL), of linear viscoelastic region is the
highest value of strain (%) before change in constant value of G’.
Viscoelastic phenomena are described by Phan-Thien (2002). Normal stress difference
(unequal normal stresses in a shear flow) causes:

75
- Weissenberg rod-climbing effect
o Viscoelastic fluid climbs the rod whereas Newtonian fluid forms a vortex
when stirred.
- die swell
o Viscoelastic fluid swells remarkably more than Newtonian fluid when exiting
a capillary.
- flow down an inclined channel
o Viscoelastic fluid has a convex surface whereas Newtonian fluid has a flat
surface when flowing in a channel.
Transient responses (quantification of relaxation time scale) cause:
- small strain oscillatory flow
o Functions of the frequency, dynamic properties.
- stress overshoot
o Shear stress overshoot before steady-state values, start-up of shear flow.
- stress relaxation
o Shear stress relaxation after steady-state values, stop of shear flow.
- relaxation modulus
o Shear stress relaxation after applying large strain rate over a small interval.
- recoil
o Viscoelastic liquid retracts partly to some previous shape after removing a
load. Newtonian liquid does not remember the previous shape and the motion
of liquid stops immediately upon removal of loads. On the other hand, elastic
solid remembers the previous shape perfectly and returns to the shape upon
removal of loads.
Another way of describing viscoelasticity is studying interfacial rheology. This is
particularly important for systems with high specific area, such as liquid films, emulsions
and foams, and systems with surfactants (Ravera et al., 2010). In interfacial rheology, the
surface is modified by shear or dilatational stresses. Dilatational stress is
compression/expansion of the liquid, surface modification as the area of the surface
decreases and increases, and thus variation to the interfacial tension of the liquid. Here,
dilatational viscoelasticity, or complex viscoelastic modulus (E*), is the quantity expressing
the relationship between the surface modification of an interfacial layer and the related

76
dilatational stress (Ravera et al., 2010; Karbaschi et al., 2014). Dilatational viscoelasticity is
the relaxation behavior of the fluid after external mechanical stress.
Complex surface elasticity modulus (E*) of the interface is defined by Gibbs as a relation of
interfacial/surface tension change (dσ) and surface area change (dA/A0) (Biolin Scientific,
2017a; KRÜSS GmbH, 2018b):
𝐸∗ =𝑑𝜎
𝑑𝐴/𝐴0. (37)
As for complex shear modulus, only pure elastic interfaces response to mechanical stress
without a phase lag. So in general, the interfacial tension follows the area change with a
delay, which is due to relaxation processes in the interfacial layer and between the interface
and the bulk system. Also complex surface elasticity composes of elastic/storage modulus
(E’) and viscous/loss modulus (E’’). E’ describes the impact of the changed area on the
concentration change and is considered as pure dilatational elasticity. E’’ describes the
viscous contribution, and time-dependent change due to gradual concentration equilibration.
(Biolin Scientific, 2017a)
For systems with surfactants, studying the dynamic interfacial layers is important for
understanding the surfactant function at the fluid interface. Surfactants adsorb at the fluid
interface. When expanding the interface, concentration of surfactant molecules with respect
to the area decreases and thus the interfacial/surface tension increases. This is the elastic
behavior of the interface (E’) and it is reversible, so the initial value of surface tension is
reached when the initial area of the interface is reached. However, as the interface expands,
the free surfactant molecules in the bulk phase diffuse to the interface and adsorption occurs
when the molecules fill the space at the interface. This process leads to time-dependent
irreversible decrease of surface/interfacial tension and is referred as viscous behavior (E’’)
of the fluid. Both elastic and viscous processes take place at the interface of a system with
surfactants, and the system response to dilatation is thus called viscoelasticity. (KRÜSS
GmbH, 2018b)

77
Mechanism of adsorption and interactions between the molecules affect the properties of the
absorbed layer and it can be studied simply via interfacial tension and dilatational
viscoelasticity (Karbaschi et al., 2014). For example, molecular re-orientation,
conformational changes and aggregation processes affect the properties of the interfacial
layer. Thus, the surface kinetics are important in development and characterization of
surfactants. Viscoelastic properties of the adsorbed interfacial layer correlate to emulsion
and foam stability. Strongly viscoelastic interfacial layer stabilizes well thin films (Langevin,
2000).
Rheology of polymer systems, such as resins, is highly dependent on polymer characteristics
such as molecular weight, molecular size and structure (chain length). These properties and
in addition temperature and concentration of polymer molecules in solution affect the
rheology of the polymer systems (Barnes et al., 1989). Chemically crosslinked polymers
form strong networks. Network strength is described with equilibrium modulus (Ge), which
is proportional to density of crosslinks. High equilibrium modulus corresponds to stiff
systems. Polymer system can be made softer by increasing the space between crosslinks or
by increasing defects to polymer network. Spacing can be done by increasing the molecular
weight of the polymer chain connecting the crosslinks or by diluting the system with a liquid.
Defects in polymer network are loops and hanging ends of polymer chains that are connected
only from the one end of the chain. Defects are formed when in production of polymer
system there is an imbalance between the number of polymer chains and crosslinkers.
(Grillet et al., 2012) For resins, the crosslink density increases as the formaldehyde:phenol
(F:P) molar ratio increases and the curing temperature increases (Halász et al., 2001).
The complex structure of a polymer system causes the wide variety of relaxation times, the
time required for a system to relax from deformation. Deformation stretch and align sections
of polymers. After deformation, the ends of the polymers can rearrange quickly, but the
middle sections must wait the ends to relax before they can relax. The longest relaxation
time of a free polymer, which determines the overall rheological behavior, is controlled by
the molecular weight of the polymer and the viscosity of the surrounding fluid (Grillet et al.
2012). The final deformation of the polymer system is determined by its equilibrium
modulus.

78
The viscoelastic nature of a polymer system and surface and interfacial tensions of the
polymer and substrate play important roles in the characterizing the adhesion properties of
the polymer system. Newtonian liquids make poor adhesives because they flow for example
under gravity and do not stay in place. On the other hand, stiff elastic rubbers separate from
a surface because they cannot deform. To function properly, polymeric adhesives must
combine liquid-like characteristics (loss modulus G”) to form good molecular contact under
an applied pressure and solid-like characteristics (storage modulus G’) to resist an applied
stress once the bond has been formed. This combination usually requires a high-molecular-
weight polymer to form the backbone of the adhesive and low-molecular-weight fractions
which favor flow and deformation. (Grillet et al., 2012)
During the crosslinking/curing process of phenol-formaldehyde (PF) adhesive, the adhesive
passes through different physical and relaxation states from the viscous to the rubbery or
even glassy state. The transition of adhesive from liquid to solid phase occurs at the gel point
(G’’ = G’) at gel time. When G’ < G’’ viscous properties dominate, and only linear or weakly
branched structures are formed. When G’ > G’’ elastic properties dominate, and highly
branched network structure is formed. (Halász et al., 2001; Grillet et al., 2012) The gelation
time is found to depend greatly on sample conditions, such as the concentration of polymer,
the gelling temperature and the solvent conditions.
Dimensionless numbers describing rheological behavior of fluids are for example Deborah
and Reynolds numbers. Deborah number is the degree of non-Newtonian behavior in a flow.
Small Deborah number represents Newtonian flow, while non-Newtonian (with both viscous
and elastic effects present) behavior occurs at intermediate range of Deborah numbers, and
high Deborah number indicates an elastic/rigid solid. Reynolds number is a measure of the
ratio of inertial forces to viscous forces of the fluid. Under low Reynolds numbers viscous
forces dominate and the flow is laminar, and under high Reynolds numbers inertia forces
predominates and the flow may be turbulent. (Goodwin and Hughes, 2008)
Rheology has a major role especially in studying the nature of colloidal systems, a mixture
of dispersed particles (solid, liquid or gas) and dispersion medium (solid, liquid or gas),
which are viscoelastic fluids (Shaw, 1980). Plywood adhesives are colloidal systems.
Rheological behavior of colloidal systems depends mainly on:

79
- viscosity of the dispersion medium
- particle concentration
- particle size and shape
- particle-particle and particle-medium interactions.
7.2 Additives to affect rheology of resins
Additives to affect rheological properties of resins are in general mainly viscosity modifiers,
such as thickeners. With water-based systems, for example cellulosics, acrylics and
associative rheology modifiers (polyurethane and polyether derivatives) may be used
(BASF, 2016). Carboxymethylcellulose (CMC) and acrylate thickeners are widely used in
paper coatings (Willenbacher et al., 2004). Other rheological additives are for example
defoamers to prevent foam generation during mixing and application of adhesive, and
dispersants to prevent settling and clumping of the mixture.
In curtain coating, thickeners improve stretchability of the coating material. Newtonian flow
behavior and high shear viscosity are preferred (BASF, 2016). Thickeners are large
molecules containing functional groups to interact with the coating material (Birkert et al.,
2006). Compatibility of thickeners with other additives, especially surfactants, must be
considered. Associative thickeners have somehow similar characteristics as surfactants and
use of multiple additives in the same adhesive composition may affect the performance of
additives (BASF, 2016).
Methoxy- and hydroxy-celluloses may be used as thickeners in ethyl, propyl or alkyl forms.
With cellulose thickeners it is possible to reach viscosities of 2000-4000 mPas. Typical
amount of thickeners added is less than 0,5 % of the resin composition. Cellulose modifiers
result more flexible film and improve dry-out resistance. However, cold-press tack is
reduced due to hydrophilic nature of cellulose modifiers. (Sellers, 1985)
CMC and acrylate thickeners for paper coatings indicate shear thinning flow behavior but
with relatively low decrease in viscosity. Acrylate thickeners indicate typical elongational
behavior of an elastic fluid as the filament diameter decreases exponentially as the function
of time. CMC indicate viscous fluid elongational behavior as the filament diameter decreases
80
more linearly. Long filament break-up times correlate with higher stretchability of the
coating material. (Willenbacher et al., 2004)
The basic structure of polyurethane and polyether derivates consists of polyethylene glycols,
hydrophobic alcohols and diisocyanates as linking groups. They are hydrophobically
modified but still water-soluble, can give coatings more Newtonian or plastic nature and can
be modified by the type of hydrophobic end group, molecular weight and degree of
branching. Hydrophobically modified polyurethanes and polyethers are abbreviated HEUR
and HMPE, respectively. Also hydrophobically modified alkali swellable emulsions
(HASE) are generally used rheological additives. (BASF, 2016)
Examples of commercial thickeners for coatings and adhesives are presented in Table XV.
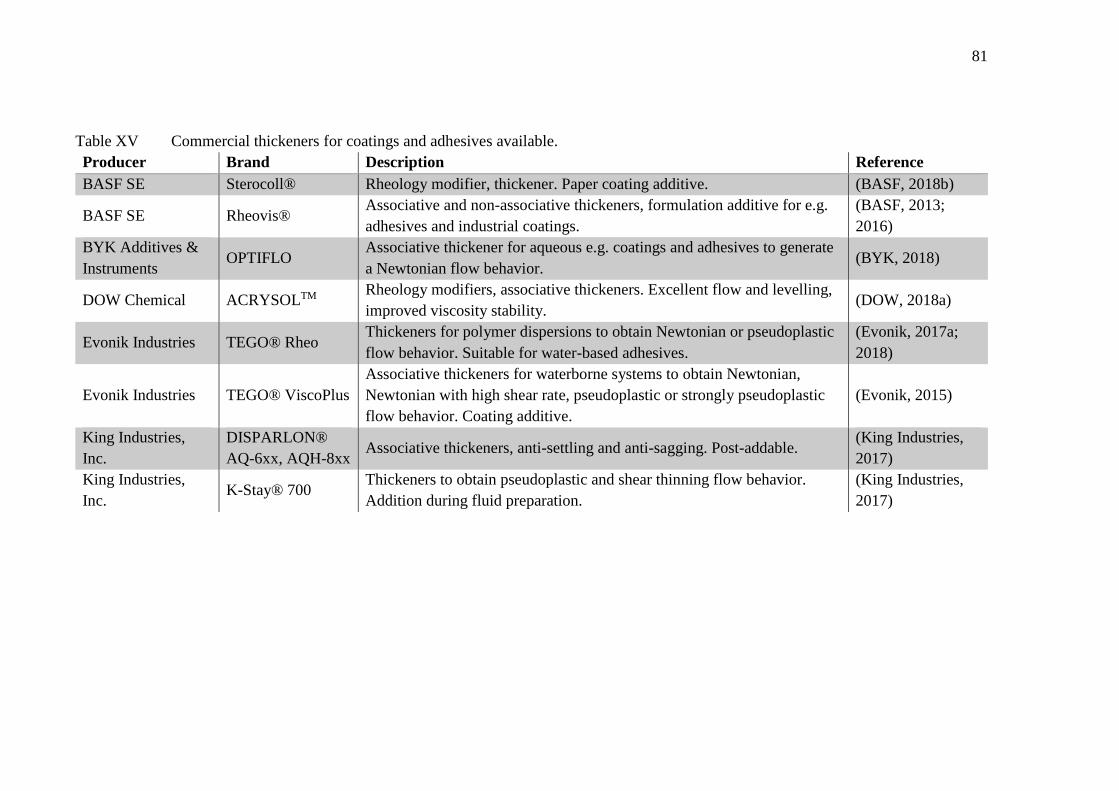
81
Table XV Commercial thickeners for coatings and adhesives available.
Producer Brand Description Reference
BASF SE Sterocoll® Rheology modifier, thickener. Paper coating additive. (BASF, 2018b)
BASF SE Rheovis® Associative and non-associative thickeners, formulation additive for e.g.
adhesives and industrial coatings.
(BASF, 2013;
2016)
BYK Additives &
Instruments OPTIFLO
Associative thickener for aqueous e.g. coatings and adhesives to generate
a Newtonian flow behavior. (BYK, 2018)
DOW Chemical ACRYSOLTM Rheology modifiers, associative thickeners. Excellent flow and levelling,
improved viscosity stability. (DOW, 2018a)
Evonik Industries TEGO® Rheo Thickeners for polymer dispersions to obtain Newtonian or pseudoplastic
flow behavior. Suitable for water-based adhesives.
(Evonik, 2017a;
2018)
Evonik Industries TEGO® ViscoPlus
Associative thickeners for waterborne systems to obtain Newtonian,
Newtonian with high shear rate, pseudoplastic or strongly pseudoplastic
flow behavior. Coating additive.
(Evonik, 2015)
King Industries,
Inc.
DISPARLON®
AQ-6xx, AQH-8xx Associative thickeners, anti-settling and anti-sagging. Post-addable.
(King Industries,
2017)
King Industries,
Inc. K-Stay® 700
Thickeners to obtain pseudoplastic and shear thinning flow behavior.
Addition during fluid preparation.
(King Industries,
2017)

82
However, in general adhesive fillers and extenders are used as thickening agents. They are
low cost powders, such as wheat flour, corn cob, soda ash (sodium carbonate), lime (calcium
carbonate) and mixtures thereof. Fillers and extenders are used to adjust adhesive viscosity
and dry matter content. Commercial rheological additives are more expensive and thus rarely
used, but could be applied to give adhesive certain type of flow properties.
Resin cooking properties to increase viscosity are high solids content, high temperature and
varying reaction time of polymerization. Thus, the degree of polymerization can be affected
(Sellers, 1985). Lignin is generally applied as high-molecular-weight (HMW) polymer into
the resin composition, which increases the viscosity of the resin more rapidly when
compared to conventional PF resins.
Foam generation is one of the operational challenges in plywood production. Foaming
causes defects on adhesive surface and thus adhesive application onto veneer is not uniform.
Foaming is particularly problematic for high viscous and high solids liquids (Evonik, 2015).
Adhesive mixing and the adhesive pumping up to the applicator in curtain coating are the
main points where foam may be generated.
Foaming can be prevented or generated foam can be broken by anti-foaming agents,
defoamers. Defoamers cause air bubbles to burst and release the air. When surfactants are
used, the surface of the liquid is filled with surfactants. Surfactants may stabilize the foam
bubble by retarding the coalescence of the bubbles (BASF, 2018a). Defoamers enter the
foam bubble surface, spread and cause an opposite Marangoni effect. Fast thinning foam
bubble collapses. Defoamers are required to have lower surface tension than surfactants.
They may be of insoluble or partially soluble in the medium, and they have positive entering
and spreading coefficient (BASF, 2013). In general, defoamers can be classified into three
groups; silicone, mineral oil and polymer defoamers.
Incompatibility of the defoamer and the binder material may cause surface defects such as
cratering or wetting problems, but foaming is well prevented. On the other hand, too good
compatibility/solubility does not accomplish anti-foaming function, but there are no
undesired influences on the surface of the material. (BASF, 2018a) Defoamers have surface

83
active properties, which may counteract with surfactants required for surface tension
reduction and curtain formation (Sellers, 1985).
In this work, defoamers are considered as rheological additives even though their
functionality at the surface of the material is described. Defoamers affect the rheology of the
material, since removal of air bubbles from the liquid affects the flowing properties. Also
surface viscosity and elasticity may be decreased if they disrupt the surface structure formed
by adsorbed surfactant molecules. In addition, the selected defoamers used in the
experimental part of the work, are mainly oil-based defoamers which do not remarkably
affect the surface tension of the resin.
Examples of commercial defoamers for coatings and adhesives are presented in Table XVI.

84
Table XVI Commercial defoamers for coatings and adhesives available.
Producer Brand Description Reference
BASF SE FoamStar® Defoamers for water-based formulations, adhesives and sealants. Silicone
and polymer-based, emulsion and powder defoamers.
(BASF, 2013;
2018a)
BASF SE Foamaster® Defoamers for water-based formulations, adhesives and sealants. Oil-
based (mineral, native and white oil), blends and organic.
(BASF, 2013;
2018a)
BASF SE Etingal® Defoamer for coatings. Prevention and elimination of surface foam. (BASF, 2018b)
BYK Additives &
Instruments BYK-0xx
Defoamers for coatings, adhesives and sealants. Optimized compatibility.
Silicone-free (polymer), silicone and mineral oil-based. (BYK, 2018)
DOW Chemical DOWFAX® Non-ionic surfactants as foam control agents, low foam characteristics. (DOW, 2018c)
DOW Chemical PxxxxE Defoamers to prevent and eliminate foam in aqueous systems. Water
insoluble polypropylene glycols. (DOW, 2018c)
Evonik Industries AIRASE®
Defoamers and deaerators for waterborne applications, optimum
compatibility. A coating additive. Polyether siloxanes and organic
polymer-based.
(Evonik, 2017b)
Evonik Industries TEGO® Foamex
Prevents foam formation in waterborne coatings and printing inks. For
high solids coatings too. Pre-existing foam is destroyed and air inclusions
are prevented. Optimized particle size for optimized compatibility.
Polyether siloxanes, mineral oils and organic polymer-based.
(Evonik, 2015;
2017b)
Evonik Industries TEGO® Antifoam
Defoamer additive for water-based formulations/adhesives/polymer
dispersions. Provides long term stability. Optimized compatibility.
Polyether siloxanes, polyether + siloxine, paraffinic oil and vegetable oil-
based.
(Evonik, 2017a;
2018)
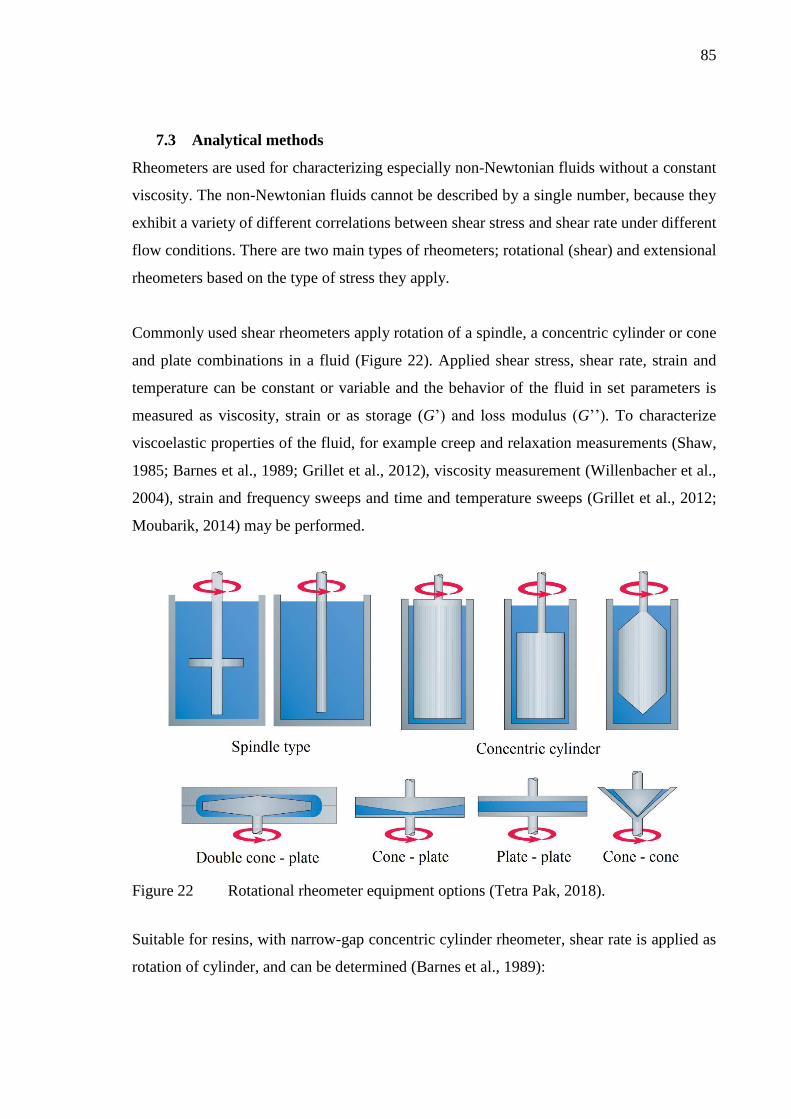
85
7.3 Analytical methods
Rheometers are used for characterizing especially non-Newtonian fluids without a constant
viscosity. The non-Newtonian fluids cannot be described by a single number, because they
exhibit a variety of different correlations between shear stress and shear rate under different
flow conditions. There are two main types of rheometers; rotational (shear) and extensional
rheometers based on the type of stress they apply.
Commonly used shear rheometers apply rotation of a spindle, a concentric cylinder or cone
and plate combinations in a fluid (Figure 22). Applied shear stress, shear rate, strain and
temperature can be constant or variable and the behavior of the fluid in set parameters is
measured as viscosity, strain or as storage (G’) and loss modulus (G’’). To characterize
viscoelastic properties of the fluid, for example creep and relaxation measurements (Shaw,
1985; Barnes et al., 1989; Grillet et al., 2012), viscosity measurement (Willenbacher et al.,
2004), strain and frequency sweeps and time and temperature sweeps (Grillet et al., 2012;
Moubarik, 2014) may be performed.
Figure 22 Rotational rheometer equipment options (Tetra Pak, 2018).
Suitable for resins, with narrow-gap concentric cylinder rheometer, shear rate is applied as
rotation of cylinder, and can be determined (Barnes et al., 1989):
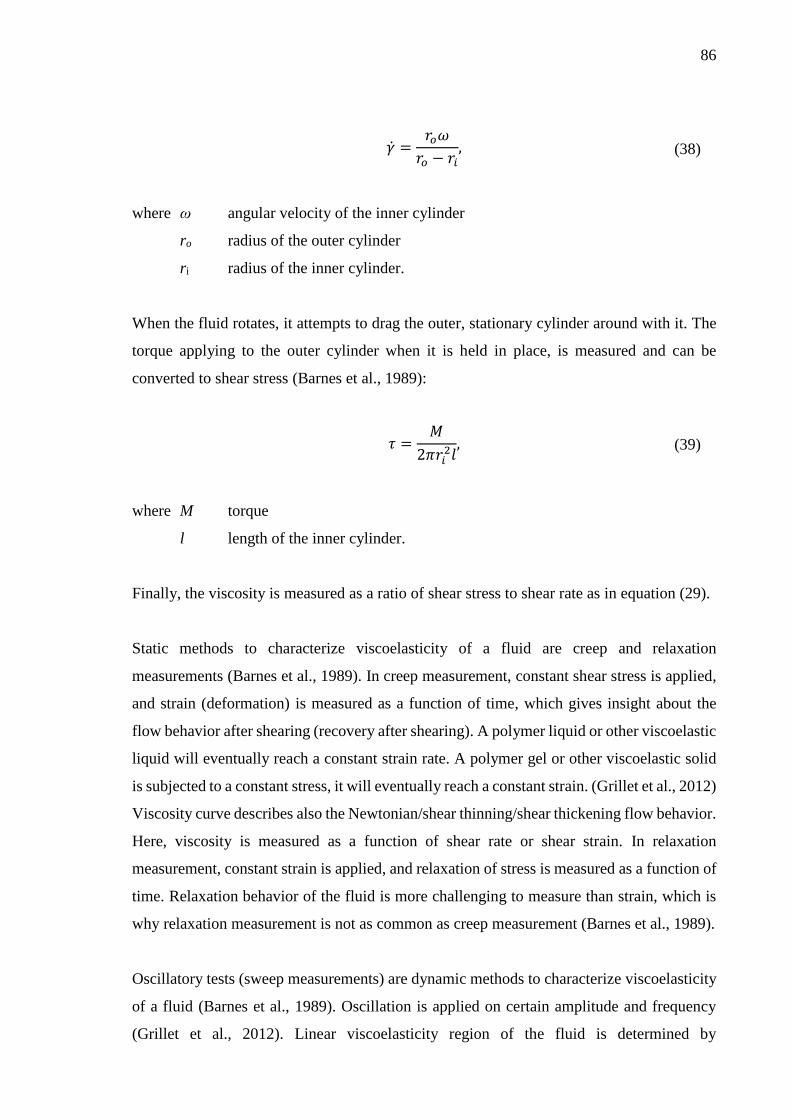
86
�� =𝑟𝑜𝜔
𝑟𝑜 − 𝑟𝑖, (38)
where ω angular velocity of the inner cylinder
ro radius of the outer cylinder
ri radius of the inner cylinder.
When the fluid rotates, it attempts to drag the outer, stationary cylinder around with it. The
torque applying to the outer cylinder when it is held in place, is measured and can be
converted to shear stress (Barnes et al., 1989):
𝜏 =𝑀
2𝜋𝑟𝑖2𝑙
, (39)
where M torque
l length of the inner cylinder.
Finally, the viscosity is measured as a ratio of shear stress to shear rate as in equation (29).
Static methods to characterize viscoelasticity of a fluid are creep and relaxation
measurements (Barnes et al., 1989). In creep measurement, constant shear stress is applied,
and strain (deformation) is measured as a function of time, which gives insight about the
flow behavior after shearing (recovery after shearing). A polymer liquid or other viscoelastic
liquid will eventually reach a constant strain rate. A polymer gel or other viscoelastic solid
is subjected to a constant stress, it will eventually reach a constant strain. (Grillet et al., 2012)
Viscosity curve describes also the Newtonian/shear thinning/shear thickening flow behavior.
Here, viscosity is measured as a function of shear rate or shear strain. In relaxation
measurement, constant strain is applied, and relaxation of stress is measured as a function of
time. Relaxation behavior of the fluid is more challenging to measure than strain, which is
why relaxation measurement is not as common as creep measurement (Barnes et al., 1989).
Oscillatory tests (sweep measurements) are dynamic methods to characterize viscoelasticity
of a fluid (Barnes et al., 1989). Oscillation is applied on certain amplitude and frequency
(Grillet et al., 2012). Linear viscoelasticity region of the fluid is determined by

87
strain/amplitude sweep (constant frequency (Hz or ω), strain varies (%), Figure 23A).
Polymer network properties are characterized in the linear domain, where G’ is constant.
From strain sweep, strain value of linearity limit (γL) can be determined. Gel point, where
phase transition takes place, is determined by time sweep (constant frequency and strain,
behavior of both moduli (G’ and G’’) as a function of time). Time sweep may also be
performed in higher temperature to study the gelation in industrially interesting temperature
(for example curing behavior of plywood adhesive (Moubarik, 2014)). Gel point may also
occur in frequency sweep. Frequency sweep (constant strain or stress, frequency varies,
Figure 23B) is used to characterize different relaxation times and to determine equilibrium
modulus. For polymer systems, the elastic response depends on the frequency of oscillation.
At low frequencies, the system has time to rearrange but with higher frequencies not. Here,
the stiffness of the system can be determined which gives insight of the degree of
crosslinking of the polymer. Highly crosslinked polymers have longer relaxation times. Gel
point is proportional to molar mass of the polymer (Mezger, 2014). System relaxation time
(λ) can be determined from gel point frequency. As the frequency approaches to zero, elastic
modulus reaches a constant value, which is the equilibrium modulus (Ge). (Grillet et al.,
2012)
Figure 23 A) Strain/amplitude sweep and B) frequency sweep examples, logarithmic
storage (G’) and loss (G’’) plotted as a function of logarithmic strain or
angular frequency, respectively. Determination of strain value of linearity
limit (γL) and relaxation time (λ).
Extensional rheometers are less common. Two interesting extensional rheometers for liquids
apply filament stretching and break-up studies. HAAKETM CaBERTM (capillary break-up

88
extensional rheometer) is a commercial rheometer by Thermo Fisher Scientific
(Willenbacher et al., 2004) used for measurement of extensional viscosity of for example
paper coatings (Voss & Tadjbach, 2004; Birkert et al., 2006). CaBERTM can be used for
characterization of fluids and semi-solids with shear viscosity range of 10-106 mPas (Thermo
Fisher Scientific, 2018). Operating principle of the rheometer is based on stretching a drop
of fluid between two parallel plates (uniaxial extensional flow). Upper plate is moved up
rapidly (50 ms), so the sample elongates and produces a liquid filament (Figure 24). The
diameter of the filament as the necking proceeds is measured by laser micrometer as a
function of time until the filament breaks-up (Figure 25). Long break-up time correlates with
high extensional viscosity.
Figure 24 Example of CaBERTM measurement. A) Filament forming. B-C) Filament
necking. D) Filament break-up. (Willenbacher et al., 2004)
Figure 25 Measurement of filament diameter as a function of time with CaBERTM
extensional rheometer. A) Sample stretched between two parallel plates and
laser micrometer measuring the diameter of the fluid. B) Typical behavior of
adhesive, viscoelastic fluid and Newtonian fluid in CaBERTM extensional
rheometer. (Willenbacher et al., 2004)
A B
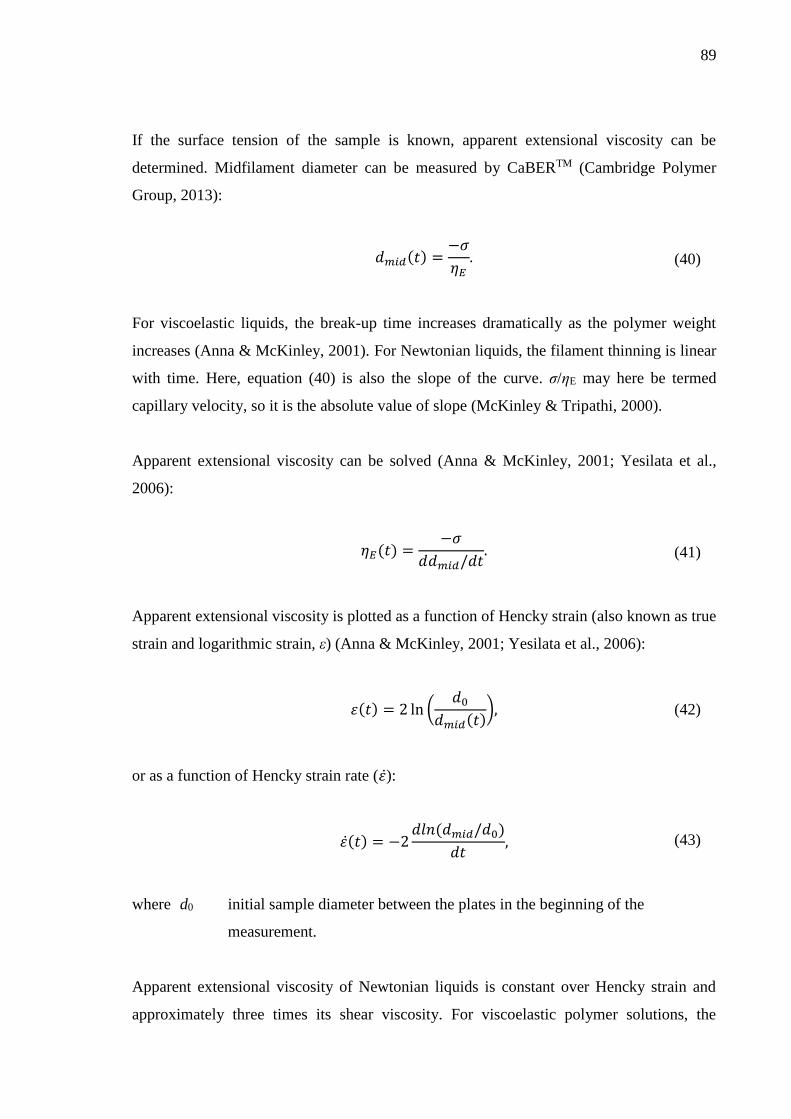
89
If the surface tension of the sample is known, apparent extensional viscosity can be
determined. Midfilament diameter can be measured by CaBERTM (Cambridge Polymer
Group, 2013):
𝑑𝑚𝑖𝑑(𝑡) =−𝜎
𝜂𝐸. (40)
For viscoelastic liquids, the break-up time increases dramatically as the polymer weight
increases (Anna & McKinley, 2001). For Newtonian liquids, the filament thinning is linear
with time. Here, equation (40) is also the slope of the curve. σ/ηE may here be termed
capillary velocity, so it is the absolute value of slope (McKinley & Tripathi, 2000).
Apparent extensional viscosity can be solved (Anna & McKinley, 2001; Yesilata et al.,
2006):
𝜂𝐸(𝑡) =−𝜎
𝑑𝑑𝑚𝑖𝑑/𝑑𝑡. (41)
Apparent extensional viscosity is plotted as a function of Hencky strain (also known as true
strain and logarithmic strain, ε) (Anna & McKinley, 2001; Yesilata et al., 2006):
𝜀(𝑡) = 2 ln (𝑑0
𝑑𝑚𝑖𝑑(𝑡)), (42)
or as a function of Hencky strain rate (𝜀):
𝜀(𝑡) = −2𝑑𝑙𝑛(𝑑𝑚𝑖𝑑/𝑑0)
𝑑𝑡, (43)
where d0 initial sample diameter between the plates in the beginning of the
measurement.
Apparent extensional viscosity of Newtonian liquids is constant over Hencky strain and
approximately three times its shear viscosity. For viscoelastic polymer solutions, the

90
apparent extensional viscosity increases as the strain increases. For adhesives, the apparent
extensional viscosity diverges as the adhesive starts to solidify over time. (Cambridge
Polymer Group, 2013)
Elongational relaxation time (λE) can be calculated from equation (Yesilate et al., 2006):
𝑑𝑚𝑖𝑑(𝑡) ≈ exp (−𝑡
3𝜆𝐸). (44)
Elongational relaxation time dependence to relaxation time obtained from oscillatory shear
rheology (λ) varies depending on the fluid material. For viscoelastic fluids, relaxation times
are approximately equal. Strain rate and elongational relaxation time can be utilized in
calculation of dimensionless Deborah number, known as stretch rate. (Anna & McKinley,
2001)
CaBERTM assumes axial symmetry of filament thinning. However, gravitational effects
break this symmetry, and cause weak axial flow downwards. Relative magnitude of the
effect compared to opposing capillary forces can be described by dimensionless Bond
number (McKinley & Tripathi, 2000; Anna & McKinley, 2001):
𝐵𝑜 = 𝜌𝑔𝑑0
2
4𝜎. (45)
The gravitational effect can be neglected if Bond number is much less than 1 (McKinley &
Tripathi, 2000).
Surface tension, viscosity, elasticity and mass transfer affect the filament stretching
phenomenon (Willenbacher et al., 2004). By monitoring the dynamics of the fluid filament
break-up following a rapid extensional deformation of the sample, information about
relaxation times, non-Newtonian flow behavior and break-up time of the fluid can be
obtained (Cambridge Polymer Group, 2013).
Cambridge Polymer Group has developed another filament stretching applying extensional
rheometer (FiSERTM), which has provided wide applicability in characterizing viscous
91
polymers fluids and melts with true uniaxial extensional flow. During the measurement,
FiSERTM elongates the sample continuously, whereas CaBERTM rapidly elongates the
sample once in the beginning of the measurement. The limitation of the device is
incompatibility with low viscosity fluids, relatively high cost and no commercial availability.
For solid samples, there are extensional viscosity accessories to be attached to shear
rheometers available. These optional accessories in general apply horizontal elongation of
the sample, which is loaded between two drums.
Viscometers measure fluid properties under only one flow condition and provide a single
value of shear viscosity. They are most applicable for characterizing of Newtonian fluids
with constant viscosity but are generally used also for non-Newtonian fluids to obtain overall
conception of viscosity of the analyzed fluid. Viscometers can be for example rotational or
glass capillary viscometers. Brookfield is very common viscometer manufacturer (Beneventi
& Guerin, 2005), which apply rotation of for example a spindle or cone into fluid.
To determine dilatational interfacial viscoelastic properties of the fluid, forced oscillation of
a bubble/drop at broad frequency range is a well-known analysis (Ravera et al., 2010;
Karbaschi et al., 2014). Here, the interfacial tension and the surface area change of the drop
is measured while the drop is pulsating at determined frequency. The pulsation/deformation
of the interfacial layer is caused by expansion/compression of a hanging drop. The
surface/interfacial tension is determined by pendant drop shape analysis method with
Young-Laplace fit (KRÜSS GmbH, 2018b). The method is simple, but possibly occurring
deviations from sphericity, caused by gravity, lead to unwanted overtones in the experiment
and thus deviations from an ideal shape of drops must be considered (Karbaschi et al., 2014).
7.4 Discussion
To summarize the studied rheological properties, Figure 26 is presented.

92
Figure 26 Summary of rheological properties studied in this work and methods to
measure the properties.
Flow behavior of the resins can be determined by shear rheometer. As stated, Newtonian
flow behavior is desired for curtain coating materials, and by rheological thickeners flow
behavior can be changed. Resins are polymer systems and thus viscoelastic properties
measured by shear rheometer oscillatory methods are interesting to be determined.
Viscoelasticity gives insight about the structural stability of the coating material.
In curtain coating, if the coating material contains long flexible molecules (polymers),
viscoelastic tensile stress will appear. Strong planar extensional flow occurs due to the liquid
acceleration as it flows down the curtain (Figure 27). The effect of viscoelastic behavior on
liquid curtain stability was investigated by Becerra and Carvalho (2011). They have shown
that the presence of small amount of high molecular weight polymer in the liquid, which
leads to high extensional viscosity, can remarkably increase the stability of the curtain.
• Shear flow
• Shear rheometer: static and oscillatory methods
• Viscometer
Shear viscosity
• Extensional flow
• Extensional rheometer: CaBERTM
• Filament elongation and break-up as a function of time
Extensional viscosity
• Combination of viscous fluid and elastic solid behavior
• Polymer systems: polymer structure, size and molecular weight
• System relaxation from deformation
Viscoelasticity
• Dilatational viscoelasticity
• Surfactant performance
• Oscillating drop
Interfacial rheology

93
Figure 27 Polymer chains of the fluid are stretched in extensional flows.
Also studying the interfacial rheology and more precisely dilatational viscoelasticity as a
measure for surfactant performance is interesting, since surfactants are going to be used in
the experimental part of this work. This measurement can be interesting to be compared to
frequency sweep of oscillatory tests, since in both determinations frequency is varied.
EXPERIMENTAL PART
In the experimental part of the work, surface chemical and rheological properties of resins
are determined. In the experiments, commercial phenol-formaldehyde (PF) resins for roller
and curtain coating and lignin-phenol-formaldehyde (LPF) resin are used as reference resins.
It can be assumed, that the commercial PF curtain resin contains unknown additives, and it
has different properties than roller coating resin. To the LPF resin, commercial surfactants
and defoamers are added to obtain similar surface chemical and rheological properties than
commercial PF curtain resin has. This gives insight about the applicability of LPF resin in
curtain coating of veneer.
Used analytical methods are surface tension, surface free energy, shear rheology, extensional
rheology and interfacial viscoelasticity. Suitability of the analytical method to be used in
determination of resin properties is reviewed. Additive performance is evaluated.
Final aim of the experimental part of this work is to determine operational windows for
additive dosing for LPF resin to be applied in curtain coating of veneer. Operational windows
are determined for two surfactants with all defoamers, based on elongation property target.

94
8 MATERIALS
Next, resins, surfactants and defoamers used in this work are reviewed. Resin and additive
combinations are presented as experiments.
8.1 Resins
In the experiments, commercial plywood phenol-formaldehyde (PF) resins for roller and
curtain coating are used as reference resins. PF resin for roller coating is further referred as
PF resin and PF resin for curtain coating is further referred as PF curtain resin.
Lignin-phenol-formaldehyde (LPF) resin produced by UPM. LPF resin contains 50 % of
lignin of the amount of phenol. Preparation of LPF adhesive is performed in Figure 28.
Figure 28 Lignin-phenol-formaldehyde resin and adhesive preparation.
Resins used in this work are stored frozen in a freezer (temperature -19 ºC). Before using
them for analyses, the resins are completely melted. Liquid resins are stored in a fridge
(temperature + 5-7 ºC) for a week at longest. Prior to use, resins are mixed for 5 minutes to
obtain homogenous composition.
Dissolving lignin, phenol and NaOH
• Increased temperature
Hydroxymethylation
• Addition of formaldehyde
Resin polymerization
• Addtition of NaOH
• Heating, mixing
• Viscosity development
Finished LPF resin

95
8.2 Additives
Surfactants used in this work are all produced by Evonik Industries AG. All surfactants are
suitable for water-based coating and adhesive formulations. Surfactants are:
- Surfactant 1 is non-ionic superwetter utilizing Gemini surfactant technology. Non-
persistent foam generation.
o Concentration: 100 %.
- Surfactant 2 is non-ionic dynamic wetting agent and in some applications molecular
defoamer.
o Concentration: component A 50-70 %, component B 10-25 %.
- Surfactant 3 is non-ionic dynamic wetting agent. Low foaming.
o Concentration: component A 100 %.
- Surfactant 4 is non-ionic, organic wetting agent. Low foaming.
o Concentration: 100 %.
In addition, one additive working as a surfactant and defoamer produced by Evonik
Industries AG is studied:
- Surfactant/Defoamer 1 is non-ionic wetting agent utilizing Gemini surfactant
technology and molecular defoamer.
o Concentration: component B 70-90 %, component C 20-35 %.
Surfactant 1 was chosen because of its superwetting ability. Surfactant 2 was chosen because
of its additional nonfoaming or in some cases defoaming ability. Surfactant 3 was chosen
because it composes of component A of surfactant 2. Surfactant 4 was chosen because of its
remarkably different chemical composition. Surfactant/defoamer 1 was chosen because of
its additional defoaming ability and it mostly composes of component B of surfactant 2.
Different surfactants have been tested previously in curtain coating trials. Based on trials,
surfactants 1-3 are considered as good additives for achieving a stable curtain. Surfactant 4
has given varying results depending on surfactant dosage. Performance of
surfactant/defoamer 1 has not been desired in trials at dosages typical for surfactants. At
lower dosages it has shown defoaming ability. In this work, effect of surfactants on LPF
resin properties is determined.

96
Surfactants are added preliminary at three dosages; 0,2 %, 0,4 % and 0,6 % of the weight of
resin. Surfactant amount 0,6 % is considered maximum dosage based on economic point of
view of industrial scale production process. Even lower dosages than 0,2 % of the weight of
resin are interesting, but this dosage is preliminary considered as a minimum amount for
achieving a stable curtain based on previous curtain coating trials.
Defoamers used in this work are:
- Defoamer 1 is organic oil defoamer produced by Evonik Industries AG. Controlling
and eliminating foam.
- Defoamer 2 is vegetable oil defoamer produced by Evonik Industries AG. Avoiding
premature coagulation.
- Defoamer 3 is non-ionic surfactant and defoamer produced by Dow Chemical.
All three defoamers have performed defoaming ability in previous laboratory foaming tests.
In curtain coating trials, performance of defoamer 1 has not been desired. In this work, effect
of defoamers on LPF resin properties is determined. Dosages of 0,03 % and 0,05 % of the
weight of resin are considered relevant for industrial scale production process, but also
amount of 0,10 % of the weight of the resin is partly studied. Compatibility of surfactants
and defoamers have also been tested previously, but not with a systematic approach.
All additives are presented in Appendix I (classified).
To add additives to a resin sample, average weight of a drop of each additive was determined
by weighing (accuracy 0,1 mg) 10 separate drops of an additive formed with 1 ml pipette.
Desired dosage of an additive was added to resin sample at the precision of a drop. After the
addition, resins were mixed and stored for at least 24 h, and mixed again prior to analyses.
Storage of resins allows additives to affect the solution.
8.3 Experiments
Final experiments of the work are presented in Appendix II, Table I and Table II. Visual
presentation of the experiments is presented in Figure 29 and Figure 30. In total the work
includes 79 experiments.

97
Figure 29 Experiments of the work. PF resin, PF curtain resin and LPF resin as the
reference resins. To LPF resin, in total 8 additives are added at different
dosage levels, surfactants primarily 0,20 %, 0,40 % and 0,60 % and
defoamers 0,03 %, 0,05 % and 0,10 %. Surfactant/defoamer 1 was added at
all dosage levels.
Figure 30 Additive combinations and additional experiments of the work. Surfactant
dosage level selected based on surface tension results so that the surface
PF resin PF curtain resin LPF resin
Surfactants 1-4
Dosage:0,20 %0,40 %0,60 %
Surfactant/Defoamer 1
Dosage:0,03 %0,05 %0,10 %
Dosage: 0,20 %0,40 %0,60%
Defoamers 1-3
Dosage:0,03 %0,05 %0,10 %
Additive combinations
Surfactant 1: 0,20 %
Surfactant 2: 0,10 %
Surfactant 3: 0,60 %
Surfactant 4: 0,20 %
Defoamers: 0,03 %0,05 %
Additional experiments
Surfactant 2: 0,40 %
Surfactant 3: 0,40 %
Defoamers: 0,03 %0,05 %

98
tension at the same level with PF curtain reference resin. Additional
experiments added based on results from extensional rheology.
9 METHODS
Next, the analytical methods, used devices and operation conditions, to determine general,
surface chemical and rheological properties of the resins performed in this work are
reviewed.
9.1 Determination of general properties of resins
General properties of the reference resins (PF resin, PF curtain resin and LPF resin) were
determined, including the following properties:
- Dry matter content, [%]
- pH, [-]
- Conductivity, [mS/m]
- Alkalinity, [%]
- Free formaldehyde content, [%]
- Gel time, [min]
- Viscosity, [cP] and [s]
- Molar mass, [-]
Dry matter content of the resins was determined by measuring approximately 1 g of resin
and drying it in the temperature 105 ºC for 3 h. pH and conductivity were determined by
Mettler Toledo SevenCompact pH/Ion S220 and SevenEasy S230 devices, respectively.
Alkalinity and free formaldehyde content were determined by internal titration methods. Gel
time was determined by setting the resin sample in a test tube into 100 ºC water and
measuring the time for resin to form gel-like structure. Viscosity was determined by
Brookfield DV1 digital viscometer (plate spindle, speed of 50 rpm) and flow viscosity cup
(FC) DIN53211 (6 mm hole) in temperatures 20 ºC and 25 ºC. Polymer molar masses
(number average and weight average), polydispersity index (PDI, Mw/Mn) and peak
maximum were determined by Thermo Dionex size exclusion chromatography (SEC)
device.

99
9.2 Determination of surface chemical properties of resins
Attension Theta optical tensiometer manufactured by Biolin Scientific was used for
determination of surface tension of the experiments. Theta tensiometer utilizes pendant drop
shape analysis method for surface tension determination. In calculation of results, LPF resin
density 1,2073 g/cm3 was used. A drop was formed with a micropipette of 200 μl and the
drop volume was 4 μl in all but one experiment with drop volume of 3,5 μl. Drop volume of
4 μl (or 3,5 μl) was the maximum for resins including surfactants to be formed and not to
drop during the measurement. For PF resin and LPF resin, larger drops could have been
formed, but the drop volume effect on obtained surface tension values was not remarkable.
The measurement was started when the drop was formed. Surface tension value after 3
seconds of the beginning of the measurement was selected. At least 5 replicates were done
for each sample and the repeatability was good. An average surface tension value was
calculated for each sample. The accuracy of the device was 0,01 mN/m. The device was
calibrated daily prior to use. Measurements were performed in temperature of 23 ± 2 ºC.
For comparison, surface tension of the reference resins was also determined with De Noüy
ring method. Manual Force Tensiometer K6 manufactured by KRÜSS GmbH was used. At
least 3 replicates were done for each sample and the repeatability of the measurement was
good. The accuracy of device utilizing the ring method was approximately 0,5 mN/m. The
device was calibrated by using water. The scale of the device was adjusted for each sample.
Attension Theta optical tensiometer was also used for contact angle measurements to
determine surface free energy of the resins. For the measurements, sufficient amount of resin
was dried in room temperature onto piece of glass. Contact angles between the solid resin
surface and sessile drop of water, ethylene glycol and diiodomethane were determined. Drop
volumes used were 3 μl for water and ethylene glycol and 1 μl for diiodomethane. The
measurement was started when the drop was detached from the capillary. Contact angle
values after 0,5 and 1 second of the beginning of the measurement were selected. At least 5
replicates were done for each sample, but the repeatability was not good. An average contact
angle value was calculated for each liquid for each sample based on at least 4 replicates. The
accuracy of the device was 0,01 º. The device was calibrated daily prior to use.
Measurements were performed in temperature of 23 ± 1 ºC and relative humidity of 50 ± 2

100
%. Total surface free energy and its components were calculated with Steven Abbott
calculator (Abbott, 2018).
9.3 Determination of rheological properties of resins
MCR302 shear rheometer manufactured by Anton Paar GmbH was used for determination
of shear viscosity, structural and viscoelastic properties of the reference resins. CC27
concentric cylinder (inner cylinder effective length 40,024 mm and diameter 26,665 mm;
outer cylinder positioning length 72,5 mm and diameter 28,920 mm) was mainly used but
also ST-24 paddle spindle stirrer was tested. Viscosity curve, amplitude sweep to determine
the linear viscoelastic region of the resins and frequency sweep were performed. For
viscosity curve, shear rate was varied first from 1 to 100 1/s and then from 100 to 1 1/s.
Shear rate was also varied from 1 to 500 1/s and from 500 to 1 1/s. For amplitude sweep,
strain varied from 0,01 to 100 % and frequencies of 15, 10 and 1 rad/s were used. For
frequency sweep, angular frequency varied from 500 to 0,5 rad/s and strains of 1, 0,5 and
0,1 % were used. Measurements were performed in temperature of 25 ºC.
HAAKETM CaBERTM 1 capillary break-up extensional rheometer manufactured by Thermo
Fischer Scientific Inc. was used for determination of elongational properties of the
experiments. Plates of 6 mm were used, so also the sample diameter was 6,0 mm. Initial and
final aspect ratios defining the sample elongation were 1,00 and 2,75, respectively, so the
sample initial height and final heights were 2,99 mm and 8,24 mm, respectively. System
imposed axial Hencky strain (εf) was 1,01, which is between the optimal range (1 < εf < 2)
determined by Anna & McKinley (2001). Measurement duration was 2 s and sampling rate
4000 Hz. For each experiment, at least 6 replicates were done and for each replicate 2
elongations. The repeatability was good. The resin filament diameter was measured as a
function of time and the break-up time determined. The diameter was normalized for scale
0-1. Apparent extensional viscosity curves were plotted as a function of strain. Plotting was
performed by V4.50 CaBER Data Analysis software. An average curve for filament
elongation was calculated for each sample based on at least 5 replicates. Average apparent
extensional viscosity curves were calculated for part of the experiments, and in calculations,
LPF resin density 1,2073 g/cm3 and surface tension determined by pendant drop method
were used. Measurements were performed in temperature of 25 ± 2 ºC.

101
Effect of additive dosage increase was studied and working curve coefficients were
computed via regression analysis (multiple linear regression, MLR), tool available in
Microsoft Excel Data Analysis Add-Inns. Regression analysis models the relationship
between multiple explanatory variables and a response variable by fitting a linear equation
to observed data (Montgomery et al., 2012).
Interfacial viscoelastic properties of the experiments were determined by using CAM 200
optical contact angle and surface tension meter manufactured by KSV Instruments Ltd and
PD-100 pulsating drop module. LPF resin density 1,2073 g/cm3 was used in heavy phase
settings and air as light phase. Drop volumes used were 27 μl, 11 μl and 15 μl for PF resin,
PF curtain resin and LPF resin, respectively, which were the maximum to be formed and not
to drop during the measurement. Measurements were performed at frequencies of 0,05 Hz,
0,10 Hz and 0,25 Hz. Frame interval of 1 second and 50 frames were recorded at frequencies
of 0,10 Hz and 0,25 Hz and frame interval of 2 seconds and 30 frames were recorded at
frequency of 0,05 Hz. OscDrop software were used in calculation of results. At least 3
replicates were performed at each frequency for each sample. For every measurement, a new
drop was formed. The repeatability was variable. Average values were calculated at each
frequency for each sample. Measurements were performed in temperature of 23 ± 1 ºC and
relative humidity of 50 ± 2 %.
10 RESULTS AND DISCUSSION
Next, the results of the analyses are performed and discussed. In addition to general
properties of the resins, surface tension was determined by pendant drop shape analysis
method and De Noüy ring method, surface free energy was determined via contact angle
measurements, shear (viscosity curve, amplitude sweep and frequency sweep) and
extensional rheological properties (filament break-up time and capillary velocity, apparent
extensional viscosity) were determined and interfacial viscoelasticity by oscillating pendant
drop shape analysis method was determined. Properties of LPF resin were modified with
commercial additives.

102
Based on these measurements, Table XVII and Table XVIII can be presented. Table XVII
summarizes the suitability of the measurement for determination of resin properties. Table
XVIII summarizes the performance evaluation of the additives to modify resin properties.
Table XVII Review of analytical methods performed in this work.
Analytical method Suitability Comments Reference to
this work
Surface tension +
Clear differences between the resins
obtained. Pendant drop method
simple, reliable and accurate.
Chapter 10.2,
Appendix III
Surface free energy - Drying of resins not applicable,
repeatability not good.
Chapter 10.5,
Appendix III
Shear rheology +/-
Viscosity curves applicable, results
of oscillatory measurements
unexpected. No characteristic
differences between the resins
obtained.
Chapter 10.3,
Appendix IV
Extensional
rheology +
Clear differences between the resins
obtained in filament break-up and
capillary velocity. Extensional
rheometer reliable and good
repeatability.
Chapter 10.4,
Appendix IV
Interfacial
viscoelasticity -
Additive performance evaluation
challenging, uncertain applicability
with resins.
Chapter 10.5,
Appendix IV
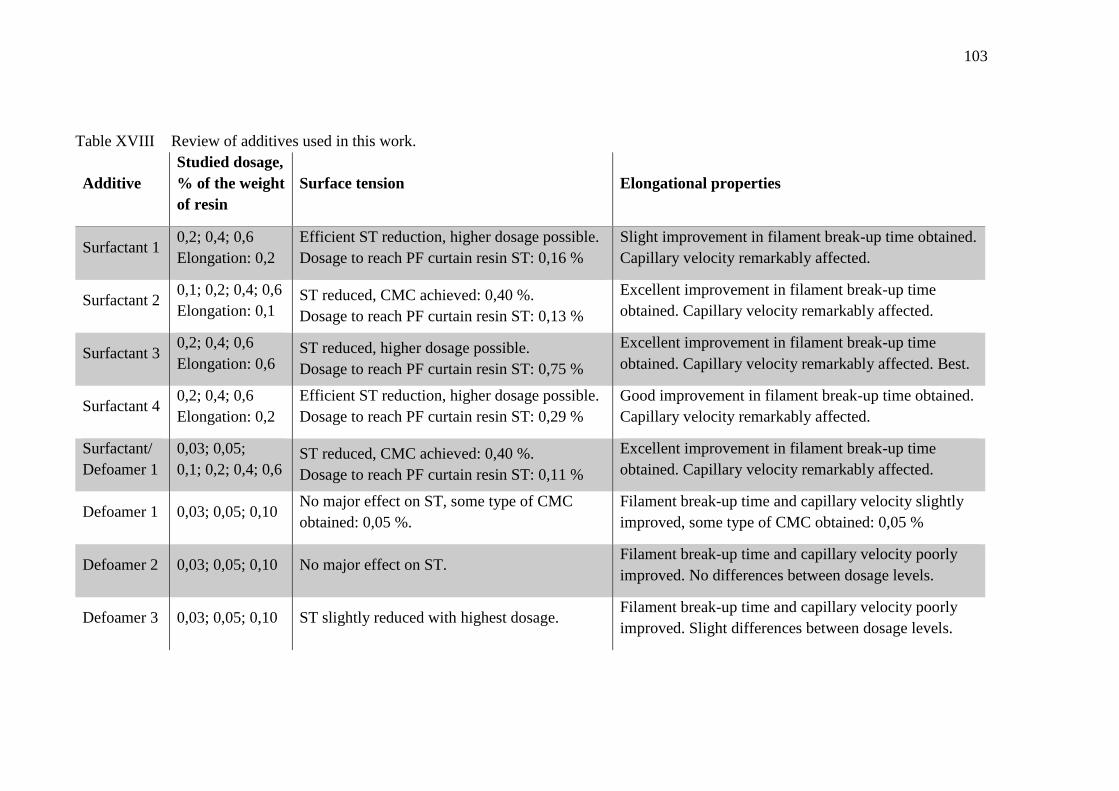
103
Table XVIII Review of additives used in this work.
Additive
Studied dosage,
% of the weight
of resin
Surface tension Elongational properties
Surfactant 1 0,2; 0,4; 0,6
Elongation: 0,2
Efficient ST reduction, higher dosage possible.
Dosage to reach PF curtain resin ST: 0,16 %
Slight improvement in filament break-up time obtained.
Capillary velocity remarkably affected.
Surfactant 2 0,1; 0,2; 0,4; 0,6
Elongation: 0,1 ST reduced, CMC achieved: 0,40 %.
Dosage to reach PF curtain resin ST: 0,13 %
Excellent improvement in filament break-up time
obtained. Capillary velocity remarkably affected.
Surfactant 3 0,2; 0,4; 0,6
Elongation: 0,6 ST reduced, higher dosage possible.
Dosage to reach PF curtain resin ST: 0,75 %
Excellent improvement in filament break-up time
obtained. Capillary velocity remarkably affected. Best.
Surfactant 4 0,2; 0,4; 0,6
Elongation: 0,2
Efficient ST reduction, higher dosage possible.
Dosage to reach PF curtain resin ST: 0,29 %
Good improvement in filament break-up time obtained.
Capillary velocity remarkably affected.
Surfactant/
Defoamer 1
0,03; 0,05;
0,1; 0,2; 0,4; 0,6 ST reduced, CMC achieved: 0,40 %.
Dosage to reach PF curtain resin ST: 0,11 %
Excellent improvement in filament break-up time
obtained. Capillary velocity remarkably affected.
Defoamer 1 0,03; 0,05; 0,10 No major effect on ST, some type of CMC
obtained: 0,05 %.
Filament break-up time and capillary velocity slightly
improved, some type of CMC obtained: 0,05 %
Defoamer 2 0,03; 0,05; 0,10 No major effect on ST. Filament break-up time and capillary velocity poorly
improved. No differences between dosage levels.
Defoamer 3 0,03; 0,05; 0,10 ST slightly reduced with highest dosage. Filament break-up time and capillary velocity poorly
improved. Slight differences between dosage levels.

104
Additive combinations were analyzed with extensional rheometer. Based on multiple linear
regression (MLR) analysis results, surfactant/defoamer 1 was considered the best, since
increased dosing was mainly important/reasonable in order to achieve desired elongational
properties. Defoamer 3 was considered poor, since increased dosing was mainly not
important. Defoamers 1 and 2 had relatively same type of performance. Surfactant 1 and 4
performances varied depending on the defoamers, the best combination was achieved with
surfactant/defoamer 1 and other defoamers provided poor results. Surfactants 2 and 3 had
relatively same type of performance, combination with all but defoamer 3 provided good
results. Operational windows were calculated to surfactants 2 and 3 in combination with all
defoamers. From the operational window, the additive dosage combination may be selected
in order to achieve the desired elongational property, as long or longer break-up time than
break-up time of PF curtain resin.
10.1 General properties of resins
General properties of the reference resins without any additives are presented in Table XIX.
Table XIX General properties of PF resin, PF curtain resin and LPF resin.
Property Unit PF resin PF curtain
resin LPF resin
Dry matter content % 47,6 47,1 45,2
pH - 12 12,2 12,6
Conductivity mS/m 1807 1677 2050
Alkalinity % 7,1 7,1 6,8
Free formaldehyde content % 0,07 0,10 0,05
Gel time min 30 26 63
Viscosity - Brookfield, 20 ºC cP 473 550 442
Viscosity - Brookfield, 25 ºC cP 332 400 312
Viscosity – FC 6, 20 ºC s 20 24 20
Viscosity – FC 6, 25 ºC s 14 19 16
Molar mass - MW - 5371 6740 8357
Molar mass - MN - 1221 1402 1228
PDI (MW/MN) - 4 5 7
Peak max. - 3296 3823 2686
The most remarkable difference between the resins is in the viscosity of the PF curtain resin.
Viscosity of the curtain resin is higher (400 cP, Brookfield 25 ºC) than the viscosity of PF
resin and LPF resin (332 cP and 312 cP, respectively). For LPF resins, longer gel time is

105
typical. This commonly is due to lower degree of polymerization than PF resins, which
affects the curing of the resin. This has been described earlier in LPF resin chapter 4.
10.2 Surface tension
Surface tension of the reference resins was determined with pendant drop shape analysis
method and De Noüy ring method. For PF resin and LPF resin the surface tensions
determined with both methods were in good relation. For PF curtain resin the surface tension
value obtained with ring method was higher than with pendant drop method. Surface tension
of PF curtain resin was however still lower than surface tension of LPF resin. The surface
tensions determined with both methods are presented in Table XX.
Table XX Surface tensions of the reference resins, determined by pendant drop shape
analysis method and De Noüy ring method.
Resin
Surface tension,
pendant drop method,
mN/m
Surface tension,
De Noüy ring method,
mN/m
PF resin 71,28 72,2
PF curtain resin 36,09 43,5
LPF resin 46,52 45,7
Pendant drop shape analysis method was selected for further surface tension measurements
due to its higher accuracy and suitability to resins. When using the ring method device, the
ring does not rapidly rise from the viscous resin when the maximum force is reached, but
slowly starts moving when the force is increased. Even though the repeatability was good,
the device was considered not to work completely as it should. Surface tension of the
experiments are plotted as a function of surfactant and defoamer dosage in Figure 31 and
Figure 32.

106
Figure 31 Surface tension of experiments plotted as a function of surfactant dosage.
Surface tension determined by pendant drop shape analysis method with
Attension Theta optical tensiometer, in temperature of 23 ± 2 ºC. Drop
(volume 4 μl, except for LPF + 0,60 % Surfactant 2 experiment 3,5 μl) formed
with 200 μl micropipette, and resin density used 1,2073 g/cm3. Values
obtained after 3,0 s from the beginning of the measurement.
As seen from Figure 31, all surfactants remarkably lowered the surface tension of LPF resin.
Surfactants 1 and 4 performed relatively similar, efficient lowering of the surface tension of
LPF resin. With dosage of 0,2 % of the weight of the resin, the surface tension was able to
be lowered approximately to the level of PF curtain resin. Further addition of both surfactants
would be possible, since critical micelle concentration (CMC) was not yet achieved with
dosage of 0,6 %. Surfactant 3 also lowered the surface tension of LPF resin and further
addition would be possible. However, the performance was not as strong as with surfactants
1 and 4. With dosage of 0,6 % of the weight of resin the surface tension was able to be
lowered to the level of PF curtain resin. For surfactant 2 and surfactant/defoamer 1 additional
experiments with dosage of 0,1 % were added, since the dosage of 0,2 % already lowered
the surface tension below the level of PF curtain resin. CMC was achieved with dosage of
0,4 % of the weight of resin for both additives. Higher dosing than 0,4 % of the surfactant 2
or surfactant/defoamer 1 is not reasonable, since further lowering of the surface tension is
not possible with these additives.
25
30
35
40
45
50
0,00 0,10 0,20 0,30 0,40 0,50 0,60
Surf
ace
tensi
on [
mN
/m]
Surfactant dosage [%]
PF curtain resin
LPF resin
LPF + Surfactant 1
LPF + Surfactant 2
LPF + Surfactant 3
LPF + Surfactant 4
LPF + Surfactant/Defoamer 1

107
The accurate required dosages of different surfactants to obtain PF curtain resin surface
tension (36,09 mN/m), estimated graphically from the surface tension curves in Figure 31,
are:
- Surfactant 1: 0,16 % of the weight of resin
- Surfactant 2: 0,13 % of the weight of resin
- Surfactant 3: 0,75 % of the weight of resin
- Surfactant 4: 0,29 % of the weight of resin
- Surfactant/Defoamer 1: 0,11 % of the weight of resin.
Based on chemical composition of the surfactants, surfactants 2 and 3 and
surfactant/defoamer 1 are somehow similar, but surfactant 3 does not have special defoaming
ability. This may be the reason, why CMC is achieved for surfactant 2 and
surfactant/defoamer 1, but for surfactant 3 a higher dosage is required. Surfactant 1 is
reported as superwetter utilizing Gemini technology, which could imply that large reductions
to surface tension can be achieved and thus CMC is not yet achieved. Surfactant 4
remarkably different chemistry seem to function in resin solution relatively well, based on
this analytical method.
Figure 32 Surface tension of experiments plotted as a function of defoamer dosage.
Surface tension determined by pendant drop shape analysis method with
Attension Theta optical tensiometer, in temperature of 23 ± 2 ºC. Drop
35
40
45
50
0,00 0,02 0,04 0,06 0,08 0,10
Surf
ace
tensi
on [
mN
/m]
Defoamer dosage [%]
PF curtain resin
LPF resin
LPF + Defoamer 1
LPF + Defoamer 2
LPF + Defoamer 3
LPF + Surfactant/Defoamer 1
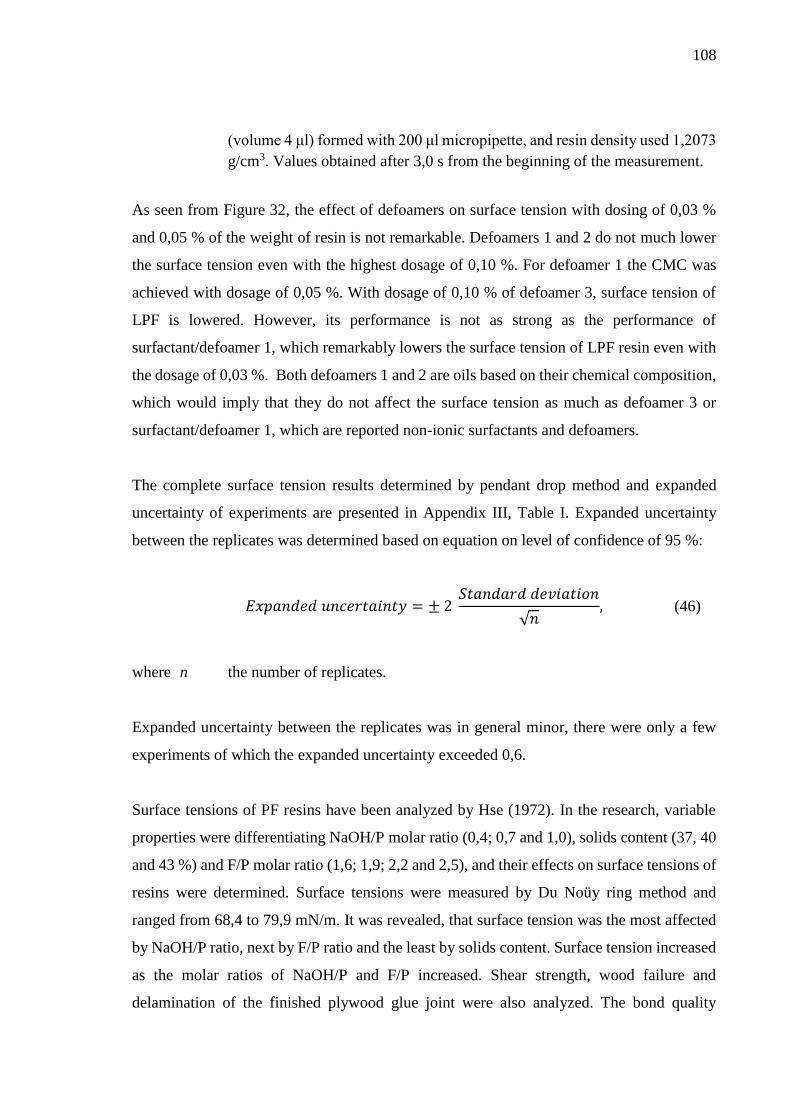
108
(volume 4 μl) formed with 200 μl micropipette, and resin density used 1,2073
g/cm3. Values obtained after 3,0 s from the beginning of the measurement.
As seen from Figure 32, the effect of defoamers on surface tension with dosing of 0,03 %
and 0,05 % of the weight of resin is not remarkable. Defoamers 1 and 2 do not much lower
the surface tension even with the highest dosage of 0,10 %. For defoamer 1 the CMC was
achieved with dosage of 0,05 %. With dosage of 0,10 % of defoamer 3, surface tension of
LPF is lowered. However, its performance is not as strong as the performance of
surfactant/defoamer 1, which remarkably lowers the surface tension of LPF resin even with
the dosage of 0,03 %. Both defoamers 1 and 2 are oils based on their chemical composition,
which would imply that they do not affect the surface tension as much as defoamer 3 or
surfactant/defoamer 1, which are reported non-ionic surfactants and defoamers.
The complete surface tension results determined by pendant drop method and expanded
uncertainty of experiments are presented in Appendix III, Table I. Expanded uncertainty
between the replicates was determined based on equation on level of confidence of 95 %:
𝐸𝑥𝑝𝑎𝑛𝑑𝑒𝑑 𝑢𝑛𝑐𝑒𝑟𝑡𝑎𝑖𝑛𝑡𝑦 = ± 2 𝑆𝑡𝑎𝑛𝑑𝑎𝑟𝑑 𝑑𝑒𝑣𝑖𝑎𝑡𝑖𝑜𝑛
√𝑛, (46)
where n the number of replicates.
Expanded uncertainty between the replicates was in general minor, there were only a few
experiments of which the expanded uncertainty exceeded 0,6.
Surface tensions of PF resins have been analyzed by Hse (1972). In the research, variable
properties were differentiating NaOH/P molar ratio (0,4; 0,7 and 1,0), solids content (37, 40
and 43 %) and F/P molar ratio (1,6; 1,9; 2,2 and 2,5), and their effects on surface tensions of
resins were determined. Surface tensions were measured by Du Noüy ring method and
ranged from 68,4 to 79,9 mN/m. It was revealed, that surface tension was the most affected
by NaOH/P ratio, next by F/P ratio and the least by solids content. Surface tension increased
as the molar ratios of NaOH/P and F/P increased. Shear strength, wood failure and
delamination of the finished plywood glue joint were also analyzed. The bond quality

109
decreased as the surface tension increased but may be partly due to difficulties in adhesive
spreading. (Hse, 1972)
Yang and Frazier studied the influence of organic fillers on surface tension (2016b) and
rheology (2016a) of PF adhesives (the latter reviewed later). Here, PF resole resins are used
for production of veneer-based wood composites such as plywood and laminated veneer
lumber. Adhesive contains PF resin, water, sodium hydroxide, wheat flour extender, sodium
carbonate and different organic fillers. In their studies, the used organic fillers were flours
of walnut shell, red alder bark and corn cob residue.
Surface tension of the adhesive affects wettability of the surface and adhesive penetration,
but also glue joint water retention, prepress tack and final bond quality (Yang and Frazier,
2016b). Methods used to determinate the surface tension were drop weight method with two
corrections and drop shape analysis. All methods were in reasonable agreement. PF resin
had surface tension of 67,1-69,0 mN/m. Wheat flour extender and organic fillers all reduced
the surface tension of PF adhesive (Table XXI). Surface tension reduction can be explained
by the chemical composition of the extender and fillers. Alkaline resin releases the
components of extender (lipids, polysaccharides and proteins) and extractives of fillers (e.g.
xylan and lignin) in the substances, which act as surface active compounds and reduce
surface tension. The influence of adhesive viscosity on surface tension measurement when
using different size syringe needles for formation of the drop was also analyzed. Viscosity
was found to affect the surface tension, but not significantly. Age of the adhesive affected
the surface tension remarkably, since the viscosity of the adhesive increased during storage.
Most change occurred within the first 8 hours of storing (Table XXI). However, as
conclusions it can be stated that drop shape analysis and the two largest needles (inner radius
0,4 mm and 0,6 mm) provided the most systematic and reliable results.
Table XXI Surface tension of PF resin and PF adhesives with wheat flour extender and
organic fillers after preparation and after 8 h of storing in room temperature
(combined from Yang and Frazier (2016b)).
Sample Surface tension,
mN/m, 0 h
Surface tension,
mN/m, 8 h
PF resin 67,1-69,0 N.A.

110
PF adhesive including wheat flour extender 60,8-62,8 N.A.
PF adhesive including wheat flour extender +
alder bark filler 50,2-51,3 48,3-50,5
PF adhesive including wheat flour extender +
walnut shell filler 51,4-53,8 48,8-51,6
PF adhesive including wheat flour extender +
corn cob filler 54,9-58,0 52,4-54,8
Reviewed in curtain coating resin/adhesive chapter 5.3, Bond and Moehl (1975) reported PF
resin without additives having surface tension of 69,7 mN/m. Surface tension of PF resin
determined in this work is in good agreement with surface tension results determined by Hse
(1972), Yang and Frazier (2016b) and Bond and Moehl (1975). Schweizer (2004) concluded
that for paper curtain coatings, surface tension must be below 40 mN/m to achieve stable
curtain. The studied patents by Järvi (1969) and Bond and Moehl (1975) concluded that
surface tension of 30-55 mN/m is required to obtain a good curtain. PF curtain resin surface
tension is in line with both requirements. However, in previous curtain coating trials it has
been noticed, that LPF resin surface tension (46,52 mN/m) is not sufficient for successful
curtain formation. This strengthens the validity for surface tension requirement presented by
Schweizer (2004).
10.3 Shear rheology
Reference resins were analyzed with shear rheometer. In Figure 33, viscosity curves of
reference resins are performed.

111
Figure 33 Viscosity curves of the reference resins, viscosity as a function of shear rate,
determined by MCR302 shear rheometer and CC27 cylinder, in temperature
of 25 ºC. Shear rate varied first from 1-100 1/s (lighter curves) and then from
100-1 1/s (darker curves).
As seen from Figure 33, behavior of the resins is almost Newtonian. When studying the
curves where shear rate varied from 1-100 1/s, a slight shear thinning at low shear rates
(especially with PF resin) can be noticed. At shear rates higher than 20 1/s, viscosity remains
constant, which implies Newtonian liquid type of behavior. Same observation was also done
by Domínguez et al. (2013) and Yang and Frazier (2016a).
After shearing, no remarkable structural deformation can be noticed. This can be concluded,
since the curves where shear rate varied from 100-1 1/s, are very close to first curves (Yang
and Frazier, 2016a). Also higher shear rates were tested, up to 500 1/s. This was performed
to ensure, that the viscosity remains constant even at higher shear rates, and it did. Viscosity
levels of the resins are in line with resin viscosities measured by Brookfield 25 ºC. PF curtain
resin has the highest viscosity, PF resin the second highest and LPF resin the lowest.
Further results from shear rheometer, amplitude and frequency sweep curves of the resins,
are presented in Appendix IV, Figure 1 and Figure 2. Results are presented and discussed in
Appendix IV, because they were unexpected based on literature (Domínguez et al. 2013;
310
320
330
340
350
360
370
380
390
0 20 40 60 80 100
Vis
cosi
ty [
mP
as]
Shear rate [1/s]
PF resin,
shear rate 1-100 1/s
PF resin,
shear rate 100-1 1/s
PF curtain resin,
shear rate 1-100 1/s
PF curtain resin,
shear rate 100-1 1/s
LPF resin,
shear rate 1-100 1/s
LPF resin,
shear rate 100-1 1/s

112
Moubarik, 2014; Yang and Frazier, 2016a) and did not imply differences between the resins.
The results from amplitude and frequency sweeps imply that all resins are ideally Newtonian
liquids, since storage modulus was not plotted in any of the measurements, even though
measurement variables were changed. Since storage modulus was not plotted, also further
calculations based on frequency sweep results (complex shear modulus (G*) and further
complex viscosity (η*) and zero-shear viscosity (η0), and relaxation time (λ)) could not been
performed reliably.
10.4 Extensional rheology
With extensional rheometer, the reference resins and additive performance were studied
based on elongational properties. Based on pendant drop surface tension determinations, the
following surfactant dosages for LPF resin were primarily selected for extensional rheometer
analyses:
- Surfactant 1: 0,20 % of the weight of resin (experiment 4)
- Surfactant 2: 0,10 % of the weight of resin (experiment 7)
- Surfactant 3: 0,60 % of the weight of resin (experiment 13)
- Surfactant 4: 0,20 % of the weight of resin (experiment 14)
- Surfactant/Defoamer 1: 0,10 % of the weight of resin (experiment 19)
By selection of these experiments, the surface tension of all experiments was approximately
the same and on the same level to commercial PF curtain resin, 35-38 mN/m. Defoamer
dosages without surfactants were 0,03 %, 0,05 % and 0,10 % and with surfactants 0,03 %
and 0,05 %, of the weight of LPF resin. Surfactant/defoamer 1 was considered as a defoamer
in additive combinations.
Filament elongation as a function of time and break-up time of reference resins are presented
in Figure 34. Bond numbers (equation 45) for the reference resins are 1,50; 2,95 and 2,29,
respectively for PF resin, PF curtain resin and LPF resin. To neglect the gravitational effects,
the Bond number should be much less than 1, for example < 0,1 (McKinley & Tripathi,
2000). When solving the diameter from equation (45), the resulting diameter is the upper
limit for validity of data. Those diameters are 1,55 mm, 1,10 mm and 1,25 mm, respectively
for PF resin, PF curtain resin and LPF resin, and cover approximately 40 ms from the
beginning of the measurement. Limiting diameter is approximately the same for resins
including surfactants, since the surface tension is approximately the same.

113
Figure 34 Elongational properties of the reference resins. Normalized diameter of
filament elongation and break-up as a function of time determined by
HAAKETM CaBERTM 1. Measurement was performed with 6 mm plates with
initial and final aspect ratio of 1,00 and 2,75, respectively, and in temperature
of 25 ± 2 ºC.
As seen from Figure 34, all resins perform Newtonian liquid behavior by linear curves.
However, the difference in filament break-up time (when diameter is zero) and capillary
velocity (absolute value of slope of the curve) between the PF curtain resin and PF and LPF
resins is remarkable. Surface tension does give insight about the elongation behavior, since
the break-up time extends as the surface tension lowers. However, extensional viscosity does
also affect the break-up time, since otherwise break-up time of LPF resin would be closer to
PF curtain resin as its surface tension is closer to PF curtain resin than to PF resin. Based on
Figure 34, when pursuing the properties of PF curtain resin, long break-up time and small
capillary velocity are desired.
In Figure 35, the effect of surfactants on LPF resin elongational properties are presented.
0
0,05
0,1
0,15
0,2
0,25
0,3
0,35
0 0,05 0,1 0,15 0,2 0,25 0,3
No
rmal
ized
dia
met
er [
-]
Time [s]
PF resin
PF curtain resin
LPF resin

114
Figure 35 Effect of surfactants (varying dosage 0,2 %, 0,1 %, 0,6 %, 0,2 % and 0,1 %
of the weight of resin for surfactants 1-4 and surfactant/defoamer 1,
respectively) on LPF resin elongational properties. Normalized diameter of
filament elongation and break-up as a function of time determined by
HAAKETM CaBERTM 1. Measurement was performed with 6 mm plates with
initial and final aspect ratio of 1,00 and 2,75, respectively, and in temperature
of 25 ± 2 ºC.
As seen from Figure 35, all surfactants affect the elongation of LPF resin. Surfactant 1
remarkably changes the capillary velocity to match the velocity of PF curtain resin.
However, the break-up time is still remarkably lower than break-up time of PF curtain resin.
Surfactants 2-4 and surfactant/defoamer 1 match the curve of PF curtain resin better than
surfactant 1. Also surfactants 2-4 and surfactant/defoamer 1 change the capillary velocity of
the resin. With surfactants 2 and 3 and surfactant/defoamer 1 the break-up time is almost as
long as the break-up time of PF curtain resin. Surfactant 4 does not longer the break-up time
as much, but still more than surfactant 1. The performance of surfactant 1 may be due to its
primary superwetting ability and may thus not affect the elongation so remarkably.
In Figure 36, Figure 37, Figure 38 and Figure 39, the effect of defoamers and defoamer
dosages on LPF resin elongational properties are presented.
0
0,05
0,1
0,15
0,2
0,25
0,3
0,35
0 0,05 0,1 0,15 0,2 0,25 0,3
No
rmal
ized
dia
met
er [
-]
Time [s]
PF curtain resin
LPF resin
LPF resin + 0,2 % Surfactant 1
LPF resin + 0,1 % Surfactant 2
LPF resin + 0,6 % Surfactant 3
LPF resin + 0,2 % Surfactant 4
LPF resin + 0,1 % Surfactant/Defoamer 1
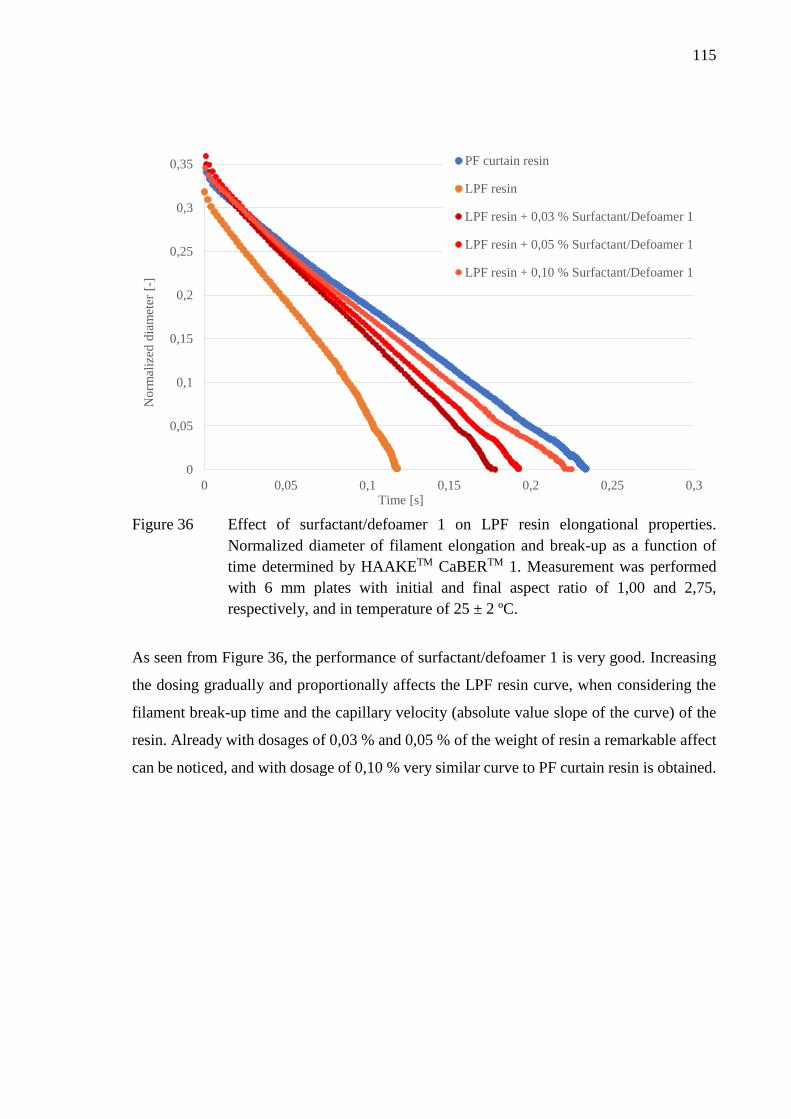
115
Figure 36 Effect of surfactant/defoamer 1 on LPF resin elongational properties.
Normalized diameter of filament elongation and break-up as a function of
time determined by HAAKETM CaBERTM 1. Measurement was performed
with 6 mm plates with initial and final aspect ratio of 1,00 and 2,75,
respectively, and in temperature of 25 ± 2 ºC.
As seen from Figure 36, the performance of surfactant/defoamer 1 is very good. Increasing
the dosing gradually and proportionally affects the LPF resin curve, when considering the
filament break-up time and the capillary velocity (absolute value slope of the curve) of the
resin. Already with dosages of 0,03 % and 0,05 % of the weight of resin a remarkable affect
can be noticed, and with dosage of 0,10 % very similar curve to PF curtain resin is obtained.
0
0,05
0,1
0,15
0,2
0,25
0,3
0,35
0 0,05 0,1 0,15 0,2 0,25 0,3
No
rmal
ized
dia
met
er [
-]
Time [s]
PF curtain resin
LPF resin
LPF resin + 0,03 % Surfactant/Defoamer 1
LPF resin + 0,05 % Surfactant/Defoamer 1
LPF resin + 0,10 % Surfactant/Defoamer 1
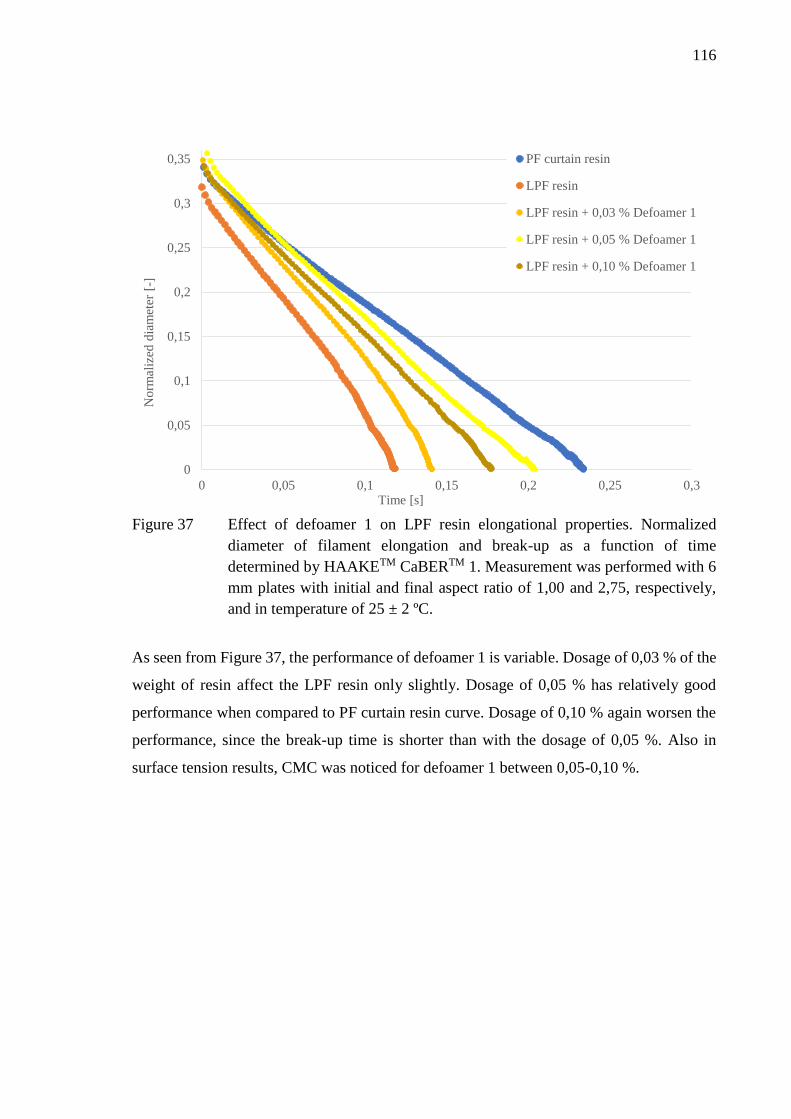
116
Figure 37 Effect of defoamer 1 on LPF resin elongational properties. Normalized
diameter of filament elongation and break-up as a function of time
determined by HAAKETM CaBERTM 1. Measurement was performed with 6
mm plates with initial and final aspect ratio of 1,00 and 2,75, respectively,
and in temperature of 25 ± 2 ºC.
As seen from Figure 37, the performance of defoamer 1 is variable. Dosage of 0,03 % of the
weight of resin affect the LPF resin only slightly. Dosage of 0,05 % has relatively good
performance when compared to PF curtain resin curve. Dosage of 0,10 % again worsen the
performance, since the break-up time is shorter than with the dosage of 0,05 %. Also in
surface tension results, CMC was noticed for defoamer 1 between 0,05-0,10 %.
0
0,05
0,1
0,15
0,2
0,25
0,3
0,35
0 0,05 0,1 0,15 0,2 0,25 0,3
No
rmal
ized
dia
met
er [
-]
Time [s]
PF curtain resin
LPF resin
LPF resin + 0,03 % Defoamer 1
LPF resin + 0,05 % Defoamer 1
LPF resin + 0,10 % Defoamer 1

117
Figure 38 Effect of defoamer 2 on LPF resin elongational properties. Normalized
diameter of filament elongation and break-up as a function of time
determined by HAAKETM CaBERTM 1. Measurement was performed with 6
mm plates with initial and final aspect ratio of 1,00 and 2,75, respectively,
and in temperature of 25 ± 2 ºC.
As seen from Figure 38, the dosing of defoamer 3 does not affect the performance of the
additive. The elongation of LPF resin is slightly affected, but there is no difference between
the dosage levels. Also in surface tension results, dosage levels did practically have no
differences.
0
0,05
0,1
0,15
0,2
0,25
0,3
0,35
0 0,05 0,1 0,15 0,2 0,25 0,3
No
rmal
ized
dia
met
er [
-]
Time [s]
PF curtain resin
LPF resin
LPF resin + 0,03 % Defoamer 2
LPF resin + 0,05 % Defoamer 2
LPF resin + 0,10 % Defoamer 2
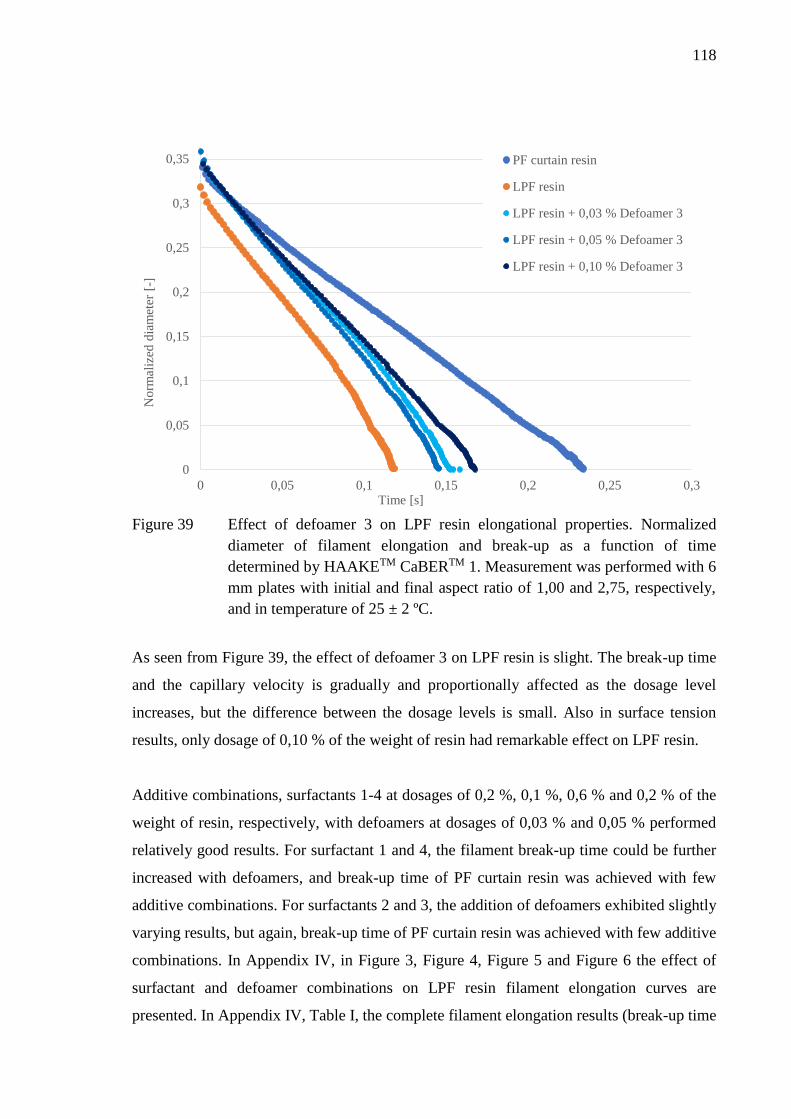
118
Figure 39 Effect of defoamer 3 on LPF resin elongational properties. Normalized
diameter of filament elongation and break-up as a function of time
determined by HAAKETM CaBERTM 1. Measurement was performed with 6
mm plates with initial and final aspect ratio of 1,00 and 2,75, respectively,
and in temperature of 25 ± 2 ºC.
As seen from Figure 39, the effect of defoamer 3 on LPF resin is slight. The break-up time
and the capillary velocity is gradually and proportionally affected as the dosage level
increases, but the difference between the dosage levels is small. Also in surface tension
results, only dosage of 0,10 % of the weight of resin had remarkable effect on LPF resin.
Additive combinations, surfactants 1-4 at dosages of 0,2 %, 0,1 %, 0,6 % and 0,2 % of the
weight of resin, respectively, with defoamers at dosages of 0,03 % and 0,05 % performed
relatively good results. For surfactant 1 and 4, the filament break-up time could be further
increased with defoamers, and break-up time of PF curtain resin was achieved with few
additive combinations. For surfactants 2 and 3, the addition of defoamers exhibited slightly
varying results, but again, break-up time of PF curtain resin was achieved with few additive
combinations. In Appendix IV, in Figure 3, Figure 4, Figure 5 and Figure 6 the effect of
surfactant and defoamer combinations on LPF resin filament elongation curves are
presented. In Appendix IV, Table I, the complete filament elongation results (break-up time
0
0,05
0,1
0,15
0,2
0,25
0,3
0,35
0 0,05 0,1 0,15 0,2 0,25 0,3
No
rmal
ized
dia
met
er [
-]
Time [s]
PF curtain resin
LPF resin
LPF resin + 0,03 % Defoamer 3
LPF resin + 0,05 % Defoamer 3
LPF resin + 0,10 % Defoamer 3
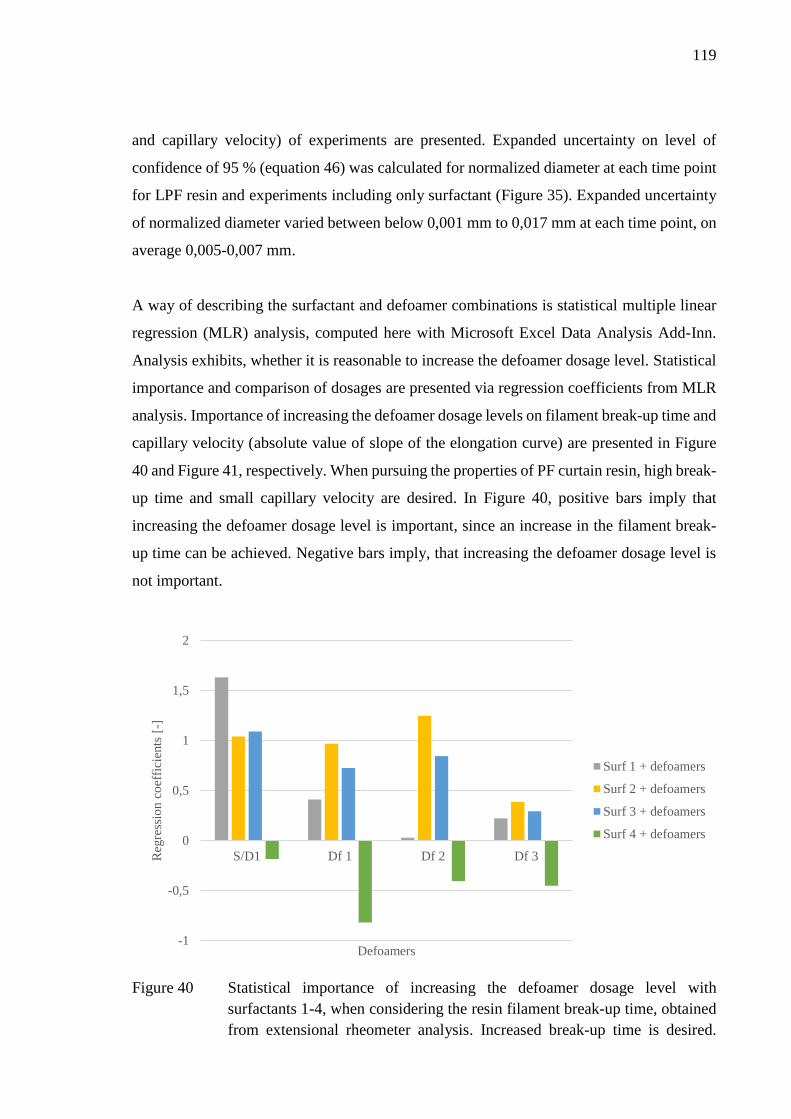
119
and capillary velocity) of experiments are presented. Expanded uncertainty on level of
confidence of 95 % (equation 46) was calculated for normalized diameter at each time point
for LPF resin and experiments including only surfactant (Figure 35). Expanded uncertainty
of normalized diameter varied between below 0,001 mm to 0,017 mm at each time point, on
average 0,005-0,007 mm.
A way of describing the surfactant and defoamer combinations is statistical multiple linear
regression (MLR) analysis, computed here with Microsoft Excel Data Analysis Add-Inn.
Analysis exhibits, whether it is reasonable to increase the defoamer dosage level. Statistical
importance and comparison of dosages are presented via regression coefficients from MLR
analysis. Importance of increasing the defoamer dosage levels on filament break-up time and
capillary velocity (absolute value of slope of the elongation curve) are presented in Figure
40 and Figure 41, respectively. When pursuing the properties of PF curtain resin, high break-
up time and small capillary velocity are desired. In Figure 40, positive bars imply that
increasing the defoamer dosage level is important, since an increase in the filament break-
up time can be achieved. Negative bars imply, that increasing the defoamer dosage level is
not important.
Figure 40 Statistical importance of increasing the defoamer dosage level with
surfactants 1-4, when considering the resin filament break-up time, obtained
from extensional rheometer analysis. Increased break-up time is desired.
-1
-0,5
0
0,5
1
1,5
2
S/D1 Df 1 Df 2 Df 3Reg
ress
ion c
oef
fici
ents
[-]
Defoamers
Surf 1 + defoamers
Surf 2 + defoamers
Surf 3 + defoamers
Surf 4 + defoamers
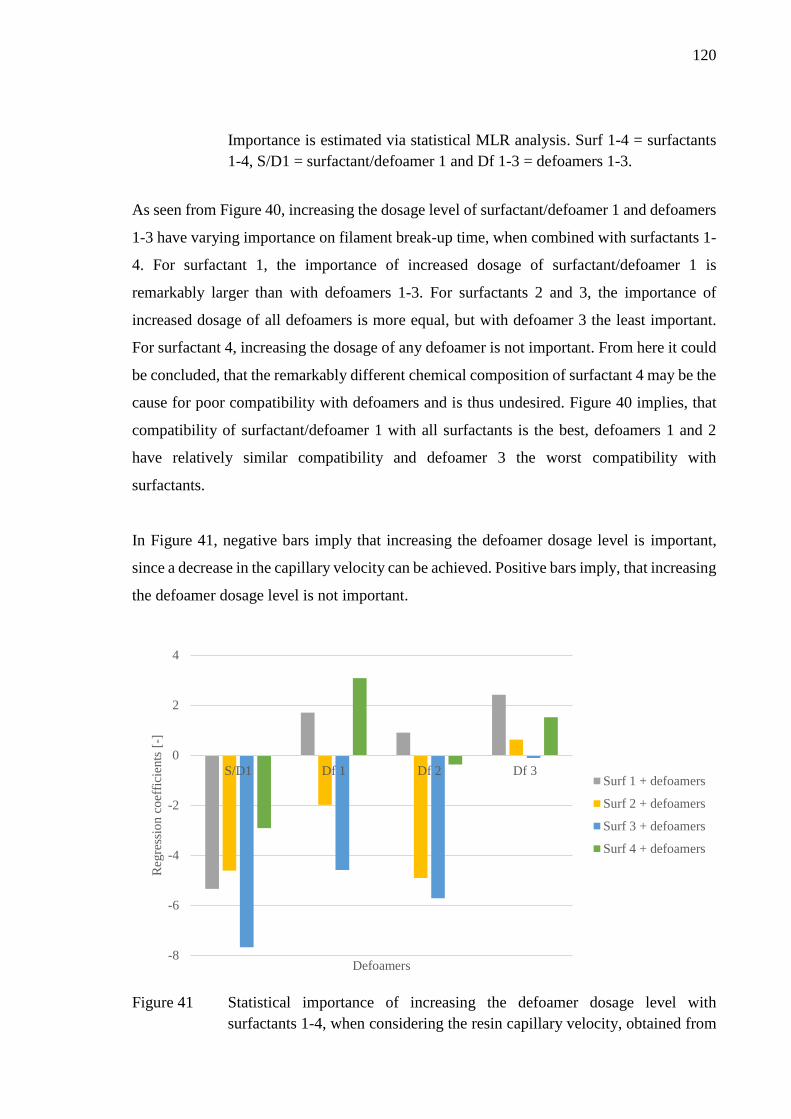
120
Importance is estimated via statistical MLR analysis. Surf 1-4 = surfactants
1-4, S/D1 = surfactant/defoamer 1 and Df 1-3 = defoamers 1-3.
As seen from Figure 40, increasing the dosage level of surfactant/defoamer 1 and defoamers
1-3 have varying importance on filament break-up time, when combined with surfactants 1-
4. For surfactant 1, the importance of increased dosage of surfactant/defoamer 1 is
remarkably larger than with defoamers 1-3. For surfactants 2 and 3, the importance of
increased dosage of all defoamers is more equal, but with defoamer 3 the least important.
For surfactant 4, increasing the dosage of any defoamer is not important. From here it could
be concluded, that the remarkably different chemical composition of surfactant 4 may be the
cause for poor compatibility with defoamers and is thus undesired. Figure 40 implies, that
compatibility of surfactant/defoamer 1 with all surfactants is the best, defoamers 1 and 2
have relatively similar compatibility and defoamer 3 the worst compatibility with
surfactants.
In Figure 41, negative bars imply that increasing the defoamer dosage level is important,
since a decrease in the capillary velocity can be achieved. Positive bars imply, that increasing
the defoamer dosage level is not important.
Figure 41 Statistical importance of increasing the defoamer dosage level with
surfactants 1-4, when considering the resin capillary velocity, obtained from
-8
-6
-4
-2
0
2
4
S/D1 Df 1 Df 2 Df 3
Reg
ress
ion c
oef
fici
ents
[-]
Defoamers
Surf 1 + defoamers
Surf 2 + defoamers
Surf 3 + defoamers
Surf 4 + defoamers

121
extensional rheometer analysis. Decreased capillary velocity is desired.
Importance is estimated via statistical MLR analysis. Surf 1-4 = surfactants
1-4, S/D1 = surfactant/defoamer 1 and Df 1-3 = defoamers 1-3.
As seen also from Figure 41, increasing the dosage level of surfactant/defoamer 1 and
defoamers 1-3 have varying importance on capillary velocity, when combined with
surfactants 1-4. For surfactants 1 and 4, only increased dosage of surfactant/defoamer 1 is
important. For surfactants 2 and 3, all but increased dosage of defoamer 3 are important.
Also Figure 41 implies, that compatibility of surfactant/defoamer 1 with all surfactants is the
best, defoamers 1 and 2 have relatively similar compatibility and defoamer 3 the worst
compatibility with surfactants.
When considering the additive combinations and their chemical compositions, based on
elongational properties, it could be concluded, that chemical composition of defoamer 3
(non-ionic surfactant and defoamer) does not function with surfactants as desired. Defoamer
3 can be assumed to have more complex chemical composition than defoamers 1 and 2 (oils),
and thus their compatibility is better with surfactants 1-4. Surfactant/defoamer 1 has
somehow similar chemical composition than surfactants 2 and 3, and may thus strengthen
the effect on elongation properties.
Based on these results, surfactants 2 and 3 were considered the best out of the studied four
surfactants. The filament break-up time of PF curtain resin was achieved with a few additive
combinations, with all surfactants. However, based on MLR analysis, surfactant 1 performed
variable and surfactant 4 in general poor combinations with defoamers, and surfactants 2
and 3 performed good compatibility. This means, that increasing the defoamer dosage level
further improved the elongational properties of the LPF resin.
An operational window, where the interaction effect of surfactant and defoamer
combinations could be detected and specific elongational property of LPF resin could be
achieved was desired to obtain for surfactants 2 and 3. Thus, further measurements with
extensional rheometer were performed for surfactant 2 and 3 dosages of 0,40 % of the weight
of resin (experiments 9 and 12) and combinations with all defoamers. In Appendix IV, in
Figure 7 and Figure 8 the effect of surfactant and defoamer combinations on LPF resin
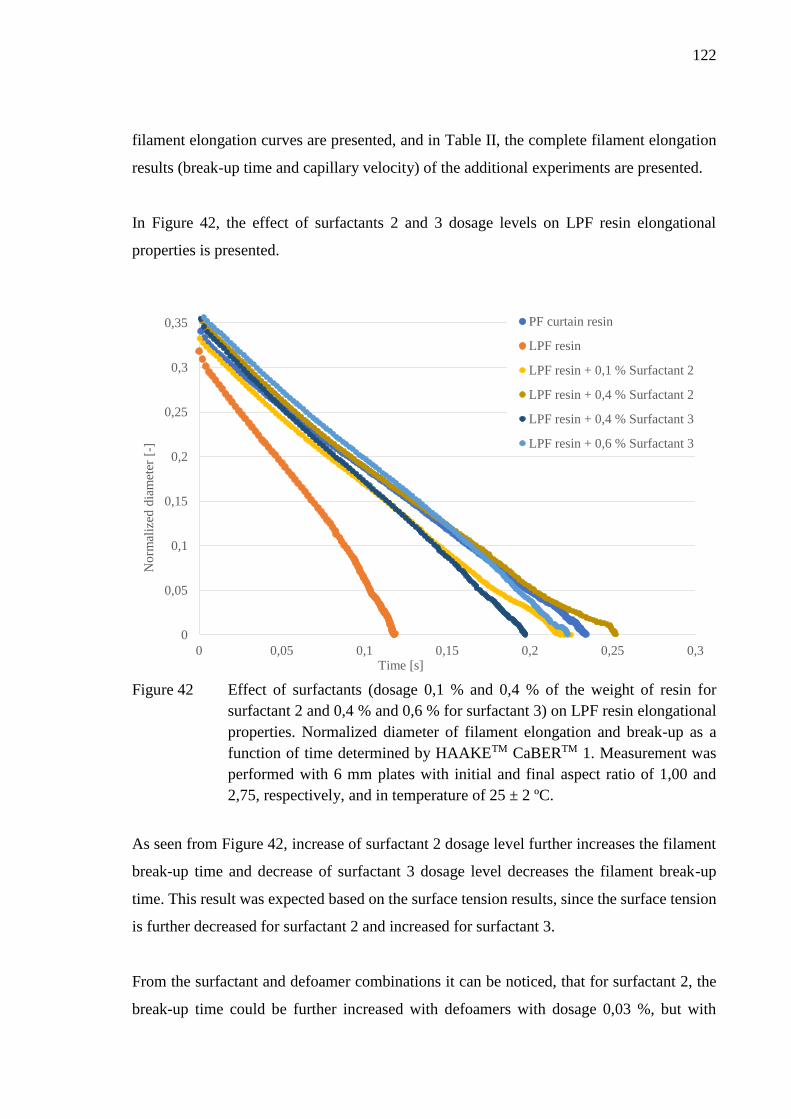
122
filament elongation curves are presented, and in Table II, the complete filament elongation
results (break-up time and capillary velocity) of the additional experiments are presented.
In Figure 42, the effect of surfactants 2 and 3 dosage levels on LPF resin elongational
properties is presented.
Figure 42 Effect of surfactants (dosage 0,1 % and 0,4 % of the weight of resin for
surfactant 2 and 0,4 % and 0,6 % for surfactant 3) on LPF resin elongational
properties. Normalized diameter of filament elongation and break-up as a
function of time determined by HAAKETM CaBERTM 1. Measurement was
performed with 6 mm plates with initial and final aspect ratio of 1,00 and
2,75, respectively, and in temperature of 25 ± 2 ºC.
As seen from Figure 42, increase of surfactant 2 dosage level further increases the filament
break-up time and decrease of surfactant 3 dosage level decreases the filament break-up
time. This result was expected based on the surface tension results, since the surface tension
is further decreased for surfactant 2 and increased for surfactant 3.
From the surfactant and defoamer combinations it can be noticed, that for surfactant 2, the
break-up time could be further increased with defoamers with dosage 0,03 %, but with
0
0,05
0,1
0,15
0,2
0,25
0,3
0,35
0 0,05 0,1 0,15 0,2 0,25 0,3
No
rmal
ized
dia
met
er [
-]
Time [s]
PF curtain resin
LPF resin
LPF resin + 0,1 % Surfactant 2
LPF resin + 0,4 % Surfactant 2
LPF resin + 0,4 % Surfactant 3
LPF resin + 0,6 % Surfactant 3

123
dosage 0,05 % no further increases were noticed. Surfactant 3 performed relatively similar
behavior with defoamer dosage of 0,03 %, and dosage 0,05 % further improved the break-
up time with all but defoamer 2. These observations can also be noticed in MLR analyses.
Statistical importance of increasing the dosage level is presented in Figure 43 and Figure 44.
In Figure 43, increase to filament break-up time is desired, and thus positive bars imply that
increasing the defoamer dosage level is important. In Figure 44, decrease to filament
capillary velocity is desired, and thus negative bars imply that increasing the defoamer
dosage level is important. From here it can be concluded, that for surfactant 2 with dosage
of 0,4 % of the weight of resin, defoamer dosage level should be maximum 0,03 %.
Figure 43 Statistical importance of increasing the defoamer dosage level with
surfactants 2 and 3 with dosage of 0,4 % of the weight of resin, when
considering the resin filament break-up time, obtained from extensional
rheometer analysis. Increased break-up time is desired. Importance is
estimated via statistical MLR analysis. Surf 2-3 = surfactants 2-3, S/D1 =
surfactant/defoamer 1 and Df 1-3 = defoamers 1-3.
-6
-4
-2
0
2
4
6
S/D1 Df 1 Df 2 Df 3
Reg
ress
ion c
oef
fici
ents
[-]
Defoamers
Surf 2 (0,4 %) +
defoamers
Surf 3 (0,4 %) +
defoamers

124
Figure 44 Statistical importance of increasing the defoamer dosage level with
surfactants 2 and 3 with dosage of 0,4 % of the weight of resin, when
considering the resin capillary velocity, obtained from extensional rheometer
analysis. Decreased capillary velocity is desired. Importance is estimated via
statistical MLR analysis. Surf 2-3 = surfactants 2-3, S/D1 =
surfactant/defoamer 1 and Df 1-3 = defoamers 1-3.
Working curves for operational windows were obtained for additive combinations from
interaction effect analysis, modelled with MLR method. Working curves are computed based
on second-order model with interaction (Montgomery et al., 2012):
𝑦 = 𝑏0 + 𝑏1 ∗ 𝑥1 + 𝑏2 ∗ 𝑥2 + 𝑏3 ∗ 𝑥1 ∗ 𝑥2 + 𝑏4 ∗ 𝑥12 + 𝑏5 ∗ 𝑥2
2, (47)
where y response variable to be modelled (filament break-up time)
b regression coefficients
x1 explanatory variable in regression (surfactant dosage)
x2 explanatory variable in regression (defoamer dosage).
Interaction coefficients were obtained from MLR analysis, computed here with Microsoft
Excel Data Analysis Add-Inn, possibly not significant variables (based on P-value) were
deleted and MLR analysis was computed again. Final regression results are presented in
Appendix V. Surfactant dosage was extrapolated for defoamer dosages of 0-0,05 %, when
target break-up time (y) value was 234 ms (filament break-up time of PF curtain resin).
Model was evaluated by comparing the measured and estimated break-up times of
-1,5
-1
-0,5
0
0,5
1
S/D1 Df 1 Df 2 Df 3R
egre
ssio
n c
oef
fici
ents
[-]
Defoamers
Surf 2 (0,4 %) +
defoamers
Surf 3 (0,4 %) +
defoamers

125
experiments and fitting a linear trendline to the plot. Fit of the model, R2-value, was for
working curves (the higher the better, max 100 %):
- Surfactant 2 + Surfactant/Defoamer 1: 85,29 %
- Surfactant 2 + Defoamer 1: 80,82 %
- Surfactant 2 + Defoamer 2: 95,73 %
- Surfactant 2 + Defoamer 3, 95,11 %
- Surfactant 3 + Surfactant/Defoamer 1: 72,61 %
- Surfactant 3 + Defoamer 1: 52,10 %
- Surfactant 3 + Defoamer 2: 92,68 %
- Surfactant 3 + Defoamer 3: 79,52 %.
Working curves for LPF resin with surfactant 2 and defoamers are presented in Figure 45
and working curves for LPF resin with surfactant 3 and defoamers are presented in Figure
46. Operating areas are marked with diagonal lines. It should be noted, that generally
considered maximum dosage level of surfactants is 0,6 % of the weight of resin (0,05 % for
defoamers), so the dosing is economically applicable. The required dosage of surfactant 2 is
well in line with the economical point of view, and thus the maximum surfactant dosage
limit (0,6 %) is not plotted in Figure 45. With surfactant 3, the only applicable additive
combination, from the economical point of view, would be surfactant 3 and
surfactant/defoamer 1.

126
Figure 45 Operational window for LPF resin with surfactant 2 and defoamer
combinations. Required dosage of both additives plotted, when the target
filament break-up time is 234 ms. For working curves, data obtained from
extensional rheometer analysis and model coefficients computed via
statistical MLR analysis. Operating area marked with diagonal lines. Surf 2
= surfactant 2, S/D1 = surfactant/defoamer 1 and Df 1-3 = defoamers 1-3.
Figure 46 Operational window for LPF resin with surfactant 3 and defoamer
combinations. Required dosage of both additives plotted, when the target
filament break-up time is 234 ms. For working curves, data obtained from
extensional rheometer analysis and model coefficients computed via
0
0,05
0,1
0,15
0,2
0 0,01 0,02 0,03 0,04 0,05
Surf
acta
nt
2,
do
sage
[%]
Defoamers, dosage [%]
Surf 2 + S/D 1
Surf 2 + Df 1
Surf 2 + Df 2
Surf 2 + Df 3
Economic limit
0
0,2
0,4
0,6
0,8
1
0 0,01 0,02 0,03 0,04 0,05
Surf
acta
nt
3,
do
sage
[%]
Defoamers, dosage [%]
Surf 3 + S/D 1
Surf 3 + Df 1
Surf 3 + Df 2
Economic limit

127
statistical MLR analysis. Operating area marked with diagonal lines. Surf 3
= surfactant 3, S/D1 = surfactant/defoamer 1 and Df 1-2 = defoamers 1-2.
Working curves seem reliable based on the measured results. As seen from Figure 45,
especially with surfactant/defoamer 1, surfactant 2 dosage is highly dependent on
surfactant/defoamer 1 dosage. For other defoamers, surfactant 2 dosage does not vary as
much. Highest dosage of surfactant 2 is required for defoamer 3. As seen from Figure 46,
the surfactant 3 dosage level does not vary that much either, when combined with defoamers.
With surfactant/defoamer 1 and defoamer 1 a small decrease in surfactant 3 dosage can be
obtained when defoamer dosage level is increased. Working curve was not obtained for
surfactant 3 and defoamer 3 combination, since filament break-up time target was not
achieved in extrapolation, and further deletion of variables was not possible. Overall,
working curve models were less fitting for surfactant 3 models than for surfactant 2 models.
Thermo Fischer Scientific HAAKETM CaBERTM 1 device has been commercially available
since 2002. There are no scientific research papers regarding elongation properties of resins.
Paper coatings, and specifically the effect of thickeners on the coating properties and
polymer elongation properties have been reported to some extent. In these studies, filament
break-up time is generally mentioned but capillary velocity is not mentioned as a remarkable
factor for stable curtain formation.
Birkert et al. (2006) studied the stretchability of paper coating colors. Stretchability can be
affected by thickeners. On molecular level, large molecules (extended polymer chains),
hyperstructure with pigment (pigment-polymer interaction/compatibility) and water binding
ability by hydrogen donor/acceptor interaction are favored. Polyacrylamide thickeners
performed the highest extensional viscosity, when qualitatively compared to polyethylene
glycol and polyacrylic acid thickeners. They found out, that in paper coating, both too low
and too high extensional viscosity lead to coating defects.
Voss & Tadjbach (2004) studied paper coating colors, which indicated via shear rheology
analysis practically identical behavior. Characteristic differences between the coating colors
which would indicate advantages and disadvantages regarding the successful curtain
formation or stability were not observed. However, via extensional rheology analysis, clear
differences in filament break-up time (range of 50-200 ms) were observed. Extensional

128
rheology characteristics correlation to curtain formation and stability were studied in pilot
trials. Dynamic surface tension of the coating colors (determined by bubble pressure
tensiometer) were 54 mN/m (at 50 ms) and 32 mN/m (at 3000 ms, close to equilibrium/static
surface tension). Also effect of natural and synthetic co-binders and special, acrylic
acid/acrylamide-based special thickeners on extensional rheology was studied. Conventional
thickeners showed only minimum effect on stretchability of the coating color (break-up time
50 ms). Special thickeners enabled much higher elongation/stretchability, and indicated
positive effects also in coating trials at high speeds (lowered spot index). Here, the filament
break-up time was increased up to 300 ms. Trouton ratio was calculated for conventional co-
binders to be 3-6, and for efficient special thickeners to be 10.
Becerra & Carvalho (2011) studied stability of viscoelastic curtain composing of
polyethylene glycol (PEG) and high molecular weight polyethylene oxide (PEO) was added
into the solution. PEO addition of 0,05 % of the weight of PEG resulted filament break-up
time of approximately 300 ms and was reported to stabilize the curtain remarkably.
PF curtain resin break-up time is 234 ms, which is relatively close to break-up time (300 ms)
of the best curtain coating color studied by Voss & Tadjbach (2004) and formed stable
curtain studied by Becerra & Carvalho (2011). Filament break-up time of 300 ms was not
achieved with any of the additive combinations. Closest break-up time to this, with surfactant
2 (0,40 % of the weight of resin) and surfactant/defoamer 1 (0,03 % of the weight of resin)
combination, break-up time of 280 ms was achieved. However, in this work, the results are
in general compared to properties of PF curtain resin, since it is a commercial product and
working. In addition, paper coatings go through more extreme elongation as the conveyor
speeds in paper production are faster.
From CaBERTM measurement, also apparent extensional viscosity curves are obtained as a
function of Hencky strain. Apparent extensional viscosities of the reference resins are
presented in Figure 47 and effect of surfactants on LPF resin apparent extensional viscosity
is presented in Figure 48.

129
Figure 47 Apparent extensional viscosity of the reference resins as a function of Hencky
strain, determined by HAAKETM CaBERTM 1. Measurement was performed
with 6 mm plates with initial and final aspect ratio of 1,00 and 2,75,
respectively, and in temperature of 25 ± 2 ºC.
Figure 48 Effect of surfactants on LPF resin apparent extensional viscosity as a function
of Hencky strain, determined by HAAKETM CaBERTM 1. Measurement was
performed with 6 mm plates with initial and final aspect ratio of 1,00 and
2,75, respectively, and in temperature of 25 ± 2 ºC.
0,01
0,1
1
10
0 2 4 6 8 10 12
Ap
par
ent
exte
nsi
onal
vis
cosi
ty [
Pas
]
Hencky Strain [-]
PF resin
PF curtain resin
LPF resin
0,01
0,1
1
10
0 2 4 6 8 10 12
Ap
par
ent
exte
nsi
onal
vis
cosi
ty [
Pas
]
Hencky Strain [-]
PF curtain resin
LPF resin
LPF resin + 0,2 % Surfactant 1
LPF resin + 0,1 % Surfactant 2
LPF resin + 0,6 % Surfactant 3
LPF resin + 0,2 % Surfactant 4
LPF resin + 0,1 % Surfactant/Defoamer 1
130
As seen from Figure 47 and Figure 48, the apparent extensional viscosity curves are very
similar, differences between the reference resins and effect of surfactants are not significant.
Curves approach constant value, which would imply about the Newtonian liquid behavior
(Cambridge Polymer Group, 2013), but not ideally. To combine shear and extensional
rheology results, further calculations would include determination of Trouton ratio for resins.
Thus, differences between the resins could probably be detected more easily. From shear
rheology, complex shear modulus (G*) and complex viscosity (η*) could be calculated based
on equations (35) and (36), respectively, and plotted as a function of angular frequency.
Zero-shear viscosity (η0) could be determined from complex viscosity curve. Trouton ratio
could be calculated based on equation (32), and plotted as a function of Hencky strain as
Anna & McKinley (2001), Yesilata et al. (2006), Becerra & Carvalho (2011) and Hussainov
et al. (2012) did. From Trouton ratio curve, possible extensional thickening could be
detected. Trouton ratio approaches constant steady-state value, which could also be
determined. Elongational relaxation time (equation 41) could be determined and compared
to shear relaxation time (Anna & McKinley, 2001; Yesilata et al., 2006). However,
relaxation time was not obtained from shear rheology, since crossover point for loss and
storage moduli was not observed.
In Appendix IV, these further calculations are presented as a test, when neglecting the
absence of storage modulus and determining the zero-shear viscosity based on the available
data.
10.5 Other analyses
Surface free energy determination was tested for LPF resin and PF curtain resin. The results
and discussion in detail are presented in Appendix III. The obtained results are in line with
surface tension results, since PF curtain resin has higher surface free energy than LPF resin.
The higher surface free energy of a solid, the easier wetting, and the lower surface tension
of a liquid, the easier wetting. However, the standard deviation between the replicate contact
angle determinations was remarkable (even over 7 º), and determinations especially with
water was challenging due to fast absorption into the solid resin. Matsushita et al. (2006) did
not report to face these kind of issues.

131
As the water evaporates from resin during drying, it may cause undesired crosslinking in the
resin structure. This may vary also the surface chemical properties of the resin. Since surface
tension results gave reliable and accurate results, surface free energy determinations were
not continued.
Interfacial viscoelasticity determination was tested for the reference resins and for surfactant
1 and 4, and defoamer 3. The determination should give insight about the surfactant
performance in the solution, and thus surfactants with remarkably different chemical
composition and defoamer described as non-ionic surfactant and defoamer were chosen. The
results and discussion are presented in Appendix IV. Standard deviation between the
replicate oscillating drop determinations at each frequency was variable and sometimes
remarkable. Frequency range used in this work was relatively narrow due to practical issues,
and the range should be wider (Ravera et al., 2010; Karbaschi et al., 2014). Lower
frequencies were not applicable due to drying of the resin drop during a long measurement.
Camera of the device was not able to record frames faster, and thus higher frequencies could
not be applied.
Differences between the LPF resin and PF resins and additives were able to detect. However,
due to lack of reference results from literature, evaluation of the additive performance was
challenging. In the scope of this work, the determination was not considered as valuable as
the other analytical methods determining surface tension and rheological properties of the
resins.
11 CONCLUSIONS
In this thesis, the surface chemical and rheological properties of phenol-formaldehyde (PF)
and lignin-phenol-formaldehyde (LPF) resins used in plywood adhesive preparation were
determined. Curtain coating as an adhesive application method in plywood production
requires specific resin properties, since formation of a stable and uniform curtain is a
challenge. Curtain coating of paper is commonly studied, and it has been concluded that
surface tension reduction and extensional viscosity increasement correlate with successful
curtain formation. Curtain coating of veneer and surface chemical and rheological properties

132
of resins are not as widely studied. The objective of the work was to develop LPF resin
composition for curtain coating of veneer.
In the experimental part of this work, it was discovered that surface tension of resins can be
determined via pendant drop shape analysis method simply and reliably. Pendant drop shape
method was in good correlation with De Noüy ring method, and provided more accurate
results. Surface free energy determination via contact angle measurements was not
applicable for resins. Drying of resins may cause structural changes, and reliability and
repeatability of the determination were poor.
Rheological properties of the resins were determined via shear, extensional and interfacial
rheology. Viscosity curves determined by shear rheometer were reliable, but oscillatory tests
provided unexpected results based on literature and differences between resins, which would
indicate advantages and disadvantages for curtain coating, were not observed. Elongational
properties, determined via capillary break-up extensional rheometer (CaBERTM), provided
clear differences between the resins. Interfacial viscoelasticity measurement for studying the
surfactant function faced some operational issues and due to lack of reference results,
evaluation of surfactant performance was not considered reliable.
In this thesis, properties of a commercial PF resin for curtain coating were considered
desirable. With commercial additives, surfactants and defoamers, the properties of LPF resin
were modified. Surface tension of LPF resin was reduced from 46,52 mN/m to 36,09 mN/m
(PF curtain resin) with surfactant dosing of 0,11-0,75 % of the weight of resin, depending
on the surfactant. From both shear and extensional rheology analyses it was concluded, that
resins exhibit Newtonian flow behavior. Both filament break-up time and capillary velocity
were describing elongational properties obtained from extensional rheometer measurement.
PF curtain resin exhibited long filament break-up time (234 ms) and slow capillary velocity
(1,39 mm/s) and LPF resin short filament break-up time (118 ms) and fast capillary velocity
(2,60 mm/s). As the surface tension of LPF resin was adjusted with each surfactant to the
level of PF curtain resin, a remarkable difference in elongation properties was obtained. Also
performance of defoamers was able to be evaluated with extensional rheometer. With
additive combinations (both surfactants and defoamers) as long or longer break-up time and

133
as slow or slower capillary velocity, than PF curtain resin exhibited, were obtained for LPF
resin.
Statistical importance of defoamer level increasement was studied via multiple linear
regression analysis and it was considered to correlate with surfactant and defoamer
compatibility. Based on compatibility, two best surfactants were selected. Further
measurements were performed to obtain an operational window to correlate LPF resin
filament break-up time to dosage of both surfactant and defoamer. Operational windows
were obtained for two surfactants in combination with all defoamers.
Further studies regarding the topic of this work include industrial trials to determine
correlation between the laboratory analyses and curtain coating of veneer. Based on this
work it can be concluded that surface tension and elongational properties of the coating
material are essential for successful curtain formation, since differences between the resins
were noticed. Those properties can be suggested to be measured in the future, when studying
resins for curtain coating and for evaluation of additives. In the future, operational windows
could be determined with additional variables and limitations. To fully confirm the
performance of the additive combinations, curtain coating trials are required.

134
REFERENCES
Abbott, S. (2018). Surface Energy Calculator. [online] Prof Steven Abbott Apps. Available
at: https://www.stevenabbott.co.uk/abbottapps/SEC/index.html [Accessed 17 Oct. 2018].
Adamson, A. (1976). Physical Chemistry of Surfaces. 3rd ed. New York: John Wiley &
Sons, Inc.
Alen, R. (2011). Biorefining of forest resources. Papermaking Science and Technology -
Book 20. Helsinki: Finnish Paper Engineers Association.
Anna, S. and McKinley, G. (2001). Elasto-capillary thinning and breakup of model elastic
liquids. Journal of Rheology, 45(1), pp.115-138.
Barnes, H., Hutton, J. and Walters, K. (1989). Rheology Series vol. 3: An Introduction
Rheology. Amsterdam: Elsevier Science Publishers B.V.
BASF (2013). Additives for Adhesives and Sealants. [online] Available at:
http://www.dispersions-
pigments.basf.com/portal/load/fid793202/Booklet_%20Additives%20for%20adhesives%2
0and%20sealants.pdf [Accessed 8 Aug. 2018].
BASF (2016). Practical Guide to Rheology Modifiers. [online] Formulation Additives by
BASF. Available at: https://www.dispersions-
pigments.basf.com/portal/load/fid806722/RheologyModifiers-Brochure.pdf [Accessed 26
Jul. 2018].
BASF (2018a). A Practical Guide to Defoamers. [online] Formulation Additives by BASF.
Available at: https://www.dispersions-
pigments.basf.com/portal/load/fid807410/BASF%20Defoamers%20Practical%20Guide.pd
f [Accessed 15 Aug. 2018].

135
BASF (2018b). Paper & Board - Coating Additives. [online] BASF Dispersions &
Pigments. Available at: http://www.dispersions-
pigments.basf.com/portal/basf/ien/dt.jsp?setCursor=1_832005 [Accessed 8 Aug. 2018].
BASF (2018c). Practical Guide to Wetting Agents and Surface Modifiers. [online]
Formulation Additives by BASF. Available at: https://www.dispersions-
pigments.basf.com/portal/load/fid831592/Wetting%20Agents%20and%20Surface%20Mod
ifiers.pdf [Accessed 8 Aug. 2018].
Becerra, M. and Carvalho, M. (2011). Stability of viscoelastic liquid curtain. Chemical
Engineering and Processing: Process Intensification, 50(5-6), pp.445-449.
Beneventi, D. and Guerin, D. (2005). Physical chemistry, rheology and curtain formation
ability of surfactant-starch solutions. [conference material] 22. PTS Streicherei-Symposium,
Baden-Baden, September 2005.
Biolin Scientific (2017a). Pulsating drop technique to characterize surfactant behavior in
flotation process. Attension - Application Note 11. [online] Available at:
https://cdn2.hubspot.net/hubfs/516902/Pdf/Attension/Application%20notes/AT-AN-11-
Pulsating-drop-surfactant-in-flotation.pdf?t=1539950841852 [Accessed 22 Oct. 2018].
Biolin Scientific (2017b). Surface free energy - theory and calculation. Attension -
Technology Note 4. [online] Available at:
https://cdn2.hubspot.net/hubfs/516902/Pdf/Attension/Tech%20Notes/AT-TN-04-Surface-
free-energy-theory.pdf?t=1535604088175 [Accessed 31 Aug. 2018].
Biolin Scientific (2018a). Measurements - Contact Angle. [online] Available at:
https://www.biolinscientific.com/measurements/contact-angle [Accessed 6 Jul. 2018].
Biolin Scientific (2018b). Measurements - Critical Micelle Concentration. [online]
Available at: https://www.biolinscientific.com/measurements/critical-micelle-concentration
[Accessed 6 Jul. 2018].

136
Biolin Scientific (2018c). Measurements - Surface Tension. [online] Available at:
https://www.biolinscientific.com/measurements/surface-tension [Accessed 6 Jul. 2018].
Birkert, O., Hamers, C., Krumbacher, E., Schachtl, M., Gane, P., Gerteiser, N., Ridgway, C.,
Fröhlich, U. and Tietz, M. (2006). Curtain Coating of Pigment Coats. Professional
Papermaking, 2, pp.56-71.
Bond, W. and Moehl, T. (1975). Plywood Adhesive. Georgia-Pacific Corporation.
US1976/3931070.
BYK (2018). Additives for Adhesives & Sealants. [online] BYK Additives. Available at:
https://www.byk.com/en/additives/applications/adhesives-sealants/aqueous.php [Accessed
8 Aug. 2018].
Calvo-Flores, F. and Dobado, J. (2010). Lignin as Renewable Raw Material. ChemSusChem,
3(11), pp.1227-1235.
Cambridge Polymer Group (2013). The Capillary Breakup Extensional Rheometer
(CABER™). Filament Breakup Rheometry. Cambridge Polymer Group. [online] Available
at: http://www.campoly.com/files/3913/7122/7764/007_New.pdf [Accessed 27 Jul. 2018]
Clausen, V., Järvi, R. and Zweig, A. (1965). Curtain Coating Apparatus. Simpson Timber
Company. US1969/3451374.
Colloid and Surface Chemistry Virtual Lab. (2018). Determination of Critical Micelle
Concentration (CMC) of a Surfactant. [online] Available at: https://csc-
iiith.vlabs.ac.in/exp14/index.html [Accessed 6 Jul. 2018].
Danielson, B. and Simonson, R. (1998). Kraft lignin in phenol formaldehyde resin. Part 1.
Partial replacement of phenol by kraft lignin in phenol formaldehyde adhesives for
plywood. Journal of Adhesion Science and Technology, 12(9), pp.923-939.

137
Doering, G. (1992). Lignin Modified Phenol-Formaldehyde Resins. Georgia-Pacific Resins,
Inc. US1993/005202403A.
Domínguez, J., Oliet, M., Alonso, M., Rojo, E. and Rodríguez, F. (2013). Structural, thermal
and rheological behavior of a bio-based phenolic resin in relation to a commercial resol
resin. Industrial Crops and Products, 42, pp.308-314.
Dow (2018a). ACRYSOL™ Rheology Modifiers. [online] Dow Coating Materials. Available
at: https://www.dow.com/en-us/coatings/products/acrysol [Accessed 8 Aug. 2018].
DOW (2018b). ECOSURF™ Surfactants. [online] Dow Coating Materials. Available at:
https://www.dow.com/en-us/coatings/products/ecosurf [Accessed 8 Aug. 2018].
DOW (2018c). Foam Control - Polypropylene Glycols and Copolymers Europe. [online]
Available at: https://www.dow.com/polyglycols/ppgc/europe/apps/foamcon.htm [Accessed
15 Aug. 2018].
Dunky, M. (2003). Adhesives in the Wood Industry. In: A. Pizzi and K. Mittal,
ed., Handbook of Adhesive Technology, 2nd ed. New York: Marcel Dekker, pp.887-956.
Evonik (2015). TEGO Product Overview. Evonik Coatings.
Evonik (2017a). Additives for Water Based Adhesives. Evonik Polymer Dispersions.
Evonik (2017b). One partner. Many experts. Product Reference Guide. Evonik Coatings.
Evonik (2018). Product Overview - Additives for Polymer Dispersions. Evonik Polymer
Dispersions.
Glazer, A. and Nikaido, H. (1995). Microbial Biotechnology: fundamentals of applied
microbiology. San Francisco: W. H. Freeman.

138
Goodwin, J. and Hughes, R. (2008). Rheology for Chemists. 2nd ed. Cambridge: Royal
Society of Chemistry.
Grillet, A., Wyatt, N. and Gloe, L. (2012). Polymer Gel Rheology and Adhesion. In: J.
Vicente, ed., Rheology. Rijeka: InTech.
Halász, L., Vorster, O., Pizzi, A. and Guasi, K. (2001). Rheology study of gelling of phenol‐
formaldehyde resins. Journal of Applied Polymer Science, 80(6), pp.898-902.
Holladay, J., Bozell, J., White, J. and Johnson, D. (2007). Top Value-Added Chemicals from
Biomass: Volume II - Results of Screening for Potential Candidates from Biorefinery Lignin.
Pacific Northwest National Laboratory for the United States Department of Energy.
Hse, C. (1972). Surface Tension of Phenol-Formaldehyde Wood Adhesives. Holzforschung,
26(2), pp.82-85.
Hu, L., Pan, H., Zhou, Y. and Zhang, M. (2011). Methods to Improve Lignin's Reactivity as
a Phenol Substitute and as a Replacement for Other Phenolic Compounds: a Brief
Review. BioResources, 6(3), pp.3515-3525.
Hussainov, M., Tätte, T. and Hussainova, I. (2012). Technique for extensional rheology
characterization of highly reactive viscoelastic liquids. Rheologica Acta, 51(8), pp.729-742.
Järvi, R. (1969). High Molecular Weight/Low Molecular Weight Phenol-Formaldehyde
Curtain Coating Adhesive Composition. Simpson Timber Company. US1971/3591535.
Karbaschi, M., Lotfi, M., Krägel, J., Javadi, A., Bastani, D. and Miller, R. (2014). Rheology
of interfacial layers. Current Opinion in Colloid & Interafce Science, 19(6), pp.514-519.
King Industries (2017). K-Stay Rheology Modifiers & DISPARLON for Solventborne and
Solventless Systems. [online] Available at: http://www.kingindustries.com/assets/1/7/K-
STAY_DISPARLON_Combined.pdf [Accessed 8 Aug. 2018].

139
Koponen, H. (2002). Puutuoteteollisuus 4: Puulevytuotanto. 3rd ed. Helsinki:
Opetushallitus.
KRÜSS GmbH (2018a). Bubble Pressure Tensiometer. [online] Available at:
https://www.kruss-scientific.com/services/education-theory/glossary/bubble-pressure-
tensiometer/ [Accessed 10 Jul. 2018].
KRÜSS GmbH (2018b). Interfacial rheology. [online] Available at: https://www.kruss-
scientific.com/services/education-theory/glossary/interfacial-rheology/ [Accessed 22 Oct.
2018].
Langevin, D. (2000). Influence of interfacial rheology on foam and emulsion properties.
Advances in Colloid and Interface Science, 88(1-2), pp.209-222.
Laurichesse, S. and Avérous, L. (2014). Chemical modification of lignins: Towards biobased
polymers. Progress in Polymer Science, 39(7), pp.1266-1290.
Louis, C. (2003). Importance of Surfactants in Dynamic Applications of Waterborne
Pressure Sensitive Adhesives. Air Products and Chemicals, Inc.
Mankar, S., Chaudhari, A. and Soni, I. (2012). Lignin in phenol-formaldehyde
adhesives. International Journal of Knowledge Engineering, 3(1), pp.116-118.
Matsushita, Y., Wada, S., Fukushima, K. and Yasuda, S. (2006). Surface characteristics of
phenol–formaldehyde–lignin resin determined by contact angle measurement and inverse
gas chromatography. Industrial Crops and Products, 23(2), pp.115-121.
Mattinen, M. (2016). Lignin-based polymer blends and biocomposite materials. [lecture
material] School of Chemical Technology. Aalto University.
McKinley, G. and Tripathi, A. (2000). How to extract the Newtonian viscosity from capillary
breakup measurements in a filament rheometer. Journal of Rheology, 44(3), pp.653-670.
140
McVay, T., Baxter, G. and Dupre, Jr., F. (1993). Reactive Phenolic Resin Modifier. Georgia-
Pacific Resins, Inc. US1999/005866642A.
Merck KGaA (2017a). Formaldehyde solution 37% (stabilized with about 10% methanol)
for synthesis. Safety Data Sheet. Darmstadt: Merck KGaA.
Merck KGaA (2017b). Phenol for Synthesis. Safety Data Sheet. Darmstadt: Merck KGaA.
Mezger, T. (2014). Applied Rheology - With Joe Flow on Rheology Road. Anton Paar
GmbH.
Montgomery, D., Peck, E. and Vining, G. (2012). Introduction to linear regression analysis.
5th ed. Hoboken: John Wiley & Sons, Inc.
Morrel, S. (2014). Oxidizable Phenolic-Based Urethanes. [online] PCI - Paint & Coating
Industry. Available at: https://www.pcimag.com/articles/98855-oxidizable-phenolic-based-
urethanes [Accessed 15 Jun. 2018].
Moubarik, A. (2014). Rheology Study of Sugar Cane Bagasse Lignin-Added Phenol–
Formaldehyde Adhesives. The Journal of Adhesion, 91(5), pp.347-355.
Peng, W. and Riedl, B. (1994). The chemorheology of phenol-formaldehyde thermoset resin
and mixtures of the resin with lignin fillers. Polymer, 35(6), pp.1280-1286.
Phan-Thien, N. (2002). Understanding viscoelasticity: basics of rheology. Berlin: Springer.
Pietarinen, S., Valkonen, S. and Ringena, O. (2014). A Method for Increasing the Reactivity
of Lignin. UPM-Kymmene Corporation. US2016/0237194A1.
Pizzi, A. (1994). Advanced Wood Adhesives Technology. New York: Marcel Dekker.
Pizzi, A. (2003a). Natural Phenolic Adhesives II: Lignin. In: A. Pizzi and K. Mittal,
ed., Handbook of Adhesive Technology, 2nd ed. New York: Marcel Dekker, pp.589-598.

141
Pizzi, A. (2003b). Phenolic Resin Adhesives. In: A. Pizzi and K. Mittal, ed., Handbook of
Adhesive Technology, 2nd ed. New York: Marcel Dekker, pp.541-571.
Pizzi, A., Ibeh, C. (2014). Phenol-Formaldehydes. In: H. Dodiuk and S. Goodman ed.,
Handbook of Thermoset Plastics, 3rd ed. William Andrew, pp.13-44.
Raskin, M., Ioffe, L., Pukis, A. and Wolf, M. (2001). Resin Material and Method of
Producing Same. Cellutech LLC. US2002/0065400A1.
Ravera, F., Loglio, G. and Kovalchuk, V. (2010). Interfacial dilational rheology by
oscillating bubble/drop methods. Current Opinion in Colloid & Interface Science, 15(4),
pp.217-228.
Robitschek, P., Chappelie, N. and Lorimer, J. (1974). Liquid Phenol-Aldehyde Adhesive for
Use in Curtain-Coating Adhesive Applicators. Chembond Corporation. US1976/3966658.
Schweizer, P. (2004). Curtain coating – stability a critical operating parameter. Paper
Technology, 45(2), pp.28-35.
Sellers, T. (1985). Plywood and adhesive technology. New York: Marcel Dekker.
Shaw, D. (1980). Introduction to Colloid and Surface Chemistry. 3rd ed. Oxford:
Butterworth-Heinemann Ltd.
Tetra Pak (2018). Chapter 3: Rheology. [online] Dairy Processing Handbook. Available at:
http://dairyprocessinghandbook.com/chapter/rheology [Accessed 17 Sep. 2018].
Thermo Fisher Scientific (2018). HAAKE™ CaBER™ 1 Capillary Breakup Extensional
Rheometer. [online] Rheometers & Viscometers. Available at:
https://www.thermofisher.com/order/catalog/product/398-0001?SID=srch-srp-398-0001
[Accessed 27 Jul. 2018].
142
Triantafillopoulos, N., Grön, J., Luostarinen, I. and Paloviita, P. (2004). Operational issues
in high speed curtain coating of paper, Part 1: The principles of curtain coating. Tappi
Journal, 3(11), pp.6-10.
UPM Biochemicals. (2018). [website] Available at: http://www.upmbiochemicals.com
[Accessed 4 Jun. 2018].
UPM Biofore. (2018). Bonding breakthrough: the new life of lignin. [online] Available at:
https://www.upmbiofore.com/plywood/bonding-breakthrough-the-new-life-of-lignin/
[Accessed 4 Jun. 2018].
UPM Kaukas. (2018). [website] Available at: http://www.upmpulp.fi/upm-kaukas/
[Accessed 4 Jun. 2018]
UPM-Kymmene Oyj (2018). Annual Report 2017. [online] Available at:
http://assets.upm.com/Investors/2017/Reports%20and%20Presentations%202017/UPM_A
nnual%20Report_2017.pdf [Accessed 7 Jun. 2018].
Valmet. (2018). Valmet LignoBoost - lignin extraction. [online] Available at:
https://www.valmet.com/more-industries/bio/lignin-separation/ [Accessed 20 Jun. 2018].
Voss, M. and Tadjbach, S. (2004). Extensional Rheology of Coating Colours for Curtain
Application. [conference material] TAPPI Coating and Graphic Arts Conference, Baltimore,
May 2004.
Weser, C. (1980). Measurement of Interfacial Tension and Surface Tension - General
Review for Practical Man. GIT Fachzeitschrift für das Laboratorium, 24, pp.642-648, 734-
742.
Willenbacher, N., Benz, R., Ewers, A. and Nijman, J. (2004). The influence of thickeners on
the application method of automotive coatings and paper coatings – rheological
investigations with the HAAKE CaBER 1. Rheology Application Notes. Thermo Fisher
Scientific.

143
Winterowd, J., Zhang, C. and Neogi, A. (2010). Utilization of Kraft Lignin in
Phenol/Formaldehyde Bonding Resins for OSB. Weyerhaeuser NR Company.
US2011/0245381A1.
WISA BioBond. (2018). WISA BioBond - The most sustainable plywood bonding
technology. [online] Available at: http://www.wisabiobond.com/ [Accessed 4 Jun. 2018].
Yang, X. and Frazier, C. (2016a). Influence of organic fillers on rheological behavior in
phenol-formaldehyde adhesives. International Journal of Adhesion and Adhesives, 66,
pp.93-98.
Yang, X. and Frazier, C. (2016b). Influence of organic fillers on surface tension of phenol-
formaldehyde adhesives. International Journal of Adhesion and Adhesives, 66, pp.160-166.
Yesilata, B., Clasen, C. and McKinley, G. (2006). Nonlinear shear and extensional flow
dynamics of wormlike surfactant solutions. Journal of Non-Newtonian Fluid Mechanics,
133(2-3), pp.73-90.
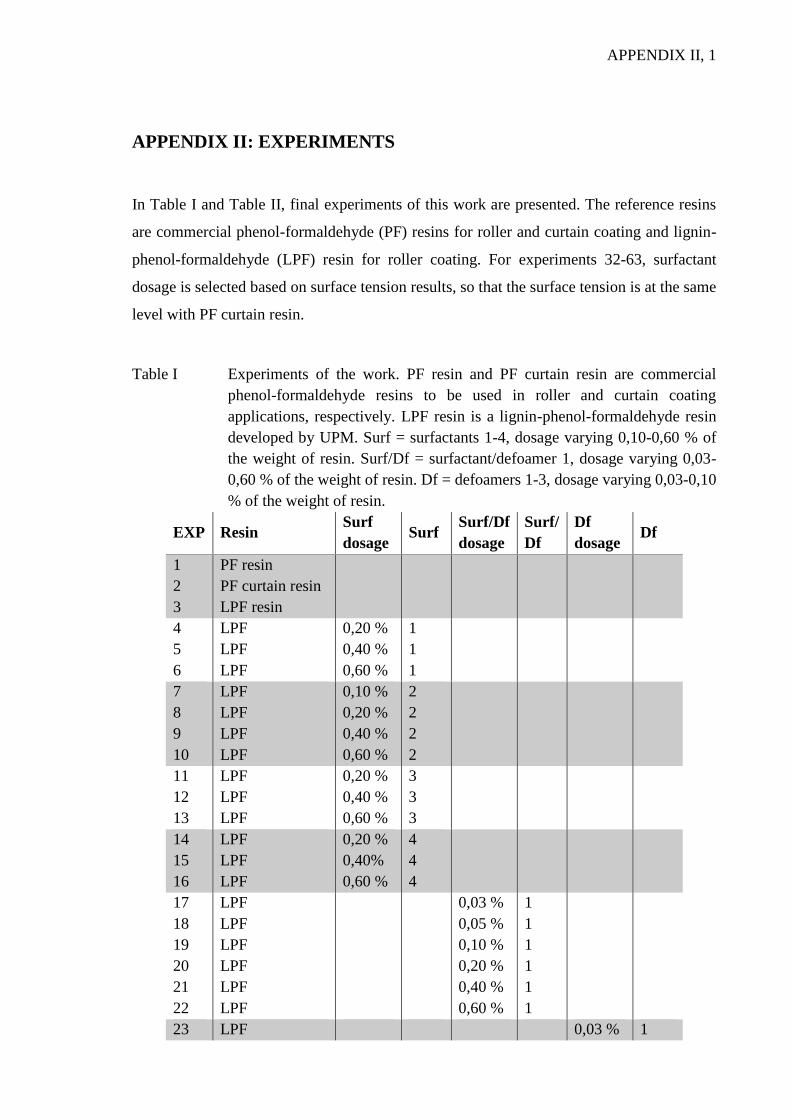
APPENDIX II, 1
APPENDIX II: EXPERIMENTS
In Table I and Table II, final experiments of this work are presented. The reference resins
are commercial phenol-formaldehyde (PF) resins for roller and curtain coating and lignin-
phenol-formaldehyde (LPF) resin for roller coating. For experiments 32-63, surfactant
dosage is selected based on surface tension results, so that the surface tension is at the same
level with PF curtain resin.
Table I Experiments of the work. PF resin and PF curtain resin are commercial
phenol-formaldehyde resins to be used in roller and curtain coating
applications, respectively. LPF resin is a lignin-phenol-formaldehyde resin
developed by UPM. Surf = surfactants 1-4, dosage varying 0,10-0,60 % of
the weight of resin. Surf/Df = surfactant/defoamer 1, dosage varying 0,03-
0,60 % of the weight of resin. Df = defoamers 1-3, dosage varying 0,03-0,10
% of the weight of resin.
EXP Resin Surf
dosage Surf
Surf/Df
dosage
Surf/
Df
Df
dosage Df
1
2
3
PF resin
PF curtain resin
LPF resin
4
5
6
LPF
LPF
LPF
0,20 %
0,40 %
0,60 %
1
1
1
7
8
9
10
LPF
LPF
LPF
LPF
0,10 %
0,20 %
0,40 %
0,60 %
2
2
2
2
11
12
13
LPF
LPF
LPF
0,20 %
0,40 %
0,60 %
3
3
3
14
15
16
LPF
LPF
LPF
0,20 %
0,40%
0,60 %
4
4
4
17
18
19
20
21
22
LPF
LPF
LPF
LPF
LPF
LPF
0,03 %
0,05 %
0,10 %
0,20 %
0,40 %
0,60 %
1
1
1
1
1
1
23 LPF 0,03 % 1
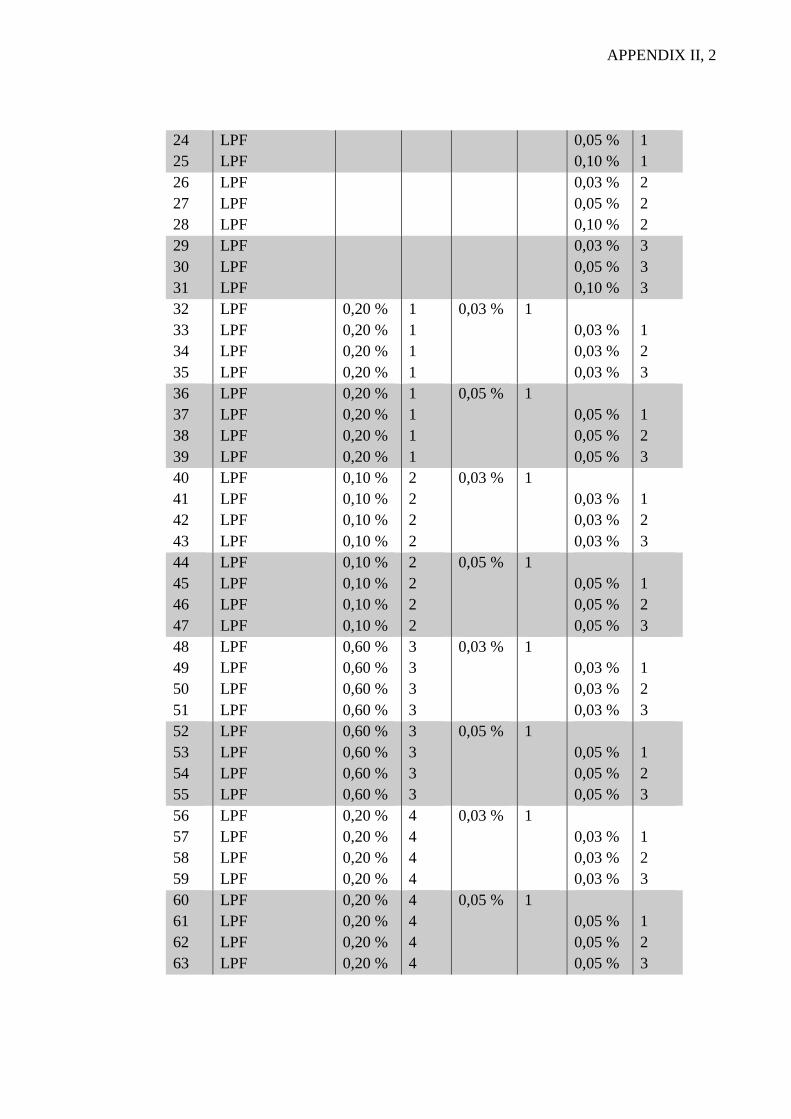
APPENDIX II, 2
24
25
LPF
LPF
0,05 %
0,10 %
1
1
26
27
28
LPF
LPF
LPF
0,03 %
0,05 %
0,10 %
2
2
2
29
30
31
LPF
LPF
LPF
0,03 %
0,05 %
0,10 %
3
3
3
32
33
34
35
LPF
LPF
LPF
LPF
0,20 %
0,20 %
0,20 %
0,20 %
1
1
1
1
0,03 %
1
0,03 %
0,03 %
0,03 %
1
2
3
36
37
38
39
LPF
LPF
LPF
LPF
0,20 %
0,20 %
0,20 %
0,20 %
1
1
1
1
0,05 %
1
0,05 %
0,05 %
0,05 %
1
2
3
40
41
42
43
LPF
LPF
LPF
LPF
0,10 %
0,10 %
0,10 %
0,10 %
2
2
2
2
0,03 %
1
0,03 %
0,03 %
0,03 %
1
2
3
44
45
46
47
LPF
LPF
LPF
LPF
0,10 %
0,10 %
0,10 %
0,10 %
2
2
2
2
0,05 %
1
0,05 %
0,05 %
0,05 %
1
2
3
48
49
50
51
LPF
LPF
LPF
LPF
0,60 %
0,60 %
0,60 %
0,60 %
3
3
3
3
0,03 %
1
0,03 %
0,03 %
0,03 %
1
2
3
52
53
54
55
LPF
LPF
LPF
LPF
0,60 %
0,60 %
0,60 %
0,60 %
3
3
3
3
0,05 %
1
0,05 %
0,05 %
0,05 %
1
2
3
56
57
58
59
LPF
LPF
LPF
LPF
0,20 %
0,20 %
0,20 %
0,20 %
4
4
4
4
0,03 %
1
0,03 %
0,03 %
0,03 %
1
2
3
60
61
62
63
LPF
LPF
LPF
LPF
0,20 %
0,20 %
0,20 %
0,20 %
4
4
4
4
0,05 %
1
0,05 %
0,05 %
0,05 %
1
2
3

APPENDIX II, 3
Based on the results obtained from extensional rheology, the following experiments (Table
II) were added for further measurements with extensional rheometer.
Table II Additional experiments of the work. LPF resin is a lignin-phenol-
formaldehyde resin developed by UPM. Surf = surfactants 2-3, dosage 0,60
% of the weight of resin. Surf/Df = surfactant/defoamer 1, dosage varying
0,03-0,05 % of the weight of resin. Df = defoamers 1-3, dosage varying 0,03-
0,10 % of the weight of resin.
EXP Resin Surf
dosage Surf
Surf/Df
dosage
Surf/
Df
Df
dosage Df
64
65
66
67
LPF
LPF
LPF
LPF
0,40 %
0,40 %
0,40 %
0,40 %
2
2
2
2
0,03 %
1
0,03 %
0,03 %
0,03 %
1
2
3
68
69
70
71
LPF
LPF
LPF
LPF
0,40 %
0,40 %
0,40 %
0,40 %
2
2
2
2
0,05 %
1
0,05 %
0,05 %
0,05 %
1
2
3
72
73
74
75
LPF
LPF
LPF
LPF
0,40 %
0,40 %
0,40 %
0,40 %
3
3
3
3
0,03 %
1
0,03 %
0,03 %
0,03 %
1
2
3
76
77
78
79
LPF
LPF
LPF
LPF
0,40 %
0,40 %
0,40 %
0,40 %
3
3
3
3
0,05 %
1
0,05 %
0,05 %
0,05 %
1
2
3

APPENDIX III, 1
APPENDIX III: SURFACE CHEMICAL ANALYSES
Surface tension
Surface tension and expanded uncertainty on level of confidence of 95 % of experiments are
presented in Table I.
Table I Surface tension of experiments determined by pendant drop shape analysis
method with Attension Theta optical tensiometer, in temperature of 23 ± 2
ºC. Drop (volume 4 μl, except for experiment 10, 3,5 μl) formed with 200 μl
micropipette, and resin density used 1,2073 g/cm3. Values obtained after 3,0
s from the beginning of the measurement. Expanded uncertainty on level of
confidence of 95 %.
EXP Description Surface tension,
mN/m
Expanded
uncertainty
1
2
3
PF resin
PF curtain resin
LPF resin
71,28
36,09
46,52
0,91
0,11
1,16
4
5
6
LPF resin + 0,2 % Surfactant 1
LPF resin + 0,4 % Surfactant 1
LPF resin + 0,6 % Surfactant 1
35,58
33,75
31,57
0,24
0,38
0,10
7
8
9
10
LPF resin + 0,1 % Surfactant 2
LPF resin + 0,2 % Surfactant 2
LPF resin + 0,4 % Surfactant 2
LPF resin + 0,6 % Surfactant 2
37,01
33,81
30,27
29,67
0,11
0,10
0,13
0,11
11
12
13
LPF resin + 0,2 % Surfactant 3
LPF resin + 0,4 % Surfactant 3
LPF resin + 0,6 % Surfactant 3
42,45
39,81
37,95
0,55
0,16
0,12
14
15
16
LPF resin + 0,2 % Surfactant 4
LPF resin + 0,4 % Surfactant 4
LPF resin + 0,6 % Surfactant 4
37,07
35,05
32,01
0,07
0,15
0,05
17
18
19
20
21
22
LPF resin + 0,03 % Surfactant/Defoamer 1
LPF resin + 0,05 % Surfactant/Defoamer 1
LPF resin + 0,10 % Surfactant/Defoamer 1
LPF resin + 0,20 % Surfactant/Defoamer 1
LPF resin + 0,40 % Surfactant/Defoamer 1
LPF resin + 0,60 % Surfactant/Defoamer 1
42,42
39,07
36,53
31,64
29,86
29,86
0,12
0,25
0,34
0,83
0,56
0,51
23
24
25
LPF resin + 0,03 % Defoamer 1
LPF resin + 0,05 % Defoamer 1
LPF resin + 0,10 % Defoamer 1
45,77
44,99
45,81
0,65
0,49
0,97
26
27
LPF resin + 0,03 % Defoamer 2
LPF resin + 0,05 % Defoamer 2
46,89
46,23
0,15
0,16

APPENDIX III, 2
28 LPF resin + 0,10 % Defoamer 2 46,23 0,26
29
30
31
LPF resin + 0,03 % Defoamer 3
LPF resin + 0,05 % Defoamer 3
LPF resin + 0,10 % Defoamer 3
46,32
44,78
41,54
0,42
0,96
0,38
Surface free energy
Surface free energy determination was tested for LPF resin and PF curtain resin.
Determination could not be made for PF resin due to operational issues in the laboratory.
Calculated, total surface free energy and its components are presented in Table II. Lewis
acid-base calculation method was performed, since the determination was performed with
three liquids and it is the most accurate calculation method.
Table II Surface free energy and its components for Lewis acid-base calculation
method determined from contact angle measurements with Attension Theta
optical tensiometer, in temperature of 23 ± 1 ºC and relative humidity of 50
± 2 %. Contact angles were determined for water (drop volume 3 μl), ethylene
glycol (drop volume 3 μl) and diiodomethane (drop volume 1 μl) and values
obtained after 1,0 s from the beginning of the measurement. Calculation
performed with Steven Abbott calculator (Abbott, 2018).
Resin Total,
mN/m
Dispersive
component
Polar/
acid-base
component
Acid
parameter
σ+
Base
parameter
σ-
PF curtain resin 42,1 39,1 3,0 0 70,2
LPF resin 35,2 21,8 13,4 0,5 86,5
The obtained results are in line with surface tension results, since PF curtain resin has higher
surface free energy than LPF resin. The higher surface free energy of a solid, the easier
wetting, and the lower surface tension of a liquid, the easier wetting. However, the standard
deviation between the replicate contact angle determinations was remarkable (even over 7
º). Especially with water, the drops absorbed into the solid resin very fast and contact angles
were very small. This affects the validity of Lewis acid-base polar component results.
Deviation may be due to non-uniform surface of the resins. After drying of resins, it was
noticed that especially the surface of LPF resin was wrinkled. However, the deviation was
also remarkable for PF curtain resin even though visually the surface seemed smooth.
Water evaporates from resin during drying and may thus cause crosslinking in the resin
structure. This may vary also the surface chemical properties of the resin. In practice resin

APPENDIX III, 3
is not used in a solid form. Thus, surface free energy of resin was not considered applicable
or relevant way of describing the properties of resin, when considering the scope of this
work.
However, Matsushita et al. (2006) determined the surface characteristics of LPF resin with
kraft lignin (7 % and 15 %) and lignosulfonates (15 % and 30 %) by contact angle
measurement and inverse gas chromatography (IGC). For contact angle measurements,
resins were dried to obtain a resin film and for IGC, resins were converted into powders.
Total surface free energies of samples and Lewis acid-base components of work of adhesion
are presented in Table III. Lewis acid-base component of work of adhesion (WaAB) was
calculated from equation (Matsushita et al., 2006):
𝑊𝑎𝐴𝐵 = 2 [(𝜎𝑆
+𝜎𝐿−)1/2 + (𝜎𝑆
−𝜎𝐿+)1/2], (1)
where σ+ acid (electron acceptor) parameter of surface free energy of solid (S) or
surface tension of liquid (L)
σ- base (electron donor) parameter of surface free energy of solid (S) or surface
tension of liquid (L).
Lewis acid-base parameters for liquids are known.
Table III Total surface free energy of PF and LPF resins, determined by contact angle
measurement with three liquids (water, diiodomethane and formamide), and
Lewis acid-base components of work of adhesion for water and ethylene
glycol (collected from Matsushita et al. (2006)).
Sample Total surface free
energy, mN/m
Lewis acid-base component
of work of adhesion,
water/ethylene glycol, mN/m
PF resin 42,8 56,8/29,7
Kraft lignin-PF resin
(7 % phenol substitution) 41,8 50,0/18,0
Kraft lignin-PF resin
(15 % phenol substitution) 41,9 46,6/12,8
Lignosulfonate-PF resin
(15 % phenol substitution) 38,4 58,7/24,6

APPENDIX III, 4
Lignosulfonate-PF resin
(30 % phenol substitution) 37,6 59,0/16,2
Differences in the surface free energy between the samples may be due to chemical
component changes, e.g. lignin and sulfonic acid group side chains in the resin composition.
From the work of adhesion results it can be concluded, that the kraft lignin PF resin has the
best resistance to water (lowest values), PF resin has the second best resistance and
lignosulfonate-PF resin the lowest resistance to water. Resistance to water was further
improved by the higher substitution of phenol with kraft lignin. Results from IGC were partly
different, which may be due to different measuring principles. (Matsushita et al., 2006)
Surface free energies determined for PF curtain resin and LPF resin in this work are in
principle in good agreement with surface free energies determined by Matsushita et al.
(2006). However, as mentioned, the surface free energy results of this work are not
completely reliable. Apparently, Matsushita et al. (2006) did not have issues with drying of
the resins and contact angle determinations. Lewis acid-base component of work of adhesion
for water calculated based on equation (46) for PF curtain resin and LPF resin are 84,6 mN/m
and 101,1 mN/m, respectively. These values are not in line with the results of Matsushita et
al. (2006). This is probably due to invalid results of contact angle determination with water
in this work. Water contact angles determined by Matsushita et al. (2006) were 56-63 º,
whereas water contact angles obtained in this work were 8-10 º.

APPENDIX IV, 1
APPENDIX IV: RHEOLOGICAL ANALYSES
Shear rheology
In Figure 1, amplitude sweeps of the reference resins are presented.
Figure 1 Amplitude sweeps of the reference resins, loss modulus as function of strain
on logarithmic scale, determined by MCR302 shear rheometer and CC27
cylinder, in temperature of 25 ºC. Storage modulus not obtained. Strain varied
from 0,01-100 % and frequencies of 15 rad/s, 10 rad/s and 1 rad/s were used.
Amplitude sweep was done to determine linear viscoelastic region of the resins. However,
storage/elastic moduli were not plotted for any of the resins. Storage moduli were measured
0 throughout the measurements at all frequencies tested. In addition, loss/viscous moduli
remained constant throughout the measurements at all frequencies for all resins. This implies
that the resins are ideal Newtonian liquids with no elastic behavior. Linear viscoelastic
region cannot thus be determined. The loss moduli of all of the resins are at same level at
the same frequency. This is probably due to same type of the composition of all the resins,
water, phenol and formaldehyde as the main components. Lignin as a structural component
does not have any remarkable effect on this property of the resins.
0,0
1,0
2,0
3,0
4,0
5,0
6,0
0,01 0,1 1 10 100
Lo
ss m
od
ulu
s, G
'' [P
a]
Strain [%]
PF resin,
frequency 15 rad/s
PF resin,
frequency 10 rad/s
PF resin,
frequency 1 rad/s
PF curtain resin,
frequency 15 rad/s
PF curtain resin,
frequency 10 rad/s
PF curtain resin,
frequency 1 rad/s
LPF resin,
frequency 15 rad/s
LPF resin,
frequency 10 rad/s
LPF resin,
frequency 1 rad/s

APPENDIX IV, 2
However, frequency sweeps of the reference resins were determined, and are presented in
Figure 2.
Figure 2 Frequency sweeps of the reference resins, loss modulus as function of
frequency on logarithmic scale, determined by MCR302 shear rheometer and
CC27 cylinder, in temperature of 25 ºC. Storage modulus not obtained.
Frequency varied from 500-0,5 rad/s and strains of 1 %, 0,5 % and 0,1 %
were used.
Frequency sweep is supposed to be measured at a strain level determined by amplitude
sweep. Since linear viscoelastic region could not be determined, different strains were tested.
Again, storage moduli were not plotted for any of the resins, since it was measured 0
throughout the measurements at all strains tested. This confirms ideal Newtonian liquid type
of behavior. The loss modulus curves of the resins are the same for all the resins at all strains.
This is again probably due to same type of the composition of all the resins.
Based on these results, it could be concluded that the resins used in this work are ideal
Newtonian liquids, with no elastic behavior and thus no viscoelastic behavior. However, this
conclusion is unexpected due to visual evaluation of the resins and results based on literature
(Domínguez et al. 2013; Moubarik, 2014; Yang and Frazier, 2016a). Resins used in this
work are syrupy, but however flowing, and for example remarkably thicker than water or
0,1
1,0
10,0
100,0
1000,0
0,1 1 10
Lo
ss m
od
ulu
s, G
'' [P
a]
Angular frequency [rad/s]
PF resin,
strain 1 %
PF resin,
strain 0,5 %
PF resin,
strain 0,1 %
PF curtain resin,
strain 1 %
PF curtain resin,
strain 0,5 %
PF curtain resin,
strain 0,1 %
LPF resin,
strain 1 %
LPF resin,
strain 0,5 %
LPF resin,
strain 0,1 %
APPENDIX IV, 3
oil. This would imply that the resins have also elastic behavior. It was considered, that maybe
cylinder is not an appropriate measuring head for the resins, and also a paddle spindle stirrer
head was tested. This removed the possible doubt that the resin would not move in the small
gap between the cylinders. However, storage moduli were still not plotted for amplitude or
frequency sweeps.
Domínguez et al. (2013) compared the rheological behavior of commercial phenolic resin
and resin with partial substitution (30 %) of phenol with modified ammonium
lignosulfonates. PF resin exhibited close to Newtonian flow behavior and LPF resin
pseudoplastic flow behavior. Viscoelastic behavior of LPF resin can be considered as an
advantage in coating applications and composite production, but as a drawback for some
other applications. Characterization was performed with frequency sweep (0,5-80 Hz,
constant strain 2 %) within the linear viscoelastic region of both resins. The profiles of the
storage and loss moduli of both resins were typical for polymer solution. High water content
of both resins (more than 50 wt-%) can be a cause for this. Storage and loss moduli were
lower for PF resin than for LPF resin. Lignosulfonates may cause interferences with the
polymer which can cause different behavior of LPF resin. Storage modulus is more sensitive
for structural analysis of the fluid than loss modulus. Lower storage modulus of PF resin can
thus also imply that it has lower molecular weight and lower degree of branching
(Domínquez et al., 2013). This was also supported by the relaxation spectra calculations
(frequency as a function of relaxation time), where the time peak was lower for PF resin than
to LPF resin. Lower peak implies to easier mobility of the polymer chains and thus lower
branching. The researchers also studied the structural and thermal behavior of the resins by
Fourier transform infrared spectroscopy (FTIR), differential scanning calorimeter (DSC) and
thermogravimetric analysis (TGA), resulting that PF resin has higher reactivity and LPF
resin has higher thermal stability (Domínguez et al., 2013).
Rheological properties of LPF resin containing 30 % of sugar cane bagasse lignin were
studied by rotational rheometer by Moubarik (2014). Linear domain of the resin was
determined by amplitude sweep (strain 0,01-10 %, constant frequency 1 rad/s) and it was
between strain range 0,01 % and 1 % (similar to reference PF resin). Time sweep resulted
constant moduli (both G’ and G’’) after 50 min (constant strain 1 % and frequency 1 rad/s),
which indicated excellent structural stability of the resin (similar to reference PF resin). In
APPENDIX IV, 4
frequency sweep, both moduli of the LPF resin increased as the frequency increased (0,1-
100 rad/s, constant strain 1 %). G’ and G’’ curves were approximately parallel, and G’ was
larger than G’’, which is typical for weak gels (Moubarik, 2014). This indicates LPF resin
containing crosslinked structure which can be broken and reformed. Time sweep performed
in industrial polymerization temperature (125 °C) for LPF resin resulted constant moduli
after 7,5 min, which indicated the optimal cure time of the resin. Temperature sweep (20-
180 °C, constant strain 1 % and frequency 1 rad/s) resulted three stages of variation of the
viscoelastic properties. First, slight increase of both moduli as the temperature increases
(maybe due to evaporation of water). Second (between 110-125 °C), sharp increase of
moduli due to activation of polymerization. Third, (between 125-160 °C), sharp decrease of
moduli (maybe due to foam formation).
Rheology of PF adhesives is considered to affect bulk flow, prepress tack, precure moisture
retention, gap-filling properties, and cured glue joint strength and durability (Yang and
Frazier, 2016a). The influence of organic fillers (flours of walnut shell, red alder bark and
corn cob residue) on flow properties of PF adhesives were determined by analyzing viscosity
curves, creep/recovery measurements and frequency sweeps. Viscosity curves were
performed for resin and adhesives by first increasing the shear rate 0,05-4000 1/s and then
decreasing the shear rate 4000-0,05 1/s. PF resin showed principally Newtonian flow
behavior, shear thinning occurred in shear rates above 1250 1/s. PF adhesive with wheat
flour extender showed gradually shear thinning behavior. PF adhesives with extender and
different organic fillers showed rather similar behavior, first shear thinning at low shear
rates, plateau at intermediate shear rates, and again shear thinning at high shear rates. In the
second step, when decreasing the shear rates, viscosity was regained gradually or first
gradually and then more rapidly at lower shear rates. There was no significant reorganization
in hysteresis curves (plots of increasing and decreasing shear rates in the same figure) of
adhesives with corn cob and walnut shell fillers, but adhesive with alder bark filler showed
a crossover at low shear region, which implies structural reorganization (Yang and Frazier,
2016a). In creep/recovery measurement (constant shear stress of 0,05 Pa), adhesive
containing alder bark filler showed first mostly viscous behavior and after shearing
viscoelastic behavior, implying to development of some type of network structure (Yang and
Frazier, 2016a). This was also recognized in frequency sweep, where loss modulus was
greater than storage modulus prior to shearing and almost equal after shearing. In contrast,

APPENDIX IV, 5
adhesive containing corn cob filler showed first viscoelastic behavior and shearing causing
dramatic development of elastic behavior. In frequency sweep (0,01-0,05 Hz, constant shear
stress 0,05 Pa), crossover point for storage modulus to exceed loss modulus was observed
after the second shearing at low frequencies. Both moduli also tend to toward plateau value,
which implies greater network development. The cause for development of viscoelastic
network structures was unknown, but it was suggested that fillers aggregate colloidal effects
within the liquid, alkaline PF resin. Here, compounds of the extender and fillers would
interact with PF chains and form colloidal structures.
Both Domínguez et al. (2013) and Yang and Frazier (2016a) concluded PF resin indicating
close to Newtonian flow behavior, but still exhibiting elastic behavior as the storage modulus
plot was obtained in frequency sweep measurements to determine structural properties of
the resin. LPF resin exhibited pseudoplastic behavior (Domínguez et al., 2013) and adhesives
shear thinning behavior (Yang and Frazier, 2016a). Domínguez et al. (2013) reported some
similarities in PF and LPR resin behavior (explained by similar composition) but differences
in structure (PF resin having lower molecular weight and lower degree of branching).
Moubarik (2014) reported initially similar properties of PF and LPF resin (linear viscoelastic
region and structural stability), but not all determinations were performed to PF resin. Yang
and Frazier (2016a) reported structural reorganization and development of some type of
network structure for some adhesives, possibly due to filler compounds and PF resin
interaction to form colloidal structures, but structural analyses for PF resin without extender
or fillers were not performed. Domínguez et al. (2013) and Moubarik (2014) used plate-plate
and Yang and Frazier (2016a) concentric cylinder geometry for analyses.
So, the literature results and results from this work vary when considering the shear
rheological properties of the resins. The results obtained from this work imply that the resins
are ideally Newtonian liquids and do not differ from each other, except for the viscosity
level. Overall it was considered, that elastic behavior should exist. Since the storage modulus
was not found also the calculation of other results may not be reliable. Relaxation time (λ),
complex shear modulus (G*) and further complex viscosity (η*) and zero-shear viscosity
(η0) could be determined from shear rheology of the resins. Without storage modulus,
complex shear modulus is equal to loss modulus values, and complex viscosity curves
correspond to viscosity curves.

APPENDIX IV, 6
Extensional rheology
In Figure 3, Figure 4, Figure 5, Figure 6, Figure 7 and Figure 8 the effect of surfactant and
defoamer combinations on LPF resin elongational properties are presented.
Figure 3 Effect of surfactant 1 (dosage 0,2 % of the weight of resin) and defoamer
combinations on LPF resin elongational properties. Normalized diameter of
filament elongation and break-up as a function of time determined by
HAAKETM CaBERTM 1. Measurement was performed with 6 mm plates with
initial and final aspect ratio of 1,00 and 2,75, respectively, and in temperature
of 25 ± 2 ºC.
0
0,05
0,1
0,15
0,2
0,25
0,3
0,35
0 0,05 0,1 0,15 0,2 0,25 0,3
No
rmal
ized
dia
met
er [
-]
Time [s]
PF curtain resinLPF resinLPF resin + 0,2 % Surfactant 1LPF resin + 0,2 % Surfactant 1 + 0,03 % S/D 1LPF resin + 0,2 % Surfactant 1 + 0,05 % S/D 1LPF resin + 0,2 % Surfactant 1 + 0,03 % Defoamer 1LPF resin + 0,2 % Surfactant 1 + 0,05 % Defoamer 1LPF resin + 0,2 % Surfactant 1 + 0,03 % Defoamer 2LPF resin + 0,2 % Surfactant 1 + 0,05 % Defoamer 2LPF resin + 0,2 % Surfactant 1 + 0,03 % Defoamer 3LPF resin + 0,2 % Surfactant 1 + 0,05 % Defoamer 3

APPENDIX IV, 7
Figure 4 Effect of surfactant 2 (dosage 0,1 % of the weight of resin) and defoamer
combinations on LPF resin elongational properties. Normalized diameter of
filament elongation and break-up as a function of time determined by
HAAKETM CaBERTM 1. Measurement was performed with 6 mm plates with
initial and final aspect ratio of 1,00 and 2,75, respectively, and in temperature
of 25 ± 2 ºC.
Figure 5 Effect of surfactant 3 (dosage 0,6 % of the weight of resin) and defoamer
combinations on LPF resin elongational properties. Normalized diameter of
filament elongation and break-up as a function of time determined by
HAAKETM CaBERTM 1. Measurement was performed with 6 mm plates with
0
0,05
0,1
0,15
0,2
0,25
0,3
0,35
0 0,05 0,1 0,15 0,2 0,25 0,3
No
rmal
ized
dia
met
er [
-]
Time [s]
PF curtain resinLPF resinLPF resin + 0,1 % Surfactant 2LPF resin + 0,1 % Surfactant 2 + 0,03 % S/D 1LPF resin + 0,1 % Surfactant 2 + 0,05 % S/D 1LPF resin + 0,1 % Surfactant 2 + 0,03 % Defoamer 1LPF resin + 0,1 % Surfactant 2 + 0,05 % Defoamer 1LPF resin + 0,1 % Surfactant 2 + 0,03 % Defoamer 2LPF resin + 0,1 % Surfactant 2 + 0,05 % Defoamer 2LPF resin + 0,1 % Surfactant 2 + 0,03 % Defoamer 3LPF resin + 0,1 % Surfactant 2 + 0,05 % Defoamer 3
0
0,05
0,1
0,15
0,2
0,25
0,3
0,35
0 0,05 0,1 0,15 0,2 0,25 0,3
No
rmal
ized
dia
met
er [
-]
Time [s]
PF curtain resinLPF resinLPF resin + 0,6 % Surfactant 3LPF resin + 0,6 % Surfactant 3 + 0,03 % S/D 1LPF resin + 0,6 % Surfactant 3 + 0,05 % S/D 1LPF resin + 0,6 % Surfactant 3 + 0,03 % Defoamer 1LPF resin + 0,6 % Surfactant 3 + 0,05 % Defoamer 1LPF resin + 0,6 % Surfactant 3 + 0,03 % Defoamer 2LPF resin + 0,6 % Surfactant 3 + 0,05 % Defoamer 2LPF resin + 0,6 % Surfactant 3 + 0,03 % Defoamer 3LPF resin + 0,6 % Surfactant 3 + 0,05 % Defoamer 3
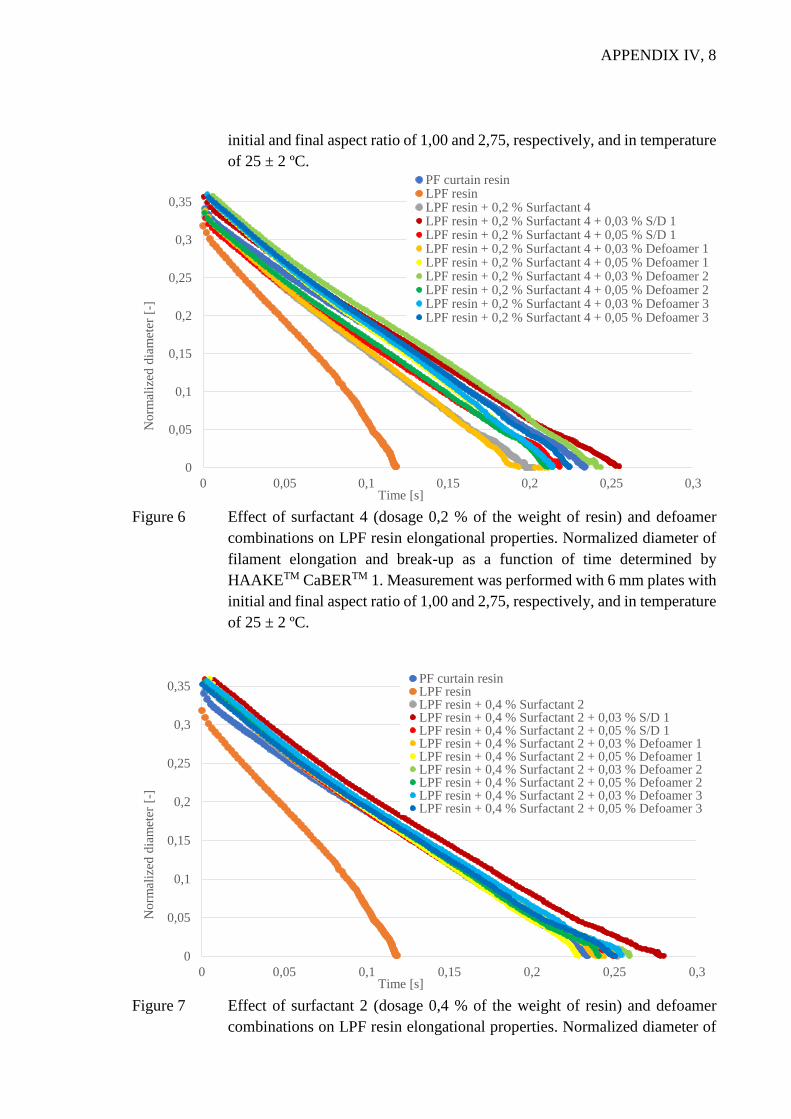
APPENDIX IV, 8
initial and final aspect ratio of 1,00 and 2,75, respectively, and in temperature
of 25 ± 2 ºC.
Figure 6 Effect of surfactant 4 (dosage 0,2 % of the weight of resin) and defoamer
combinations on LPF resin elongational properties. Normalized diameter of
filament elongation and break-up as a function of time determined by
HAAKETM CaBERTM 1. Measurement was performed with 6 mm plates with
initial and final aspect ratio of 1,00 and 2,75, respectively, and in temperature
of 25 ± 2 ºC.
Figure 7 Effect of surfactant 2 (dosage 0,4 % of the weight of resin) and defoamer
combinations on LPF resin elongational properties. Normalized diameter of
0
0,05
0,1
0,15
0,2
0,25
0,3
0,35
0 0,05 0,1 0,15 0,2 0,25 0,3
No
rmal
ized
dia
met
er [
-]
Time [s]
PF curtain resinLPF resinLPF resin + 0,2 % Surfactant 4LPF resin + 0,2 % Surfactant 4 + 0,03 % S/D 1LPF resin + 0,2 % Surfactant 4 + 0,05 % S/D 1LPF resin + 0,2 % Surfactant 4 + 0,03 % Defoamer 1LPF resin + 0,2 % Surfactant 4 + 0,05 % Defoamer 1LPF resin + 0,2 % Surfactant 4 + 0,03 % Defoamer 2LPF resin + 0,2 % Surfactant 4 + 0,05 % Defoamer 2LPF resin + 0,2 % Surfactant 4 + 0,03 % Defoamer 3LPF resin + 0,2 % Surfactant 4 + 0,05 % Defoamer 3
0
0,05
0,1
0,15
0,2
0,25
0,3
0,35
0 0,05 0,1 0,15 0,2 0,25 0,3
No
rmal
ized
dia
met
er [
-]
Time [s]
PF curtain resinLPF resinLPF resin + 0,4 % Surfactant 2LPF resin + 0,4 % Surfactant 2 + 0,03 % S/D 1LPF resin + 0,4 % Surfactant 2 + 0,05 % S/D 1LPF resin + 0,4 % Surfactant 2 + 0,03 % Defoamer 1LPF resin + 0,4 % Surfactant 2 + 0,05 % Defoamer 1LPF resin + 0,4 % Surfactant 2 + 0,03 % Defoamer 2LPF resin + 0,4 % Surfactant 2 + 0,05 % Defoamer 2LPF resin + 0,4 % Surfactant 2 + 0,03 % Defoamer 3LPF resin + 0,4 % Surfactant 2 + 0,05 % Defoamer 3

APPENDIX IV, 9
filament elongation and break-up as a function of time determined by
HAAKETM CaBERTM 1. Measurement was performed with 6 mm plates with
initial and final aspect ratio of 1,00 and 2,75, respectively, and in temperature
of 25 ± 2 ºC.
Figure 8 Effect of surfactant 3 (dosage 0,4 % of the weight of resin) and defoamer
combinations on LPF resin elongational properties. Normalized diameter of
filament elongation and break-up as a function of time determined by
HAAKETM CaBERTM 1. Measurement was performed with 6 mm plates with
initial and final aspect ratio of 1,00 and 2,75, respectively, and in temperature
of 25 ± 2 ºC.
In Table I, the break-up time and capillary velocity of the experiments, determined by
HAAKETM CaBERTM 1 extensional rheometer, are presented. In Table II, the results of
additional experiments are presented.
Table I Break-up time and capillary velocity of the experiments determined by
HAAKETM CaBERTM 1 extensional rheometer. Measurement was performed
with 6 mm plates with initial and final aspect ratio of 1,00 and 2,75,
respectively, and in temperature of 25 ± 2 ºC.
EXP Description Break-up
time, ms
Capillary
velocity,
mm/s
1
2
PF resin
PF curtain resin
91
234
3,429
1,390
0
0,05
0,1
0,15
0,2
0,25
0,3
0,35
0 0,05 0,1 0,15 0,2 0,25 0,3
No
rmal
ized
dia
met
er [
-]
Time [s]
PF curtain resinLPF resinLPF resin + 0,4 % Surfactant 3LPF resin + 0,4 % Surfactant 3 + 0,03 % S/D 1LPF resin + 0,4 % Surfactant 3 + 0,05 % S/D 1LPF resin + 0,4 % Surfactant 3 + 0,03 % Defoamer 1LPF resin + 0,4 % Surfactant 3 + 0,05 % Defoamer 1LPF resin + 0,4 % Surfactant 3 + 0,03 % Defoamer 2LPF resin + 0,4 % Surfactant 3 + 0,05 % Defoamer 2LPF resin + 0,4 % Surfactant 3 + 0,03 % Defoamer 3LPF resin + 0,4 % Surfactant 3 + 0,05 % Defoamer 3

APPENDIX IV, 10
3 LPF resin 118 2,598
4
7
13
14
LPF resin + 0,2 % Surfactant 1
LPF resin + 0,1 % Surfactant 2
LPF resin + 0,6 % Surfactant 3
LPF resin + 0,2 % Surfactant 4
164
218
223
202
1,501
1,475
1,587
1,622
17
18
19
LPF resin + 0,03 % Surfactant/Defoamer 1
LPF resin + 0,05 % Surfactant/Defoamer 1
LPF resin + 0,10 % Surfactant/Defoamer 1
176
193
255
1,890
1,751
1,491
23
24
25
LPF resin + 0,03 % Defoamer 1
LPF resin + 0,05 % Defoamer 1
LPF resin + 0,10 % Defoamer 1
141
204
178
2,358
1,710
1,875
26
27
28
LPF resin + 0,03 % Defoamer 2
LPF resin + 0,05 % Defoamer 2
LPF resin + 0,10 % Defoamer 2
147
150
152
2,246
2,169
2,210
29
30
31
LPF resin + 0,03 % Defoamer 3
LPF resin + 0,05 % Defoamer 3
LPF resin + 0,10 % Defoamer 3
155
146
168
2,204
2,322
2,002
32
33
34
35
LPF resin + 0,2 % Surfactant 1 + 0,03 % S/D 1
LPF resin + 0,2 % Surfactant 1 + 0,03 % Defoamer 1
LPF resin + 0,2 % Surfactant 1 + 0,03 % Defoamer 2
LPF resin + 0,2 % Surfactant 1 + 0,03 % Defoamer 3
252
200
195
214
1,400
1,627
1,506
1,451
36
37
38
39
LPF resin + 0,2 % Surfactant 1 + 0,05 % S/D 1
LPF resin + 0,2 % Surfactant 1 + 0,05 % Defoamer 1
LPF resin + 0,2 % Surfactant 1 + 0,05 % Defoamer 2
LPF resin + 0,2 % Surfactant 1 + 0,05 % Defoamer 3
276
225
201
203
1,195
1,537
1,555
1,691
40
41
42
43
LPF resin + 0,1 % Surfactant 2 + 0,03 % S/D 1
LPF resin + 0,1 % Surfactant 2 + 0,03 % Defoamer 1
LPF resin + 0,1 % Surfactant 2 + 0,03 % Defoamer 2
LPF resin + 0,1 % Surfactant 2 + 0,03 % Defoamer 3
209
217
212
193
1,519
1,617
1,543
1,708
44
45
46
47
LPF resin + 0,1 % Surfactant 2 + 0,05 % S/D 1
LPF resin + 0,1 % Surfactant 2 + 0,05 % Defoamer 1
LPF resin + 0,1 % Surfactant 2 + 0,05 % Defoamer 2
LPF resin + 0,1 % Surfactant 2 + 0,05 % Defoamer 3
234
224
246
199
1,460
1,580
1,426
1,703
48
49
50
51
LPF resin + 0,6 % Surfactant 3 + 0,03 % S/D 1
LPF resin + 0,6 % Surfactant 3 + 0,03 % Defoamer 1
LPF resin + 0,6 % Surfactant 3 + 0,03 % Defoamer 2
LPF resin + 0,6 % Surfactant 3 + 0,03 % Defoamer 3
217
199
206
205
1,546
1,711
1,667
1,763
52
53
54
55
LPF resin + 0,6 % Surfactant 3 + 0,05 % S/D 1
LPF resin + 0,6 % Surfactant 3 + 0,05 % Defoamer 1
LPF resin + 0,6 % Surfactant 3 + 0,05 % Defoamer 2
LPF resin + 0,6 % Surfactant 3 + 0,05 % Defoamer 3
239
226
229
192
1,442
1,554
1,503
1,827
56
57
LPF resin + 0,2 % Surfactant 4 + 0,03 % S/D 1
LPF resin + 0,2 % Surfactant 4 + 0,03 % Defoamer 1
255
193
1,342
1,654

APPENDIX IV, 11
58
59
LPF resin + 0,2 % Surfactant 4 + 0,03 % Defoamer 2
LPF resin + 0,2 % Surfactant 4 + 0,03 % Defoamer 3
241
214
1,471
1,629
60
61
62
63
LPF resin + 0,2 % Surfactant 4 + 0,05 % S/D 1
LPF resin + 0,2 % Surfactant 4 + 0,05 % Defoamer 1
LPF resin + 0,2 % Surfactant 4 + 0,05 % Defoamer 2
LPF resin + 0,2 % Surfactant 4 + 0,05 % Defoamer 3
218
212
211
225
1,419
1,639
1,515
1,548
Table II Break-up time and capillary velocity of the additional experiments
determined by HAAKETM CaBERTM 1 extensional rheometer. Measurement
was performed with 6 mm plates with initial and final aspect ratio of 1,00 and
2,75, respectively, and in temperature of 25 ± 2 ºC.
EXP Description Break-up
time, ms
Capillary
velocity,
mm/s
9
12
LPF resin + 0,4 % Surfactant 2
LPF resin + 0,4 % Surfactant 3
252
197
1,357
1,730
64
65
66
67
LPF resin + 0,4 % Surfactant 2 + 0,03 % S/D 1
LPF resin + 0,4 % Surfactant 2 + 0,03 % Defoamer 1
LPF resin + 0,4 % Surfactant 2 + 0,03 % Defoamer 2
LPF resin + 0,4 % Surfactant 2 + 0,03 % Defoamer 3
280
239
259
254
1,299
1,415
1,363
1,381
68
69
70
71
LPF resin + 0,4 % Surfactant 2 + 0,05 % S/D 1
LPF resin + 0,4 % Surfactant 2 + 0,05 % Defoamer 1
LPF resin + 0,4 % Surfactant 2 + 0,05 % Defoamer 2
LPF resin + 0,4 % Surfactant 2 + 0,05 % Defoamer 3
250
228
241
251
1,395
1,520
1,446
1,363
72
73
74
75
LPF resin + 0,4 % Surfactant 3 + 0,03 % S/D 1
LPF resin + 0,4 % Surfactant 3 + 0,03 % Defoamer 1
LPF resin + 0,4 % Surfactant 3 + 0,03 % Defoamer 2
LPF resin + 0,4 % Surfactant 3 + 0,03 % Defoamer 3
242
201
210
210
1,464
1,718
1,693
1,652
76
77
78
79
LPF resin + 0,4 % Surfactant 3 + 0,05 % S/D 1
LPF resin + 0,4 % Surfactant 3 + 0,05 % Defoamer 1
LPF resin + 0,4 % Surfactant 3 + 0,05 % Defoamer 2
LPF resin + 0,4 % Surfactant 3 + 0,05 % Defoamer 3
228
235
201
233
1,484
1,587
1,715
1,552
If neglecting the absence of storage modulus in shear rheology results, and determining the
zero-shear viscosity based on the available data, zero-shear viscosities are 355 mPas, 379
mPas and 323 mPas, respectively for PF resin, PF curtain resin and LPF resin. Then, Trouton
ratio can be calculated and plotted as a function of Hencky strain. In Figure 9, the Trouton
ratios of the reference resins are presented.
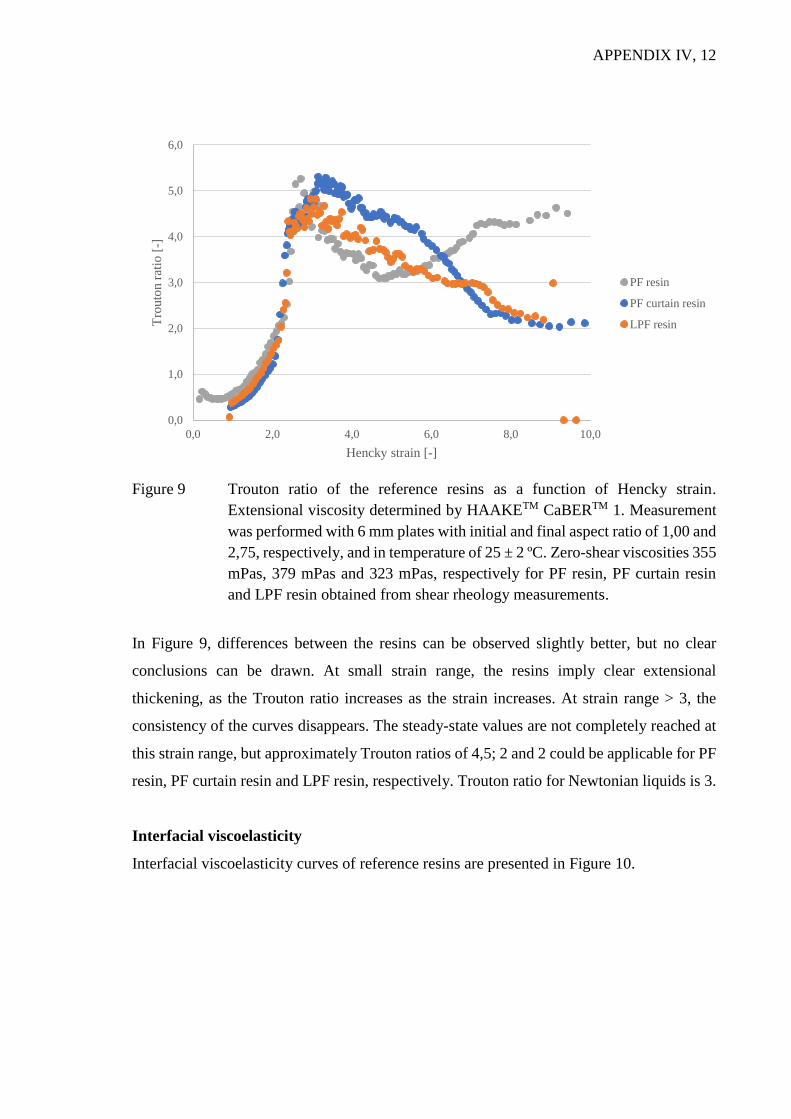
APPENDIX IV, 12
Figure 9 Trouton ratio of the reference resins as a function of Hencky strain.
Extensional viscosity determined by HAAKETM CaBERTM 1. Measurement
was performed with 6 mm plates with initial and final aspect ratio of 1,00 and
2,75, respectively, and in temperature of 25 ± 2 ºC. Zero-shear viscosities 355
mPas, 379 mPas and 323 mPas, respectively for PF resin, PF curtain resin
and LPF resin obtained from shear rheology measurements.
In Figure 9, differences between the resins can be observed slightly better, but no clear
conclusions can be drawn. At small strain range, the resins imply clear extensional
thickening, as the Trouton ratio increases as the strain increases. At strain range > 3, the
consistency of the curves disappears. The steady-state values are not completely reached at
this strain range, but approximately Trouton ratios of 4,5; 2 and 2 could be applicable for PF
resin, PF curtain resin and LPF resin, respectively. Trouton ratio for Newtonian liquids is 3.
Interfacial viscoelasticity
Interfacial viscoelasticity curves of reference resins are presented in Figure 10.
0,0
1,0
2,0
3,0
4,0
5,0
6,0
0,0 2,0 4,0 6,0 8,0 10,0
Tro
uto
n r
atio
[-]
Hencky strain [-]
PF resin
PF curtain resin
LPF resin

APPENDIX IV, 13
Figure 10 Interfacial viscoelasticity of the reference resins, storage (E’) and loss (E’’)
moduli as a function of frequency, determined by CAM 200 optical
tensiometer and PD-100 module, in temperature of 23 ± 1 ºC and relative
humidity of 50 ± 2 %. Drop volumes of 27 μl, 11 μl and 15 μl for PF resin,
PF curtain resin and LPF resin, respectively, and resin density 1,2073 g/cm3
used.
For PF resins, loss/viscous modulus (E’’) is higher than storage/elastic modulus throughout
the measurement. This implies, that the resins are more liquid-like fluids than solid-like. For
LPF resin, a crossover point is observed at 0,07 Hz. The level of the LPF curves is also
higher. This is probably due to lignin in resin structure, since it is the most remarkable
difference between the resins. However, PF curtain resin is assumed to contain additives due
to its curtain formation ability.
Standard deviation between the replicates at each frequency was variable and sometimes
remarkable. Frequency range used in this work was relatively narrow, which was due to
practical issues. Lower frequencies were not applicable due to drying of the resin drop during
a long measurement. Camera of the device was not able to record frames faster, and thus
higher frequencies could not be applied. Overall, higher frequencies would be interesting to
measure. Here, the results could be possibly compared to shear rheology results.
-4,0
-2,0
0,0
2,0
4,0
6,0
8,0
10,0
12,0
14,0
16,0
0,05 0,10 0,15 0,20 0,25
Mo
duli
[m
N/m
]
Frequency [Hz]
PF resin, E'
PF resin, E''
PF curtain resin, E'
PF curtain resin, E''
LPF resin, E'
LPF resin, E''

APPENDIX IV, 14
Interfacial rheology studies mostly focus on foam and emulsion stability characterization.
Thus, the availability of reasonable reference results from literature is limited. Beneventi &
Guerin (2005) have mentioned the study of surface viscoelastic modulus above the critical
micelle concentration of the surfactant as a part of their paper curtain coating study. They
conclude that low surface elasticity, below 16 mN/m, is desired for successful curtain
formation. The interfacial viscoelasticity of LPF resin obtained in this work, is below 16
mN/m.
However, pulsating/oscillating drop measurement was further tested for surfactant including
resins. The measurement should give insight about the surfactant performance in the
solution, and thus, the effect of two surfactants (1 and 4) with different chemical composition
and defoamer 3, which is described as nonionic surfactant and defoamer, on LPF resin
interfacial viscoelasticity was tested. In Figure 11, Figure 12 and Figure 13 the effect of
surfactants (dosages of 0,2 %, 0,4 % and 0,6 %, respectively) and in Figure 14 the effect of
defoamer 3 (dosage 0,1 %) is presented.
Figure 11 Effect of surfactants 1 and 4 (dosage 0,2 %) on interfacial viscoelasticity of
LPF resin, storage (E’) and loss (E’’) moduli as a function of frequency,
determined by CAM 200 optical tensiometer and PD-100 module, in
temperature of 23 ± 1 ºC and relative humidity of 50 ± 2 %. Drop volumes of
13 μl and 14 μl for LPF resin with surfactant 1 and 4, respectively, and resin
density 1,2073 g/cm3 used.
-2,0
0,0
2,0
4,0
6,0
8,0
10,0
12,0
14,0
16,0
0,05 0,10 0,15 0,20 0,25
Mo
duli
[m
N/m
]
Frequency [Hz]
PF curtain resin, E'
PF curtain resin, E''
LPF resin, E'
LPF resin, E''
LPF resin + 0,2 % Surf 1, E'
LPF resin + 0,2 % Surf 1, E''
LPF resin + 0,2 % Surf 4, E'
LPF resin + 0,2 % Surf 4, E''

APPENDIX IV, 15
Figure 12 Effect of surfactants 1 and 4 (dosage 0,4 %) on interfacial viscoelasticity of
LPF resin, storage (E’) and loss (E’’) moduli as a function of frequency,
determined by CAM 200 optical tensiometer and PD-100 module, in
temperature of 23 ± 1 ºC and relative humidity of 50 ± 2 %. Drop volumes of
12 μl and 13 μl for LPF resin with surfactant 1 and 4, respectively, and resin
density 1,2073 g/cm3 used.
Figure 13 Effect of surfactants 1 and 4 (dosage 0,6 %) on interfacial viscoelasticity of
LPF resin, storage (E’) and loss (E’’) moduli as a function of frequency,
determined by CAM 200 optical tensiometer and PD-100 module, in
temperature of 23 ± 1 ºC and relative humidity of 50 ± 2 %. Drop volumes of
10 μl and 12 μl for LPF resin with surfactant 1 and 4, respectively, and resin
density 1,2073 g/cm3 used.
0,0
2,0
4,0
6,0
8,0
10,0
12,0
14,0
16,0
0,05 0,10 0,15 0,20 0,25
Mo
duli
[m
N/m
]
Frequency [Hz]
PF curtain resin, E'
PF curtain resin, E''
LPF resin, E'
LPF resin, E''
LPF resin + 0,4 % Surf 1, E'
LPF resin + 0,4 % Surf 1, E''
LPF resin + 0,4 % Surf 4, E'
LPF resin + 0,4 % Surf 4, E''
0,0
2,0
4,0
6,0
8,0
10,0
12,0
14,0
16,0
0,05 0,10 0,15 0,20 0,25
Mo
duli
[m
N/m
]
Frequency [Hz]
PF curtain resin, E'
PF curtain resin, E''
LPF resin, E'
LPF resin, E''
LPF resin + 0,6 % Surf 1, E'
LPF resin + 0,6 % Surf 1, E''
LPF resin + 0,6 % Surf 4, E'
LPF resin + 0,6 % Surf 4, E''

APPENDIX IV, 16
As seen from Figure 11, Figure 12 and Figure 13, surfactants affect the LPF resin interfacial
viscoelasticity. With dosage of 0,2 % of surfactant 1, the shape of the E’ and E’’ curves is
similar to LPF resin without additives, but at lower level. With dosage of 0,4 %, the curves
are close to each other and with dosage of 0,6 % there is again a remarkable difference
between the curves and actually two crossover points. There is no consistency in the results
with surfactant 1. With surfactant 4, however, the loss and storage moduli curves of LPF
resin gradually change positions as the surfactant dosage level increases. With 0,2 % dosage
of surfactant 4, storage modulus is higher or equal to loss modulus at all frequencies, but
with dosage of 0,6 %, loss modulus is higher or equal to storage modulus at all frequencies.
Figure 14 Effect of defoamer 3 (dosage 0,1 %) on interfacial viscoelasticity of LPF
resin, storage (E’) and loss (E’’) moduli as a function of frequency,
determined by CAM 200 optical tensiometer and PD-100 module, in
temperature of 23 ± 1 ºC and relative humidity of 50 ± 2 %. Drop volume of
15 μl, and resin density 1,2073 g/cm3 used.
As seen from Figure 14, also with defoamer 3 the level of E’ and E’’ curves is lowered.
There is a remarkable effect on storage modulus of LPF resin with defoamer 3 as the
difference between the lowest and highest frequency has increased.
Difference between the surfactant 1 and 4 and defoamer 3 performance can be recognized.
However, evaluation of the performance, whether the other additive is better than the other,
is challenging due to lack of reference results. In the scope of this work, this analytical
0,0
2,0
4,0
6,0
8,0
10,0
12,0
14,0
16,0
0,05 0,10 0,15 0,20 0,25
Mo
duli
[m
N/m
]
Frequency [Hz]
PF curtain resin, E'
PF curtain resin, E''
LPF resin, E'
LPF resin, E''
LPF resin + 0,1 % Df 3, E'
LPF resin + 0,1 % Df 3, E''

APPENDIX IV, 17
method was not considered as valuable as the analytical methods determining surface tension
and rheological properties of the resins.

APPENDIX V, 1
APPENDIX V: MULTIPLE LINEAR REGRESSION ANALYSIS
From multiple linear regression (MLR) analysis, the following values are obtained
(Montgomery et al., 2012):
- Multiple R: correlation coefficient
- R Square: squared correlation coefficient
- Adjusted R Square: for system with more than one x variable
- Significance F: significance of the model
- P-value: probability value
- t Stat: student’s test parameter.
Surfactant 2 and defoamers
In Table I, Table II, Table III and Table IV, the MLR analysis output is presented for
surfactant 2 in combination with surfactant/defoamer 1, defoamer 1, defoamer 2 and
defoamer 3, respectively. MLR analyses computed with Microsoft Excel Data Analysis Add-
Inn.
Table I MLR analysis for surfactant 2 and surfactant/defoamer 1 additive
combination. Variable coefficients computed for the working curve model.
Regression Statistics
Multiple R 0,960601
R Square 0,922755
Adjusted R Square 0,860959
Standard Error 0,017607
Observations 10
ANOVA
df SS MS F Significance
F
Regression 4 0,018515 0,004629 14,932270 0,0054840
Residual 5 0,001550 0,000310
Total 9 0,020065
Variables Coefficients Standard
Error t Stat P-value
Lower
95%
Upper
95%
Intercept 0,130829 0,013514 9,680810 0,000200 0,096089 0,165568
x1 0,767338 0,191015 4,017167 0,010149 0,276319 1,258357
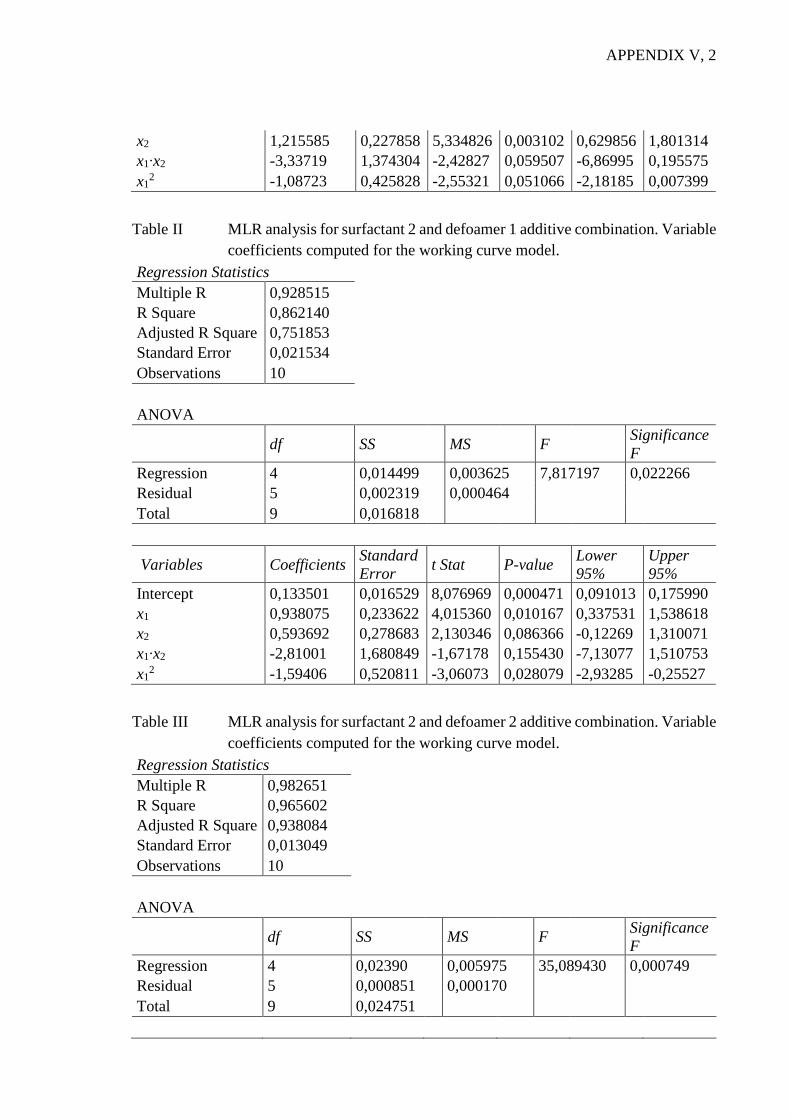
APPENDIX V, 2
x2 1,215585 0,227858 5,334826 0,003102 0,629856 1,801314
x1∙x2 -3,33719 1,374304 -2,42827 0,059507 -6,86995 0,195575
x12 -1,08723 0,425828 -2,55321 0,051066 -2,18185 0,007399
Table II MLR analysis for surfactant 2 and defoamer 1 additive combination. Variable
coefficients computed for the working curve model.
Regression Statistics
Multiple R 0,928515
R Square 0,862140
Adjusted R Square 0,751853
Standard Error 0,021534
Observations 10
ANOVA
df SS MS F Significance
F
Regression 4 0,014499 0,003625 7,817197 0,022266
Residual 5 0,002319 0,000464
Total 9 0,016818
Variables Coefficients Standard
Error t Stat P-value
Lower
95%
Upper
95%
Intercept 0,133501 0,016529 8,076969 0,000471 0,091013 0,175990
x1 0,938075 0,233622 4,015360 0,010167 0,337531 1,538618
x2 0,593692 0,278683 2,130346 0,086366 -0,12269 1,310071
x1∙x2 -2,81001 1,680849 -1,67178 0,155430 -7,13077 1,510753
x12 -1,59406 0,520811 -3,06073 0,028079 -2,93285 -0,25527
Table III MLR analysis for surfactant 2 and defoamer 2 additive combination. Variable
coefficients computed for the working curve model.
Regression Statistics
Multiple R 0,982651
R Square 0,965602
Adjusted R Square 0,938084
Standard Error 0,013049
Observations 10
ANOVA
df SS MS F Significance
F
Regression 4 0,02390 0,005975 35,089430 0,000749
Residual 5 0,000851 0,000170
Total 9 0,024751

APPENDIX V, 3
Variables Coefficients Standard
Error t Stat P-value
Lower
95%
Upper
95%
Intercept 0,126181 0,010016 12,59796 5,6E-05 0,100434 0,151929
x1 1,134920 0,141570 8,016671 0,000488 0,771002 1,498837
x2 0,346578 0,168876 2,052257 0,095368 -0,08753 0,780689
x1∙x2 -1,18459 1,018561 -1,16301 0,297309 -3,80289 1,433699
x12 -2,03833 0,315601 -6,45856 0,001325 -2,84961 -1,22705
Table IV MLR analysis for surfactant 2 and defoamer 3 additive combination. Variable
coefficients computed for the working curve model.
Regression Statistics
Multiple R 0,972832
R Square 0,946401
Adjusted R Square 0,919602
Standard Error 0,013731
Observations 10
ANOVA
df SS MS F Significance
F
Regression 3 0,019975 0,006658 35,314440 0,000330
Residual 6 0,001131 0,000189
Total 9 0,021106
Variables Coefficients Standard
Error t Stat P-value
Lower
95%
Upper
95%
Intercept 0,137107 0,008831 15,52555 4,52E-06 0,115498 0,158716
x1 0,746260 0,143848 5,187837 0,002039 0,394277 1,098243
x1∙x2 -1,16581 0,334810 -3,48200 0,013111 -1,98506 -0,34656
x22 2,830638 1,658047 1,707212 0,138652 -1,22646 6,887734
Surfactant 3 and defoamers
In Table V, Table VI, Table VII and Table VII, the MLR analysis output is presented for
surfactant 3 in combination with surfactant/defoamer 1, defoamer 1, defoamer 2 and
defoamer 3, respectively. MLR analyses computed with Microsoft Excel Data Analysis Add-
Inn.

APPENDIX V, 4
Table V MLR analysis for surfactant 3 and surfactant/defoamer 1 additive
combination. Variable coefficients computed for the working curve model.
Regression Statistics
Multiple R 0,950041
R Square 0,902578
Adjusted R Square 0,853867
Standard Error 0,015341
Observations 10
ANOVA
df SS MS F Significance
F
Regression 3 0,013083 0,004361 18,529200 0,001947
Residual 6 0,001412 0,000235
Total 9 0,014495
Variables Coefficients Standard
Error t Stat P-value
Lower
95%
Upper
95%
Intercept 0,130334 0,011786 11,05819 3,26E-05 0,101494 0,159173
x1 0,158877 0,030310 5,241749 0,001935 0,084711 0,233042
x2 1,290619 0,207411 6,222507 0,000796 0,783101 1,798136
x1∙x2 -1,62097 0,718615 -2,25568 0,064932 -3,37936 0,137421
Table VI MLR analysis for surfactant 3 and defoamer 1 additive combination. Variable
coefficients computed for the working curve model.
Regression Statistics
Multiple R 0,826521
R Square 0,683137
Adjusted R Square 0,592605
Standard Error 0,023774
Observations 10
ANOVA
df SS MS F Significance
F
Regression 2 0,008530 0,004265 7,545784 0,017908
Residual 7 0,003956 0,000565
Total 9 0,012486
Variables Coefficients Standard
Error t Stat P-value
Lower
95%
Upper
95%
Intercept 0,139886 0,016492 8,482045 6,26E-05 0,100888 0,178883
x1 0,115926 0,030591 3,789574 0,006807 0,043590 0,188261
x2 0,513813 0,267365 1,921768 0,096079 -0,1184 1,146030

APPENDIX V, 5
Table VII MLR analysis for surfactant 3 and defoamer 2 additive combination. Variable
coefficients computed for the working curve model.
Regression Statistics
Multiple R 0,964116
R Square 0,929519
Adjusted R Square 0,909381
Standard Error 0,011467
Observations 10
ANOVA
df SS MS F Significance
F
Regression 2 0,012139 0,006070 46,158610 9,3E-05
Residual 7 0,000920 0,000131
Total 9 0,013060
Variables Coefficients Standard
Error t Stat P-value
Lower
95%
Upper
95%
Intercept 0,133793 0,007955 16,81919 6,43E-07 0,114983 0,152603
x1 0,140743 0,014755 9,538606 2,92E-05 0,105853 0,175634
x2 0,215983 0,128961 1,674795 0,137885 -0,08896 0,520927
Table VIII MLR analysis for surfactant 3 and defoamer 3 additive combination. Variable
coefficients computed for the working curve model.
Regression Statistics
Multiple R 0,928505
R Square 0,862122
Adjusted R Square 0,793183
Standard Error 0,016715
Observations 10
ANOVA
df SS MS F Significance
F
Regression 3 0,010482 0,003494 12,505600 0,005429
Residual 6 0,001676 0,000279
Total 9 0,012158
Variables Coefficients Standard
Error t Stat P-value
Lower
95%
Upper
95%
Intercept 0,132731 0,011919 11,13561 3,13E-05 0,103565 0,161896
x1 0,323721 0,087716 3,690548 0,010202 0,109087 0,538355
x2 0,307987 0,188857 1,630793 0,154055 -0,15413 0,770104
x12 -0,35664 0,149799 -2,38077 0,054711 -0,72318 0,009908