Embed Size (px)
Citation preview

1
Defining totipotency using criteria of increasing stringency
Eszter Posfaia,b,#,* John Paul Schellc,d,#, Adrian Janiszewskif,#, Isidora Rovice, Alexander Murraya,
Brian Bradshawa, Tine Pardonf, Mouna El Bakkalif, Irene Talonf, Natalie De Geestf, Pankaj
Kumarc,d, San Kit Tof, Sophie Petropoulosc,d,h, Andrea Jurisicovae,i, Vincent Pasquef, *, Fredrik
Lannerc,d,g*, Janet Rossanta,*
aProgram in Developmental and Stem Cell Biology, Hospital for Sick Children, Toronto, ON,
Canada
bCurrent: Department of Molecular Biology, Princeton University, Princeton, NJ, USA
cDepartment of Clinical Sciences, Intervention and Technology, Karolinska Institutet, Stockholm,
Sweden
dDivision of Obstetrics and Gynecology, Karolinska Universitetssjukhuset, Stockholm, Sweden.
eLunenfeld Tanenbaum Research Institute, Sinai Health System, Toronto, ON, Canada
fKU Leuven-University of Leuven, Department of Development and Regeneration, Leuven,
Belgium
gMing Wai Lau Center for Reparative Medicine, Stockholm node, Karolinska Institutet, Stockholm,
Sweden
hCentre de recherche du centre hospitalier de l'université de montréal (CRCHUM), University of
Montreal, Department of Medicine, Montreal, QC, Canada
i Departments of Obstetrics and Gynecology and Department of Physiology, Toronto, ON, Canada
#authors contributed equally
*corresponding authors
Abstract
Totipotency is the ability of a single cell to give rise to all the differentiated cells that build the
conceptus, yet how to capture this property in vitro remains incompletely understood. Defining
totipotency relies upon a variety of assays of variable stringency. Here we describe criteria to
define totipotency. We illustrate how distinct criteria of increasing stringency can be used to judge
totipotency by evaluating candidate totipotent cell types in the mouse, including early blastomeres
and expanded or extended pluripotent stem cells. Our data challenge the notion that expanded
or extended pluripotent states harbor increased totipotent potential relative to conventional
embryonic stem cells under in vivo conditions.
.CC-BY 4.0 International license(which was not certified by peer review) is the author/funder. It is made available under aThe copyright holder for this preprintthis version posted March 3, 2020. . https://doi.org/10.1101/2020.03.02.972893doi: bioRxiv preprint

2
Introduction
During early mammalian development, the totipotent state of early blastomeres is rapidly lost as
cells gradually restrict their developmental potential and commit to distinct cell lineages by the
blastocyst stage1,2,3. In mouse, the first cell fate decision starting at embryonic day (E)2.5 sets
aside the trophectoderm (TE), the precursors of the placenta, from the inner cell mass (ICM). A
second cell fate decision starting around E3.5 within the ICM gives rise to the pluripotent epiblast
(EPI) and the primitive endoderm (PE), precursors of all embryonic germ layers and
extraembryonic yolk sac, respectively4. For the most part EPI, PE and TE cells maintain
blastocyst-defined lineage assignments throughout subsequent development, with a notable
exception for the PE, which was shown to also contribute to otherwise EPI-derived definitive
endodermal lineages during post-implantation stages5,6.
While EPI, PE and TE cells exist only transiently in the developing embryo, distinct self-renewing
stem cell types can be derived from each cell type using a combination of appropriate growth
factors and/or inhibitors which capture and preserve their developmental potential in culture7,8,9,10.
Murine embryonic stem cells (ESCs) derived from the early EPI lineage were originally
established using fetal bovine serum and leukemia inhibitory factor (Lif)7,8. They can however also
be cultured under naïve conditions, using inhibitors against mitogen-activated protein kinase and
glycogen synthase kinase-3, termed 2i, in combination with Lif11. Trophoblast stem cells (TSCs)
can be derived from the TE lineage using fibroblast growth factor 4 and heparin9 and
extraembryonic endoderm (XEN) stem cells can be established from the PE using various
methods10,12,13. Importantly, while each of these stem cell types are able to re-enter the normal
course of embryonic development and differentiate into the downstream cell types similar to their
in vivo counterparts, they are also lineage restricted in that they do not readily cross lineage
boundaries that have been set during blastocyst formation14,15.
Strict lineage restriction differs between the three stem cell types, and is reflected in the time
elapsed since the source lineages parted ways during embryo development. The closer
relationship between EPI and PE lineages is also underscored by the observation that XEN cells
can spontaneously appear in ESC cultures16,17 and ESCs can be readily converted into XEN cells
using only soluble factors13. On the other hand, ESCs have only been reported to rarely contribute
to trophectoderm-derived lineages in vivo18. Work by several laboratories has also shown that
stem cell types with properties of TE, EPI or PE can be obtained by reprogramming lineage
.CC-BY 4.0 International license(which was not certified by peer review) is the author/funder. It is made available under aThe copyright holder for this preprintthis version posted March 3, 2020. . https://doi.org/10.1101/2020.03.02.972893doi: bioRxiv preprint

3
restriction using transcription factor (TF) expression. Long-term TF overexpression was shown to
reprogram ESCs into TSC-like cells in vitro19,20,21,22. Induced pluripotent stem cells (iPSCs), as
well as induced TSCs and induced XEN stem cells have also been derived by TF overexpression
followed by culture with the appropriate growth media23,24. Additionally, mouse primed epiblast
stem cells (EpiSCs), isolated from the post-implantation epiblast25,26 can be reverted back into
ESCs27. Collectively, these studies suggested that it might be possible to induce totipotent stem
cells, or at least cells that approach the totipotent state, by conversion from pluripotent stem cells.
In the past years there has been several reports of conditions to derive novel mouse stem cells
types with the ability to produce descendants contributing to all three blastocyst-defined
lineages28,29,30,31,32,33,34. In particular, two methods were described to derive extended or expanded
pluripotent stem cells (EPSCs) by conversion from pre-existing ESCs or directly from 8-cell stage
blastomeres33,32. In the first method, Liu lab EPSCs (L-EPSCs)32 were derived in Lif, CHIR,
PD0325901, JNK Inhibitor VIII, SB203580, A-419259 and XAV939. In the second method, Deng
lab EPSCs (D-EPSCs)33 were derived using Lif, CHIR, DiM ((S)-(+)-Dimethindene maleate), and
MiH (Minocycline hydrochloride). Both cell types showed molecular and functional features that
suggested expanded pluripotency, such as totipotency-associated marker gene expression and
contribution to the EPI, PE as well as TE lineages using chimeric assays. Additionally, recent
studies reported the ability of EPSCs, alone or in combination with TSCs, to self-assemble into
blastocyst-like structures, termed blastoids, that contain cells with features of all three embryonic
lineages35,36. These studies suggested that stem cells with the potential to give rise to both ICM
and TE lineages, properties that define totipotent stem cells, can be isolated and expanded in
vitro.
Many criteria of variable stringency can be used to assess totipotency. One criterion is to assess
gene expression, in search of activated totipotency-associated marker genes. This can either be
performed in bulk for a set of genes or through a more stringent approach taking advantage of
transcriptome-wide single cell correlation analysis with totipotent cells of early embryos. More
demanding is providing evidence of the potential to enter both the embryonic and extraembryonic
pathway using in vitro differentiation assays. Finally, a more stringent requirement for evaluating
the potential of different stem cell types is to perform in vivo aggregation experiments, by
combining candidate cells with a host embryo and analyzing lineage contributions in the resulting
chimera. Candidate cells are typically combined with morula (8-16 cell stage) or blastocyst stage
host embryos and analyzed at different developmental stages. It is important to analyze chimeric
.CC-BY 4.0 International license(which was not certified by peer review) is the author/funder. It is made available under aThe copyright holder for this preprintthis version posted March 3, 2020. . https://doi.org/10.1101/2020.03.02.972893doi: bioRxiv preprint
4
contributions not only based on localization, but also by assessing lineage integration using
functional marker analysis.
Here we subject candidate totipotent stem cells to these assays of increasing stringency to assess
their developmental potential. We analyze the transcriptome and gene regulatory networks of
ESCs, L-EPSC and D-EPSCs and pre-implantation embryos using bulk and single-cell RNA-
sequencing (RNA-seq), and provide a resource for the community enabling interactive online data
exploration. We investigate the ability of EPSCs to give rise to TSCs in both a conversion and a
reprogramming setting. We analyze the transcriptome and gene regulatory networks of blastoids
derived from EPSCs. Finally, we examine how EPSCs and blastomeres perform in chimeric
experiments. We present a gold standard for analyzing contribution to different lineages, with a
focus on contribution to the trophoblast lineage at different stages combined with molecular
analyses. We emphasize the importance of thorough analysis of cell potential using high
stringency assays and highlight the ongoing challenges of unlocking the totipotent state.
Results
Transcriptional signatures of preimplantation embryos and different stem cell states
Transcriptomic analysis can serve as effective means to monitor cellular states and analyze
marker gene expression. Therefore, using transcriptional similarity analysis, we investigated
which in vivo developmental stage or previously established in vitro stem cell state L-EPSCs and
D-EPSCs resemble the most. First, we converted naïve ESCs (2iLif) to L-EPSCs and D-EPSCs
using published protocols33,32. We observed similar morphological changes after conversion as
previously reported33,32 and were able to stably maintain L-EPSC and D-EPSC cell lines (Figure
S1A). In our first experiments we used bulk RNA sequencing for genome-wide detection of
transcription and assessment of totipotency marker gene expression in L-EPSCs. We first set out
to explore the dynamics with which a transcriptome shift is induced after switching ESCs into L-
EPSC conditions (Figure 1A). Our results reveal a rapid transcriptome change, within 3 days of
induction, indicating that ESCs can readily convert into L-EPSCs (Figure 1B). Intriguingly, despite
these differences between L-EPSCs and ESCs, the L-EPSC transcriptome resembled the ESC
transcriptome more than any early mouse embryo stage (Figure 1C and S2A and B) and 4-cell
and 8-16 cell stage embryo marker genes remained mostly silenced (Figure 1D).
.CC-BY 4.0 International license(which was not certified by peer review) is the author/funder. It is made available under aThe copyright holder for this preprintthis version posted March 3, 2020. . https://doi.org/10.1101/2020.03.02.972893doi: bioRxiv preprint

5
Single-cell RNA-seq (scRNA-seq) is particularly suited to resolve cellular heterogeneity and
identify subpopulations with distinct transcriptional features. To examine whether totipotent
features can be detected in individual cells, we applied SMART-seq2 scRNA-seq to ESCs, as
well as to L-EPSCs and D-EPSCs derived from them. As a reference we transcriptionally tracked
mouse preimplantation lineage segregation and post-implantation epiblast development from
zygote to E6.75, and included naïve ESC and primed EpiSC states as well (Figure 1E). This
dataset includes single-cell sequencing data from Deng et al. 201437, Posfai et al. 20173,
Mohammed et al. 201738, and Chen et al. 201639, as well as an additional 96 cells from E2.5 and
E4.5 embryos, and 551 cells from three pluripotent stem cell conditions: ESCs cultured in 2iLif,
L-EPSCs and D-EPSCs, sequenced in this study. This integrated dataset provided suitable
sampling for establishing a comparison of embryonic development with the different stem cell
culture conditions, using Seurat v3.0 CCA integration tools (Figure S2C). Based on clustering
using the top 2000 most variable genes, we resolved clear segregation of ICM/TE and EPI/PE
lineages and annotated them based on the expression of well-established lineage markers
(Figure S2D). As expected, ESCs cultured in 2iLif conditions occupied the space between E3.5
ICM and E4.5 EPI, while primed EpiSCs clustered with E5.5 and E6.75 EPI cells. We found that
along the embryonic developmental trajectory L-EPSCs, as parental ESCs, clustered between
the E3.5 ICM and E4.5 EPI stages, while the majority of D-EPSCs clustered together with E5.5
stage EPI cells (Figure 1E). We observed that top differentially expressed genes reported to be
upregulated in D-EPSCs compared to Lif/serum-cultured ESCs were also upregulated in D-
EPSCs compared to 2iLif-cultured ESCs (Figure S2E). We additionally constructed a correlation
matrix from the top 2000 genes averaged expression to compare each stem cell condition
independently with each developmental stage (Figure 1F). While ESCs showed high correlation
with all preimplantation stages: 8-cell (r = .45, p < .001), morula (r = .55, p < .001), ICM (r = .53,
p < .001), and highest similarity with E4.5 EPI (r = .72, p < .001), L-EPSCs (from both this and
previous study) exhibited the most resemblance to E4.5 EPI (r = .64, p < .001), while lacking
significant correlation with other developmental stages (p > .05). Consistent with the UMAP, D-
EPSCs correlated the most with E5.5 EPI (r = .89, p < .001), but also showed close similarity with
primed EpiSCs (r = .71, p < .001), and E6.75 EPI (r = .51, p < .001). The position occupied by L-
EPSCs in the UMAP space is consistent with the original report by Yang et al.32. In conclusion, L-
and D-EPSCs single-cell transcriptomes align with pluripotent rather than totipotent states.
.CC-BY 4.0 International license(which was not certified by peer review) is the author/funder. It is made available under aThe copyright holder for this preprintthis version posted March 3, 2020. . https://doi.org/10.1101/2020.03.02.972893doi: bioRxiv preprint

6
Embryo development is under the control of transcription factors that bind to cis-regulatory
regions, forming gene regulatory networks. We reconstructed gene regulatory networks which are
active in early development, ESCs and EPSCs, from scRNA-seq data, using single-cell gene
regulatory inference and clustering (pySCENIC40). SCENIC predicts TFs that may control cellular
states present in the dataset, together with candidate TF target genes. A TF and its candidate
targets are called a regulon, and by quantifying the activity of regulons in each single cell, SCENIC
can be used to cluster cells based on the activity of regulatory programs. In contrast to identifying
the global transcriptional state of cells, here we project a UMAP visualization based on regulon
activity and reveal that 2iLif ESCs localize closest to E3.5 ICM, and both L- and D-EPSCs
clustered between E4.5 EPI and E5.5 EPI (Figure S2F). These results show that the regulatory
state of EPSCs resembles that of late pluripotent EPI rather than earlier, totipotent developmental
stages.
Capacity of EPSCs to enter the trophectoderm program and generate TSC-like cells in vitro
Another test to judge totipotency is to evaluate the capacity of cells to enter the trophoblast linage.
This can be assessed in vitro by switching cells to TSC culture conditions and assaying whether
cells give rise to TSC-like cells, a transition that pluripotent ESCs cannot make. When bulk L-
EPSCs cultures were switched to TSC conditions followed by RT-PCR to assay trophoblast
marker gene expression (Figure 2A), no substantial activation of such genes was seen (Figure
2B).
To examine whether a small subpopulation of L-EPSCs or D-EPSCs may harbor the potential to
directly convert into TSCs, as suggested by a previous study (Yang32), we analyzed the
expression of key TSC markers on a single cell level using flow cytometry (Figure 2C).
Additionally, we tested whether L-EPSCs and D-EPSCs can be reprogrammed into TSC-like cells
more efficiently than ESCs. While ESCs do not readily convert into TSCs, they can be
reprogrammed with low efficiency into TSCs by induced overexpression of TSC-associated TFs,
such as Cdx2 and by lowering the expression of the pluripotency factor Oct419. To assay TSC
reprogramming, we used a tetracycline-inducible Cdx2 (iCdx2) and Oct4 heterozygous ESC
background, used in the original ESC-to-TSC reprogramming experiments19. To read out fate
conversion using flow cytometry, we immunostained for two TSC-specific cell surface markers,
CD40 and Plet1. We also established an Elf5-2A-mCherry reporter ESC line by targeting 2A-
mCherry to the C-terminus of the endogenous Elf5 locus41,42,20,22 (Figure 2C). We then switched
.CC-BY 4.0 International license(which was not certified by peer review) is the author/funder. It is made available under aThe copyright holder for this preprintthis version posted March 3, 2020. . https://doi.org/10.1101/2020.03.02.972893doi: bioRxiv preprint

7
L-EPSCs, D-EPSCs and ESCs to TSC medium (with Fgf4 and Heparin) with or without
tetraycycline (+/-4OH) and cultured the cells for 6 days (6d) before analyzing TSC-marker
expression. We found that both in the absence or presence of Cdx2 induction, there were no
significant differences in the number of single or triple marker positive cells between ESC and
either EPSC conditions (Figure 2D). In contrast, a control TSC line in which we also targeted the
Elf5 gene with the mCherry reporter showed 80% CD40/PLET1/ELF5 triple-positive cells (Figure
2E). Collectively, these results indicate that the EPSC states do not facilitate more efficient
reprogramming into TSCs in vitro, in contrast with a previous study that suggested an increased
ability of EPSC to give rise to TSC-like cells compared to ESC33,32.
In vitro blastoid-forming ability of D-EPSCs based on Li et al. 2019 and Sozen et al. 2019
The ultimate proof of totipotency is the ability of a single cell type, or more stringently a single cell,
to give rise to an entire blastocyst and subsequently a viable and fertile animal. Recently,
blastocyst-like structures, termed blastoids, have been generated in vitro from different stem cell
types43,44,35,36. These protocols use different combinations of growth factors and inhibitors to
generate blastoids, which in multiple aspects resemble real blastocyst stage embryos, although
until now none have been able to generate viable animals. Most notably, two recent reports used
D-EPSCs, either as a sole stem cell source (Belmonte group, B-blastoid)35 or in combination with
TSCs (Zernicka-Goetz group, ZG-blastoid)36 to generate blastoids. Importantly, a large proportion
of the blastoid cells generated with only D-EPSCs showed expression of genes previously
associated with post-implantation stage lineages and not cells of the blastocyst. We therefore re-
analyzed the scRNA-seq data provided in these reports and aligned them to our existing sampled
preimplantation cells, along with an additional dataset containing cells up to E7.545, to generate a
developmental trajectory spanning fertilization to gastrulation (Figure 3A, S3A), resource data
also available for visualization in SCope56. ZG-blastoids were generated by combining either D-
EPSCs or ESCs with TSCs, using a slightly modified version of the protocol established by Rivron
et al. for making blastoids43 with ESCs and TSCs. Corroborating previous findings, we found that
both ESCs and D-EPSCs are able to give rise to similar cell types in these blastoids (Figure S3B,
S3C): to cells resembling the E4.5 blastocyst EPI and to cells most similar to E4.5 PE or
postimplantation parietal endoderm (Figure 3A, S3C), albeit reportedly D-EPSCs give rise to PE-
like cells more efficiently than ESCs36. However, using the ZG-blastoid forming method the
authors saw no detectable contribution of D-EPSCs towards the TE lineage and blastoid formation
was not observed when TSCs were omitted36. B-blastoids, made from only D-EPSCs, also
.CC-BY 4.0 International license(which was not certified by peer review) is the author/funder. It is made available under aThe copyright holder for this preprintthis version posted March 3, 2020. . https://doi.org/10.1101/2020.03.02.972893doi: bioRxiv preprint
8
contained cells (B-blastoid EPI) that grouped with E4.5 blastocyst EPI cells and cells (B-blastoid
PE) that grouped towards E4.5 blastocyst PE or postimplantation parietal endoderm cells (Figure
3A, S3D). However, only 6.7% of B-blastoid cells (B-blastoid-TE) clustered close to the TE
lineage, between blastocyst TE cells and postimplantation ExE (Figure S3E). The remaining 60%
of B-blastoid cells consisted of two intermediate clusters (B-blastoid-intermediate-1 and 2) that
did not align with any blastocyst cells but instead resembled most closely certain postimplantation
stage embryo cells. In an in vitro blastoid culture, these cells could be mistaken for TE cells as
they express Cdx2, Krt8 and Krt18. However, they also co-expressed T (Brachyury) suggesting
an embryonic or extra-embryonic mesoderm identity (Figure 3B). Indeed, B-blastoid-intermediate-
1 cells showed the highest correlation with E5.5 EPI (r = .28, p < .001), E6.5-E7.5 EPI (r = .29, p
< .001) and ExE mesoderm (r = .33, p < .001) and B-blastoid-intermediate-2 cells with ExE
mesoderm (r = .67, p = .001) and other mesodermal lineages: mixed mesoderm (r = .64, p = .001),
intermediate mesoderm (r = .62, p = .001), nascent mesoderm (r = .48, p = .001), as well as a
strong resemblance to mesenchyme (r = .42, p = .001) (Figure 3C). Nevertheless, the small
subpopulation of B-blastoid-TE cells resembling blastocyst TE is intriguing, and leaves the door
open to the possibility that D-EPSCs can contribute to the trophoblast lineage under B-blastoid
forming conditions. However, it should be noted that these cells expressed very low levels of
conventional TE markers such as Cdx2, Elf5 and Gata3, while also exhibiting a higher similarity
to ExE ectoderm (r = .74, p =.001), than genuine TE (r = .62, p = .001) (Figure 3B, 3C).
At the gene regulatory level, both B- and ZG-blastoid cells aligned well with embryo cells,
indicating that the gene regulatory programs of natural embryos are recapitulated to a large extent
in blastoids derived from D-EPSCs (Figure S4A). For example, the activity of selected regulons
for lineage-specific TFs showed that blastoid-generated PE and EPI cells shared regulatory
activity with their respective cell types in natural embryos (Figure S4B). Furthermore, in-depth
analysis of target genes of NANOG and GATA4, EPI and PE TFs, respectively, showed similar
target gene expression patterns between blastoids and natural embryos (Figure S4C). However,
the TE regulatory state did not seem to be well recapitulated in D-EPSC-derived blastoids.
Regulons associated with TE such as GATA3, CDX2, PITX1 and SOX6 are downregulated in
blastoid TE compared to embryo TE (Figure S4B). Indeed, GATA3 target genes are
downregulated in blastoid TE cells compared with natural embryos (Figure S4C), indicating that
the misregulation of specific parts of the regulatory program underlying embryogenesis may limit
blastoid development. We also investigated the regulatory activity of intermediate blastoid
subpopulations to determine what may prevent these cells from becoming appropriate lineages
.CC-BY 4.0 International license(which was not certified by peer review) is the author/funder. It is made available under aThe copyright holder for this preprintthis version posted March 3, 2020. . https://doi.org/10.1101/2020.03.02.972893doi: bioRxiv preprint

9
present in the blastocyst. In line with gene expression analysis, we found that the intermediate
blastoid populations (B-blastoid-intermediate-1 and 2) activated regulons of postimplantation EPI
and mesodermal lineages (Figure S4A, S4B) such as T and MIXL1. We therefore analyzed gene
expression of T target genes and found that B-blastoid-Intermediate-2 cells activate most, but not
all, T targets (Figure S4C). At the same time, however, these cells, as well as mesodermal cells,
also activate many targets of CDX2 (Figure S4C). This suggests that B-blastoid-intermediate-2
cells may have failed to activate the TE regulatory program and instead arrested between
overlapping mesodermal and TE states. Altogether, these results demonstrate that the gene
regulatory programs used in natural embryos are engaged to a large extent in EPSC-derived
blastoids, but not fully, which might contribute to the developmental arrest of these structures.
In vivo lineage contributions of totipotent blastomeres, L-EPSCs and D-EPSCs at
embryonic day 4.5
The capacity to enter the trophoblast lineage can also be assessed in vivo by creating chimeras
with a host embryo and analyzing lineage contributions at later developmental time points. To test
lineage contributions of truly totipotent cells, we aggregated a morula-stage (E2.5) embryo (host)
with a single blastomere from an 8-cell stage embryo (donor), as most, if not all blastomeres at
the 8-cell stage are considered totipotent46,47. We allowed chimeras to develop for 48 hours before
analyzing lineage contributions at the late blastocyst stage (E4.5). At E4.5 the three blastocyst
lineages are clearly segregated (Figure 4A) and express well-characterized lineage specific
markers, such as Sox2 (EPI), Sox17 (PE) and Cdx2, Gata3, Krt8, and Krt18 (TE)48,49,50,51,16,52. To
visualize progeny of the donor cell, we isolated single blastomeres from embryos expressing
either H2B-Gfp (nuclear-localized marker) or DsRed (no nuclear localization, marker appears in
both cytoplasm and nucleus) and used wild-type embryos as hosts. We found that in 60-70% of
chimeras the donor blastomere contributed to both the inner cell mass (EPI + PE) and the TE
(Figure 4B) which was verified by co-immunostaining with the panel of lineage-specific markers
(Figure 4C). These data serve as a benchmark for lineage contributions of truly totipotent cells in
a chimera.
We then aggregated L-EPSCs, D-EPSCs or control parental ESCs to wild-type host embryos and
analyzed chimeras at E4.5. Interestingly, we observed that progeny of both L-EPSCs and D-
EPSCs localized to trophectodermal positions in ~20% of chimeras, while progeny of the parental
ESC line cultured in 2iLif conditions localized only to the epiblast, corroborating previous
.CC-BY 4.0 International license(which was not certified by peer review) is the author/funder. It is made available under aThe copyright holder for this preprintthis version posted March 3, 2020. . https://doi.org/10.1101/2020.03.02.972893doi: bioRxiv preprint

10
studies33,32 (Figure 4D). However, when we immuno-stained chimeras for epiblast (Sox2) and
trophectoderm markers (Cdx2), none of the L-EPSC or D-EPSC derived cells in the TE position
showed expression of either marker (Figure 4E and S5). Therefore, we conclude that EPSCs can
contribute cells that localize to the TE but do not express a key TE marker.
In vivo lineage contributions of totipotent blastomeres, L-EPSCs and D-EPSCs at
embryonic day 6.25
To confirm that the observed lineage contributions at E4.5 persist later in development, we
examined chimeras post implantation. Shortly after implantation the EPI forms a cup-shaped
epithelium, the PE forms the two layers of the visceral and parietal endoderm and the TE cells
overlying the EPI proliferate to form the extraembryonic ectoderm (ExE) and the ectoplacental
cone (Figure 5A). Before gastrulation is initiated at ~E6.5, the boundaries of the different
compartments are easily discernable, prompting us to analyze lineage contributions at E6.25.
First, we generated chimeras with H2B-Gfp expressing blastomeres and showed that progeny of
the blastomeres can contribute to both the Oct4-positive EPI, the Tfap2c and Elf5-positive ExE
and the Tfap2c-positive ectoplacental cone (Figure 5B). Next, we generated chimeras with H2B-
Gfp expressing L-EPSCs, D-EPSCs or ESCs and performed similar lineage analysis at E6.25.
We found that all cell types readily contributed to the EPI lineage of the host embryo (Figure 5C).
Interestingly, while ESC and D-EPSC chimeras occasionally contained donor cells in the
trophoblast compartment (~5% of chimeras), we also found that around 25% of L-EPSC chimeras
contained a few cells in the ExE. However, when we performed immuno-staining for lineage-
specific markers, cells localized to trophoblast regions did not express trophoblast markers such
as Elf5 and Tfap2c (Figure 5D and S5F). Instead, most of these mis-localized cells expressed the
EPI marker Oct4. These data emphasize that donor cell localization alone does not necessarily
indicate appropriate lineage-specific marker allocation and therefore questions functional
integration into the tissue. We also show an increased frequency of mis-localized L-EPSCs in
chimeras, which may potentially explain the previously reported behavior of these cells.
In vivo lineage contributions of totipotent blastomeres, L-EPSCs and ESCs in embryonic
day 12.5 placentas
To test whether ExE-localized donor cells in chimeras give rise to differentiated trophoblast cell
types, we analyzed chimeric placentas at E12.5. The placenta has a complex structure and
.CC-BY 4.0 International license(which was not certified by peer review) is the author/funder. It is made available under aThe copyright holder for this preprintthis version posted March 3, 2020. . https://doi.org/10.1101/2020.03.02.972893doi: bioRxiv preprint

11
contains both trophoblast as well as embryo-derived cell types53 (Figure 6A). Additionally, due to
its high metabolite content, the placenta exhibits elevated levels of autofluorescence. These
properties make immuno-fluorescent lineage analysis in the placenta a tricky task, requiring
thorough evaluation aided by appropriate positive and negative controls. First, we identified
antibodies and immuno-fluorescent staining conditions to label the different cell types of the
placenta. We used Mct1 and Mct4 to label syncytiotrophoblast I and II, respectively, Tpbpa to
label spongiotrophoblast, and Krt8, Cdh3 and Tfap2c to label all trophoblast cell types in both the
spongio and the labyrinth zones. Tfap2c is a nuclear-localized TF, making it an ideal marker to
detect co-localization with nuclear-localized lineage tracers (e.g. H2B-Gfp). Finally, we used
CD31 to label embryo-derived endothelial cells in the placenta. We then used this marker panel
to show that in chimeric placentas generated with a single H2B-Gfp or DsRed expressing
totipotent blastomere and a wild-type host embryo, blastomere progeny contribute to all analyzed
lineages (Figure S6). To unambiguously distinguish between trophoblast and embryo-derived
cells in the placenta we took advantage of a technique termed tetraploid complementation, which
involves generating a chimera using a tetraploid host embryo and diploid ESCs54,55 (Figure 6B).
Tetraploid cells are not tolerated in the embryonic compartment and ESCs do not contribute to
the trophoblast compartment. Therefore, any surviving conceptus at E12.5 consists of trophoblast
originating from tetraploid cells and embryonic tissues originating from ESCs. We generated
chimeras in which either the tetraploid cells or ESCs (Figure 6C) carried H2B-eGfp and immuno-
stained placental sections at E12.5 for the markers described above (Figure S7). As expected,
we saw that in chimeras with H2B-eGfp-posititve tetraploid cells trophoblast markers (Tfap2c,
Cdh3, Tpbpa, and Mct4) always overlapped with the Gfp signal, while the embryonic marker CD31
did not. In contrast, in chimeras with H2B-eGfp-posititve ESCs only CD31 overlapped with the
Gfp signal, and trophoblast markers were excluded from Gfp-positive cells. This panel highlights
the difficulty in distinguishing different cell types in the placenta, especially in the labyrinth zone,
without detailed analysis of markers and also emphasizes the challenge of matching a nuclear
label with a membrane-localized signal in individual cells. Co-localization can be interpreted more
clearly when the fluorescent lineage tracer and the cell-type specific marker are in the same sub-
cellular compartment, as exemplified in our staining panel by the co-localization of H2B-eGfp and
Tfap2c. Next we generated chimeric placentas using diploid host embryos and L-EPSCs and
analyzed them using the same marker panel (Figure 6D). We could only detect Gfp-positive cells
in the embryonic, but not in the trophoblast compartment, suggesting that L-EPSCs do not readily
give rise to differentiated trophoblast cell types.
.CC-BY 4.0 International license(which was not certified by peer review) is the author/funder. It is made available under aThe copyright holder for this preprintthis version posted March 3, 2020. . https://doi.org/10.1101/2020.03.02.972893doi: bioRxiv preprint

12
Discussion
Here we present different criteria to evaluate the differentiation potential of early embryonic stem
cells. We provide a large compiled dataset of single cell transcriptomes covering different in vivo
cell types from fertilization to gastrulation, as well as several early stem cell types, which can be
used to map a novel cell type based on transcriptional similarities. As a resource for the
community, the data presented here is made available through a user-friendly file format that can
be explored using the single-cell analysis tool SCope56. Users can upload the .loom files provided
here (https://github.com/pasquelab/totipotency) enabling to browse the data sets at will.
We demonstrate assays to directly test the differentiation potential of cells by converting or
reprogramming cells in vitro to TSCs or by analyzing lineage contributions to the trophoblast
compartment in vivo in the context of a chimera. Of note, in the later experiments we only focused
on extraembryonic contributions to the trophoblast lineage and therefore cannot draw conclusions
about potential contributions to the extraembryonic endoderm lineage. By using totipotent
blastomeres as examples of a truly totipotent state, we highlight the importance of evaluating
chimeric contributions not only based on the localization of donor cells, but also on the expression
on lineage-specific marker analysis.
Using these criteria, we examine the potential of two novel stem cell states (L-EPSCs and D-
EPSCs) that have been reported to have expanded/extended potential beyond pluripotency.
Surprisingly, we fail to find convincing evidence that these cell types harbor extensive expanded
or extended potential. Instead, based on our transcriptomic comparison L-EPSCs most closely
resemble E4.5 EPI cells or the parental ESCs cultured in 2iLif and D-EPSCs the E5.5 EPI or
EpiSCs. In TSC conversion or reprogramming settings neither L-EPSCs or D-EPSCs show
enhanced potential compared to parental ESCs. Finally, in chimeric experiments L-EPSCs and
D-EPSCs only show convincing contribution to the EPI lineage. Interestingly, we found that in
chimeras analyzed at the late blastocyst stage generated with both L-EPSCs or D-EPSCs, but
not ESCs, cells occasionally localized to TE positions but did not express either EPI nor TE
markers. We hypothesize that these mis-localized, marker-negative cells are not maintained long
term and are likely in the process of getting eliminated from the compartment where they do not
belong. We also detected mis-localized cells in chimeras made with L-EPSCs just prior to the
onset of gastrulation. Majority of these cells however continued to express Oct4 and lacked
trophoblast marker expression. Therefore, it is likely that these cells are not the progeny of the
TE-localized, marker-negative cells observed in blastocyst-stage chimeras. Instead, mis-
.CC-BY 4.0 International license(which was not certified by peer review) is the author/funder. It is made available under aThe copyright holder for this preprintthis version posted March 3, 2020. . https://doi.org/10.1101/2020.03.02.972893doi: bioRxiv preprint

13
localization of L-EPSCs may occur during postimplantation development and coud potentially be
due to weak anchorage or un-synced developmental timing, allowing spurious integration.
Our results which suggest that L- and D-EPSCs are unable to enter the trophectoderm lineage
are seemingly in contrast with the recent study reporting the formation of blastocyst-like
structures, termed blastoids, using only D-EPSCs35 or L-EPSCs. We therefore carefully re-
examined the cell types generated in blastoids. Our results corroborate the idea that EPSCs are
able engage the gene regulatory programs utilized in distinct cellular lineages in natural embryos.
However, we also found differences between the gene regulatory programs of natural embryos
and EPSC-derived blastoids, which were most apparent in the TE lineage. Our re-analysis of the
scRNA-seq data of B-blastoids made form D-EPSCs indicated that only 6.7 % of cells sequenced
were categorized as TE and even these showed an ExE-like profile. These TE-like cells also failed
to show robust expression of classical TE markers such as Cdx2, Gata3 or Elf5. Problematically,
the most abundant cell types in B-blastoids (B-blastoid intermediate 1 and 2) seem to most closely
resemble mesoderm, expressing markers such as T, yet also share a number of common markers
with the trophoblast lineage, such as Cdx2, Krt8, Krt18, Tfap2c. With such cell composition it is
not surprising that B-blastoids are not able to generate a live conceptus. Although not abundant,
the presence of TE or ExE-like cells in B-blastoids is intriguing and leaves the door open for the
possibility that some EPSCs may indeed harbor potential to differentiate into trophoblast. Of note,
ESCs are also able, in some cases, to form blastoids44,36 but whether they also recapitulate the
gene regulatory programs of natural embryos like EPSC-derived blastoids do remains to be
determined.
Why is this potential only revealed in the blastoid-forming assays and not in the context of
chimeras? Forcing cells to the surface of a forming sphere in the blastoid method may mimic TE-
inducing cues better than aggregation assays, which allow positional freedom of aggregated cells
within the host embryo3. Positional freedom permits cells to group with TE or ICM compartments
in the forming blastocyst based on their identity, therefore if only the potential exists for TE fate,
this may not be realized in an aggregation setting. Additionally, B-blastoids are formed under
specific culture conditions which may direct differentiation more robustly than the environment of
the embryo. Supporting this notion, D-EPSCs were not able to give rise to a TE-like layer under
a different blastoid forming protocol (ZG-blastoid). Instead, TSCs had to be used36. It should
however still be considered that the TE or ExE-like blastoid cells fail to express Cdx2, Gata3 and
Elf5 transcripts in similar levels to endogenous TE or ExE of the embryo suggesting that their
transcriptional profile still is distinct from in vivo cells.
.CC-BY 4.0 International license(which was not certified by peer review) is the author/funder. It is made available under aThe copyright holder for this preprintthis version posted March 3, 2020. . https://doi.org/10.1101/2020.03.02.972893doi: bioRxiv preprint

14
Notably, the B-blastoid method employs Bmp4 and inhibits Activin/Nodal signaling35, conditions
which were also used in another blastoid protocol by the Tomoda lab44. The Tomoda group used
EpiSCs as starting cells and were also able to produce blastoids with certain TE-like marker
expression in the surface layer. Additionally, high Bmp4 and low Activin/Nodal was previously
computationally predicted and shown in vitro to activate TE-marker gene expression in ESCs in
which Jak/Stat signaling was inhibited57. These data suggest that high Bmp4 and low
Activin/Nodal signaling may be key to TE-like cell induction.
Importantly, these signaling conditions are also involved in inducing proximal mesoderm fates
during gastrulation and Bmp induces mixed mesoderm and trophoblast differentiation in EpiSCs
and hESCs58, consistent with the appearance of abundant mesoderm-like cells in B-blastoids.
Could the starting stem cell state be crucial for facilitating mesoderm versus trophoblast
differentiation? Indeed, it was shown that Cdx2 overexpression in ESCs induces reprogramming
into TSCs, while Cdx2 overexpression in EpiSCs results in mesodermal gene expression19,59,
highlighting the importance of the starting state for different differentiation outcomes. Notably, as
our analysis placed D-EPSCs closest to primed EpiSCs, the widespread induction of mesodermal
profiles is not surprising. We propose that to truly unlock a cell’s differentiation potential into any
extraembryonic or embryonic lineage, a starting state more resembling earlier embryonic, such
as morula stages is needed. Our study highlights this challenge and sets gold standards for
evaluating the differentiation potential of cells using various methods.
Methods
ESC and EPSC culture
Naïve mouse ESCs and D-EPSCs were cultured in a base medium of N2B27 prepared as follows:
1:1 ratio of DMEM/F12 (ThermoFisher Scientific 21331020) and Neurobasal (ThermoFisher
Scientific 21103049); 1 mL N2 supplement (ThermoFisher Scientific 17502001) or 1x NDiff
Neuro2 supplement (Gibco, 17502048); 2 mL B27 supplement minus vitamin A (ThermoFisher
Scientific 12587-010 or 17504044); 1x Glutamax (ThermoFisher Scientific 35050061); 0.1mM β-
mercaptoethanol (ThermoFisher Scientific 21985023). For best results, this base media was
further supplemented with 1-5% knockout serum replacement (KSR; ThermoFisher Scientific
10828028) as described60,33. Both naïve ESCs and D-EPSCs were cultured at 20% O2 and 5%
CO2 at 37°C on mitomycin C (MMC; Sigma-Aldrich M0503) inactivated mouse embryonic
fibroblast (MEF) feeder cells (approx 30,000 cells/cm2). E12.5 DR4 MEFs were routinely plated
on 0.2% gelatin-coated plates in ESC base media prepared as follows: DMEM (ThermoFisher
.CC-BY 4.0 International license(which was not certified by peer review) is the author/funder. It is made available under aThe copyright holder for this preprintthis version posted March 3, 2020. . https://doi.org/10.1101/2020.03.02.972893doi: bioRxiv preprint
15
Scientific 11960069); 15% foetal bovine serum (FBS; Wiscent); 1x Glutamax (ThermoFisher
Scientific 35050061); 1x non-essential amino acids (NEAA; ThermoFisher Scientific 11140-050);
1 mM sodium pyruvate (ThermoFisher Scientific 11360070); 0.1 mM β-mercaptoethanol
(ThermoFisher Scientific 21985023 or Merck, M3148 SIGMA). MEF plates were used within 1
week and washed with DPBS (ThermoFisher Scientific 14190250) prior to plating of ESC/D-
EPSCs in appropriate media.
For naïve ESC culture, N2B27 (1-5% KSR) base media was supplemented with 1 µM PD0325901
(Tocris 4192); 3 µM CHIR99021 (Tocris 4423); and 1000 U/mL mouse LIF (generated in-house).
For D-EPSC culture, N2B27 1-5% KSR base media was supplemented with 1x NEAA
(ThermoFisher Scientific 11140-050); 10 ng/mL recombinant human LIF (hLIF; Peprotech 300-
05); 3 µM CHIR99021 (Tocris 4423); 2 µM Dimethindene maleate (Tocris #1425); and 2 µM
Minocycline Hydrochloride (Santa Cruz #sc-203339). Media was changed daily for both ESCs
and D-EPSCs, with single-cell passaging every 2-3 days using accutase (ThermoFisher Scientific
A1110501) at split ratios between 1:5 and 1:12.
L-EPSCs were cultured in a base media prepared as follows: DMEM/F12 (ThermoFisher
Scientific 21331020); 20% KSR (ThermoFisher Scientific 10828028); 1x Glutamax (ThermoFisher
Scientific 35050061) (or DMEM/F12 (Gibco, 13320074), 20% KnockOut Serum Replacement
(KSR, Gibco, 10828028 ), 2.25 mM L-glutamine); 1x NEAA (ThermoFisher Scientific 11140-050);
0.1 mM β-mercaptoethanol (ThermoFisher Scientific 21985023 or Merck, M3148 SIGMA). This
base media was supplemented with 10 ng/mL hLIF (Peprotech 300-05) or 1000 U/ml homemade
mouse Lif; 1 µM PD0325901 (Tocris 4192 or Axon 1408); 3 µM CHIR99021 (Tocris 4423, or Axon
1386); 4 µM TCS JNK 60 (Tocris 3222); 5 µM XAV939 (Sigma-Aldrich X3004); 10 µM SB203580
(Tocris 1402); and 0.3 µM A-419259 (Santa Cruz sc-36109; or Tocris 39142). L-EPSCs were
cultured at 20% O2 and 5% CO2 at 37°C on MMC-inactivated SNL76/7 feeder cells or MMC-
inactivated MEF feeders (~50-80,000 cells/cm2). SNL feeders were plated on 0.2% gelatin-coated
plates in ES base media (described above). SNL plates were used within 3-4 days and washed
with DPBS prior to plating L-EPSCs. Media was changed daily, with single-cell passaging every
3 days using accutase at split ratios between 1:3 and 1:12.
Conversion to EPSC conditions
To convert naïve ESCs into either D-EPSC or L-EPSC conditions, cells were passaged and plated
at range of low cell densities (1-3,000 cells/cm2) on either MMC-inactivated E12.5 WT or DR4
MEFs or SNL feeders in their original media. The following day the media was changed to D-
EPSC or L-EPSC conditions, respectively. The cells were passaged when approaching
.CC-BY 4.0 International license(which was not certified by peer review) is the author/funder. It is made available under aThe copyright holder for this preprintthis version posted March 3, 2020. . https://doi.org/10.1101/2020.03.02.972893doi: bioRxiv preprint

16
confluence (4-5 days) at a range of split ratios (e.g. 1:3, 1:5, 1:8). D-EPSCs and L-EPSCs were
cultured for at least 5 passages (~2 weeks) prior to use in chimaera or in vitro potency
experiments.
TSC culture
TSCs were cultured in standard conditions: RPMI-1640 (Sigma-Aldrich R0883); 20% FBS
(Wiscent); 1x Glutamax (ThermoFisher Scientific 35050061); 1 mM sodium pyruvate
(ThermoFisher Scientific 11360070); 0.1 mM β-mercaptoethanol (ThermoFisher Scientific
21985023). This TS base media was supplemented with 25 ng/mL FGF4 (R&D Systems 235-F4)
and 1 µg/ml heparin (Sigma-Aldrich H3149). TSCs were routinely cultured on MEFs plated on
0.2% gelatin-coated plates (approx 30,000 cells/cm2). Medium was changed every 1-2 days and
cells passaged before reaching confluency (every 3-4 days) at split ratios between 1:5 and 1:12.
Cell line generation
H2B-eGfp ESCs (ICR) were derived directly from E3.5 blastocysts (JAX 006069 backcrossed to
ICR in-house61). Briefly, single E3.5 blastocysts were transferred into a well containing 100 µL
2iLif media (96-well plate pre-coated with E12.5 DR4 MEFs). Embryos were left undisturbed for
approx 48 hours at which point additional 100 µL 2iLif media was added per well. The top 100 µL
of media was then changed every two days until the outgrowth reached passaging size (~5-7
days). Outgrowths were passaged using 50 µL accutase per well and plated into a new 96-well
MEF plate. Cells were then passaged as described above until expanded for morphological
assessment and cryopreservation of selected clones.
R1-mScarlet-NLS ESCs were generated from R1-ESCs (129X1 x 129S1;62) by transfection
(Lipofectamine 2000; ThermoFisher Scientific 11668027) with PiggyBac CAG-mScarlet-NLS
construct and isolation of single clones.
Wild-type TSCs were TS-F4 (ICR) described previously63. Elf5-2A-mCherry TSCs were generated
by transfection (JetPRIME; Polyplus 114-07) of TS-F4 cells with vector expressing Cas9 and
gRNA targeting proximal to Elf5 stop codon. Donor construct containing desired insert (GSG-
P2A-SV40-NLS) and selection cassette (SV40::NeoR) flanked by homology arms was co-
transfected. Cells were selected with 100-200 µg/mL G418 (ThermoFisher Scientific 10131027)
and correctly targeted clones identified by PCR genotyping and Sanger sequencing. Floxed
selection cassette was subsequently removed by transfection with Cre and desired clones
identified by PCR genotyping and Sanger sequencing. Heterozygous Elf5-2A-mCherry TSC
.CC-BY 4.0 International license(which was not certified by peer review) is the author/funder. It is made available under aThe copyright holder for this preprintthis version posted March 3, 2020. . https://doi.org/10.1101/2020.03.02.972893doi: bioRxiv preprint

17
clones were used in this study and faithful overlap between Elf5 and mCherry protein validated
by immunostaining.
5ECER4G20 eGfp-Cdx2-ER (iCdx2) ESCs were a kind gift from H. Niwa19. These cells
constitutively express eGfp and are heterozygous for Oct4 (Pou5F1). Heterozygous Elf5-2A-
mCherry iCdx2 ESCs were generated as above, except for use of SV40::HygroR selection
cassette and Lipofectamine based transfection.
ESC-to-TSC reprogramming
For in vitro testing of EPSC potency, iCdx2 Elf5-2A-mCherry ESCs were converted to either D-
EPSC or L-EPSC conditions as described above. To initiate ESC-to-TSC reprogramming, 50-200
cells/cm2 were plated onto low density E12.5 DR4 MEFs (~10,000 cells/cm2 on gelatin-coated
plate) in their original media. The following day the media was changed to TSC media
(+Fgf4/Heparin) with or without 1 µg/mL 4-hydroxytamoxifen (Sigma-Aldrich H7904) to induce
Cdx2. Media was changed daily and the degree of TSC reprogramming assessed by flow
cytometry on day 6.
For ESC-to-TSCs differentiation followed by RT-qPCR, L-EPSCs and ESCs were gradually
feeder-depleted by passaging every two days with 0.1% gelatin (porcine skin, 0.1% g/v final,
Sigma, G2500) and a feeder percentage of 100%, 75%, 50% to 0% at every passage in L-EPSCM
and 2iLif, respectively. After complete feeder removal, the cells were cultured at a density of
1x10⁵ cells on gelatin-coated culture 6 well plates in TSC medium (as above). The cell culture
medium was refreshed every two days and cells were collected every three days from D0 to D12
for RT-qPCR analysis of TSC marker genes expression using the following primers:
Nanog TCTCTCAGGCCCAGCTGTGT
GCTGGAGGCTGAGGTACTTCTG
Elf5 TGAAAACAAGTGGCATCAAGAG
TCAGGGGACAGCAGCAAG
Tfap2c CGCGGAAGAGTATGTTGTTG
TATGTTCGGCTCCAAGACCT
Cdx2 GAAACCTGTGCGAGTGGATG
ACACCACCCGGTATTTGTCTT
Ascl2 AAGCACACCTTGACTGGTAC
AAGTGGACGTTTGCACCTTC
Esx1 AGGAGCTGGAGGCCTTTTT
CTAGGTTCAGGTAAGCCCAGG
Eomes AAAGGCTTCCGGGACAACTA
TAATATCGGGCTTGAGGCAA
.CC-BY 4.0 International license(which was not certified by peer review) is the author/funder. It is made available under aThe copyright holder for this preprintthis version posted March 3, 2020. . https://doi.org/10.1101/2020.03.02.972893doi: bioRxiv preprint

18
Flow cytometry
Flow cytometry assay was designed to assess differential protein levels of TSC surface markers
CD4063 and Plet142, as well as TSC transcription factor Elf520 using a reporter cell line. Titration
experiments were carried out to optimize staining against CD40 (1:20; BD Biosciences 740700)
as well as Plet1 (1:200; Nordic MUbio MUB1512P conjugated to Bio-Rad ReadiLink 633/655
1351005). Single-cell suspensions for ESCs and EPSCs undergoing ES-to-TSC reprogramming
as well as control cell lines (ESC/EPSC day 0 samples; wild-type TSCs and Elf5-2A-mCherry
TSCs) were generated using 0.25% trypsin (ThermoFisher Scientific 25200072). Cells were
incubated with conjugated antibody mix in PBS/2% FBS for 60 min on ice. Post-staining, cells
were washed twice with PBS/2% FBS prior to resuspension in PBS/2% FBS supplemented with
0.5 µm Sytox blue (ThermoFisher Scientific S11348) to assess cell viability. Cells were transferred
to flow tubes with 40 µm cell strainer lid and analyzed using BD LSR II at the SickKids Flow
Cytometry facility. For ES-to-TSC reprogramming samples, at least 100,000 events were
recorded and analyzed using FlowJo software. Gates were drawn based on fluorescence minus
one (FMO) controls.
Bulk RNA sequencing library preparation
Total RNA was isolated from 2iLif ESCs and L-EPSCs reprogramming intermediates at indicated
days using TRIzol reagent according to the manufacturer’s protocol. 4 µg of total RNA was used
to generate libraries using of stranded poly(A) mRNA-Seq library with the KAPA stranded mRNA
Library prep kit (KAPA Biosystems, KK8421). Libraries concentration was quantified with Qubit
dsDNA HS (High Sensitivity) Assay Kit (Invitrogen, Q32854), and the final pool was generated by
combining individual libraries in equimolar ratio. Libraries were sequenced on an Illumina HiSeq
4000 instrument (Illumina) with 51 bp reads and read depth ranging ~33 mln reads. Sequencing
reads were mapped to mm10 reference genome using STAR 2.5.3a64. On average, 77,16% of
reads were uniquely mapped and only those were kept for further analyses. Subsequently, the
featureCounts function from the R Bioconductor package “Rsubread” (version 1.5.2)65 was used
to assign mapped reads to genomic features.
Bulk RNA sequencing analysis
Processing raw read counts was performed as described in66. Briefly, the DESeq2 package and
the associated protocol67 was used. Only genes that express at least 10 reads in total across all
libraries were retained. PCA was performed using plotPCA function from the DESeq2 package
.CC-BY 4.0 International license(which was not certified by peer review) is the author/funder. It is made available under aThe copyright holder for this preprintthis version posted March 3, 2020. . https://doi.org/10.1101/2020.03.02.972893doi: bioRxiv preprint

19
with input of top 500 most variable genes after rlog transformation. Unless mentioned otherwise,
gene expression was presented as log2 values after size-factor normalization for the differences
in library size (DESeq2).
Integration of bulk RNA-seq data with published single-cell RNA-seq data
Principal component analysis of top 500 most variable genes. Single-cell data from published
datasets (Deng et al. 201437; Posfai et al. 20173; Yang et al. 201733) were processed together
with samples from this study. The reads from single-cell samples were averaged within the same
embryonic timepoint. Subsequently, all samples were normalized together for the library size
using size-factor normalization in the DESeq2 package.
Comparison of gene expression of different L-EPSC conversion timepoints to 4, 8 and 16 cell
stage preimplantation embryos was done in two-steps. First, stage-specific markers were defined
using k-means clustering (SC3) of single-cell data, followed by differential expression analysis
between the clusters. Second, these markers were used for the comparison between L-EPSC
timepoints and the corresponding embryo stages in the averaged single-cell data.
Library preparation for single-cell RNA sequencing
Single-cells from stem cells were sorted by FACS into 384 well plates containing lysis and RT,
whereas embryo cells were manually picked and directly dispensed into lysis buffer containing
RT. The current study generated cDNA libraries using the Smart-seq2 protocol, as previously
described68,69.
Single-cell RNA sequencing data pre-processing and quality control
Smart-Seq2 read files (E2.5 and E4.5 embryos, and three pluripotent stem cell conditions: ESCs
cultured in 2iLif, L-EPSCs, and D-EPSCs) were mapped to the mouse reference genome (mm10)
using STAR aligner64 and only uniquely mapped reads were used for expression level estimation
as reads per kilobase of gene model and million mappable reads (RPKMs) using RefSeq
annotation and previously established pipeline70. Cells were quality-filtered with minimum cut-off
of 500 expressed genes per cell and Spearman’s correlation greater than 60% between cells.
Pre-processed gene expression matrices were downloaded as provided by Deng et al., 201437
(GSE45719), Posfai et al., 20173 (GSE84892), Mohammed et al., 201738 (GSE100597), Chen et
al., 201639 (GSE74155), Li et al., 201935 (GSE135289, GSE135701), Yang et al., 201732
(ERP005641), Pijuan-Sala et al., 201945
(https://github.com/MarioniLab/EmbryoTimecourse2018), Sozen et al., 201936 (GSE134240).
.CC-BY 4.0 International license(which was not certified by peer review) is the author/funder. It is made available under aThe copyright holder for this preprintthis version posted March 3, 2020. . https://doi.org/10.1101/2020.03.02.972893doi: bioRxiv preprint

20
Single-cell gene expression analysis of merged datasets
Analysis of the filtered data was conducted in R version 3.6.1 using Seurat suite version 3.1.0.71.
Integration of single-cell data was performed using Seurat’s canonical correlation analysis (CCA)
integration tool; datasets were scaled and log-transformed before selection of 2000 most variable
genes which were used to compute principal component analysis (PCA). Manifold approximation
and projection (UMAP) coordinates were calculated using the top 14 PCs. Seurat’s FeaturePlot
function was used to demonstrate individual gene expression on UMAP embedding. Merged
datasets were clustered, annotated, then downsampled prior to CCA integration. Correlation
matrixes were constructed using corrplot v0.84. Clustering of preimplantation lineages was
performed using Seurat’s shared nearest neighbor (SNN) algorithm implemented in FindClusters
function. Differential expression analysis was performed using Wilcoxon’s rank sum test using a
minimum cutoff of 0.45 average log fold change.
Gene Regulatory Network inference
Gene regulatory networks were inferred using pySCENIC (0.9.15; python implementation of
SCENIC)40 in Python version 3.6.9. First, raw expression data was normalized by dividing feature
counts of each cell by the total counts for that cell and multiplying by factor of 10000 followed by
log1p transformation. Subsequently, normalized counts were used to generate co-expression
modules using GRBboost2 algorithm72 implemented in arboreto package (v0.1.3)73. Next, gene
regulatory networks were inferred using pySCENIC (with default parameters and mm10__refseq-
r80__10kb_up_and_down_tss.mc9nr and mm10__refseq-
r80__500bp_up_and_100bp_down_tss.mc9nr motif collections) resulting in the matrix of AUCell
values that represent the activity of each regulon in each cell. The resulting gene regulatory
networks contained 451 regulons for merged datasets in Figure 1, S2 and S3 and 333 regulons
for datasets in Figure 3, S3 and S4 and have been added to the .loom files which can be
downloaded from: https://github.com/pasquelab/totipotency and browsed interactively by
uploading the loom file on the SCope platform, www.scope.aertslab.org. The loom files contain
non-integrated gene expression and regulon data.
For generating UMAP plots based on gene regulatory information in Figures S2E and S4A, the
AUCell matrix was split by dataset of origin and integrated using Seurat’s canonical correlation
analysis (CCA) integration tool. Anchors for integration were found using FindIntegrationAnchors
function with default parameters and dims = 1:20 and data was integrated across all features.
.CC-BY 4.0 International license(which was not certified by peer review) is the author/funder. It is made available under aThe copyright holder for this preprintthis version posted March 3, 2020. . https://doi.org/10.1101/2020.03.02.972893doi: bioRxiv preprint

21
SCENIC-based UMAP were constructed using runUMAP function with default parameters except
for dims = 25 and min.dist = 0.35 in Figure S2E and dims = 25 and min.dist = 0.25 in Figure S4A.
The list of target genes were downloaded from the loom file through the SCope platform.
Mouse lines and embryos
ICR (breeding stock from Charles River, Montreal, Canada), DsRed74, H2B-Gfp61 mouse lines
were used in this study. Embryos were collected at appropriate time points from 5-8 week old
hormone-primed (5 IU each, pregnant mare serum gonadotropin (Sigma) and human chorionic
gonadotropin (Sigma), 48 hours apart) and mated females. If not immediately used, embryos
were cultured in small drops of KSOM supplemented with amino acids (EMD Milipore) under
mineral oil (Zenith Biotech, Guilford, CT) at 37°C, with 5% CO2 for specified times. All animal
work was carried out following Canadian Council on Animal Care Guidelines for Use of Animals
in Research and Laboratory Animal Care under protocols approved by The Centre for
Phenogenomics Animal Care Committee (20-0026H).
Generation, culture and isolation of chimeras using diploid or tetraploid hosts
To isolate 8-cell stage blastomeres embryos from H2B-Gfp or DsRed mouse lines were harvested
on the morning of day E2.5 by flushing the oviduct. The zona pellucida was removed using acid
Tyrode’s solution (Sigma, Oakville, Canada) and embryos were washed in M2. Dissociation was
performed by incubating embryos in TrypLE Select (GibcoTM, Thermo Fisher Scientific,
Waltham, MA) for 3-6 minutes at 37°C followed by pipetting through fine pulled glass capillaries.
Individual cells were picked, washed in warm M2 and used as donor cells. For host embryos, E2.5
embryos were isolated and zona was removed in a similar way. To generate aggregation
chimeras a single donor cell and a single host embryo were then brought together in a micro-well
generated by pressing a blunt end needle into the bottom of a plastic tissue culture dish (FalconTM,
Thermo Fisher Scientific) in drops of KSOM under oil. Such aggregation chimeras were either
cultured for 48 hours (E4.5) or transferred into oviducts of pseudopregnant females on the
following day and isolated either on day E6.25 or E12.5.
For generating chimeras with different stem cells (ESC, L-EPSC, D-EPSC), host embryos were
generated as described above. A small clump (6-8 cells) of stem cells expressing H2B-Gfp were
aggregated to each host embryo in a micro-well. Stem cell clumps were made by briefly
trypsinizing the cells, inactivating or diluting trypsin with media and manually picking appropriate-
sized clumps using a fine glass capillary. Chimeras were cultured or transferred into
pseudopregnant females as above.
.CC-BY 4.0 International license(which was not certified by peer review) is the author/funder. It is made available under aThe copyright holder for this preprintthis version posted March 3, 2020. . https://doi.org/10.1101/2020.03.02.972893doi: bioRxiv preprint

22
For tetraploid complementation experiments embryos from either wild-type or H2B-Gfp mouse
lines were isolated at the 2-cell stage (E1.5). Cells were electro-fused into one tetraploid cell using
a Cell-fusion instrument, CF-150B pulse generator with 250 μm electrode chamber (BLS Ltd,
Hungary). The procedure is described in detail in75. Such tetraploid embryos were cultured for
one day before using them as host embryos. In tetraploid complementation experiments a small
clump (6-8 cells) of ESCs either from a wild-type line or an H2B-Gfp expressing cell line was used.
Aggregation, chimera culture and transfer were performed as before.
Immunofluorescent staining of E4.5 and E6.25 chimeras
Whole mount immunofluorescence staining of E4.5 embryos was performed as previously
described3. Briefly, embryos were fixed in 4% paraformaldehyde at room temperature for 15
minutes, washed once in PBS containing 0.1% Tween 20 (PBS-T) and permeabilized for 15
minutes in PBS 0.5% Triton X-100. E4.5 embryos were blocked in PBS-T with 2% BSA (Sigma)
and 5% normal donkey serum (Jackson ImmunoResearch Laboratories) at room temperature for
2 hours and E6.25 embryos were blocked in PBS-T with 10% BSA (Sigma) and 5% normal donkey
serum (Jackson ImmunoResearch Laboratories) at room temperature for 8 hours or overnight at
4°C. Primary and secondary antibodies were diluted in blocking solution. Staining was performed
at room temperature for ~2-5 hours or overnight at 4°C. Washes after primary and secondary
antibodies were done three times in PBS-T. In the last washing step (15 minutes) 1:500 Hoechst
33258 (Invitrogen) was used to stain nuclei. E4.5 embryos were mounted in PBS in wells made
with Secure Seal spacers (Molecular ProbesTM, Thermo Fisher Scientific) and placed between
two cover glasses for imaging. E6.25 embryos were mounted in agarose plugs using 1% low
melting agar (Sigma).
Immunofluorescent staining of E12.5 placentas
Placentas were dissected from pregnant females at E12.5, washed briefly in ice cold PBS and
fixed in 4% PFA overnight. Depending on the experiment, embryos and placentas were
prescreened for contribution to individual compartments using a fluorescent stereomicroscope.
The following day, placentas were embedded, frozen and sectioned (10μm) starting at the sagittal
plane. Sections were blocked with 10% horse serum in PBS for 1-hr at room temperature and
incubated overnight at 4°C with primary antibodies diluted with 5% horse serum in PBS. DsRed
chimeric placentas were stained with anti-mCherry/Rfp antibody and H2B-Gfp chimeric placentas
with anti-GFP. For detection of fetal endothelial cells, placentas were first subjected to antigen
retrieval using 10 mM citrate buffer, pH 6.0 at 100°C for 10 minutes, then cooled, blocked, and
.CC-BY 4.0 International license(which was not certified by peer review) is the author/funder. It is made available under aThe copyright holder for this preprintthis version posted March 3, 2020. . https://doi.org/10.1101/2020.03.02.972893doi: bioRxiv preprint

23
co-stained with anti-CD34. The following day, sections were stained with the appropriate
secondary antibodies for 1-hr at room temperature, washed in PBS, and eventually
counterstained with DAPI (Sigma). Sections exposed to secondary antibody alone were used as
negative controls. Antibody specificity for mCherry/Rfp and Gfp were confirmed on non-chimeric
placentas.
Antibodies for immunofluorescence stainings
Primary antibodies: rabbit anti-mCherry 1:500 (Ab167453, Abcam) *detects DsRed; mouse anti-
mCherry 1:500 (632543, Clontech); chicken anti-Gfp 1:500 (ab13970, Abcam); rabbit anti-Cdx2
1:600 (ab76541, Abcam); rabbit anti-Nanog 1:100 (09-0020, ReproCell); goat anti-Gata3 1:100
(AF2605, RandD Systems), goat anti-Sox2 1:100 (AF2018, RandD Systems); goat anti-Oct4
1:100 (sc-8629, Santa Cruz Biotechnologies); goat anti-Sox17 1:100 (AF1924, RandD Systems);
goat anti-Elf5 1:100 (sc9645, SantaCruz); rabbit anti-Tfap2c (sc8977 SantaCruz); rat anti-Krt8
1:10 (TROMA-I antibody, Developmental Studies Hybridoma Bank, Iowa City, IA, USA); and
mouse anti Krt18 1:100 (ab668, Abcam). To visualize trophoblast cells in placentas, co-
immunostaining was performed with the following antibodies: anti Kr8 (1:10, TROMA-1), anti
Tfap2c (1:80, Santa Cruz, sc-8977), anti Cdh3 (1:100, RD, AF761), anti Tpbpa (1:150, Abcam,
ab104401), anti Mct1 (1:400, Millipore, AB1286I) and anti Mct4 (1:400, Millipore, AB3314P).
Endothelial cells were identified by immunoreactivity to CD34 antibody (1:100, Abcam, ab8158)
Secondary antibodies: (diluted 1:500) 448, 549, 594 or 633 conjugated donkey anti-mouse,
donkey anti-rabbit or donkey anti-goat DyLight (Jackson ImmunoResearch) or Alexa Fluor (Life
Technologies) and donkey anti rat DyLight 488 (Bethyl).
Imaging
Images of E4.5 embryos were acquired using a Zeiss Axiovert 200 inverted microscope equipped
with a Hamamatsu C9100-13 EM-CCD camera, a Quorum spinning disk confocal scan head and
Volocity aquisition software (PerkinElmer). Z-stacks were taken at 1μm intervals with a 20x air
objective (NA = 0.75). Images of E6.25 embryos were acquired using a Ziess Ligh Sheet Z1, with
a pCO Edge 5.5 x 2 camera and Zeiss Zen Lightsheet 2014 acquisition software. Images were
acquired using a 20x water immersion detection objective (NA = 1.0). Z-stacks were taken at 1μm
intervals. Images of E12.5 placentas were acquired using a Pannoramic 250 Flash II from
3DHistech.
Data access
.CC-BY 4.0 International license(which was not certified by peer review) is the author/funder. It is made available under aThe copyright holder for this preprintthis version posted March 3, 2020. . https://doi.org/10.1101/2020.03.02.972893doi: bioRxiv preprint

24
All raw and processed sequencing data generated in this study have been submitted to the NCBI
Gene Expression Omnibus (GEO; http://www.ncbi.nlm.nih.gov/geo/) under accession number
GSE145609.
Processed data can also be visualized and downloaded using .loom files deposited under:
https://github.com/pasquelab/totipotency.
Acknowledgements
The authors wish to acknowledge the contribution of the Model Production Core staff at the Center
for Phenogenomics for technical support. Single cell sequencing was performed at National
Genomics Infrastructure in Stockholm at Science for Life Laboratory (funded by the Knut and
Alice Wallenberg Foundation and the Swedish Research Council) with assistance from
SNIC/Uppsala Multidisciplinary Center for Advanced Computational Science with massively
parallel sequencing and access to the UPPMAX computational infrastructure. Bulk RNA
sequencing was performed in KU Leuven Genomics Core. We would like to thank Stein Aerts,
Sara Aibar, Chris Davie and Christopher Flerin for discussions and support. This work was funded
by CIHR (FDN-143334), Genome Canada and Ontario Genomics (OGI-099), Programme de
bourses de chercheur-boursier FRQS Junior 1 (FRQS 268829, 280187), the Swedish Research
Council, Ragnar Söderberg Foundation, Ming Wai Lau Center for Reparative Medicine, Center
for Innovative Medicine, Wallenberg Academy Fellow, NSERC (2014-04497). Research in the
Pasque lab is supported by The Research Foundation–Flanders (FWO) (Odysseus Return Grant
G0F7716N to VP, FWO grants G0C9320N and G0B4420N to VP), the KU Leuven Research Fund
(BOFZAP starting grant StG/15/021BF to VP, C1 grant C14/16/077 to VP and project financing),
and FWO Ph.D. fellowships to A.Ja (1158318N), IT (1S72719N) and SKT (1S75720N).
Author contributions
J.P.S., A.M., A.Ja., T.P., M.E.B., N.D.G., S.K.T. performed in vitro stem cell experiments. E.P.,
I.R., B.B. performed in vivo chimera experiments. J.P.S., A.Ja., P.K., S.P., M.E.B., I.T., F.L., V.P.,
performed transcriptional analyses. E.P., V.P., F.L., J.P.S., A.Ju. and J.R., planned experiments,
analyzed data and wrote the manuscript. V.P., F.L., E.P., and J.R., conceived the study.
Competing Financial Interest
Authors declare no competing financial interests.
.CC-BY 4.0 International license(which was not certified by peer review) is the author/funder. It is made available under aThe copyright holder for this preprintthis version posted March 3, 2020. . https://doi.org/10.1101/2020.03.02.972893doi: bioRxiv preprint

25
Figures
Fig. 1: Gene expression analysis of candidate totipotent stem cells using RNA-seq
A) Experimental design of L-EPSC conversion. Mouse ESCs grown in 2iLif were switched to L-
EPSC medium and subjected to bulk RNA-seq at day (D) 0, D3, D5, D7, D9, D11, D13 and D15.
B) The L-EPSC transcriptome was rapidly induced during conversion from 2iLif ESCs. Principal
Component Analysis (PCA) analysis of bulk RNA-seq data of samples from different timepoints
of L-EPSC conversion and 2iLif ESCs.
C) PCA analysis of bulk L-EPSC transcriptomes after integrating the dataset from this study with
published scRNA-seq data (Deng et al. 201437; Posfai et al. 20173; Yang et al. 201732).
D) Silencing of most 4-cell, 8-cell and 16-cell stage marker genes is maintained in L-EPSCs.
Expression of 4-cell and 8-16 cell stage marker genes in ESCs undergoing conversion to L-
EPSCs.
E) Single-cell UMAP comparing developmental progression from zygote to E6.75 EPI, including
preimplantation extra embryonic lineages, with L-EPSCs, previously published L-EPSCs32, D-
EPSCs, 2iLif ESCs and primed EpiSCs.
F) Correlation matrix based on top 2000 expressed genes averaged tracking zygote to E6.75 EPI,
including preimplantation extraembryonic lineages, with L-EPSCs, D-EPSCs, 2iLif ESCs and
primed EpiSCs.
Fig. 2: In vitro capacity and potential of candidate totipotent stem cells to give rise to
trophoblast stem cells
A) Differentiation of L-EPSCs to TSCs. 2iLif ESCs or L-EPSCs were subjected to TSC
differentiation conditions. RNA was collected at D0, D3, D6, D9, D12 and qPCR was used to
measure the expression of TE marker genes.
B) Silencing of extra-embryonic gene expression was maintained in L-EPSCs exposed to TSC
differentiation conditions. Expression of TSC markers: Elf5, Eomes, Tfap2c, Cdx2, Ascl2, Esx1
and Nanog as control at D3, D6, D9 and D12 of differentiation by RT-qPCR.
C) Experimental design of ESC, L-EPSC or D-EPSC to TSC conversion (-4OH) or reprogramming
experiments. ESC, L-EPSC or D-EPSC lines harbored a tamoxifen(4OH)-inducible Cdx2
transgene, were heterozygous for Oct4 (Pou5f1) and contained an Elf5-2a-mCherry reporter.
Cells switched to TSC media with or without 4OH were analyzed by flow cytometry on indicated
days for TSC markers CD40, ELF5 and PLET1.
.CC-BY 4.0 International license(which was not certified by peer review) is the author/funder. It is made available under aThe copyright holder for this preprintthis version posted March 3, 2020. . https://doi.org/10.1101/2020.03.02.972893doi: bioRxiv preprint

26
D) Flow cytometry analysis of ESC, L-EPSC or D-EPSC cells switched to TSC media with or
without 4OH on indicated days. Percentages of cells positive of each TSC marker, or cells positive
for all three markers are shown. Three biological replicates were performed, error bars indicate
standard deviation of mean.
E) Flow cytometry analysis of TSCs containing an Elf5-2s-mCherry reporter. Percentages of cells
positive of each TSC marker, or cells positive for all three markers are shown. Three biological
replicates were performed, error bars indicate standard deviation of mean.
Fig. 3: Single cell transcriptional comparison of blastoid cells to in vivo and different stem
cell states
A) Single-cell UMAP tracking morula to E7.5 gastrulation in embryonic and extraembryonic
lineages, comparing all stem cells, B-blastoid cells and ZG-blastoid cells.
B) Dot plot representing frequency of expression and average expression for select lineage
marker genes.
C) Matrices showing correlation coefficients between B-blastoids (top) or ZG-blastoids (bottom)
and selected lineages.
Fig. 4: In vivo potential of candidate totipotent stem cells to give rise to the trophectoderm
lineage at E4.5
A) Cartoon showing cell types of the E4.5 blastocyst embryo.
B) Bar chart showing percent of E4.5 chimeric embryos with different lineage contributions.
Chimeras were generated by aggregating a wild-type host embryo and a single blastomere of an
8-cell stage embryo that expressed either H2B-Gfp (green) or DsRed (red). n indicates number
of chimeras generated.
C) Immunofluorescent stainigs of E4.5 chimeric embryos with lineage contributions to both ICM
and TE generated with a single blastomere of an 8-cell stage embryo that expressed either H2B-
Gfp (top panel) or DsRed (lower panel). Stained for Sox2+Sox17 (ICM), Nanog (EPI), Cdx2,
Gata3, Krt8 and Krt18 (TE) and Gfp or DsRed. Left panel shows maximum intensity projection of
whole chimera, scale bar: 40 µm. Right panels show magnified single plane images of ICM and
TE (bottom) contributions, scale bar: 10 µm.
D) Bar chart showing percent of E4.5 chimeric embryos with different lineage contributions.
Chimeras were generated by aggregating a wild-type host embryo with H2B-Gfp expressing
ESCs (black), L-EPSCs (grey) or D-EPSCs (blue). n indicates number of chimeras generated.
.CC-BY 4.0 International license(which was not certified by peer review) is the author/funder. It is made available under aThe copyright holder for this preprintthis version posted March 3, 2020. . https://doi.org/10.1101/2020.03.02.972893doi: bioRxiv preprint
27
E) Example of E4.5 chimeric embryos generated with H2B-Gfp expressing L-EPSCs stained for
Sox2 (EPI), Cdx2 (TE) and Gfp. Left panel shows maximum intensity projection of whole chimera,
scale bar: 40 µm. Right panel shows magnified single plane image of Gfp positive L-EPSC
contributions, scale bar: 10 µm.
Fig. 5: In vivo potential of candidate totipotent stem cells to give rise to the trophoblast
lineage at E6.25
A) Cartoon showing cell types of the E6.25 embryo.
B) Immunofluorescent stainigs of E6.25 chimeric embryos with lineage contributions to both EPI
and trophoblast lineages generated with a single blastomere of an 8-cell stage embryo that
expressed H2B-Gfp. Stained for Oct4 (EPI), Tfap2c and Elf5 (trophoblast compartment) and Gfp.
Left panel shows maximum intensity projection of whole chimera, and right panels show single
plane images, scale bar: 100 µm.
C) Bar chart showing percent of E6.25 chimeric embryos with different lineage contributions.
Chimeras were generated by aggregating a wild-type host embryo with H2B-Gfp expressing
ESCs (black), L-EPSCs (grey) or D-EPSCs (blue). n indicates number of chimeras generated.
D) Examples of E6.25 chimeric embryos generated with H2B-Gfp expressing L-EPSCs stained
for Oct4 (EPI), Tfap2c and Elf5 (trophoblast compartment) and Gfp. Left panel shows maximum
intensity projection of whole chimera, scale bar: 100 µm. Right panel shows magnified single
plane image of Gfp positive L-EPSC contributions, scale bar: 50 µm.
Fig. 6: In vivo potential of candidate totipotent stem cells to give rise to the trophoblast
lineage of the E12.5 placenta
A) Cartoon indicating cell types and organization of the E12.5 placenta. Markers of different cell
types used in this study are indicated.
B) Experimental design of tetraploid complementation assay. Tetraploid host embryos are
generated by electro-fusing embryos at the 2-cell stage. A small clump of ESCs are aggregated
with tetraploid host embryos to generate a chimera. Chimeric placentas are analyzed at E12.5.
C) Examples of chimeric E12.5 placentas generated with H2B-Gfp expressing tetraploid host
embryo and wild-type ESCs (left panel) and wild-type tetraploid host embryo and H2B-Gfp
expressing ESCs (right panel). Placenta sections are immuno-stained for Gfp and Tfap2c, which
labels all trophoblast cell types. Images shown at different magnifications. Scale bars: 500 µm
(4x), 200 µm (7x), 50 µm (40x).
.CC-BY 4.0 International license(which was not certified by peer review) is the author/funder. It is made available under aThe copyright holder for this preprintthis version posted March 3, 2020. . https://doi.org/10.1101/2020.03.02.972893doi: bioRxiv preprint

28
D) Example of chimeric E12.5 placentas generated with wild-type host embryo (diploid) and H2B-
Gfp expressing L-EPSCs. Placenta sections are immuno-stained for Gfp and Tfap2c. Images
shown at different magnifications. Scale bars: 500 µm (4x), 200 µm (7x), 50 µm (40x).
Supplementary Figures
Fig. S1: Culture conditions and morphologies of ESCs, L-EPSCs and D-EPSCs
Scale bar 100 µm.
Fig. S2: Transcriptional profiling of L- and D-EPSCs related to Figure 1
A) Gene expression comparison of pluripotency and somatic genes between 2iLif ESCs and L-
EPSCs and mouse embryonic fibroblasts (MEFs) as control.
B) Changes in expression levels between 2iLif ESCs and L-EPSCs for genes reported to change
in Yang et al., 201732.
C) UMAP from Figure 1E showing the resource from which each cell was merged, and lists the
number of cells used from each.
D) FeaturePlots projecting expression of representative 2-cell, EPI, PE, and TE marker genes,
overlaying Figure1E UMAP.
E) Heatmap of genes previously reported to be upregulated in D-EPSCs compared to ESCs
cultured in Lif/serum conditions, which are similarly upregulated in D-EPSCs (generated in this
study) when compared to naïve 2iLif ESCs.
F) UMAP constructed based on the activity of gene regulatory networks in 2iLif ESCs, embryonic
stages E3.5 ICM, E4.5 EPI, E5.5 EPI, L-EPSCs and D-EPSCs.
Fig. S3: Re-analysis of transcriptional profiling data of blastoid cells related to Figure 3
A) UMAP from Figure 3A identifying original datasets for each cell.
B) UMAP from Figure 3A, highlighting ZG-blastoid EPI, ZG-blastoid ZG, B-blastoid TE, and ZG-
blastoid intermediate.
C) UMAP from Figure 3A, highlighting ZG-blastoid populations produced with 2iLif vs. EPSCs
D) UMAP from Figure 3A, highlighting B-blastoid EPI, B-blastoid PE, B-blastoid TE, and B-
blastoid intermediates.
E) Pie chart showing percent of each cell type category based on our re-analysis of all B-blastoid
cells.
.CC-BY 4.0 International license(which was not certified by peer review) is the author/funder. It is made available under aThe copyright holder for this preprintthis version posted March 3, 2020. . https://doi.org/10.1101/2020.03.02.972893doi: bioRxiv preprint
29
Fig. S4: Gene regulatory network atlas spanning mouse embryo stages from morula to
gastrulation and in vitro blastoid models
A) UMAP clustering based on the activity of gene regulatory networks.
B) Heatmap representing the activity of selected regulons associated with lineage-specific TFs
averaged across cells from each cluster.
C) Dot plot showing expression levels of NANOG, GATA4, GATA3, T and CDX2 target genes
derived from gene regulatory network analysis of selected cell types.
Fig. S5: E6.25 chimeras using mScarlet-NLS ESCs and L-EPSCs
A-B) Bar charts showing percent of E4.5 and E6.5 chimeric embryos with different lineage
contributions. Chimeras were generated by aggregating a wild-type host E2.5 embryo with a small
clump of mScarlet ESCs (129 ESC, R1-ES mScarlet-NLS) which were cultured in either 2iLif or
L-EPSC conditions. n indicates number of chimeras generated.
C) Immunofluorescent staining of E4.5 chimeric embryo stained for mCherry (mScarlet), Sox2
(EPI) and Cdx2 (TE). Donor cells were cultured in 2iLif conditions. Scale bar = 20 µm.
C’) Magnified single plane showing mCherry/Sox2 positive, Cdx2 negative cell within the TE.
Scale bar = 20 µm.
D) Immunofluorescent staining of E4.5 chimeric embryo. Donor cells were cultured in L-EPSC
conditions. Merges show a magnified single plane of the ICM. Scale bar = 20 µm.
E) Immunofluorescent staining of E6.5 chimeric embryo cultured in 2iLif conditions stained for
mCherry (mScarlet) Oct4 (EPI). Maximum intensity projection. Scale bar = 20 µm.
E’) Magnified single plane showing single mCherry/Oct4 positive donor cell found within the
trophoblast compartment. Scale bar = 20 µm.
F) Immunofluorescent staining of E6.5 chimeric embryo stained for mCherry (mScarlet) and Elf5
(trophoblast compartment). Donor cells were cultured in L-EPSC conditions. Single plane image.
Scale bar = 20 µm.
F’) Magnified single plane showing single donor mCherry positive, Elf5 negative cell found within
the epiblast region. Scale bar = 20 µm.
Fig. S6: Analysis of chimeric E12.5 placentas generated with totipotent blastomeres
Immunofluorescent stainings of E12.5 chimeric placentas generated with a single blastomere of
an 8-cell stage embryo that expressed either H2B-Gfp or DsRed and a wild-type host embryo.
H2B-Gfp expressing placentas were stained for Tfap2c, Tpbpa, Mct4, Cd31 and Gfp (top panel).
.CC-BY 4.0 International license(which was not certified by peer review) is the author/funder. It is made available under aThe copyright holder for this preprintthis version posted March 3, 2020. . https://doi.org/10.1101/2020.03.02.972893doi: bioRxiv preprint

30
DsRed expressing placentas were stained for Krt8, Mct1, Cdh3 and mCherry/Rfp (bottom panel).
Images shown at different magnifications. Scale bars: 500 µm (4x), 200 µm (7x), 50 µm (40x).
Fig. S7: Full panel of chimeric E12.5 placentas generated using tetraploid
complementation
Immunofluorescent staining of E12.5 chimeric placentas generated with H2B-Gfp expressing
tetraploid host embryo and wild-type ESCs (left panel), wild-type tetraploid host embryo and H2B-
Gfp expressing ESCs (middle panel) and wild-type host embryo (diploid) and H2B-Gfp expressing
L-EPSCs. Placenta sections are immuno-stained for Gfp and the following trophoblast markers:
Cdh3, Tpbpa, and Mct4, as well as the fetal endothelial cell marker Cd31. A total of 14 H2B-Gfp
positive L-EPSCs placentas were collected from two females, and 3 to 4 placentas were analyzed
for each marker. Images shown at different magnifications. Scale bars: 500 µm (4x), 200 µm (7x),
50 µm (40x).
References
1 Rossant, J. Investigation of the determinative state of the mouse inner cell mass. II. The
fate of isolated inner cell masses transferred to the oviduct. J Embryol Exp Morphol. 33 (4), 991-1001, (1975).
2 Tarkowski, A. K., Suwinska, A., Czolowska, R. & Ozdzenski, W. Individual blastomeres of 16- and 32-cell mouse embryos are able to develop into foetuses and mice. Dev Biol. 348 (2), 190-198, (2010).
3 Posfai, E. et al. Position- and Hippo signaling-dependent plasticity during lineage segregation in the early mouse embryo. Elife. 6, (2017).
4 Cockburn, K. & Rossant, J. Making the blastocyst: lessons from the mouse. J Clin Invest. 120 (4), 995-1003, (2010).
5 Kwon, G. S., Viotti, M. & Hadjantonakis, A. K. The endoderm of the mouse embryo arises by dynamic widespread intercalation of embryonic and extraembryonic lineages. Dev Cell. 15 (4), 509-520, (2008).
6 Nowotschin, S. et al. The emergent landscape of the mouse gut endoderm at single-cell resolution. Nature. 569 (7756), 361-367, (2019).
7 Evans, M. J. & Kaufman, M. H. Establishment in culture of pluripotential cells from mouse embryos. Nature. 292 (5819), 154-156, (1981).
8 Martin, G. R. Isolation of a pluripotent cell line from early mouse embryos cultured in medium conditioned by teratocarcinoma stem cells. Proc Natl Acad Sci U S A. 78 (12), 7634-7638, (1981).
9 Tanaka, S., Kunath, T., Hadjantonakis, A. K., Nagy, A. & Rossant, J. Promotion of trophoblast stem cell proliferation by FGF4. Science. 282 (5396), 2072-2075, (1998).
.CC-BY 4.0 International license(which was not certified by peer review) is the author/funder. It is made available under aThe copyright holder for this preprintthis version posted March 3, 2020. . https://doi.org/10.1101/2020.03.02.972893doi: bioRxiv preprint

31
10 Kunath, T. et al. Imprinted X-inactivation in extra-embryonic endoderm cell lines from mouse blastocysts. Development. 132 (7), 1649-1661, (2005).
11 Ying, Q. L. et al. The ground state of embryonic stem cell self-renewal. Nature. 453 (7194), 519-523, (2008).
12 Niakan, K. K., Schrode, N., Cho, L. T. & Hadjantonakis, A. K. Derivation of extraembryonic endoderm stem (XEN) cells from mouse embryos and embryonic stem cells. Nat Protoc. 8 (6), 1028-1041, (2013).
13 Cho, L. T. et al. Conversion from mouse embryonic to extra-embryonic endoderm stem cells reveals distinct differentiation capacities of pluripotent stem cell states. Development. 139 (16), 2866-2877, (2012).
14 Papaioannou, V. E., McBurney, M. W., Gardner, R. L. & Evans, M. J. Fate of teratocarcinoma cells injected into early mouse embryos. Nature. 258 (5530), 70-73, (1975).
15 Gardner, R. L. & Rossant, J. Investigation of the fate of 4-5 day post-coitum mouse inner cell mass cells by blastocyst injection. J Embryol Exp Morphol. 52 141-152, (1979).
16 Niakan, K. K. et al. Sox17 promotes differentiation in mouse embryonic stem cells by directly regulating extraembryonic gene expression and indirectly antagonizing self-renewal. Genes Dev. 24 (3), 312-326, (2010).
17 Canham, M. A., Sharov, A. A., Ko, M. S. & Brickman, J. M. Functional heterogeneity of embryonic stem cells revealed through translational amplification of an early endodermal transcript. PLoS Biol. 8 (5), e1000379, (2010).
18 Beddington, R. S. & Robertson, E. J. An assessment of the developmental potential of embryonic stem cells in the midgestation mouse embryo. Development. 105 (4), 733-737, (1989).
19 Niwa, H. et al. Interaction between Oct3/4 and Cdx2 determines trophectoderm differentiation. Cell. 123 (5), 917-929, (2005).
20 Ng, J. H., Heng, J. C., Loh, Y. H. & Ng, H. H. Transcriptional and epigenetic regulations of embryonic stem cells. Mutat Res. 647 (1-2), 52-58, (2008).
21 Kuckenberg, P. et al. The transcription factor TCFAP2C/AP-2gamma cooperates with CDX2 to maintain trophectoderm formation. Mol Cell Biol. 30 (13), 3310-3320, (2010).
22 Cambuli, F. et al. Epigenetic memory of the first cell fate decision prevents complete ES cell reprogramming into trophoblast. Nat Commun. 5 5538, (2014).
23 Yamanaka, S. & Takahashi, K. [Induction of pluripotent stem cells from mouse fibroblast cultures]. Tanpakushitsu Kakusan Koso. 51 (15), 2346-2351, (2006).
24 Benchetrit, H. et al. Direct Induction of the Three Pre-implantation Blastocyst Cell Types from Fibroblasts. Cell Stem Cell. 24 (6), 983-994 e987, (2019).
25 Tesar, P. J. et al. New cell lines from mouse epiblast share defining features with human embryonic stem cells. Nature. 448 (7150), 196-199, (2007).
26 Brons, I. G. et al. Derivation of pluripotent epiblast stem cells from mammalian embryos. Nature. 448 (7150), 191-195, (2007).
27 Hall, J. et al. Oct4 and LIF/Stat3 additively induce Kruppel factors to sustain embryonic stem cell self-renewal. Cell Stem Cell. 5 (6), 597-609, (2009).
28 Macfarlan, T. S. et al. Embryonic stem cell potency fluctuates with endogenous retrovirus activity. Nature. 487 (7405), 57-63, (2012).
29 Morgani, S. M. et al. Totipotent embryonic stem cells arise in ground-state culture conditions. Cell Rep. 3 (6), 1945-1957, (2013).
30 Abad, M. et al. Reprogramming in vivo produces teratomas and iPS cells with totipotency features. Nature. 502 (7471), 340-345, (2013).
31 Choi, Y. J. et al. Deficiency of microRNA miR-34a expands cell fate potential in pluripotent stem cells. Science. 355 (6325), (2017).
.CC-BY 4.0 International license(which was not certified by peer review) is the author/funder. It is made available under aThe copyright holder for this preprintthis version posted March 3, 2020. . https://doi.org/10.1101/2020.03.02.972893doi: bioRxiv preprint

32
32 Yang, J. et al. Establishment of mouse expanded potential stem cells. Nature. 550 (7676), 393-397, (2017).
33 Yang, Y. et al. Derivation of Pluripotent Stem Cells with In Vivo Embryonic and Extraembryonic Potency. Cell. 169 (2), 243-257 e225, (2017).
34 Liu, L. et al. G1 cyclins link proliferation, pluripotency and differentiation of embryonic stem cells. Nat Cell Biol. 19 (3), 177-188, (2017).
35 Li, R. et al. Generation of Blastocyst-like Structures from Mouse Embryonic and Adult Cell Cultures. Cell. 179 (3), 687-702 e618, (2019).
36 Sozen, B. et al. Self-Organization of Mouse Stem Cells into an Extended Potential Blastoid. Dev Cell. 51 (6), 698-712 e698, (2019).
37 Deng, Q., Ramskold, D., Reinius, B. & Sandberg, R. Single-cell RNA-seq reveals dynamic, random monoallelic gene expression in mammalian cells. Science. 343 (6167), 193-196, (2014).
38 Mohammed, H. et al. Single-Cell Landscape of Transcriptional Heterogeneity and Cell Fate Decisions during Mouse Early Gastrulation. Cell Rep. 20 (5), 1215-1228, (2017).
39 Chen, G. et al. Single-cell analyses of X Chromosome inactivation dynamics and pluripotency during differentiation. Genome Res. 26 (10), 1342-1354, (2016).
40 Aibar, S. et al. SCENIC: single-cell regulatory network inference and clustering. Nat Methods. 14 (11), 1083-1086, (2017).
41 Rugg-Gunn, P. J., Cox, B. J., Ralston, A. & Rossant, J. Distinct histone modifications in stem cell lines and tissue lineages from the early mouse embryo. Proc Natl Acad Sci U S A. 107 (24), 10783-10790, (2010).
42 Murray, A., Sienerth, A. R. & Hemberger, M. Plet1 is an epigenetically regulated cell surface protein that provides essential cues to direct trophoblast stem cell differentiation. Sci Rep. 6 25112, (2016).
43 Rivron, N. C. et al. Blastocyst-like structures generated solely from stem cells. Nature. 557 (7703), 106-111, (2018).
44 Kime, C. et al. Induced 2C Expression and Implantation-Competent Blastocyst-like Cysts from Primed Pluripotent Stem Cells. Stem Cell Reports. 13 (3), 485-498, (2019).
45 Pijuan-Sala, B. et al. A single-cell molecular map of mouse gastrulation and early organogenesis. Nature. 566 (7745), 490-495, (2019).
46 Suwinska, A., Czolowska, R., Ozdzenski, W. & Tarkowski, A. K. Blastomeres of the mouse embryo lose totipotency after the fifth cleavage division: expression of Cdx2 and Oct4 and developmental potential of inner and outer blastomeres of 16- and 32-cell embryos. Dev Biol. 322 (1), 133-144, (2008).
47 Strnad, P. et al. Inverted light-sheet microscope for imaging mouse pre-implantation development. Nat Methods. 13 (2), 139-142, (2016).
48 Strumpf, D. et al. Cdx2 is required for correct cell fate specification and differentiation of trophectoderm in the mouse blastocyst. Development. 132 (9), 2093-2102, (2005).
49 Home, P. et al. GATA3 is selectively expressed in the trophectoderm of peri-implantation embryo and directly regulates Cdx2 gene expression. J Biol Chem. 284 (42), 28729-28737, (2009).
50 Ralston, A. et al. Gata3 regulates trophoblast development downstream of Tead4 and in parallel to Cdx2. Development. 137 (3), 395-403, (2010).
51 Brulet, P., Babinet, C., Kemler, R. & Jacob, F. Monoclonal antibodies against trophectoderm-specific markers during mouse blastocyst formation. Proc Natl Acad Sci U S A. 77 (7), 4113-4117, (1980).
52 Avilion, A. A. et al. Multipotent cell lineages in early mouse development depend on SOX2 function. Genes Dev. 17 (1), 126-140, (2003).
53 Watson, E. D. & Cross, J. C. Development of structures and transport functions in the mouse placenta. Physiology (Bethesda). 20 180-193, (2005).
.CC-BY 4.0 International license(which was not certified by peer review) is the author/funder. It is made available under aThe copyright holder for this preprintthis version posted March 3, 2020. . https://doi.org/10.1101/2020.03.02.972893doi: bioRxiv preprint
33
54 Tanaka, M., Hadjantonakis, A. K. & Nagy, A. Aggregation chimeras. Combining ES cells, diploid and tetraploid embryos. Methods Mol Biol. 158 135-154, (2001).
55 Nagy, A., Gertsenstein, M., Vintersten, K. & Behringer, R. Assembling Aggregates between Embryonic Stem (ES) Cells and Tetraploid Embryos. CSH Protoc. 2006 (3), (2006).
56 Davie, K. et al. A Single-Cell Transcriptome Atlas of the Aging Drosophila Brain. Cell. 174 (4), 982-998 e920, (2018).
57 Yachie-Kinoshita, A. et al. Modeling signaling-dependent pluripotency with Boolean logic to predict cell fate transitions. Mol Syst Biol. 14 (1), e7952, (2018).
58 Kurek, D. et al. Endogenous WNT signals mediate BMP-induced and spontaneous differentiation of epiblast stem cells and human embryonic stem cells. Stem Cell Reports. 4 (1), 114-128, (2015).
59 Blij, S., Parenti, A., Tabatabai-Yazdi, N. & Ralston, A. Cdx2 efficiently induces trophoblast stem-like cells in naive, but not primed, pluripotent stem cells. Stem Cells Dev. 24 (11), 1352-1365, (2015).
60 Hackett, J. A. et al. Tracing the transitions from pluripotency to germ cell fate with CRISPR screening. Nat Commun. 9 (1), 4292, (2018).
61 Hadjantonakis, A. K. & Papaioannou, V. E. Dynamic in vivo imaging and cell tracking using a histone fluorescent protein fusion in mice. BMC Biotechnol. 4 33, (2004).
62 Nagy, A., Rossant, J., Nagy, R., Abramow-Newerly, W. & Roder, J. C. Derivation of completely cell culture-derived mice from early-passage embryonic stem cells. Proc Natl Acad Sci U S A. 90 (18), 8424-8428, (1993).
63 Rugg-Gunn, P. J. et al. Cell-surface proteomics identifies lineage-specific markers of embryo-derived stem cells. Dev Cell. 22 (4), 887-901, (2012).
64 Dobin, A. et al. STAR: ultrafast universal RNA-seq aligner. Bioinformatics. 29 (1), 15-21, (2013).
65 Liao, Y., Smyth, G. K. & Shi, W. The R package Rsubread is easier, faster, cheaper and better for alignment and quantification of RNA sequencing reads. Nucleic Acids Res. 47 (8), e47, (2019).
66 Janiszewski, A. et al. Dynamic reversal of random X-Chromosome inactivation during iPSC reprogramming. Genome Res. 29 (10), 1659-1672, (2019).
67 Love, M. I., Huber, W. & Anders, S. Moderated estimation of fold change and dispersion for RNA-seq data with DESeq2. Genome Biol. 15 (12), 550, (2014).
68 Petropoulos, S. et al. Single-Cell RNA-Seq Reveals Lineage and X Chromosome Dynamics in Human Preimplantation Embryos. Cell. 167 (1), 285, (2016).
69 Picelli, S. et al. Tn5 transposase and tagmentation procedures for massively scaled sequencing projects. Genome Res. 24 (12), 2033-2040, (2014).
70 Ramskold, D., Wang, E. T., Burge, C. B. & Sandberg, R. An abundance of ubiquitously expressed genes revealed by tissue transcriptome sequence data. PLoS Comput Biol. 5 (12), e1000598, (2009).
71 Butler, A., Hoffman, P., Smibert, P., Papalexi, E. & Satija, R. Integrating single-cell transcriptomic data across different conditions, technologies, and species. Nat Biotechnol. 36 (5), 411-420, (2018).
72 Huynh-Thu, V. A., Irrthum, A., Wehenkel, L. & Geurts, P. Inferring regulatory networks from expression data using tree-based methods. PLoS One. 5 (9), (2010).
73 Moerman, T. et al. GRNBoost2 and Arboreto: efficient and scalable inference of gene regulatory networks. Bioinformatics. 35 (12), 2159-2161, (2019).
74 Vintersten, K. et al. Mouse in red: red fluorescent protein expression in mouse ES cells, embryos, and adult animals. Genesis. 40 (4), 241-246, (2004).
75 Gertsenstein, M. Mouse embryos' fusion for the tetraploid complementation assay. Methods Mol Biol. 1313 41-59, (2015).
.CC-BY 4.0 International license(which was not certified by peer review) is the author/funder. It is made available under aThe copyright holder for this preprintthis version posted March 3, 2020. . https://doi.org/10.1101/2020.03.02.972893doi: bioRxiv preprint

34
.CC-BY 4.0 International license(which was not certified by peer review) is the author/funder. It is made available under aThe copyright holder for this preprintthis version posted March 3, 2020. . https://doi.org/10.1101/2020.03.02.972893doi: bioRxiv preprint

Mouse Embryonic Stem Cells (ESCs)
Mouse Expanded Potential Stem Cells (EPSCs)
D0 D3 D5 D7 D11
EPSCMedium
2i/LIF
-D4 D13 D15D9
RNA-seq
C
−8
−4
0
4
−30 −20 −10 0 10PC1: 87% variance
PC2:
4%
var
ianc
e
Day 0Day 3Day 5Day 7Day 9Day 11Day 13Day 15EPSCM2i/L
EPSCsESCs 2iL
4-cell
8-cell 16-cell
early blastocyst
mid blastocyst
late blastocyst
early 16-cell
late 16-celllate 32-cell
early 32-cell64-cell
2iLif 2iLif ESC
L-EPSC(Yang et al.)
Embryo (Deng et al. 2014)
2iLif ESCs and L-EPSCs (Yang et al. 2017)
Embryo (Posfai et al. 2017)2iLif ESCs and L-EPSCs (Current Study)
L-EPSC
20
0
-20
-40
-60
PCA3
PCA2
-20-30
-10010
2030
PCA140
200
-20-40
-60-80
05
1015
05
1015
05
1015
05
1015
05
1015
05
1015
norm
alize
d co
unts
log2
1600025M17RikDpep2Gm1995Gm5Gm7104Gm9125
EPSC
s D
11
EPSC
s D
7
EPSC
s D
15
EPSC
s D
9
EPSC
s D
13
EPSC
s D
5EP
SCs
D3
ESC
s
4 ce
ll em
bryo
0
5
10
15
0
5
10
15
0
5
10
15
0
5
10
15
0
5
10
15
2310040G24RikBhmt2Cited1Pdxk−psPpt2
EPSC
s D
11
EPSC
s D
7
EPSC
s D
15
EPSC
s D
9
EPSC
s D
13
EPSC
s D
5EP
SCs
D3
ESC
s
8 ce
ll em
bryo
16 c
ell e
mbr
yo
norm
aliz
ed c
ount
s log
2
4-cell stage embryo markers
8-16-cell stage embryo markers
A B
C D
E
F
−1 −0.8−0.6−0.4−0.2 0 0.2 0.4 0.6 0.8 1
Zygo
teEa
rly 2
-cel
l2 -
cell
4-ce
llM
orul
aIC
MTE PE 2i
Lif E
SCE4
.5 E
PIL-
EPSC
sE5
.5 E
PID
-EPS
Cs
Prim
ed E
piSC
E6.7
5 EP
I
ZygoteEarly 2-cell
2 -cell 4-cellMorula
ICMTEPE
2iLif ESCE4.5 EPIL-EPSCsE5.5 EPID-EPSCs
Primed EpiSCE6.75 EPI
Stem Cells Totipotent Preimplantation Postimplantation
Preimplantation ExE
r =
Morula
4-cell8-cell
TE
Early 2-cell
2 -cell
Zygote
L-EPSCs(Yang et al.)
2iLif ESC
D-EPSCs
L-EPSCs
ICM
E4.5 EPI
PE
E5.5 EPIE6.75 EPI
Primed EpiSC
E6.75 EPIE5.5 EPI
E4.5 EPI
MorulaICM
2 -cellD-EPSCsL-EPSCs
4-cell8-cell
TE
Early 2-cellZygote
L-EPSCs (Yang et al.)
2iLif ESC
PE
Primed EpiSC
UMAP1
UM
AP
2
Figure 1
.CC-BY 4.0 International license(which was not certified by peer review) is the author/funder. It is made available under aThe copyright holder for this preprintthis version posted March 3, 2020. . https://doi.org/10.1101/2020.03.02.972893doi: bioRxiv preprint
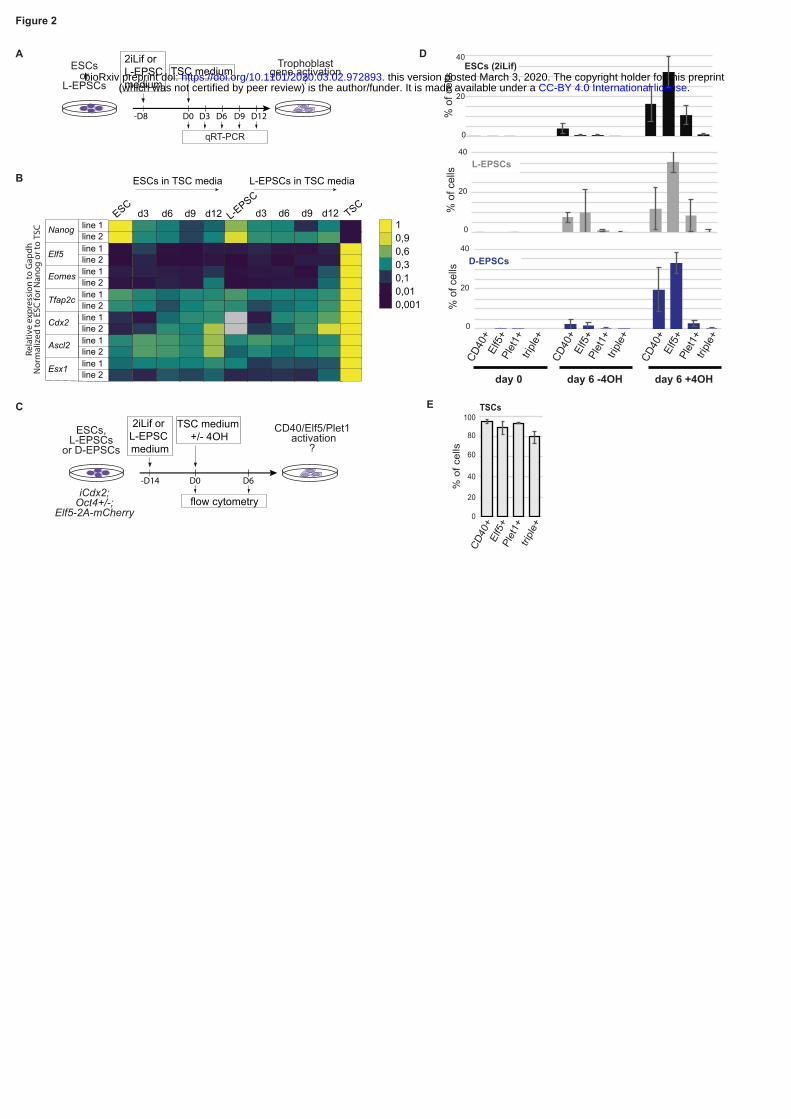
Figure 2
AESCs
orL-EPSCs
D0 D3 D6 D9
TSC medium
-D8 D12
qRT-PCR
Trophoblastgene activation
?
Rela
tive
expr
essi
on to
Gap
dhN
orm
aliz
ed to
ESC
for N
anog
or t
o TS
C Nanogline 2line 1
Ascl2line 2line 1
Eomesline 2line 1
Cdx2line 2line 1
Esx1line 2line 1
Tfap2c line 2line 1
Elf5 line 2line 1
ESCL-EPSC
d3 d6 d9 d12 TSCd3 d6 d9 d12
ESCs in TSC media L-EPSCs in TSC media
0,0010,010,10,30,60,91
B
2iLif or L-EPSC medium
ESCs (2iLif)
D-EPSCs
L-EPSCs
40
20
0
CD40
+
% o
f cel
ls
40
20
0
% o
f cel
ls
40
20
0
% o
f cel
ls
Plet
1+
Elf5
+
triple
+
CD40
+
Plet
1+
Elf5
+
triple
+
CD40
+
Plet
1+
Elf5
+
triple
+
C
D
ESCs,L-EPSCs
or D-EPSCs
D0 D6
TSC medium +/- 4OH
-D14
CD40/Elf5/Plet1 activation
?
2iLif or L-EPSC medium
flow cytometryiCdx2;
Oct4+/-;Elf5-2A-mCherry
day 0 day 6 -4OH day 6 +4OH
bright field
CD40
+
Plet
1+
Elf5
+
tripl
e+
100
80
0
% o
f cel
ls
TSCs
60
40
20
E
.CC-BY 4.0 International license(which was not certified by peer review) is the author/funder. It is made available under aThe copyright holder for this preprintthis version posted March 3, 2020. . https://doi.org/10.1101/2020.03.02.972893doi: bioRxiv preprint

−1 −0.8−0.6−0.4−0.2 0 0.2 0.4 0.6 0.8 1
EPI E
4.5
B-Bl
asto
id-E
PIEP
I E5.
5PE B-
Blas
toid
-PE
TE B-Bl
asto
id-T
EEx
E Ec
tode
rmB-
Blas
toid
-Int-1
B-Bl
asto
id-In
t-2Ex
E M
esod
erm
Mes
ench
yme
EPI E4.5B-Blastoid-EPI
EPI E5.5PE
B-Blastoid-PETE
B-Blastoid-TEExE Ectoderm
B-Blastoid-Int-1B-Blastoid-Int-2ExEMesodermMesenchyme
−1 −0.8−0.6−0.4−0.2 0 0.2 0.4 0.6 0.8 1
EPI E
4.5
ZG.B
last
oid.
EPI
EPI E
5.5
PE ZG.B
last
oid.
PE
TE ZG.B
last
oid.
TE
ExE.
Ecto
derm
ZG.B
last
oid.
Int
ExEM
esod
erm
Mes
ench
yme
EPI E4.5
ZG.Blastoid.EPI
EPI E5.5
PE
ZG.Blastoid.PE
TE
ZG.Blastoid.TE
ExE.Ectoderm
ZG.Blastoid.Int
ExEMesoderm
Mesenchyme
ExE MesodermCaudal Mesoderm
Intermediate MesodermMixed Mesoderm
Paraxial MesodermNascent Mesoderm
ZG-Blastoid-IntB-Blastoid-Int-2B-Blastoid-Int-1
ExE EctodermZG-Blastoid-TE
B-Blastoid-TETE
ExE EndodermParietal EndodermVisceral Endoderm
ZG-Blastoid-PEB-Blastoid-PE
PEZG-Blastoid-EPI
B-Blastoid-EPIEPI E6.5−E7.5
EPI E5.5EPI E4.5
ICMMorula
Nanog
Tdgf1Sox
2Gata
6Dab
2Pdgfra
Cdx2 Elf5Gata
3Tfap
2cKrt8
Krt18 T
Mesp1
Mixl1
EPI Genes PE Genes TE or Mesoderm Genes
A
B C
0
1
2
Average Expression
Percent Expressed
0255075100
Blastoid-EPI
Blastoid-PE
Blastoid-TE
Blastoid-Int.
Postimplantation ExE:
Postimplantation EPI:
Preimplantation:
B-Blastoid-TE
B-Blastoid-Int-2
B-Blastoid-PE
B-Blastoid-Int-1
B-Blastoid-EPI
Primitive Streak
EPI E6.5−E7.5
Visceral Endoderm
ExE Ectoderm
ExE Endoderm
Rostral Neurectoderm
Mixed MesodermExE Mesoderm
Intermediate Mesoderm
Caudal EpiblastPGC
MesenchymeParaxial Mesoderm
Caudal Neurectoderm
NotochordSomitic Mesoderm
Caudal Mesoderm
Nascent Mesoderm
Parietal Endoderm
Allantois
Anterior Primitive Streak
Endothelium
2iLif ESC
D.EPSCs
L-EPSCs
EPI E5.5
Primed EpiSC
ICM EPI E4.5
TEMorula
PEZG-Blastoid-PE
ZG-Blastoid-TE
ZG-Blastoid-EPI
ZG-Blastoid-Int-1
L-EPSCs (Yang et al.)
ZG-Blastoid-EPIZG-Blastoid-Int-1ZG-Blastoid-PEZG-Blastoid-TEB-Blastoid-EPIB-Blastoid-PEB-Blastoid-TEB-Blastoid-Int-1B-Blastoid-Int-2
L-EPSCsD-EPSCs
2iLif ESCL-EPSCs (Yang et al.)
Primed EpiSC
Mesenchyme
AllantoisAnterior Primitive StreakCaudal EpiblastCaudal MesodermCaudal NeurectodermEndotheliumIntermediate MesodermMixed Mesoderm
Nascent MesodermNotochordParaxial MesodermParietal EndodermPGCPrimitive StreakRostral NeurectodermSomitic MesodermVisceral Endoderm
MorulaICM
PETE
EPI E6.5−E7.5EPI E5.5
EPI E4.5
ExE ectodermExE endodermExE mesoderm
Blastoids:
Stem Cells:
Other Lineages:
UMAP1
UM
AP2
Figure 3
.CC-BY 4.0 International license(which was not certified by peer review) is the author/funder. It is made available under aThe copyright holder for this preprintthis version posted March 3, 2020. . https://doi.org/10.1101/2020.03.02.972893doi: bioRxiv preprint
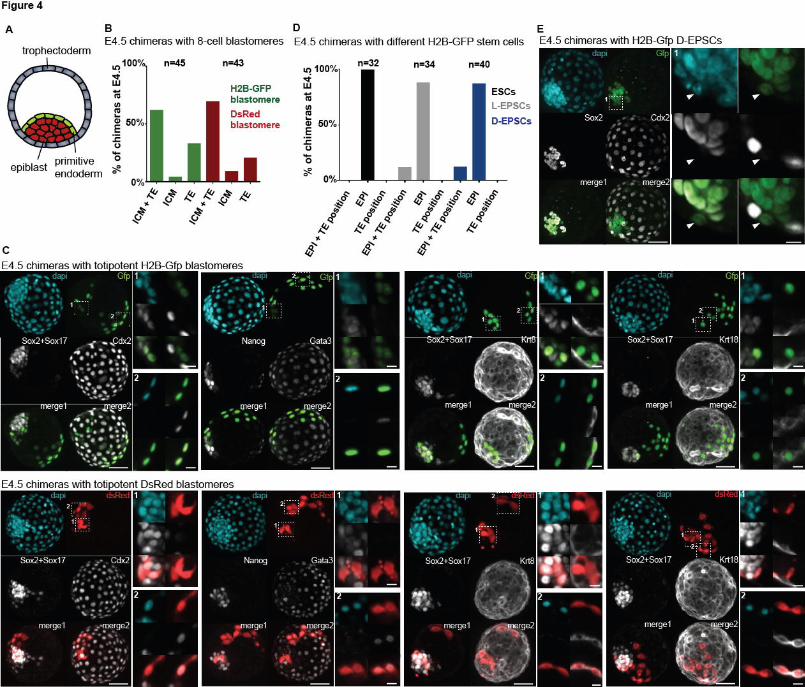
.CC-BY 4.0 International license(which was not certified by peer review) is the author/funder. It is made available under aThe copyright holder for this preprintthis version posted March 3, 2020. . https://doi.org/10.1101/2020.03.02.972893doi: bioRxiv preprint

.CC-BY 4.0 International license(which was not certified by peer review) is the author/funder. It is made available under aThe copyright holder for this preprintthis version posted March 3, 2020. . https://doi.org/10.1101/2020.03.02.972893doi: bioRxiv preprint
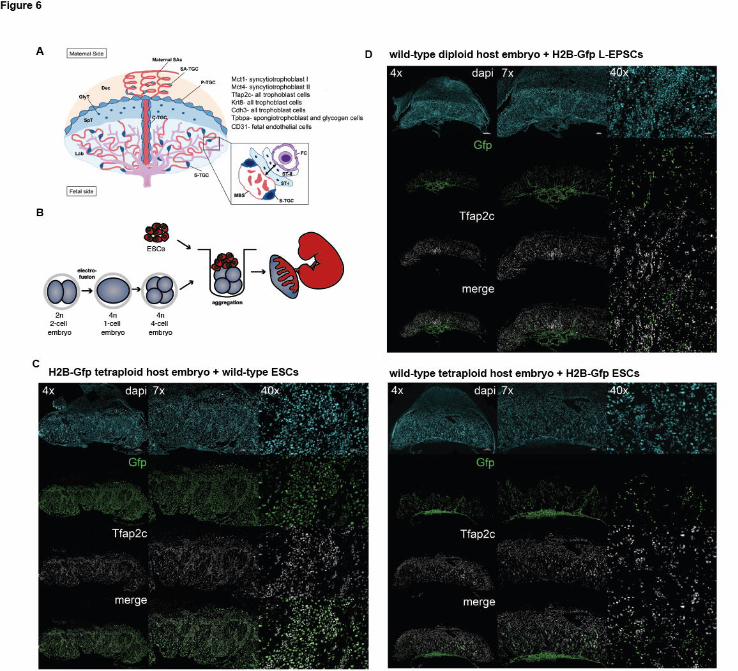
.CC-BY 4.0 International license(which was not certified by peer review) is the author/funder. It is made available under aThe copyright holder for this preprintthis version posted March 3, 2020. . https://doi.org/10.1101/2020.03.02.972893doi: bioRxiv preprint