Embed Size (px)
Citation preview

Definitive Guide to Excel VBA, Second Edition
MICHAEL KOFLERTRANSLATED BY DAVID KRAMER
*1038_ch00_CMP3 6/21/03 12:59 PM Page i
Definitive Guide to Excel VBA, Second EditionCopyright ©2003 by Michael Kofler
All rights reserved. No part of this work may be reproduced or transmitted in any form or by any means, electronic or mechanical, including photocopying, recording, or by any information storage or retrieval system, without the prior written permission of the copyright owner and the publisher.
ISBN (pbk): 1-59059-103-8
Printed and bound in the United States of America 12345678910
Trademarked names may appear in this book. Rather than use a trademark symbol with everyoccurrence of a trademarked name, we use the names only in an editorial fashion and to the benefit of the trademark owner, with no intention of infringement of the trademark.
Translator and Editor: David Kramer
Editorial Board: Dan Appleman, Craig Berry, Gary Cornell, Tony Davis, Steven Rycroft, Julian Skinner, Martin Streicher, Jim Sumser, Karen Watterson, Gavin Wright, John Zukowski
Assistant Publisher and Project Manager: Grace Wong
Copy Editor: Rebecca Rider
Production Manager: Kari Brooks
Production Editor: Janet Vail
Proofreader: Lori Bring
Compositor: Diana Van Winkle, vwdesign.com
Indexer: Kevin Broccoli
Cover Designer: Kurt Krames
Manufacturing Manager: Tom Debolski
Distributed to the book trade in the United States by Springer-Verlag New York, Inc., 175 FifthAvenue, New York, NY, 10010 and outside the United States by Springer-Verlag GmbH & Co. KG,Tiergartenstr. 17, 69112 Heidelberg, Germany.
In the United States: phone 1-800-SPRINGER, email [email protected], or visithttp://www.springer-ny.com. Outside the United States: fax +49 6221 345229, [email protected], or visit http://www.springer.de.
For information on translations, please contact Apress directly at 2560 Ninth Street, Suite 219,Berkeley, CA 94710. Phone 510-549-5930, fax 510-549-5939, email [email protected], or visithttp://www.apress.com.
The information in this book is distributed on an “as is” basis, without warranty. Although everyprecaution has been taken in the preparation of this work, neither the author(s) nor Apress shallhave any liability to any person or entity with respect to any loss or damage caused or alleged tobe caused directly or indirectly by the information contained in this work.
The source code for this book is available to readers at http://www.apress.com in the Downloadssection.
*1038_ch00_CMP3 6/21/03 12:59 PM Page ii
CHAPTER 10
Charts and DrawingObjects (Shapes)
CHARTS CONSTITUTE THE central feature of many Excel applications. This chaptergives a brief overview of the charts supported by Excel and also shows how youcan create and print out your own charts under program control. A lengthy exam-ple on the subject of data recording demonstrates various programming tech-niques.
A further topic of this chapter is that of drawing objects (Shapes), available sinceExcel 97, with which both charts and ordinary worksheets can be ornamented.
Chapter Overview
10.1 Charts .........................................................................................................52810.2 Programming Charts ..............................................................................53510.3 Example: Automatic Data Reporting ..............................................54410.4 Syntax Summary for Charts ...............................................................55810.5 Drawing Objects (Shapes) .................................................................56010.6 Diagrams ....................................................................................................565
527
*1038_ch10_CMP3 6/21/03 10:55 AM Page 527
10.1 Charts
Fear not! You are not about to be subjected to an extensive introduction to the useof charts. This topic is exhaustively (in the literal sense of the word) dealt with incountless books on Excel. The goal of this section is rather to describe, withoutmuch concern about the details of how they are used, the possibilities for design-ing charts, and to name the various elements of charts and explain their functions.This information will provide you with the requisite knowledge for entering theworld of programming charts, a world swarming with various ChartXxx objects.
Fundamentals
Chart Sheets Versus Charts Embedded in Worksheets
In Excel you can either embed charts in worksheets or present them in their ownchart sheets. The first variant has the advantage that the chart can be printed outwith its associated data. Furthermore, very small charts can be created that takeup only part of a page.
The Chart Wizard
Usually, the path to a new chart goes by way of the chart wizard. This wizard isautomatically summoned when you create a new chart (with INSERT|CHART or clickon the chart wizard tool.)
In the first step of the chart wizard you select the desired chart type. In thesecond step you choose the data range. Here there is no problem with indicating arange of cells that is the union of other cell ranges. In further steps you can deter-mine various options for the format of the chart. The chart wizard can also becalled up to help with preexisting charts if you wish to change certain formattingdetails.
Further Processing of Charts
Charts that have been created with the chart wizard frequently do not quite meetyour requirements. Therefore, the fine details of layout often begin after the chartwizard has been terminated.
In order for you to be able to edit the chart, you have to activate it with amouse click. As soon as the chart is active, you can click on most of the chart ele-ments within the region of the chart: the legend, the axes, individual data series
Chapter 10
528
*1038_ch10_CMP3 6/21/03 10:55 AM Page 528
(which are represented in the form of lines, bars, etc.), the background of thechart, and so on. For each of these chart elements there exists a pop-up menu thatusually offers an extensive array of formatting options. You can access the mostimportant setting dialogs with a double click on the corresponding chart element.
If you are working with charts for the first time, you will often encounter theproblem that you do not know which element to click on to carry out a specificchange. You have two alternatives: Suffering through the user’s guide and experi-mentation.
Chart Types
There are over seventy types of chart in Excel (though many of them are similar toone another). A complete list can be found in the chart wizard (where the chartsare organized by group) or in VBA help under the keyword ChartType.
Combination Charts
Combination charts are charts in which several chart types are combined (forexample, a line chart and column chart). Combination charts can be createdeither with the help of a user-defined chart (see below) or by changing the charttype of a single data series (not the entire chart).
Charts can be combined only if they are based on the same coordinate system. Therefore, the range of combination possibilities is relatively narrow.Three-dimensional charts cannot be combined at all.
Pivot Charts
Pivot charts are new in Excel 2000. These are not actually a new chart type, but anew way of linking data between a chart and a pivot table. What is special aboutpivot charts is that categories for structuring data can be created dynamically (thatis, by means of listboxes in charts). The chart is immediately revised. For the chartitself almost all the chart types listed above can be used. Pivot charts will bedescribed within the framework of pivot tables in Chapter 13.
User-Defined Chart Types (Autoformat)
There are two ways to format a chart: You can select one of the standard types, oryou can employ a so-called user-defined type (formerly autoformat). Among these
Charts and Drawing Objects (Shapes)
529
*1038_ch10_CMP3 6/21/03 10:55 AM Page 529
types are stored numerous formatting details, so that you can very quickly create awide variety of different charts. The name “user-defined” is somewhat confusing,since Excel recognizes an entire palette of predefined (integrated) types.
The user-defined formats in Excel give a very good overview as to what is avail-able. The formats are located in Officedirectory\Office\n\Xl8galry.xls, where nis a language code (for example, 1033 is the number of the American version).
More important is the possibility of adding your own user-defined formatsand using them in the future. For this you format a chart to your specifications,open the “Chart Type” dialog with the right mouse button, switch into the page“Custom Types,” and click on the option button “User-defined.” Then click the Addbutton and save your format as a new chart type. New (personal) chart types aresaved in the file Userprofile\Application Data\Microsoft\Excel\Xlusrgal.xls.
Chart Elements (Chart Objects) and Formatting Options
For the detailed layout of charts as well as for programming charts it is necessaryto know the distinctions made by Excel among various chart objects. Assistance inyour experimentation is offered by the chart toolbar. There, in the left listbox isshown the object that was just clicked on, such as “axis n,” “gridlines n,” “Series n,”and so on.
• Chart Area: This is the object ChartArea, which is responsible for the back-ground of the entire chart (that is, the region that is visible behind the plotarea, the legend, and so on). The type style that is input here holds for alltext of the chart that is not otherwise specially set.
• Plot Area: The plot area (PlotArea) represents a rectangle around the graphicregion of the chart. The plot area contains the actual chart, but not the title,legend, etc. With most two-dimensional charts even the axes are not part ofthe plot area. If, for example, you specify the background color green for theplot area and red for the chart area, the labels for the axes will be underlaidwith red.
• Floor, Walls: These two objects exist only for three-dimensional charts anddescribe the appearance of the floor and walls of the two vertical bordersurfaces of the chart. The plot area in this case is considered to be only therectangular region outside of the chart itself.
• Corners: Even the corners exist as an independent object in three-dimen-sional charts. Corners cannot be formatted. But they can be grabbed withthe mouse and turned in three dimensions. This is often more convenientthan setting the viewpoint and perspective via the dialog CHART|3D-VIEW.
Chapter 10
530
*1038_ch10_CMP3 6/21/03 10:55 AM Page 530
• Data Series: A data series describes a related unit of data (usually the valuesof a column from the underlying table; only if you select “Series in Rows” instep 2 of the chart wizard will data series be organized by rows). For exam-ple, a data series is reprenseted by a line. The formatting data of data seriesaffect the graphic representation of this data series, that is, color, markers,line style, etc.
• Data Points: The individual values of a data series are represented by datapoints. Normally, the format properties of all data points are the same andare preset by the properties of the data series. However, you can set theproperties of each data point separately and thereby thrust individualpoints of a series into prominence, or label points individually, for example.In a pie chart you can shove individual pie slices out from the pie and dis-tinguish them in this way—that, too, affects the property of the data point.Caution: The vertical position of data points in two-dimensional charts canbe changed with the mouse, and this changes the underlying value in thedata table!
• Trend Lines: Data series of two-dimensional charts can be associated withtrend lines. The trend lines are drawn in addition to the normal representa-tion of the data. Excel recognizes types of trend lines: best-fit curves (fivedifferent types) and averaging curves.
• Error Bars: Error bars are another subelement of a data series in two-dimen-sional charts. They indicate potential error amounts relative to each datamarker.
• Coordinate Axes: The coordinate axes have a large number of formattingdetails, which begin with scaling (minimum, maximum, linear or logarith-mic) and end with the precise arrangement of the axis labeling (which datapoints are labeled, which are indicated by a tick marks, whether the tickmark is inside or outside, and so on). New since Excel 97 is the possibility oflabeling the coordinate axes with text in any orientation (horizontal, verti-cal, or slant; FORMAT AXIS|FONT|ALIGNMENT).
There is also the option to equip a two-dimensional chart with two inde-pendent Y-axes, where one is valid for some of the data series and the otherfor the remaining data series. This is useful when you wish to represent onthe same chart two related quantities that have different scales (for exam-ple, a voltage and current). In order to employ two Y-axes it is necessary toseparate the data series into two groups. The easiest way to accomplish thisis by selecting the custom chart type “Lines on 2 Axes.”
• Grid Lines: The plot area of a two-dimensional chart or the walls and floor ofa three-dimensional chart can be combined with grid lines. The position of
Charts and Drawing Objects (Shapes)
531
*1038_ch10_CMP3 6/21/03 10:55 AM Page 531
grid lines is determined by the tick marks on the coordinate axes. Theappearance (color, line style) of principal and secondary grid lines can beset separately (but only for normal charts, not composite charts).
• Title: A chart can be equipped with several titles (for the chart, the axes,etc.). The position, type style, and alignment can be set independently.
• Legend: The legend makes possible a link between the colors used in thechart and the patterns of the data series. The labeling of the legend is takenfrom the first column or row of the data series. The legend can be placedanywhere in the chart (even beneath the data).
Chart Options in Tools|Options
With TOOLS|OPTIONS|CHART you have access to a few further chart options. Thesesettings concern only the current chart (and can be changed only when the chartis active).
The option “Plot empty cells as” determines how Excel responds to emptycells in the data series. In the setting “not plotted (leave gaps)” there appears ahole in the chart (that is, bars are missing, a line is broken, etc.). The alternativesto this setting are “zero” (then Excel treats empty cells as if they contained thevalue 0) and “interpolated” (then Excel attempts to interpolate suitable data val-ues for the empty cells).
The check box “Plot visible cells only” determines how Excel deals with hid-den rows and columns: If the box is activated, then data in invisible rows orcolumns are not displayed. In the chart the data are simply ignored (rather than a hole appearing). This setting is of interest primarily when the chart data comefrom a filtered database.
The check box “Chart sizes with window frame” is of interest only for chartsheets. When the box is activated the chart is fit to the current size of the window.Otherwise, only one print page is shown. To make the entire chart visible, thezoom factor may have to be changed (VIEW|ZOOM).
Trend Lines, Data Smoothing
With line charts you can select the option “Smoothed line” in the formatting set-tings for the data series. This has the effect of rounding the edges of an otherwiseangular course.
Other possibilities for providing a best-fit curve or averaging curve are offeredby the command CHART|ADD TRENDLINE. Excel can approximate a data set with fivedifferent types of best-fit curves: straight line, polynomial curve (up to sixth
Chapter 10
532
*1038_ch10_CMP3 6/21/03 10:55 AM Page 532
degree), logarithmic curve, exponential curve, power curve. With the options inthe dialog FORMAT TRENDLINE you can specify whether and to what extent the curveshould be extended beyond the current data and whether the formula for thecurve should be given.
A sixth type of curve can be specified in the TREND LINE dialog: an averagingcurve based on a running average. Here every point on the curve is calculatedfrom the average of the n preceding points. This has the effect of smoothing statis-tical errors of measurement. Averaging curves, in contrast to best-fit curves, can-not be extended beyond the range of the data.
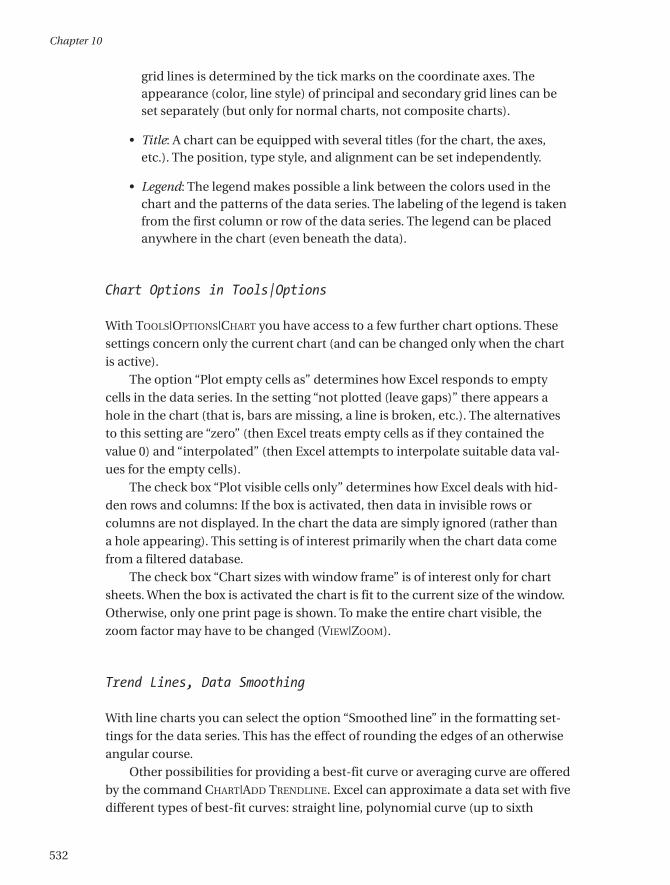
Some examples of the application of the trend line function are indicated inFigure 10-1. The associated example file Trend.xls is included with the samplefiles for this book.
Figure 10-1. Three examples of trend lines
Charts and Drawing Objects (Shapes)
533
*1038_ch10_CMP3 6/21/03 10:55 AM Page 533
Error Indication
Data series in two-dimensional charts can be provided with error indicators (errorbars). These are small lines that specify the range in which the actual value of adata point is to be found if statistical error of measurement is taken into account.
Printing
When it comes to printing a chart two variants must be considered: If the chart isembedded in a worksheet, then printing is accomplished by way of printing theworksheet. Here the only problem is that Excel does not give much thought towhere page breaks are inserted, and even a small chart might find itself brokeninto four pieces. It does not hurt to check the page preview before printing. Youmay find yourself compelled to insert some hard page breaks to optimize printing(INSERT|PAGE BREAK).
On the other hand, if the chart is located in a chart sheet, or if you wish toprint an embedded chart that has been selected with a mouse click, then there aresome options available in the dialog PAGE SETUP. The most important of these is“Printed chart size” on the CHART page of this dialog. In the standard setting Exceluses the entire page. If the chart does not happen to have the same format as thepage, the chart can become completely distorted. Therefore, it is usually better toselect the option “Scale to fit page.” Excel enlarges the chart only to the extent thatthe relationship between the length and width does not change (that is, the aspectratio is preserved). The third variant, “Custom,” leaves the size of the chartunchanged.
The option “Print in black and white” allows color charts to be printed on ablack and white printer. (Most printers can handle this without the use of thisoption.) Whether with or without this option, you will achieve usable results on a black and white printer only if you refrain from using color in your chart. Useinstead differing line widths and types to distinguish among several data series.
Since the standard and custom chart types are generally extremely colorfriendly, the creation of a satisfactory black and white substitute usually requiresconsiderable effort (say, about 100 mouse clicks for a typical chart). Therefore, ifthis is a common situation for you, then save black and white charts as a customchart type.
Chapter 10
534
*1038_ch10_CMP3 6/21/03 10:55 AM Page 534
10.2 Programming Charts
First attempts at programming charts are often very difficult. The reason is that itis not easy to acquire an orientation among the multitude of Chart objects, andthe association of properties and methods is not always clear.
Here is an example: The method ClearContents of the ChartArea object clearsthe data of a chart, but not its formatting. This is strange, in that the ChartAreaobject is actually not responsible for the chart itself, but only for its background. Itwould have been more logical if chart data were deleted via the Delete method ofthe Chart object, but this method returns nothing but an error message in the caseof an embedded chart. Apparently, Delete is suitable only for deleting chart sheets,while the two related methods ClearContents and ClearFormats of the ChartAreaobject are responsible for the internal affairs of charts.
In constrast to the ChartArea object we have the PlotArea object. This objectalso describes the background of the chart, though in this case the area immedi-ately behind the chart lines, bars, and so on.
REMARK Though at the outset you may feel overwhelmed by the surfeit ofobjects and their properties, there are positive aspects to the situation: Youcan truly run almost the entire chart business with program code. Alas, spacedoes permit a full description of this plenitude. For many details you will bereferred to the on-line help after finishing this chapter.
Instead of Searching Fruitlessly, Use the Macro Recorder!
If you would like to know how you can achieve a particular formatting result inprogram code, then use the macro recorder as your trusted adviser (the examplesfrom the on-line help are practically useless).
The shorter the recording session, the easier it will be for you to interpret theresults. Therefore, you should start recording in a chart that already exists, changeonly a single detail, and then stop recording at once. If you arrange on your moni-tor one window with program code and a second one with the chart, you can evenobserve during recording when each line of code is generated.
The code that results from the macro recording usually works (at least nocounterexamples appeared during the preparation of this chapter), but it is sel-dom optimal. In part, the instructions are unnecessarily convoluted, and in partthey are completely superfluous. Therefore, the code must be edited after the fact.
Charts and Drawing Objects (Shapes)
535
*1038_ch10_CMP3 6/21/03 10:55 AM Page 535
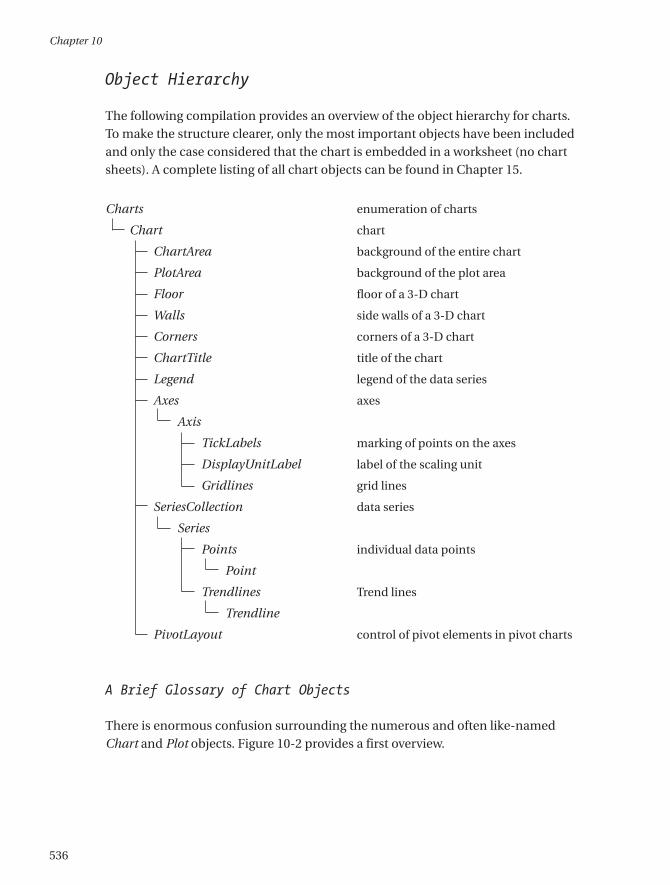
Object Hierarchy
The following compilation provides an overview of the object hierarchy for charts.To make the structure clearer, only the most important objects have been includedand only the case considered that the chart is embedded in a worksheet (no chartsheets). A complete listing of all chart objects can be found in Chapter 15.
Charts enumeration of charts
Chart chart
ChartArea background of the entire chart
PlotArea background of the plot area
Floor floor of a 3-D chart
Walls side walls of a 3-D chart
Corners corners of a 3-D chart
ChartTitle title of the chart
Legend legend of the data series
Axes axes
Axis
TickLabels marking of points on the axes
DisplayUnitLabel label of the scaling unit
Gridlines grid lines
SeriesCollection data series
Series
Points individual data points
Point
Trendlines Trend lines
Trendline
PivotLayout control of pivot elements in pivot charts
A Brief Glossary of Chart Objects
There is enormous confusion surrounding the numerous and often like-namedChart and Plot objects. Figure 10-2 provides a first overview.
Chapter 10
536
*1038_ch10_CMP3 6/21/03 10:55 AM Page 536
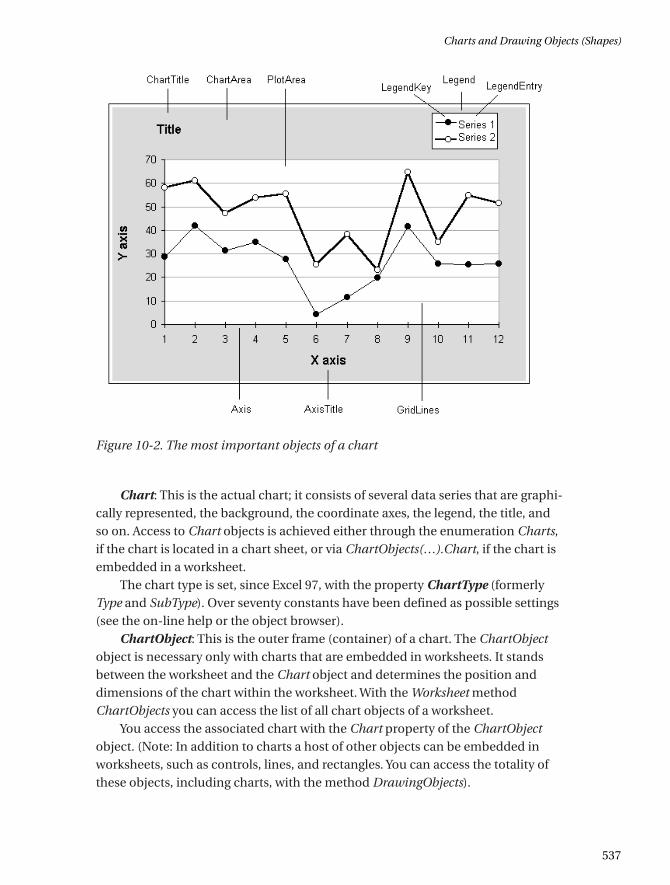
Figure 10-2. The most important objects of a chart
Chart: This is the actual chart; it consists of several data series that are graphi-cally represented, the background, the coordinate axes, the legend, the title, andso on. Access to Chart objects is achieved either through the enumeration Charts,if the chart is located in a chart sheet, or via ChartObjects(…).Chart, if the chart isembedded in a worksheet.
The chart type is set, since Excel 97, with the property ChartType (formerlyType and SubType). Over seventy constants have been defined as possible settings(see the on-line help or the object browser).
ChartObject: This is the outer frame (container) of a chart. The ChartObjectobject is necessary only with charts that are embedded in worksheets. It standsbetween the worksheet and the Chart object and determines the position anddimensions of the chart within the worksheet. With the Worksheet method ChartObjects you can access the list of all chart objects of a worksheet.
You access the associated chart with the Chart property of the ChartObjectobject. (Note: In addition to charts a host of other objects can be embedded inworksheets, such as controls, lines, and rectangles. You can access the totality ofthese objects, including charts, with the method DrawingObjects).
Charts and Drawing Objects (Shapes)
537
*1038_ch10_CMP3 6/21/03 10:55 AM Page 537
ChartArea: This is the background of the chart. With the properties of thisobject you can set color, borders, and so on. However, this object has a greater sig-nificance insofar as its methods Copy, Clear, ClearContents, and ClearFormatsrelate to the actual subordinate Chart object (Microsoft alone knows why). In thecase of embedded charts the method Select can be used only if first the associatedChartObject object has beed activated with Activate.
ChartGroup: This object groups various chart types within a chart. Normally,a chart possesses only a single chart group. In this case the ChartGroup object isirrelevant. This object, then, has significance only when in a composite chart twoor more chart types are united (for example, a bar chart and line chart). In thiscase the chart is managed by several groups with differing chart types (Typeproperty).
Charts: The chart object contains the enumeration of all chart sheets of aworkbook. The like-named method immediately returns the Chart object. Thereis, then, no separate chart sheet object comparable to a worksheet. For chartsheets, no intermediate ChartObject is necessary.
Some additional objects do not, in fact, begin with “Chart,” but they arenonetheless of interest.
PlotArea: This is the “graphical” area within a chart. The plot area contains thecoordinate axes and the actual chart graphic. The main task of this object consistsin determining the size and position of this region within the total area of thechart. Other regions in the chart are the legend (Legend object) and the title(ChartTitle object). In the case of three-dimensional charts the objects Floor andWalls (as subobjects of Chart) are managed independently of PlotArea. These twoobjects are responsible for the visual appearance of the boundary surfaces of athree-dimensional chart.
NOTE When you execute PlotArea.Width=n: m=PlotArea.Width, then m is distinctly larger than n. The reason is that PlotArea.Width actually changesthe write-protected property InsideWidth introduced in Excel 97, that is, theinside region of PlotArea. In addition to this inside region there is an outsideregion, in which the labeling of the coordinate axes appears. (The same prob-lems occur also with Height/InsideHeight, of course). To set the size of the outside region you can usually rely on the following code:
delta = PlotArea.Width - PlotArea.InsideWidthPlotArea.Width = n + delta
This method is not quite exact either, since the size of the label area is notconstant. For example, if a chart is greatly reduced in size, Excel simply doeswithout axis labels, and the label area is reduced to size 0.
Chapter 10
538
*1038_ch10_CMP3 6/21/03 10:55 AM Page 538
Series, Point: The Series object refers to the data of a data series belonging to achart. The actual numerical values can be taken from the Values property of theSeries object, which can also be used to change these values. Series is a subobjectof the Chart object. Formatting data that affect not the entire series but only anindividual data point are controlled by Point objects. These are again a subobjectof the Series objects.
Axis, Gridlines: The Axis object is also a subobject of the Chart object. Itdescribes the details of a coordinate axis. The Gridlines object is a subobject of theAxis object and is addressed via the properties MajorGridlines and MinorGridlines.
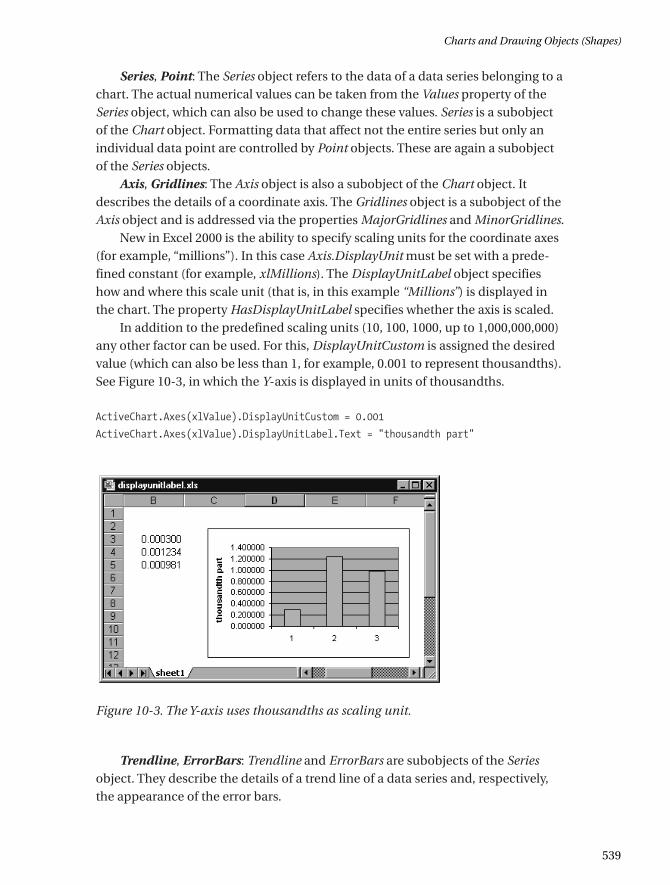
New in Excel 2000 is the ability to specify scaling units for the coordinate axes(for example, “millions”). In this case Axis.DisplayUnit must be set with a prede-fined constant (for example, xlMillions). The DisplayUnitLabel object specifieshow and where this scale unit (that is, in this example “Millions”) is displayed inthe chart. The property HasDisplayUnitLabel specifies whether the axis is scaled.
In addition to the predefined scaling units (10, 100, 1000, up to 1,000,000,000)any other factor can be used. For this, DisplayUnitCustom is assigned the desiredvalue (which can also be less than 1, for example, 0.001 to represent thousandths).See Figure 10-3, in which the Y-axis is displayed in units of thousandths.
ActiveChart.Axes(xlValue).DisplayUnitCustom = 0.001
ActiveChart.Axes(xlValue).DisplayUnitLabel.Text = "thousandth part"
Figure 10-3. The Y-axis uses thousandths as scaling unit.
Trendline, ErrorBars: Trendline and ErrorBars are subobjects of the Seriesobject. They describe the details of a trend line of a data series and, respectively,the appearance of the error bars.
Charts and Drawing Objects (Shapes)
539
*1038_ch10_CMP3 6/21/03 10:55 AM Page 539
TIP The keywords Gridlines and ErrorBars appear in the plural, and in contrast to other pluralized Excel objects, they do not refer to enumerationobjects.
TIP If you do not know the name of a particular object in a chart, you can click on that object (for example, a coordinate axis) and execute ?TypeName(Selection) in the immediate window. As result you obtain the object name (in this example, Axis).
Programming Techniques
The Chart Wizard
The method ChartWizard offers, in general, the fastest route to creating a chart. Inorder to use this method, you must first generate a ChartObject object. You can readall about the infinitude of parameters associated to this method in the on-line help.
ActiveSheet.ChartObjects.Add(30, 150, 400, 185).Name = _
"new chart"
ActiveSheet.ChartObjects("new chart").Activate
ActiveChart.ChartWizard sheet1 .[A3:D99], xlLine, 4, xlColumns, 1, 1
Chart Objects: Activate or Select?
With the methods Activate and Select Microsoft has blessed us with a certainamount of confusion: Sometimes one method must be used (windows), some-times the other (worksheets), and sometimes both are allowed (ranges of cells). In the case of ChartObject objects not only are both methods allowed, but theylead to different results!
Activate corresponds to a single click on a chart. Selection now refers to theobject PlotArea (thus not to Chart)!
Select seemingly also corresponds to a single click on a chart. However, theSelection property now refers to a ChartObject object. Therefore, use Select whenyou wish to change the position or size of a chart in a worksheet but you do notwish to change features of the actual chart.
Sheets(1).ChartObjects(1).Select
Chapter 10
540
*1038_ch10_CMP3 6/21/03 10:55 AM Page 540
The two methods have in common that the Chart object can then be accessedvia ActiveChart.
CAUTION In Excel 97 access to a chart via ActiveChart led at times to seriousproblems. Access the object in question directly instead of first activating itand then altering it via ActiveChart.
Deactivating Chart Objects
The best way to deactivate a chart is by activating some other object. For example,
Sheets(n).[A1].Select
Deleting, Copying, and Inserting Charts
ChartObject objects can be directly copied together with the chart containedtherein with Copy and then again inserted into the worksheet. After the insertion,the Selection property refers to the new ChartObject object, so that this can thenbe named. If you simply wish to duplicate a ChartObject object, you can use themethod Duplicate directly instead of Copy and Paste. With Delete you can delete aChartObject object together with all the data contained therein.
ActiveSheet.ChartObjects(1).Copy
ActiveSheet.Paste
Selection.Name = "new chart"
' …
ActiveSheet.ChartObjects("new chart").Delete
The situation is somewhat different if you wish to delete, copy, or insert onlythe chart data without altering the ChartObject object. In this case the ChartAreaobject takes center stage (since there is no Copy method defined for the Chartobject). Upon insertion into another chart object you must then refer to thatChart object.
ActiveSheet.ChartObjects(1).Chart.ChartArea.Copy
ActiveSheet.ChartObjects(2).Chart.Paste
Charts and Drawing Objects (Shapes)
541
*1038_ch10_CMP3 6/21/03 10:56 AM Page 541
With deleting chart data, too, you have to access the ChartArea object. Cleardeletes all the chart data, ClearContents only the chart’s contents (here is meantprimarily the data series), and ClearFormats only the formatting information.
If you wish to insert an empty ChartObject into a worksheet (that is, an emptychart framework), you apply the Add method to ChartObjects. To this method arepassed the position and size specifications (in points: 1 point = 1/72 inch = 0.35mm). A name can be given at once to the new object:
ActiveSheet.ChartObjects.Add(0,0,200,100).Name = "new chart"
Aligning Several Charts
When you place two or more charts in a worksheet with the mouse, you will soonfind out that it is relatively difficult to create two charts of exactly the same sizelying one precisely above the other. A very good assistant in this enterprise is themenu of the DRAWING toolbar. With its menu items you can align previouslyselected objects (including charts). Another variant consists in simply accessingthe Left, Top, Width, and Height properties of the ChartObject object.
The following instructions in the immediate window were used to align thefive charts of a monthly report (see the next section) horizontally corresponding to the position and size of the first chart.
set wb = Worksheets("MonthlyReport")
For i=2 To 5: wb.ChartObjects(i).Left = _
wb.ChartObjects(1).Left: Next i
For i=2 To 5: wb.ChartObjects(i).Width = _
wb.ChartObjects(1).Width: Next i
Using Ready-Made Charts or Custom Formats
The complete setting up of a chart with all its formatting details is possible via program code, but this is a laborious and complex programming endeavor. If theappearance of a chart is in any case predetermined (and independent of the data to be processed) it makes more sense to save the completed chart in a worksheet orchart sheet and use program code only to change the data used to draw the chart.The actual formatting of the chart can be carried out directly with the mouse andwithout programming effort. (The procedure MonthlyProtocol in the next sectionprovides an example.)
The use of autoformat requires more than minimal programming, but is stillbetter than programming a chart from scratch. With autoformats, which in turn
Chapter 10
542
*1038_ch10_CMP3 6/21/03 10:56 AM Page 542
are derived from charts that you have formatted in the traditional way, you canchange practically all the formatting data of a chart generated by program codewith a single instruction. Then you need to carry out at most a few instructions forthe optimal sizing of individual chart elements. The application of an autoformatto an existing chart is carried out, since Excel 97, with the method ApplyCustom-Type (formerly AutoFormat).
ActiveChart.ApplyCustomType ChartType:=xlUserDefined, _
TypeName:="DailyReport"
The deployment of autoformats is problematic when you wish to install acomplete Excel application on another computer. Personal autoformats are storedin the file Userprofile\Application Data\Microsoft\Excel\Xlusrgal.xls. Thisfile cannot be copied to another computer, because you would thereby overwritethe autoformats of another user. Thus the transmission of autoformats in a file isimpossible.
However, there is a way around this restriction. You should include in yourapplication a worksheet in which you have embedded a simple example chart foreach autoformat used. When the program is launched, activate these examplecharts one after the other and save their format information as autoformats on the computer on which the application is being run.
Application.AddChartAutoFormat Chart:=ActiveChart, _
Name:= "new autoformat", Description:=""
Unfortunately, there is no way to determine which autoformats have alreadybeen defined. An object such as AutoFormats does not exist in the current versionof Excel.
Printing and Exporting Charts
Printing a chart is carried out with the method PrintOut, which can be applied toboth Chart and Workbook objects. Since Excel 97 charts can also be exported intoa graphics file in various formats with Export.
ActiveChart.Export "test.gif", "GIF"
According to the on-line documentation, in the second parameter you canprovide all of the graphics formats for which export filters have been installed.What filters exists, what they are called, and how the program can determinewhether a particular filter is installed are not revealed in the documentation.
Charts and Drawing Objects (Shapes)
543
*1038_ch10_CMP3 6/21/03 10:56 AM Page 543
Therefore, protect your procedures for exporting with On Error. Experiments withExport have succeeded with the following formatting character strings:
“GIF”, “JPEG”, “TIF”, “TIFF”, “PNG”On the other hand, “BMP” and “WMF”, that is, the two standard Microsoft for-
mats for bitmaps and for simple vector graphics, are not supported. If you requirecharts in these formats, you can use the method CopyPicture, which copies thechart to the clipboard. Unfortunately, the exportation ends there. That is, Excelprovides no method to save the contents of the clipboard to a file.
10.3 Example: Automatic Data Reporting
The file Chart.xls demonstrates the application of Excel to the reporting of meas-urement data. Data reporting is necessary whenever relatively large data sets needto be documented and perhaps analyzed over an extended period of time. The datasource can be just about anything, from the automatically measured amounts ofhazardous chemicals in a waste treatment plant to the results of quality control in afactory.
The task of data reporting is to generate informative and readable printoutsfrom the trash heap of numbers consisting of many small, or one large, file ordatabase. It should be clear that charts for data visualization can play an impor-tant role in this operation.
Since in the sample files we cannot provide a technological method of data production, the application Chart.xls has available the menu commandREPORT|CREATE TEST DATA, which creates Excel files with simulated measurementdata. In practice, you would need such a command only during the test phase ofthe program. In general, you would have more genuine measurement data at yourdisposal than you probably want, and you would not need to increase your datasupply with a data simulation program.
Using the Example Program
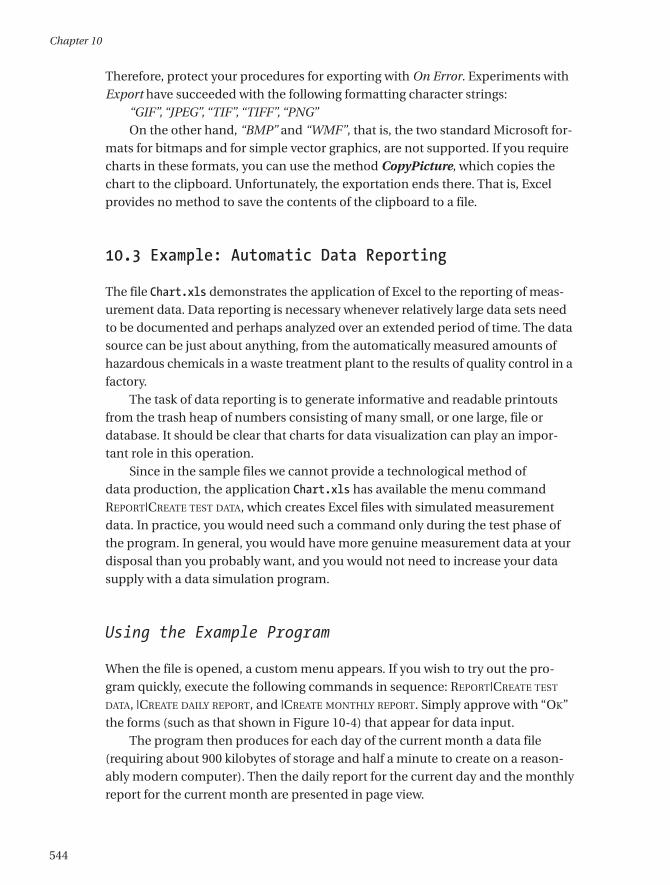
When the file is opened, a custom menu appears. If you wish to try out the pro-gram quickly, execute the following commands in sequence: REPORT|CREATE TEST
DATA, |CREATE DAILY REPORT, and |CREATE MONTHLY REPORT. Simply approve with “OK”the forms (such as that shown in Figure 10-4) that appear for data input.
The program then produces for each day of the current month a data file(requiring about 900 kilobytes of storage and half a minute to create on a reason-ably modern computer). Then the daily report for the current day and the monthlyreport for the current month are presented in page view.
Chapter 10
544
*1038_ch10_CMP3 6/21/03 10:56 AM Page 544
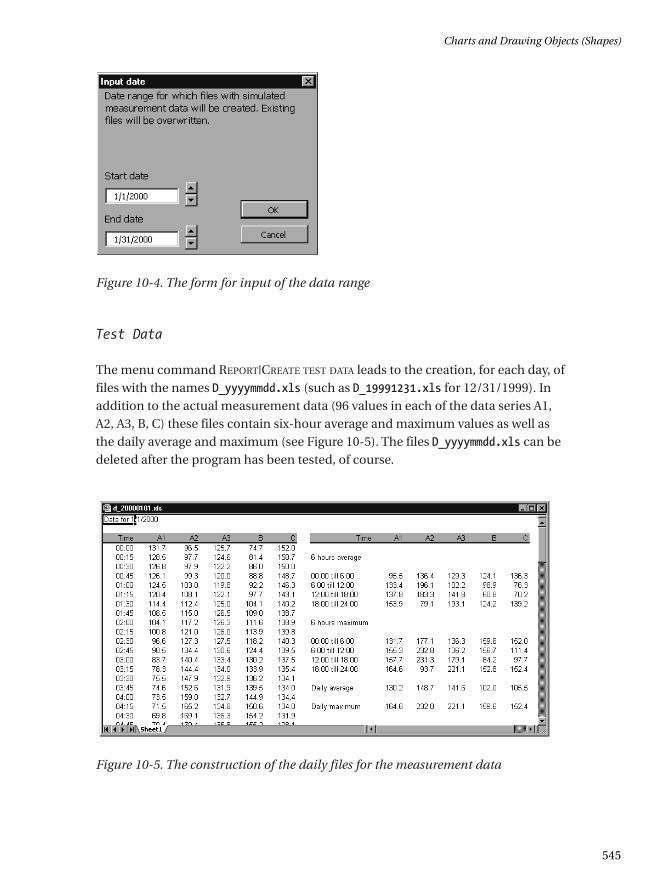
Figure 10-4. The form for input of the data range
Test Data
The menu command REPORT|CREATE TEST DATA leads to the creation, for each day, offiles with the names D_yyyymmdd.xls (such as D_19991231.xls for 12/31/1999). Inaddition to the actual measurement data (96 values in each of the data series A1,A2, A3, B, C) these files contain six-hour average and maximum values as well asthe daily average and maximum (see Figure 10-5). The files D_yyyymmdd.xls can bedeleted after the program has been tested, of course.
Figure 10-5. The construction of the daily files for the measurement data
Charts and Drawing Objects (Shapes)
545
*1038_ch10_CMP3 6/21/03 10:56 AM Page 545
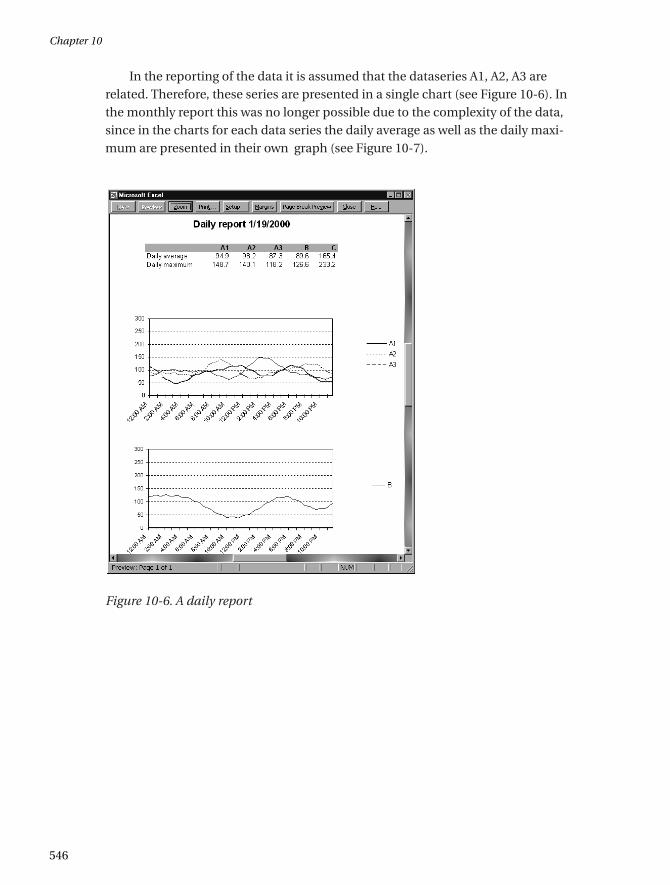
In the reporting of the data it is assumed that the dataseries A1, A2, A3 arerelated. Therefore, these series are presented in a single chart (see Figure 10-6). Inthe monthly report this was no longer possible due to the complexity of the data,since in the charts for each data series the daily average as well as the daily maxi-mum are presented in their own graph (see Figure 10-7).
Figure 10-6. A daily report
Chapter 10
546
*1038_ch10_CMP3 6/21/03 10:56 AM Page 546
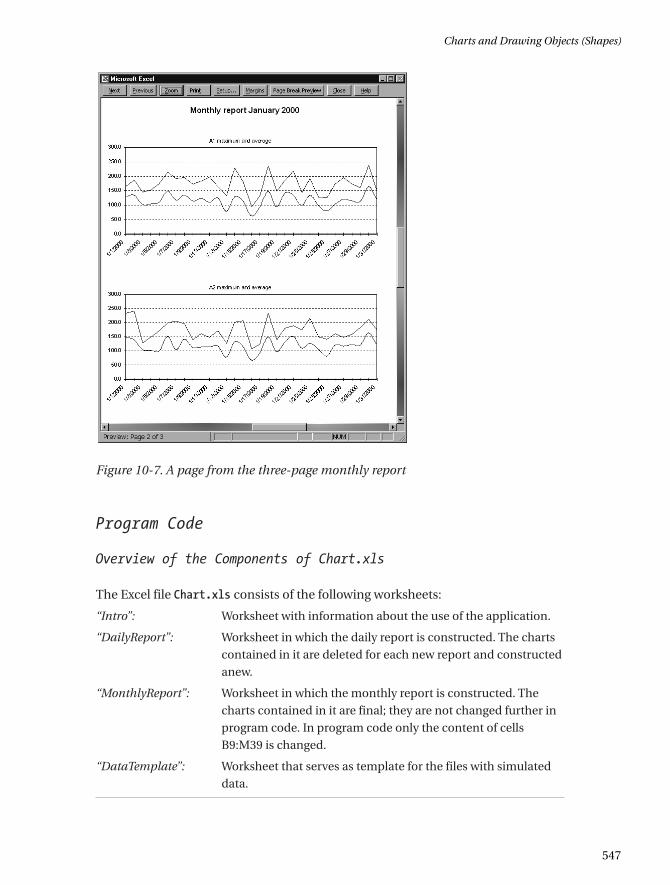
Figure 10-7. A page from the three-page monthly report
Program Code
Overview of the Components of Chart.xls
The Excel file Chart.xls consists of the following worksheets:
“Intro”: Worksheet with information about the use of the application.
“DailyReport”: Worksheet in which the daily report is constructed. The charts
contained in it are deleted for each new report and constructed
anew.
“MonthlyReport”: Worksheet in which the monthly report is constructed. The
charts contained in it are final; they are not changed further in
program code. In program code only the content of cells
B9:M39 is changed.
“DataTemplate”: Worksheet that serves as template for the files with simulated
data.
Charts and Drawing Objects (Shapes)
547
*1038_ch10_CMP3 6/21/03 10:56 AM Page 547
The construction of the worksheets must not be altered, since access to par-ticular cells is carried out directly in program code.
The program code is divided into the following modules:
“ThisWorkbook”: display menu on opening; delete it on closing.
“FormDateInput”: form for input of date range.
“MenuEvents”: event procedures for the menu commands.
“CreateDateFiles”: procedures for generating the test data.
“CreateReports”: procedures for building and printing the daily and monthly
reports.
On the following pages the most interesting details of the program code aredescribed. The same order is observed as that for using the program (generate testdata, daily report, monthly report). The code not only demonstrates the variouspossibilities for chart programming, it also shows how you can consolidate datafrom several Excel files when the Excel function DATA|CONSOLIDATE is too inflexiblefor your requirements.
Creating the Test Data
The program segment for creating the test data is of little interest to the extent that it would not exist in a real-world application (in which one has genuinedata!). In our example GenerateDailyWorksheet creates a new Excel file based onthe template worksheet in the sheet “DataTemplate.” This template contains notonly various formatting data, but also some formulas for calculating the six-houraverage and maximum values as well as the daily average and maximum values.
The simulated test data are calculated on the basis of six superposed sinecurves of various frequencies. The parameters of these functions (amplitude, frequency, and phase) are stored in the global field rndmat. The global variablerndInit determines whether this field already contains valid values. This avoids thenecessity of providing new random numbers for each day. (Random numbers aregenerated only the first time this procedure is called.)
The random numbers are initialized in the procedure InitRandomnumbers(not presented here). Here the attempt is made to choose similar values for thethree data series A1, A2, A3. For each day the procedure DailyRandomnumbers iscalled anew. This procedure changes the existing values of the zfmat field by asmall amount, so that the data do not appear to be too regular.
Chapter 10
548
*1038_ch10_CMP3 6/21/03 10:56 AM Page 548
' Chart.xls, Module CreateDataFiles
Dim rndInit As Boolean 'tests whether random matrix is already initialized
Dim rndmat#(5, 18) 'matrix with random numbers
Const Pi = 3.1415927
' create workbook with (random) measurement data for one day
Function GenerateDailyWorksheet(dat As Date) As BooleanDim filename$ 'name of the new workbook
Dim wb As Workbook 'new workbook
Dim ws As Worksheet 'sheet in this book
Dim cell As Range 'first data cell on the sheet
Dim i%, j%, k% 'loop variables
Dim x#, z As Date
filename = ThisWorkbook.Path + "\d_" + _
Format(dat, "yyyymmdd") + ".xls"
Application.DisplayAlerts = False
' creates new workbook; copies sheet "DataTemplate" from
' this workbook into new workbook; deletes all other sheets
Set wb = Workbooks.Add
ThisWorkbook.Sheets("DataTemplate").Copy Before:=wb.Sheets(1)
For i = wb.Sheets.Count To 2 Step -1
wb.Sheets(i).Delete
Next i
wb.Sheets(1).Name = "Sheet1"
' insert random numbers into sheet
Set ws = wb.Worksheets(1)
Set cell = ws.[A4]
ws.[a1] = "Data for " & dat
If Not rndInit Then InitRandomnumbers
DailyRandomnumbers
Application.Calculation = xlManual
For i = 1 To 96 '00:00 through 23:45
z = dat + CDbl(#12:15:00 AM#) * (i - 1)
cell.Cells(i, 1) = z
cell.Cells(i, 1).NumberFormat = "hh:mm"
For j = 1 To 5 'five series of data
x = rndmat(j, 0)
For k = 1 To 18 Step 3
x = x + rndmat(j, k) * (1 + Sin(rndmat(j, k + 1) * z + _
rndmat(j, k + 2)))
Next k
cell.Cells(i, j + 1) = x
Next j
Charts and Drawing Objects (Shapes)
549
*1038_ch10_CMP3 6/21/03 10:56 AM Page 549
Next i
Application.Calculation = xlAutomatic
Application.DisplayAlerts = True
On Error Resume Next
' delete existing file
If Dir(filename)<>"" Then Kill filename
wb.SaveAs filename
wb.Close False
If Err = 0 Then
GenerateDailyWorksheet = True
Else
MsgBox "An error has occured: " & Error
GenerateDailyWorksheet = False
End If
End Function
NOTE It happens again and again with automated measuring processes thatdue to some error, data are missing for a period of time (hours, or even days).In the procedure above, error simulation was not implemented. However, thereporting in DailyReport and MonthlyReport will continue to function if yousimply delete some of the data from the generated files. But be careful in thecalculation of average values. Missing measurements must not be taken to bezero values. The Excel worksheet function AVERAGE behaves admirably inthis case and considers only those cells in the given range that are not empty.Only when all of the measurements of an averaging range are missing does itreturn the error result “division by 0.”
Daily Report
The daily report contains three charts, in which the exact course of the measure-ments is presented. Here the curves A1, A2, A3 are united in a single chart. So thatcharts from several days can be compared easily, a uniform scaling is required. For this reason the Y range is set with a fixed range of 0 to 300. (Normally, Excelchanges the scaling automatically and fits it to the values that actually occur.)Integrated into the daily report are a tabular overview of the daily average valuesand the daily maximum of the five curves.
The daily report for a given date is created by the procedure DailyProtocol.The charts are created completely in program code and inserted into the work-sheet “DailyReport.” Any existing charts in this worksheet (from the previousreport) are first deleted.
Chapter 10
550
*1038_ch10_CMP3 6/21/03 10:56 AM Page 550
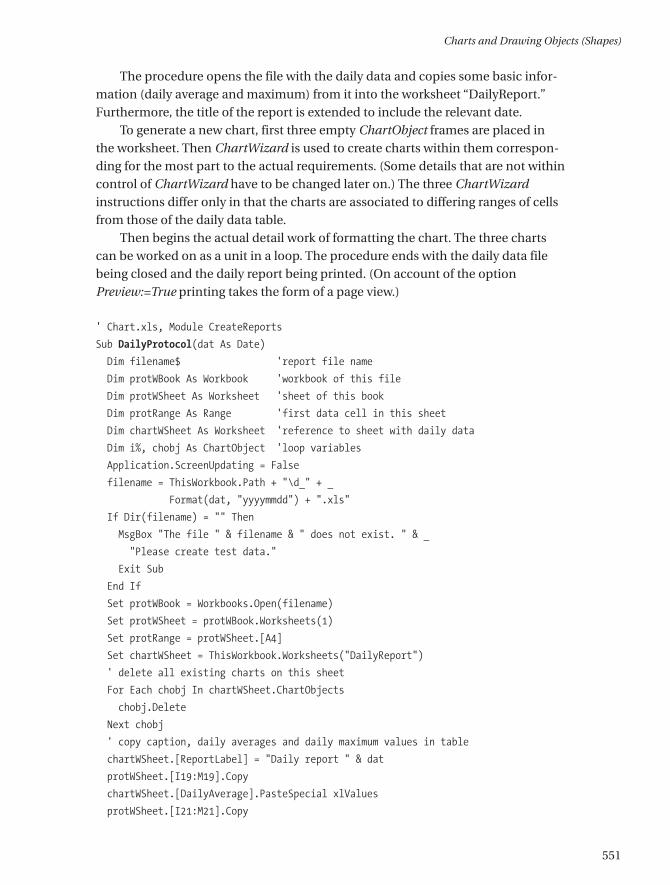
The procedure opens the file with the daily data and copies some basic infor-mation (daily average and maximum) from it into the worksheet “DailyReport.”Furthermore, the title of the report is extended to include the relevant date.
To generate a new chart, first three empty ChartObject frames are placed inthe worksheet. Then ChartWizard is used to create charts within them correspon-ding for the most part to the actual requirements. (Some details that are not withincontrol of ChartWizard have to be changed later on.) The three ChartWizardinstructions differ only in that the charts are associated to differing ranges of cellsfrom those of the daily data table.
Then begins the actual detail work of formatting the chart. The three chartscan be worked on as a unit in a loop. The procedure ends with the daily data filebeing closed and the daily report being printed. (On account of the option Preview:=True printing takes the form of a page view.)
' Chart.xls, Module CreateReports
Sub DailyProtocol(dat As Date)
Dim filename$ 'report file name
Dim protWBook As Workbook 'workbook of this file
Dim protWSheet As Worksheet 'sheet of this book
Dim protRange As Range 'first data cell in this sheet
Dim chartWSheet As Worksheet 'reference to sheet with daily data
Dim i%, chobj As ChartObject 'loop variables
Application.ScreenUpdating = False
filename = ThisWorkbook.Path + "\d_" + _
Format(dat, "yyyymmdd") + ".xls"
If Dir(filename) = "" Then
MsgBox "The file " & filename & " does not exist. " & _
"Please create test data."
Exit Sub
End If
Set protWBook = Workbooks.Open(filename)
Set protWSheet = protWBook.Worksheets(1)
Set protRange = protWSheet.[A4]
Set chartWSheet = ThisWorkbook.Worksheets("DailyReport")
' delete all existing charts on this sheet
For Each chobj In chartWSheet.ChartObjects
chobj.Delete
Next chobj
' copy caption, daily averages and daily maximum values in table
chartWSheet.[ReportLabel] = "Daily report " & dat
protWSheet.[I19:M19].Copy
chartWSheet.[DailyAverage].PasteSpecial xlValues
protWSheet.[I21:M21].Copy
Charts and Drawing Objects (Shapes)
551
*1038_ch10_CMP3 6/21/03 10:56 AM Page 551
chartWSheet.[DailyMax].PasteSpecial xlValues
' create three charts
For i = 1 To 3
chartWSheet.ChartObjects.Add(30, 150 + 200 * (i - 1), 400, 185). _
Name = "Daily data " & i
chartWSheet.ChartObjects("Daily data " & i).Activate
If i = 1 Then
ActiveChart.ChartWizard protWSheet.[A3:D99], _
xlLine, 4, xlColumns, 1, 1
ElseIf i = 2 Then
ActiveChart.ChartWizard protWSheet.[A3:A99,E3:E99], _
xlLine, 4, xlColumns, 1, 1
ElseIf i = 3 Then
ActiveChart.ChartWizard protWSheet.[A3:A99,F3:F99], _
xlLine, 4, xlColumns, 1, 1
End If
Next i
' format charts
For Each chobj In chartWSheet.ChartObjects
chobj.Border.LineStyle = xlNone 'no border for entire chart
With chobj.Chart
.HasTitle = False 'no title
.PlotArea.Border.LineStyle = xlAutomatic 'border
.PlotArea.Interior.ColorIndex = xlNone 'no pattern/fill
.Axes(xlCategory).TickLabelSpacing = 8
.Axes(xlCategory).TickMarkSpacing = 4 'x axis
.Axes(xlValue).MinimumScale = 0 'y axis
.Axes(xlValue).MaximumScale = 300
.Axes(xlCategory).TickLabels.Orientation = 45 '45 degrees
.Axes(xlCategory).TickLabels.NumberFormat = "h:mm AM/PM"
For i = 1 To .SeriesCollection.Count 'format data
.SeriesCollection(i).Border.ColorIndex = 1 ' series
.SeriesCollection(i).Border.Weight = xlThin
.SeriesCollection(i).Border.LineStyle = xlContinuous
.SeriesCollection(i).MarkerStyle = xlNone
Next i
If .SeriesCollection.Count > 2 Then 'distinguish
.SeriesCollection(2).Border.LineStyle = xlDot ' 2nd and 3rd
.SeriesCollection(3).Border.LineStyle = xlDash ' series
End If
' diagram size, legend size
.PlotArea.Left = 5: .PlotArea.Top = 5
.PlotArea.Width = 290
Chapter 10
552
*1038_ch10_CMP3 6/21/03 10:56 AM Page 552
.PlotArea.Height = 140
.Legend.Left = 340
.Legend.Width = 50
.Legend.Border.LineStyle = xlNone
End With
Next chobj
ActiveWindow.Visible = False 'deactivate chart
protWBook.Close
chartWSheet.PrintOut Preview:=True
End Sub
Monthly Report
The monthly reports are somewhat more lavishly decked out than the dailyreports, taking three pages in all. The first side consists of an overview of all dailyaverage and maximum values as well as the resulting monthly averages and maxima. The next page contains three charts, and the last page sports two charts.These show the progression of the average and maximum values. The curves forthe averages have been smoothed (click on the curve, open the pop-up menu FORMAT DATA SERIES|PATTERNS, option SMOOTHED LINE). Figure 10-7 shows the sec-ond page of the monthly report with the curves for the measurement values A1through A3.
For generating the monthly report we have chosen a method completely differ-ent from that used for the daily report. The charts were inserted (with the mouse)into the worksheet “MonthlyReport” and are not touched at all by the procedureMonthlyProtocol. MonthlyProtocol merely changes those data cells that the finishedchart accesses.
This way of proceeding has advantages and disadvantages. The advantage isthat the programming effort is greatly reduced. Thus you can achieve good resultswith minimal experience in programming charts. The disadvantages become evi-dent when you attempt to generate five identical charts by mouse click. This isalmost as much effort as the programming (even if you first create a chart, andthen copy it and change only the ranges of cells of the data series). Furthermore,this way of proceeding is possible only if the chart, as in this example, is to a greatextent independent of the data. However, if such items as the number of dataseries, the number of data points, and the range of values of the data series canvary, then there is no avoiding “real” programming.
Charts and Drawing Objects (Shapes)
553
*1038_ch10_CMP3 6/21/03 10:56 AM Page 553
REMARKS The charts assume a month of 31 days. In the case of months withfewer days there are one to three empty data points. Thus the space availablefor the chart is not used to full capacity, but in exchange there is a distinctadvantage: The scaling of the X-axis is independent of the number of days inthe month. The charts are thereby more comparable.
Onward to the program code, which for the reasons cited above contains not asingle line of instructions that typically apply to charts. The procedure is rather anexample of how data from up to 31 files can be consolidated in a single table. Theindividual files are not opened, but rather direct access to individual cells of otherworksheets is made via formulas of type =’C:\Test\[D_20000101.XLS]Sheet1’!$L$19.This form of data access proceeds surprisingly quickly. The creation of themonthly report takes only a little longer than that of the daily report.
The most complicated part of the procedure relates to the creation of theseformulas, which are inserted into the worksheet by changing the FormulaR1C1property of the affected cells. The formulas must be created relatively laboriouslyas character strings. The R1C1 format is better suited for such tasks, because atleast there is no transformation from column numbers into letters.
Sub MonthlyProtocol(dat As Date)
Dim sdat As Date, edat As Date 'start and end date
Dim nrdays As Integer 'number of days
Dim filename$ 'name of report file
Dim chartWSheet As Worksheet 'sheet of report file
Dim chartRange As Range 'first data cell
Dim z As Date, i%, j% 'loop variables
sdat = DateSerial(Year(dat), Month(dat), 1)
nrdays = DateSerial(Year(dat), Month(dat) + 1, 1) - _
DateSerial(Year(dat), Month(dat), 1)
edat = dat + nrdays - 1
ThisWorkbook.Activate
Set chartWSheet = ThisWorkbook.Worksheets("MonthlyReport")
chartWSheet.Activate
chartWSheet.[a1].Select
Set chartRange = chartWSheet.[B9]
' build monthly table
Application.Calculation = xlManual
chartWSheet.[B1] = "Monthly report " & Format(dat, "mmmm yyyy")
For i = 1 To nrdays
z = dat + i - 1
Chapter 10
554
*1038_ch10_CMP3 6/21/03 10:56 AM Page 554
chartRange.Cells(i, 1) = z
filename = ThisWorkbook.Path + "\d_" + _
Format(z, "yyyymmdd") & ".xls"
If Dir(filename) = "" Then
For j = 1 To 5
chartRange.Cells(i, 1 + j).FormulaR1C1 = ""
chartRange.Cells(i, 7 + j).FormulaR1C1 = ""
Next j
Else
filename = "='" & ThisWorkbook.Path + "\[d_" + _
Format(z, "yyyymmdd") & ".xls]Sheet1'"
For j = 1 To 5
chartRange.Cells(i, 1 + j).FormulaR1C1 = _
filename & "!R19C" & 8 + j
chartRange.Cells(i, 7 + j).FormulaR1C1 = _
filename & "!R21C" & 8 + j
Next j
End If
Next i
If nrdays < 31 Then
For i = nrdays + 1 To 31
For j = 1 To 12
chartRange.Cells(i, j).ClearContents
Next j
Next i
End If
Application.Calculate
chartWSheet.Range("B9:M39").Copy
chartWSheet.Range("B9:M39").PasteSpecial Paste:=xlValues
Application.CutCopyMode = False
chartWSheet.PrintOut Preview:=True
Application.Calculation = xlAutomatic
End Sub
After all references have been inserted into the worksheet and the worksheetrecalculated, the entire range of cells is copied to the clipboard. Then, with PasteSpecial only the numerical values (instead of the formulas) are pasted. Thisprocess saves memory and increases the speed of further processing. Further-more, it does not occur to Excel to ask at the next opportunity whether it shouldupdate the existing references.
Charts and Drawing Objects (Shapes)
555
*1038_ch10_CMP3 6/21/03 10:56 AM Page 555
The procedure ends, like DailyProtocol, with printing the worksheet togetherwith the five charts contained therein. Furthermore, in the page layout of theworksheet (FILE|PAGE SETUP) “none” is selected for the header, and for the footerthe page number is inserted (since the report always contains three pages).
Menu Management
The management of the menus has nothing new about it in comparison to whathas been discussed in earlier chapters, for this reason we have not included the code here for the event procedures. The menu is realized as an independent CommandBar object. It is made visible in Workbook_Open when Chart.xls isopened, and is hidden again in Workbook_BeforeClose.
Dialog Management
The form FormDateInput is used universally for the three commands REPORT|CREATE TEST DATA, …|DAILY REPORT, and …|MONTHLY REPORT. The text in thetext box lblInfo is changed according to the purpose for which it is to be used. With the procedures ProtocolMenu_GenerateNewFiles, _DailyProtocol, and_MonthlyProtocol, of which only one is reproduced here, the text in the text boxes txtFrom and txtTo is preset.
The two dates can be increased or decreased with spin buttons. The values arepreset to 0, and the permissible range is from –1000 to 1000. Therefore, you cantheoretically change the date by ±1000 days. (Theoretically, because you wouldnot have the patience to keep pushing the button. Much quicker is simply to inputthe date via the keyboard.)
' Chart.xls, Module MenuEvents
Sub ChartSampleMenu_MonthlyProtocol()Dim dat As Date, lastmonth As Integer
lastmonth = -1
With FormDateInput
.dat1 = DateSerial(Year(Now), Month(Now), 1)
.dat2 = DateSerial(Year(Now), Month(Now), _
DateSerial(Year(Now), Month(Now) + 1, 1) - _
DateSerial(Year(Now), Month(Now), 1))
.txtFrom = CStr(.dat1)
.txtTo = CStr(.dat2)
.spinTo = 0
.spinFrom = 0
Chapter 10
556
*1038_ch10_CMP3 6/21/03 10:56 AM Page 556
.lblInfo = "Date range for which monthly reports will be " & _
"created and printed."
.Show
If .result = False Then Exit Sub
' create report
Application.ScreenUpdating = False
Application.DisplayStatusBar = True
For dat = CDate(.txtFrom) To CDate(.txtTo)
If lastmonth <> Month(dat) Then
Application.StatusBar = "Create monthly report for " & _
Format(dat, "mmmm yyyy")
MonthlyProtocol CDate(dat)
lastmonth = Month(dat)
End If
Next dat
Application.StatusBar = False
Application.DisplayStatusBar = False
End With
End Sub
If the input is terminated with OK and if in btnOK_Click no input error is dis-covered, then a loop runs through all the days of the date range. Each time themonth changes, MonthlyProtocol is called. Admittedly, the algorithm has not beenoverly carefully programmed, but it is surely the simplest solution that functionsfor arbitrary time intervals (even for more than twelve months). A calculation ofthe first day of each new month would probably require more time than simplyrunning through all the days. In any case, it would have required more thought inthe programming, and programmers are known not always to be in the mood forheavy-duty thinking.
The actual form event procedures turn out to be comparatively short and triv-ial. Note that the spin button is not synchronized when a new date is input via thekeyboard. For this reason it is impossible to input a date via the keyboard and thenchange it with the spin button.
' event procedure for the form for date input
Option Explicit
Public result As Boolean, dat1 As Date, dat2 As Date
Private Sub btnCancel_Click()result = False
Hide
End Sub
Private Sub btnOK_Click()If IsDate(txtFrom) And IsDate(txtTo) Then
Charts and Drawing Objects (Shapes)
557
*1038_ch10_CMP3 6/21/03 10:56 AM Page 557
result = True
Hide
Else
MsgBox "Invalid date!!"
End If
End Sub
Private Sub spinFrom_Change()txtFrom = CStr(dat1 + spinFrom)
End Sub
Private Sub spinTo_Change()txtTo = CStr(dat2 + spinTo)
End Sub
10.4 Syntax Summary for Charts
This section collects almost all the truly important chart objects, methods, andproperties. A summary of the object hierarchy of all chart objects appears inChapter 15. There, all objects are also briefly described. In the following syntaxboxes we have used the following abbreviations: wb for a Workbook object, wsfor a Worksheet object, chobj for a ChartObject object, and ch for a Chart object.
CHART OBJECTS
ws.ChartObjects(..) select embedded chart object
ws.ChartObjects.Add .. new (empty) chart frame
chobj.Select corresponds to a single mouse click
chobj.Activate corresponds to a single mouse click
ActiveWindow.Visible = False deactivate
chobj.Chart refers to a chart object
chobj.Copy copy chart object together with chart
ws.Paste: Selection.Name = “..” insert chart object together with chart
chobj.Duplicate.Name = “..” duplicate existing chart object
chobj.Delete delete chart object together with chart
Chapter 10
558
*1038_ch10_CMP3 6/21/03 10:56 AM Page 558
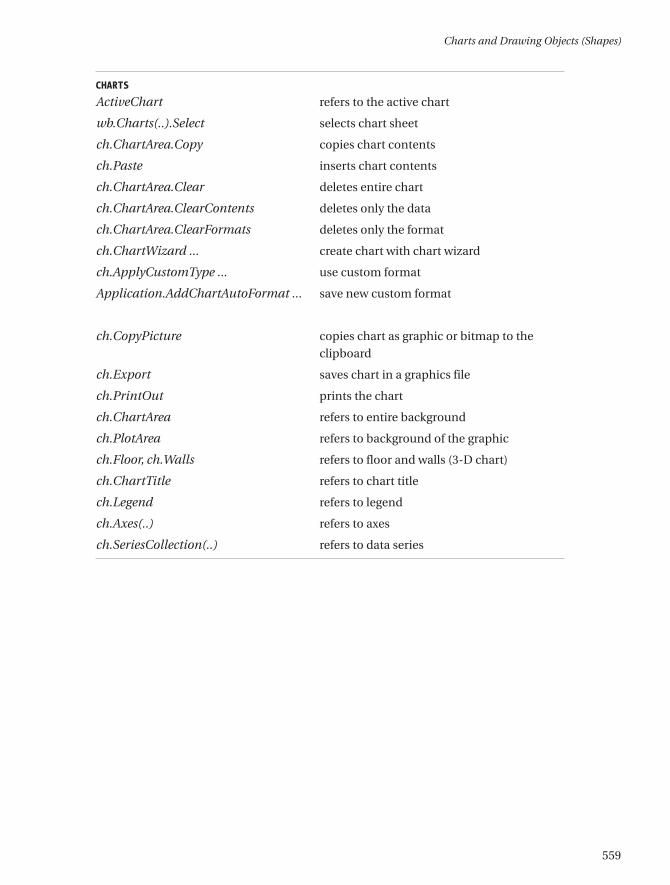
CHARTS
ActiveChart refers to the active chart
wb.Charts(..).Select selects chart sheet
ch.ChartArea.Copy copies chart contents
ch.Paste inserts chart contents
ch.ChartArea.Clear deletes entire chart
ch.ChartArea.ClearContents deletes only the data
ch.ChartArea.ClearFormats deletes only the format
ch.ChartWizard ... create chart with chart wizard
ch.ApplyCustomType ... use custom format
Application.AddChartAutoFormat ... save new custom format
ch.CopyPicture copies chart as graphic or bitmap to the
clipboard
ch.Export saves chart in a graphics file
ch.PrintOut prints the chart
ch.ChartArea refers to entire background
ch.PlotArea refers to background of the graphic
ch.Floor, ch.Walls refers to floor and walls (3-D chart)
ch.ChartTitle refers to chart title
ch.Legend refers to legend
ch.Axes(..) refers to axes
ch.SeriesCollection(..) refers to data series
Charts and Drawing Objects (Shapes)
559
*1038_ch10_CMP3 6/21/03 10:56 AM Page 559
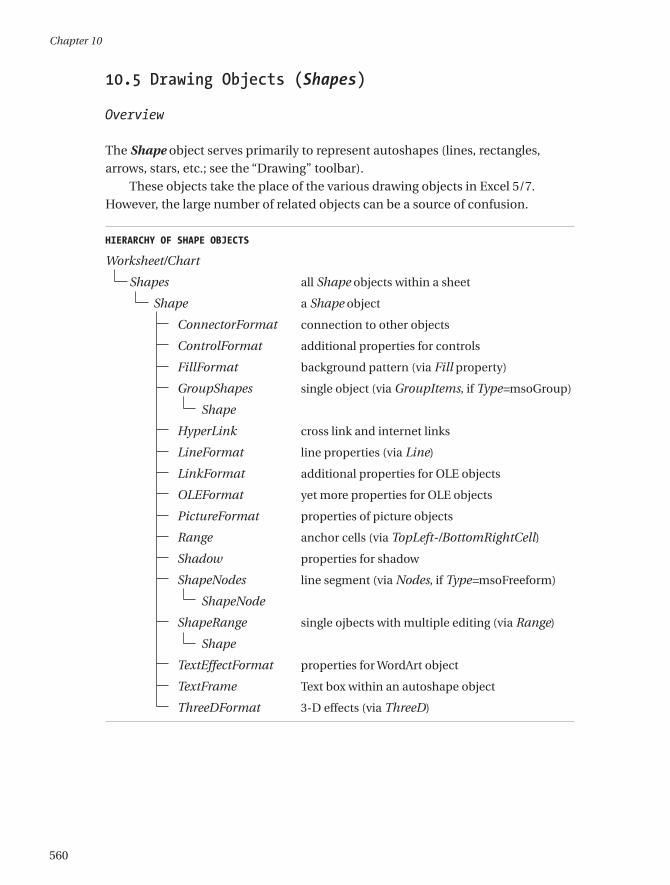
10.5 Drawing Objects (Shapes)
Overview
The Shape object serves primarily to represent autoshapes (lines, rectangles,arrows, stars, etc.; see the “Drawing” toolbar).
These objects take the place of the various drawing objects in Excel 5/7. However, the large number of related objects can be a source of confusion.
HIERARCHY OF SHAPE OBJECTS
Worksheet/Chart
Shapes all Shape objects within a sheet
Shape a Shape object
ConnectorFormat connection to other objects
ControlFormat additional properties for controls
FillFormat background pattern (via Fill property)
GroupShapes single object (via GroupItems, if Type=msoGroup)
Shape
HyperLink cross link and internet links
LineFormat line properties (via Line)
LinkFormat additional properties for OLE objects
OLEFormat yet more properties for OLE objects
PictureFormat properties of picture objects
Range anchor cells (via TopLeft-/BottomRightCell)
Shadow properties for shadow
ShapeNodes line segment (via Nodes, if Type=msoFreeform)
ShapeNode
ShapeRange single ojbects with multiple editing (via Range)
Shape
TextEffectFormat properties for WordArt object
TextFrame Text box within an autoshape object
ThreeDFormat 3-D effects (via ThreeD)
Chapter 10
560
*1038_ch10_CMP3 6/21/03 10:56 AM Page 560
The Shapes enumeration enables access to all Shape objects of a worksheet orchart sheet. For the insertion of new drawing objects there is a long list of methodsavailable, such as AddShape for autoshapes and AddLine for lines.
ShapeRange enables the simultaneous editing of several Shape objects (as ifthese objects were selected with Shift and the mouse).
Freehand shapes (that is, freely drawn line segments) represent a particularform of Shape objects. In this case, the property ShapeNodes refers to a like-namedenumeration of ShapeNode objects. These objects contain, among other attrib-utes, coordinate points of the individual line segments.
A Shape object is also used for managing a so-called group (in interactivemode: pop-up menu command GROUPING). In this case the property GroupItemsleads to a GroupShape object, which, in turn, takes over the management of thegroup elements. Group elements can include not only Shape objects, but alsocharts and OLE objects, among others.
Finally, Shape is used to manage completely foreign objects, such as for MSForms control objects (Type=msoOLEControlObject). In this case, Shape standsbetween the worksheet or chart sheet and the actual object. Shape is then con-cerned, among other things, with the positioning of the control. For communica-tion between the sheet and the control the ControlFormat object is employed,which is addressed via the like-named property of Shape. ControlFormat is gener-ally transparent, because its properties appear in the properties window of thecontrol and can be used like control properties.
Shape Properties
AutoShapeType: The two most important properties are surely Type andAutoShapeType. If Type=msoAutoShape is set, then with AutoShapeType one ofcountless autoshape types can be specified (there are more than 130). On theother hand, if no autoshape is represented by the Shape object, then the objecttype is specified by the msoShapeType constants. Elements such as msoChart,msoComment, msoEmbeddedOLEObject, msoFreeForm, msoGroup, msoOLEControlObject, and msoTextBox prove that internally to Excel every object that is located outside of a cell is controlled by Shape objects.
Positioning: For each object is saved the upper left corner (Left and Top) aswell as the width and height (Width and Height). These coordinates are figuredfrom the upper left-hand corner of the form or worksheet. TopLeftCell and BottomRightCell specify the cells under the upper left-hand corner and lowerright-hand corner. Placement determines how the control should behave whenthe worksheet is changed (xlMoveAndSize, xlMove, or xlFreeFloating).
Charts and Drawing Objects (Shapes)
561
*1038_ch10_CMP3 6/21/03 10:56 AM Page 561
Format: The possibilities for visual appearance are practically without bound.Each of the following properties leads to a particular object (whose name is givenin parentheses if it is different from that of the property): Adjustments, Callout(CalloutFormat), Fill (FillFormat), Hyperlink, Line (LineFormat), PictureFormat,Shadow (ShadowFormat), TextEffect (TextEffectFormat), TextFrame, and ThreeD(ThreeDFormat). Perhaps this superfluity of objects is too much of a good thing.
Other: Depending on which objects are represented by Shape, there are further properties available: ConnectorFormat (if the object is bound to otherobjects), ControlFormat (for controls), GroupItems (for object groups), Nodes (for freehand objects), as well as LinkFormat and OLEFormat (for OLE objects).
POINTER Note that the Shape objects are defined in the Excel library, but theassociated constants in the Office library. When old Excel 5/7 files are opened,the Office library is not activated under normal circumstances. This must beaccomplished with TOOLS|REFERENCES.
Example
The drawing objects in Figure 10-8 were created with the loop in btnShowAllAutoShapes_Click. And now a word about the syntax of AddShape: The first parameter specifies the autoshape type (1 through 37), while the follow-ing four parameters determine the location (Left/Top) and size (Width/Height) ofthe object. The coordinate system begins in the upper left-hand corner of theworksheet.
' Shapes.xls, Sheet1
Private Sub btnShowAllAutoShapes_Click()Dim i&
For i = 0 To 136
ActiveSheet.Shapes.AddShape i + 1, _
40 + 50 * (i Mod 12), 50 + 50 * (i \ 12), 40, 40
Next
End Sub
Chapter 10
562
*1038_ch10_CMP3 6/21/03 10:56 AM Page 562
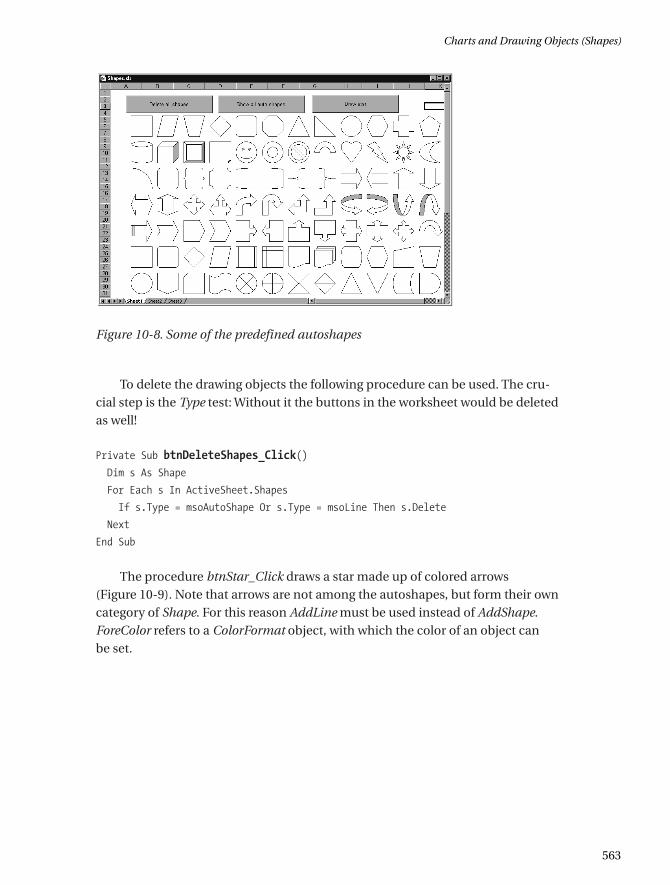
Figure 10-8. Some of the predefined autoshapes
To delete the drawing objects the following procedure can be used. The cru-cial step is the Type test: Without it the buttons in the worksheet would be deletedas well!
Private Sub btnDeleteShapes_Click()Dim s As Shape
For Each s In ActiveSheet.Shapes
If s.Type = msoAutoShape Or s.Type = msoLine Then s.Delete
Next
End Sub
The procedure btnStar_Click draws a star made up of colored arrows (Figure 10-9). Note that arrows are not among the autoshapes, but form their owncategory of Shape. For this reason AddLine must be used instead of AddShape.ForeColor refers to a ColorFormat object, with which the color of an object can be set.
Charts and Drawing Objects (Shapes)
563
*1038_ch10_CMP3 6/21/03 10:56 AM Page 563
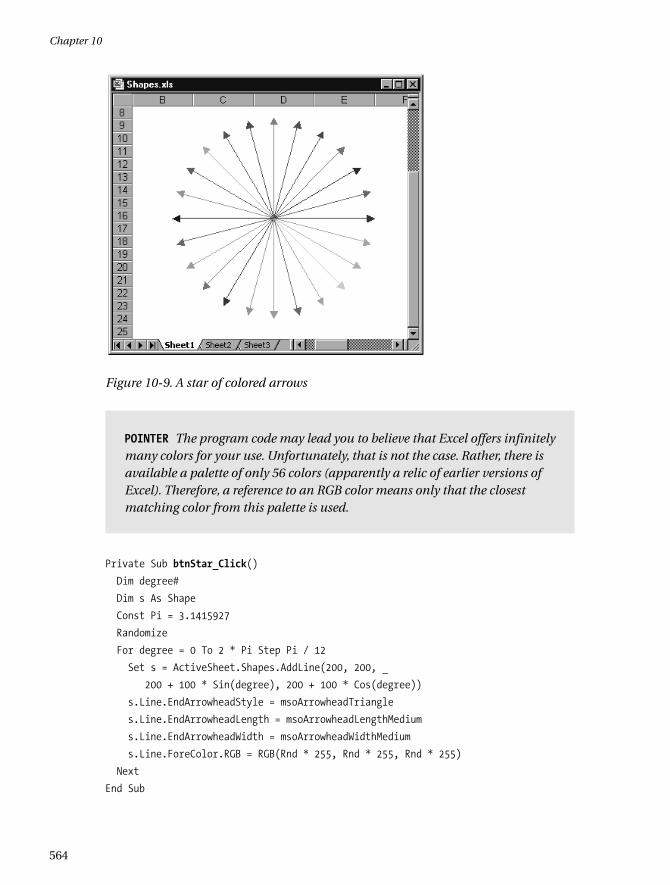
Figure 10-9. A star of colored arrows
POINTER The program code may lead you to believe that Excel offers infinitelymany colors for your use. Unfortunately, that is not the case. Rather, there isavailable a palette of only 56 colors (apparently a relic of earlier versions ofExcel). Therefore, a reference to an RGB color means only that the closestmatching color from this palette is used.
Private Sub btnStar_Click()
Dim degree#
Dim s As Shape
Const Pi = 3.1415927
Randomize
For degree = 0 To 2 * Pi Step Pi / 12
Set s = ActiveSheet.Shapes.AddLine(200, 200, _
200 + 100 * Sin(degree), 200 + 100 * Cos(degree))
s.Line.EndArrowheadStyle = msoArrowheadTriangle
s.Line.EndArrowheadLength = msoArrowheadLengthMedium
s.Line.EndArrowheadWidth = msoArrowheadWidthMedium
s.Line.ForeColor.RGB = RGB(Rnd * 255, Rnd * 255, Rnd * 255)
Next
End Sub
Chapter 10
564
*1038_ch10_CMP3 6/21/03 10:56 AM Page 564
10.6 Diagrams
Beginning with Excel 2002 you can use INSERT|DIAGRAM to insert an organizationchart or one of five additional types of diagram into an Excel worksheet (cycle dia-gram, radial diagram, pyramid diagram, Venn diagram, and target diagram). Thesediagrams appear in a basic format and can be enhanced with your own text, for-matting, and additional subobjects. In working with diagrams the ORGANIZATION
CHART toolbars are helpful (only for organization charts), as well as the DIAGRAM
toolbar (for the other five diagram types).To create or edit a diagram in VBA code, you must use the new DiagramXxx
objects, which are the focus of this section: Diagram describes an entire diagram,while DiagramNode refers to one of the diagram’s elements. The enumerationsDiagramNodes and DiagramNodeChildren help in the management of diagramelements.
TIP Before you set out on the great adventure of programming diagrams,here are a few tips:
• Macro recording does not work either in creating or in editing a diagram.This makes the creation of Diagram objects a labor-intensive process.
• The Diagram objects themselves do not seem to be quite mature. As a partic-ularly obvious example, diagrams that you create yourself cannot be giventitles, and the title of an existing diagram cannot be changed.
• Save your project often! In the course of my experimentation I have sufferednumerous crashes.
Creating Diagrams
To create a new diagram, use the method AddDiagram of the Shapes object. Youmust specify the desired diagram type (msoDiagramXxx constant) as well as thesize and location. As a result you receive a Shape object whose property Diagramrefers to a like-named Diagram object.
Dim s As Shape
Dim d As Diagram
Dim ws As Worksheet
Set ws = Worksheets(1)
Set s = ws.Shapes.AddDiagram(msoDiagramRadial, 10, 10, 200, 100)
Set d = s.Diagram
Charts and Drawing Objects (Shapes)
565
*1038_ch10_CMP3 6/21/03 10:56 AM Page 565
Inserting Diagram Elements
A new diagram, regardless of type, is originally empty. The next step consists in fill-ing the diagram with elements (with DiagramNode objects). It is annoying that theDiagram object refers, with the property Nodes, to a DiagramNodes enumeration,yet this enumeration does not, as is otherwise usual, have use of an Add method.
Finally, the example programs in the Help section show the only effective (yet completely illogical) way of proceeding: When you generate a new diagramwith AddDiagram, you receive a Shape object (as described earlier). For this objectone has the property DiagramNode, which refers to an object of this type. Appar-ently, together with each Diagram object an invisible and in some sense virtualdiagramNode object is generated that serves as the starting point for the additionof additional elements. (But note that DiagramNodes.Count returns 0.)
How one proceeds next depends on the type of diagram: In the case of organi-zation charts a root object must be created. All further objects are added as sub-objects (Children) of this root object. The following lines of code generate a radialdiagram with a circle in the middle (root) and three associated circles around it(child1 through child3).
' ws refers to a Worksheet object
' for msoDiagramRadial and msoDiagramOrgChart
Dim s As Shape
Dim root As DiagramNode, child1 As DiagramNode, _
child2 As DiagramNode, child3 As DiagramNode
Set s = ws.Shapes.AddDiagram(msoDiagramRadial, 10, 10, 200, 100)
Set startnode = s.DiagramNode
Set root = startnode.Children.AddNode
Set child1 = root.Children.AddNode
Set child2 = root.Children.AddNode
Set child3 = root.Children.AddNode
With the other diagram types, however, all diagram objects are at the samelevel. The next example shows how a four-part pyramid diagram is generated:
' msoDiagramPyramid, msoDiagramCycle, msoDiagramTarget, msoDiagramVenn
Dim s As Shape
Dim child1 As DiagramNode, child2 As DiagramNode, _
child3 As DiagramNode, child4 As DiagramNode
Set s = ws.Shapes.AddDiagram(msoDiagramPyramid, 10, 10, 200, 100)
Set startnode = s.DiagramNode
Set child1 = startnode.Children.AddNode
Set child2 = child1.AddNode
Set child3 = child1.AddNode
Set child4 = child1.AddNode
Chapter 10
566
*1038_ch10_CMP3 6/21/03 10:56 AM Page 566
Providing Labels for Diagram Elements
The text of a diagram element is managed via a TextFrame object (see the previoussection). Beginning with a DiagramNode object, the following list of propertiesresults in the text property: child1.TextShape.TextFrame.Characters.Text.
The great problem is that a change in Text in Excel 2002 is not easily achiev-able. (Even the use of the alternative property Caption or the method Insert doesnot help.) That this error has not even been documented (let alone fixed) three-quarters of a year after the release of Excel 2002 leads one to believe that the newDiagramXxx objects have not caught the imagination of programmers.
Without the possibility of attaching labels to diagram elements, further pro-gramming makes no sense at all. One may hope that the many inconsistenciesplaguing the Diagram objects will be corrected in future versions of Excel.
Deleting Diagrams
There is no Delete method for Diagram objects. Instead, the underlying Shapeobject must be deleted. With the property HasShape you can test whether theShape object is being used to represent a diagram or for some other purpose. The following loop deletes the diagram in the first worksheet of a file:
Dim s As Shape
Dim ws As Worksheet
Set ws = Worksheets(1)
For Each s In ws.Shapes
If s.HasDiagram Then s.Delete
Next
Charts and Drawing Objects (Shapes)
567
*1038_ch10_CMP3 6/21/03 10:56 AM Page 567


![[MS-VBAL]: VBA Language SpecificationMS-VBAL].pdf · [MS-VBAL]: VBA Language Specification ... vba](https://img.pdfslide.net/doc/110x75/5e6b43c27f31a13cd8257e06/ms-vbal-vba-language-specification-ms-vbalpdf-ms-vbal-vba-language-specification.jpg)