Embed Size (px)
Citation preview
1
DEFLAGRATION SAFETY STUDY OF MIXTURES OF HYDROGEN AND NATURAL GAS IN A SEMI-OPEN SPACE
Merilo, E.G.1, and Groethe, M.A.1
1 Poulter Laboratory, SRI International, Menlo Park, CA, 94025, USA, [email protected]
ABSTRACT In the transition to a hydrogen economy it is likely that hydrogen will be used or stored in close proximity to other flammable fuels and gases. Accidents can occur that result in the release of two or more fuels, such as hydrogen and natural gas, that can mix and form a hazard. A series of five medium-scale semi-open-space deflagration experiments have been conducted with hydrogen, natural gas, and air mixtures. The natural gas consisted of 90% methane, 6% ethane, 3% propane, and 1% butane by volume. Mixtures of hydrogen and natural gas were created with the hydrogen mole fraction in the fuel varying from 1.000 to 0.897 and the natural gas mole fraction varying from 0.000 to 0.103. The hydrogen and natural gas mixture was then released inside a 5.27-m³ thin plastic tent. The stoichiometric fuel-air mixtures were ignited with a 40-J spark located at the bottom center of the tent. Overpressure and impulse data were collected using pressure transducers located within the mixture volume and in the free field. Flame front time-of-arrival was measured using fast response thermocouples and infrared video. Flame speeds, relative to a fixed observer, were measured between 36.2 m/s and 19.7 m/s. Average peak overpressures were measured between 2.0 kPa and 0.3 kPa. The addition of natural gas inhibited the combustion when the hydrogen mole fraction was less than or equal to 0.949. For these mixtures there was a significant decrease in overpressures. When the hydrogen mole fraction in the fuel was between 0.999 and 0.990, the overpressures were slightly higher than for the case of hydrogen alone. This could be due to experimental scatter, or there may be a slight enhancement of the combustion when a very small amount of natural gas was present. From a safety standpoint, variation in overpressure was small and should have little effect on safety considerations.
1.0 NOMENCLATURE
Co speed of sound, m/s
E energy, J
I impulse, kPa-s
Mf apparent flame Mach number
P pressure, Pa
Po ambient pressure, Pa
R range, m
Ro characteristic distance, m
XNG natural gas mole fraction
XH2 hydrogen mole fraction
Φ fuel equivalence ratio
2
2.0 INTRODUCTION
When the use of hydrogen fuel cell vehicles becomes more common, there will be several circumstances where hydrogen and other flammable fuels will be used and stored in close proximity. Vehicles using hydrocarbon-based fuels and vehicles using hydrogen will be on the roads and driving through confined spaces such as tunnels. This mix of vehicles will also be stored in personal and commercial garages when not in use. Many garages that are used for vehicle storage also contain natural gas or fuel oil-fired water heaters and furnaces. Volatile solvents of various kinds are often stored and used in the home garage. In some cases hydrogen may be mixed with natural gas intentionally in order to use existing infrastructure for distribution [1]. Accidents can occur that result in the release of two or more fuels, such as hydrogen and natural gas. It is therefore important to determine the fire and explosion risks associated with these mixtures. Enhancement of a deflagration may be possible for certain mixture ratios of these gases leading to higher overpressures and increased damage than from hydrogen or natural gas alone. It is important to characterize the deflagration properties of these mixtures and the magnitude of generated overpressures.
Research has been conducted on the combustion of hydrogen-methane mixtures and other hydrogen- hydrocarbon mixtures. Laminar burning velocity has been experimentally measured for different gas compositions and equivalency ratios (Φ) [2-5]. Computational simulations have been performed to model laminar burning velocity for hydrogen-methane mixtures over a wide range of conditions [3-7]. These studies show that for methane-rich mixtures, the addition of hydrogen enhances the combustion and for hydrogen-rich fuel mixtures, the addition of methane has an inhibiting effect on the hydrogen combustion. For hydrogen-methane mixtures, the laminar burning velocity decreases with the increase of the fuels’ methane mole fraction. The inhibitive effect of methane addition and the enhancement effect of hydrogen addition are caused by chemical effects dependent on H radicals [6,7].
For real-world accident scenarios and explosions, flame propagation is almost always turbulent. Computer simulations use the laminar burning velocity to model turbulent combustion [8] in the laminar flamelet approach. However, in order to validate and increase the accuracy of computer models it is also important to have experimental data for medium and large-scale deflagrations of flammable gas mixtures. The flame speeds and generated overpressures need to be measured in order to improve the accuracy of computer models and to improve risk assessment capabilities.
Unconfined deflagrations of hydrogen-natural gas mixtures with air have been studied in a semi-open space to obtain fundamental data needed for safety evaluations. The tests were performed in a 5.27-m3 prismatic tent made of thin plastic. Since the primary interest in these experiments was the measurement of the blast overpressure, the tests were used to investigate gas mixtures where small amounts of natural gas were added to hydrogen. Five experiments were performed with five different stoichiometric mixtures consisting of hydrogen-natural gas and air. The hydrogen mole fraction in the fuel (XH2) was varied from 1.000 to 0.897.
3.0 EXPERIMENTAL FACILITY
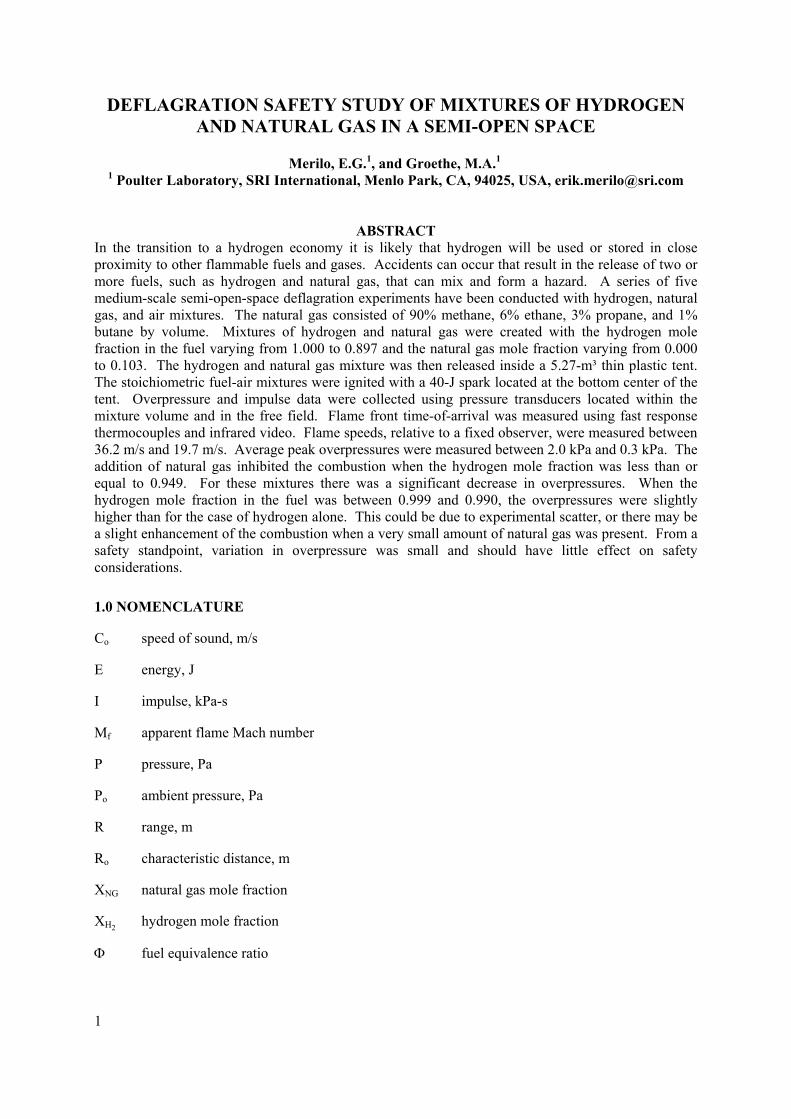
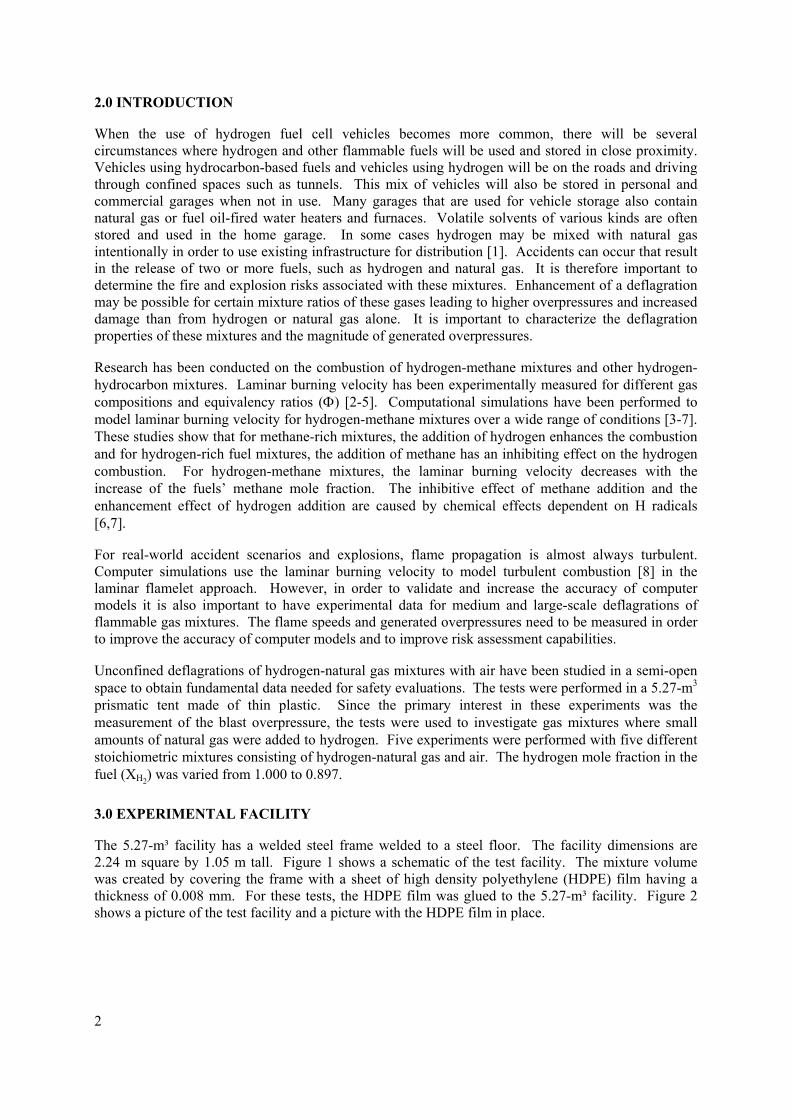
The 5.27-m³ facility has a welded steel frame welded to a steel floor. The facility dimensions are 2.24 m square by 1.05 m tall. Figure 1 shows a schematic of the test facility. The mixture volume was created by covering the frame with a sheet of high density polyethylene (HDPE) film having a thickness of 0.008 mm. For these tests, the HDPE film was glued to the 5.27-m³ facility. Figure 2 shows a picture of the test facility and a picture with the HDPE film in place.
Fill Point
Semi-Open Space Facility
Hydrogen Sensor
Sampling Tube
Sampling Tube Fan
Mixing Fans
TC1TC2TC3TC4
P1 P2 P3 P4
Thermocouple
Bridge Wire
Pressure Sensor
Valve 2Valve 1
Valve 3 Valve 4
Fill Point
Semi-Open Space Facility
Hydrogen Sensor
Sampling Tube
Sampling Tube Fan
Mixing Fans
TC1TC2TC3TC4
P1 P2 P3 P4
Thermocouple
Bridge Wire
Pressure Sensor
Valve 2Valve 1
Valve 3 Valve 4
Figure 1. Schematic of the experimental setup
Figure 2. 5.27-m3 source and free-field pressure transducers
The hydrogen and natural gas mixtures were created by first flowing natural gas from pressurized gas cylinders through a manifold into an evacuated gas cylinder. The cylinder had been evacuated with a rotary vane vacuum pump. The natural gas pressure was measured using an Ashcroft Bordon Tube precision pressure gauge. The pressure of the natural gas was allowed to stabilize, and the final pressure was recorded. Then pure hydrogen was bled into the cylinder until the desired pressure, as determined by the law of partial pressures, was reached. The total tank pressure was monitored using a Sensotec TJE precision pressure transducer. The gas mixture was allowed to stabilize, and the final pressure was recorded. Table 1 lists the hydrogen-natural gas mixtures used in the five experiments.
Table 1. Fuel mixture mole fractions
Fuel Mixture XH2 XNG
Test 1 1.000 0.000 Test 2 0.999 0.001 Test 3 0.990 0.010 Test 4 0.949 0.051 Test 5 0.897 0.103
The hydrogen and natural gas mixture was released into the tent facility and mixed to a homogeneous state by four mixing fans distributed throughout the mixture volume. The hydrogen concentration within the mixture volume was monitored by a mixture sampling tube. This sampling tube used an 3
4
internal fan to draw the hydrogen-natural gas and air mixture out of the mixture volume past an H2ScanTM palladium-nickel variable resistance hydrogen sensor and then returned the gas to the mixture volume. This sensor measures hydrogen concentration only and is unaffected by the presence of other gases. Therefore, the concentration in the tent was set by the hydrogen concentration inside the mixture volume. Table 2 lists the fuel-air mixtures used in each of the five tests. When the hydrogen concentration reached the desired level the hydrogen-natural gas release valve was turned off, and the fuel-air mixture was mixed for two minutes. The internal mixing fans were turned off, and the mixture sampling tube was closed 30 seconds prior to ignition. The mixture was ignited at the bottom center of the enclosure with a spark created by a standard DuPont bridgewire connected to a capacitive discharge unit (CDU). The total energy available from the CDU was about 40 J.
Table 2. Fuel concentrations in the mixture volume
Test XH2 Measured H2 Concentration
Fuel Concentration
Φ Energy (MJ)
1 1.000 29.8% 29.8% 1.01 15.12 2 0.999 29.6% 29.6% 1.01 15.81 3 0.990 28.6% 28.9% 1.00 15.93 4 0.949 25.4% 26.8% 1.00 15.60 5 0.897 22.3% 24.9% 1.02 16.36
The overpressure generated within the mixture volume was measured by a pressure transducer mounted flush on the floor of the facility 0.92 m from the ignition point. Three free-field pressure transducers mounted flush in the ground were used to measure the overpressure outside the mixture volume 3.85 m, 6.25 m, and 8.93 m from the ignition point. All four pressure measurements were made with PCB model 112M343 gages housing quartz crystal blast pressure sensors to measure static overpressure.
Flame front propagation in the facility was measured using four fast-response coaxial thermocouples. Medtherm coaxial thermocouples with a µs response time [9] were used to measure the flame front time of arrival (TOA). The thermocouples were evenly distributed at locations ranging from 0.25 m to 0.99 m from the center for source. The thermocouples were oriented so that the first thermal response would occur when the flame front reached the thermocouple junction; no heating by thermal radiation could occur prior to the flame's arrival. Each experiment was recorded with standard and infrared (IR) digital video recorders. Weather conditions at the test facility were monitored with a Davis Vantage Pro weather station.
4.0 TEST RESULTS
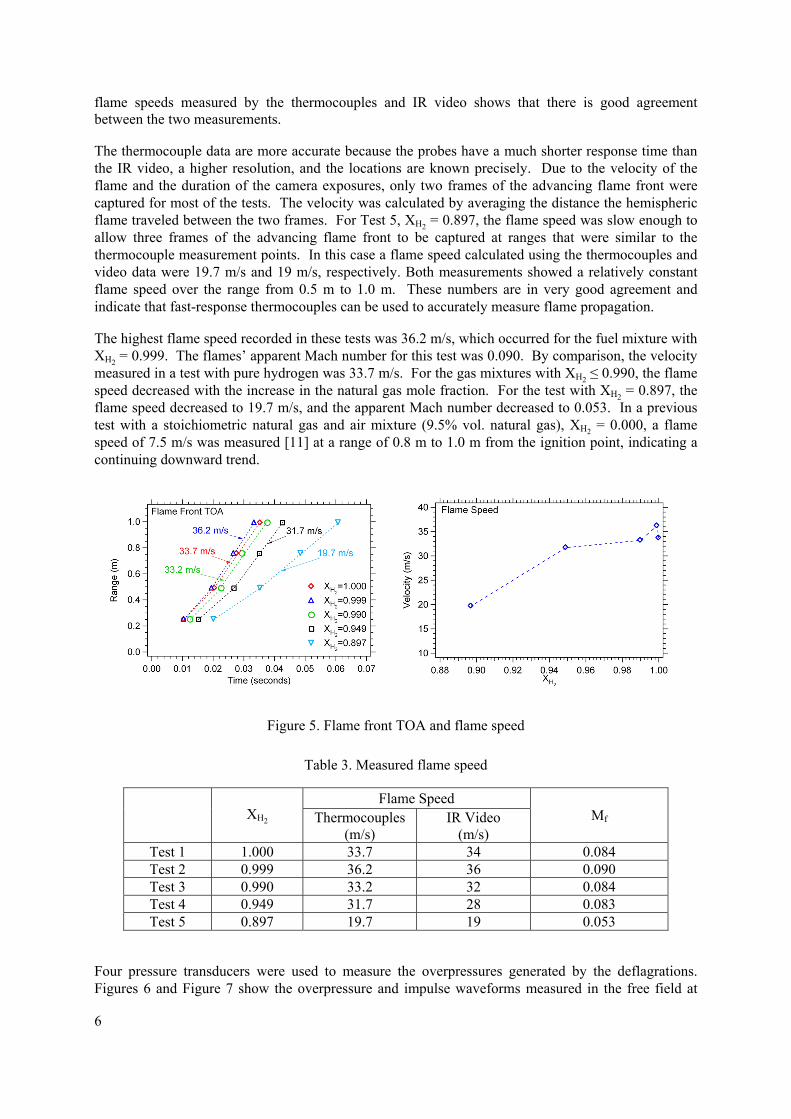
A total of five tests were conducted with stoichiometric mixtures of hydrogen, natural gas, and air. In these tests XH2 was varied from 1.000 to 0.897. Figure 3 and Figure 4 show standard and infrared video frames for tests with XH2 = 0.999 and XH2 = 0.897, respectively. For these two tests there is a very noticeable difference between the flame propagation speeds and intensity shown in the video frames.
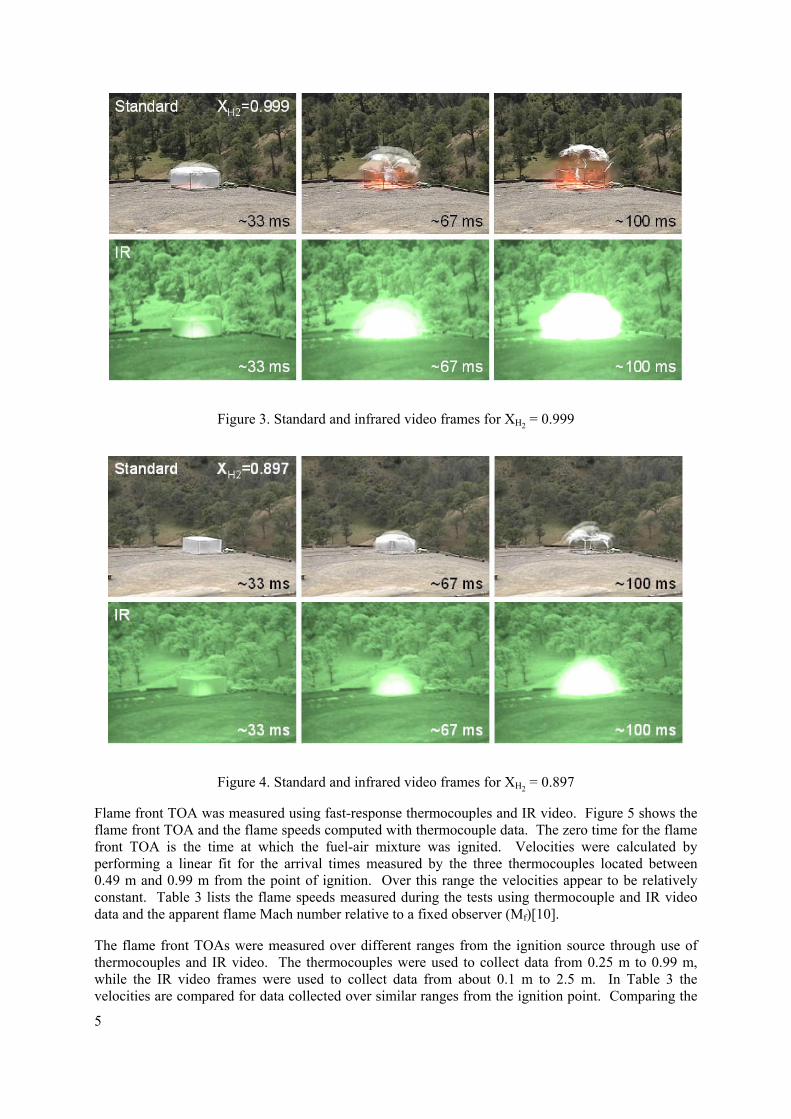
Figure 3. Standard and infrared video frames for XH2 = 0.999
Figure 4. Standard and infrared video frames for XH2 = 0.897
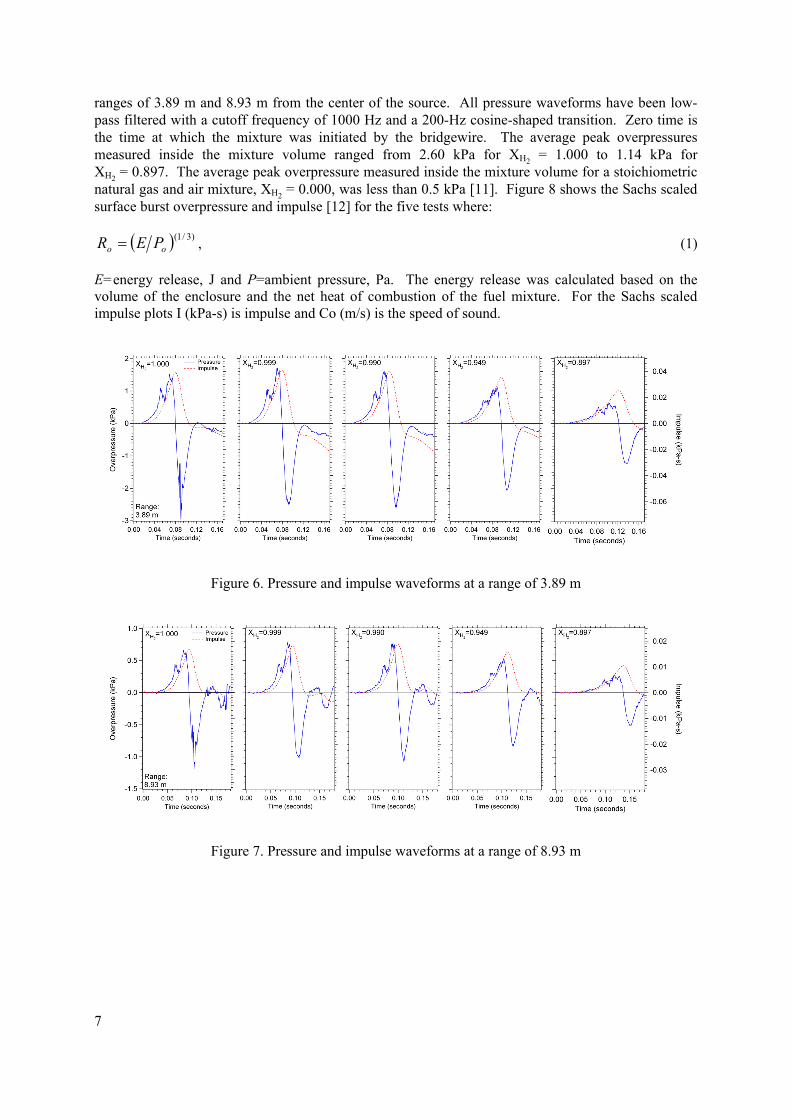
Flame front TOA was measured using fast-response thermocouples and IR video. Figure 5 shows the flame front TOA and the flame speeds computed with thermocouple data. The zero time for the flame front TOA is the time at which the fuel-air mixture was ignited. Velocities were calculated by performing a linear fit for the arrival times measured by the three thermocouples located between 0.49 m and 0.99 m from the point of ignition. Over this range the velocities appear to be relatively constant. Table 3 lists the flame speeds measured during the tests using thermocouple and IR video data and the apparent flame Mach number relative to a fixed observer (Mf)[10].
The flame front TOAs were measured over different ranges from the ignition source through use of thermocouples and IR video. The thermocouples were used to collect data from 0.25 m to 0.99 m, while the IR video frames were used to collect data from about 0.1 m to 2.5 m. In Table 3 the velocities are compared for data collected over similar ranges from the ignition point. Comparing the
5
flame speeds measured by the thermocouples and IR video shows that there is good agreement between the two measurements.
The thermocouple data are more accurate because the probes have a much shorter response time than the IR video, a higher resolution, and the locations are known precisely. Due to the velocity of the flame and the duration of the camera exposures, only two frames of the advancing flame front were captured for most of the tests. The velocity was calculated by averaging the distance the hemispheric flame traveled between the two frames. For Test 5, XH2 = 0.897, the flame speed was slow enough to allow three frames of the advancing flame front to be captured at ranges that were similar to the thermocouple measurement points. In this case a flame speed calculated using the thermocouples and video data were 19.7 m/s and 19 m/s, respectively. Both measurements showed a relatively constant flame speed over the range from 0.5 m to 1.0 m. These numbers are in very good agreement and indicate that fast-response thermocouples can be used to accurately measure flame propagation.
The highest flame speed recorded in these tests was 36.2 m/s, which occurred for the fuel mixture with XH2 = 0.999. The flames’ apparent Mach number for this test was 0.090. By comparison, the velocity measured in a test with pure hydrogen was 33.7 m/s. For the gas mixtures with XH2 ≤ 0.990, the flame speed decreased with the increase in the natural gas mole fraction. For the test with XH2 = 0.897, the flame speed decreased to 19.7 m/s, and the apparent Mach number decreased to 0.053. In a previous test with a stoichiometric natural gas and air mixture (9.5% vol. natural gas), XH2 = 0.000, a flame speed of 7.5 m/s was measured [11] at a range of 0.8 m to 1.0 m from the ignition point, indicating a continuing downward trend.
Figure 5. Flame front TOA and flame speed
Table 3. Measured flame speed
Flame Speed XH2 Thermocouples
(m/s) IR Video
(m/s) Mf
Test 1 1.000 33.7 34 0.084 Test 2 0.999 36.2 36 0.090 Test 3 0.990 33.2 32 0.084 Test 4 0.949 31.7 28 0.083 Test 5 0.897 19.7 19 0.053
Four pressure transducers were used to measure the overpressures generated by the deflagrations. Figures 6 and Figure 7 show the overpressure and impulse waveforms measured in the free field at
6
ranges of 3.89 m and 8.93 m from the center of the source. All pressure waveforms have been low-pass filtered with a cutoff frequency of 1000 Hz and a 200-Hz cosine-shaped transition. Zero time is the time at which the mixture was initiated by the bridgewire. The average peak overpressures measured inside the mixture volume ranged from 2.60 kPa for XH2 = 1.000 to 1.14 kPa for XH2 = 0.897. The average peak overpressure measured inside the mixture volume for a stoichiometric natural gas and air mixture, XH2 = 0.000, was less than 0.5 kPa [11]. Figure 8 shows the Sachs scaled surface burst overpressure and impulse [12] for the five tests where:
( ) )3/1(oo PER = , (1)
E=energy release, J and P=ambient pressure, Pa. The energy release was calculated based on the volume of the enclosure and the net heat of combustion of the fuel mixture. For the Sachs scaled impulse plots I (kPa-s) is impulse and Co (m/s) is the speed of sound.
Figure 6. Pressure and impulse waveforms at a range of 3.89 m
Figure 7. Pressure and impulse waveforms at a range of 8.93 m
7
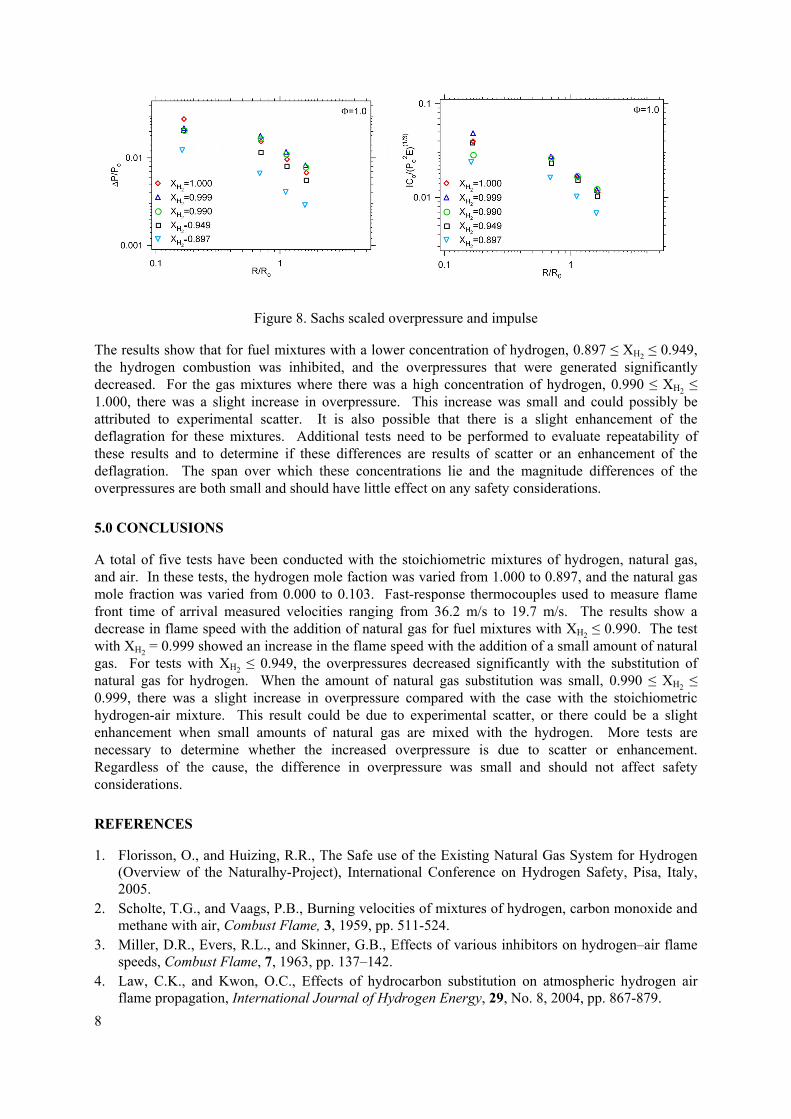
Figure 8. Sachs scaled overpressure and impulse
The results show that for fuel mixtures with a lower concentration of hydrogen, 0.897 ≤ XH2 ≤ 0.949, the hydrogen combustion was inhibited, and the overpressures that were generated significantly decreased. For the gas mixtures where there was a high concentration of hydrogen, 0.990 ≤ XH2 ≤ 1.000, there was a slight increase in overpressure. This increase was small and could possibly be attributed to experimental scatter. It is also possible that there is a slight enhancement of the deflagration for these mixtures. Additional tests need to be performed to evaluate repeatability of these results and to determine if these differences are results of scatter or an enhancement of the deflagration. The span over which these concentrations lie and the magnitude differences of the overpressures are both small and should have little effect on any safety considerations.
5.0 CONCLUSIONS
A total of five tests have been conducted with the stoichiometric mixtures of hydrogen, natural gas, and air. In these tests, the hydrogen mole faction was varied from 1.000 to 0.897, and the natural gas mole fraction was varied from 0.000 to 0.103. Fast-response thermocouples used to measure flame front time of arrival measured velocities ranging from 36.2 m/s to 19.7 m/s. The results show a decrease in flame speed with the addition of natural gas for fuel mixtures with XH2 ≤ 0.990. The test with XH2 = 0.999 showed an increase in the flame speed with the addition of a small amount of natural gas. For tests with XH2 ≤ 0.949, the overpressures decreased significantly with the substitution of natural gas for hydrogen. When the amount of natural gas substitution was small, 0.990 ≤ XH2 ≤ 0.999, there was a slight increase in overpressure compared with the case with the stoichiometric hydrogen-air mixture. This result could be due to experimental scatter, or there could be a slight enhancement when small amounts of natural gas are mixed with the hydrogen. More tests are necessary to determine whether the increased overpressure is due to scatter or enhancement. Regardless of the cause, the difference in overpressure was small and should not affect safety considerations.
REFERENCES
1. Florisson, O., and Huizing, R.R., The Safe use of the Existing Natural Gas System for Hydrogen (Overview of the Naturalhy-Project), International Conference on Hydrogen Safety, Pisa, Italy, 2005.
2. Scholte, T.G., and Vaags, P.B., Burning velocities of mixtures of hydrogen, carbon monoxide and methane with air, Combust Flame, 3, 1959, pp. 511-524.
3. Miller, D.R., Evers, R.L., and Skinner, G.B., Effects of various inhibitors on hydrogen–air flame speeds, Combust Flame, 7, 1963, pp. 137–142.
4. Law, C.K., and Kwon, O.C., Effects of hydrocarbon substitution on atmospheric hydrogen air flame propagation, International Journal of Hydrogen Energy, 29, No. 8, 2004, pp. 867-879.
8
9
5. Ren J.-Y., Qin, W., Egolfopoulos, F.N., Mak H., and Tsotsis, T.T., Methane reforming and its potential effect on the efficiency and pollutant emissions of lean methane–air combustion, Chem. Eng. Sci., 56, 2001, pp. 1541-1549.
6. Di Sarli, V., Di Benedetto, A., Laminar burning velocity of hydrogen-methane/air pre-mixed flames, International Journal of Hydrogen Energy, 32, No. 5, April 2007, pp. 637-646.
7. Kunioshi, N., and Fukutani, S., Fuel mixing effects on propagation of premixed flames. II. Hydrogen + methane flames, Bull. Chem. Soc. Japan, 65, 1992, pp. 2573–2577.
8. Peters, N., Laminar flamelet concepts in turbulent combustion, Proceedings of the 21st Symposium (International) on Combustion, the Combustion Institute, 1986, 1231-1250.
9. Lincoln Laboratory, Optics Research, Technical Report, Contract F19628-73-C-0002, 1974. 10. Tang, M.J., and Baker Q.A., A New Set of Curves from Vapor Cloud Explosions, Process Safety
Progress, 18, No.3, Winter 1999, pp 235-240. 11. Inaba, Y., Nishihara, T., Groethe, M.A., and Nitta, Y., Study on explosion characteristics of
natural gas and methane in semi-open space for HTTR hydrogen production system, Nuclear Engineering and Design, 232, 2004, pp. 111-119.
12. AMC. Engineering design handbook, Explosions in Air, volume 1. US Army Materiel Command, 1974. AMCP 706-181.