Embed Size (px)
Citation preview
Introduction
In order to get a better understanding of the genesisand the dynamics of active rock glaciers, various directand indirect observation methods can be applied. Themodelling of the flow of rock glaciers depends onnumerous time-variant and often interrelated variables,e.g., geomorphometric parameters, air temperature,precipitation, debris supply, internal structure, physicaland chemical processes, etc. In this respect the repeatedmapping of the surface of the rock glacier in a three-dimensional co-ordinate system is of great importance.Surface flow velocities, volumes and superficial princi-pal strain rates and changes thereof in the course oftime have to be determined with high precision todescribe the kinematics of a rock glacier. Detailed infor-mation on photogrammetric and geodetic methods andresults of practical work are given in Haeberli (1985),Haeberli and Schmid (1988), Barsch (1996), K��b (1996),and Zick (1996). Various authors, e.g., Whalley andAzizi (1994) and Barsch (1996), state that precise geo-metric measurements, especially long-term ones, arelacking.
A review of past and ongoing rock glacier mappingand monitoring projects in Austria is given byKaufmann (1996). The outer Hochebenkar rock glacier(Figure 1) has the longest record of continuous pho-togrammetric and geodetic measurements, dating backto 1938. The derived displacement vectors have beenanalysed by many authors (e.g. Barsch, 1996), neverthe-less some important questions concerning the flow
process still remain to be answered. In 1995 a renewedterrestrial photogrammetric survey was carried out atthis rock glacier. An evaluation is still pending(Kaufmann, 1996).
In 1995, the Doesen rock glacier (Figure 1) was select-ed as a test site in the framework of a comprehensivestudy on permafrost in the Austrian Alps. The geo-graphical location (inner Doesen Valley, Hohe Tauernrange) and the main characteristics of the rock glacierhave already been outlined by Lieb (1998, in this vol-ume). An important issue of this study has been to setup a long-term monitoring program on the Doesen rockglacier based on photogrammetric and geodetic meth-ods in order to derive time-series of precise surface flowvelocities, volumetric changes and principal strainrates.
Abstract
In the framework of a multidisciplinary research project on high-mountain permafrost in the Austrian Alps, acomprehensive deformation analysis of the active Doesen rock glacier (Hohe Tauern range) was carried outusing various geodetic and photogrammetric methods. In 1995 a monitoring program was established in orderto obtain geomorphometric parameters of the Doesen rock glacier for the past, present and future. Precise geo-detic measurements within an observation network are acquired on a regular basis applying classical and alsonavigation satellite-based methods. Aerial photographs (1954, 1969, 1975, 1983 and 1993) were photogrammet-rically evaluated. The flow vectors reveal that the horizontal velocity observed in the center of the rock glacierhas decreased from 29 cm a-1(1954-1975) to 17 cm a-1 (1975-1993), whereas recent measurements (1995-1996)indicate a significant increase in flow velocity (29 cm a-1). Furthermore, this analysis also includes an evalua-tion of volumetric changes of the Doesen rock glacier.
Viktor Kaufmann 551
DEFORMATION ANALYSIS OF THE DOESEN ROCK GLACIER (AUSTRIA)
Viktor Kaufmann
Institute for Applied Geodesy and PhotogrammetryTechnical University Graz
Steyrergasse 30, A-8010 Graz, Austriae-mail: [email protected]
Figure 1. Location of main rock glacier study areas in the Austrian Alps.
Photogrammetric approach
In this paper, only the evaluation of aerial and terres-trial metric photographs is considered. Until now,spaceborne remotely sensed data from non-militaryearth observation satellites are not applicable to the out-lined tasks since their spatial resolution, which is notbetter than 1 m, is too limited.
AERIAL PHOTOGRAMMETRIC METHOD
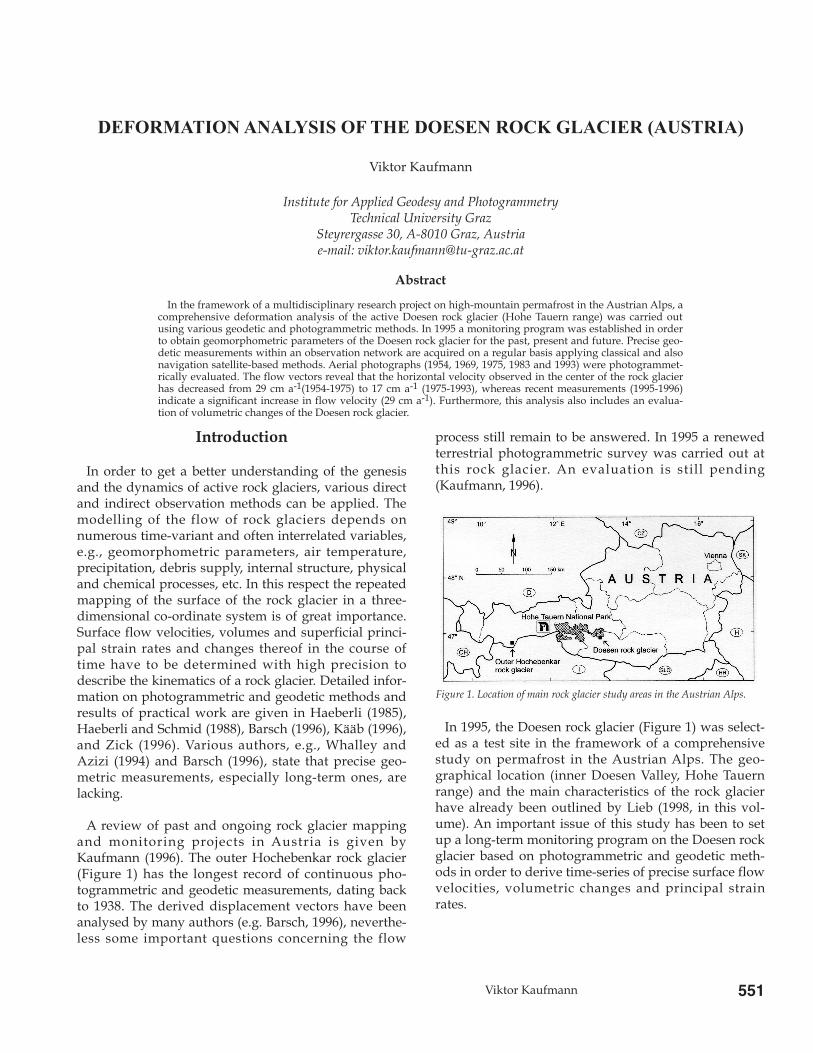
Aerial photographs covering the area of interest wereobtained from the Austrian Federal Office of Metrologyand Surveying (Table 1). In a first step a geomorphome-tric study map at 1:5,000 scale and a primary digital ter-rain model (DTM) covering the inner Doesen Valleywere evaluated. Further cartographic work comprised astereo-orthophoto map at 1:30,000 scale, two combinedimage-line maps at 1:10,000 scale, i.e., an orthophotomap and a relief map, and various combined image-linemaps of the Doesen rock glacier at 1:5,000 scale(Kaufmann, 1996). Figure 2 shows a computer-genera-ted perspective view of the inner Doesen Valley.
Three-dimensional displacement vectors wereobtained by photogrammetrically tracking prominentboulders of the surface layer of the rock glacier usingthe photographs given in Table 1. The stereomodel da-ting from 1993 was selected as a reference model for theabsolute orientation of the other stereomodels using
homologous control points. In time-consuming work,581 individual boulders, evenly distributed over thewhole rock glacier, were identified and measured usingthe DSR-1 analytical stereoplotter. These points wereremeasured in the older stereomodels, i.e., 372 pointsfor 1983, 382 points for 1975, 297 points for 1969, and305 points for 1954. Due to the small scales and some-times very bad image quality of the photographs, eventhe identification of larger boulders was quite trouble-some and tedious. As a final result mean annual flowvelocities, flow lines, principal strain rates and changesof the surface height of the rock glacier were computedand presented in numerical and graphical (color-coded)form.
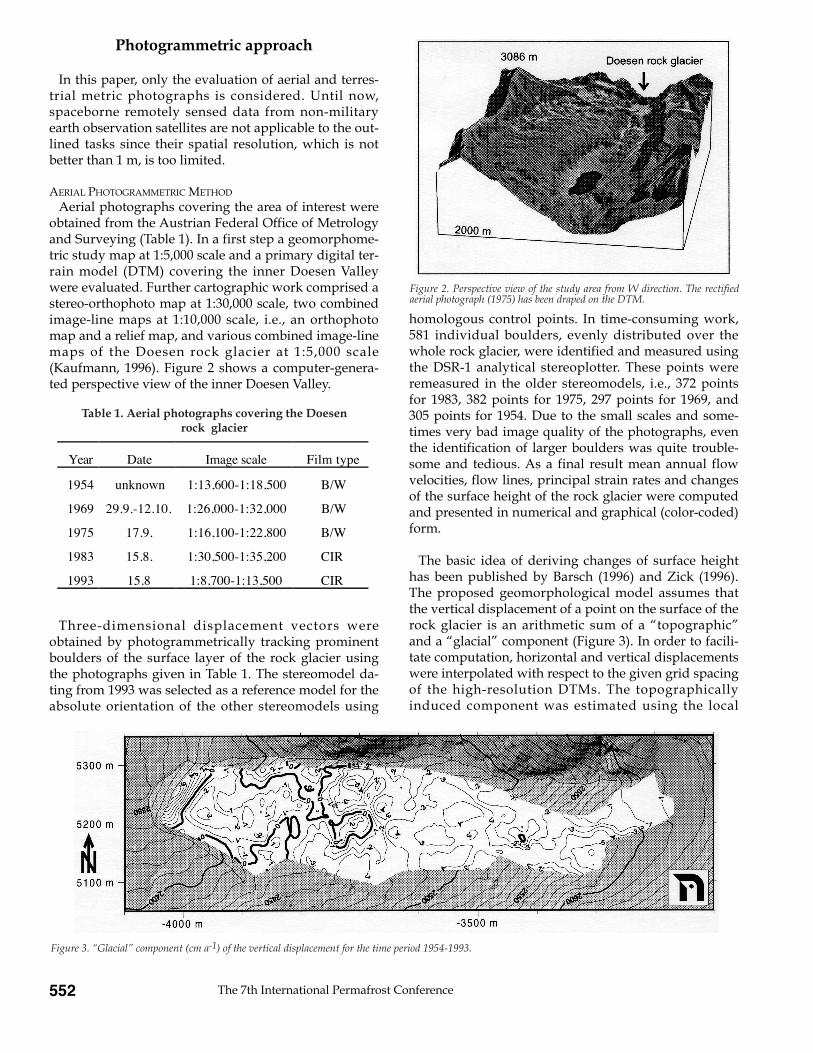
The basic idea of deriving changes of surface heighthas been published by Barsch (1996) and Zick (1996).The proposed geomorphological model assumes thatthe vertical displacement of a point on the surface of therock glacier is an arithmetic sum of a ÒtopographicÓand a ÒglacialÓ component (Figure 3). In order to facili-tate computation, horizontal and vertical displacementswere interpolated with respect to the given grid spacingof the high-resolution DTMs. The topographicallyinduced component was estimated using the local
The 7th International Permafrost Conference552
Year Date Image scale Film type
1954 unknown 1:13,600-1:18,500 B/W
1969 29.9.-12.10. 1:26,000-1:32,000 B/W
1975 17.9. 1:16,100-1:22,800 B/W
1983 15.8. 1:30,500-1:35,200 CIR
1993 15.8 1:8,700-1:13,500 CIR
Table 1. Aerial photographs covering the Doesen rock glacier
Figure 2. Perspective view of the study area from W direction. The rectifiedaerial photograph (1975) has been draped on the DTM.
Figure 3. ÒGlacialÓ component (cm a-1) of the vertical displacement for the time period 1954-1993.
gradient of the DTM, which itself was smoothed to agreat extent in order to reduce the influence of micro-relief, i.e., ridges and furrows.
Based on dense three-dimensional relief data, i.e, con-tour lines, drainage lines, ridge lines, break lines andspot heights, three high-resolution DTMs covering thearea of the Doesen rock glacier were generated repre-senting the situations of 1954, 1975 and 1993.Unfortunately, it was not possible to derive properheight information for the whole catchment area. Theslopes in the S and SE of the rock glacier, which havebeen identified as the main regions for debris supply,were almost always in shadow. As a matter of fact, thearea of interest was restricted to the area indicated inFigure 3. Since mass balance computations could not beperformed, relative volumetric changes within the out-lined area only were assessed. By dividing the relativevolumetric change by the respective planimetric area ageneral trend towards a lowering of the surface levelwas derived. But due to the topography of the rockglacier and its intrinsic downslope movement, theresult obtained is slightly lower than the actual value.
TERRESTRIAL PHOTOGRAMMETRIC METHOD
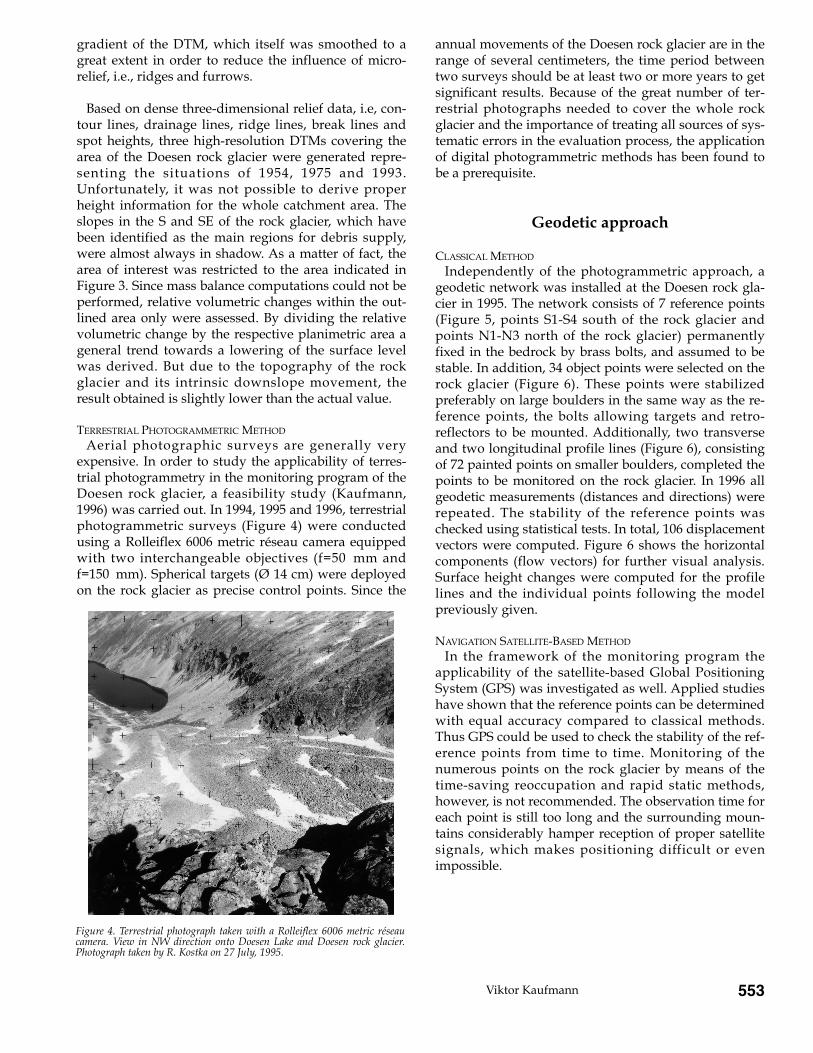
Aerial photographic surveys are generally veryexpensive. In order to study the applicability of terres-trial photogrammetry in the monitoring program of theDoesen rock glacier, a feasibility study (Kaufmann,1996) was carried out. In 1994, 1995 and 1996, terrestrialphotogrammetric surveys (Figure 4) were conductedusing a Rolleiflex 6006 metric r�seau camera equippedwith two interchangeable objectives (f=50 mm andf=150 mm). Spherical targets (¯ 14 cm) were deployedon the rock glacier as precise control points. Since the
annual movements of the Doesen rock glacier are in therange of several centimeters, the time period betweentwo surveys should be at least two or more years to getsignificant results. Because of the great number of ter-restrial photographs needed to cover the whole rockglacier and the importance of treating all sources of sys-tematic errors in the evaluation process, the applicationof digital photogrammetric methods has been found tobe a prerequisite.
Geodetic approach
CLASSICAL METHOD
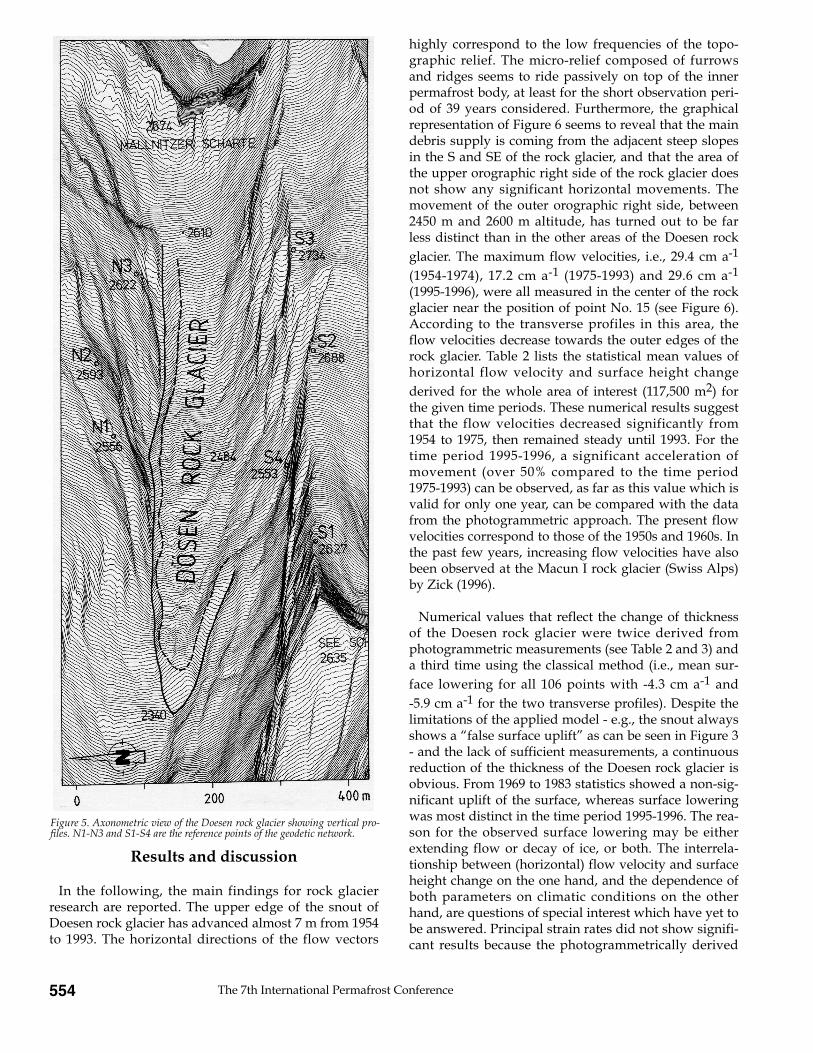
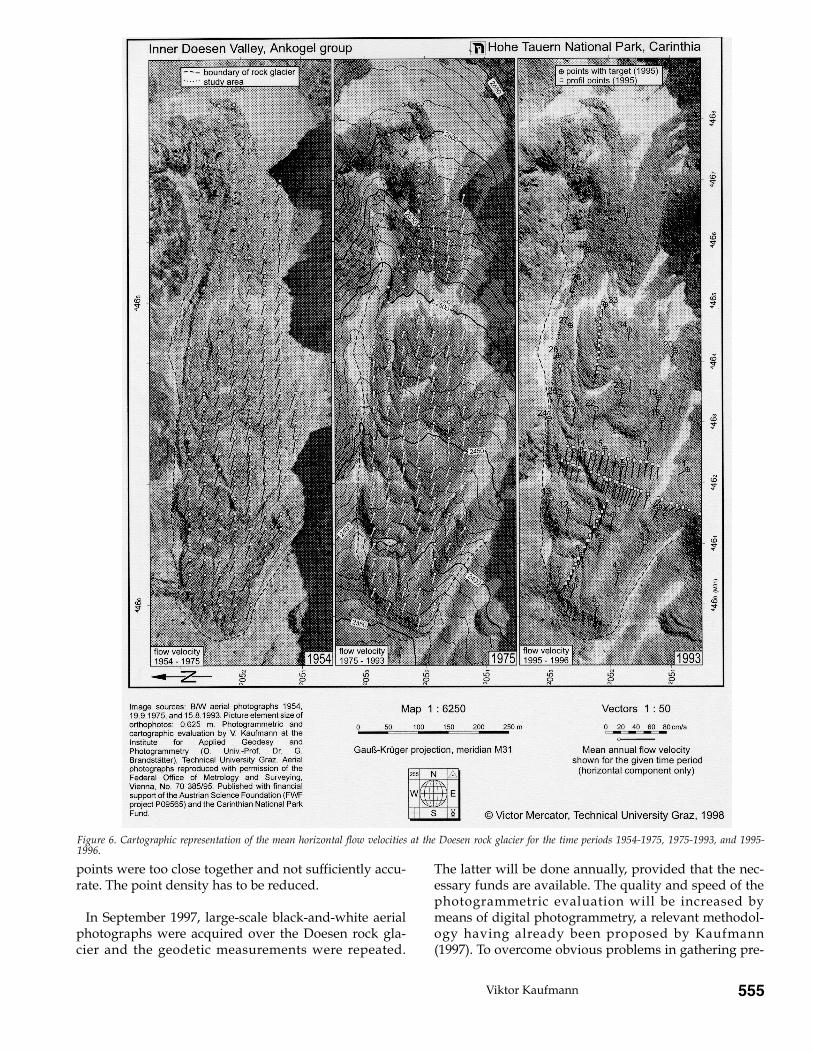
Independently of the photogrammetric approach, ageodetic network was installed at the Doesen rock gla-cier in 1995. The network consists of 7 reference points(Figure 5, points S1-S4 south of the rock glacier andpoints N1-N3 north of the rock glacier) permanentlyfixed in the bedrock by brass bolts, and assumed to bestable. In addition, 34 object points were selected on therock glacier (Figure 6). These points were stabilizedpreferably on large boulders in the same way as the re-ference points, the bolts allowing targets and retro-reflectors to be mounted. Additionally, two transverseand two longitudinal profile lines (Figure 6), consistingof 72 painted points on smaller boulders, completed thepoints to be monitored on the rock glacier. In 1996 allgeodetic measurements (distances and directions) wererepeated. The stability of the reference points waschecked using statistical tests. In total, 106 displacementvectors were computed. Figure 6 shows the horizontalcomponents (flow vectors) for further visual analysis.Surface height changes were computed for the profilelines and the individual points following the modelpreviously given.
NAVIGATION SATELLITE-BASED METHOD
In the framework of the monitoring program theapplicability of the satellite-based Global PositioningSystem (GPS) was investigated as well. Applied studieshave shown that the reference points can be determinedwith equal accuracy compared to classical methods.Thus GPS could be used to check the stability of the ref-erence points from time to time. Monitoring of thenumerous points on the rock glacier by means of thetime-saving reoccupation and rapid static methods,however, is not recommended. The observation time foreach point is still too long and the surrounding moun-tains considerably hamper reception of proper satellitesignals, which makes positioning difficult or evenimpossible.
Viktor Kaufmann 553
Figure 4. Terrestrial photograph taken with a Rolleiflex 6006 metric r�seaucamera. View in NW direction onto Doesen Lake and Doesen rock glacier.Photograph taken by R. Kostka on 27 July, 1995.
Results and discussion
In the following, the main findings for rock glacierresearch are reported. The upper edge of the snout ofDoesen rock glacier has advanced almost 7 m from 1954to 1993. The horizontal directions of the flow vectors
highly correspond to the low frequencies of the topo-graphic relief. The micro-relief composed of furrowsand ridges seems to ride passively on top of the innerpermafrost body, at least for the short observation peri-od of 39 years considered. Furthermore, the graphicalrepresentation of Figure 6 seems to reveal that the maindebris supply is coming from the adjacent steep slopesin the S and SE of the rock glacier, and that the area ofthe upper orographic right side of the rock glacier doesnot show any significant horizontal movements. Themovement of the outer orographic right side, between2450 m and 2600 m altitude, has turned out to be farless distinct than in the other areas of the Doesen rockglacier. The maximum flow velocities, i.e., 29.4 cm a-1
(1954-1974), 17.2 cm a-1 (1975-1993) and 29.6 cm a-1
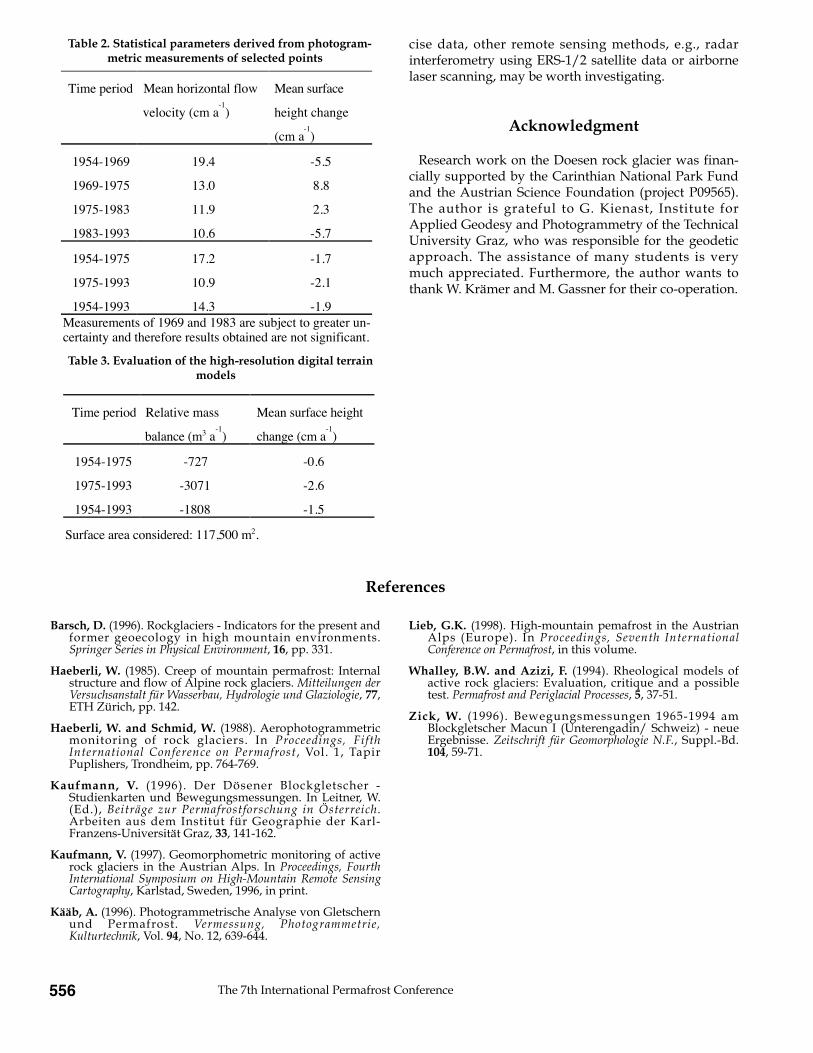
(1995-1996), were all measured in the center of the rockglacier near the position of point No. 15 (see Figure 6).According to the transverse profiles in this area, theflow velocities decrease towards the outer edges of therock glacier. Table 2 lists the statistical mean values ofhorizontal flow velocity and surface height changederived for the whole area of interest (117,500 m2) forthe given time periods. These numerical results suggestthat the flow velocities decreased significantly from1954 to 1975, then remained steady until 1993. For thetime period 1995-1996, a significant acceleration ofmovement (over 50% compared to the time period1975-1993) can be observed, as far as this value which isvalid for only one year, can be compared with the datafrom the photogrammetric approach. The present flowvelocities correspond to those of the 1950s and 1960s. Inthe past few years, increasing flow velocities have alsobeen observed at the Macun I rock glacier (Swiss Alps)by Zick (1996).
Numerical values that reflect the change of thicknessof the Doesen rock glacier were twice derived fromphotogrammetric measurements (see Table 2 and 3) anda third time using the classical method (i.e., mean sur-face lowering for all 106 points with -4.3 cm a-1 and -5.9 cm a-1 for the two transverse profiles). Despite thelimitations of the applied model - e.g., the snout alwaysshows a Òfalse surface upliftÓ as can be seen in Figure 3- and the lack of sufficient measurements, a continuousreduction of the thickness of the Doesen rock glacier isobvious. From 1969 to 1983 statistics showed a non-sig-nificant uplift of the surface, whereas surface loweringwas most distinct in the time period 1995-1996. The rea-son for the observed surface lowering may be eitherextending flow or decay of ice, or both. The interrela-tionship between (horizontal) flow velocity and surfaceheight change on the one hand, and the dependence ofboth parameters on climatic conditions on the otherhand, are questions of special interest which have yet tobe answered. Principal strain rates did not show signifi-cant results because the photogrammetrically derived
The 7th International Permafrost Conference554
Figure 5. Axonometric view of the Doesen rock glacier showing vertical pro-files. N1-N3 and S1-S4 are the reference points of the geodetic network.
Viktor Kaufmann 555
Figure 6. Cartographic representation of the mean horizontal flow velocities at the Doesen rock glacier for the time periods 1954-1975, 1975-1993, and 1995-1996.
points were too close together and not sufficiently accu-rate. The point density has to be reduced.
In September 1997, large-scale black-and-white aerialphotographs were acquired over the Doesen rock gla-cier and the geodetic measurements were repeated.
The latter will be done annually, provided that the nec-essary funds are available. The quality and speed of thephotogrammetric evaluation will be increased bymeans of digital photogrammetry, a relevant methodol-ogy having already been proposed by Kaufmann(1997). To overcome obvious problems in gathering pre-
cise data, other remote sensing methods, e.g., radarinterferometry using ERS-1/2 satellite data or airbornelaser scanning, may be worth investigating.
Acknowledgment
Research work on the Doesen rock glacier was finan-cially supported by the Carinthian National Park Fundand the Austrian Science Foundation (project P09565).The author is grateful to G. Kienast, Institute forApplied Geodesy and Photogrammetry of the TechnicalUniversity Graz, who was responsible for the geodeticapproach. The assistance of many students is verymuch appreciated. Furthermore, the author wants tothank W. Kr�mer and M. Gassner for their co-operation.
The 7th International Permafrost Conference556
Time period Mean horizontal flow
velocity (cm a-1)
Mean surface
height change�
(cm a-1)
1954-1969 19.4 -5.5
1969-1975 13.0 8.8
1975-1983 11.9 2.3
1983-1993 10.6 -5.7
1954-1975 17.2 -1.7
1975-1993 10.9 -2.1
1954-1993 14.3 -1.9Measurements of 1969 and 1983 are subject to greater un-certainty and therefore results obtained are not significant.
Time period Relative mass
balance (m3 a-1)
Mean surface height
change (cm a-1)
1954-1975 -727 -0.6
1975-1993 -3071 -2.6
1954-1993 -1808 -1.5
Surface area considered: 117,500 m2.
Table 2. Statistical parameters derived from photogram-metric measurements of selected points
Table 3. Evaluation of the high-resolution digital terrainmodels
References
Barsch, D. (1996). Rockglaciers - Indicators for the present andformer geoecology in high mountain environments.Springer Series in Physical Environment, 16, pp. 331.
Haeberli, W. (1985). Creep of mountain permafrost: Internalstructure and flow of Alpine rock glaciers. Mitteilungen derVersuchsanstalt f�r Wasserbau, Hydrologie und Glaziologie, 77,ETH Z�rich, pp. 142.
Haeberli, W. and Schmid, W. (1988). Aerophotogrammetricmonitoring of rock glaciers. In Proceedings, FifthInternational Conference on Permafrost , Vol. 1, TapirPuplishers, Trondheim, pp. 764-769.
Kaufmann, V. (1996). Der D�sener Blockgletscher -Studienkarten und Bewegungsmessungen. In Leitner, W.(Ed.), Beitr�ge zur Permafrostforschung in �sterreich.Arbeiten aus dem Institut f�r Geographie der Karl-Franzens-Universit�t Graz, 33, 141-162.
Kaufmann, V. (1997). Geomorphometric monitoring of activerock glaciers in the Austrian Alps. In Proceedings, FourthInternational Symposium on High-Mountain Remote SensingCartography, Karlstad, Sweden, 1996, in print.
K��b, A. (1996). Photogrammetrische Analyse von Gletschernund Permafrost. Vermessung, Photogrammetrie,Kulturtechnik, Vol. 94, No. 12, 639-644.
Lieb, G.K. (1998). High-mountain pemafrost in the AustrianAlps (Europe). In Proceedings, Seventh InternationalConference on Permafrost, in this volume.
Whalley, B.W. and Azizi, F. (1994). Rheological models ofactive rock glaciers: Evaluation, critique and a possibletest. Permafrost and Periglacial Processes, 5, 37-51.
Zick, W. (1996). Bewegungsmessungen 1965-1994 amBlockgletscher Macun I (Unterengadin/ Schweiz) - neueErgebnisse. Zeitschrift f�r Geomorphologie N.F., Suppl.-Bd.104, 59-71.