Embed Size (px)
Citation preview

1
Degradable Plastics Packaging Materials:
Assessment and Implication for the Australian
Environment
Materials Science and Engineering
FINAL REPORT
Prepared by: Dr Parveen Sangwan and Dr Katherine Dean
Approved by: Dr Stuart Bateman Theme leader – Sustainable Polymeric Materials
Issue date: 8th June 2011
CSIRO - EP114268

2
Whilst the document has been prepared with due diligence and care the contents are subject
to change and as such CSIRO and its employees are not responsible for the results of any
actions taken in reliance on it or for any errors or omissions herein.
CSIRO Copyright 8th June 2011
Please address all enquires to:
The Chief
CSIRO Materials Science and Engineering
Private Bag 33
CLAYTON SOUTH VIC 3169
Australia
3
NEPC Project Committee:
Gregory Manning (DSEWPaC)
Peter Marshall (DSEWPaC)
Ian Newbery (NEPC Service Corporation)
Peter Bury (PACIA)
Prof. Graeme George (Queensland University of Technology)
Monika Stasiak (ZWSA)
Ian Harvey (ZWSA)
Anne Maree Casey (DSEWPaC)
CSIRO Materials Science and Engineering (CMSE):
Dr Stuart Bateman (CMSE)
Dr Katherine Dean (CMSE)
Dr Parveen Sangwan (CMSE)

4
Table of Contents
Table of Contents...................................................................................................... 4
List of Tables ............................................................................................................ 6
List of Figures ........................................................................................................... 7
1. EXECUTIVE SUMMARY ............................................................................................ 9
2. ABBREVIATIONS....................................................................................................... 17
3. MATERIALS AND METHODS ................................................................................. 18
3.1. MATERIALS ............................................................................................................... 18
3.1.1 Test specimens .................................................................................................... 18
3.1.2 Soil and marine sites for real-time exposure experiments.................................. 18
3.1.3 Soil and marine characteristics for simulated testing ........................................ 20
3.2. METHODS ................................................................................................................. 21
3.2.1 Real-time weathering experiment ....................................................................... 21
3.2.2 Gravimetric analysis........................................................................................... 24
3.2.3 Mechanical properties ........................................................................................ 24
3.2.4 FTIR analysis ...................................................................................................... 25
3.2.5 Accelerated UV exposure.................................................................................... 25
3.2.6 Accelerated Biodegradation ............................................................................... 26
4. RESULTS AND OBSERVATIONS............................................................................ 29
4.1. DIGITAL IMAGES........................................................................................................ 29
4.1.1 On soil and marine real-time exposure .............................................................. 29
4.2. GRAVIMETRIC WEIGHT ANALYSIS ................................................................................ 57
4.2.1 On soil real-time exposure.................................................................................. 57
4.2.2 Marine real-time exposure.................................................................................. 59
4.3. CHANGES IN MECHANICAL PROPERTIES ...................................................................... 60
4.3.1 On soil real-time exposure.................................................................................. 60
4.3.2 Marine real-time exposure.................................................................................. 64
4.4. CHANGES IN CHEMICAL STRUCTURE........................................................................... 66
4.4.1 Accelerated UV exposure using xenon-arc unit.................................................. 68
4.5. RESPIROMETRIC BIODEGRADATION ............................................................................ 69
4.5.1 In soil biodegradation......................................................................................... 69

5
4.5.2 In marine biodegradation ................................................................................... 73
5. CONCLUSIONS ........................................................................................................... 76
6. RECOMMENDATIONS: ............................................................................................ 85
6.1. TEST METHODOLOGIES ............................................................................................. 85
6.2. PERFORMANCE CRITERIA FOR A PLASTIC CLAIMING TO BE DEGRADABLE ...................... 86
6.3. BENEFITS AND RISKS ................................................................................................. 88
7. TERMINOLOGY ......................................................................................................... 90
8. APPENDIX A – METHODOLOGY ATTACHED AS SEPARATE
DOCUMENT…..................................................................................................................... 95
9. APPENDIX B – SUPPORTING DATA ATTACHED AS SEPARATE
DOCUMENT....................................................................................................................... 132

6
List of Tables
Table 1. Plastic specimens selected for assessment in this study ............................................. 9
Table 2. An overview of degradation of test plastic specimens in real-time exposure tests .. 11
Table 3. An overview of biodegradation of test plastic specimens in simulated environment
exposure tests .......................................................................................................................... 13
Table 4 List of environmental variables for real-time exposure............................................. 14
Table 5 Selection of degradable plastics for assessment ........................................................ 18
Table 6 Soil and marine analysis for real-time testing ........................................................... 19
Table 7 Heavy metal analysis of real time exposure sites ...................................................... 19
Table 8. Soil and marine sample analysis for simulated testing ............................................. 20
Table 9 Digital images of sample A during on soil and marine real-time exposure .............. 30
Table 10 Digital images of sample B during on soil and marine real-time exposure............. 34
Table 11 Digital images of sample C during on soil and marine real-time exposure............. 38
Table 12 Digital images of sample D during on soil and marine real-time exposure ............ 42
Table 13 Digital images of sample E during on soil and marine real-time exposure ............. 46
Table 14 Digital images of sample F during on soil and marine real-time exposure ............. 49
Table 15 Digital images of sample G during on soil and marine real-time exposure ............ 53
Table 16 Summary of sample class and class description ...................................................... 76
Table 17 Summary of test results: On-soil real time exposure study Melbourne (VIC) ........ 79
Table 18 Summary of test results: On-soil real time exposure study Darwin (NT) ............... 80
Table 19 Summary of test results: In marine real time exposure study Williamstown (VIC) 81
Table 20 Summary of disintegration end point for all exposure sites .................................... 82
Table 21 Summary of test results from in-lab biodegradation study...................................... 84
Table 22 List of environmental variables for real-time exposure........................................... 85

7
List of Figures
Figure 1 Microbial counts (cfu/ml) in soil and marine samples respectively......................... 20
Figure 2 Digital images of plastic specimens A-G (before exposure).................................... 21
Figure 3 On soil exposure site before and after clearing grass/weeds .................................... 22
Figure 4 On soil exposure set up at Melbourne (left) and Darwin (right) sites ...................... 22
Figure 5 Test specimens and marine real-time exposure set up ............................................. 23
Figure 6 Instron Testing System used for analyzing tensile properties .................................. 25
Figure 7 Film specimens set up in Xenon Weather-Ometer®................................................ 26
Figure 8 Test specimens for accelerated biodegradation study .............................................. 26
Figure 9 Bioreactors set up with test specimens in soil and marine respectively................... 27
Figure 10 NATA certified Respirometric unit at CSIRO Biodegradation testing laboratory,
Clayton VIC ............................................................................................................................ 28
Figure 11 On soil real-time exposure at Melbourne (VIC)..................................................... 58
Figure 12 On soil real-time exposure at Darwin (NT)............................................................ 58
Figure 13 Biofouling of plastic specimens during marine exposure ...................................... 59
Figure 14 Mesh bags containing test specimens after 6 months marine exposure; digital
images showing biofouling of samples in sea over time ........................................................ 59
Figure 15 Marine exposure at Williamstown (VIC) ............................................................... 60
Figure 16 Effect on elongation during on soil exposure at Melbourne (VIC)........................ 61
Figure 17 Effect on elongation during on soil exposure at Darwin (NT)............................... 61
Figure 18 Effect on Modulus during on soil exposure at Melbourne (VIC) .......................... 62
Figure 19 Effect on Modulus during on soil exposure at Darwin (NT).................................. 62
Figure 20 Effect on tensile strength during on soil exposure at Melbourne (VIC) ................ 63
Figure 21 Effect on tensile strength during on soil exposure at Darwin (NT) ....................... 63
Figure 22 Effect on Elongation during marine exposure at Williamstown (VIC).................. 64
Figure 23 Effect on Modulus during marine exposure at Williamstown (VIC) ..................... 65
Figure 24 Tensile strength during marine exposure at Williamstown (VIC) ......................... 65
Figure 25 Carbonyl index during on soil exposure at Melbourne (VIC)................................ 67
Figure 26 Carbonyl index during on soil exposure at Darwin (NT)....................................... 67
Figure 27 Carbonyl index after accelerated UV exposure in xenon-arc................................. 68
Figure 28 Digital images of test samples after biodegradation in soil; samples A and E
disintegrated into smaller size................................................................................................. 71
Figure 29 Cumulative CO2 evolution during biodegradation of test samples in soil ............. 72

8
Figure 30 Rate of biodegradation of test samples in soil........................................................ 72
Figure 31 Digital images of test samples after biodegradation in marine; sample B
disintegrated completely, samples A and E were significantly reduced. Arrows point towards
remaining film samples........................................................................................................... 74
Figure 32 Cumulative CO2 evolution during biodegradation of test samples in marine ........ 75
Figure 33 Rate of biodegradation of test samples in marine .................................................. 75

9
1. Executive Summary
A rigorous scientific investigation into on-soil and marine degradation of generic
types of degradable plastics currently available in the Australian market was undertaken. The
scope of the study included developing guidance on testing degradable plastics in on-soil and
marine environments under defined conditions and a general approach to assessing
degradation of degradable plastics under defined test conditions.
In stage 1 of this project a report was completed that included a literature review and
methodologies for monitoring the rate of degradation of plastics under real time and
simulated environment conditions typical of litter – on soil and in the marine environment.
These methodologies were designed through consultation with the project Technical Review
committee, the detail of which can be found in Appendix A.
In stage 2 of the project, six (6) plastic specimens (provided as 20 micron films)
belonging to four (4) major classes of degradable plastics were selected for assessment; these
are summarized in Table 1 below:
Table 1. Plastic specimens selected for assessment in this study
Sample designation Class Class description1
A iii Non-polyolefin with bio-derived component
B iv Bio-derived
C ii Polyolefin with bio-derived component
D i Polyolefin with prodegradant
E iii Non-polyolefin with bio-derived component
F i Polyolefin with prodegradant G - HDPE baseline
1 The full definition of all terms can be found in the glossary of terms found at the end of this document Bio-derived: being derived
from a biological source (not petrochemical), examples of bio-derived polymers include starches, proteins and polylactic acid.
Polyolefin: polymer produced from polymerization of simple olefin (CnH2n); examples are polyethylene and polypropylene produced
from olefin ethylene and propylene respectively. Most commonly derived from a petrochemical resource. Non-polyolefin: polymer
typically derived from a petrochemical resource but not a simple olefin (CnH2n) examples include polyesters such as polycaprolactone; Prodegradant: any substance or a factor that promotes degradation examples include transition metals.

10
Real Time Exposure Tests
To capture the diversity of different climates in which these samples may ultimately
end up, samples were set up for real-time exposure on soil (9 months maximum) at two
different sites – Melbourne (temperate climate) and Darwin (tropical climate), and in the
marine environment at the salt water immersion exposure site managed by the Defence Science
and Technology Organisation (DSTO) at Williamstown (VIC). At each sampling time, exposed
specimens were analysed to monitor changes in physical appearance, total weight, tensile
properties (tensile strength, modulus and elongation at break) and chemical structure.
For real-time exposure, comparative disintegration has been predominantly assessed
based on mechanical performance (when elongation was less than 5% of its original value
measured at time zero) and visual imaging (when sample was too damaged to obtain
mechanical properties). This definition is based on current guidelines for aging of polymers
and cannot be used by itself as a measure of degradability.
Differences were observed in the rates of disintegration of test samples at the three
exposure sites selected for the study. In summary, samples A and E (non-polyolefin with bio-
derived component) disintegrated quite rapidly in all three environments (on-soil (temperate
and tropical) and marine), with sample A appearing to be more susceptible to moisture.
Sample B (bio-derived) was highly susceptible to moisture but quite stable on soil (in the
environments in which we tested). Sample C (polyolefin with bio-derived) was sensitive to
UV and marine fouling may have blocked UV leading to a reduced disintegration rate in the
marine environment.
Samples D and F (polyolefin with prodegradant) showed similar trends to sample C
in which marine fouling may have reduced the UV exposure and thus ability to disintegrate
and/or degrade. Sample G (baseline HDPE) showed similar trends to the other polyolefin
containing samples (albeit generally a longer degradation time) with the exception of sample
D. The differences in disintegration of sample D and the baseline HDPE may have been due
to variation in base polyolefin formulation (for example the addition of processing
stabilisers). For comparison all samples and environments have been summarised in the
Table 2 below with simple trend lines overlaid.

11
Table 2. An overview of degradation of test plastic specimens in real-time exposure tests
C
F
G
8
DEA
B
Marine
(Melbourne)
BDGAC
E
FOn-soilTropical
(Darwin)
BDA
G
C
F
EOn-soil
Temperate (Melbourne)
97654321months
C
F
G
8
DEA
B
Marine
(Melbourne)
BDGAC
E
FOn-soilTropical
(Darwin)
BDA
G
C
F
EOn-soil
Temperate (Melbourne)
97654321months
Simulated Environment Exposure Tests
To determine the rate of biodegradation on exposure to simulated soil and marine
environments, plastic specimens were first subjected to accelerated UV exposure using xenon-
arc lamps for 1 month followed by biodegradation under simulated soil and marine conditions
for 5 months at 28°C – the results from this study are summarised in Table 3 with trend lines
overlaid. A standard error of ±5% should be considered when comparing percentage
biodegradation values.
Simulated in-soil, samples A and E (non-polyolefin with bio-derived component)
showed the highest biodegradation, reaching 59.5% and 69.5% biodegradation respectively.
Sample C (polyolefin with bio-derived component) obtained the next highest level of
biodegradation (23.4%). Sample B (bio-derived) obtained a biodegradation level of 10.7%
indicating that bio-derived materials can have longevity provided temperature and moisture are
minimised. Samples D and F (polyolefin with prodegradant) obtained biodegradation levels of
4.2% and 10.9% respectively, which are within error or the baseline HDPE 6.8%.
Simulated marine water, sample B (bio-derived) showed the highest biodegradation reaching
99.9%, showing its susceptibility to moisture. Samples A and E (non-polyolefin with bio-

12
derived component) followed reaching 87.0% and 69.7% biodegradation respectively. Sample
C (polyolefin with bio-derived component) obtained the next highest level of biodegradation
(55.4%) It is noteworthy that sample C had the highest carbonyl index value among all the
polyolefin based samples and its rate of degradation was higher in soil and marine relative to
samples D, F, and G; this means it was more oxidised. Samples D and F (polyolefin with
prodegradant) obtained biodegradation levels of 35.9% and 27.5% respectively and the
baseline HDPE 21.1%, indicating that moisture could play a significant role in increasing the
biodegradation of polyolefins containing prodegradants.

13
Table 3. An overview of biodegradation of test plastic specimens in simulated environment exposure tests
% Biodegradation (after 150 days)
0-10 11-20 21-30 31-40 41-50 51-60 61-70 71-80 81-90 91-100
On-soil simulated
environment at
28°C
D (4.2)
G
(6.8)
B (10.7)
F (10.9)
C (23.4) A (59.5) E (69.5)
Marine simulated
environment at
28°C
F (27.5)
G
(21.1)
D (35.9) C (55.4) E (69.7) A (87.0) B (99.9)
* please note that a standard error of ± 5% should be considered when comparing % biodegradation values

14
Key findings and recommendations
Broadly, the test results obtained from exposure of plastic samples to real-time
conditions and in-lab simulated conditions indicate that the rate of disintegration and
degradation of non-polyolefin based samples (in all test environments) and bio-derived
sample (particularly in the marine environment) is faster relative to polyolefin based samples.
However, the study found that it was difficult to quantify the degree of disintegration and
degradation under natural conditions, as there were a large number of variable factors that
could influence the biodegradability of test materials. The list of potential environmental
variables is outlined in Table 4.
Table 4 List of environmental variables for real-time exposure
pH
Precipitation
Temperature
Sunlight
Salinity
Element contents such as carbon, nitrogen and heavy metals Microbial activity
Fouling
Tides/water currents
Wind velocity
Under natural conditions it was also difficult to differentiate between disintegration
(where sample has fragmented and been lost from the test frames) and degradation in which
sample is ultimately mineralised, for this reason it is recommended that real-time weathering
experiments could not be used as a stand-alone system to assess degradation. It is further
recommended that other chemical methods such as carbonyl index (specifically for
polyolefins containing prodegradants) and molecular weight also be used as a measure of
degradation of the materials. Although it must be noted that both these chemical methods
cannot be used when sample has been lost from the test frames.
It is recommended the real-time weathering experiment at different exposure sites be
repeated, in different seasons or years to gain better insight into the rate and extent of
biodegradation of these materials under natural environmental conditions. It is also

15
recommended the samples of various film thickness are also included in the testing to study the
effects of film thickness on degradation rates.
The in-lab study was relevant in terms of quantitatively measuring the rate of
biodegradation of these test materials under accelerated test conditions. Caution is advised in
using these test results in predicting the performance of test materials in real-time for a
number of reasons. Firstly, the in-lab study exposed samples to sequential steps of UV
exposure followed by biodegradation, whereas in real-time these steps would occur
simultaneously; this variation could affect the final result. Also in the marine study we have
not considered the effect of biofouling that could affect the biodegradation rate. These and
other variable factors must be considered.
Recommended performance criteria for a plastic claiming to be degradable
It is difficult to ascertain performance criteria for a plastic claiming to be degradable
in real-time exposure conditions. We recommend the only performance criteria which can be
specified is for embrittlement and this would be defined as the time required for the film to
reach 5% or less of its original elongation at break in real-time exposure conditions, it is
recommended that embrittlement cannot be used by itself as a measure of degradability
For the results to be valid in the laboratory test in marine water or soil we recommend the
following criteria must be met:
A negative reference of exactly the same base polyolefin as that containing pro-
oxidant additive must be included in the study for comparison
The degree of biodegradation of the positive reference material must be more than
60% at the plateau phase or at the end of the test
The CO2 evolved from the replicate blanks (marine water or soil) are within 20% of
the mean at the plateau phase, or at the end of the test
For a plastic claiming to be degradable in a simulated laboratory environment it must achieve
both of the following performance criteria:

16
After an accelerated photo-oxidation process the sample must be embrittled (film to
reach 5% or less of its original elongation at break) or reach an appropriately low
molecular weight.
and
The degree of biodegradation of the material must be more than 60% at the plateau
phase or at the end of the biodegradation test.
This 6 month (1 month UV exposure plus 5 months biodegradation) study did not provide
conclusive evidence of the length of time that would form an appropriate criterion for a plastic
claiming to be degradable. It could be considerably longer than 5 months biodegradation
undertaken in this study (for polyolefins with prodegradants up to 2 years may be required to
achieve these levels of biodegradation, it is however recommended that an upper time limit
must be defined in any standard and/or test protocol which is developed).
Assessing toxicity risks from the degradation process was outside the terms of this study.
Conclusion
The results from the study will assist policy makers, technical experts and legislators to
develop relevant test protocols and hence Australian standards to assess and certify
performance of degradable plastics on soil and in marine environments and policies over the
use of different types of plastic packaging materials. However, the study highlights the
difficulty of developing standards for degradability on soil and in marine environments due the
variability of performance in different end environments.
As this study incorporates a cross section of degradable plastics from the marketplace the
results could also be integrated into a sustainable design program (such as the Design for
Sustainability Program – PACIA) for the design and manufacturing of plastic materials or
products. These design criteria would need to take into account the whole of life of the
plastic material or product including its end use.

17
2. Abbreviations
FTIR Fourier Transform Infrared Spectroscopy
NATA National Association of Testing Authorities
ASTM American Society for Testing and Materials
ISO International Organization for Standardization
CFU Colony Forming Units
PVC Poly Vinyl Chloride
UV Ultra Violet
VIC Victoria
CO2 Carbon dioxide
ThCO2 theoretical carbon dioxide
LOI Loss on Ignition
Mw Molecular weight
CI Carbonyl Index
IR Infra Red
nm nanometre
cm centimetre
mm millimetre
mg milligram
% percentage
Kg Kilogram
L Litre
ml millilitre
hrs hours

18
3. Materials and methods
3.1. Materials
3.1.1 Test specimens
Approximately 20 micron films of six (6) different degradable plastics were selected
for assessment by Technical Review committee and delivered to CSIRO. These samples
belonged to the following four (4) major classes of degradable plastics:
i) Polyolefin with prodegradant
ii) Polyolefin with bio-derived component
iii) Non-polyolefin with bio-derived component
iv) Bio-derived
HDPE film of similar thickness was included as baseline sample. The specimens were
marked A – G; sample identification and description of classes is provided in Table 5.
Table 5 Selection of degradable plastics for assessment
Sample designation Class Class description
A iii Non-polyolefin with bio-derived component
B iv Bio-derived
C ii Polyolefin with bio-derived component
D i Polyolefin with prodegradant
E iii Non-polyolefin with bio-derived component
F i Polyolefin with prodegradant
G - HDPE baseline
3.1.2 Soil and marine sites for real-time exposure experiments
Soil exposure site: CSIRO locations at Melbourne and Darwin were selected for on
soil real-time exposure studies. Exposure sites were selected away from shade/trees to allow

19
maximum exposure to sunlight. Soil samples were collected from the surface (0-2 cm) and
transported to laboratory in clean containers. Soil samples were analytically tested at NATA
certified Environmental division of ALS laboratory Group (Victoria). Test results are presented
in Table 6 and Table 7.
Marine exposure site: Marine samples were collected from Williamstown site managed by
Defence Science and Technology Organisation (DSTO). Samples were analysed at NATA
certified Environmental division of ALS laboratory Group (Victoria) and results are provided
below in Table 6 and Table 7. A description of real-time experimental sites is included in
Appendix B
Table 6 Soil and marine analysis for real-time testing
Test Soil Melbourne Soil Darwin Marine Williamstown
pH 5.4 5.7 7.97
Salinity - - 41 g/kg
Organic matter 5.4 % 2.6 % 2 mg/L
Total Nitrogen as N 6630 mg/kg 1910 mg/kg 0.4 mg/L
Table 7 Heavy metal analysis of real time exposure sites
Metals Soil Melbourne mg/kg
Soil Darwin mg/kg Marine Williamstown mg/L
Arsenic <5 <5 0.005
Cadmium <0.1 <0.1 0.0010
Chromium 4 47 <0.001
Copper 10 <5 0.013
Lead 19 9 <0.001
Molybdenum <2 <2 0.013
Nickel 2 2 0.004
Selenium <5 <5 <0.01
Zinc 32 15 0.007
Mercury <0.1 2.6 <0.0001

20
3.1.3 Soil and marine characteristics for simulated testing
Samples were collected from Melbourne and Williamstown locations, where real-time
exposure studies were being conducted. Samples were transported to the laboratory in clean
containers. Any visibly large pieces of plants/foreign material were removed and 8 mm or 1
mm sterile sieves (for soil and marine samples respectively) were used for sieving. Samples
were processed for microbial count within 2-3 hrs of collection to estimate colony forming
units (CFU) counts (Figure 1) and the remaining samples were stored in dark at 4°C ± 2°C
until further analysis.
SOIL MARINE
Figure 1 Microbial counts (cfu/ml) in soil and marine samples respectively
Analytical testing was performed at NATA certified Environmental division of ALS
laboratory Group (Victoria) and results are presented below in Table 8.
Table 8. Soil and marine sample analysis for simulated testing
Test Soil Melbourne Marine Williamstown
pH 7.1 7.99
Salinity - 41 g/kg
Moisture content 21.8% -
Loss on ignition 6.7% -
Total Nitrogen as N 4260 mg/kg 0.4 mg/L
CFU/ml 3 × 10⁻⁷ 1 × 10⁻⁶

21
3.2. Methods
3.2.1 Real-time weathering experiment
Samples were intended for the measurement of tensile properties during degradation
therefore specimens A-G were cut into tensile bars before exposure (Figure 2). Exposure of
samples to real-time on soil and marine conditions was scheduled for maximum period of 9
months; sampling each week during 1st month and then monthly over next 8 months.
Figure 2 Digital images of plastic specimens A-G (before exposure)

22
On soil exposure: A patch of land was cleared of grass/vegetation and allowed to condition for
a week (Figure 3). To allow specimens maximum contact with soil surface, the frames were
firmly nailed into the ground. Samples were clamped to the metal frames and set-up at
Melbourne and Darwin exposure sites as shown in Figure 4.
At each sampling time, at least 5 replicate tensile bars for specimens A-G were collected,
lightly brushed to remove adhering soil particles followed by air-drying overnight in a fume
hood and stored away from light in desiccators. Samples were analysed to monitor changes in
physical appearance, tensile properties and chemical structure.
Figure 3 On soil exposure site before and after clearing grass/weeds
Figure 4 On soil exposure set up at Melbourne (left) and Darwin (right) sites
Marine exposure: An exposure raft was made from polyvinyl chloride (PVC) tubing and
nylon mesh bags (>98% Transmission in UV region 300-400 nm; see Appendix) containing
the specimens A-G were tied firmly to the raft using cable ties. Each bag contained a set of 5
replicate tensile bars and marked with appropriate sample designation. The raft was positioned
horizontally such that bags containing specimens float freely on water surface (Figure 5). At
each sampling time, samples were collected and air-dried in fume-hood overnight and stored in

23
desiccators at room temperature in dark. Samples were analyzed for changes in appearance,
tensile properties and chemical structure.
Test specimens in nylon mesh bags Sample labelling
Exposure raft set up at the marine exposure site (Williamstown, VIC)
Figure 5 Test specimens and marine real-time exposure set up

24
3.2.2 Gravimetric analysis
Specimens of each plastic test sample were weighed before exposure (time=0) and at
each sampling time with an analytical balance (0.1 mg accuracy; Sartorius Australia Pty Ltd).
Test results were averaged on 5 replicates unless reported otherwise. The percentage weight
loss was determined as follows:
% weight loss = to
tsto
W
WW )( × 100
where, Wto and Wts refer to the weight of samples at time 0 (before exposure) and at specific
sampling time, respectively.
3.2.3 Mechanical properties
The test method ASTM D882 – Standard Test Method for Tensile Properties of Thin
Plastic Sheeting was followed for the measurement of tensile strength, modulus and percentage
elongation using an Instron Universal Testing System (Model 3366; Figure 6) with BlueHill® 2
software (Instron Pty Ltd, Australia). Specimens were cut to the size Type IV dumbbell
specification (ASTM D638-Standard Test Method for Tensile Properties of Plastics). Thin film
grips were used to hold the samples and avoid any damage to the specimens. All tests were
performed using a crosshead speed of 50mm/minute. The test results were averaged on 5
replicates, unless reported otherwise.

25
Figure 6 Instron Testing System used for analyzing tensile properties
3.2.4 FTIR analysis
A Fourier transform infrared spectroscopy (FTIR) spectrum was acquired for all test
specimens before exposure and at each sampling time using Perkin Elmer FTIR Spectrum 100
spectrometer. The spectra were taken as an average of 16 scans from 4000-450 cm-1. Oxidation
of degradable polymers results into increased levels of carbonyl peaks which are considered as
an indirect measurement of extent of oxidation therefore, special attention was paid to the
carbonyl region (1760-1665 cm-1). Carbonyl Index (CI) was calculated from an average of 3
replicate samples by means of absorbance ratio of the IR bands at 1715-1735 cm-1 (carbonyl
peak), and the 1465 cm-1 (CH2 scissoring peak).
3.2.5 Accelerated UV exposure
The samples were subjected to accelerated UV exposure for a maximum period of 28
days using Ci-4000 Xenon Weather-Ometer® (ATLAS) at NATA certified testing facility
(Australian Wool Testing Authority, Melbourne VIC). Samples were irradiated at 340 nm in
accordance with international standard ISO 4892-2:2006 (Method A; cycle 1). Lamps were
calibrated at the start of 28 days exposure cycle for each specimen. Since large quantities of
test material were required, samples were wrapped around the specimen racks enclosed in
nylon mesh to prevent loss of materials in the event of disintegration (Figure 7). Oxidized

26
samples were stored in desiccators in dark and FTIR analysis of oxidized samples was done to
monitor changes in chemical structure of test specimens before and after accelerated UV
exposure.
Figure 7 Film specimens set up in Xenon Weather-Ometer®
3.2.6 Accelerated Biodegradation
UV exposed test specimens (A-G) were cut into same size, less than 5 mm x 5 mm
(Figure 8), to minimize variability in speed of biodegradation due to differences in their
shapes. Microcrystalline cellulose powder was used as positive reference material.
Figure 8 Test specimens for accelerated biodegradation study
Soil and marine samples collected from CSIRO locations in Melbourne and
Williamstown were used as sources of inoculum during this study. In order to increase the
organic matter content of soil, 4% mature compost was added. Test material to inoculum ratio
27
was 4 g/400 g soil and 1 g/L marine, and 2 replicate samples for each test specimen were
tested.
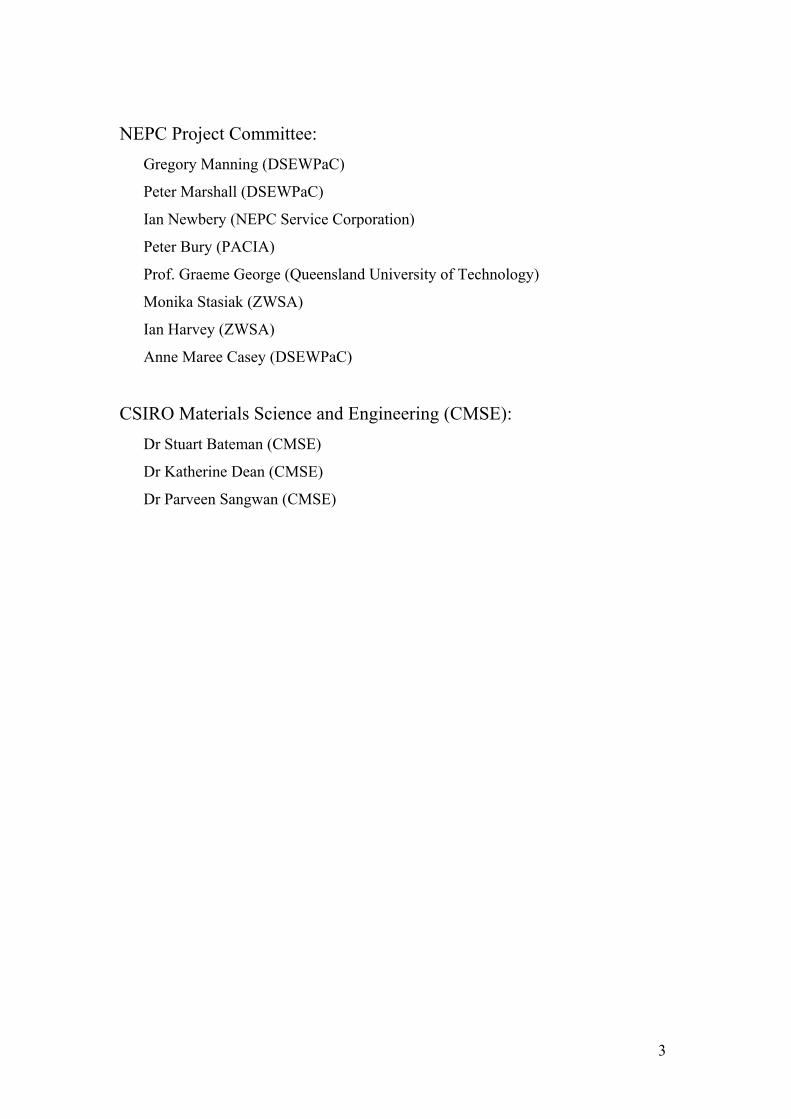
Each test specimen (A-G) was mixed with soil and marine samples in proportion
mentioned above and filled into bioreactors (glass jars holding the test mixture) as shown in
Figure 9. All bioreactors were then placed in NATA certified biodegradation testing unit
(Figure 10) and set up to allow continuous supply of CO2 -free humidified air to bioreactors
and discharge of respired gases to CO2 gas analyser. Testing is performed at temperature 28°C
± 1°C for a max period of testing 5 months). Test requirements, procedure and data analysis
details were included in the Step 1 Methodology Project report see Appendix A.
Figure 9 Bioreactors set up with test specimens in soil and marine respectively

28
Blank soil Soil w/test film Marine w/test film
Figure 10 NATA certified Respirometric unit at CSIRO Biodegradation testing laboratory, Clayton VIC

29
4. Results and observations
This section includes test results of degradation of plastic specimens under real-time and
accelerated on soil and marine environmental conditions. After 9 months exposure, only
samples C and D were collected as rest were lost in the sea.
4.1. Digital images
Digital photographs of test specimens were taken at each sampling time to monitor
changes in their physical appearance during real-time exposure to soil and marine
environment (see Table 9 to Table 15).
4.1.1 On soil and marine real-time exposure
During on-soil weathering, test samples are primarily exposed to solar radiations (UV
and visible) air humidity, temperature and rainfall, and simultaneously subjected to the action
of microorganisms present in the soil. Generally it is understood that abiotic factors initiate
oxidation of high molecular weight polymers into lower molecular weight products which are
then easily biodegraded and assimilated by microorganisms. In marine environment, samples
are simultaneously exposed to sunlight, oxygen, moisture, temperature, biofouling (typical
colonization by marine algae and invertebrates) and microbial activity. All or some of these
factors contribute towards deterioration and/or degradation of the plastic materials depending
their chemical composition and conditions at the marine exposure site. We observed
differences in the rates of degradation and disintegration of test samples at the three exposure
sites selected for the present study and observations are presented in the following sections.
Sample A samples became brittle and started disintegrating after approx 2 months of real-
time exposure on soil and the environmental effect was more rapid at Darwin site as compared
to Melbourne/Highett site. The test sample disintegrated and no intact samples could be
retrieved after 4 months of on-soil exposure. Biofouling of samples was observed within 4
weeks of exposure in sea. As the time progressed, the samples crumpled and algae covered
film surface, restricting UV exposure and providing a nutrient rich environment for microbial
activity. The plastic materials were observed to slowly disintegrate under these conditions.

30
Table 9 Digital images of sample A during on soil and marine real-time exposure
EXPOSURE
PERIOD/SITEMELBOURNE (ON SOIL) DARWIN (ON SOIL) WILLIAMSTOWN (MARINE)
BEFORE
EXPOSURE
MONTH 1

31
MONTH 2
MONTH 3
MONTH 4

32
MONTH 5
NO SAMPLE REMAINED
MONTH 6
NO SAMPLE REMAINED
NO SAMPLE REMAINED
MONTH 7
NO SAMPLE REMAINED
NO SAMPLE REMAINED

33
MONTH 8
NO SAMPLE REMAINED
NO SAMPLE REMAINED
MONTH 9
NO SAMPLE REMAINED
NO SAMPLE REMAINED
LOST IN THE SEA
Sample B became brittle on exposure to moisture & sunlight and lost its structural integrity after almost 2 months of on soil exposure. No intact
samples were recovered after 6 months of on-soil exposure. Effect was more pronounced in marine environment; samples started disintegrating after
just 4 week of exposure. Samples crumpled and break easily upon handling. Marine algae covered the film surface and contributed towards
deterioration of the samples over time.

34
Table 10 Digital images of sample B during on soil and marine real-time exposure
EXPOSURE
PERIOD/SITEMELBOURNE (ON SOIL) DARWIN (ON SOIL) WILLIAMSTOWN (MARINE)
BEFORE
EXPOSURE
MONTH 1

35
MONTH 2
MONTH 3
MONTH 4

36
MONTH 5
MONTH 6
MONTH 7
NO SAMPLE REMAINED

37
MONTH 8
NO SAMPLE REMAINED
MONTH 9
NO SAMPLE REMAINED
NO SAMPLE REMAINED
LOST IN THE SEA
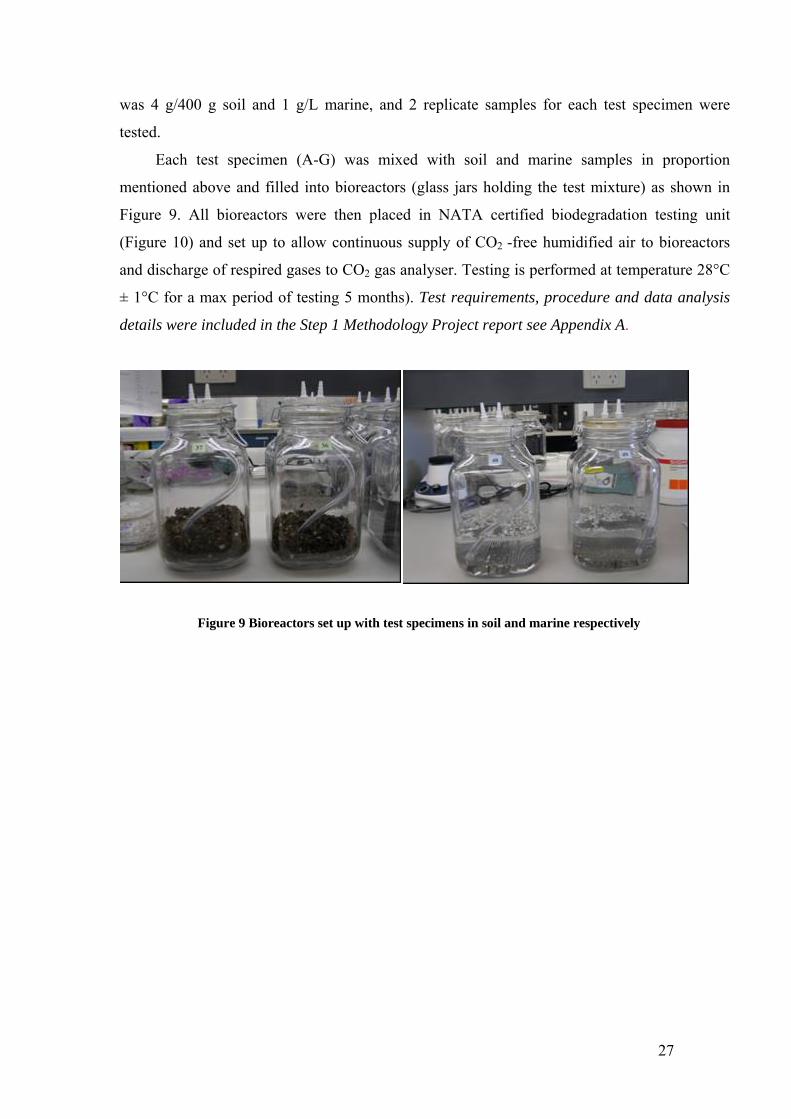
Sample C disintegrated relatively faster (within 2 months) at Darwin site as compared to Melbourne/Highett (3 months). No more intact samples
could be seen after 3 months of on-soil exposure. Marine environment had visible effects on the structural integrity of test samples. Biofouling effect
was observed after exposure for just 2 months and it progressed rapidly over time contributing towards disintegration and degradation of the test
samples.

38
Table 11 Digital images of sample C during on soil and marine real-time exposure
EXPOSURE
PERIOD/SITEMELBOURNE (ON SOIL) DARWIN (ON SOIL) MELBOURNE (MARINE)
BEFORE
EXPOSURE
MONTH 1

39
MONTH 2
MONTH 3
MONTH 4
40
MONTH 5
NO SAMPLE REMAINED
NO SAMPLE REMAINED
MONTH 6
NO SAMPLE REMAINED
NO SAMPLE REMAINED
MONTH 7
NO SAMPLE REMAINED
NO SAMPLE REMAINED

41
MONTH 8
NO SAMPLE REMAINED
NO SAMPLE REMAINED
MONTH 9
NO SAMPLE REMAINED
NO SAMPLE REMAINED
Sample D was observed to retain its form over relatively longer period of exposure (approx 6 months), although sample brittleness increased over
time and they tend to break easily. Similarly, weathering in marine resulted in biofouling of samples but their structure remained intact during 9
months of exposure period.

42
Table 12 Digital images of sample D during on soil and marine real-time exposure
EXPOSURE
PERIOD/SITEMELBOURNE (ON SOIL) DARWIN (ON SOIL) WILLIAMSTOWN (MARINE)
BEFORE
EXPOSURE
MONTH 1

43
MONTH 2
MONTH 3
MONTH 4

44
MONTH 5
MONTH 6
MONTH 7

45
MONTH 8
MONTH 9
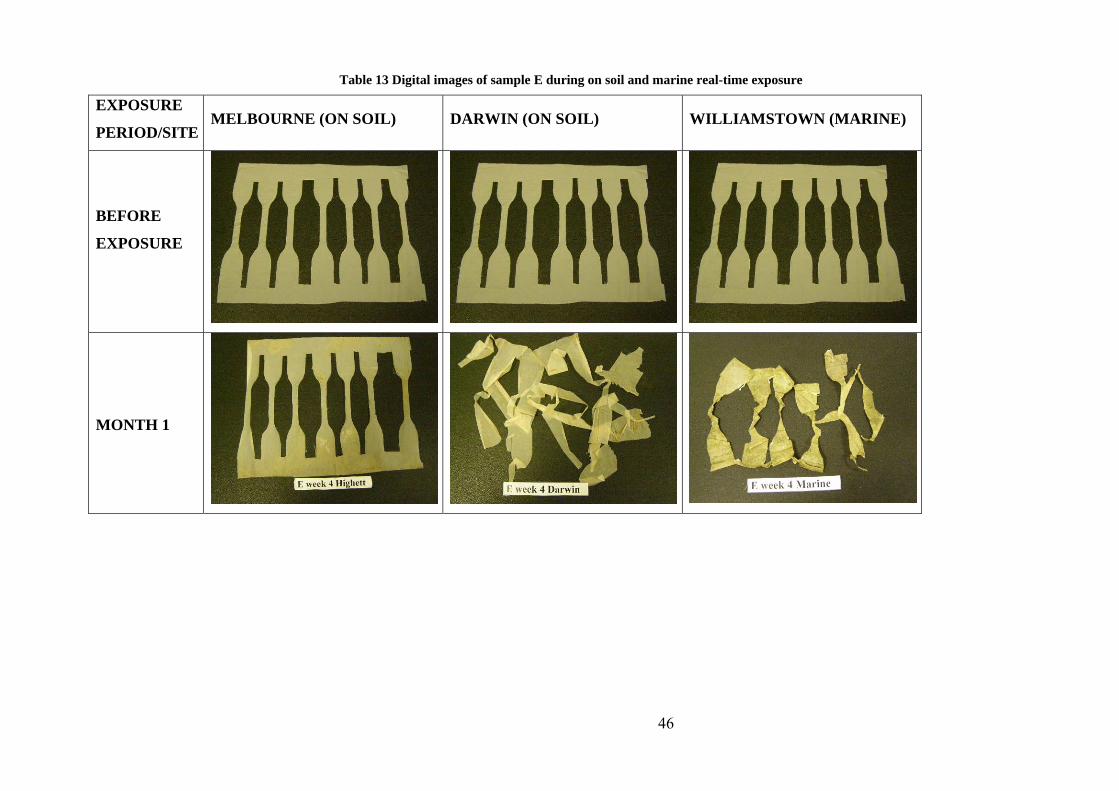
Sample E disintegrated rapidly under real-time soil environmental conditions; within 1 month exposure at Darwin site and after 2 months exposure
at Melbourne site. Films became very brittle and no intact sample was recovered after 2 months of on-soil exposure. Film samples deformed upon
exposure to marine conditions. Biofouling of samples was observed within 1st month of marine exposure and further affected their rate of
disintegration and deterioration over time.
46
Table 13 Digital images of sample E during on soil and marine real-time exposure
EXPOSURE
PERIOD/SITEMELBOURNE (ON SOIL) DARWIN (ON SOIL) WILLIAMSTOWN (MARINE)
BEFORE
EXPOSURE
MONTH 1

47
MONTH 2
MONTH 3
NO SAMPLE REMAINED
MONTH 4
NO SAMPLE REMAINED
NO SAMPLE REMAINED
MONTH 5 NO SAMPLE REMAINED NO SAMPLE REMAINED
NO SAMPLE REMAINED

48
MONTH 6 NO SAMPLE REMAINED NO SAMPLE REMAINED
NO SAMPLE REMAINED
MONTH 7 NO SAMPLE REMAINED NO SAMPLE REMAINED
NO SAMPLE REMAINED
MONTH 8 NO SAMPLE REMAINED NO SAMPLE REMAINED
NO SAMPLE REMAINED
MONTH 9 NO SAMPLE REMAINED NO SAMPLE REMAINED
NO SAMPLE REMAINED
Sample F test specimens disintegrated after 4 weeks on soil exposure at Darwin site and within 3 months exposure at Melbourne site. Once
disintegrated, samples were lost to strong winds and/or rainfall. During marine exposure, biofouling of samples was observed although samples
retained their form during 9 months exposure period.

49
Table 14 Digital images of sample F during on soil and marine real-time exposure
EXPOSURE
PERIOD/SITEMELBOURNE (ON SOIL) DARWIN (ON SOIL) WILLIAMSTOWN (MARINE)
BEFORE
EXPOSURE
MONTH 1

50
MONTH 2
NO SAMPLE REMAINED
MONTH 3
NO SAMPLE REMAINED
MONTH 4
NO SAMPLE REMAINED
NO SAMPLE REMAINED

51
MONTH 5
NO SAMPLE REMAINED
NO SAMPLE REMAINED
MONTH 6
NO SAMPLE REMAINED
NO SAMPLE REMAINED
MONTH 7
NO SAMPLE REMAINED
NO SAMPLE REMAINED

52
MONTH 8
NO SAMPLE REMAINED
NO SAMPLE REMAINED
MONTH 9
NO SAMPLE REMAINED
NO SAMPLE REMAINED
LOST IN THE SEA
Sample G specimens became brittle as on-soil weathering progressed, and disintegration of samples was observed after 2- 3 months exposure
period. Film samples break easily and no intact samples could be recovered after 3 months. Marine exposure resulted in discoloration of films owing
to marine conditions and growth of algae on its surface.

53
Table 15 Digital images of sample G during on soil and marine real-time exposure
EXPOSURE
PERIOD/SITEMELBOURNE (ON SOIL) DARWIN (ON SOIL) WILLIAMSTOWN (MARINE)
BEFORE
EXPOSURE
MONTH 1

54
MONTH 2
MONTH 3
MONTH 4
NO SAMPLE REMAINED

55
MONTH 5
NO SAMPLE REMAINED
NO SAMPLE REMAINED
MONTH 6
NO SAMPLE REMAINED
NO SAMPLE REMAINED
MONTH 7
NO SAMPLE REMAINED
NO SAMPLE REMAINED

56
MONTH 8
NO SAMPLE REMAINED
NO SAMPLE REMAINED
MONTH 9
NO SAMPLE REMAINED
NO SAMPLE REMAINED
LOST IN THE SEA

57
4.2. Gravimetric weight analysis
Difference in weights of samples before and after exposure to real-time on soil and
marine conditions was used to monitor degradation of test materials over time. Precautions
were taken to gently handle the samples so as to minimize damage, if any.
4.2.1 On soil real-time exposure
As the time exposure time progressed, the samples started becoming brittle. It was
estimated that initially samples appeared to have gained weight instead of losing and this could
be attributed to dirt/soil adhering to the films or moisture absorbed during exposure period.
Some of the grass or soil particles were found embedded into the films and difficult to remove
easily. Visual assessment suggested that samples disintegrated relatively faster at Darwin site
as compared to those exposed at Melbourne. An overall %weight loss for samples A, B, C, D,
E and G was observed at Melbourne site. In comparison, film samples B, D and G at Darwin
exposure site showed loss in their total weights just before they disintegrated; samples A and C
were estimated to gain weight and samples E and F could not be analysed as they disintegrated
within first month of exposure (Figures 11 and 12). A summary of test results for each test
sample before their disintegration is provided in Table 17 and 18

58
-250
-200
-150
-100
-50
0
50
0 1 mth 2 mths 3 mths 4 mths 5 mths 6 mths 7 mths 8 mths 9 mths
On-soil exposure at Melbourne site (months)
% w
eig
ht
chan
ge
D A B C E F G
Figure 11 On soil real-time exposure at Melbourne (VIC)
-250
-200
-150
-100
-50
0
50
0 1 mth 2 mths 3 mths 4 mths 5 mths 6 mths 7 mths 8 mths
On soil exposure at Darwin site (months)
% w
eig
ht
chan
ge
A B C D F G
Figure 12 On soil real-time exposure at Darwin (NT)

59
4.2.2 Marine real-time exposure
Samples exposed to marine environment showed biofouling effect early during exposure
period and it progressed rapidly with time (Figures 13 and 14). Test specimens were found
covered with green algae and other invertebrates (suggesting onset of biofouling), and as the
exposure period progressed, films crumpled and started disintegrating. After 8 months, the
frame to which samples were attached broke and samples A, B, E, F and G were lost in the sea.
Figure 13 Biofouling of plastic specimens during marine exposure
Figure 14 Mesh bags containing test specimens after 6 months marine exposure; digital images showing
biofouling of samples in sea over time

60
As the samples wrinkled and folded over, the exposure to sunlight and other marine
conditions was non-uniform across the samples. In addition to biofouling, moisture absorbed
by test specimens could have affected weight measurements of specimens, thus resulting into
inconsistent weight analysis data presented in this study (Figure 15). An overall increase in
weight for all samples was observed.
-400
-350
-300
-250
-200
-150
-100
-50
0
50
0 1 mth 2 mths 3 mths 4 mths 5 mths 6 mths 7 mths 8 mths 9 mths
Marine exposure at Williamstown (months)
% w
eig
ht
chan
ge
A B C D E F G
Figure 15 Marine exposure at Williamstown (VIC)
4.3. Changes in mechanical properties
Tensile properties such as elongation, modulus and tensile strength of test specimens
were analysed to monitor effect of on-soil and marine weathering on mechanical properties of
film specimens analysed in this study.
4.3.1 On soil real-time exposure
Elongation vs exposure time. Results obtained in this study suggested that all test specimens
(A-G) showed significant reduction in elongation properties under on-soil weathering
conditions at both exposure sites (Figures 16 and 17). Data analysis suggested that this effect
was more rapid in Darwin samples in comparison to those exposed at Melbourne location.

61
0
100
200
300
400
500
600
0 1 2 3 4 5 6 7 8 9
Exposure period (months)
Elo
ng
atio
n a
t b
reak
(%
)A
B
C
D
E
F
G
Figure 16 Effect on elongation during on soil exposure at Melbourne (VIC)
0
100
200
300
400
500
600
0 1 2 3 4 5 6 7 8 9
Exposure period (months)
Elo
ng
atio
n a
t b
reak
(%
)
A
B
C
D
E
F
G
Figure 17 Effect on elongation during on soil exposure at Darwin (NT)
Modulus vs exposure time. Data analysis suggested that an overall increase in modulus was
observed for samples A, C and D due to samples becoming brittle with time (Figures 18 and

62
19). Film samples E, F and G did not show any change in modulus before they disintegrated
within first 2 months of exposure period.
0
400
800
1200
1600
2000
0 1 2 3 4 5 6 7 8 9
Exposure period (months)
Mo
du
lus
(MP
a)
A
B
C
D
E
F
G
Figure 18 Effect on Modulus during on soil exposure at Melbourne (VIC)
0
400
800
1200
1600
2000
0 1 2 3 4 5 6 7 8 9
Exposure period (months)
Mo
du
lus
(MP
a)
A
B
C
D
E
F
G
Figure 19 Effect on Modulus during on soil exposure at Darwin (NT)

63
Tensile strength vs exposure time. Results suggested that tensile strength of most test
samples reduced during exposure period. However, sample D maintained tensile strength for a
longer period of time (measurable up to 9 months) and sample B maintained tensile strength
for 5 months followed by a rapid drop off (Figures 20 and 21).
0
20
40
60
80
100
0 1 2 3 4 5 6 7 8 9
Exposure period (months)
Ten
sile
str
ess
at m
ax lo
ad (
MP
a)
A
B
C
D
E
F
G
Figure 20 Effect on tensile strength during on soil exposure at Melbourne (VIC)
0
20
40
60
80
100
0 1 2 3 4 5 6 7 8 9
Exposure period (months)
Ten
sile
str
ess
at m
ax lo
ad (
MP
a)
A
B
C
D
E
F
G
Figure 21 Effect on tensile strength during on soil exposure at Darwin (NT)

64
4.3.2 Marine real-time exposure
Elongation vs exposure time. The data analysis suggested overall decrease in tensile strength
during marine exposure (Figure 22), with samples C and D and the reference PE (sample G)
maintaining a measureable elongation at break up to 8 months of exposure .
0
100
200
300
400
500
600
0 1 2 3 4 5 6 7 8 9
Exposure period (months)
Elo
ng
atio
n a
t b
reak
(%
)
A
B
C
D
E
F
G
Figure 22 Effect on Elongation during marine exposure at Williamstown (VIC)
Modulus vs exposure period. The data analysis suggested overall decrease in tensile strength
during marine exposure (Figure 23), with polyolefin based samples (C, D, F and G)
maintaining a measureable modulus up to 8 months of exposure.

65
0
400
800
1200
1600
2000
0 1 2 3 4 5 6 7 8 9
Exposure period (months)
Mo
du
lus
(MP
a)A
B
C
D
E
F
G
Figure 23 Effect on Modulus during marine exposure at Williamstown (VIC)
Tensile strength vs exposure period. It was observed that tensile strength of all the test
samples reduced during exposure to marine conditions (Figure 24).
0
20
40
60
80
100
0 1 2 3 4 5 6 7 8 9
Exposure period (months)
Ten
sile
str
ess
at m
ax lo
ad (
MP
a)
A
B
C
D
E
F
G
Figure 24 Tensile strength during marine exposure at Williamstown (VIC)

66
4.4. Changes in chemical structure
Degradation of polymers is subject to its physio-chemical structure, environmental
conditions (such as sunlight, temperature, moisture, pH and salinity) and microbial activity.
Polyolefins are known to degrade by an oxo-biodegradation mechanism. During exposure to
abiotic conditions such as UV or thermal conditions, low molecular weight oxidation products
are formed which are subsequently biodegraded and assimilated by environmental
microorganisms. The biodegradation of oxidized polyolefin fraction opens up the whole
structure and facilitate diffusion of water and other soluble compounds inside thus accelerating
the biodegradation process.
As mentioned earlier in the report, carbonyl index (CI) provides a means of quantifying
the oxidative degradation of polymers and predict changes in molecular weight (as Mw
decreases upon oxidation, the CI increases). Samples collected at each sampling time were
analysed by FTIR and carbonyl index was calculated for polyolefin based samples C, D, F and
G. Each one of these original samples (i.e. before exposure) had a CI value of 0.00. Later it
was observed that CI of degradable polyolefin samples increased on exposure to soil
environment suggesting initiation of degradation process. Sample F showed rapid increase in
CI at both the exposure sites; Melbourne and Darwin (0.08 and 0.17 respectively) followed by
sample C (0.13 and 0.11 respectively) and sample G (0.03 and 0.04 respectively). Sample D
did not show any change in CI during initial 4 months of on-soil exposure but as the time
progressed slight increase in CI was observed (approx 0.04 after 9 months exposure) (Figures
25 and 26).

67
0
0.02
0.04
0.06
0.08
0.1
0.12
0.14
0.16
0.18
0.2
0.22
0 1 2 3 4 5 6 7 8 9 10
Melbourne on soil exposure (months)
Car
bo
nyl
ind
ex (
CI)
Sample C
Sample D
Sample F
Sample G
Figure 25 Carbonyl index during on soil exposure at Melbourne (VIC)
0
0.02
0.04
0.06
0.08
0.1
0.12
0.14
0.16
0.18
0.2
0.22
0 1 2 3 4 5 6 7 8 9 10
Darwin on soil exposure (months)
Car
bo
nyl
ind
ex (
CI)
Sample C
Sample D
Sample F
Sample G
Figure 26 Carbonyl index during on soil exposure at Darwin (NT)
Degradable polyolefin-based test films exposed to marine environment were also
analysed and no changes in CI were observed. Comparative FTIR spectra of all test specimens
are presented in Appendix B.

68
4.4.1 Accelerated UV exposure using xenon-arc unit
During present study, all the test films (A-G) were exposed to accelerated UV irradiations
for a period of 28 days and CI was calculated for polyolefin based samples. As mentioned
earlier, the CI of un-exposed polyolefin based samples C, D, F and G was 0.00. A marked
increase in CI value (approx 0.2) was observed for sample C after UV treatment indicating
oxidation of test material and formation of low molecular weight products (Figure 27). The CI
for polyolefin samples D, F and G was estimated to be approx 0.04, 0.02 and 0.003
respectively. Based on these results it is hypothesised that an extended period UV exposure
might be required for abiotic oxidation of these materials into lower molecular weight
products. However, molecular weight analysis of these oxidized samples is necessary to make
any further comments on their oxidation levels.
Comparative FTIR spectra of mesh bag and all 7 xenon-arc exposed test specimens are
presented in Appendix B.
0
0.02
0.04
0.06
0.08
0.1
0.12
0.14
0.16
0.18
0.2
0.22
After 1 month xenon-arc exposure
Car
bo
nyl
ind
ex (
CI)
Sample C
Sample D
Sample F
Sample G
Figure 27 Carbonyl index after accelerated UV exposure in xenon-arc

69
4.5. Respirometric biodegradation
The oxidized test specimens (A-G) were exposed to simulated soil and marine conditions
in a biodegradation test unit and their rate of biodegradation was assessed over a period of 5
months.
4.5.1 In soil biodegradation
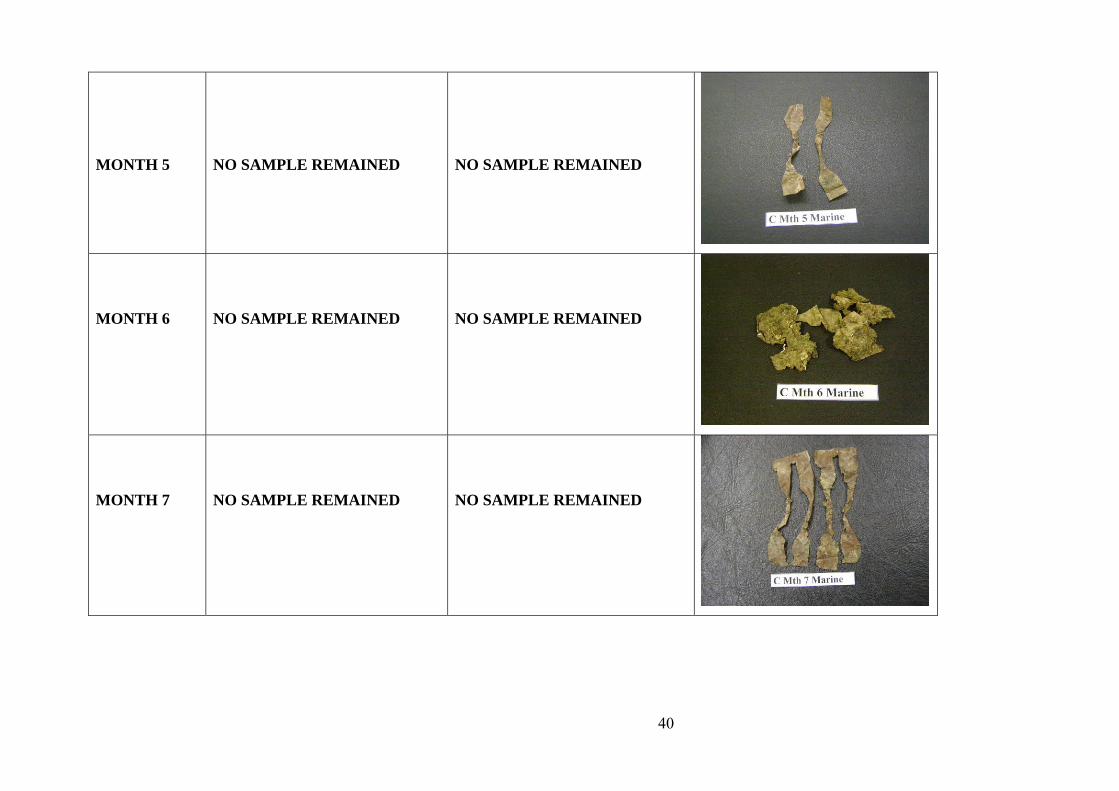
Digital images of the samples were taken at the end of the test (Figure 28). It was found
that degradable film samples A and E disintegrated into smaller pieces over time and in the end
it was difficult to separate them from soil particles. Other test samples namely, B, C, D, F and
G did not show any marked changes to their sample structure.
A slow but steady increase in the cumulative CO2 was observed for all seven test samples
(Figure 29). Results suggested that biodegradation of reference sample cellulose, and oxidized
test samples A and E was initiated within a week of incubation in soil. The rate of
biodegradation of the cellulose was more than 70% after 45 days and it reached approx 100%
at the end of the test. Meanwhile test samples A and E achieved 60% and 70% biodegradation
respectively (Figure 30) suggesting that non-polyolefin based samples were biodegradable in
soil under the specified set of conditions. The remaining test samples B, C, D, F and G had an
extended lag phase and a relatively slower rate of biodegradation. Sample C appeared to
degrade more steadily after almost 3 months of incubation in soil and it reached approx 23% at
the end of the test. Initially it was observed that the rate of biodegradation of blank soil sample
was higher relative to soil containing samples F and G. This may have been due to microbial
activity in the soil being influenced by addition of these two test samples but it quickly
recovered to normal after approx 2 weeks. Further work would have to be done to confirm the
exact reason for this observation. Film sample B, D, F and G did not show any relevant
changes in their rate of biodegradation over 5 months period (11%, 4%, 11% and 7%
respectively). Sample B which is made from bioderived products did not biodegrade
significantly under soil conditions. It is possible that abiotic and/or biotic trigger to initiate
biodegradation of sample B was lacking in the present test system. Samples C, D, F and G
were polyolefin-based samples and carbonyl index results suggested that sample C showed
highest concentration of carbonyl groups among these samples. Since, polyolefins degrade by a
combination of oxidation and biodegradation process, it is likely that these test samples did not
70
oxidize completely to generate low- molecular weight products that could be easily degraded
and assimilated by soil microorganisms.
Soil is a complex heterogeneous environment. Its physio-chemical properties could
influence the activity and structure of its microbial communities. The results obtained in this
study reflect the rate of degradation of test materials under specific set of environmental
conditions and soil characteristics. Any natural variation in the test conditions could result into
variable test data. It is recommended to repeat the tests using soil from different sites, and
using set of different test conditions (UV exposure, temperature, pH and moisture) to obtain a
more reliable test results.

71
A B C D
E F G cellulose
Figure 28 Digital images of test samples after biodegradation in soil; samples A and E disintegrated into smaller size.
Arrows point towards remaining film samples

72
0
5
10
15
20
25
30
0 20 40 60 80 100 120 140
Number of days
Cu
mu
lati
ve C
O2
(g/v
esse
l, M
ean
)Blank soil
A
B
C
D
E
F
G
Cellulose
Figure 29 Cumulative CO2 evolution during biodegradation of test samples in soil
-10
0
10
20
30
40
50
60
70
80
90
100
110
0 10 20 30 40 50 60 70 80 90 100 110 120 130 140 150
Number of days
Deg
ree
of
bio
deg
rad
atio
n (
%)
Soil A
Soil B
Soil C
Soil D
Soil E
Soil F
Soil Cellulose
Soil G
Figure 30 Rate of biodegradation of test samples in soil

73
4.5.2 In marine biodegradation
Test specimens were exposed to accelerated marine conditions in laboratory and changes
in their physical appearance was monitored at regular intervals. Sample A sample size
appeared to disintegrate and degrade during marine exposure, followed by sample E. On the
other hand, sample B did not show any change for first 2 months and then started disintegrating
slowly and by the end of 5 months no intact pieces were visible. Digital images of test
specimens after approx 5 months of exposure in marine are presented below (Figure 31).
On analysis of the rate of biodegradation during the initial 3 weeks of the study it was
observed that the blank marine sample had higher rate of CO2 evolution relative to marine
containing test specimens. This may have been due to microbial activity in the marine water
being influenced by addition of these two test samples but it quickly recovered to normal
thereafter (Figure 32 and 33). Further work would have to be done to confirm the exact reason
for this observation. The rate of biodegradation of cellulose in marine water was more than
60% after approx 83 days and it reached almost 90% at the end of the test (Figure 33). Samples
A and E biodegraded to approx 87% and 70% suggesting that these materials were easily
biodegradable in marine under specified set of conditions. Biodegradation of sample B started
relatively slow and after almost 3 months it rapidly increased and completely disintegrated
and/or biodegraded by the end of the test. These results suggested that specified marine
conditions (especially moisture and/or marine microorganisms) played an important role
during biodegradation of sample B. A steady rate of biodegradation was observed for sample C
and it achieved approx 55% biodegradation by the end of the test. Polyolefin-based samples D,
F and G were found to biodegraded at extremely slow rates, achieving approx 36%, 28% and
21% respectively after 5 months exposure.
Degradation of degradable plastics in marine is subject to UV exposure, biofouling and
microbial activity under aerobic marine conditions (floating plastics) or anaerobic marine
sediments (non-floating plastics). In the present study, samples were oxidized using accelerated
UV exposure and then subjected to aerobic marine conditions under laboratory conditions. The
test results obtained in this study exclude the impact of biofouling on these test materials. It is
not clearly understood what impact, if any, biofouling would have on the rate of
biodegradation of these test specimens. It is therefore suggested to repeat the test under
different set of test conditions (pH, temperature, duration of UV exposure) and using sea water
from other locations (same or different seasons/years) to obtain reliable data.

74
A B C D
E F G cellulose Figure 31 Digital images of test samples after biodegradation in marine; sample B disintegrated completely, samples A and E were significantly reduced. Arrows point
towards remaining film samples

75
0
5
10
15
20
25
0 20 40 60 80 100 120 140
Number of days
Cu
mu
lati
ve C
O2
(g/v
esse
l, M
ean
)Blank marine
A
B
C
D
E
F
G
Cellulose
Figure 32 Cumulative CO2 evolution during biodegradation of test samples in marine
-10
0
10
20
30
40
50
60
70
80
90
100
110
0 10 20 30 40 50 60 70 80 90 100 110 120 130 140 150
Number of days
Deg
ree
of
bio
deg
rad
atio
n (
%)
Marine A
Marine B
Marine C
Marine D
Marine E
Marine F
Marine Cellulose
Marine G
Figure 33 Rate of biodegradation of test samples in marine

76
5. Conclusions
A rigorous scientific investigation into degradation of generic types of degradable
plastics currently available in the Australian market, to study their performance and impact on
two relevant litter environments in Australia - on soil and marine was completed.
In stage 1 of this project a report was completed that included literature review and
methodologies for monitoring the rate of degradation of plastics under real time and simulated
environment conditions typical of litter – on soil and in marine. These methodologies were
designed through consultation with the project Technical Review committee are described in
detail in Appendix A.
In stage 2 of the project, six (6) plastic specimens belonging to four (4) major classes of
degradable plastics were selected for assessment (Table 16).
Table 16 Summary of sample class and class description
Sample designation Class Class description2
A iii Non-polyolefin with bio-derived component
B iv Bio-derived
C ii Polyolefin with bio-derived component
D i Polyolefin with prodegradant
E iii Non-polyolefin with bio-derived component
F i Polyolefin with prodegradant
G - HDPE baseline
To capture the diversity of different climates in which these samples may ultimately end up
samples were set up for real-time exposure on soil (9 months maximum) at two different sites –
2 The full definition of all terms can be found in the glossary of terms found at the end of this document Bio-derived: being derived
from a biological source (not petrochemical), examples of bio-derived polymers include starches, proteins and polylactic acid.
Polyolefin: polymer produced from polymerization of simple olefin (CnH2n); examples are polyethylene and polypropylene produced
from olefin ethylene and propylene respectively. Most commonly derived from a petrochemical resource. Non-polyolefin: polymer
typically derived from a petrochemical resource but not a simple olefin (CnH2n) examples include polyesters such as polycaprolactone; Prodegradant: any substance or a factor that promotes degradation examples include transition metals.

77
Melbourne (temperate climate) and Darwin (tropical climate), and in marine conditions at the
salt water immersion exposure site managed by The Defence Science and Technology
Organisation (DSTO) at Williamstown (VIC). At each sampling time, exposed specimens were
analysed to monitor changes in physical appearance, colour, total weight, tensile properties
(tensile strength, modulus and elongation at break) and chemical structure. A detailed summary
of sample analysis over time at all three sites is shown in tables 17 to 19 for on-soil temperate
climate, on-soil tropical climate and in marine respectively. The weight variation and
mechanical properties reported in these tables are the last measureable test result before
disintegration of each sample.
For real-time exposure, comparative disintegration has been predominantly assessed
based on mechanical performance (when elongation is less than 5% of its original value
measured at time zero) and visual imaging (when sample is too damaged to obtain mechanical
properties). This definition is based on current guidelines on aging of polymers and cannot be
used by itself as a measure of degradability.
At the tropical (Darwin) real-time soil exposure site sample A and E (non-polyolefin
with bio-derived component) and samples C (polyolefin with bio-derived component)
disintegrated in 2 months. Samples D and F (polyolefin with prodegradant) showed some
variability. Sample D disintegrated in 5 months and sample F started to disintegrate after 1
month with no sample retrievable after that point. Sample B (bio-derived) disintegrated after 6
months. HDPE disintegrated at month 3 and no sample retrievable after 4 months.
At the temperate (Melbourne) real-time soil exposure site sample A and E (non-
polyolefin with bio-derived component) disintegrated relatively quickly in 4 and 2 months
respectively, sample C (polyolefin with bio-derived component) disintegrated in 3 months.
Samples D and F (polyolefin with prodegradant) showed some variability. Sample D
disintegrated in 5 months and sample F started to disintegrate at 3 months with no sample
retrievable after that point. Sample B (bio-derived) disintegrated after 6 months. HDPE had
disintegrated at month 4 and no sample retrievable after 5 months.
At the real-time marine exposure site, sample B (bio-derived) disintegrated rapidly
within a month, samples A and E (non-polyolefin with bio-derived component) disintegrated
within 2 months. Sample C (polyolefin with bio-derived component) disintegrated after 9
months (but was heavily fouled after 6 months). Sample D (polyolefin with prodegradant) was
still intact at 9 months and sample F (polyolefin with prodegradant) and the baseline HDPE

78
were still intact at 8 months (it must be noted that both samples F and HDPE may have still
been intact at 9 months but they were lost at sea due to extreme weather conditions).

79
Table 17 Summary of test results: On-soil real time exposure study Melbourne (VIC)
Sample Class description Appearance Weight variation
Elongation Stress Modulus CI
A Non-polyolefin w/bio-derived component
Brittle and disintegrated after 4 months
-18% -91% -79% +40% NA
B Bio-derived Brittle and disintegrated after 6 months
- 27% -52% -5% -11% NA
C Polyolefin w/ bio-derived component
Brittle and disintegrated after 3 months
- 25% -86% -81% +81% 0.13
D Polyolefin with prodegradant Brittle, disintegrated after 5 months
- 15% -99% -83% +22% 0.04
E Non-polyolefin w/bio-derived component
Disintegrated after 2 months - 12% -95% -59% -12% NA
F Polyolefin with prodegradant Brittle and disintegrated after 3 months
+35% -83% -91% -13% 0.08
G HDPE baseline Brittle and disintegrated after 4 months
-41% -99% -53% -3% 0.03

80
Table 18 Summary of test results: On-soil real time exposure study Darwin (NT)
Sample Class description Appearance Weight variation
Elongation Stress Modulus CI
A Non-polyolefin w/bio-derived component
Brittle and disintegrated after 2 months
+9% -98% -55% +61% NA
B Bio-derived Brittle and disintegrated after 6 months
-25% -84% -82% +19% NA
C Polyolefin w/ bio-derived component
Brittle and disintegrated after 2 months
+25% -99% -77% +33% 0.10
D Polyolefin with prodegradant Brittle, disintegrated after 5 months
-6% -99% -70% +57% 0.03
E Non-polyolefin w/bio-derived component
Disintegrated within 2 month No intact sample left
-92% -43% +4% NA
F Polyolefin with prodegradant Disintegrated after 1 month No intact sample left
-99% -64% - 0.04
G HDPE baseline Brittle and disintegrated after 3 months
-30% -99% -61% -12% 0.03

81
Table 19 Summary of test results: In marine real time exposure study Williamstown (VIC)
Sample Class description Appearance Weight
variation
Elongation Tensile Modulus CI
A Non-polyolefin w/bio-derived component
Crumpled and lost structure after 1 month
+96% -81% -53% -52% NA
B Bio-derived Brittle and lost form within 1 month
+14% -63% -45% - NA
C Polyolefin w/ bio-derived component
Wrinkled and lost form after 8 months
+61% -82% -67% -32% 0.00
D Polyolefin with prodegradant Wrinkled but maintained form even after 9 months
+121% -66% -57% -43% 0.00
E Non-polyolefin w/bio-derived component
Crumpled and lost structure after 2 months
+54% -87% -60% +>100% NA
F Polyolefin with prodegradant Wrinkled but maintained form even after 8 months
+106% -93% -65% -61% 0.00
G HDPE baseline Wrinkled but maintained form even after 8 months
+44% -73% -55% -33% 0.00

82
The results from Tables 17 to 19 have been simplified and summarised in Table
20 below, with simple trend lines overlaid. The disintegration end point is described
as the time at which samples could not be tested or tensile elongation was less than
5% of the original elongation of unexposed systems.
In summary samples A and E (non-polyolefin with bioderived component)
disintegrated quite rapidly in all environments, with sample A appearing to be more
susceptible to moisture. Sample B (bioderived) was highly susceptible to moisture but
quite stable on soil (in the environments in which we tested). Sample C (polyolefin
with bioderived) was sensitive to UV and marine fouling blocking UV, which may
have reduced the disintegration rate in the marine environment. Samples D and F
(polyolefin with prodegradant) showed similar trends to samples C in which marine
fouling may have reduced the UV exposure and thus ability to disintegrate and/or
degrade. Sample G (baseline HDPE) showed similar trends to the other polyolefin
containing samples (albeit a longer disintegration time) with the exception of sample
D. Variation in base polyolefin formulation (for example the addition of processing
stabilisers) could also account for some variable disintegration in polyolefin
containing samples.
Table 20 Summary of disintegration end point for all exposure sites
C
F
G
8
DEA
B
Marine
(Melbourne)
BDGAC
E
FOn-soilTropical
(Darwin)
BDA
G
C
F
EOn-soil
Temperate (Melbourne)
97654321months
C
F
G
8
DEA
B
Marine
(Melbourne)
BDGAC
E
FOn-soilTropical
(Darwin)
BDA
G
C
F
EOn-soil
Temperate (Melbourne)
97654321months

83
To determine the rate of biodegradation on exposure to simulated soil and marine
environment, plastic specimens were first subjected to accelerated UV exposure using
xenon-arc lamps for 1 month (approximately 1 month exposure in xenon-arc is
equivalent to 8-12 months real time exposure, although it must be noted that this is
highly variable due to climate differences) followed by biodegradation under simulated
soil and marine conditions for 5 months at 28°C, the results are described in detail
below and summarised in Table 21.
Simulated in-soil, samples A and E (non-polyolefin with bio-derived component)
showed the highest biodegradation, reaching 59.5% and 69.5% biodegradation
respectively. Sample C (polyolefin with bio-derived component) obtained the next
highest level of biodegradation (23.4%). Sample B (bio-derived) obtained a
biodegradation level of 10.7% showing that bio-derived materials can have longevity
provided temperature and moisture are minimised. Samples D and F (polyolefin with
prodegradant) obtained biodegradation levels of 4.2% and 10.9% respectively, within
error or the baseline HDPE 6.8%.
Simulated marine water, sample B (bio-derived) showed the highest
biodegradation reaching 99.9%, showing its susceptibility to moisture. Samples A and
E (non-polyolefin with bio-derived component) followed reaching 87.0% and 69.7%
biodegradation respectively. Sample C (polyolefin with bio-derived component)
obtained the next highest level of biodegradation (55.4%) It is noteworthy that sample
C had the highest carbonyl index value among all the polyolefin based samples and its
rate of degradation was higher in soil and marine relative to samples D, F, and G, this
means it was more oxidised. Samples D and F (polyolefin with prodegradant) obtained
biodegradation levels of 35.9% and 27.5% respectively and the baseline HDPE 21.1%,
indicating that moisture can play a significant role in increasing the biodegradation of
polyolefins containing prodegradants.
It is noteworthy that sample C had the highest CI value among all the polyolefin
based samples and its rate of degradation was higher in soil and marine relative to
samples D, F, and G.

84
Table 21 Summary of test results from in-lab biodegradation study
Sample Class description Carbonyl index after xenon-arc exposure
% Biodegradation in
Soil (after 150 days)
% Biodegradation in
Marine (after 150 days)
A Non-polyolefin w/bio-derived component NA 59.5 87.0
B Bio-derived NA 10.7 99.9
C Polyolefin w/ bio-derived component 0.2 23.4 55.4
D Polyolefin with prodegradant 0.04 4.2 35.9
E Non-polyolefin w/bio-derived component NA 69.5 69.7
F Polyolefin with prodegradant 0.02 10.9 27.5
G HDPE baseline 0.00 6.8 21.1
Cellulose NA 103.2 91.4
* please note that a standard error of ± 5% should be considered when comparing % biodegradation values

85
6. Recommendations:
6.1. Test Methodologies
Scope
The study presents a guide to testing of degradable plastics on soil and marine
environments under defined conditions and a general approach to compare and rank
degradation of degradable plastics under defined test conditions. This study describes
methods of real-time exposure and a simulated environment in the laboratory.
Real-time conditions
This study specifies a method to establish disintegration and degradability of
degradable plastics under real-time exposure conditions, where test samples are exposed to
different environmental conditions, for example tropical and temperate climates for on soil
and marine exposure. Any natural variation in the test conditions could result in variable test
data, see Table 22 for the list of potential environmental variables. Although intended for
marine (salt water) environments, the marine exposure process might be used with outdoor
brackish water and fresh water environments as well.
Table 22 List of environmental variables for real-time exposure
pH
Precipitation
Temperature
Sunlight
Salinity
Element contents such as carbon, nitrogen and heavy metals Microbial activity
Fouling
Tides/water currents
Wind velocity

86
Simulated environment in the laboratory
In the laboratory a two tier system was used, this involved an accelerated photo-
oxidation process (Tier I) and biodegradation measured via CO2 evolution (Tier II). It is also
suggested that a third tier (Tier III) be added to assess the toxicity of residues from the
biodegradation step. In Tier I specimens were first subjected to accelerated UV exposure
using xenon-arc lamps for 1 month, followed by biodegradation (Tier II) under simulated soil
and marine conditions for 5 months at 28°C. At the end of the test, biodegradability in soil
and marine was determined by measuring the carbon-dioxide evolved in a closed
respirometer. The results reflect the rate of degradation of test materials under specific set of
environmental conditions.
It is suggested that laboratory results are not extrapolated to actual real-time exposure
environments due to the variability in the natural environment.
6.2. Performance criteria for a plastic claiming to be degradable
Real-time conditions
It is difficult to ascertain performance criteria for a plastic claiming to be degradable
in real-time exposure conditions. We recommend the only performance criteria which can be
specified is for embrittlement and this would be defined as the time required for the film to
reach 5% or less of its original elongation at break in real-time exposure conditions, it is
recommended that embrittlement cannot by itself be sued as a measure of degradability. It is
further recommended that other chemical methods such as carbonyl index (specifically for
polyolefins containing prodegradants) and molecular weight also be used as a measure of
degradation of the materials. Although it must be noted that both these chemical methods
cannot be used when sample has been lost from the test frames.
Simulated environment in the laboratory
For the results to be valid in the laboratory test in marine water or soil (as described in
ISO 17566:2003) the following criteria must be met:

87
A negative reference of exactly the same base polyolefin as that containing pro-
oxidant additive must be included in the study for comparison
The degree of biodegradation of the positive reference material must be more than
60% at the plateau phase or at the end of the test
The CO2 evolved from the replicate blanks (marine water or soil) are within 20% of
the mean at the plateau phase or at the end of the test
The standard guide D6954-04 recommends that materials reach a Mw of 5000dal or
less in Tier I, prior to the biodegradation step (Tier II). We believe a comprehensive study
should be undertaken on the changes in molecular weight of the polymers before, during and
after degradation steps to clarify a) if this is a valid and b) if 1 month of xenon-arc exposure
is sufficient.
This has particular relevance when studying the differences in degradation of sample D
and the baseline HDPE. Sample D containing an oxo-degradable additive may have had a
significantly different base polyolefin formulation (for example the addition of processing
stabilisers). To solve this issue all oxo-degradable polyolefin samples submitted for testing
must be tested in parallel with the same grade of base polyolefin as a reference.
For a plastic claiming to be degradable in a simulated laboratory environment it must
achieve both of the following performance criteria:
After an accelerated photo-oxidation process the sample must be embrittled (film to
reach 5% or less of its original elongation at break) or reach an appropriately low
molecular weight, see also discussion above in relation to D6954-04.
and
The degree of biodegradation of the material must be more than 60% at the plateau
phase or at the end of the biodegradation test
This 6 month (1 month UV exposure plus 5 months biodegradation) study did not provide
conclusive evidence of the length of time that would form an appropriate criterion for a plastic
claiming to be degradable. It could be considerably longer than 5 months biodegradation
undertaken in this study (for polyolefins with prodegradants up to 2 years may be required to
88
achieve these levels of biodegradation, it is however recommended that an upper time limit
must be defined in any standard and/or test protocol which is developed).
Assessing toxicity risks from the degradation process was outside the terms of this study.
6.3. Benefits and Risks
Benefits
The results from the study will assist policy makers, technical experts and legislators to
develop relevant test protocols and hence Australian standards to assess and certify
performance of degradable plastics on soil and in marine environments and policies over the
use of different types of plastic packaging materials.
As this study incorporates a cross section of degradable plastics from the marketplace
the results could also be integrated into a sustainable design program (such as the Design for
Sustainability Program – PACIA) for the design and manufacturing of plastic materials or
products. These design criteria would need to take into account the whole of life of the
plastic material or product including its end use.
Risks
Broadly, the test results obtained from exposure of plastic samples to real-time
conditions and in-lab simulated conditions indicate that the rate of disintegration and
degradation of non-polyolefin based samples (in all test environments) and bio-derived
sample (particularly in the marine environment) is faster relative to polyolefin based samples.
However, the study found that it was difficult to quantify the degree of disintegration and
degradation under natural conditions as there were a large number of variable factors in
natural environment that could influence the biodegradability of test materials. It is
recommended the real-time weathering experiment at different exposure sites be repeated, in
different seasons or years to gain better insight into the rate and extent of biodegradation of
these materials under natural environmental conditions. It is also recommended the samples
of various film thicknesses are also included in testing to study the effects of film thickness
on degradation rates. A comprehensive study of the changes in molecular weight of the
polymers before, during and after degradation steps would also add value and understanding
to studies of this kind. Under natural conditions it was also difficult to differentiate between
disintegration (where sample was fragmented and lost from the test frames) and degradation

89
in which the sample is ultimately mineralised, for this reason it is recommended that real-
time weathering experiments could not be used as a stand-alone system to assess degradation.
The in-lab study was relevant in terms of quantitatively measuring the rate of
biodegradation of these test materials under accelerated test conditions. Caution is advised in
using these test results in predicting the performance of test materials in real-time for a number
of reasons. Firstly, the in-lab study exposed samples to sequential steps of UV exposure
followed by biodegradation, whereas in real-time these steps would occur simultaneously, this
variation could affect the final result. Also in the marine study we have not considered the
effect of biofouling which could affect the biodegradation rate. These and other variable
factors must be considered.
Any natural variation in the test conditions (UV exposure, temperature, pH and
moisture) and site location (soil/marine characteristics, marine population, salt-
content, tides) could result in variable test data and reversal of results when ranking
samples.
Microbes in a particular environment may favourably biodegrade one particular
polymer in preference to another, this could also cause reversal of results when
changing environments.

90
7. Terminology
Abiotic
Non-living physical and chemical factors in the environment such as light, temperature,
atmospheric gases etc
Assimilation
to consume and incorporate nutrients into substance of the body
Algae
Represent a large and diverse group of simple, typically autotrophic organisms, ranging
from unicellular to multicellular forms
Biodegradation
the process of breaking down of organic substances by microorganisms in the presence of
oxygen to carbon dioxide, water, biomass and mineral salts or any other elements that are
present
Bio-derived: being derived from a biological source (not petrochemical), examples of
bio-derived polymers include starches, proteins and polylactic acid.
Biofouling
process in which marine organisms like bacteria, diatoms (single-celled algae), seaweed
or barnacles (a type of marine crustacean) attach to substrates in contact with water for a
period of time
Bioreactors
glass vessels that contain compost/soil (source of inoculum) with or without test materials
Blank
refers to compost samples without any added test materials
Brittle
state of material when it fails without significant deformation (strain) when subjected to
stress
Carbonyl Index
is the ratio of the intensity (or total area) of the carbonyl absorption band (i.e C=O) in the
FTIR spectrum to that of another band (such as C-H stretching or bending) in the

91
spectrum. Increase in carbonyl index after exposure maybe an indication that oxidation
occurred during the exposure
Colony Forming Units
measure of living or viable bacterial and fungal numbers
Crumple
collapse; to contract into irregular fold
Degradation
the process of breakdown of an organic compound under the influence of one or more
environmental factors such as heat, light or chemicals and resulting into undesirable
change in the in-use properties of the material
Desiccators
sealable laboratory equipment containing suitable desiccant used for storage of moisture
sensitive materials
Disintegration
physical falling apart of a material into small fragments
Deterioration
decline in the quality of structures over a period of time due to the chemical or physical
action of the environment
Elongation
The percentage elongation reported in the tensile test is the maximum elongation of the
gage length divided by the original gage length
Fouling
unwanted accumulation of either living organisms (biofouling) or non-living substances
(inorganic or organic)
Fume hood
ventilation device used to limit the exposure to hazardous dust or vapours
Gravimetric analysis
consists of set of methods for the quantitative determination of an analyte based on the
mass of a solid
Herbicide

92
A type of pesticide used to kill unwanted plant growth
Inoculum
in microbiology terms, inoculum is the biological material (such as bacterial, fungi or
viral cells) added to the medium to start a culture (microbial growth)
Invertebrates
group of animals with no backbone, found in both terrestrial and aquatic habitats, and
includes animals ranging from sponges, corals and seastars etc to insects, crabs and
worms etc.
Irradiation
process by which an item is exposed to UV or other radiations
Loss on ignition
is an analytical test method and it consists of incinerating a sample of the material at a
specified temperature until its mass ceases to change. It is widely used as an indication of
the amount of organic matter content in the material
Mature compost
is a complex organic materials that has been transformed into a stable humus by
microorganisms
Microorganisms
microscopic size organisms such as bacteria, fungi and viruses
Microcrystalline
a crystallized substance that contains small crystals visible only through microscopic
examination
Modulus or modulus of elasticity
mathematical description of an object’s tendency to be deformed elastically when a force
is applied to it (λ = stress/strain)
Moisture content
refers to quantity of water in a mass of soil or compost; expressed in percentage by
weight of water in the mass
93
Non-polyolefin: polymer typically derived from a petrochemical resource but not a
simple olefin (CnH2n) example include polyesters such as polycaprolactone
Pesticide
any substance that prevents, destroys, repels any pest
Plastic
A material that contains large molecular weight organic polymeric substances as an
essential ingredient
pH
is the measure of acidity or basicity of a solution
Polyolefin
polymer produced from polymerization of simple olefin (CnH2n); examples are
polyethylene and polypropylene produced from olefin ethylene and propylene
respectively. Most commonly derived from a petrochemical resource.
Prodegradant
any substance or a factor that promotes degradation
Respirometry
science used in determining the rates of degradation of any organic or biological material
that releases quantifiable gasses
Tensile strength
the maximum strength that a material can withstand before failure
Temperate
climate without extremes of temperature and precipitation
Tropical
climate with a constant temperature mainly above 18°C
Theoretical amount of evolved carbon dioxide
the maximum theoretical amount of carbon dioxide evolved after completely oxidizing a
chemical compound, calculated from the molecular formula and expressed as milligrams
of carbon dioxide evolved per milligram or gram of test compound
94
Total organic carbon
all the carbon present in organic matter
Vegetation
refers to the ground cover provided by plants
Weed
refers to unwanted plant species that grows and reproduces aggressively
Weathering
is a complex interaction of physical, chemical and biological processes that alters the
physical and chemical state of materials
8. Appendix A – methodology attached as separate document
9. Appendix B – supporting data attached as separate
document