Embed Size (px)
Citation preview
Degradation of Humic Acid by Photocatalytic ReactionUsing Nano-sized ZnO/Laponite Composite (NZLC)
Jong Kyu Kim & Jawaher Alajmy & Alisson Carraro Borges &
Jin Chul Joo & Hosang Ahn & Luiza Cintra Campos
Received: 13 June 2013 /Accepted: 10 September 2013 /Published online: 4 October 2013# Springer Science+Business Media Dordrecht 2013
Abstract Humic acids (HA) are known as the precur-sors of carcinogenic compounds formed by the disinfec-tion of drinking water. While conventional treatmentswere found to be inefficient HA removal processes indrinking water, advanced oxidation processes have beenproven to have a significant effect in the treatment of HA.The degradation of HA was investigated using nano-sized zinc oxide (ZnO)/laponite composite (NZLC).The reactions occurred in a UVC reactor by consideringfollowing variables: pH, initial HA concentration, cata-lyst loading, addition of hydrogen peroxide (H2O2), andcatalyst reuse. Water samples containing HA wereanalysed by ultraviolet/visible spectrophotometer andhigh-performance size-exclusion chromatography. InitialHA concentrations were tested by the Langmuir–Hin-shelwood model with k andKads values, determined to be0.126 mg/L.min and 0.0257 L/mg, respectively. Thechange in pH affected the HA degradation efficiency bythe photocatalytic activity where it was higher underacidic conditions rather than alkaline ones. Optimal cat-alyst loading was proved to be a constrained factor in
influencing the photocatalytic efficiency: the increase ofcatalyst concentration enhanced the HA decompositionefficiency up to an optimum value of 20 g/L, where therewas no further degradation with excess loading. Theaddition of H2O2 was investigated through homogenousand heterogeneous photocatalysis, and, heterogeneousphotocatalysis showed higher removal efficiency due tothe combined effect of both catalysts and H2O2. Finally,NZLC was effective for reuse and exhibited an excellentstability after six times of usage.
Keywords Nano-ZnO/laponite composites .
Photocatalysis . Adsorption . Humic acid
1 Introduction
Humic substances are ubiquitous throughout aquaticand terrestrial ecosystems and are formed by biochem-ical and chemical reactions during the decay and trans-formation of plant and microbial remains (Stevenson1994; Andre and Khraisheh 2009). Generally, humicacid (HA) is considered to be the major fraction andextractable component of humic substances, and con-sist of heterogeneous mixtures of macromolecules witha wide range of molecular weights and different func-tional groups (Stevenson 1994).
According to Goel et al. (1995), the presence of HA indrinking water resources can lead to unfavourable issues,such as trihalomethane formation, bacterial regrowth inthe distribution system and reduced granular-activatedcarbon adsorbent bed life. HA also creates a membranefouling and promotes the formation of bio-film in water
Water Air Soil Pollut (2013) 224:1749DOI 10.1007/s11270-013-1749-0
J. K. Kim : J. Alajmy : L. C. Campos (*)Department of Civil, Environmental, and GeomaticEngineering, University College London, London, UKe-mail: [email protected]
A. C. BorgesDepartment of Agricultural Engineering, Federal Universityof Viçosa, Viçosa, Brazil
J. C. Joo :H. AhnWater Resource and Environment Research Department,Korea Institute of Construction Technology, Goyang-si,South Korea
pipelines as well. Furthermore, the fate, transport, bio-availability, and chemical and biological reactivity of or-ganic and inorganic contaminants have been found to bestrongly affected by the complex interactions betweenHAand contaminants (Daifullah et al. 2004; Terdkiatburanaet al. 2008; Joo et al. 2012).
Although the removal of HA from various waterresources is important, the conventional water treat-ment processes such as granular activated carbon andcoagulation-flocculation have been found to be inef-fective (Wang et al. 2000). More recently, photocatalyticreactions with semiconductors have received more at-tention for HA removal from water (Mori et al. 2013).
Although TiO2 has always been reported as the mosteffective metal oxide for use as a photocatalyst (Chen andRay 1999; Ao and Lee 2003; Doll and Frimmel 2005;Gaya and Abdullah 2008), several studies reported thatZnO has exhibited higher photodegradation performance,compared with TiO2, especially under visible light. Addi-tionally, ZnO has similar wide band-gap energy (i.e.3.2 eV) to that of TiO2, which is suitable for long wave-length applications. Thus, in this study, the feasibility ofapplying a new zinc oxide/Laponite composite (Doriaet al. 2013) to removeHA fromwater as a valid alternativeto TiO2 was evaluated.
The specific objectives of the study are (1) to exam-ine the photocatalytic degradation of HA as a functionof initial concentrations of HA, (2) to determine theeffects of pH, catalyst loading, and adding hydrogenperoxide (H2O2) on the photocatalytic degradation ofHA, and (3) to investigate the efficiency for reuse ofthe nano-sized ZnO/laponite composite (NZLC) on thephotocatalytic degradation of HA. The results of thisstudy advance our knowledge of effective HA degra-dation processes in water treatment.
2 Materials and Methods
2.1 Materials
All HA solutions were prepared using HA sodium salt(technical grade H16752) purchased from Sigma Aldrich.Laponite (hydrous sodium lithium magnesium silicate) isa synthetic crystalline layered silicate colloid with crystalstructure and composition closely resembling the naturalsmectite clay hectorite (Cummins 2007). Laponite has alayer structure which, in dispersion in water, is in theform of disc-shaped crystals, and can be visualised as a
two-dimensional inorganic polymer. In this study, com-mercially available Laponite RD (Rockwood, UK) hasbeen used as the support media with high light perme-ability. Nano-sized ZnO powder (purity 99 %, averageparticle size 100 nm, surface area>90 m2/g, bulk density0.2 g/cm3) was purchased from Nabond TechnologiesCo. (KL, Hong Kong). The NZLC were prepared bycombining 300 g of ZnO, 15 g of Laponite and 0.3 g ofpolyvinyl alcohol (PVA) by weight. Laponite was mixedwith nano-sized ZnO to form exfoliated silicate layerswhen dispersed in water. Whereas the crystal surface hasa negative charge of 50–55 mmol 100 g−1, the edges ofthe crystal have small localised positive charges (i.e. 4–5 mmol 100 g−1) generated by absorption of hydroxylgroups. Thus, an open and macro-porous structure ofaggregates (face edge), in which ZnO can be immo-bilised on the face, can be created. PVA was added as abinding agent for the physico-chemical bonding, follow-ed by crosslinking spinning of PVA applied in thepresence of boric acid (2.0 M).
2.2 Preparation of HA Solution
A stock of HA solution (100 mg/L) was prepared bydissolving 0.1 g of HA powder in 1 L of millipore water.The solution wasmixed using a magnetic stirrer to ensurethat the HAwas completely dissolved. All HA solutionsprepared from the stock solution were pre-treated prior tothe addition of NZLC by filtration using 0.45 μmWhatman cellulose nitrate membrane filters (Whatman,USA) to remove all suspended solids. The stock solutionwas stored in the refrigerator and was used for sampledilutions required later.
2.3 Analytical Methods
To investigate molecular weight fractionation from amixture of HA molecules during their adsorption anddegradation, ultraviolet/visible (UV/vis) spectrometryand high-pressure size exclusion chromatography(HPSEC) were used prior to analysis. Standard cali-bration curve relating absorbance and concentration,generated at 254 nm, was linear with an R-Squaredvalue of 0.999. HPSEC employed consists of a high-pressure liquid chromatography (HPLC) system(Perkin Elmer, UK), series 200 pump, an autosampler,and a UV/vis detector operated at a wavelength of254 nm and controlled by the TotalChrom software.The chromatography was carried out on BIOSEP-
1749, Page 2 of 10 Water Air Soil Pollut (2013) 224:1749
SEC-S3000 (7.8×300 mm) and a Security Guard fixedwith a GFC-3000 disc (4 mm) columns at 25 °C. Theeluent used for the mobile phase was 0.01 M sodiumacetate at a flow rate of 0.5 mL/min. This eluent wasused to minimise reactions of HA with the stationaryphase of the columns and was optimised with suitableionic strength and pH. Sodium polystyrene sulfonates(PSS) of 6 K, 15 K, 33 K Daltons (PSS standardspurchased from Poly-sciences, Inc., PA) and acetone(58 Da, HPLC grade, Aldrich) were used as standards.
2.4 Batch Photocatalytic Reactor and ExperimentalDesign
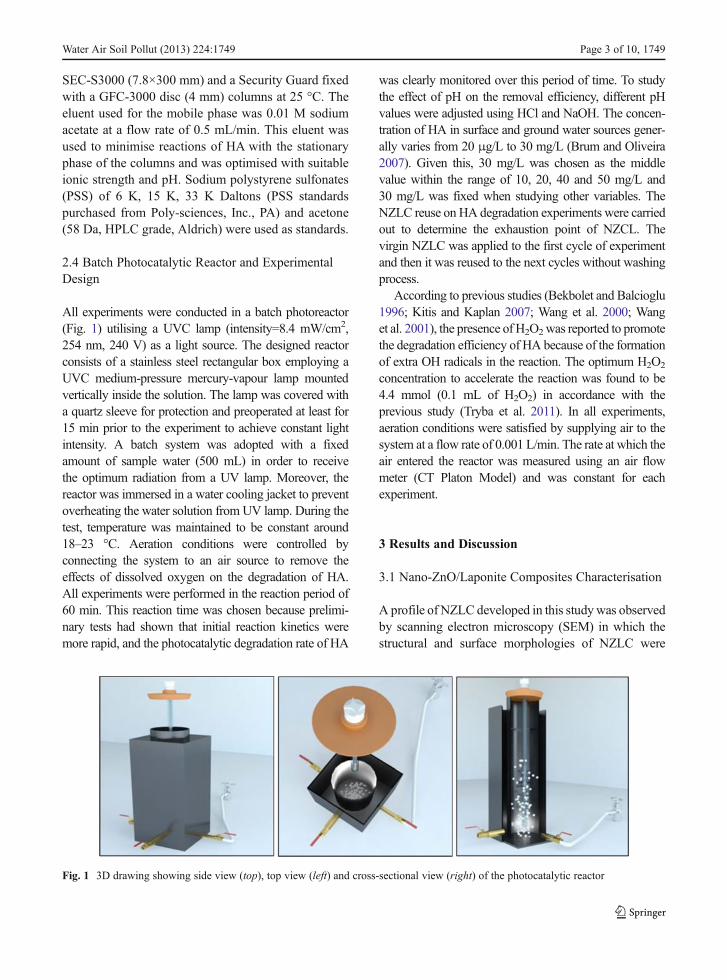
All experiments were conducted in a batch photoreactor(Fig. 1) utilising a UVC lamp (intensity=8.4 mW/cm2,254 nm, 240 V) as a light source. The designed reactorconsists of a stainless steel rectangular box employing aUVC medium-pressure mercury-vapour lamp mountedvertically inside the solution. The lamp was covered witha quartz sleeve for protection and preoperated at least for15 min prior to the experiment to achieve constant lightintensity. A batch system was adopted with a fixedamount of sample water (500 mL) in order to receivethe optimum radiation from a UV lamp. Moreover, thereactor was immersed in a water cooling jacket to preventoverheating the water solution from UV lamp. During thetest, temperature was maintained to be constant around18–23 °C. Aeration conditions were controlled byconnecting the system to an air source to remove theeffects of dissolved oxygen on the degradation of HA.All experiments were performed in the reaction period of60 min. This reaction time was chosen because prelimi-nary tests had shown that initial reaction kinetics weremore rapid, and the photocatalytic degradation rate of HA
was clearly monitored over this period of time. To studythe effect of pH on the removal efficiency, different pHvalues were adjusted using HCl and NaOH. The concen-tration of HA in surface and ground water sources gener-ally varies from 20 μg/L to 30 mg/L (Brum and Oliveira2007). Given this, 30 mg/L was chosen as the middlevalue within the range of 10, 20, 40 and 50 mg/L and30 mg/L was fixed when studying other variables. TheNZLC reuse on HA degradation experiments were carriedout to determine the exhaustion point of NZCL. Thevirgin NZLC was applied to the first cycle of experimentand then it was reused to the next cycles without washingprocess.
According to previous studies (Bekbolet and Balcioglu1996; Kitis and Kaplan 2007; Wang et al. 2000; Wanget al. 2001), the presence of H2O2was reported to promotethe degradation efficiency of HA because of the formationof extra OH radicals in the reaction. The optimum H2O2
concentration to accelerate the reaction was found to be4.4 mmol (0.1 mL of H2O2) in accordance with theprevious study (Tryba et al. 2011). In all experiments,aeration conditions were satisfied by supplying air to thesystem at a flow rate of 0.001 L/min. The rate at which theair entered the reactor was measured using an air flowmeter (CT Platon Model) and was constant for eachexperiment.
3 Results and Discussion
3.1 Nano-ZnO/Laponite Composites Characterisation
A profile of NZLC developed in this studywas observedby scanning electron microscopy (SEM) in which thestructural and surface morphologies of NZLC were
Water Air Soil Pollut (2013) 224:1749 Page 3 of 10, 1749
Fig. 1 3D drawing showing side view (top), top view (left) and cross-sectional view (right) of the photocatalytic reactor
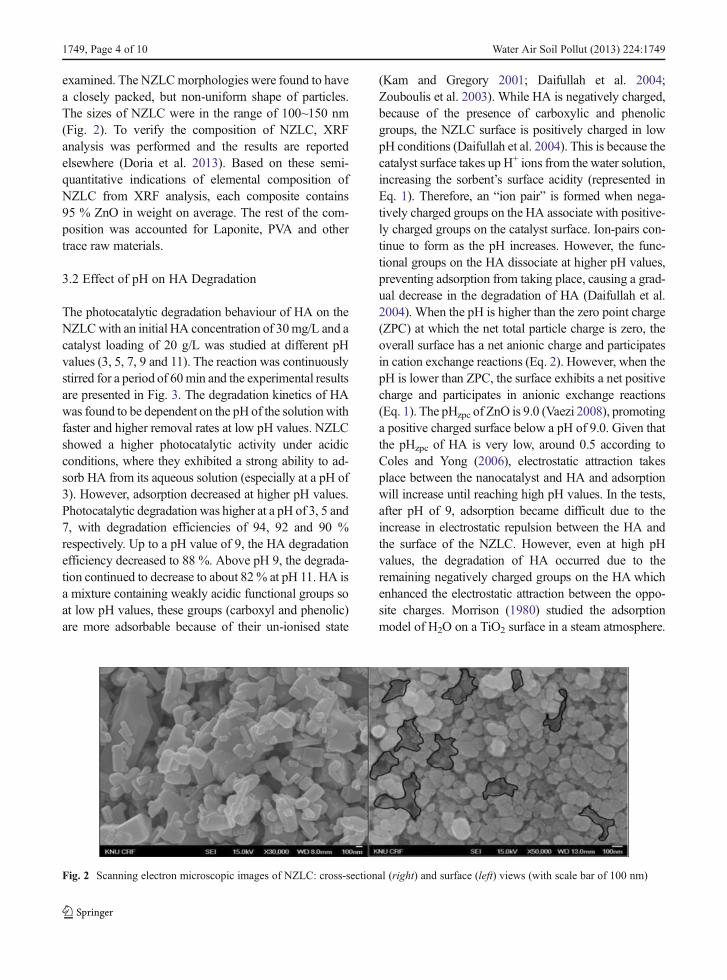
examined. The NZLCmorphologies were found to havea closely packed, but non-uniform shape of particles.The sizes of NZLC were in the range of 100~150 nm(Fig. 2). To verify the composition of NZLC, XRFanalysis was performed and the results are reportedelsewhere (Doria et al. 2013). Based on these semi-quantitative indications of elemental composition ofNZLC from XRF analysis, each composite contains95 % ZnO in weight on average. The rest of the com-position was accounted for Laponite, PVA and othertrace raw materials.
3.2 Effect of pH on HA Degradation
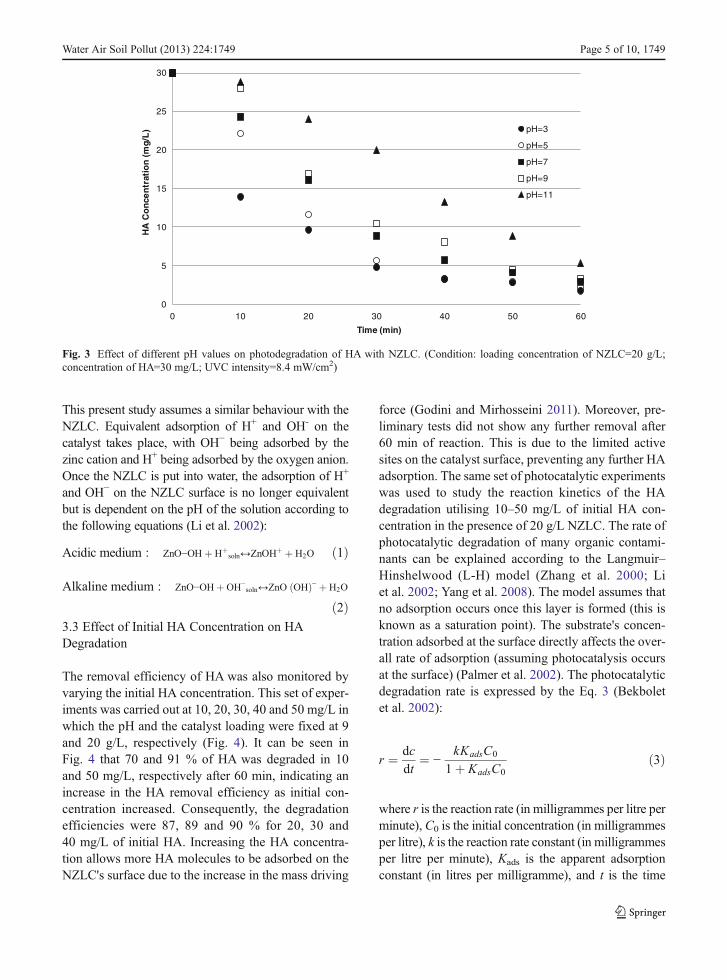
The photocatalytic degradation behaviour of HA on theNZLCwith an initial HA concentration of 30mg/L and acatalyst loading of 20 g/L was studied at different pHvalues (3, 5, 7, 9 and 11). The reaction was continuouslystirred for a period of 60min and the experimental resultsare presented in Fig. 3. The degradation kinetics of HAwas found to be dependent on the pH of the solutionwithfaster and higher removal rates at low pH values. NZLCshowed a higher photocatalytic activity under acidicconditions, where they exhibited a strong ability to ad-sorb HA from its aqueous solution (especially at a pH of3). However, adsorption decreased at higher pH values.Photocatalytic degradation was higher at a pH of 3, 5 and7, with degradation efficiencies of 94, 92 and 90 %respectively. Up to a pH value of 9, the HA degradationefficiency decreased to 88 %. Above pH 9, the degrada-tion continued to decrease to about 82% at pH 11. HA isa mixture containing weakly acidic functional groups soat low pH values, these groups (carboxyl and phenolic)are more adsorbable because of their un-ionised state
(Kam and Gregory 2001; Daifullah et al. 2004;Zouboulis et al. 2003). While HA is negatively charged,because of the presence of carboxylic and phenolicgroups, the NZLC surface is positively charged in lowpH conditions (Daifullah et al. 2004). This is because thecatalyst surface takes up H+ ions from the water solution,increasing the sorbent’s surface acidity (represented inEq. 1). Therefore, an “ion pair” is formed when nega-tively charged groups on the HA associate with positive-ly charged groups on the catalyst surface. Ion-pairs con-tinue to form as the pH increases. However, the func-tional groups on the HA dissociate at higher pH values,preventing adsorption from taking place, causing a grad-ual decrease in the degradation of HA (Daifullah et al.2004). When the pH is higher than the zero point charge(ZPC) at which the net total particle charge is zero, theoverall surface has a net anionic charge and participatesin cation exchange reactions (Eq. 2). However, when thepH is lower than ZPC, the surface exhibits a net positivecharge and participates in anionic exchange reactions(Eq. 1). The pHzpc of ZnO is 9.0 (Vaezi 2008), promotinga positive charged surface below a pH of 9.0. Given thatthe pHzpc of HA is very low, around 0.5 according toColes and Yong (2006), electrostatic attraction takesplace between the nanocatalyst and HA and adsorptionwill increase until reaching high pH values. In the tests,after pH of 9, adsorption became difficult due to theincrease in electrostatic repulsion between the HA andthe surface of the NZLC. However, even at high pHvalues, the degradation of HA occurred due to theremaining negatively charged groups on the HA whichenhanced the electrostatic attraction between the oppo-site charges. Morrison (1980) studied the adsorptionmodel of H2O on a TiO2 surface in a steam atmosphere.
1749, Page 4 of 10 Water Air Soil Pollut (2013) 224:1749
Fig. 2 Scanning electron microscopic images of NZLC: cross-sectional (right) and surface (left) views (with scale bar of 100 nm)
This present study assumes a similar behaviour with theNZLC. Equivalent adsorption of H+ and OH- on thecatalyst takes place, with OH− being adsorbed by thezinc cation and H+ being adsorbed by the oxygen anion.Once the NZLC is put into water, the adsorption of H+
and OH− on the NZLC surface is no longer equivalentbut is dependent on the pH of the solution according tothe following equations (Li et al. 2002):
Acidic medium : ZnO−OHþ Hþsoln↔ZnOHþ þ H2O ð1Þ
Alkaline medium : ZnO−OHþ OH−soln↔ZnO OHð Þ− þ H2O
ð2Þ3.3 Effect of Initial HA Concentration on HADegradation
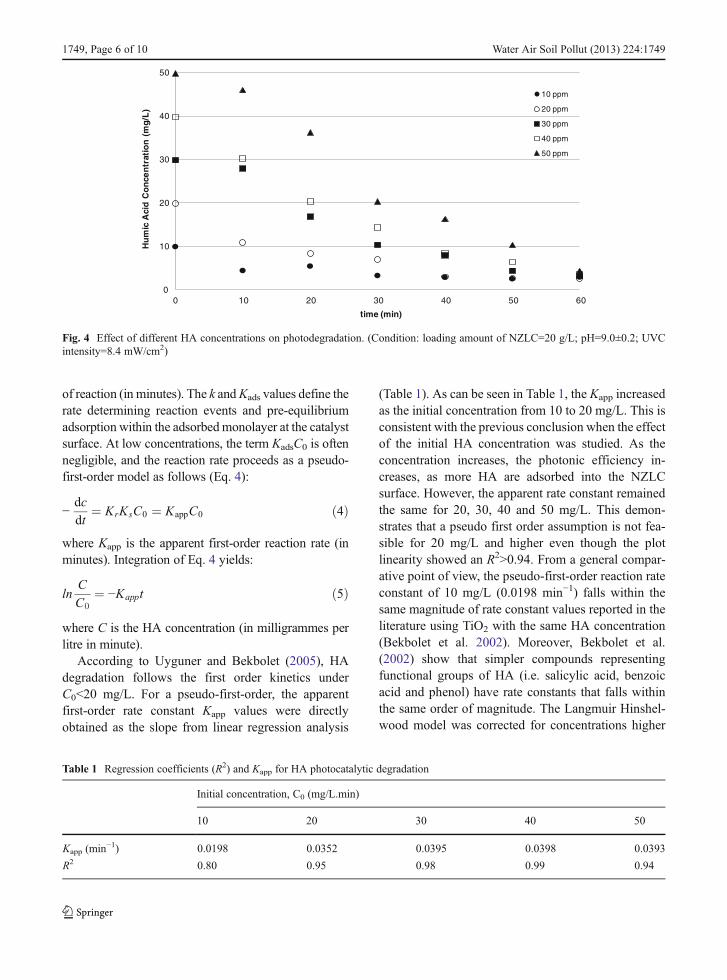
The removal efficiency of HA was also monitored byvarying the initial HA concentration. This set of exper-iments was carried out at 10, 20, 30, 40 and 50 mg/L inwhich the pH and the catalyst loading were fixed at 9and 20 g/L, respectively (Fig. 4). It can be seen inFig. 4 that 70 and 91 % of HA was degraded in 10and 50 mg/L, respectively after 60 min, indicating anincrease in the HA removal efficiency as initial con-centration increased. Consequently, the degradationefficiencies were 87, 89 and 90 % for 20, 30 and40 mg/L of initial HA. Increasing the HA concentra-tion allows more HA molecules to be adsorbed on theNZLC's surface due to the increase in the mass driving
force (Godini and Mirhosseini 2011). Moreover, pre-liminary tests did not show any further removal after60 min of reaction. This is due to the limited activesites on the catalyst surface, preventing any further HAadsorption. The same set of photocatalytic experimentswas used to study the reaction kinetics of the HAdegradation utilising 10–50 mg/L of initial HA con-centration in the presence of 20 g/L NZLC. The rate ofphotocatalytic degradation of many organic contami-nants can be explained according to the Langmuir–Hinshelwood (L-H) model (Zhang et al. 2000; Liet al. 2002; Yang et al. 2008). The model assumes thatno adsorption occurs once this layer is formed (this isknown as a saturation point). The substrate's concen-tration adsorbed at the surface directly affects the over-all rate of adsorption (assuming photocatalysis occursat the surface) (Palmer et al. 2002). The photocatalyticdegradation rate is expressed by the Eq. 3 (Bekboletet al. 2002):
r ¼ dc
dt¼ −
kKadsC0
1þ KadsC0ð3Þ
where r is the reaction rate (in milligrammes per litre perminute), C0 is the initial concentration (in milligrammesper litre), k is the reaction rate constant (in milligrammesper litre per minute), Kads is the apparent adsorptionconstant (in litres per milligramme), and t is the time
0
5
10
15
20
25
30
0 10 20 30 40 50 60
HA
Co
nce
ntr
atio
n (
mg
/L)
Time (min)
pH=3
pH=5
pH=7
pH=9
pH=11
Water Air Soil Pollut (2013) 224:1749 Page 5 of 10, 1749
Fig. 3 Effect of different pH values on photodegradation of HA with NZLC. (Condition: loading concentration of NZLC=20 g/L;concentration of HA=30 mg/L; UVC intensity=8.4 mW/cm2)
of reaction (in minutes). The k andKads values define therate determining reaction events and pre-equilibriumadsorption within the adsorbedmonolayer at the catalystsurface. At low concentrations, the term KadsC0 is oftennegligible, and the reaction rate proceeds as a pseudo-first-order model as follows (Eq. 4):
−dc
dt¼ KrKsC0 ¼ KappC0 ð4Þ
where Kapp is the apparent first-order reaction rate (inminutes). Integration of Eq. 4 yields:
lnC
C0¼ −Kappt ð5Þ
where C is the HA concentration (in milligrammes perlitre in minute).
According to Uyguner and Bekbolet (2005), HAdegradation follows the first order kinetics underC0<20 mg/L. For a pseudo-first-order, the apparentfirst-order rate constant Kapp values were directlyobtained as the slope from linear regression analysis
(Table 1). As can be seen in Table 1, the Kapp increasedas the initial concentration from 10 to 20 mg/L. This isconsistent with the previous conclusion when the effectof the initial HA concentration was studied. As theconcentration increases, the photonic efficiency in-creases, as more HA are adsorbed into the NZLCsurface. However, the apparent rate constant remainedthe same for 20, 30, 40 and 50 mg/L. This demon-strates that a pseudo first order assumption is not fea-sible for 20 mg/L and higher even though the plotlinearity showed an R2>0.94. From a general compar-ative point of view, the pseudo-first-order reaction rateconstant of 10 mg/L (0.0198 min−1) falls within thesame magnitude of rate constant values reported in theliterature using TiO2 with the same HA concentration(Bekbolet et al. 2002). Moreover, Bekbolet et al.(2002) show that simpler compounds representingfunctional groups of HA (i.e. salicylic acid, benzoicacid and phenol) have rate constants that falls withinthe same order of magnitude. The Langmuir Hinshel-wood model was corrected for concentrations higher
0
10
20
30
40
50
0 10 20 30 40 50 60
Hu
mic
Aci
d C
on
cen
trat
ion
(m
g/L
)
time (min)
10 ppm
20 ppm
30 ppm
40 ppm
50 ppm
Table 1 Regression coefficients (R2) and Kapp for HA photocatalytic degradation
Initial concentration, C0 (mg/L.min)
10 20 30 40 50
Kapp (min−1) 0.0198 0.0352 0.0395 0.0398 0.0393
R2 0.80 0.95 0.98 0.99 0.94
1749, Page 6 of 10 Water Air Soil Pollut (2013) 224:1749
Fig. 4 Effect of different HA concentrations on photodegradation. (Condition: loading amount of NZLC=20 g/L; pH=9.0±0.2; UVCintensity=8.4 mW/cm2)
than 10 mg/L. In order to determine the L-H parame-ters, Eq. 3 was re-written as (Eq. 6):
1
r¼ 1
KadkC0þ 1
kð6Þ
where Kad reflects the tendency of HA to be adsorbed bythe NZLC surface and k reflects reactivity value (Bekboletet al. 2002). To calculate both constants, a plot of thereciprocal rate (in minutes per litre per milligramme)versus the reciprocal of the initial concentration (in litresper milligramme) should generate a straight line with aslope value equal to 1
Kadkand a y-intercept equal to 1
k . The
results are presented in Table 2. Both k and Kads gavedifferent values, accounting for the different effect on HAdegradation. A higher reactivity constant demonstratesthat photocatalysis ability was stronger than adsorptionof the HA by the NZLC surface over the 60 min interval.
3.4 Effect of NZLC Loading on HA Degradation
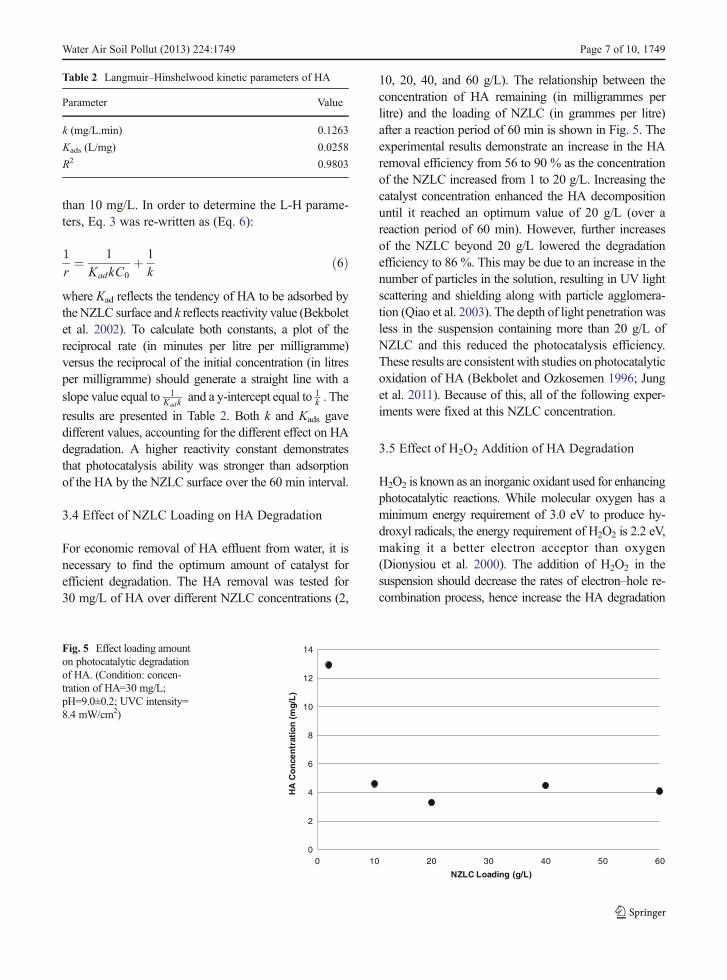
For economic removal of HA effluent from water, it isnecessary to find the optimum amount of catalyst forefficient degradation. The HA removal was tested for30 mg/L of HA over different NZLC concentrations (2,
10, 20, 40, and 60 g/L). The relationship between theconcentration of HA remaining (in milligrammes perlitre) and the loading of NZLC (in grammes per litre)after a reaction period of 60 min is shown in Fig. 5. Theexperimental results demonstrate an increase in the HAremoval efficiency from 56 to 90 % as the concentrationof the NZLC increased from 1 to 20 g/L. Increasing thecatalyst concentration enhanced the HA decompositionuntil it reached an optimum value of 20 g/L (over areaction period of 60 min). However, further increasesof the NZLC beyond 20 g/L lowered the degradationefficiency to 86 %. This may be due to an increase in thenumber of particles in the solution, resulting in UV lightscattering and shielding along with particle agglomera-tion (Qiao et al. 2003). The depth of light penetration wasless in the suspension containing more than 20 g/L ofNZLC and this reduced the photocatalysis efficiency.These results are consistent with studies on photocatalyticoxidation of HA (Bekbolet and Ozkosemen 1996; Junget al. 2011). Because of this, all of the following exper-iments were fixed at this NZLC concentration.
3.5 Effect of H2O2 Addition of HA Degradation
H2O2 is known as an inorganic oxidant used for enhancingphotocatalytic reactions. While molecular oxygen has aminimum energy requirement of 3.0 eV to produce hy-droxyl radicals, the energy requirement of H2O2 is 2.2 eV,making it a better electron acceptor than oxygen(Dionysiou et al. 2000). The addition of H2O2 in thesuspension should decrease the rates of electron–hole re-combination process, hence increase the HA degradation
Table 2 Langmuir–Hinshelwood kinetic parameters of HA
Parameter Value
k (mg/L.min) 0.1263
Kads (L/mg) 0.0258
R2 0.9803
0
2
4
6
8
10
12
14
0 10 20 30 40 50 60
HA
Co
nce
ntr
atio
n (
mg
/L)
NZLC Loading (g/L)
Fig. 5 Effect loading amounton photocatalytic degradationof HA. (Condition: concen-tration of HA=30 mg/L;pH=9.0±0.2; UVC intensity=8.4 mW/cm2)
Water Air Soil Pollut (2013) 224:1749 Page 7 of 10, 1749
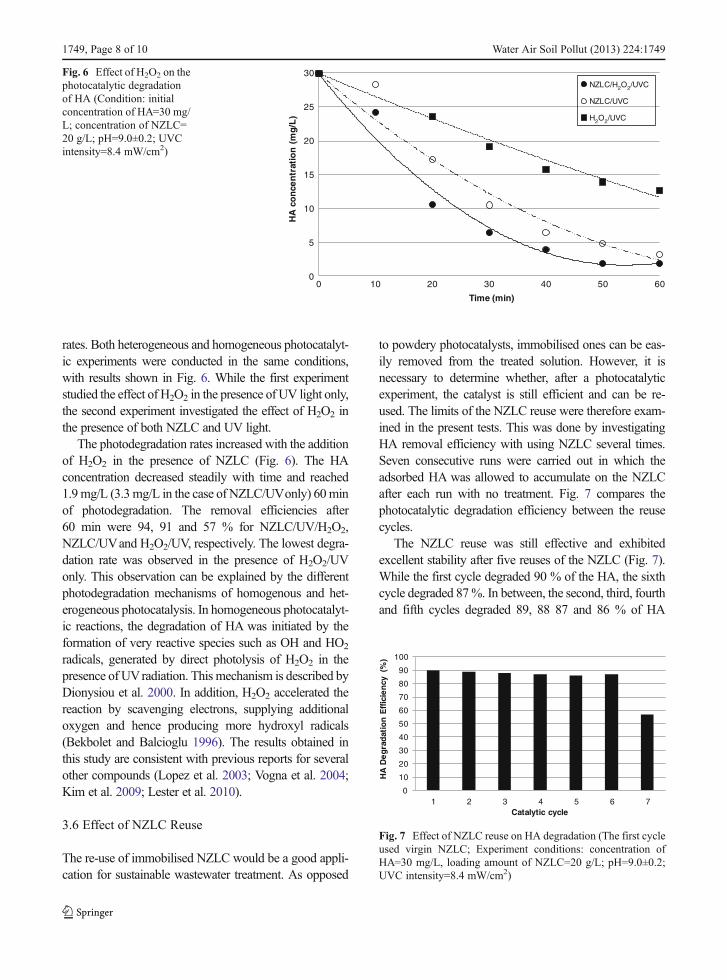
rates. Both heterogeneous and homogeneous photocatalyt-ic experiments were conducted in the same conditions,with results shown in Fig. 6. While the first experimentstudied the effect of H2O2 in the presence of UV light only,the second experiment investigated the effect of H2O2 inthe presence of both NZLC and UV light.
The photodegradation rates increased with the additionof H2O2 in the presence of NZLC (Fig. 6). The HAconcentration decreased steadily with time and reached1.9mg/L (3.3mg/L in the case of NZLC/UVonly) 60minof photodegradation. The removal efficiencies after60 min were 94, 91 and 57 % for NZLC/UV/H2O2,NZLC/UVand H2O2/UV, respectively. The lowest degra-dation rate was observed in the presence of H2O2/UVonly. This observation can be explained by the differentphotodegradation mechanisms of homogenous and het-erogeneous photocatalysis. In homogeneous photocatalyt-ic reactions, the degradation of HA was initiated by theformation of very reactive species such as OH and HO2
radicals, generated by direct photolysis of H2O2 in thepresence of UVradiation. This mechanism is described byDionysiou et al. 2000. In addition, H2O2 accelerated thereaction by scavenging electrons, supplying additionaloxygen and hence producing more hydroxyl radicals(Bekbolet and Balcioglu 1996). The results obtained inthis study are consistent with previous reports for severalother compounds (Lopez et al. 2003; Vogna et al. 2004;Kim et al. 2009; Lester et al. 2010).
3.6 Effect of NZLC Reuse
The re-use of immobilised NZLC would be a good appli-cation for sustainable wastewater treatment. As opposed
to powdery photocatalysts, immobilised ones can be eas-ily removed from the treated solution. However, it isnecessary to determine whether, after a photocatalyticexperiment, the catalyst is still efficient and can be re-used. The limits of the NZLC reuse were therefore exam-ined in the present tests. This was done by investigatingHA removal efficiency with using NZLC several times.Seven consecutive runs were carried out in which theadsorbed HA was allowed to accumulate on the NZLCafter each run with no treatment. Fig. 7 compares thephotocatalytic degradation efficiency between the reusecycles.
The NZLC reuse was still effective and exhibitedexcellent stability after five reuses of the NZLC (Fig. 7).While the first cycle degraded 90 % of the HA, the sixthcycle degraded 87%. In between, the second, third, fourthand fifth cycles degraded 89, 88 87 and 86 % of HA
0
5
10
15
20
25
30
0 10 20 30 40 50 60H
A c
on
cen
trat
ion
(m
g/L
)Time (min)
NZLC/H2O2/UVC
NZLC/UVC
H2O2/UVC
Fig. 6 Effect of H2O2 on thephotocatalytic degradationof HA (Condition: initialconcentration of HA=30 mg/L; concentration of NZLC=20 g/L; pH=9.0±0.2; UVCintensity=8.4 mW/cm2)
0
10
20
30
40
50
60
70
80
90
100
1 2 3 4 5 6 7
HA
Deg
rad
atio
n E
ffic
ien
cy (
%)
Catalytic cycle
Fig. 7 Effect of NZLC reuse on HA degradation (The first cycleused virgin NZLC; Experiment conditions: concentration ofHA=30 mg/L, loading amount of NZLC=20 g/L; pH=9.0±0.2;UVC intensity=8.4 mW/cm2)
1749, Page 8 of 10 Water Air Soil Pollut (2013) 224:1749
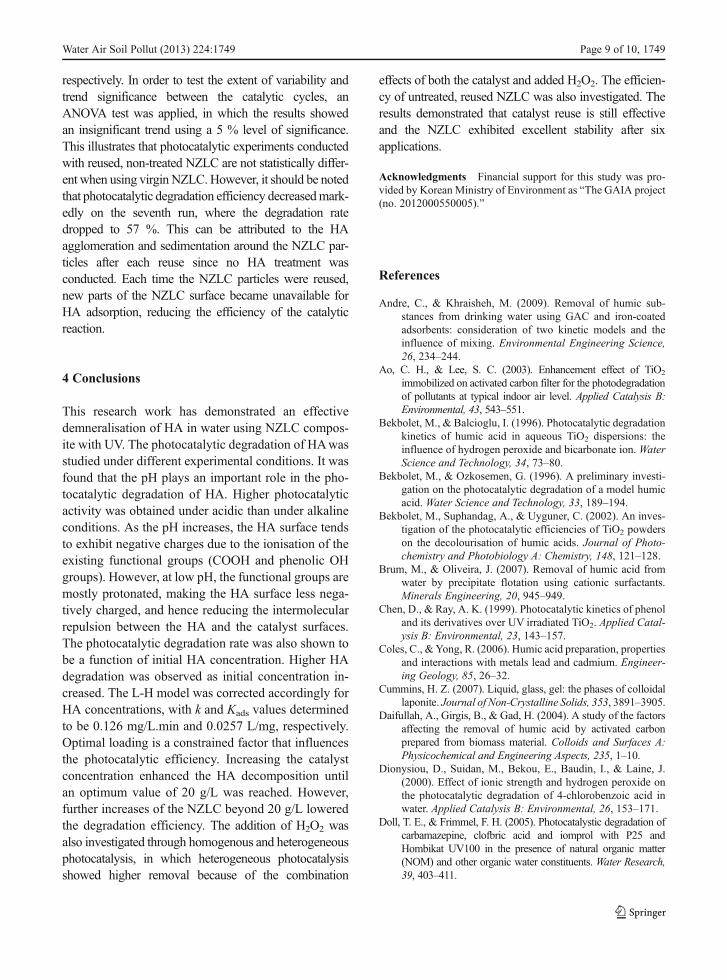
respectively. In order to test the extent of variability andtrend significance between the catalytic cycles, anANOVA test was applied, in which the results showedan insignificant trend using a 5 % level of significance.This illustrates that photocatalytic experiments conductedwith reused, non-treated NZLC are not statistically differ-ent when using virgin NZLC.However, it should be notedthat photocatalytic degradation efficiency decreasedmark-edly on the seventh run, where the degradation ratedropped to 57 %. This can be attributed to the HAagglomeration and sedimentation around the NZLC par-ticles after each reuse since no HA treatment wasconducted. Each time the NZLC particles were reused,new parts of the NZLC surface became unavailable forHA adsorption, reducing the efficiency of the catalyticreaction.
4 Conclusions
This research work has demonstrated an effectivedemneralisation of HA in water using NZLC compos-ite with UV. The photocatalytic degradation of HAwasstudied under different experimental conditions. It wasfound that the pH plays an important role in the pho-tocatalytic degradation of HA. Higher photocatalyticactivity was obtained under acidic than under alkalineconditions. As the pH increases, the HA surface tendsto exhibit negative charges due to the ionisation of theexisting functional groups (COOH and phenolic OHgroups). However, at low pH, the functional groups aremostly protonated, making the HA surface less nega-tively charged, and hence reducing the intermolecularrepulsion between the HA and the catalyst surfaces.The photocatalytic degradation rate was also shown tobe a function of initial HA concentration. Higher HAdegradation was observed as initial concentration in-creased. The L-H model was corrected accordingly forHA concentrations, with k and Kads values determinedto be 0.126 mg/L.min and 0.0257 L/mg, respectively.Optimal loading is a constrained factor that influencesthe photocatalytic efficiency. Increasing the catalystconcentration enhanced the HA decomposition untilan optimum value of 20 g/L was reached. However,further increases of the NZLC beyond 20 g/L loweredthe degradation efficiency. The addition of H2O2 wasalso investigated through homogenous and heterogeneousphotocatalysis, in which heterogeneous photocatalysisshowed higher removal because of the combination
effects of both the catalyst and added H2O2. The efficien-cy of untreated, reused NZLC was also investigated. Theresults demonstrated that catalyst reuse is still effectiveand the NZLC exhibited excellent stability after sixapplications.
Acknowledgments Financial support for this study was pro-vided by Korean Ministry of Environment as “The GAIA project(no. 2012000550005).”
References
Andre, C., & Khraisheh, M. (2009). Removal of humic sub-stances from drinking water using GAC and iron-coatedadsorbents: consideration of two kinetic models and theinfluence of mixing. Environmental Engineering Science,26, 234–244.
Ao, C. H., & Lee, S. C. (2003). Enhancement effect of TiO2
immobilized on activated carbon filter for the photodegradationof pollutants at typical indoor air level. Applied Catalysis B:Environmental, 43, 543–551.
Bekbolet, M., & Balcioglu, I. (1996). Photocatalytic degradationkinetics of humic acid in aqueous TiO2 dispersions: theinfluence of hydrogen peroxide and bicarbonate ion. WaterScience and Technology, 34, 73–80.
Bekbolet, M., & Ozkosemen, G. (1996). A preliminary investi-gation on the photocatalytic degradation of a model humicacid. Water Science and Technology, 33, 189–194.
Bekbolet, M., Suphandag, A., & Uyguner, C. (2002). An inves-tigation of the photocatalytic efficiencies of TiO2 powderson the decolourisation of humic acids. Journal of Photo-chemistry and Photobiology A: Chemistry, 148, 121–128.
Brum, M., & Oliveira, J. (2007). Removal of humic acid fromwater by precipitate flotation using cationic surfactants.Minerals Engineering, 20, 945–949.
Chen, D., & Ray, A. K. (1999). Photocatalytic kinetics of phenoland its derivatives over UV irradiated TiO2. Applied Catal-ysis B: Environmental, 23, 143–157.
Coles, C., & Yong, R. (2006). Humic acid preparation, propertiesand interactions with metals lead and cadmium. Engineer-ing Geology, 85, 26–32.
Cummins, H. Z. (2007). Liquid, glass, gel: the phases of colloidallaponite. Journal of Non-Crystalline Solids, 353, 3891–3905.
Daifullah, A., Girgis, B., & Gad, H. (2004). A study of the factorsaffecting the removal of humic acid by activated carbonprepared from biomass material. Colloids and Surfaces A:Physicochemical and Engineering Aspects, 235, 1–10.
Dionysiou, D., Suidan, M., Bekou, E., Baudin, I., & Laine, J.(2000). Effect of ionic strength and hydrogen peroxide onthe photocatalytic degradation of 4-chlorobenzoic acid inwater. Applied Catalysis B: Environmental, 26, 153–171.
Doll, T. E., & Frimmel, F. H. (2005). Photocatalystic degradation ofcarbamazepine, clofbric acid and iomprol with P25 andHombikat UV100 in the presence of natural organic matter(NOM) and other organic water constituents. Water Research,39, 403–411.
Water Air Soil Pollut (2013) 224:1749 Page 9 of 10, 1749

Doria, F. C., Borges, A. C., Kim, J. K., Nathan, A., Joo, J. C., &Campos, L. C. (2013). Removal of metaldehyde throughphotocatalytic reactions using nano-sized zinc oxide com-posites. Water, Air, and Soil Pollution, 224, 1434.
Gaya, U. I., & Abdullah, A. H. (2008). Heterogeneous photo-catalytic degradation of organic contaminants over titaniumdioxide: a review of fundamentals, progress and problems.Journal of Photochemistry and Photobiology C: Photo-chemistry Review, 9, 1–12.
Godini, H. K. & Mirhosseini, S., 2011. The application of iron-coated activated carbon in humic acid removal from water.In: 2nd International Conference on Environmental Scienceand Technology. Singapore: ICPBEE
Goel, S., Hozalski, R. M., & Bouwer, E. J. (1995). Biodegrada-tion of NOM: effect of NOM source and ozone dose.Journal of American Water Works Association, 87, 90–105.
Joo, J. C., Song, M. S., & Kim, J. K. (2012). Sorption of nonpolarneutral organic copounds to low-surface-areametal (hydr)oxide-and humic acid-coated model aquifer sands. Journal of Envi-ronmental Science and Health Part A Toxic/Hazardous Sub-stances and Environmental Engineering, 47(6), 909–918.
Jung, H., Hong, J., & Suh, J. (2011). A study on removalefficiency of phenol and humic acid using spherical acti-vated carbon doped by TiO2. Korean Journal of ChemicalEngineering, 28, 1882–1888.
Kam, S. K., & Gregory, J. (2001). The interaction of humicsubstances with cationic polyelectrolytes. Water Research,35, 3557–3566.
Kim, I., Yamashita, N., & Tanaka, H. (2009). Performance of UVand UV/H2O2 processes for the removal of pharmaceuticalsdetected in secondary effluent of a sewage treatment plantin Japan. Journal of Hazardous Materials, 166, 1134–1140.
Kitis, M., & Kaplan, S. (2007). Advanced oxidation of naturalorganic matter using hydrogen peroxide and iron-coatedpumice particles. Chemosphere, 68, 1846–1853.
Lester, Y., Avisar, D., &Mamane, H. (2010). Photodegradation of theantibiotic sulphamethoxazole inwater with UV/H2O2 advancedoxidation process. Environmental Technology, 31, 175–183.
Li, X., Fan, C., & Sun, Y. (2002). Enhancement of photocatalyticoxidation of humic acid in TiO2 suspensions by increasingcation strength. Chemosphere, 48, 453–460.
Lopez, A., Bozzi, A., Mascolo, G., & Kiwi, J. (2003). Kineticinvestigation on UV and UV/H2O2 degradations of phar-maceutical intermediates in aqueous solution. Journal ofPhotochemical Photobiology, 156, 121–126.
Mori, M., Sugita, T., Mase, A., Funatogawa, T., Kikuchi, M.,Aizawa, K., Kato, S., Saito, Y., Ito, T., & Itabashi, H.(2013). Photodecomposition of humic acid and natural or-ganic matter in swamp water using a TiO2-coated ceramic
foam filter: Potential for the formation of disinfectionbyproducts. Chemosphere, 90, 1359–1365.
Morrison, S. (1980). Electrochemistry at semiconductor andoxidized metal electrodes. New York: Plenum Press.
Palmer, F., Eggins, B., & Coleman, H. (2002). The effect ofoperational parameters on the photocatalytic degradationof humic acid. Journal of Photochemistry and Photobiolo-gy A: Chemistry, 148, 137–143.
Qiao, S., Sun, D., & Easton, C. (2003). Photocatalytic oxidationtechnology for humic acid removal using a nano-structuredTiO2/Fe2O3 catalyst. Water Science and Technology, 47,211–217.
Stevenson, F. G. (1994). Humus chemistry: genesis, composi-tion, reactions. New York: Wiley. 303.
Terdkiatburana, T., Wang, S., & Tade, M. (2008). Competitionand complexation of heavy metal ions and humic acid onzeolitic MCM-22 and activated carbon. Chemical Engi-neering Journal, 139, 437–444.
Tryba, B., Brozek, P., Piszcz, M., & Morawski, W. (2011). Newphotocatalyst for decomposition of humic acids inphotocatalysis and photo-Fenton processes. Polish Journalof Chemical Technology, 13, 8–14.
Uyguner, C., & Bekbolet, M. (2005). A comparative study on thephotocatalytic degradation of humic substances of variousorigins. Desalination, 176, 167–176.
Vaezi, M. R. (2008). TWo-step solochemical synthesis of ZnO/TiO2 nano-composite materials. Journal of Materials Pro-cessing Technology, 205, 332–337.
Vogna, D., Marotta, R., Andreozzi, R., Napolitano, A., &d’Ischia, M. (2004). Kinetic and chemical assessment ofthe UV/H2O2 treatment of antiepileptic drug carbamaze-pine. Chemosphere, 54, 497–505.
Wang, G. S., Hsieh, T., & Hong, C. S. (2000). Destruction ofhumic acid in water by UV light—catalyzed oxidation withhydrogen peroxide. Water Research, 34, 3882–3887.
Wang, G., Liao, C., &Wu, F. (2001). Photodegradation of humicacids in the presence of hydrogen peroxide. Chemosphere,42, 379–387.
Yang, L., Yu, L. E., & Ray, M. B. (2008). Degradation ofparacetamol in aqueous solutions by TiO2 photocatalysis.Water Research, 42, 3480–3488.
Zhang, F., Zhao, J., Shen, T., Hidaka, H., Pelizzetti, E., &Serpone, N. (2000). TiO2-assisted photodegradation ofdye pollutants. Adsorption and degradation kinetics of eo-sin in TiO2 dispersions under visible light irradiation. Ap-plied Catalysis B: Environmental, 15, 147–156.
Zouboulis, A. I., Jun, W., & Katsoyiannis, I. A. (2003). Removalof humic acids by flotation. Colloids and Surfaces A: Phys-icochemical Engineering Aspects, 231, 181–193.
1749, Page 10 of 10 Water Air Soil Pollut (2013) 224:1749