Embed Size (px)
Citation preview
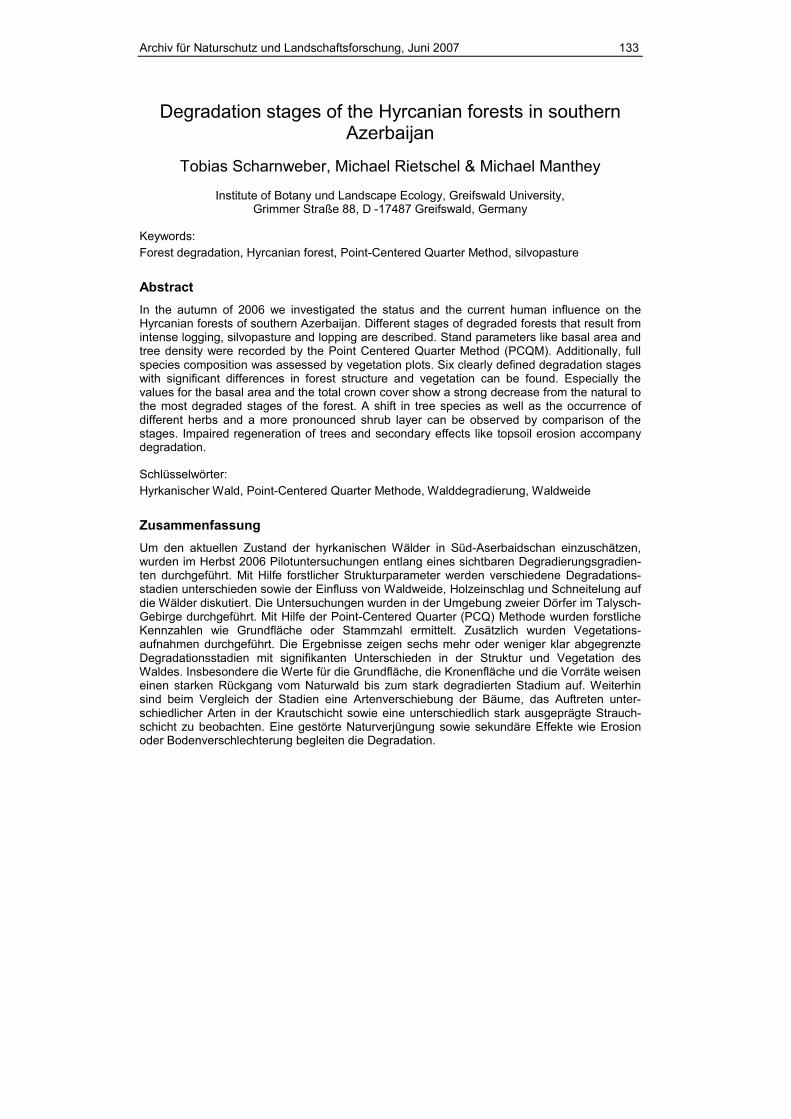
Archiv für Naturschutz und Landschaftsforschung, Juni 2007 133
Degradation stages of the Hyrcanian forests in southern Azerbaijan
Tobias Scharnweber, Michael Rietschel & Michael Manthey
Institute of Botany und Landscape Ecology, Greifswald University, Grimmer Straße 88, D -17487 Greifswald, Germany
Keywords: Forest degradation, Hyrcanian forest, Point-Centered Quarter Method, silvopasture
Abstract In the autumn of 2006 we investigated the status and the current human influence on the Hyrcanian forests of southern Azerbaijan. Different stages of degraded forests that result from intense logging, silvopasture and lopping are described. Stand parameters like basal area and tree density were recorded by the Point Centered Quarter Method (PCQM). Additionally, full species composition was assessed by vegetation plots. Six clearly defined degradation stages with significant differences in forest structure and vegetation can be found. Especially the values for the basal area and the total crown cover show a strong decrease from the natural to the most degraded stages of the forest. A shift in tree species as well as the occurrence of different herbs and a more pronounced shrub layer can be observed by comparison of the stages. Impaired regeneration of trees and secondary effects like topsoil erosion accompany degradation.
Schlüsselwörter: Hyrkanischer Wald, Point-Centered Quarter Methode, Walddegradierung, Waldweide
Zusammenfassung Um den aktuellen Zustand der hyrkanischen Wälder in Süd-Aserbaidschan einzuschätzen, wurden im Herbst 2006 Pilotuntersuchungen entlang eines sichtbaren Degradierungsgradien-ten durchgeführt. Mit Hilfe forstlicher Strukturparameter werden verschiedene Degradations-stadien unterschieden sowie der Einfluss von Waldweide, Holzeinschlag und Schneitelung auf die Wälder diskutiert. Die Untersuchungen wurden in der Umgebung zweier Dörfer im Talysch-Gebirge durchgeführt. Mit Hilfe der Point-Centered Quarter (PCQ) Methode wurden forstliche Kennzahlen wie Grundfläche oder Stammzahl ermittelt. Zusätzlich wurden Vegetations-aufnahmen durchgeführt. Die Ergebnisse zeigen sechs mehr oder weniger klar abgegrenzte Degradationsstadien mit signifikanten Unterschieden in der Struktur und Vegetation des Waldes. Insbesondere die Werte für die Grundfläche, die Kronenfläche und die Vorräte weisen einen starken Rückgang vom Naturwald bis zum stark degradierten Stadium auf. Weiterhin sind beim Vergleich der Stadien eine Artenverschiebung der Bäume, das Auftreten unter-schiedlicher Arten in der Krautschicht sowie eine unterschiedlich stark ausgeprägte Strauch-schicht zu beobachten. Eine gestörte Naturverjüngung sowie sekundäre Effekte wie Erosion oder Bodenverschlechterung begleiten die Degradation.
134
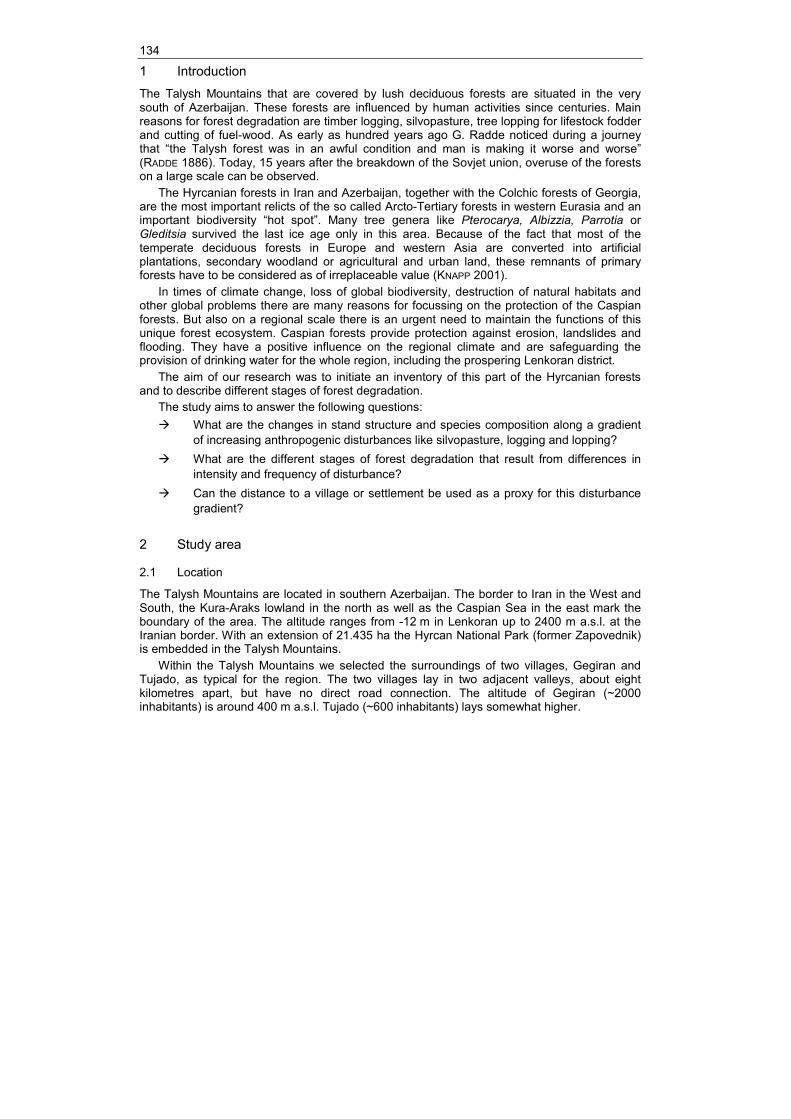
1 Introduction The Talysh Mountains that are covered by lush deciduous forests are situated in the very south of Azerbaijan. These forests are influenced by human activities since centuries. Main reasons for forest degradation are timber logging, silvopasture, tree lopping for lifestock fodder and cutting of fuel-wood. As early as hundred years ago G. Radde noticed during a journey that “the Talysh forest was in an awful condition and man is making it worse and worse” (RADDE 1886). Today, 15 years after the breakdown of the Sovjet union, overuse of the forests on a large scale can be observed.
The Hyrcanian forests in Iran and Azerbaijan, together with the Colchic forests of Georgia, are the most important relicts of the so called Arcto-Tertiary forests in western Eurasia and an important biodiversity “hot spot”. Many tree genera like Pterocarya, Albizzia, Parrotia or Gleditsia survived the last ice age only in this area. Because of the fact that most of the temperate deciduous forests in Europe and western Asia are converted into artificial plantations, secondary woodland or agricultural and urban land, these remnants of primary forests have to be considered as of irreplaceable value (KNAPP 2001).
In times of climate change, loss of global biodiversity, destruction of natural habitats and other global problems there are many reasons for focussing on the protection of the Caspian forests. But also on a regional scale there is an urgent need to maintain the functions of this unique forest ecosystem. Caspian forests provide protection against erosion, landslides and flooding. They have a positive influence on the regional climate and are safeguarding the provision of drinking water for the whole region, including the prospering Lenkoran district.
The aim of our research was to initiate an inventory of this part of the Hyrcanian forests and to describe different stages of forest degradation.
The study aims to answer the following questions: What are the changes in stand structure and species composition along a gradient
of increasing anthropogenic disturbances like silvopasture, logging and lopping? What are the different stages of forest degradation that result from differences in
intensity and frequency of disturbance? Can the distance to a village or settlement be used as a proxy for this disturbance
gradient?
2 Study area
2.1 Location
The Talysh Mountains are located in southern Azerbaijan. The border to Iran in the West and South, the Kura-Araks lowland in the north as well as the Caspian Sea in the east mark the boundary of the area. The altitude ranges from -12 m in Lenkoran up to 2400 m a.s.l. at the Iranian border. With an extension of 21.435 ha the Hyrcan National Park (former Zapovednik) is embedded in the Talysh Mountains.
Within the Talysh Mountains we selected the surroundings of two villages, Gegiran and Tujado, as typical for the region. The two villages lay in two adjacent valleys, about eight kilometres apart, but have no direct road connection. The altitude of Gegiran (~2000 inhabitants) is around 400 m a.s.l. Tujado (~600 inhabitants) lays somewhat higher.
135
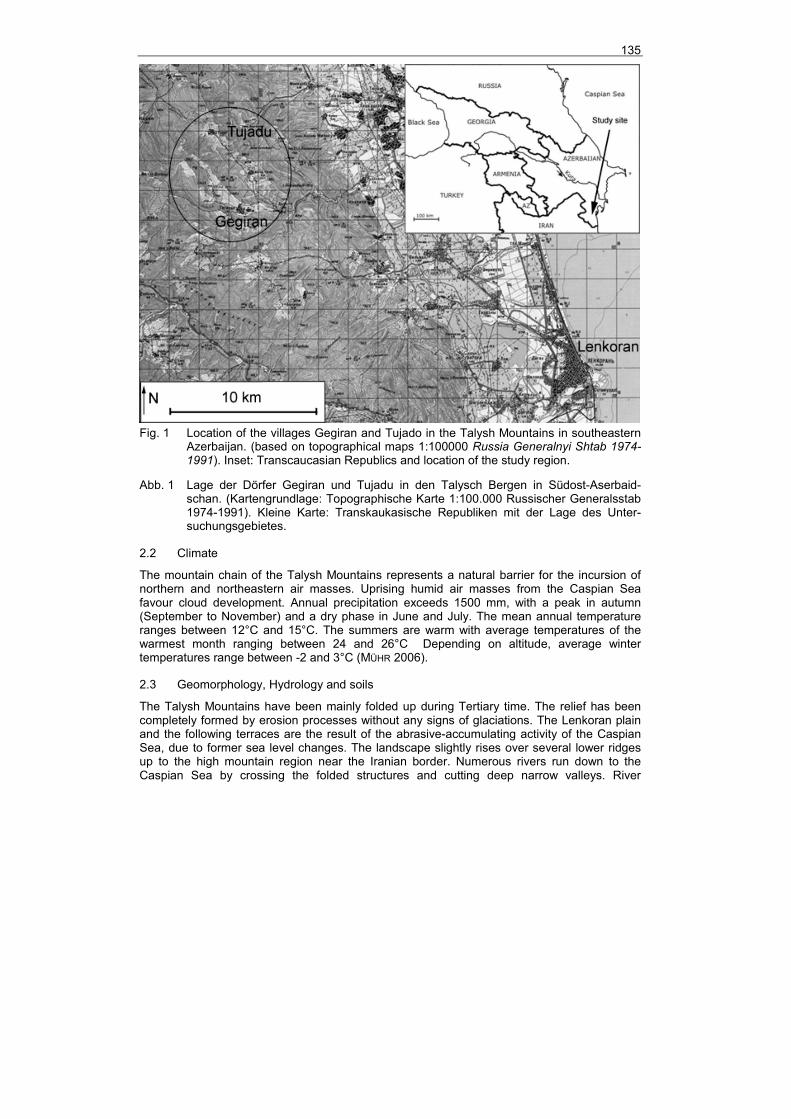
Fig. 1 Location of the villages Gegiran and Tujado in the Talysh Mountains in southeastern
Azerbaijan. (based on topographical maps 1:100000 Russia Generalnyi Shtab 1974-1991). Inset: Transcaucasian Republics and location of the study region.
Abb. 1 Lage der Dörfer Gegiran und Tujadu in den Talysch Bergen in Südost-Aserbaid-schan. (Kartengrundlage: Topographische Karte 1:100.000 Russischer Generalsstab 1974-1991). Kleine Karte: Transkaukasische Republiken mit der Lage des Unter-suchungsgebietes.
2.2 Climate
The mountain chain of the Talysh Mountains represents a natural barrier for the incursion of northern and northeastern air masses. Uprising humid air masses from the Caspian Sea favour cloud development. Annual precipitation exceeds 1500 mm, with a peak in autumn (September to November) and a dry phase in June and July. The mean annual temperature ranges between 12°C and 15°C. The summers are warm with average temperatures of the warmest month ranging between 24 and 26°C Depending on altitude, average winter temperatures range between -2 and 3°C (MÜHR 2006).
2.3 Geomorphology, Hydrology and soils
The Talysh Mountains have been mainly folded up during Tertiary time. The relief has been completely formed by erosion processes without any signs of glaciations. The Lenkoran plain and the following terraces are the result of the abrasive-accumulating activity of the Caspian Sea, due to former sea level changes. The landscape slightly rises over several lower ridges up to the high mountain region near the Iranian border. Numerous rivers run down to the Caspian Sea by crossing the folded structures and cutting deep narrow valleys. River

136
dynamics is characterized by two discharge peaks: one in autumn and one in spring, after snowmelt.
Most important soils are yellow soils (Ferrasols), yellow brown soils and mountain brown forest soils (Cambisols), cinnamon-coloured forest soils (Chromic Cambisols), chestnut after forest alkali soils, humus carbonate soils (Rendzinas) as well as podzol, gley and alluvial soils (MENR 2004).
2.4 Vegetation
The Caspian forests belong to the Hyrcanian floral province of the Oriental Turanian region (MEUSEL et al. 1965). Others have described it as Euxino-Hyrcanian (sub-) province of the Euro-Siberian region (ZOHARY 1973, SCHROEDER 1998). Together with the Elburs Mountains (Iran), the Talysh is described as an autonomic area.
The vegetation represents a relict of the arcto-tertiary forests and comprises, in comparison to other European deciduous forests, a very rich flora of woody and endemic species. Examples for endemic tree species are Parrotia persica, Gleditsia caspica, Albizzia julibrissin and Quercus castaneifolia. It is conspicuous that the flora almost completely lacks coniferous trees. Only a few Yews (Taxus baccata) are noteworthy. Due to the high humidity epiphytes (mainly cryptogams) are abundant; sometimes bryophytes are completely covering the tree trunks.
Following Schmidt 1 the main forest types are: 1 Hyrcanian or south Caspian hygro-thermophilous deciduous broadleaved
forests (species rich nemoral summer-green forests with evergreen understory species) 1.1 Hyrcanian lowland-colline mixed broadleaved forests (south Caspian
lowland forest with Quercus castaneifolia, Parrotia persica, Zelkova carpinifolia, Diospyros lotus, partly in combination with Alnus glutinosa ssp. arbata-Pterocarya pterocarpa alluvial forests)
1.2 Hyrcanian colline to montane oak (Quercus castaneifolia) and hornbeam-(Carpinus betulus) oak forests (oak and mixed hornbeam-oak forest of south Caspian mountains, partly with Parrotia persica, Zelkova carpinifolia, Diospyros lotus, Acer velutinum, Gleditsia caspica)
2 South Caspian Oriental beech forests 2.1 Montane Oriental beech (Fagus orientalis) forest with evergreen species
(Buxus hyrcana, Ilex spinigera, Ruscus hyrcanus, Danaé racemosa, Hedera pastuchowii), alternating with mixed deciduous broadleaved forests (Quercus castaneifolia, Alnus subcordata, Acer velutinum)
2.2 Altimontane Oriental beech forests without evergreen species 3 Xerophytic oak (Quercus macranthera) forest at the upper timberline
(characterized by dry conditions because of its location above the cloud cover zone, distributed only in small parts of the Talysh Mountains)
1 Schmidt, P.: Description of the vegetation of the Hyrcan forests of the Talish. – unpublished draft for a nomination paper of the Hyrcanian forests as UNESCO world heritage area.
137
3 Materials and methods Field work was carried out from the beginning of September till the beginning of October 2006 in the surrounding of the two villages Gegiran and Tujado (Fig.1).
We tried to evenly sample over the whole existing disturbance gradient from undisturbed, natural forests over medium disturbed forests with pasture and lopped trees to clear-cut areas covered by ferns. In total, 70 plots have been sampled. We recorded geographic coordinates, altitude and distance to the next village of every plot by means of a handheld-GPS. To exclude the effects of different altitudinal vegetation zones and expositions we choose only north-facing slopes between 400 and 1000 m a.s.l..
Full floristic composition was recorded on a 20 m x 20 m square in each plot. For species determination we used ROTHMALER et al. (2002), FITSCHEN et al. (2002) and Schmidt (2004). Because of the late season most of the plants did not flowering. Therefore, some of the specimens (mostly herbs) were only determined to the genus level. For cover estimation the Braun-Blanquet scale was used.
To derive the stand structure parameters total tree cover, density, importance and frequency we used the Point-Centered quarter (PCQ) method (COTTAM & CURTIS 1956, MITCHELL 2001). This method provides a rapid assessment without measuring huge stocks.
From the centre of every plot we divided the area in 4 quadrants, using a compass. We measured the distance to the nearest tree with diameter at breast height (DBH) > 4 cm in every quadrant. We also recorded the species of the tree, DBH, height and crown diameter. If there were tree-stumps closer to the centre than living trees that have been cut at maximum approx. five years ago, we also measured the distance to the stumps. This way we obtained data on recent stand density changes. Height measurement was carried out with a clinometer (Suunto). The complete measurement was repeated four times, always 15 meters away from the centre in every point of the compass. In each plot a total of 20 trees has been measured this way.
Furthermore we estimated the age for the main tree species by counting the tree rings of tree stumps if available. Additionally, increment cores were taken from living trees using an increment borer.
With the field data at hand we calculated the following parameters: mean distance of the trees (m), absolute tree density (trees/ha), total basal area (m²/ha), highest tree per plot, mean height and total crown cover. For the calculation of the timber stock we used the factor 0.5 as an approximation (SCHULZE 2006).
To classify forest degradation stages we performed a hierarchical agglomerative cluster analysis with Ward’s method as clustering algorithm and Euclidean distance based on the following parameters (after standardization by maximum): absolute tree density, total basal area, highest tree, mean height, total crown cover and percentage of bare soil.
4 Results
4.1 Description of degradation stages
The cluster analysis of the 70 plots based on six stand parameters generated 6 clearly defined clusters that can be regarded as different degradation stages. Although we are aware of the fact that almost every classification of nature deals with the problem of defining borders in a continuum, we will use these clusters in order to describe different forest structures that result from an increasing degradation gradient.
138
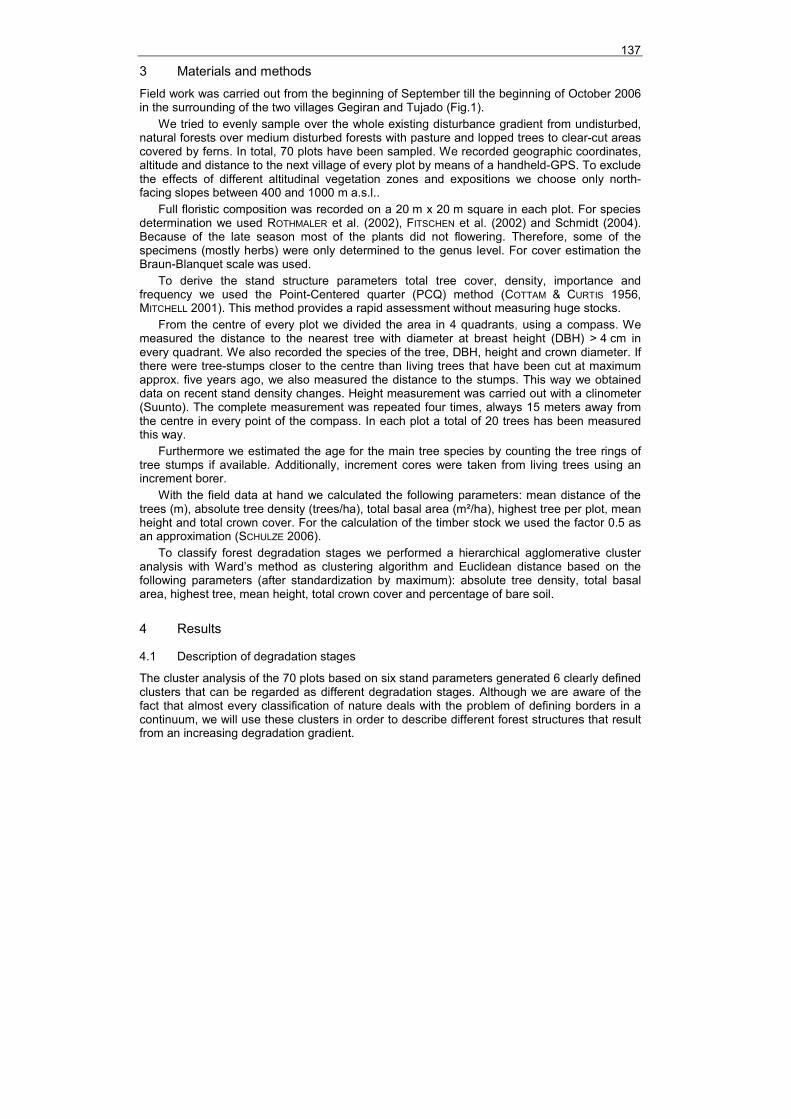
Stage 1 - Natural forest
Fig. 2 Natural forest stage.
Abb. 2 Naturwaldstadium.
Lopping none pasture intensity none timber extraction none distance to village far(>4 km), or difficult to reach average number of species/400 m² 21 soil thick litter layer, typical undisturbed forest soil In our research area natural forests were only to be found in altitudes above 800 m a.s.l.. All areas below 800 m were more or less influenced by human activities. Most of our plots are dominated by Fagus orientalis, accompanied by Acer velutinum or Alnus subcordata. Only few evergreens occurred and the herb layer was often sparsely developed. Steep escarpments and the lack of paths prevent the use of these areas. Typical species: Fagus orientalis, Acer velutinum, Alnus subcordata, Danaé racemosa,
Athyrium distentifolium, Sanicula europaea, Solanum kieseritzkii
139
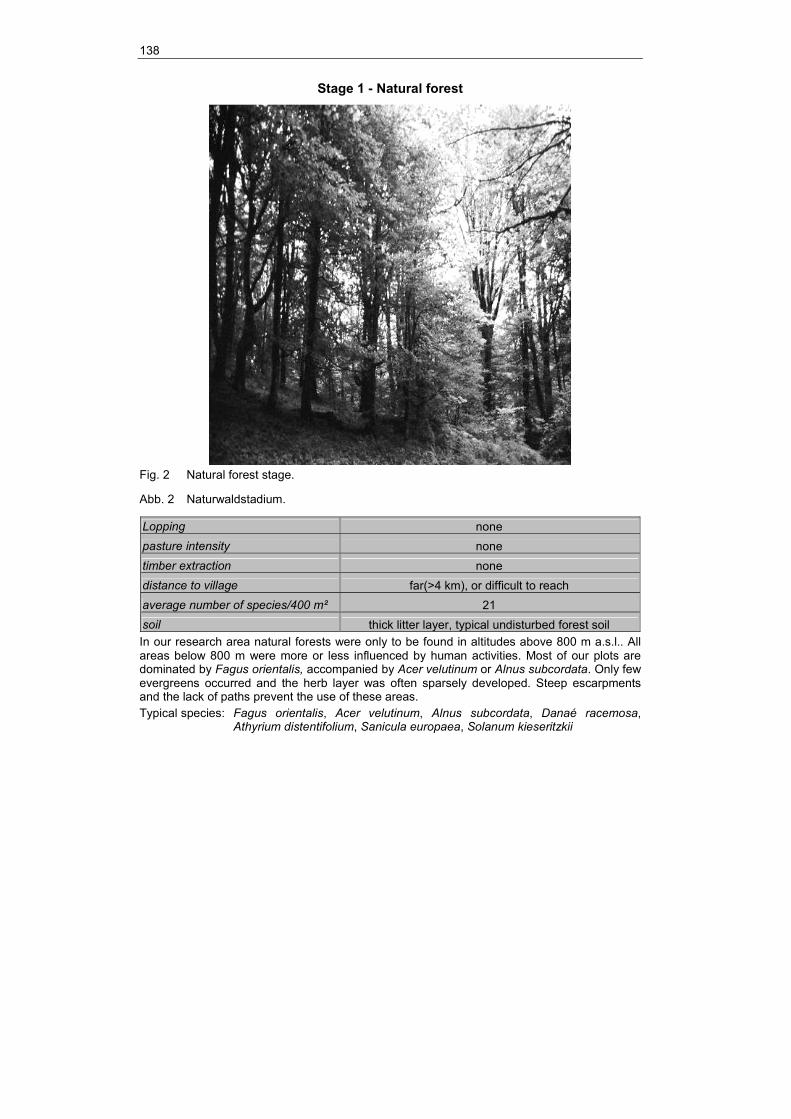
Stage 2 – Slightly disturbed forest
Fig. 3 Slightly disturbed forest.
Abb. 3 Leicht gestörter Wald.
lopping none pasture intensity low timber extraction single trees distance to village far(>4km),but ways exist average number of species/400 m² 22 soil thick litter layer, but compression occurs The forest in this stage also appears relatively undisturbed and has only some cleared spots, where single trees, mostly maple, oak and beech are removed. The soil is partly compressed by machines, a more light-demanding herb layer can be established at forest gaps. Pasture can only be observed if these areas are in reach of the villages. The tree species composition is comparable to natural forests. Typical species: Fagus orientalis, Alnus subcordata, Acer velutinum, Galium odoratum,
Cyclamen coum, Circaea lutetiana, Carex pendula, Solanum kieseritzkii
140
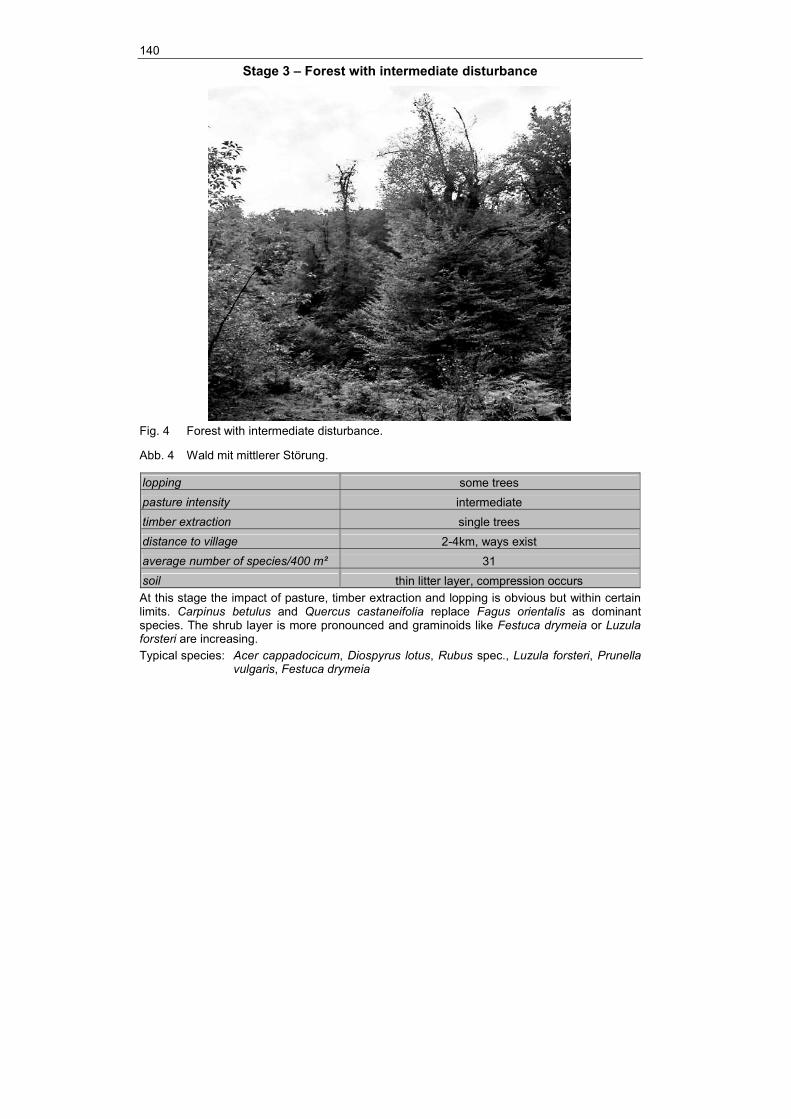
Stage 3 – Forest with intermediate disturbance
Fig. 4 Forest with intermediate disturbance.
Abb. 4 Wald mit mittlerer Störung.
lopping some trees pasture intensity intermediate timber extraction single trees distance to village 2-4km, ways exist average number of species/400 m² 31 soil thin litter layer, compression occurs At this stage the impact of pasture, timber extraction and lopping is obvious but within certain limits. Carpinus betulus and Quercus castaneifolia replace Fagus orientalis as dominant species. The shrub layer is more pronounced and graminoids like Festuca drymeia or Luzula forsteri are increasing. Typical species: Acer cappadocicum, Diospyrus lotus, Rubus spec., Luzula forsteri, Prunella
vulgaris, Festuca drymeia
141
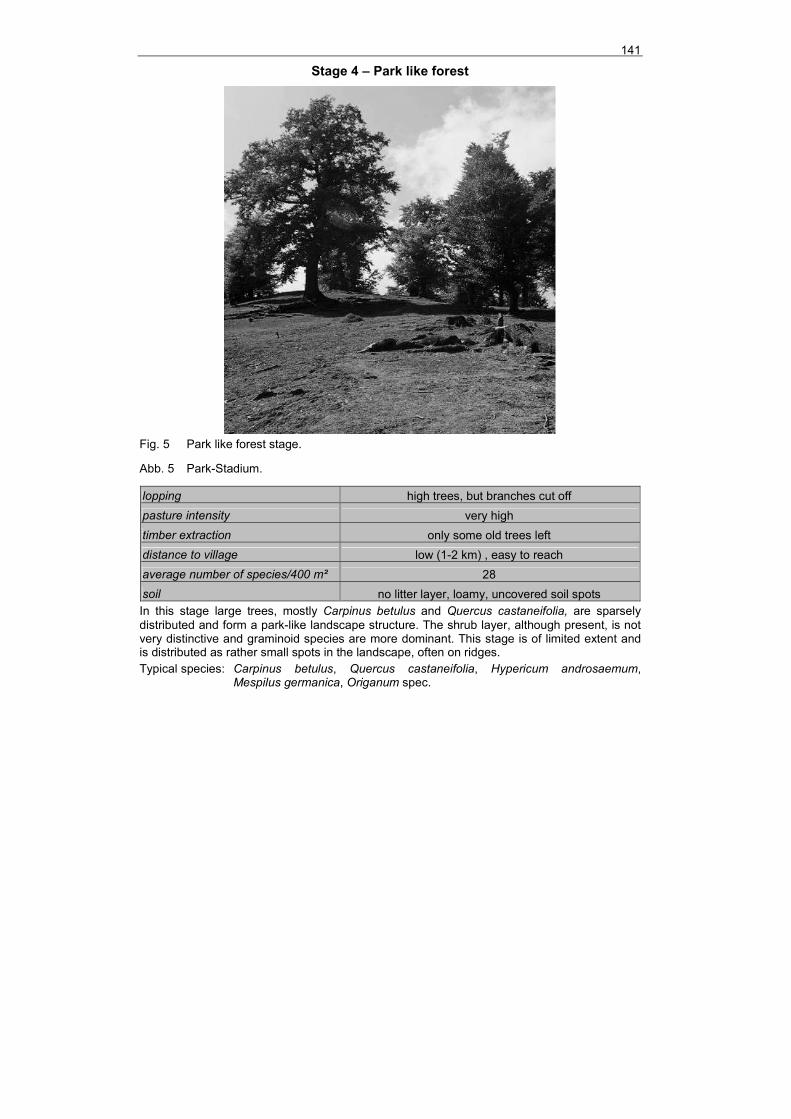
Stage 4 – Park like forest
Fig. 5 Park like forest stage.
Abb. 5 Park-Stadium.
lopping high trees, but branches cut off pasture intensity very high timber extraction only some old trees left distance to village low (1-2 km) , easy to reach average number of species/400 m² 28 soil no litter layer, loamy, uncovered soil spots In this stage large trees, mostly Carpinus betulus and Quercus castaneifolia, are sparsely distributed and form a park-like landscape structure. The shrub layer, although present, is not very distinctive and graminoid species are more dominant. This stage is of limited extent and is distributed as rather small spots in the landscape, often on ridges. Typical species: Carpinus betulus, Quercus castaneifolia, Hypericum androsaemum,
Mespilus germanica, Origanum spec.
142
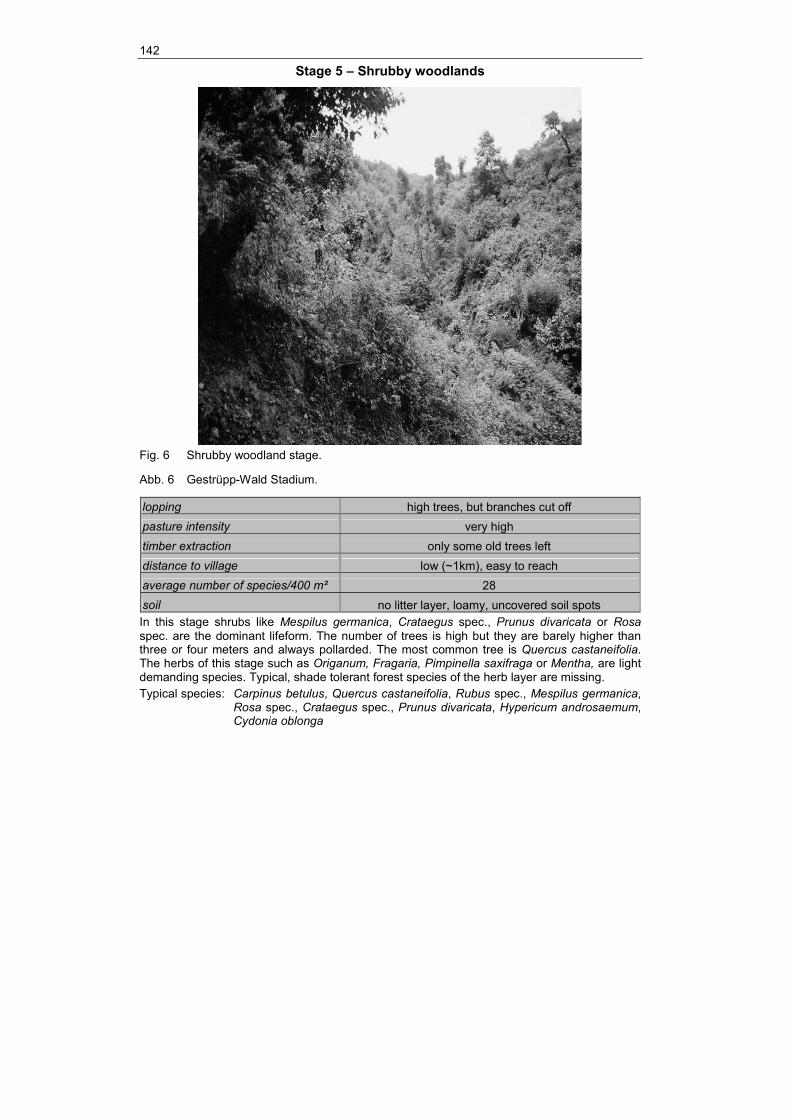
Stage 5 – Shrubby woodlands
Fig. 6 Shrubby woodland stage.
Abb. 6 Gestrüpp-Wald Stadium.
lopping high trees, but branches cut off pasture intensity very high timber extraction only some old trees left distance to village low (~1km), easy to reach average number of species/400 m² 28 soil no litter layer, loamy, uncovered soil spots In this stage shrubs like Mespilus germanica, Crataegus spec., Prunus divaricata or Rosa spec. are the dominant lifeform. The number of trees is high but they are barely higher than three or four meters and always pollarded. The most common tree is Quercus castaneifolia. The herbs of this stage such as Origanum, Fragaria, Pimpinella saxifraga or Mentha, are light demanding species. Typical, shade tolerant forest species of the herb layer are missing. Typical species: Carpinus betulus, Quercus castaneifolia, Rubus spec., Mespilus germanica,
Rosa spec., Crataegus spec., Prunus divaricata, Hypericum androsaemum, Cydonia oblonga
143
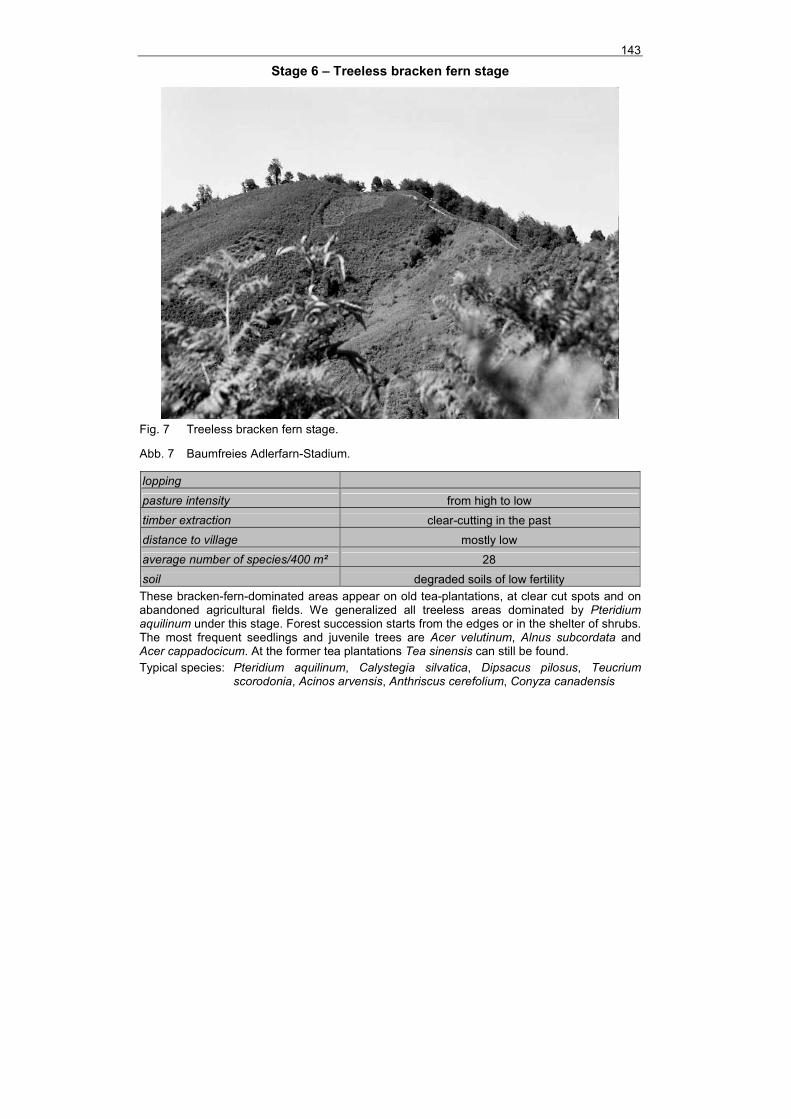
Stage 6 – Treeless bracken fern stage
Fig. 7 Treeless bracken fern stage.
Abb. 7 Baumfreies Adlerfarn-Stadium.
lopping pasture intensity from high to low timber extraction clear-cutting in the past distance to village mostly low average number of species/400 m² 28 soil degraded soils of low fertility These bracken-fern-dominated areas appear on old tea-plantations, at clear cut spots and on abandoned agricultural fields. We generalized all treeless areas dominated by Pteridium aquilinum under this stage. Forest succession starts from the edges or in the shelter of shrubs. The most frequent seedlings and juvenile trees are Acer velutinum, Alnus subcordata and Acer cappadocicum. At the former tea plantations Tea sinensis can still be found. Typical species: Pteridium aquilinum, Calystegia silvatica, Dipsacus pilosus, Teucrium
scorodonia, Acinos arvensis, Anthriscus cerefolium, Conyza canadensis
144
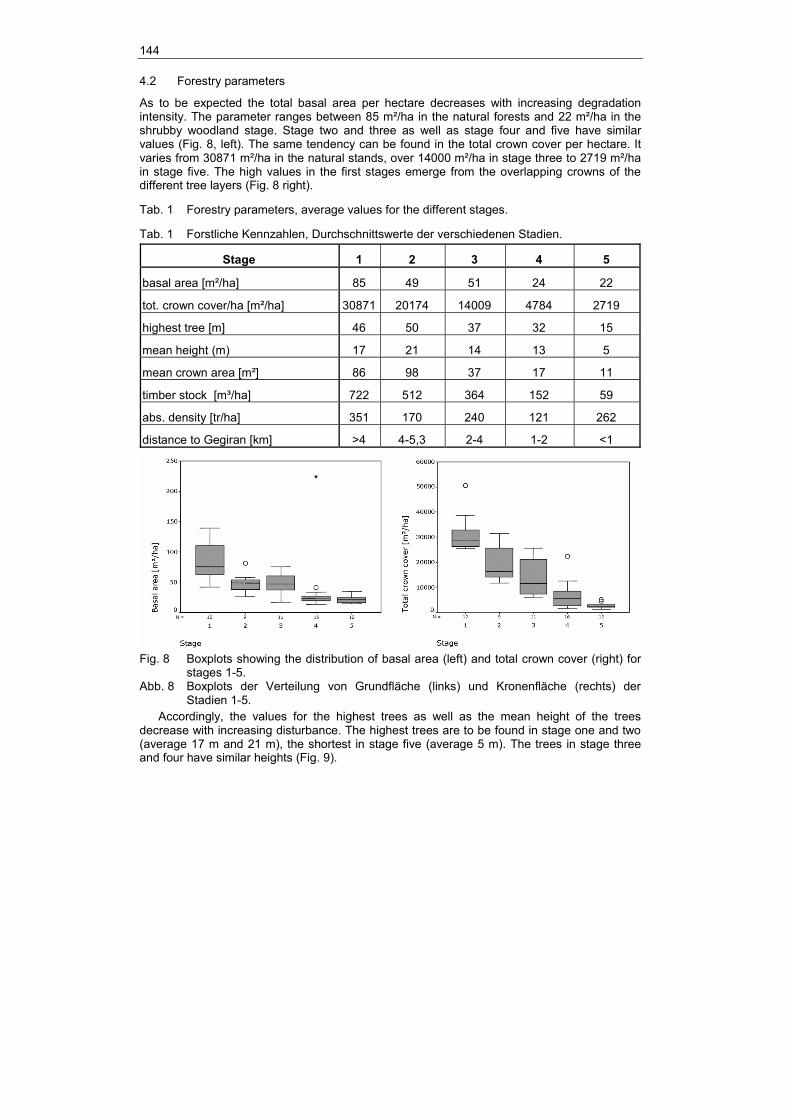
4.2 Forestry parameters
As to be expected the total basal area per hectare decreases with increasing degradation intensity. The parameter ranges between 85 m²/ha in the natural forests and 22 m²/ha in the shrubby woodland stage. Stage two and three as well as stage four and five have similar values (Fig. 8, left). The same tendency can be found in the total crown cover per hectare. It varies from 30871 m²/ha in the natural stands, over 14000 m²/ha in stage three to 2719 m²/ha in stage five. The high values in the first stages emerge from the overlapping crowns of the different tree layers (Fig. 8 right).
Tab. 1 Forestry parameters, average values for the different stages.
Tab. 1 Forstliche Kennzahlen, Durchschnittswerte der verschiedenen Stadien.
Stage 1 2 3 4 5
basal area [m²/ha] 85 49 51 24 22
tot. crown cover/ha [m²/ha] 30871 20174 14009 4784 2719
highest tree [m] 46 50 37 32 15
mean height (m) 17 21 14 13 5
mean crown area [m²] 86 98 37 17 11
timber stock [m³/ha] 722 512 364 152 59
abs. density [tr/ha] 351 170 240 121 262
distance to Gegiran [km] >4 4-5,3 2-4 1-2 <1
Fig. 8 Boxplots showing the distribution of basal area (left) and total crown cover (right) for
stages 1-5. Abb. 8 Boxplots der Verteilung von Grundfläche (links) und Kronenfläche (rechts) der
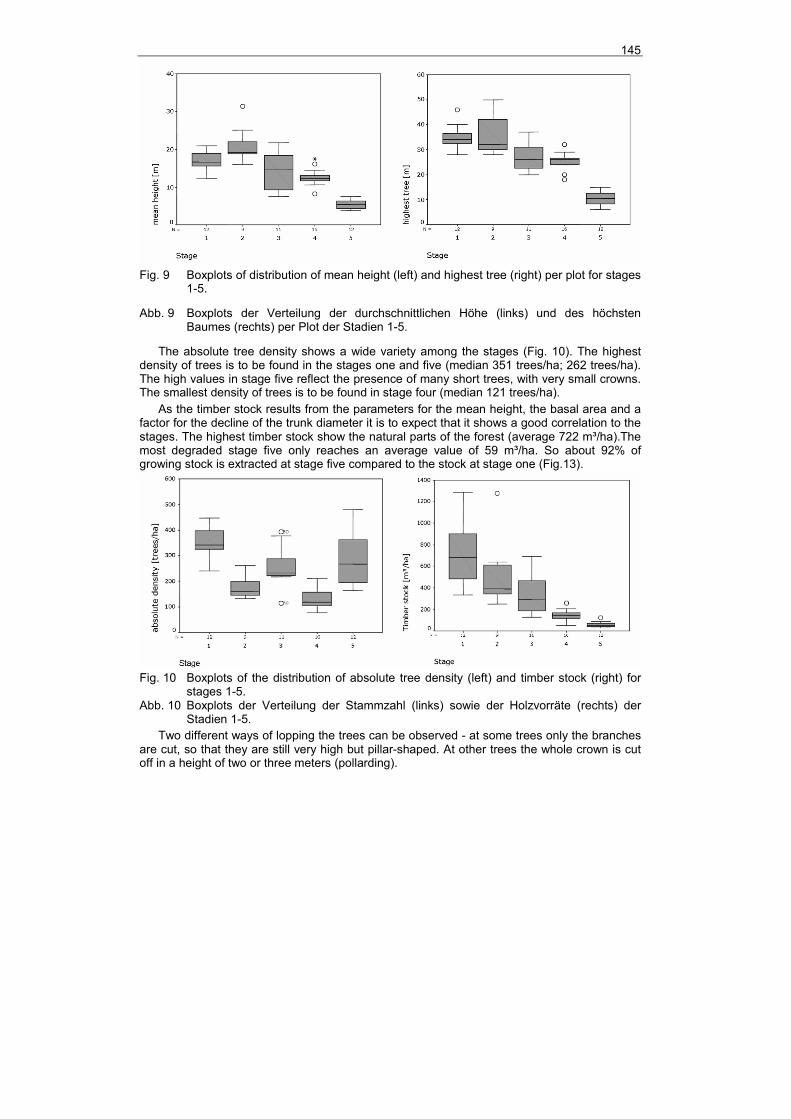
Stadien 1-5. Accordingly, the values for the highest trees as well as the mean height of the trees
decrease with increasing disturbance. The highest trees are to be found in stage one and two (average 17 m and 21 m), the shortest in stage five (average 5 m). The trees in stage three and four have similar heights (Fig. 9).
145
Fig. 9 Boxplots of distribution of mean height (left) and highest tree (right) per plot for stages
1-5.
Abb. 9 Boxplots der Verteilung der durchschnittlichen Höhe (links) und des höchsten Baumes (rechts) per Plot der Stadien 1-5.
The absolute tree density shows a wide variety among the stages (Fig. 10). The highest density of trees is to be found in the stages one and five (median 351 trees/ha; 262 trees/ha). The high values in stage five reflect the presence of many short trees, with very small crowns. The smallest density of trees is to be found in stage four (median 121 trees/ha).
As the timber stock results from the parameters for the mean height, the basal area and a factor for the decline of the trunk diameter it is to expect that it shows a good correlation to the stages. The highest timber stock show the natural parts of the forest (average 722 m³/ha).The most degraded stage five only reaches an average value of 59 m³/ha. So about 92% of growing stock is extracted at stage five compared to the stock at stage one (Fig.13).
Fig. 10 Boxplots of the distribution of absolute tree density (left) and timber stock (right) for
stages 1-5. Abb. 10 Boxplots der Verteilung der Stammzahl (links) sowie der Holzvorräte (rechts) der
Stadien 1-5. Two different ways of lopping the trees can be observed - at some trees only the branches
are cut, so that they are still very high but pillar-shaped. At other trees the whole crown is cut off in a height of two or three meters (pollarding).
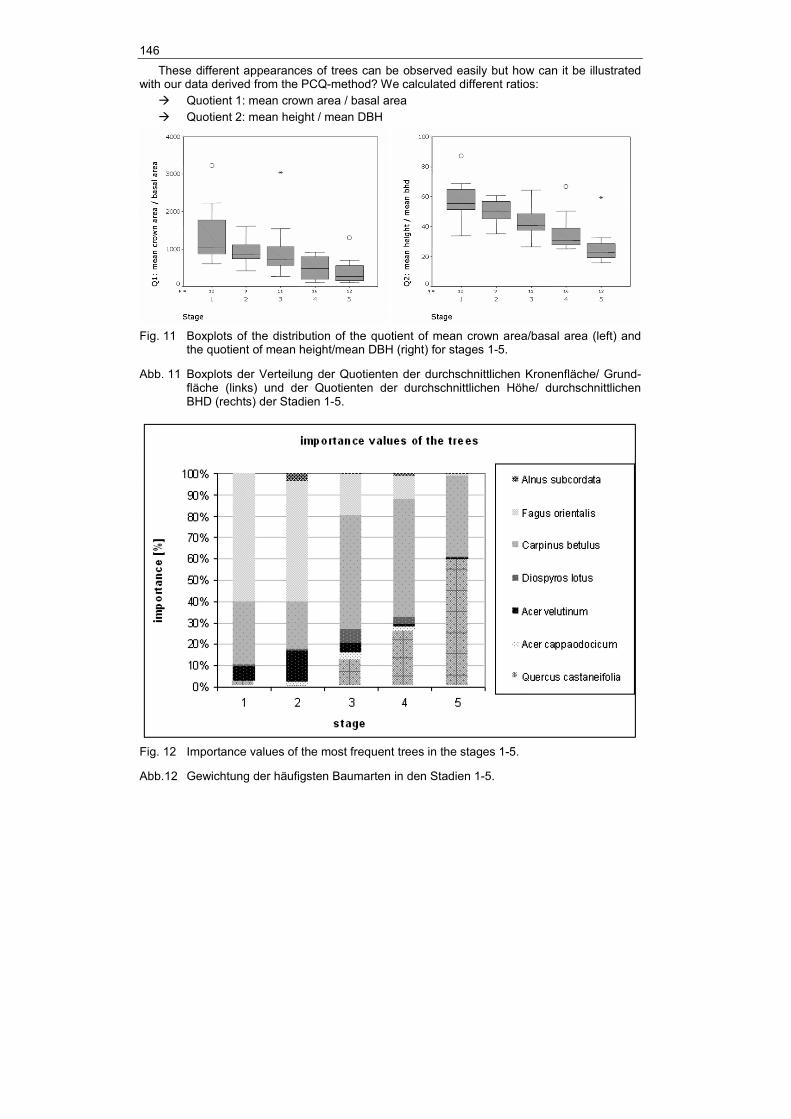
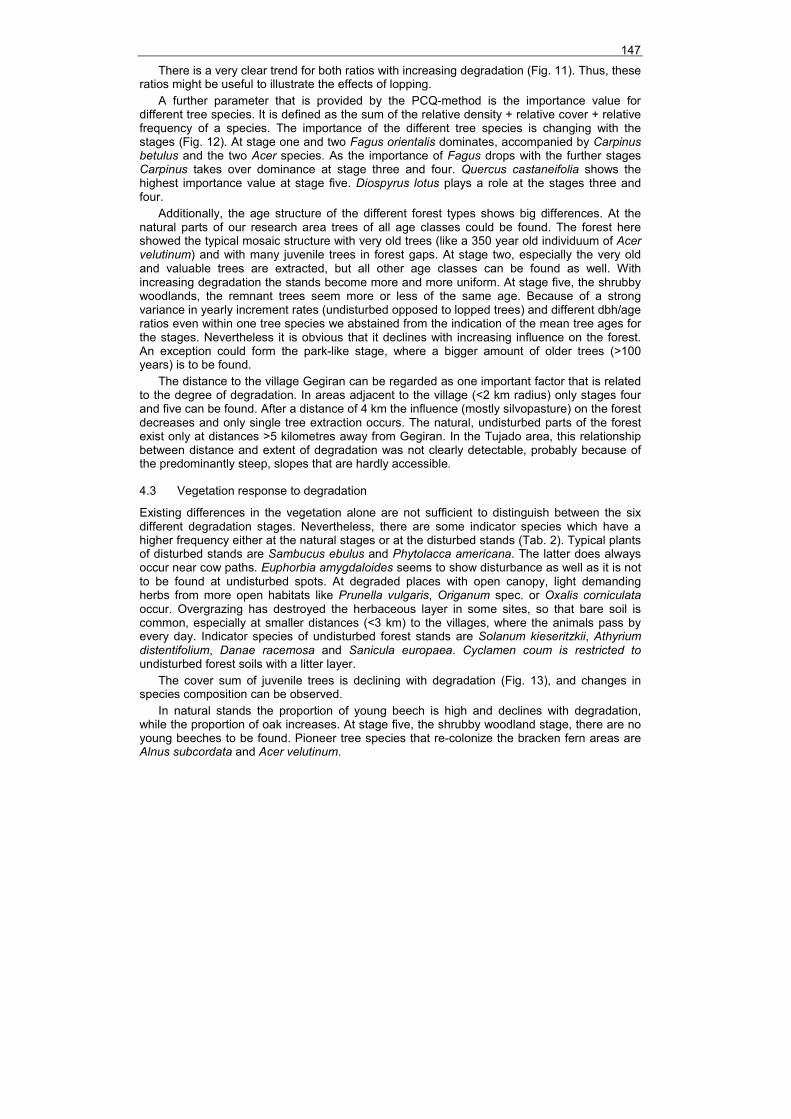
146
These different appearances of trees can be observed easily but how can it be illustrated with our data derived from the PCQ-method? We calculated different ratios:
Quotient 1: mean crown area / basal area Quotient 2: mean height / mean DBH
Fig. 11 Boxplots of the distribution of the quotient of mean crown area/basal area (left) and
the quotient of mean height/mean DBH (right) for stages 1-5.
Abb. 11 Boxplots der Verteilung der Quotienten der durchschnittlichen Kronenfläche/ Grund-fläche (links) und der Quotienten der durchschnittlichen Höhe/ durchschnittlichen BHD (rechts) der Stadien 1-5.
Fig. 12 Importance values of the most frequent trees in the stages 1-5.
Abb.12 Gewichtung der häufigsten Baumarten in den Stadien 1-5.
147
There is a very clear trend for both ratios with increasing degradation (Fig. 11). Thus, these ratios might be useful to illustrate the effects of lopping.
A further parameter that is provided by the PCQ-method is the importance value for different tree species. It is defined as the sum of the relative density + relative cover + relative frequency of a species. The importance of the different tree species is changing with the stages (Fig. 12). At stage one and two Fagus orientalis dominates, accompanied by Carpinus betulus and the two Acer species. As the importance of Fagus drops with the further stages Carpinus takes over dominance at stage three and four. Quercus castaneifolia shows the highest importance value at stage five. Diospyrus lotus plays a role at the stages three and four.
Additionally, the age structure of the different forest types shows big differences. At the natural parts of our research area trees of all age classes could be found. The forest here showed the typical mosaic structure with very old trees (like a 350 year old individuum of Acer velutinum) and with many juvenile trees in forest gaps. At stage two, especially the very old and valuable trees are extracted, but all other age classes can be found as well. With increasing degradation the stands become more and more uniform. At stage five, the shrubby woodlands, the remnant trees seem more or less of the same age. Because of a strong variance in yearly increment rates (undisturbed opposed to lopped trees) and different dbh/age ratios even within one tree species we abstained from the indication of the mean tree ages for the stages. Nevertheless it is obvious that it declines with increasing influence on the forest. An exception could form the park-like stage, where a bigger amount of older trees (>100 years) is to be found.
The distance to the village Gegiran can be regarded as one important factor that is related to the degree of degradation. In areas adjacent to the village (<2 km radius) only stages four and five can be found. After a distance of 4 km the influence (mostly silvopasture) on the forest decreases and only single tree extraction occurs. The natural, undisturbed parts of the forest exist only at distances >5 kilometres away from Gegiran. In the Tujado area, this relationship between distance and extent of degradation was not clearly detectable, probably because of the predominantly steep, slopes that are hardly accessible.
4.3 Vegetation response to degradation
Existing differences in the vegetation alone are not sufficient to distinguish between the six different degradation stages. Nevertheless, there are some indicator species which have a higher frequency either at the natural stages or at the disturbed stands (Tab. 2). Typical plants of disturbed stands are Sambucus ebulus and Phytolacca americana. The latter does always occur near cow paths. Euphorbia amygdaloides seems to show disturbance as well as it is not to be found at undisturbed spots. At degraded places with open canopy, light demanding herbs from more open habitats like Prunella vulgaris, Origanum spec. or Oxalis corniculata occur. Overgrazing has destroyed the herbaceous layer in some sites, so that bare soil is common, especially at smaller distances (<3 km) to the villages, where the animals pass by every day. Indicator species of undisturbed forest stands are Solanum kieseritzkii, Athyrium distentifolium, Danae racemosa and Sanicula europaea. Cyclamen coum is restricted to undisturbed forest soils with a litter layer.
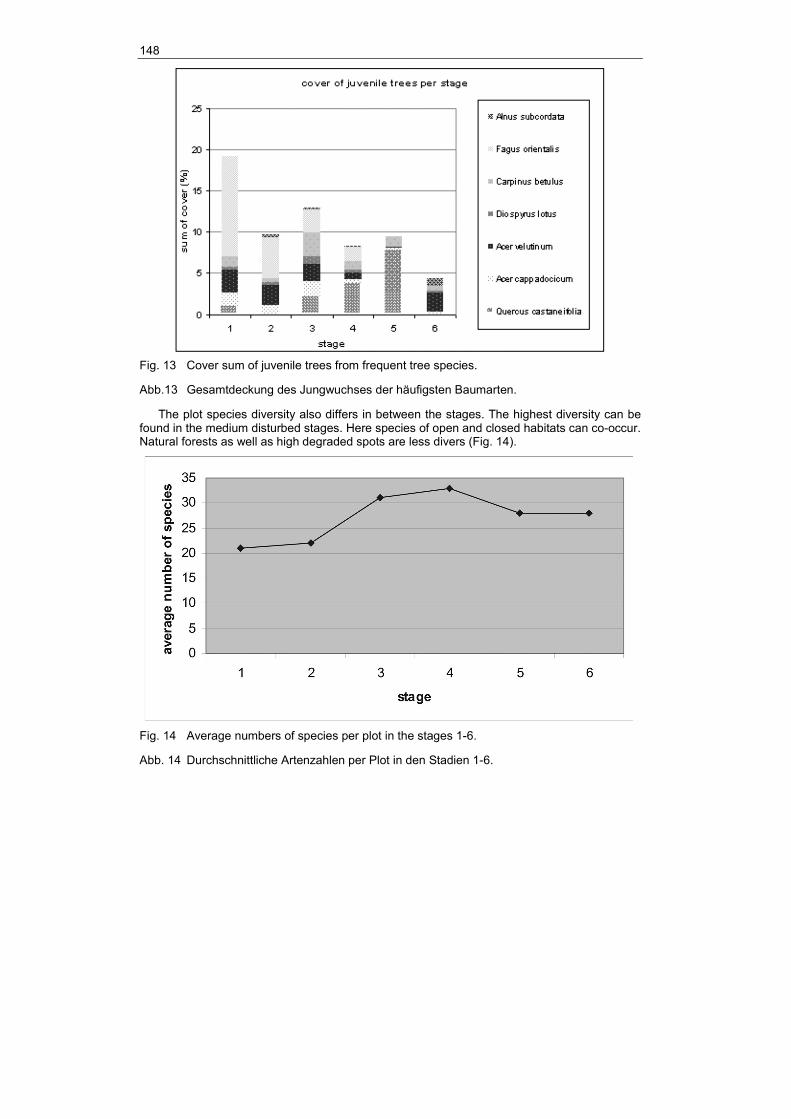
The cover sum of juvenile trees is declining with degradation (Fig. 13), and changes in species composition can be observed.
In natural stands the proportion of young beech is high and declines with degradation, while the proportion of oak increases. At stage five, the shrubby woodland stage, there are no young beeches to be found. Pioneer tree species that re-colonize the bracken fern areas are Alnus subcordata and Acer velutinum.
148
Fig. 13 Cover sum of juvenile trees from frequent tree species.
Abb.13 Gesamtdeckung des Jungwuchses der häufigsten Baumarten.
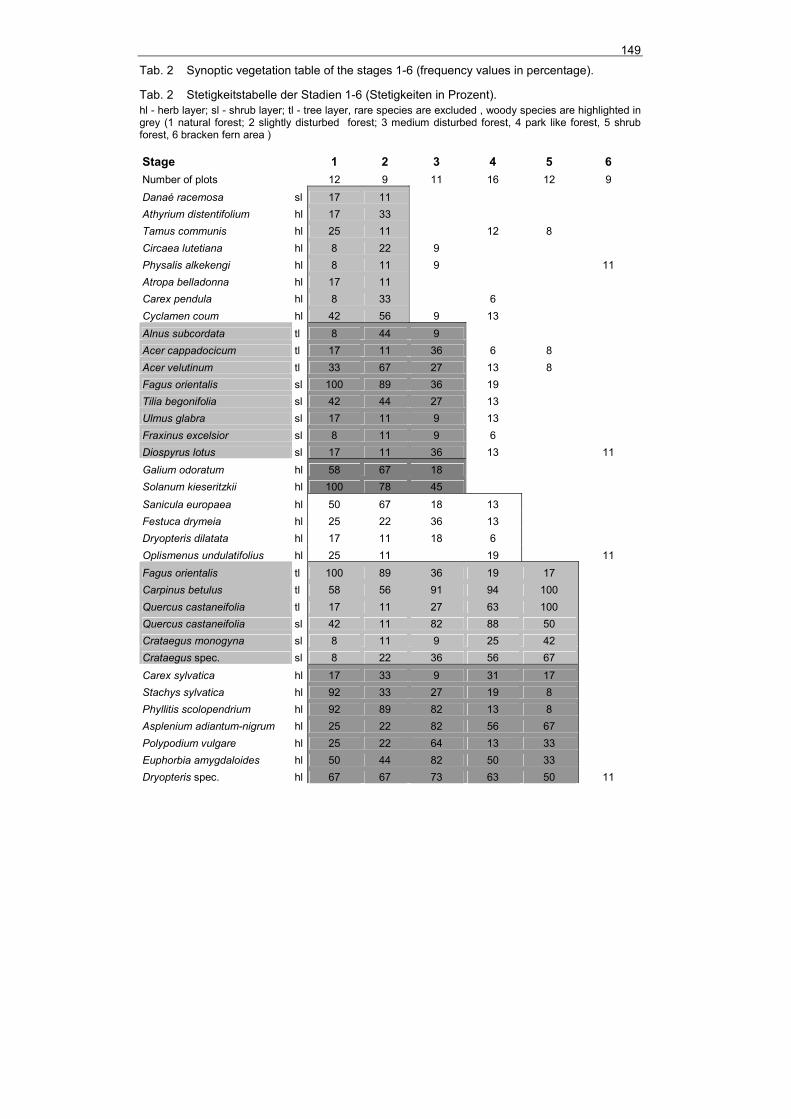
The plot species diversity also differs in between the stages. The highest diversity can be found in the medium disturbed stages. Here species of open and closed habitats can co-occur. Natural forests as well as high degraded spots are less divers (Fig. 14).
Fig. 14 Average numbers of species per plot in the stages 1-6.
Abb. 14 Durchschnittliche Artenzahlen per Plot in den Stadien 1-6.
149
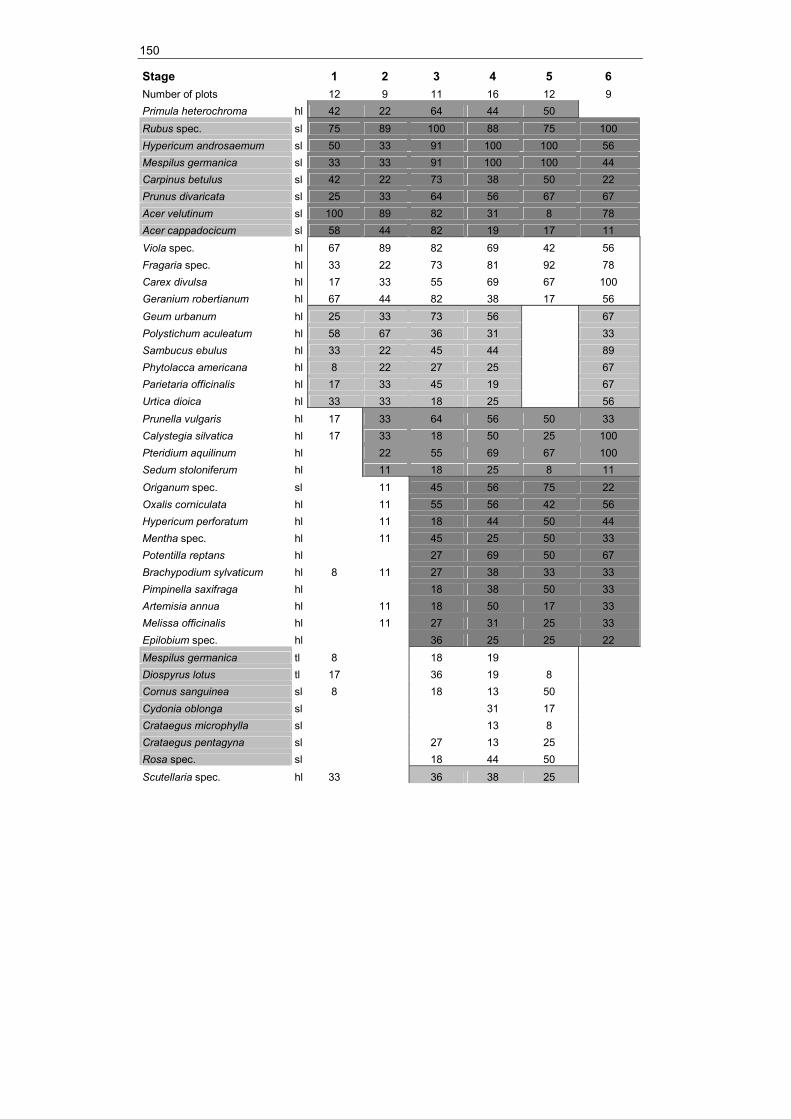
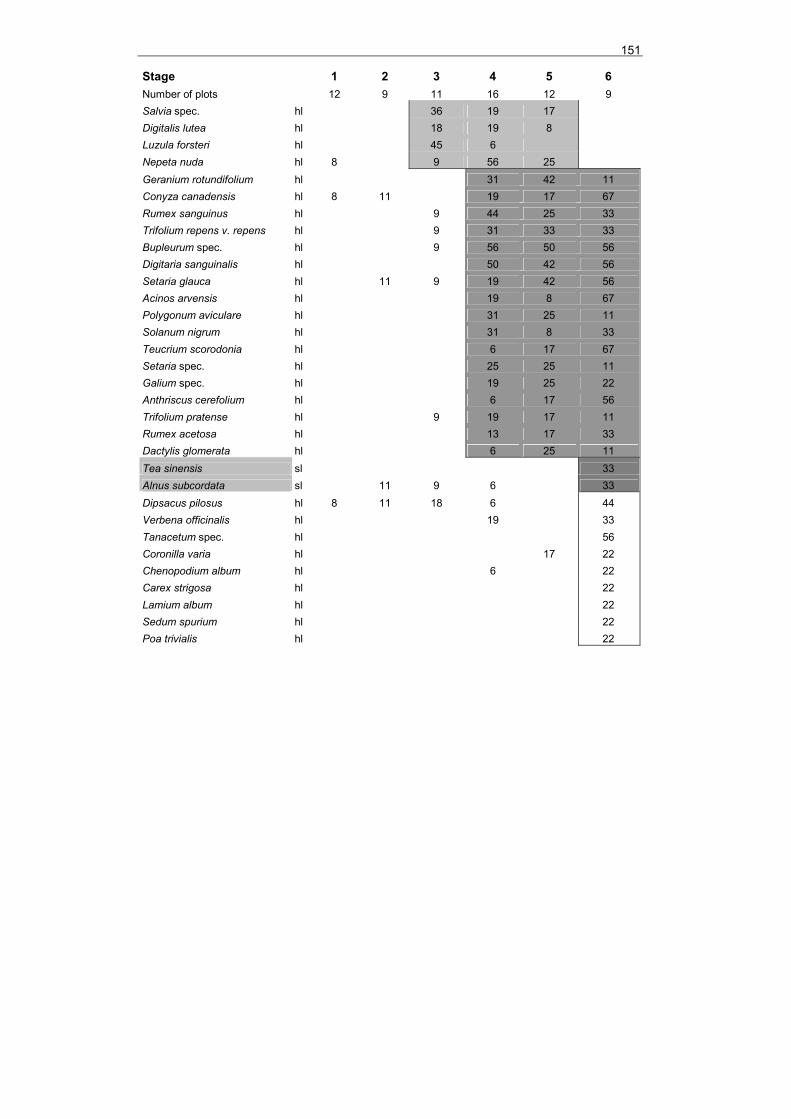
Tab. 2 Synoptic vegetation table of the stages 1-6 (frequency values in percentage).
Tab. 2 Stetigkeitstabelle der Stadien 1-6 (Stetigkeiten in Prozent). hl - herb layer; sl - shrub layer; tl - tree layer, rare species are excluded , woody species are highlighted in grey (1 natural forest; 2 slightly disturbed forest; 3 medium disturbed forest, 4 park like forest, 5 shrub forest, 6 bracken fern area )
Stage 1 2 3 4 5 6 Number of plots 12 9 11 16 12 9 Danaé racemosa sl 17 11 Athyrium distentifolium hl 17 33 Tamus communis hl 25 11 12 8 Circaea lutetiana hl 8 22 9 Physalis alkekengi hl 8 11 9 11 Atropa belladonna hl 17 11 Carex pendula hl 8 33 6 Cyclamen coum hl 42 56 9 13 Alnus subcordata tl 8 44 9 Acer cappadocicum tl 17 11 36 6 8 Acer velutinum tl 33 67 27 13 8 Fagus orientalis sl 100 89 36 19 Tilia begonifolia sl 42 44 27 13 Ulmus glabra sl 17 11 9 13 Fraxinus excelsior sl 8 11 9 6 Diospyrus lotus sl 17 11 36 13 11 Galium odoratum hl 58 67 18 Solanum kieseritzkii hl 100 78 45 Sanicula europaea hl 50 67 18 13 Festuca drymeia hl 25 22 36 13 Dryopteris dilatata hl 17 11 18 6 Oplismenus undulatifolius hl 25 11 19 11 Fagus orientalis tl 100 89 36 19 17 Carpinus betulus tl 58 56 91 94 100 Quercus castaneifolia tl 17 11 27 63 100 Quercus castaneifolia sl 42 11 82 88 50 Crataegus monogyna sl 8 11 9 25 42 Crataegus spec. sl 8 22 36 56 67 Carex sylvatica hl 17 33 9 31 17 Stachys sylvatica hl 92 33 27 19 8 Phyllitis scolopendrium hl 92 89 82 13 8 Asplenium adiantum-nigrum hl 25 22 82 56 67 Polypodium vulgare hl 25 22 64 13 33 Euphorbia amygdaloides hl 50 44 82 50 33 Dryopteris spec. hl 67 67 73 63 50 11
150
Stage 1 2 3 4 5 6 Number of plots 12 9 11 16 12 9 Primula heterochroma hl 42 22 64 44 50 Rubus spec. sl 75 89 100 88 75 100 Hypericum androsaemum sl 50 33 91 100 100 56 Mespilus germanica sl 33 33 91 100 100 44 Carpinus betulus sl 42 22 73 38 50 22 Prunus divaricata sl 25 33 64 56 67 67 Acer velutinum sl 100 89 82 31 8 78 Acer cappadocicum sl 58 44 82 19 17 11 Viola spec. hl 67 89 82 69 42 56 Fragaria spec. hl 33 22 73 81 92 78 Carex divulsa hl 17 33 55 69 67 100 Geranium robertianum hl 67 44 82 38 17 56 Geum urbanum hl 25 33 73 56 67 Polystichum aculeatum hl 58 67 36 31 33 Sambucus ebulus hl 33 22 45 44 89 Phytolacca americana hl 8 22 27 25 67 Parietaria officinalis hl 17 33 45 19 67 Urtica dioica hl 33 33 18 25 56 Prunella vulgaris hl 17 33 64 56 50 33 Calystegia silvatica hl 17 33 18 50 25 100 Pteridium aquilinum hl 22 55 69 67 100 Sedum stoloniferum hl 11 18 25 8 11 Origanum spec. sl 11 45 56 75 22 Oxalis corniculata hl 11 55 56 42 56 Hypericum perforatum hl 11 18 44 50 44 Mentha spec. hl 11 45 25 50 33 Potentilla reptans hl 27 69 50 67 Brachypodium sylvaticum hl 8 11 27 38 33 33 Pimpinella saxifraga hl 18 38 50 33 Artemisia annua hl 11 18 50 17 33 Melissa officinalis hl 11 27 31 25 33 Epilobium spec. hl 36 25 25 22 Mespilus germanica tl 8 18 19 Diospyrus lotus tl 17 36 19 8 Cornus sanguinea sl 8 18 13 50 Cydonia oblonga sl 31 17 Crataegus microphylla sl 13 8 Crataegus pentagyna sl 27 13 25 Rosa spec. sl 18 44 50 Scutellaria spec. hl 33 36 38 25
151
Stage 1 2 3 4 5 6 Number of plots 12 9 11 16 12 9 Salvia spec. hl 36 19 17 Digitalis lutea hl 18 19 8 Luzula forsteri hl 45 6 Nepeta nuda hl 8 9 56 25 Geranium rotundifolium hl 31 42 11 Conyza canadensis hl 8 11 19 17 67 Rumex sanguinus hl 9 44 25 33 Trifolium repens v. repens hl 9 31 33 33 Bupleurum spec. hl 9 56 50 56 Digitaria sanguinalis hl 50 42 56 Setaria glauca hl 11 9 19 42 56 Acinos arvensis hl 19 8 67 Polygonum aviculare hl 31 25 11 Solanum nigrum hl 31 8 33 Teucrium scorodonia hl 6 17 67 Setaria spec. hl 25 25 11 Galium spec. hl 19 25 22 Anthriscus cerefolium hl 6 17 56 Trifolium pratense hl 9 19 17 11 Rumex acetosa hl 13 17 33 Dactylis glomerata hl 6 25 11 Tea sinensis sl 33 Alnus subcordata sl 11 9 6 33 Dipsacus pilosus hl 8 11 18 6 44 Verbena officinalis hl 19 33 Tanacetum spec. hl 56 Coronilla varia hl 17 22 Chenopodium album hl 6 22 Carex strigosa hl 22 Lamium album hl 22 Sedum spurium hl 22 Poa trivialis hl 22
152
5 Discussion Compared to the average timber stock of 352 m³/ha in a managed beech forest in Germany (BUNDESWALDINVENTUR 2003) the average stock of 700 m³/ha at the natural forest stage seems to be enormous. The reason lies in the old and very thick trees (DBH>140 cm) that grow here and the relative high number of trees (350 trees/ha). The timber stock in our stage two (single tree extraction) are comparable to those of a managed German beech forest. Increments of an average beech-forest in Germany are 11,74 m³/ha*a. Under the favourable climatic conditions in the Hyrcanian forests, we assume that the increments will be much higher.
5.1 Development of the stages
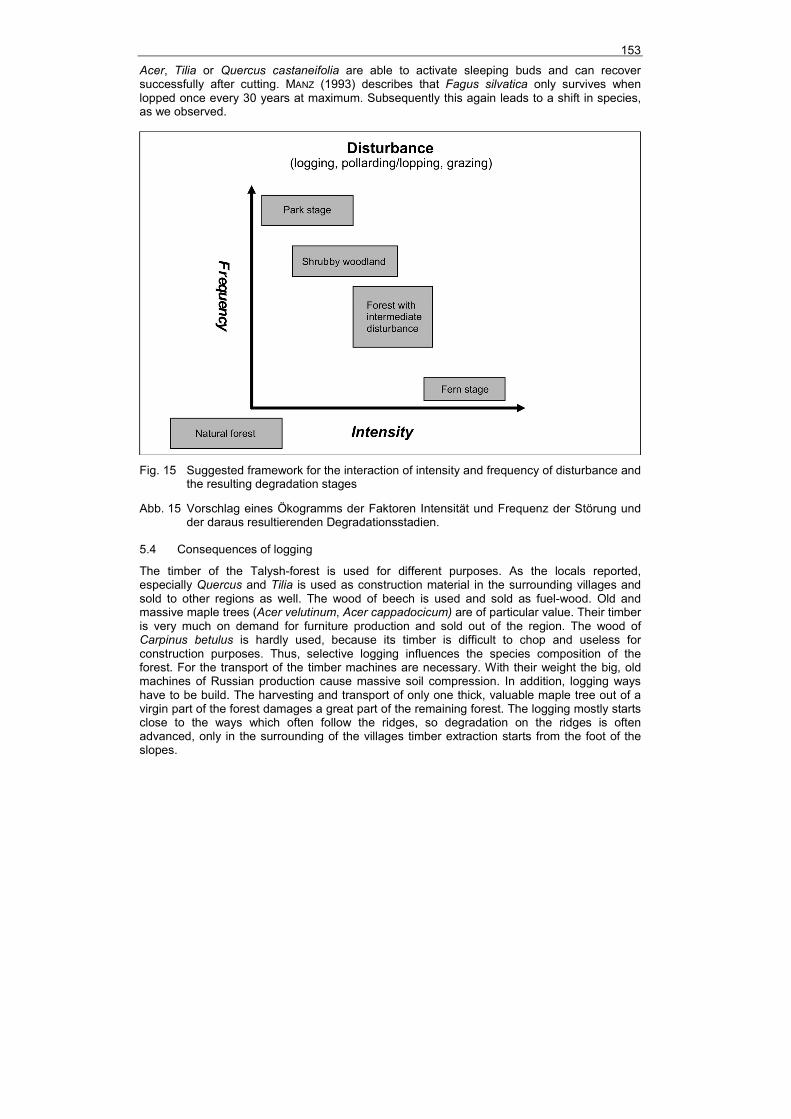
The main factors that influence the vegetation and its structure are logging, pollarding/lopping and grazing of cattle, water buffalos, horses and sheep. These factors can be summarized as disturbance. In dependence to the proportions, intensity and frequency of these main factors different forms of degraded forests develop. Figure 15 expresses a possible framework for the interaction of frequency and intensity of disturbances and the resulting degradation stages.
5.2 Influence of silvopasture
Silvopasture prevents forest recruitment because cattle selectively browse seedlings and juvenile trees (WEBER 1986, POTT 1988). On a larger time scale, a more open, park-like forest develops. Because of larger gaps between the trees, crowns grow bigger and branches already arise in low parts of the trunk. The trees are damaged through grazing or the hoofs of the animals and develop big scars and often peculiar forms (LISS 1990). Beyond this, trampling of cattle leads towards soil compression, followed by an increased surface runoff.
In the long run silvopasture changes the species composition of a forest. The animals prefer specific species and avoid others like thorny shrubs and trees. Although the ground vegetation is considered the most important component of silvopastural systems (GALLANDAT et al. 1995) also a shift in tree species and a more pronounced shrub layer can be observed (CASASUS et al. 2006). This might be one explanation for the increasing importance of shrub species in our stages. The herbaceous layer of a grazed forest is more dominated by light-demanding species as well as graminoids (SPEIER 1994). Silvopasture leads to an export of nutrient elements on a large scale (LISS 1989, GLATZEL 1990).
As typical for grazed forests a mosaic of shrub-zones, rests of woodlands and park stages is described (POTT & HÜPPE 1991) – the same structures as we found in our different stages.
In our research area silvopasture is mostly practised by cattle and, in a small amount, by water-buffalos and horses. Because the cows are driven to the villages every night their radius is limited. The data in literature differs but it will be most likely less than 6 kilometres. The water buffaloes and horses stay in the forest during night time and therefore graze in longer distances to the settlements.
5.3 Consequences of lopping/pollarding
A great amount of trees in our research area are lopped or pollarded. The branches and leaves are used as fodder for domestic animals or as fuel wood for heating and cooking.
Again, the continuous extraction of biomass leads to an impoverishment of nutrients in the soil (KILIAN 1998). Lopped or pollarded trees show decreased growth rates and develop special growth forms, as described in the results. The tree species differ in their ability to withstand periodical lopping (HÄRDTLE 2004). Some species like Fagus orientalis are restricted in their ability to renew their crown or branches after lopping. Others like Carpinus betulus,
153
Acer, Tilia or Quercus castaneifolia are able to activate sleeping buds and can recover successfully after cutting. MANZ (1993) describes that Fagus silvatica only survives when lopped once every 30 years at maximum. Subsequently this again leads to a shift in species, as we observed.
Fig. 15 Suggested framework for the interaction of intensity and frequency of disturbance and
the resulting degradation stages
Abb. 15 Vorschlag eines Ökogramms der Faktoren Intensität und Frequenz der Störung und der daraus resultierenden Degradationsstadien.
5.4 Consequences of logging
The timber of the Talysh-forest is used for different purposes. As the locals reported, especially Quercus and Tilia is used as construction material in the surrounding villages and sold to other regions as well. The wood of beech is used and sold as fuel-wood. Old and massive maple trees (Acer velutinum, Acer cappadocicum) are of particular value. Their timber is very much on demand for furniture production and sold out of the region. The wood of Carpinus betulus is hardly used, because its timber is difficult to chop and useless for construction purposes. Thus, selective logging influences the species composition of the forest. For the transport of the timber machines are necessary. With their weight the big, old machines of Russian production cause massive soil compression. In addition, logging ways have to be build. The harvesting and transport of only one thick, valuable maple tree out of a virgin part of the forest damages a great part of the remaining forest. The logging mostly starts close to the ways which often follow the ridges, so degradation on the ridges is often advanced, only in the surrounding of the villages timber extraction starts from the foot of the slopes.
154 5.5 Secondary effects of degradation
We observed effects of forest depletion in connection to soil-fertility, erosion and water storage capacity of the forest. The consistency of the topsoil changes from a strong humus forest soil with a thick litter layer in the natural parts to a very loamy, sometimes open soil without litter layer in the most influenced parts of the forest. On some exposed spots even erosion to the bare bedrock was visible. The inhabitants of the villages in the area agreed in the statement that the soil fertility of deforested soils strongly decreases after only three or four years of agricultural use.
Areas without vegetation are very much exposed to erosion, especially during heavy rainfall events. After only a few hours of heavy rainfall forest brooks with clear water are changing into muddy, raging torrents, full of eroded material as we observed during one of this events. In addition, locals told that especially within the last years more and more springs fall dry during summertime, so that there are problems with the irrigation of the fields or with the drinking water supply for the households. This could be traced back to the reduced water storage capacity of the degraded forest. The same effects reports NASSER-GHOLI SAFFARI (2005) from Caspian forests of Iran.
5.6 What can be done with our findings? Even if our research only covered the surrounding of two villages, the described structures are representative for the whole region. Our description with all its parameters can be helpful by delivering first data for an inventory of the status of the whole forest of the Talysh-mountains and to have a measure for the quantity of degradation.
A nowadays widespread tool to record vegetation structures of extensive areas is remote sensing with the help of satellite recordings. Via the so called “Normalized Difference Vegetation Index“(NDVI) the photosynthetic activity and/or amount of green biomass of the vegetation can be made visible (HILDEBRANDT 1996, FUCHS 2003). For example, a study in the region of the walnut forests in Kyrgyzstan showed that different forest types and densities can be distinguished with this method (MEISTER 2006).
5.7 How can the forest recover?
A socioeconomic study in the two villages Gegiran and Tujado shows that the lack of an alternative income let the stakeholders deplete the forest. The “open access” regime and the absence of a regular forestry or management plan aggravate the situation (NOACK 2007). The widespread bracken fern areas of former tea plantations or clear-cuttings have a great potential for reforestation. If not suppressed by cattle browsing natural succession will soon re-establish a dense forest, as evidenced by the abundand presence of juvenile trees and seedlings. Alternatively, artificial reforestation could shorten this process and provide work to some people. The reducing of livestock in silvopasture to a sustainable amount would allow even the most degraded forests to renew as there is still potential of rejuvenation present. A total division of pasture and woodland like in Central Europe will not be possible due to the small area of existing pastures and the long history of silvopasture in this region. But a kind of pasture management is urgently needed. To provide knowledge on sustainable and nature-near forestry, or better, the introduction of a regular forestry, is another step towards a better management. In this context, the creation of a functioning control mechanism to avoid illegal logging is essential. Some efforts are made by the government to build pipelines to supply some bigger settlements like Lerik with natural gas. This is another step to reduce the pressure on the forest.
155
5.8 Methodical problems
One critical point concerning our sampling design is the subjective selection of our plots only by appearance of the forest structure. More suitable for analysis of the disturbance gradients that govern the different stages would have been the transect method. Since the available time for fieldwork was limited we did not choose this method because it would have been much more time consuming to cover all different stages with various transects To make the results more objective and to have clearly defined borders between our stages we used the cluster analysis. Even if our preliminary field classification was more or less confirmed, some plots changed place in the classification. The second point is the choice of the parameters for clustering. Group membership does change slightly for some plots if, for instance, vegetation data are included as a second matrix or our quotients for describing the trees shape is included in the first matrix. A bias which we could not exclude was the fact that all plots of natural forest are located higher in altitude than the other plots. These plots already lay in the montane oriental beech zone and the differences in tree species composition between the degraded and natural stage could also be only the result of different elevation zonation. However, a study on the influence of silvopasture in the Iranian Caspian forest which excluded this bias came to the same shift in tree species composition (NOACK, unpublished data).
Furthermore, we only estimated the intensity of pasturing. To obtain more reliable data further research by counting the animals or counting of the excrements would be necessary. The determination of the age of the trees also should be taken as an approximation. For more reliable data there is needed a much bigger sample number. Especially the tree rings on the drill-cores of Carpinus betulus are very hard to distinguish; a noticeable error during counting is probable. Due to the late season, vegetation records are incomplete, geophytes and other earlier flowering plants are not included.
Acknowledgment This research was supported by the Michael Succow Foundation and the MARVA Foundation.
References BUNDESWALDINVENTUR (2003): www.bundeswaldinventur.de CASASUS, I. et al. (2006): Vegetation dynamics in Mediterranean forest pastures as affected by
beef cattle grazing. – Agric. Ecosyst. Environ 10: 168-174. COTTAM, G. & CURTIS, J.T. (1956): The use of distance measures in phytosociological
sampling. – Ecology 37: 451-460. ECKMÜLLNER, O. et al. (1970): Struktur und Problematik der österreichischen Forstwirtschaft. –
In: Österreichische Gesellschaft zur Raumforschung und Raumplanung (Hrsg.): Struktur Analyse des österreichischen Bundesgebietes. 413-435; Wien.
FITSCHEN, J. et al. (2002): Gehölzflora. Wiebelsheim (Quelle & Meyer). FUCHS, H.-J. (2003): Methodische Ansätze zur Erfassung von Waldbäumen mittels digitaler
Luftbildauswertung. Diss., Univ. Göttingen. 138 pp. GALLANDAT, J.-D., GILET, F., HAVLICEK, E. & PERRENOUD, A. (1995): Typologie et systématque
phytoécologiques des paturages boisés du Jura suisse, vol. I. Laboratoire d`écologie végétale, Université de Neuchatel, Rapport, 466 pp.
GLATZEL, G. (1990): The nitrogen status of Austrian forest ecosystems as influenced by atmospheric deposition, biomass harvesting and lateral organomass exchange. – Plant Soil 128: 67-74.
GLAVAC, V. (1996): Vegetationsökologie. Jena (Gustav Fischer Verlag). HÄRDTLE, W., EWALD, J. & HÖLZEL, N. (2004): Wälder des Tieflandes und der Mittelgebirge. 252
pp; Stuttgart (Verlag Eugen Ulmer).
156
HILDEBRANDT, G. (1996): Fernerkundung und Luftbildmessung: für Forstwirtschaft, Vegetationskartierung und Landschaftsökologie. 675 pp; Heidelberg (Wichmann).
KILIAN, K. (1998): Forest site degradation-temporary deviation from natural site potential. – Ecological Engineering 10: 5-18.
KNAPP, H.D. (2005): The global importance of the Caspian forests. – Naturschutz und biologische Vielfalt BfN Heft 12: 45-63.
LISS, B.M. (1989): The effect of grazing on mountain forests-results of long term investigations. – Forstl. Forschungsber. München 99: 133.
LISS, B.M. (1990): Beweidungseffekte im Bergwald. Ergebnisse aus fünfjährigen Untersuchungen zur Waldweide unter besonderer Berücksichtigung des Wildverbisses. – Forstw. Forsch. 40: 50-65.
MANZ, E. (1993): Vegetation und standörtliche Differenzierung der Niederwälder im Nahe- und Moselraum. 413 pp; Bad Dürkheim (Pollichia Buch).
MEISTER, P. (2006): Charakterisierung von Waldstandorten und ihrer räumlichen Verbreitung in Süd-Kyrgyzstan mit Hilfe von Fernerkundung und GIS. – Diploma Thesis Greifswald University, 131 pp.
MINISTRY OF ECOLOGY AND NATURAL RESOURCES OF THE AZERBAIJAN REPUBLIC (MENR) (2004): Nomination of the „Hirkan forests“ of Azerbaijan as UNESCO World Heritage Site. unpublished draft as of March 30, 2004.
MEUSEL, H., JÄGER, E. & WEINERT, E. (1965): Vergleichende Chorologie der Zentral-europäischen Flora. Jena (Fischer).
MITCHELL, K. (2001): Quantitative Analysis by the Point-Centered Quarter Method. – http://people.hws.edu/Mitchell/PCQM.pdf
MÜHR, B. (2006): Klimadiagramme weltweit. – www. klimadiagramme.de NASSER-GHOLI SAFARI (2005): Land use, rural development and endangering of the Caspian
forests. – Naturschutz und biologische Vielfalt BfN Heft 12: 89-97. NOACK, F. (2007): The Economics of Forest Depletion in Southern Azerbaijan. – Archiv für
Naturschutz und Landschaftsforschung 46 (2). POTT, R. (1988): Entstehung von Vegetationstypen und Pflanzengesellschaften unter dem
Einfluß des Menschen. – Düsseld. Geobot. Kolloq. 5: 27-54. POTT, R. & HÜPPE, J. (1991): Die Hudelandschaften Nordwestdeutschlands. – Abh. Westfäl.
Mus. Naturkde. 53: 1-313. RADDE, G. (1886): Reisen an der Persisch-Russischen Grenze, Talysch und seine Bewohner.
Leipzig (F.A. Brockhaus). RADDE, G. (1899): Die Vegetation der Erde III. Grundzüge der Pflanzenverbreitung in den
Kaukasusländern. Leipzig (Wilhelm Engelmann). SCHMIDT, P. (2004): Bäume und Sträucher Kaukasiens. – Mitteilungen der Deutschen
Dendrologischen Gesellschaft 87-90 (4 parts). SCHROEDER, F.-G. (1998): Lehrbuch der Pflanzengeographie. Wiesbaden (Quelle & Meyer). SCHULZE, G. (2006): Forstwirtschaft Waldmesslehre I + II, Referat Forsteinrichtung
/Waldbewertung /Waldinventuren, Staatsbetrieb Sachsenforst. http://www.forsten.sachsen.de/de/wu/organisation/obere_behoerden/landesforstpraesidium/graupa/waldundumwelt/forsteinrichtung/vorlesung/Waldmesslehre.pdf
SPEIER, M. (1994): Vegetationskundliche und paläoökologische Untersuchungen zur Rekonstruktion prähistorischer und historischer Landnutzungen im südlichen Rothaar-gebirge. – Abh. Westf. Mus. Naturkde. 56: 5-15.
WEBER, H.E. (1986) Waldumwandlung durch Beweidung in Niedersachsen. – Natur und Landschaft 61: 330-333.
ZOHARY, M. (1973): Geobotanical Foundations of the Middle East. Stuttgart (G. Fischer).