Embed Size (px)
Citation preview

Page 1 of 23
Oracle Business Intelligence
Degree Audit Reporting System
Table of Contents Introduction ............................................................................................................................................ 2
4.2.0 – DARS Plan Overview .................................................................................................................. 3
4.2.0.1 – DARS Course Planned Demand .............................................................................................. 5
4.2.1 – DARS Course Needed Demand .................................................................................................. 6
4.2.1.1 – DARS Golden Four (G4) ............................................................................................................ 9
4.2.2 – DARS GPA Report ...................................................................................................................... 10
4.2.3 – DARS Graduation Reports ........................................................................................................ 11
4.2.4 – DARS Overview ......................................................................................................................... 12
4.2.6 – DARS Requirements Needed ................................................................................................... 17
4.2.7 – DARS Student Course List ......................................................................................................... 19
Save the Current Report Filter and View Settings ............................................................................... 20
Exporting a Report for Printing ........................................................................................................... 21
Exporting Data for Analysis .................................................................................................................. 22
Frequently Asked Questions ................................................................................................................. 23

Page 2 of 23
Introduction
What is DARS and what does it do?
DARS is an acronym for a program called the Degree Audit Reporting System. At its core, DARS is a highly
automated system that helps students and advisors track progress towards completion of a degree. By
comparing the college catalog degree requirements to the courses a student has completed, DARS tells students
and advisors which requirements have been met, which are still outstanding, and the courses that will meet
those requirements.
When you request a DARS report the DARS “engine”, in real-time, gets all HSU coursework along with all
entered transfer coursework that exists in PeopleSoft and applies those courses to the student’s degree
program based on rules that define each degree program in DARS (this is referred to as DARS encoding). Manual
exceptions are created on a per-student basis to adjust courses/requirements as needed.
What is OBI and what does it do?
OBI is an acronym for Oracle Business Intelligence. OBI is a comprehensive business intelligence platform that
delivers a full range of analytic and reporting capabilities. Fundamentally, OBI is a reporting tool that is designed
to aggregate thousands of rows of data into easier to analyze reports.
What is the DARS dashboard in OBI and what does it do?
http://obi.humboldt.edu
We have created multiple DARS dashboards in OBI that gathers millions of rows of data from our nightly DARS
batch run (all active students) and presents the data in a more readable/useful format for further
analysis/reporting.

Page 3 of 23
4.2.0 - DARS Plan Overview Purpose
This dashboard reports on DARS planner data, at a detailed or summary level. You might use this dashboard to
view specific students for advising purposes, or for an overall outlook on the status of planning for a particular
group.
Plan Overview
The “Plan Overview” report is best for detailed student plan data. The first three columns of filters can help
narrow down your selection, to a specific advisor, level, or major, for example.
The “Degree Program” filters (ex. Degree Program Title) refer to the major assigned to the student. The “Plan”
filters (ex. Plan DProg Title) refer to the major assigned to the student’s DARS Plan, as these can differ.

Page 4 of 23
Details on the last column of filters
Plan Participation - Filter on plan status (Full, Incomplete, or None).
o Full – Student has an active plan, with at least 3 future terms planned, or planned up to their
expected graduation date
o Incomplete – Student has an active plan with fewer than 3 future terms planned
o None – Student does not have an active plan
Term List – View plans completed for a specific term
3 or more future terms planned – View students who have 3 or more terms planned
Advisor Hold – View students who currently have an advising hold.
o Advising holds are placed on students every semester until their advisor removes the hold ---
mandatory advising --- advisors should not remove advising holds until the student has planned
at least three semesters ahead
Approved Leave – View students with approved leave. They may have unique planning needs.
Enrolled Current Term – View students currently enrolled this term
Plan Status
The “Plan Status” report provides a summary of plan status (Full, Incomplete, None) by college, department or
advisor. Use the View drop down to change how the data is grouped.
Plan Overview (Export Friendly)
This report is the same as Plan Overview, except that it includes a link to export data to Excel or CSV.

Page 5 of 23
4.2.0.1 - DARS Course Planned Demand Purpose
This dashboard provides a count of all courses found in active DARS plans (i.e., preferred or "starred" plans).
Students can only have one active plan.
Important Note: This dashboard does not provide data on students who have not completed a plan. When
using this dashboard, overall planner participation should be taken into consideration.
It is recommended that users review overall planner participation chart (to the right), overall participation by
college or department (Plan Status tab), or more fine grain participation details can be found in dashboard 4.2.0
DARS Plan Overview.
The count of students planning to take a course are not adjusted for likely attrition of students before the target
term. Further, all new first-time and transfer students do not initially have a DARS degree plan in place.
Thus, the demand numbers for courses typically taken by new students will be understated to a greater
degree than courses typically taken by continuing students.
Use the filters if you want to limit the data you are seeing, before exporting. For example, these filters will show
you counts for Fall 2019 and Spring 2020 planned courses in Art.
The counts are hyperlinked. If you click on one, it will take you to a detailed report of the specific students who
make up the count.
Click ‘Return’ at the bottom of the detailed report to return to the dashboard.
Page 6 of 23
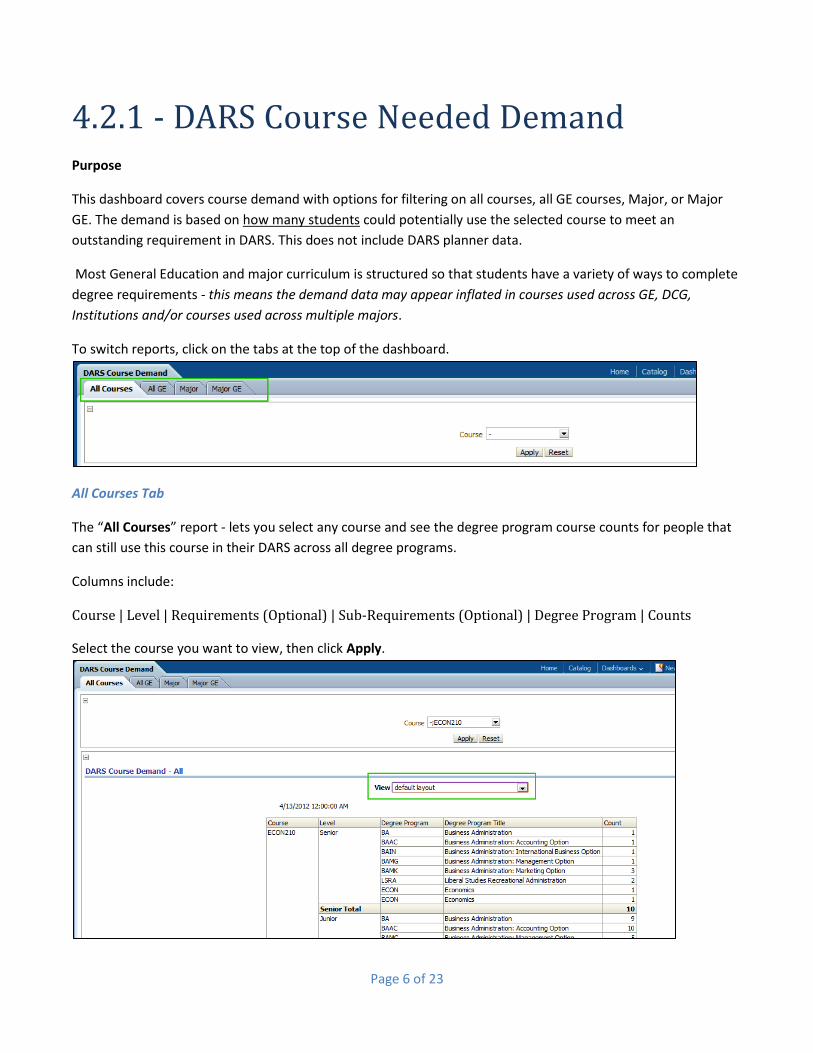
4.2.1 - DARS Course Needed Demand Purpose
This dashboard covers course demand with options for filtering on all courses, all GE courses, Major, or Major
GE. The demand is based on how many students could potentially use the selected course to meet an
outstanding requirement in DARS. This does not include DARS planner data.
Most General Education and major curriculum is structured so that students have a variety of ways to complete
degree requirements - this means the demand data may appear inflated in courses used across GE, DCG,
Institutions and/or courses used across multiple majors.
To switch reports, click on the tabs at the top of the dashboard.
All Courses Tab
The “All Courses” report - lets you select any course and see the degree program course counts for people that
can still use this course in their DARS across all degree programs.
Columns include:
Course | Level | Requirements (Optional) | Sub-Requirements (Optional) | Degree Program | Counts
Select the course you want to view, then click Apply.

Page 7 of 23
On this report you can also drop the “View” box down, to see additional fields. In this case the additional fields
you can add to the view are the Requirement/Sub-Requirements, for a more detailed breakdown of the counts.
All GE Tab
The “All GE” report - is pretty much the same as All Courses, except it is limited to just showing information as it
applies to GE requirements across all degree programs.
Columns Include: Course | Level | Requirements | Counts
Note that counts for courses (applies to both All Courses and All GE reports) that cross into GE and Major
Requirements will probably not have very accurate numbers. For example, most 309 courses will have skewed
counts. ECON309 for example, currently would show that the total demand is 2817. The numbers are skewed
because those courses can be used in upper division GE across all majors, so while technically anyone can take
ECON309 to meet their degree program requirements certain majors will be more or less likely to take certain
309 courses.
Major Tab
The “Major” report - is starting at the Major and getting the course counts for those people in the selected
Major only for courses that are not GE courses. The major reports require a degree program to be selected.
Columns Include: Requirement | Sub-Requirement | Course | Level | Counts

Page 8 of 23
Major GE Tab
The “Major GE” report - is starting at the Major and getting the course counts for those people in the selected
Major only for courses that are GE courses.
Columns Include: Requirement | Sub-Requirement | Course | Level | Counts

Page 9 of 23
4.2.1.1 - DARS Golden Four (G4) Purpose
This dashboard provides summary information on students related to G4 requirement status.
G4
You can view students who have completed a least 60, 45 or 0 number of Units.
The report will return the student’s requirements, sub-requirements, required units and their sub-requirement
status.
G4 – Transfer Students
The “G4 Transfer” report works the same way, except it looks at Transfer Units and requires the term in which
the student was admitted.

Page 10 of 23
4.2.2 - DARS GPA Report Purpose
This dashboard is used to help identify those students who might be on Academic Probation.

Page 11 of 23
4.2.3 - DARS Graduation Reports Purpose
This dashboard reports on graduation information for students related to program status and application for graduation.
Applied Grad – Not Complete
The “Applied Grad – Not Complete” report will show you who has applied for graduation in the next 6-months,
but according to the DARS they are not complete. This doesn’t always mean they will not graduate (especially if
there major contract exceptions haven’t been inputted into the system yet), but it is a list of people you might
need to look at.
Applied Grad – Not Complete GWPE ONLY
The “Applied Grad – Not Complete GWPE ONLY” report is the same as the report above, except it returns GWPE
records only.
Completed DPROG
The “Completed DPROG” report returns undergraduates with a completed Degree Program. You can filter the
data in various ways (Student ID, Advisor, College, Degree Program).
Seniors – Not Applied Grad
The “Seniors – Not Applied Grad” report returns the number of hours completed for Seniors that haven’t
applied for graduation yet.

Page 12 of 23
4.2.4 - DARS Overview Purpose
The DARS Overview dashboard was developed around paper spreadsheets that the College of Professional
Studies utilized. This dashboard provides an overview, from a DARS perspective, of all students in a particular
degree program. This allows you to discover, for example, groups of students who may need additional
advising, positive or negative trends, or individuals in need of further assistance.
The different tabs allow you to choose whether to filter data by Degree Program, Student ID, or Advisor name.
Basic Filtering
Filters with an asterisk (*) are required.
1. Depending on the tab (report) you are using, select either a degree program, a student ID or advisor
name.
2. View Courses?
a. Select Yes to see the courses used in the requirements.
b. This option turns on/off the viewing of the courses. Turning off the courses will create a more
compact view, but less detail.
3. View Sub. Req.?
a. Initially, keep the View Sub. Req. set to No.
b. You must limit the number of columns viewed before setting it to Yes; otherwise, you will
generate an error. This is explained further later in this document.
4. Press the Apply button.
5. The results of the search will be displayed, as the following screen shot:

Page 13 of 23
Explanation of Results
Report Grouping
Students are grouped first by level (Senior, Junior, etc.), then audit completion (Complete/Not Complete), and
then catalog year (ascending). This way, “like” students are displayed together for easier analysis. Each
grouping is broken out into its own section. For example, in the sample above the first two records of the
“Senior-Anthropology-Complete” grouping are displayed. Scrolling down further would reveal the “Senior-
Anthropology-Not Complete” grouping, etc. The date reflects the date the audit was run for these students.
Biographical and Demographic Data
The first eight columns Catalog Year through Advisor Name(s) can be right-clicked and excluded to create a more
compact view if the biographical and demographic data is not required.
DARS Data
The columns after the biographical and demographic fields contain the output of the DARS. The screenshot
below displays the first 5 columns after the biographical and demographic area.
Page 14 of 23
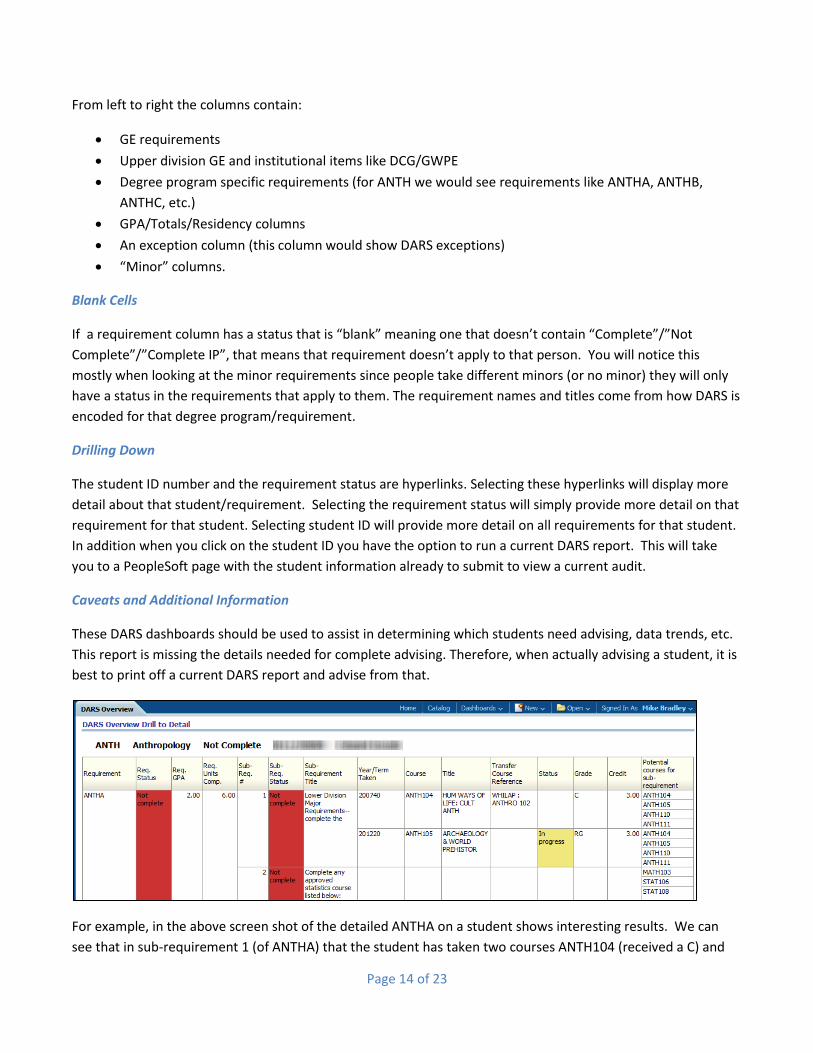
From left to right the columns contain:
GE requirements
Upper division GE and institutional items like DCG/GWPE
Degree program specific requirements (for ANTH we would see requirements like ANTHA, ANTHB,
ANTHC, etc.)
GPA/Totals/Residency columns
An exception column (this column would show DARS exceptions)
“Minor” columns.
Blank Cells
If a requirement column has a status that is “blank” meaning one that doesn’t contain “Complete”/”Not
Complete”/”Complete IP”, that means that requirement doesn’t apply to that person. You will notice this
mostly when looking at the minor requirements since people take different minors (or no minor) they will only
have a status in the requirements that apply to them. The requirement names and titles come from how DARS is
encoded for that degree program/requirement.
Drilling Down
The student ID number and the requirement status are hyperlinks. Selecting these hyperlinks will display more
detail about that student/requirement. Selecting the requirement status will simply provide more detail on that
requirement for that student. Selecting student ID will provide more detail on all requirements for that student.
In addition when you click on the student ID you have the option to run a current DARS report. This will take
you to a PeopleSoft page with the student information already to submit to view a current audit.
Caveats and Additional Information
These DARS dashboards should be used to assist in determining which students need advising, data trends, etc.
This report is missing the details needed for complete advising. Therefore, when actually advising a student, it is
best to print off a current DARS report and advise from that.
For example, in the above screen shot of the detailed ANTHA on a student shows interesting results. We can
see that in sub-requirement 1 (of ANTHA) that the student has taken two courses ANTH104 (received a C) and

Page 15 of 23
ANTH105 (this one in-progress). So you might wonder why then is the sub-requirement status “Not complete”,
this is because the sub-requirement is not complete (it is not even completed in progress).
When viewing these reports, it is helpful to have some knowledge about how the degree
programs/requirements are encoded. In this case sub-requirement 1 requires 4 courses to be considered
complete (this person has to complete ANTH110 &111 before it is complete) – that information is not reflected
on the dashboard, but is reflected on the DARS. Another issue is that in sub-requirement 2 you see that the
potential courses (courses that might be able to be used in that sub-requirement) lists MATH103 – however
Math 103 is not always a statistics class. In this case, only Math 103 that contains “STAT” in the title can be used
for this approved statistics course.
Also, catalog year is very important (which is why like years are grouped together), since requirements can
change from year to year. For example, starting in 201240 (Fall 2012) the above ANTHA requirement has been
completely changed, it requires 5 basic core courses (ANTH104, 105, 303, 338, & 310) and completely removes
the stats requirement from ANTHA. It is essential that program changes are taken into account when viewing
this data.
In addition, when viewing through the dashboard it is not possible to determine if a student is a dual major. If
you were to simply advise the student based on one major, you might miss something important. Running a
current DARS report would show you the two (or more) audits to enable proper advising.
Additional Filtering Options
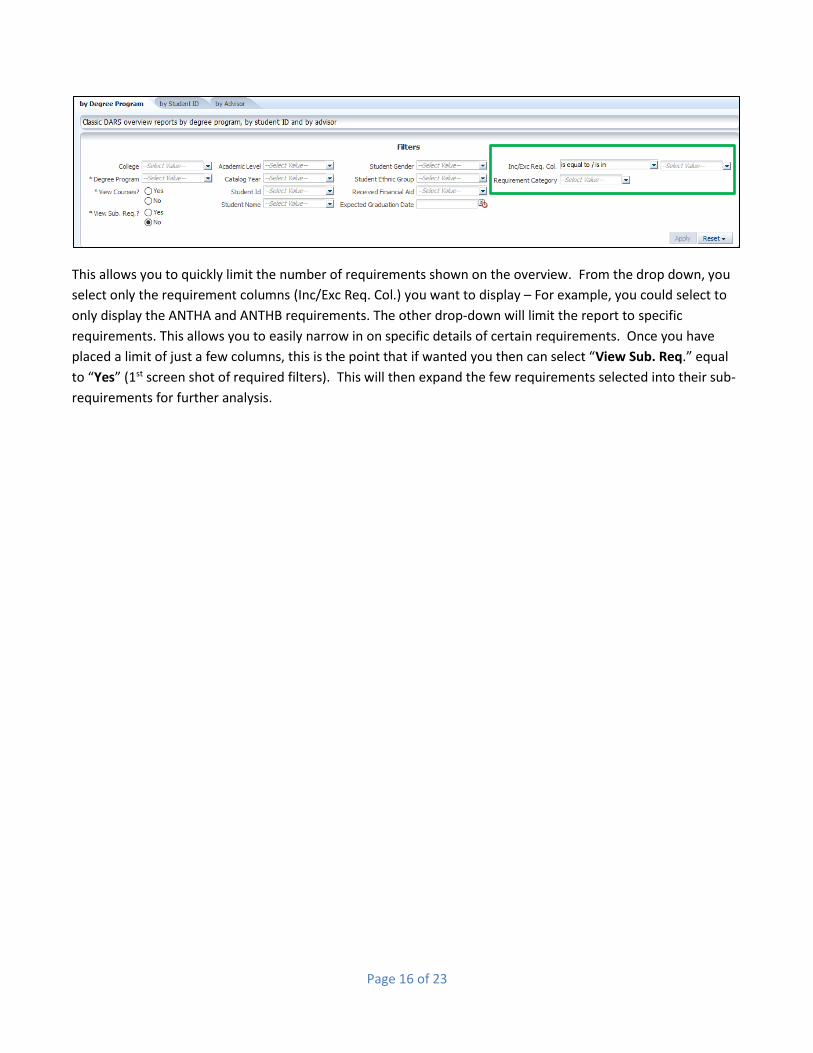
Going back to the filter section, I have highlighted the middle section in blue in this screen shot:
This middle section can be used to limit the number of rows returned. The choices are limited by the other
choices. For example, in this case since we have selected the degree program ANTH, the ethnic group drop
down will only show me the ethnic codes for people in the degree program ANTH – etc.
The last item in the filter section highlighted in green to the right in this screen shot:
Page 16 of 23
This allows you to quickly limit the number of requirements shown on the overview. From the drop down, you
select only the requirement columns (Inc/Exc Req. Col.) you want to display – For example, you could select to
only display the ANTHA and ANTHB requirements. The other drop-down will limit the report to specific
requirements. This allows you to easily narrow in on specific details of certain requirements. Once you have
placed a limit of just a few columns, this is the point that if wanted you then can select “View Sub. Req.” equal
to “Yes” (1st screen shot of required filters). This will then expand the few requirements selected into their sub-
requirements for further analysis.

Page 17 of 23
4.2.6 - DARS Requirements Needed Purpose
This dashboard shows unmet student requirements. The three reports available are for filtering by ”Degree
Program", "Student ID" or "Advisor." This report is simplified when compared to the Overview report, allowing
you to see everything on the screen, but still be able to drill down if needed.
By Degree Program

Page 18 of 23
By Student ID
By Advisor

Page 19 of 23
4.2.7 - DARS Student Course List Purpose
This dashboard reports on degree progress details by student.
This report provides an overview of a student’s course list with status, grade and earned credit.

Page 20 of 23
Save the Current Report Filter and View Settings
Save the Current Report Filter and View Settings You can save the changes (customizations) you have made. Saving the customization saves your filter
settings, excluded columns and view choice. The data will still be refreshed each time you visit the page.
Customizations only apply to the current page/tab. You can save a number of different customizations for
each page.
1. Select the Page Options button.
2. Choose Save Current Customization...
3. Add a name for the customization in
the box that appears. The name can be
anything that is meaningful to you.
4. Check Make this my default for this
page to have this same view appear
every time you visit this specific page.
5. Click OK to save this customization.
Page 21 of 23
Exporting
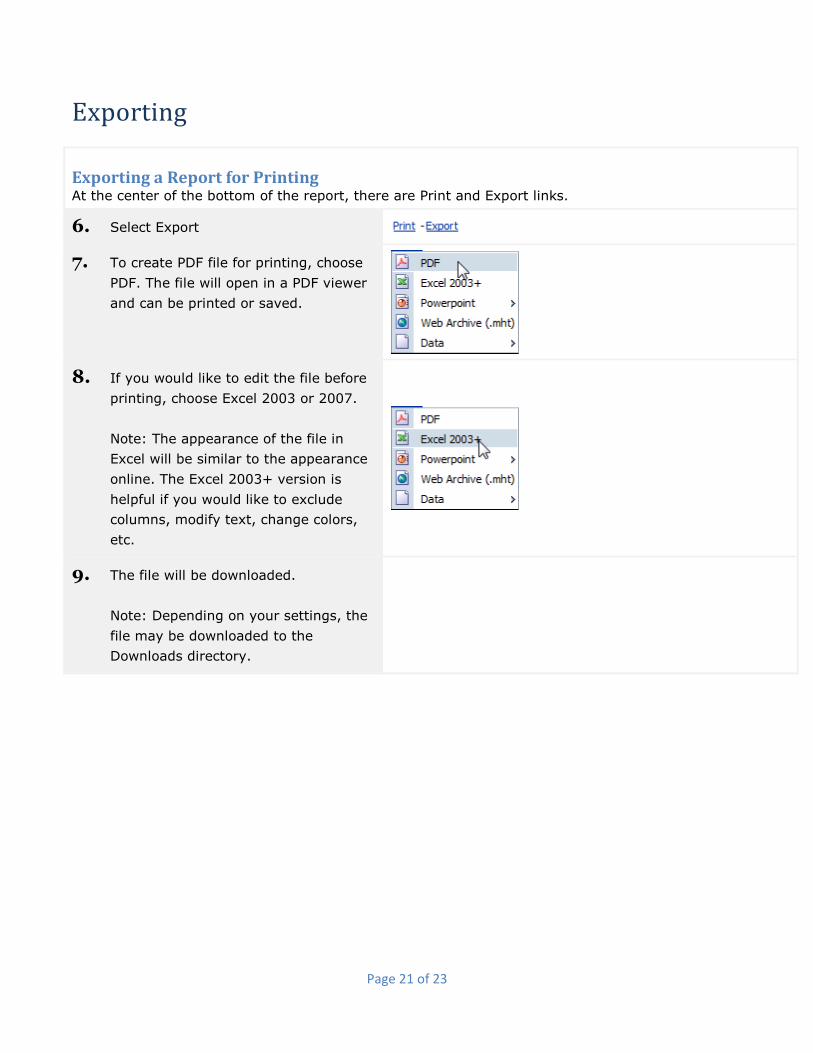
Exporting a Report for Printing At the center of the bottom of the report, there are Print and Export links.
6. Select Export
7. To create PDF file for printing, choose
PDF. The file will open in a PDF viewer
and can be printed or saved.
8. If you would like to edit the file before
printing, choose Excel 2003 or 2007.
Note: The appearance of the file in
Excel will be similar to the appearance
online. The Excel 2003+ version is
helpful if you would like to exclude
columns, modify text, change colors,
etc.
9. The file will be downloaded.
Note: Depending on your settings, the
file may be downloaded to the
Downloads directory.

Page 22 of 23
Exporting Data for Analysis At the center of the bottom of the report, there are Print and Export links. Exporting data using this
method produces a spreadsheet with an unformatted block of data, which is useful when creating
PivotTables and other types of analyses.
1. Select Export
2. Choose Data, then Tab Delimited
Format.
3. The file will be downloaded. Depending
on your settings, the file may be
downloaded to the Downloads
directory.
Page 23 of 23
FAQ
Frequently Asked Questions
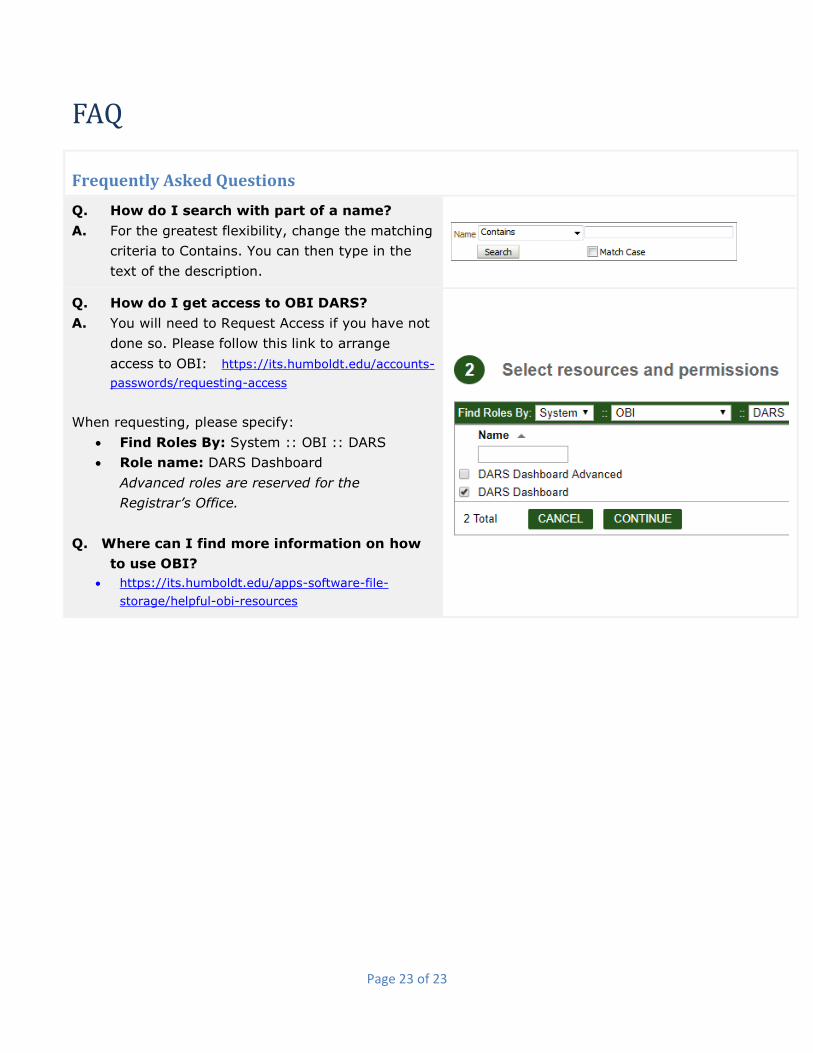
Q. How do I search with part of a name?
A. For the greatest flexibility, change the matching
criteria to Contains. You can then type in the
text of the description.
Q. How do I get access to OBI DARS?
A. You will need to Request Access if you have not
done so. Please follow this link to arrange
access to OBI: https://its.humboldt.edu/accounts-
passwords/requesting-access
When requesting, please specify:
Find Roles By: System :: OBI :: DARS
Role name: DARS Dashboard
Advanced roles are reserved for the
Registrar’s Office.
Q. Where can I find more information on how
to use OBI?
https://its.humboldt.edu/apps-software-file-
storage/helpful-obi-resources