Embed Size (px)
Citation preview
DOCUMENT RESUME
ED 372 695 HE 027 580
AUTHOR Morgan, Frank;' Broyles, SusanTITLE Degrees and Other Awards Conferred by Institutions of
Higher Education: 1991-92. E.D. TABS.INSTITUTION National Center for Education Statistics (ED),
Washington, DC.REPORT NO NCES-94-053PUB DATE Jul 94NOTE 57p.
PUB TYPE Statistical Data (110) ReportsResearch/Technical (143)
EDRS PRICE MF01/PC03 Plus Postage.DESCRIPTORS American Indians; Asian Americans; Associate Degrees;
Bachelors Degrees; Blacks; *Colleges; *Degrees(Academic); Demography; Doctoral Degrees; EducationalTrends; Females; Higher Education; HispanicAmericans; Males; Masters Degrees; Minority Groups;Professional EducatiOn; Sex Differences; *Tables(Data); Whites
IDENTIFIERS Integrated Postsecondary Education Data System
ABSTRACTThis report presents data on degrees conferred during
the 1991-92 academic year by 3,615 of the nation's accredited highereducation institutions. The data were a subset taken from IntegratedPostsecondary Education Data System (IPEDS) which collectsinformation on number of degrees conferred by level of award, fieldof study and sex of recipient. Racial/ethnic data were collected bymajor field or discipline:Data are detailed in 11' tables. Findingsreported include the following: (1) institutions conferred more than2.1 million degrees in academic year 1991-92; (2) of these, 24percent were associate's degrees, 54 percent were bachelor's degrees,17 percent were master's degrees, 2 perc:at were doctorates, and 4percent were first-professional degrees; (3) the number of alldegrees awarded was up 4.1 percent over the previous year with aboutone half of the increase in bachelor's degrees and with womenreceiving almost 61 percent of the increase; (4) percentage gains innumber of degrees awarded to minorities were as high as 10 percentmore to Asians and Pacific Islanders, 9 percent more to AmericanIndians, and 8 and 7 percent more to Hispanics and Blacks,non-Hispanics, respectively; (5) as a whole minorities increasedtheir relative share of all degrees by .5 percent; and (6) minoritiesreceived only about 14 percent of all degrees awarded in 1991-92.(JB)
************************************************************************ Reproductions supplied by EDRS are the best that can be made *
* from the original document. *
11)
Ckl NATIONAL CENTER FOR EDUCATION STATISTICS
L11 E.D. TABS July 1994
Degrees and Other AwardsConferred by Institutions ofHigher Education: 1991 92
S DEPARTMENT OF EDUCATION
EDUCATIONAI RESOURCES INFORMATIONCENTER IERICo
eoCumenl has been reetorloceo,ecr.vod Itool tho porson or organvarronorpnahng it
0 Minor (-hinges have been 1-na,lo,roupovo oductum oilily
Points of vieW or oploons stalodclocurnont do not no, ossaitly ropnw.orit01101,11 OERI posillon or poltry
U.S. Department of EducationOffice of Educational Research and Improvement NCES 94-053
BEST COPY AVAILABLE
NATIONAL CENTER FOR EDUCATION STATISTICS
E.D. TABS July 1994
Degrees and Other AwardsConferred by Institutions ofHigher Education: 1991 92
Frank MorganSusan BroylesPostsecondary Education Statistics Division
U.S. Department of EducationOffice of Educational Research and Improvement NCES 94-053
U.S. Department of EducationRichard W. RileySecretary
Office of Educational Research and ImprovementSharon P. RobinsonAssistant Secretary
National Center for Education StatisticsEmerson J. ElliottCommissioner
National Center for Education Statistics
"The purpose of the Center shall be to collect, analyze, anddisseminate statistics and other data related to educationin the United States and in other nations."Section 406(b)of the General Education Provisions Act, as amended (20U.S.C. 1221e-1).
July 1994
Contact:Frank Morgan(202) 219-1779
4
Completions in Institutions of Higher Education: 1991-92Analytic Summary
Overview
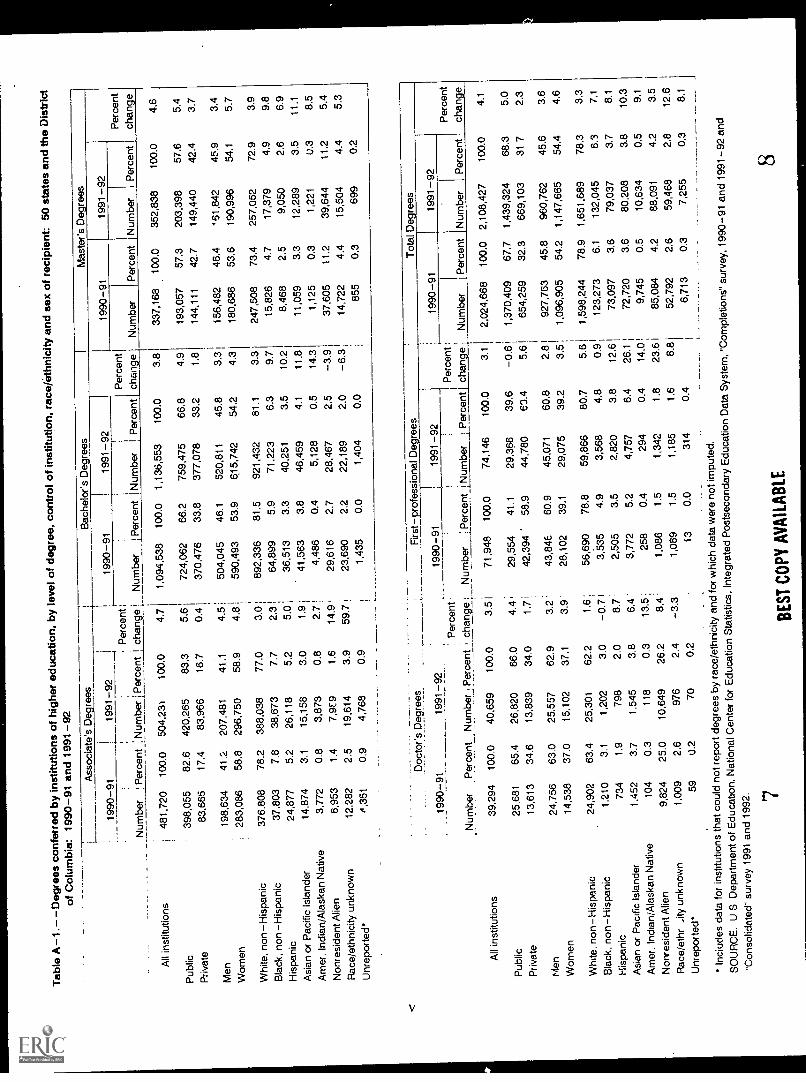
U.S. institutions of higher education conferred more than 2.1 million degrees inacademic year 1991-92. Twenty-four percent were associate's degrees; 54 percent werebachelor's C:grees; 17 percent were Master's degrees; 2 percent were doctorates; and 4
percent were first-professional degrees.
The number of all degrees awarded in 1991-92 increased by nearly 84,000, up 4.1
percent over the previous year. About one-half the increase in the number of degrees wasdue to the increase in the number of bachelor's degrees awarded. Further, of these 84,000degrees, almost 69,000 (82 percent) were awarded by public institutions. Women receivedalmost 61 percent of the increase in the number of degrees; while among the variousracial/ethnic groups, white, non-Hispanics accounted for almost two-thirds (64 percent) of the
84,000 additional degrees.
How Did Minorities Fare?
The percentage gains in the number of degrees awarded to minorities were high, (10percent more degrees were awarded to Asians and Pacific Islanders; 9 percent more wereawarded to American Indians; and 8 and 7 percent more were awarded to Hispanics andblack, non-Hispanics, respectively. Additionally, except for doctoral degrees to blacks, eachminority group registered an increase in the number of degrees awarded at each degree level.Minorities, taken as whole, also increased their relative share of all degrees awarded by one-half of one percent in the one-year period between 1990-91 ard 1991-92. On the other hand.minorities received only about 14 percent of all degrees awarded in 1991-92.
In both 1990-91 and 1991-92, about 6 percent of all degrees awarded were awarded toblack, non-Hispanics. The distribution of these degrees by level, however, did not reflect thedistribution of degrees for thc nation as a whole, as indicated above. Twenty-nine percent ofthe degrees awarded to black, non-Hispanic graduates were associate's degrees, 54 percentwere bachelor's degrees, 13 percent were master's degrees and 4 percent wcrc either doctoral(I percent) or first-professional degrees (3 percent).
The pattern of degrees awarded to Hispanics and American Indians/Alaskan Natives in
1991-92 was quite similar to that of black, non-Hispanics but differed more markedly from
the pattern of all degrees awarded because of the high concentration of awards at theassociate degree level. Of thc 4 percent share of degrees awarded to Hispanics, thirty-threepercent were associate's degrees, 51 percent were bachelor's, 11 percent were master's and 5percent were doctoral (1 percent) or first-professional (4 percent) degrees. Among AmericanIndians/Alaskan Natives, 36 percent of the degrees thcy received in 1991-92 were associate'sdegrees, 48 percent were bachelor's degrees, 11 percent were master's degrees, and 4 percent
were doctoral (1 percent) or first-professional (3 percent).
III
Degrees awarded to Asians and Pacific Islanders accounted for 4 percent of alldegrees, about the same share of degrees awarded to Hispanics. The pattern of degrees toAsians and Pacific Islanders by level, however, differed dramatically from the pattern ofdegrees awarded to other minorities and differed also from the pattern of all degrees awardedin 1991-92. Only 19 percent of degrees awarded to Asians and Pacific Islanders wereassociate's degrees, 58 percent were bachelor's degrees, 15 percent were master's degrees ano8 percent were doctoral (2 percent) or first-professional (6 percent) degrees.
In addition to the distribution of degrees by level awarded to each of the minoritygroups, also of interest is the share of degrees at each degree level that were awarded tominorities in 1991-92 and the extent to which that share changed since 1990-91. Blacks,Hispanics and American Indian/Alaskan Natives were awarded about 14 percent of allassociate's degrees. At higher degree levels, their share of degrees dropped significantlyaccounting for 10 percent of bachelor's degrees, 8 percent of master's degrees and 5 percentof doctoral degrees (table A-1). About 9 percent of all first-professional degrees wereawarded to individuals in these three minority groups. Asians and Pacific Islanders wereawarded about 3 percent of all associate's and master's degrees, 4 percent of all bachelor'sand doctoral degrees, and 6 percent of all first-professional degrees.
There was little change in the shares of degrees in the period from 1990-91 to 1991-92. Only Asians and Pacific Islanders had a change in the share of degrees. They increasedtheir share of first-professional degrees from 5 percent in 1990-91 to 6 percent in 1991-92.
Limitations of the Data
In examining data on degrees awarded to minorities, it must be noted that 3 percent ofall degrees awarded in 1991-92 were awarded to individuals whose race/ethnicity wasunknown. This unknown category could affect trends and observable changes in the numberand share of awards received by minority students, particularly if there are shifts from year toyear in the number of degree recipients with unknown race/ethnicity. As table A-1 indicates,the share of degrees awarded to individuals whose race/ethnicity was unknown variedsomewhat by degree level from 4 percent for associate's and master's degrees to 2 percent forbachelor's, doctoral and first-professional degrees. Addftionally, this share changed at theassociate degree level from 2.5 percent to 3.9 percent between 1990-91 and 1991-92.
It also should be noted that minorities reported in these data are all United Statescitizens or non-citizens with residence status. Non-resident aliens are reported separately astable A-1 indicates. Non-resident aliens accounted for 4 percent of all degrees awarded in1991-92, but 11 percent of the master's degrees and 26 percent of the doctoral degrees.
0iv
Tab
le A
-1.-
-D
egre
es c
onfe
rred
by
inst
itutio
ns o
fhig
her
educ
atio
n, b
y le
vet o
f deg
ree,
con
trol
of i
nstit
utio
n,ra
ce/e
thni
city
and
sex
of r
ecip
ient
: 50
stat
es a
nd th
e D
istr
ict
of C
olum
bia:
199
0-91
and
199
1-92
--,
Ass
ocia
te's
Deg
rees
IB
ache
lor's
Deg
rees
Mas
ter's
Deg
rees
r;i
1990
-91
,
!19
91-
92_A
;1 i19
90-9
1 I
119
91-9
2
1
1990
-91
1-P
erce
ntP
erce
nt
1991
-92
Per
cent
,
1
i
Num
ber
! Per
cent
; Num
ber
I Per
cent
I ch
ange
!N
umbe
r' P
erce
nt 1
Num
ber
1,P
erce
nt c
hang
eN
umbe
rP
erce
nt N
umbe
rP
erce
ntch
an e
1,13
6,55
310
0.0
3.8
337,
168
100.
035
2,83
810
0.0
4.6
All
inst
itutio
nsi
481,
720
100.
050
4,23
)10
0.0
4.7
1,09
4,53
810
0.0
Pub
lic39
8,05
582
.642
0,26
583
.35.
6172
4,06
266
.2
Priv
ate
83,6
6517
.483
,966
16.7
0.4
I37
0,47
633
.8
Men
198,
634
41.2
207,
481
41.1
4.5
;50
4,04
546
.1
Wom
en,
283,
086
58.8
296,
750
58.9
4.8
.59
0,49
353
.9
Whi
te, n
on-H
ispa
nic
376,
808
78.2
388,
038
77.0
3.0
I89
2,33
681
.5
Bla
ck. n
on -
His
pani
c37
,803
7.8
38,6
737.
72.
3 1
64,8
995.
9
His
pani
c24
,877
5.2
26,1
185.
25.
0 ;
36,5
133.
3
Asi
an o
r P
acifi
c Is
land
er14
,874
3.1
15,1
583.
01.
9 ;
41,5
633.
8
Am
er. I
ndia
n/A
lask
an N
ativ
e3,
772
0.8
3,87
30.
82.
74,
486
0.4
Non
resi
dent
Alie
n6,
953
1.4
7,9E
91.
614
.9 '
29,6
162.
7
Rac
e/et
hnic
ity u
nkno
wn
12,2
822.
519
,614
3.9
59.7
123
,690
2.2
Unr
epor
ted*
/1,3
510.
94,
768
0.9
1
1,43
50.
0
759,
475
66.8
377,
078
33.2
520,
811
45.8
615,
742
54.2
921,
432
81.1
71.2
236.
3
40,2
513.
5
46,4
594.
1
5,12
80.
5
28,4
672.
5
22,1
892.
0
1,40
40.
0
4.9
193,
057
57.3
203,
398
57.6
5.4
1.8
144,
111
42.7
149,
440
42.4
3.7
3.3
4.3
3.3
9.7
10.2
11.8
14.3
-3.9
-6.3
156,
482
46.4
'61,
842
45.9
3.4
180,
686
53.6
190,
996
54.1
5.7
247,
508
73.4
257,
052
72.9
3.9
15,8
264.
717
,379
4.9
9.8
8,46
82.
59,
050
2.6
6.9
11,0
593.
312
,289
3.5
11.1
1,12
50.
31,
221
0.3
8.5
37,6
0511
.239
,644
11.2
5.4
14,7
224.
415
,504
4.4
5.3
855
0.3
699
0.2
--,-
-D
octo
r's_D
egre
es.
Firs
t-pr
ofes
sion
al D
egre
es
1990
-91
1991
-92
1990
-91
i19
91-9
2j
1990
-91
Tot
al D
rees 1991
-92
:P
erce
nt '
iI
i1
Per
cent
:P
erce
nt
Num
ber
Per
cent
Num
ber
' Per
cent
icha
nge
!N
umbe
rP
erce
nti N
umbe
r Ji
erce
nt i
chan
geN
umbe
rP
erce
nt N
umbe
rP
erce
ntch
an e
All
inst
itutio
ns39
,294
100.
040
,659
100.
03.
5 ;
71,9
48
Pub
lic25
,681
65.4
26,8
2066
.04.
4 ,
29,5
54
Priv
ate
13,6
1334
.613
,839
34.0
1.7
42,3
94
Men
24,7
5663
.025
.557
62.9
3.2
;43
,846
Wom
en14
,538
37.0
15,1
0237
.13.
928
,102
Whi
te. n
on-H
ispa
nic
24,9
0263
.425
,301
62.2
1.6
;56
,690
Bla
ck, n
on-H
ispa
nic
1,21
03.
11,
202
3.0
-0.7
I3,
535
His
pani
c73
41.
979
82.
08.
7 ;
2,50
5
Asi
an o
r P
acifi
c Is
land
er1,
452
3.7
1,54
53.
86.
43,
772
Am
er. I
ndia
n/A
lask
an N
ativ
e10
40.
311
80.
313
.5 ;
258
Non
resi
dent
Alie
n9,
824
25.0
10,6
4926
.28,
4 ;
1,08
6
Rac
e/et
hr ..
ity u
nkno
wn
1,00
92.
697
62.
4-3
.31,
089
Unr
epor
ted*
590.
270
0.2
13
100.
074
,146
100.
0
41.1
29,3
6639
.6
58.9
44,7
8063
.4
60.9
45,0
7160
.8
39.1
29,0
7539
.2
78.8
59,8
6680
.7
4.9
3,56
84.
8
3.5
2,82
03.
8
5.2
4,75
76.
4
0.4
294
1,34
2
0.4
1.5
1.8
1.5
1,18
51.
6
0.0
314
0.4
3.1
2,02
4,66
810
0.0
2,10
8,42
710
0.0
-0.6
1,37
0,40
967
.71,
439,
324
68.3
5.6
;65
4,25
932
.366
9,10
331
7I
2.8
i92
7,76
345
.896
0,76
245
.6
3.5
!1,
096,
905
54.2
1,14
7,66
554
.4
5.61
1,59
8,24
478
.91,
651,
689
78.3
0.91
112
3,27
36.
113
2,04
56.
3
12.6
173
,097
3.6
79,0
373.
7
26.1
;72
,720
3.6
80,2
083.
8
14.0
!9,
745
0.5
10,6
340.
5
23.6
I85
,084
4.2
88,0
914.
2
8.8
52,7
922.
659
,468
2.8
6,71
30.
37,
255
0.3
Inci
udes
dat
a fo
r in
stitu
tions
that
cou
ld n
ot r
epor
tde
gree
s by
rac
e/et
hric
ity a
nd fo
r w
hich
dat
a w
ere
noti
mpu
ted.
SO
UR
CE
. U S
Dep
artm
ent o
f Edu
catio
n, N
atio
nal C
ente
rfo
r E
duca
tion
Sta
tistic
s, In
tegr
ated
Pos
tsec
onda
ryE
duca
tion
Dat
a S
yste
m, "
Com
plet
ions
" su
rvey
, 199
0-91
and
1991
-92
and
"Con
solid
ated
" su
rvey
199
1 an
d 19
92. 7
BE
ST
CO
PY
AV
AIL
AB
LE
4.1
5.0
2.3
3.6
4.6
3.3
7.1
8.1
10.3
9.1
3.5
12.6
8.1
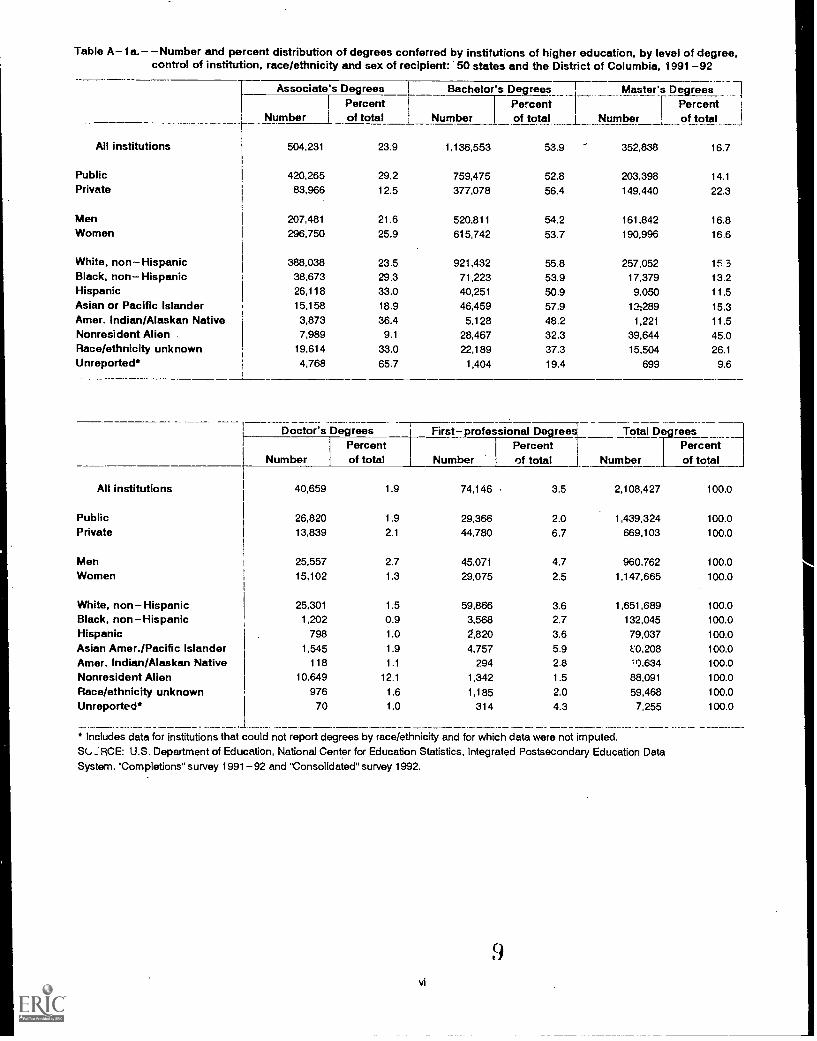
Table A-1a.- -Number and percent distribution of degrees conferred by institutions of higher education, by level of degree,control of institution, race/ethnicity and sex of recipient: 50 states and the District of Columbia, 1991-92
Associate's Degrees Bachelor's DegreesPercentof totalNumber
Percentof total Number
All institutions 504,231 23.9 1,136,553 53.9
Public 420,265 29.2 759,475 52.8Private 83,966 12.5 377,078 56.4
Men 207,481 21.6 520,811 54.2Women 296,750 25.9 615,742 53.7
White, non-Hispanic 388,038 23.5 921,432 55.8Black, non- Hispanic 38,673 29.3 71,223 53.9Hispanic 26,118 33.0 40,251 50.9Asian or Pacific Islander 15,158 18.9 46,459 57.9Amer. Indian/Alaskan Native 3,873 36.4 5,128 48.2Nonresident Alien 7,989 9.1 28,467 32.3Race/ethnicity unknown 19,614 33.0 22,189 37.3Unreported* 4,768 65.7 1,404 19.4
j Master's Degreesr Percent
I Number I of total
352,838 16.7
203,398 14.1
149,440 22.3
161,842 16.8
190,996 16.6
257,052 15 3
17,379 13.2
9,050 11.5
12289 15.3
1,221 11.5
39,644 45.0
15,504 26.1
699 9.6
Doctor's De reesPercent
Number of total
All institutions
PublicPrivate
MenWomen
White, non- HispanicBlack, non-HispanicHispanicAsian Amer./Pacific IslanderAmer. Indian/Alaskan NativeNonresident AlienRace/ethnicity unknownUnreported*
40,659 1.9
26,820 1.9
13,839 2.1
25,557 2.7
15,102 1.3
25,301 1.5
1,202 0.9
798 1.0
1,545 1.9
118 1.1
10,649 12.1
976 1.6
70 1.0
First- professional DegreesPercentof total
Total DegreesPercent
Number of totalNumber
74,146 3.5 2,108,427 100.0
29,366 2.0 1,439,324 100.0
44,780 6.7 669,103 100.0
45,071 4.7 960,762 100.0
29,075 2.5 1,147,665 100.0
59,866 3.6 1,651,689 100.0
3,568 2.7 132,045 100.0
2,820 3.6 79,037 100.0
4,757 5.9 t.'0,208 100.0
294 2.8 i 0,634 100.0
1,342 1.5 88,091 100.0
1,185 2.0 59,468 100.0
314 4.3 7,255 100.0
* Includes data for institutions that could not report degrees by race/ethnicity and for which data were not imputed.:RCE: U.S. Department of Education, National Center for Education Statistics, Integrated Postsecondary Education Data
System, "Completions" survey 1991-92 and "Consolidated" survey 1992.
9vi
Contents
Analytic Summary iii
Text Table§
A-1 Degrees conferred by institutions of higher education, by level of degree,control of institution, and race/ethnicity and sex of recipient: 50states and District of Columbia, 1990-91 and 1991-92
A-la Number and percent distribution of degrees conferred by institutions of highereducation, by level of degree, control of institution, race/ethnicity and sex ofrecipient: 50 states and the District of Columbia, 1991-92 vi
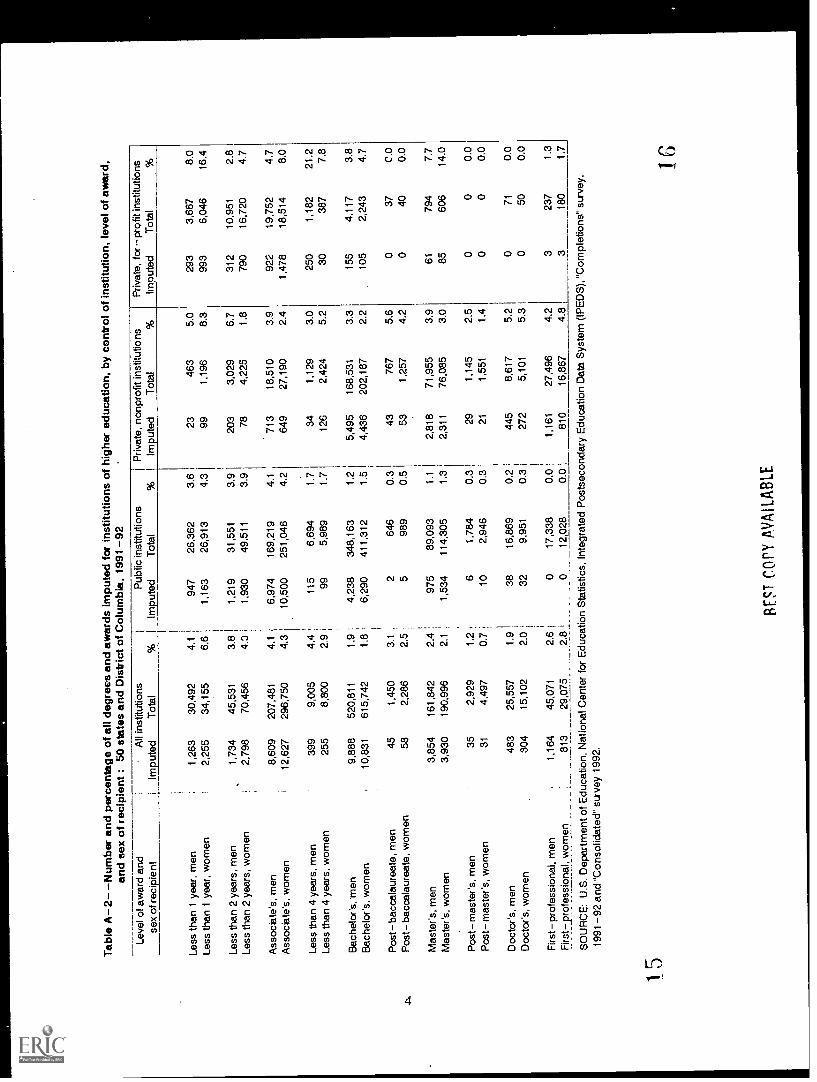
A-2 Number and percentage of all degrees and awards imputed for institutionsof higher education, by control of institution, level of award, and sexof recipient: 50 states and District of Columbia, 1991-92 4
Introduction 1
Survey Methodology
Data Sources 1
Scopi . . 2
Editing 2
Imputations 3
Adjustments for Tables in This Reix.-t 5
Notes on Tables 5
Acknowledgments 5
One-Year Tables
1 Degrees conferred by institutions of higher education, by control ofinstitution, level of degree, and sex of recipient: 50 states andDistrict of Columbia, 1991-92 7
la First-professional degrees conferred by institutions of higher education,by control of institution, field of study, and sex of recipient:50 states and District of Columbia, 1991-92 8
2 Degrees conferred by institutions of higher education, by race/ethnicity,level of degree, and sex of recipient: 50 states and District ofColumbia, 1991-92 9
2a Certificates and other awards conferred by institutions of highereducation, by race/ethnicity, level of award, and sex of recipient:50 states and District of Columbia, 1991-92 10
2b First-professional degrees conferred by institutions of higher education,by race/ethnicity, field of study, and sex of recipient: 50 states andDistrict of Columbia, 1991-92 11
3 Degrees conferred by institutions of higher education, by 1evel of degree,sex of recipient, and state: 50 states and District of Columbia, 1991-92 12
a by public institutions of higher education 13
b by private institutions of higher education 14
c by private, nonprofit institutions of nigher education 15
d by private, for-profit institutions of higher education 16
4 Degrees conferred by institutions of higher education, by race/ethnicity andstate: 50 states and District of Columbia, 1991-92
a Associate's degrees 17
b Bachelor's degrees 18
c Master's degrees 19
d Doctor's degrees 20
5 Degrees conferred by institutions of higher education, by control of institution,level of degree, and field of study: 50 states and District of Columbia,1991-92 21
6 Number of i...ititutions of higher education conferring degrees, by control ofinstitution, level of degree, and field of study: 50 states and Districtof Columbia, 1991-92 22
7 Degrees conferred by institutions of higher education, by level of degree,and by discipline division and program specialty: 50 states and Districtof Columbia, 1991-92 23
viii
Introduction
This report presents data on degrees conferred during the 1991-92 academic year by thenation's accredited higher education institutions. The completions data for all postsecondaryinstitutions are from two components of the Integrated Postsecondary Education Data System(IPEDS): (1) the "Completions" survey for 1991-92 and (2) the 1992 "Consolidated" survey.These surveys collected information on the number of de& 3es conferred by level of award(associate's, bachelor's, master's, doctor's, first-professional) including certificates, field ofstudy and sex of recipient. Racial/ethnic data were collected by major field or discipline.
This report is one of a series published by the National Center for Education Statistics(NCES) designed primarily to highlight new data and make them available to the public asquickly as possible. It presents information on institutions of higher education which areaccredited at the college level by an agency recognized by the Secretary, U.S. Department ofEducation. This E.D. TABS is also available on an electronic bulletin board operated by theOffice of Educational Research and Improvement. For modem access, call 1-800-222-4922 or(202) 219-2011; for technical questions, call (202) 219-1547. Data may be obtained onmagnetic tape or on diskette; please contact the author for further information at (202) 219-1779.
Survey Methodology
Data Sources
The completions statistics presented in this publication are a Fubset of the data collectedfrom all postsecondary institutions using the two data sources as described above:"Completions" and "Consolidated" surveys. The data were collected from institutions ofhigher education following the trends available from the Higher Education GeneralInformation Survey (HEGIS), "Degrees and Other Formal Awards Conferred," whichpreceded IPEDS.
Discipline divisions and their specialties (fields of study) arc specified in theClassification of Instructional Programs (CIP) which was developed by (NCES) and is thefederally accepted standard for collecting, reporting, and interpreting education program data.This publication uses the 1990 version of CIP for classifying degree fields.
Scope
Data included in this report are limited to the 3,615 institutions of higher education,located within the 50 states and the District of Columbia that were identified as such on thefinal 1992 IPEDS universe file. These 3,615 institutions are accredited at the college level byan agency recognized by the Secretary, U.S. Department of Education, and have an overallresponse rate of 94.1 percent for the 1991-92 completions data.
The response rate was calculated as the ratio of the number of completed survey formsdivided by the number of schools in the final universe; that is, the number mailed minus thenumber determined to be out-of scope. An institution was considered a respondent if itsupplied total awards by sex (that is, the response was considered sufficient so thatimputations could be made based on data supplied).
In addition to the 3,615 higher education institutions examined in this report, the"Completions 1991-92" survey was mailed to 374 schools that do not have recognizedaccreditation but award bachelor's, master's, doctor's or first-professional degrees. The C 1version of the survey form (the most comprehensive) was mailed to schools offering at least abaccalaureate degree, and the C2 version was sent to those schools offering a degree orcertificate requiring less than 4 years. In addition, the "Consolidated" (CN) survey collectscompletions data from approximately 3,400 other postsecondary schools offering degrees orawards ranging from certificates of less than 1 year to post-master's certificates. The CNmailout included a sample of private, less-than-2-year institutions.
During the processing cycle, some institutions of higher education may have lostaccreditation or closed; and a few that received the CN form became accredited institutions ofhigher education and thus are included in this report.
Editing
During editing, all forms were checked for CIP code validity against the 1990 version ofA Classification of Instructional Programs. Addition checks were performed by generatingtotal lines and comparing them to reported totals for each 2-digit program category. If thereported total differed, but was within a designated range, the reported total was replaced bythe generated total and the cell was flagged with the proper imputation code. If thedifference exceeded the designated range, institutions were contacted for verification of thereported data and, as appropriate, correctior 3 were made to the file. Totals were alsogenerated to compare reported racial/ethnic data (including the "racial/ethnic unknown")against the reported totals. Similar comparisons were made to the "new" 2-digit programcategory totals. Comparisons were also made with the number of completions reported at the2-digit program category level for the previous year. If the differences were sufficientlylarge, institutions were contacted for verification.
132
Imputations
Completions data were imputed for nonresponding institutions both total nonresponseand partial nonresponse to specific data items. The three schools that were not part of theCN sample, but became accredited institutions of higher education during the processingcycle, were not imputed and thus are not accounted for in the data in this report. For theremainder of the institutions, the following imputation procedures were used:
For institutions with reported data on the 1990-91 Completions file, the prior year'sdata was used unchanged.
For institutions without prior year reported Completions data:
the prior year Fall Enrollment (EF) data (either reported or imputed) and current yearInstitutional Characteristics (IC) data were examined to determine
a. The level(s) of awards to be imputed (based on IC); and
b. Group ratios for responding institutions. The group ratios were developed (by level ofdegree and sex) based on similar institutions, and were then applied to the enrollmentdata for the nonrespondent to Completions, to compute estimated completions counts.
For institutions without prior year's enrollment data but having current year IC data,group means of the degrees by level and sex were derived from similar institutions.
Special manual imputations were used for rabbinical schools and any schools thatwere nonrespondents to the CN form.
Partial imputations were performed for those institutions that provided total awardsby gender; that is, the institution failed to report race/ethnicity and/or data by awardlevel or discipline. Here again, prior responses (if available) or group ratios wereused: however, no imputations were made by program or discipline.
Table A-2 provides the numbcr and percentage of degrees imputed for each award level
by sex of recipient.
Additional information on the methodology and procedures used in collecting the 1991-
92 Completions is available in the dOcumentation for the 1991-92 Completions Survey Data
Fi le.
31 4
5
Tab
le A
-2-
-Num
ber
and
perc
enta
ge o
f all
degr
ees
and
awar
ds im
pute
d fo
r in
stitu
tions
of h
ighe
r ed
ucat
ion,
by
cont
rol o
f ins
titut
ion,
leve
l of a
war
d,an
d se
x of
rec
ipie
nt :
50 s
tate
s an
d D
istr
ict o
f Col
umbi
a, 1
991-
92
Leve
l of a
war
d an
dse
x of
rec
ipie
nti
All
inst
itutio
nsIm
pute
dT
otal
Less
than
1 y
ear,
men
1,26
330
,492
Less
than
1 y
ear,
wom
en2,
255
34,1
55
Less
than
2 y
ears
, men
1,73
445
,531
Less
than
2 y
ears
, wom
en2,
798
70,4
56
Ass
ocia
te's
, men
8,60
920
7,48
1
Ass
ocia
te's
, wom
en12
,627
296,
750
Less
than
4 y
ears
, men
399
9,00
5Le
ss th
an 4
yea
rs, w
omen
255
8,80
0
Bac
helo
r's, '
men
9,88
852
0,81
1
Bac
helo
r's, w
omen
10,8
3161
5,74
2
Pos
t- b
acca
laur
eate
, men
451,
450
Pos
t-ba
ccal
aure
ate,
wom
en58
2,28
6
Mas
ter's
, men
3,85
416
1,84
2
Mas
ter's
, wom
en3,
930
190,
996
Pos
t- m
aste
r's, m
en35
2,92
9
Pos
t-m
aste
r's, w
omen
314,
497
Doc
tor's
, men
483
25,5
57
Doc
tor's
, wom
en30
415
,102
Firs
t-pr
ofes
sion
al, m
en1,
164
45,0
71
Firs
t-pr
ofes
sion
al, w
omen
813
29,0
75
IP
ublic
inst
itutio
ns%
I I
4.1
I
6.6
I
3.8
I
4.0
i .
4.1
i 1
4.3
4.4
:2.
9 I
1.9
1.8
'
3.1
.1
2.5
; i
2.4
!2.
1
1.2
:,
0.7
I
1.9
!
2.0
1
2.6
1
2.8
i
Impu
ted
Tot
al
947
26,3
621,
163
26,9
13
1,21
931
,551
1,93
049
,511
6,97
416
9,21
910
,500
251,
046
115
6,69
499
5,98
9
4,23
834
8,16
36,
290
411,
312
264
65
989
975
89,0
931,
534
114,
305
61,
784
102,
946
3816
,869
329,
951
017
,338
012
,028
% 3.6
4.3
3.9
3.9
4.1
4.2
1.7
1.7
1.2
1.5
0.3
1
0.5
I i
1.1
I
1.3
I
0.3
1
0.3
I i
0.2
1i
0.3
i I i
0.0
I0.
01
Priv
ate,
non
prof
it in
stitu
tions
Im u
ted
Tot
alP
rivat
e, fo
r -p
rofit
inst
itutio
nsIm
pute
dT
otal
23 99 203
78
.
713
649 34 126
5,49
54,
436 43 53
2,81
82,
311 29 21 445
272
1,16
1
810
463
1,19
6
34,029
225
18,5
1027
,190
1,12
92,
424
168,
531
202,
187
767
1,25
7
71,9
5576
,085
1,14
51,
551
8,61
75,
101
27,4
9616
,867
5.0
8.3
6.7
1.8
3.9
2.4
3,0
5.2
3.3
2.2
5.6
4.2
3.9
3.0
2.5
1.4
5.2
5.3
4.2
4.8
293
993
312
790
922
1,47
8
250
30 155
105 0 0
61 85
0 0I
0 3 3
3,66
76,
046
10,9
5116
,720
19,7
5218
,514
1,18
238
7
4,11
72,
243 37 40 794
606 0
71 50 237
180
8.0
16.4
2.8
4.7
4.7
8.0
21.2 7.8
3.8
4.7
C.0
0.0
7.7
14.0 0.0
0.0
0.0
0.0
1.3
1.7
SO
UR
CE
: U.S
. Dep
artm
ent o
f Edu
catio
n, N
atio
nal C
ente
r fo
r E
duca
tion
Sta
tistic
s, In
tegr
ated
Pos
tsec
onda
ry E
duca
tion
Dat
a S
yste
m (
IPE
DS
), "
Com
plet
ions
" su
rvey
,
1991
-92
and
"C
onso
lidat
ed"
surv
ey 1
992.
RE
ST C
OPY
AV
AIL
AB
LE
Adjustments for Tables in This Report
The tables that appear in this report have not been adjusted for race/ethnicity ay. in pastreports. Data can Ix derived directly from the public release file to obtain the numberspresented in the tables. In order to maintain comparability with previously adjustedracial/ethnic counts, the actual data from the 1990-91 files are shown in table A-1. Note thatin past years, the "balance" or unreported racial/ethnic data ("balance" was calculated bysubtracting the number of awards reported by racial/ethnic category from the total number ofawards reported) were proportionately distributed among the known counts by racial/ethniccategory within the two-digit program areas. In order to provide an accurate picture of actualcompletions, by category, these distributions were not made to the 1991-92 data.
Notes on Tables
In addition to the text tables, this report presents 7 swlimary data tables for the 1991-92Completions survey. Table 7 provides a detailed listing of the number of degrees awarded byspecific field of study. When imputations were performed and CIP fields could not bedetermined, data were assigned to an "undesignated" field code; these are shown on the tables
where appropriate.
The discipline division fields shown in this publication vary from previous IPEDSCompletions reports. They are from the 1990 version of the Classificafion of InstructionalPrograms which was implemented with the 1991-92 Completions survey.
In analyzing data by fields of study, users must remember that the data representprograms, not schools, colleges, or divisions (SCDs) within institutions. For example, someinstitutions might have a few computer and information science programs organized andtaught within a business school. However, for WEDS reporting purposes, the degrees arcclassified and counted within the computer and information science discipline division.Therefore, the data represent programs, not organizational units within institutions.
Acknowledgments
The auth& is grateful to Charles Andersen, American Council on Education; KentPhillippc, American Association of Community Colleges; and Mike Cohen, Frank Johnson
and Charlene Hoffman of the National Center for Education Statistics for their valuablecomments during the review of this publication.
I
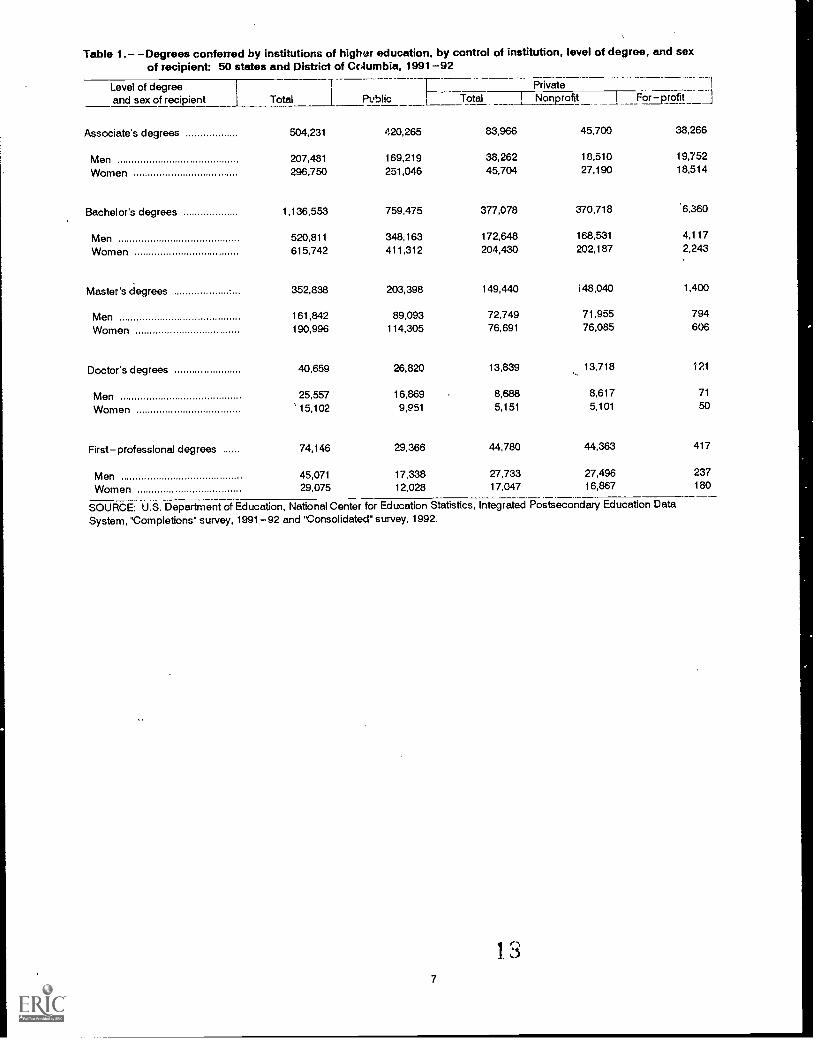
Table 1.- -Degrees conferred by institutions of highor education, by control of institution, level of degree, and sexof recipient: 50 states and District of Ccdumbia, 1991-92
Level of degreeand sex of recipient
PrivateTotal Public 11- Total I Nonprofit I For - profit
Associate's degrees 504,231 420,265 83,966 45,700 38,266
Men 207,481 169,219 38,262 18,510 19,752
Women 296,750 251,046 45,704 27,190 18,514
Bachelor's degrees 1,136,553 759,475 377,078 370,718 6,360
Men 520,811 348,163 172,648 168,531 4,117
Women 615,742 411,312 204,430 202,187 2,243
Master's ciegrees 352,838 203,398 149,440 i 48,040 1,400
Men 161,842 89,093 72,749 71,955 794
Women 190,996 114,305 76,691 76,085 606
Doctor's degrees 40,659 26,820 13,839 13,718 121
Men 25,557 16,869 8,688 8,617 71
Women 15,102 9,951 5,151 5,101 50
First- professional degrees 74,146 29,366 44,780 44,363 417
Men 45,071 17,338 27,733 27,496 237
Women 29,075 12,028 17,047 16,867 180
SOURCE: U.S. Department of Education, National Center for Education Statistics, Integrated Postsecondary Education DataSystem, "Completions" survey, 1991-92 and "Consolidated" survey, 1992.
1 3
7
-1
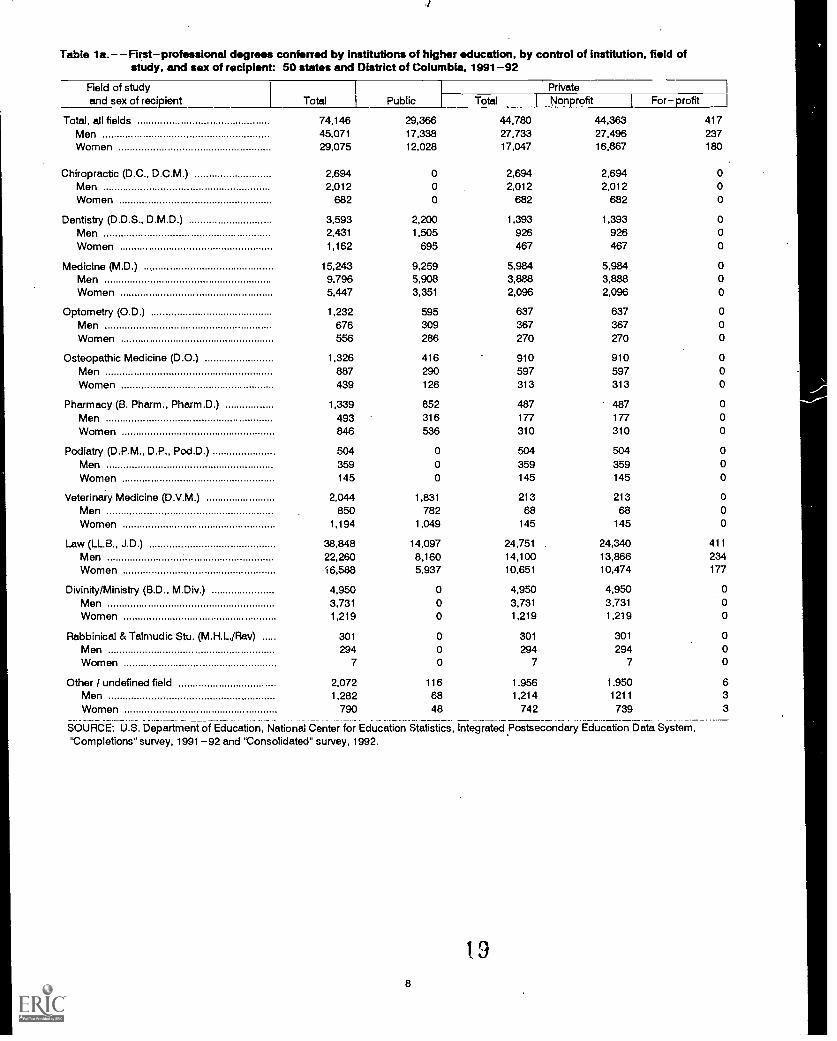
Table la.- -First-professional degrees conferred by institutions of higher education, by control of institution, field ofstudy, and sex of recipient: 50 states and District of Columbia, 1991-92
Field of studyI
Privateand sex of recipient Total I Public -1 Total I Nonprofit For-profit
Total, all fields 74,146 29,366 44,780 44,363 417Men 45,071 17,338 27,733 27,496 237Women 29,075 12,028 17,047 16,867 180
Chiropractic (D.C., D.C.M.) 2,694 0 2,694 2,694 0Men 2,012 0 2,012 2,012 0Women 682 0 682 682 0
Dentistry (D.D.S., D.M.D.) 3,593 2,200 1,393 1,393 0Men 2,431 1,505 926 926 0Women 1,162 695 467 467 0
Medicine (M.D.) 15,243 9,259 5,984 5,984 0Men 9,796 5,908 3,888 3,888 0Women 5,447 3,351 2,096 2,096 0
Optometry (0.D.) 1,232 595 637 637 0Men 676 309 367 367 0Women 556 286 270 270 0
Osteopathic Medicine (D.0.) 1,326 416 910 910 0
Men 887 290 597 597 0
Women 439 126 313 313 0
Pharmacy (B. Pharm., Pharm.D.) 1,339 852 487 487 0
Men 493 316 177 177 0
Women 846 536 310 310 0
Podiatry (D.P.M., D.P., Pod.D.) 504 0 504 504 0
Men 359 0 359 359 0
Women 145 0 145 145 0
Veterin4y Medicine (D.V.M.) 2,044 1,831 213 213 0
Men 850 782 68 68 0Women 1,194 1,049 145 145 0
Law (LL.B., J.D.) 38,848 14,097 24,751 24,340 411
Men 22,260 8,160 14,100 13,866 234Women i 6,588 5,937 10,651 10,474 177
Divinity/Ministry (B.D., M.Div.) 4,950 0 4,950 4,950 0
Men 3,731 0 3,731 3,731 0
Women 1,219 0 1,219 1,219 0
Rabbinical & Talmudic Stu. (M.H.L./Ray) 301 0 301 301 0
Men 294 0 294 294 0Women 7 0 7 7 0
Other / undefined field 2,072 116 1.956 1.950 6Men 1,282 68 1,214 1211 3
Women 790 48 742 739 3
SOURCE: U.S. Department of Education, National Center for Education Statistics, Integrated Postsecondary Education Data System,'Completions" survey, 1991-92 and "Consolidated" survey, 1992.
198
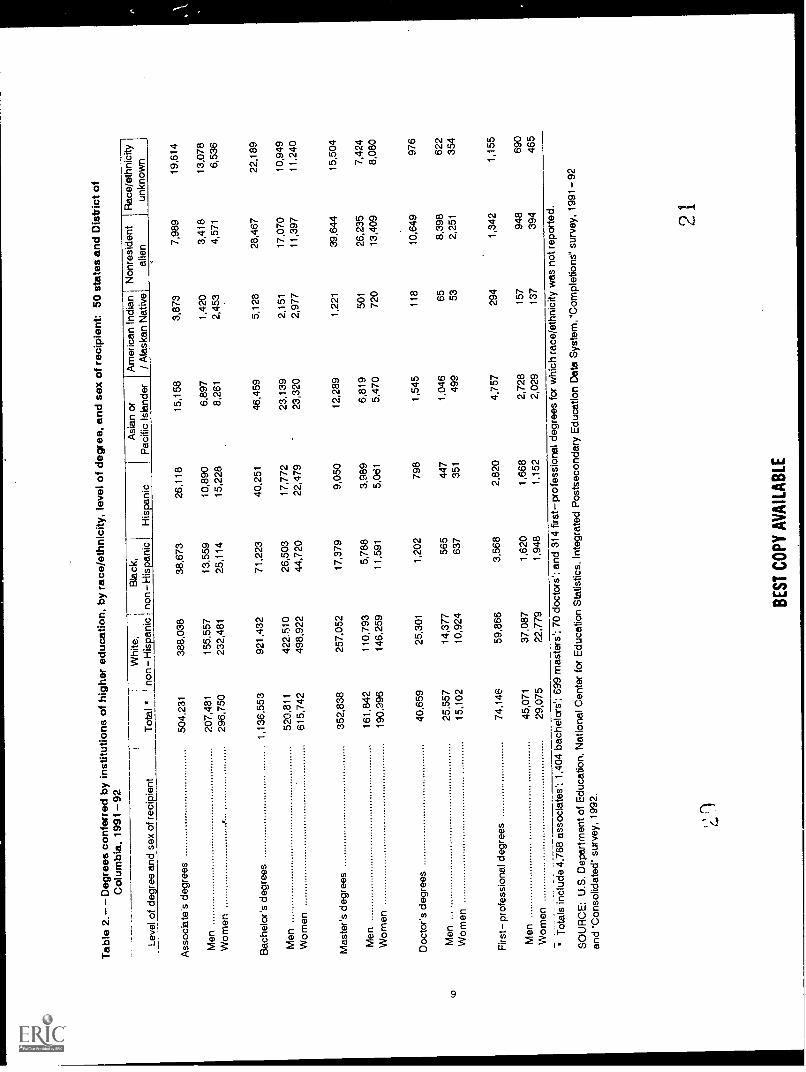
Tab
le 2
.- -
Deg
rees
con
ferr
ed b
y in
stitu
tions
of h
ighe
r ed
ucat
ion,
by r
ace/
ethn
icity
, lev
el o
f deg
ree,
and
sex
of r
ecip
ient
:50
sta
tes
and
Dis
tric
t of
Col
umbi
a, 1
991-
92
Leve
l of d
egre
e an
d se
x of
rec
ipie
ntT
otal
*W
hite
,j
Bla
ck,
I
non-
His
pani
c; n
on-H
ispa
nic
)H
ispa
nic
IA
sian
or
IP
acifi
c Is
land
erA
mer
ican
Indi
an/ A
lask
an N
ativ
eN
onre
side
ntal
ien
Rac
e/et
hnic
ityun
know
n
Ass
ocia
te's
deg
rees
504,
231
388,
038
38,6
7326
,118
15,1
583,
873
7,98
919
,614
Men
207,
481
155,
557
13,5
5910
,890
6,89
71,
420
3,41
813
,078
Wom
en29
6,75
023
2,48
125
,114
15,2
288,
261
2,45
34,
571
6,53
6
Bac
helo
r's d
egre
es1,
136,
553
921,
432
71,2
2340
,251
46,4
595,
128
28,4
6722
,189
Men
520,
811
422.
510
26,5
0317
,772
23,1
392,
151
17,0
7010
,949
Wom
en61
5,74
249
8,92
244
,720
22,4
7923
,320
2,97
711
,397
11,2
40
Mas
ter's
deg
rees
352,
838
257,
052
17,3
799,
050
12,2
891,
221
39,6
4415
,504
Men
161,
842
110,
793
5,78
83,
989
6,81
950
126
,235
7,42
4
Wom
en19
0,99
614
6,25
911
,591
5,06
15,
470
720
13,4
098,
080
Doc
tor's
deg
rees
40,6
5925
,301
1,20
279
81,
545
118
10,6
4997
6
Men
25,5
5714
,377
565
447
1,04
665
8,39
862
2
Wom
en15
,102
10,9
2463
735
149
953
2,25
135
4
Firs
t- p
rofe
ssio
nal d
egre
es74
,146
59,8
663,
568
2,82
04,
757
294
1,34
21,
155
Men
45,0
7137
,087
1,62
01,
668
2,72
815
794
869
0
Wom
en29
,075
22,7
791,
948
1,15
22,
029
137
394
465
* T
otal
s in
clud
e 4,
768
asso
ciat
es';
1,40
4 ba
chel
crs'
; 699
mas
ters
'; 70
doc
tors
'; an
d31
4 fir
st-p
rofe
ssio
nal d
egre
es fo
r w
hich
rac
e/et
hnic
ity w
as n
ot r
epor
ted.
SO
UR
CE
: U.S
. Dep
artm
ent o
f Edu
catio
n, N
atio
nal C
ente
rfo
r E
duca
tion
Sta
tistic
s, In
tegr
ated
Pos
tsec
onda
ry E
duca
tion
Dat
a S
yste
m, "
Com
plet
ions
" su
rvey
, 199
1-92
and
"Con
solid
ated
" su
rvey
, 199
2.
91
BE
ST
CO
PY
AV
AIL
AB
LE
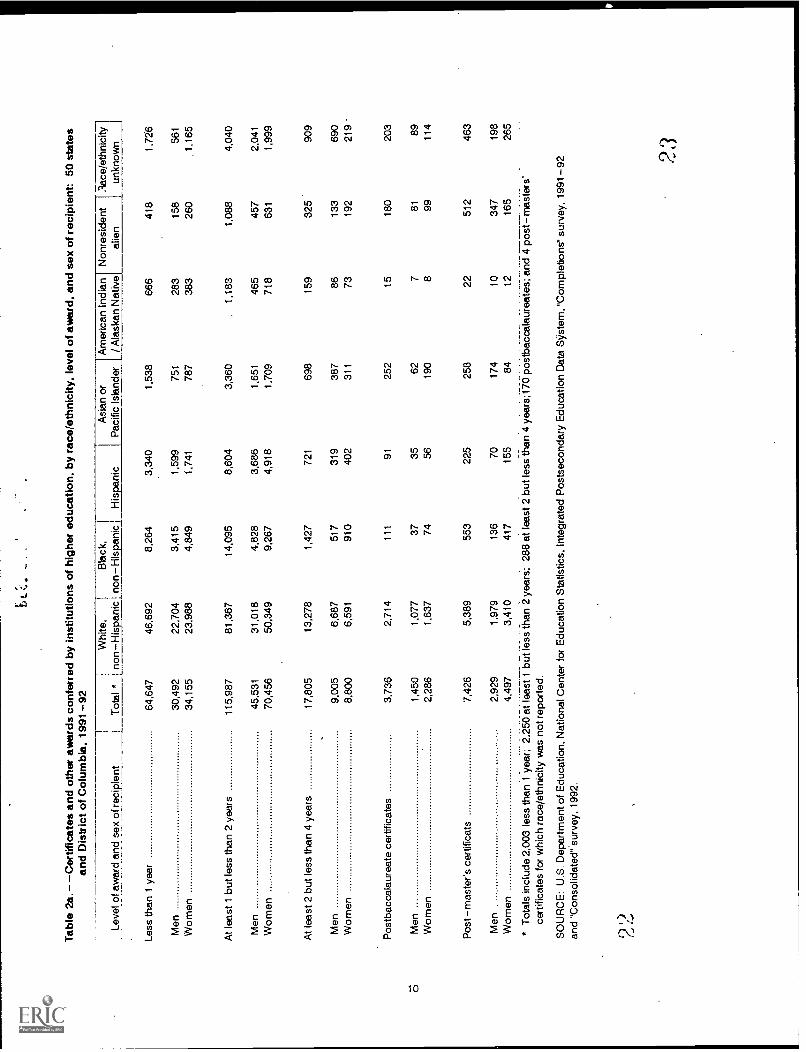
Tab
le 2
a.-
-Cer
tific
ates
and
oth
er a
war
ds c
onfe
rred
by
inst
itutio
ns o
f hig
her
educ
atio
n, b
y ra
ce/e
thni
city
, lev
el o
f aw
ard,
and
sex
of r
ecip
ient
: 50
stat
esan
d D
istr
ict o
f Col
umbi
a, 1
991-
92
Leve
l of a
war
d an
d se
x of
rec
ipie
nt1
Tot
al *
_Lno
nW
hite
,I
Bla
ck,
I
-His
pani
c ! n
on-H
ispa
nic
IH
ispa
nic
Asi
an o
r1
Am
eric
an In
dian
Pac
ific
Isla
nder
I/ A
lask
an N
ativ
eN
onre
side
ntal
ien
3ace
/eth
nici
t71
unkn
own
I
Less
than
1 y
ear
64,6
4746
,692
8,26
43,
340
1,53
866
641
81,
726
Men
30,4
9222
,704
3,41
51,
599
751
283
158
561
Wom
en34
,155
23,9
884,
849
1,74
178
738
326
01,
165
At l
east
1 b
ut le
ss th
an 2
yea
rs11
5,98
781
,367
14,0
958,
604
3,36
0.
1.18
31,
088
4,04
0
Men
45,5
3131
,018
4,82
83,
686
1,65
146
545
72,
041
Wom
en70
,456
50,3
499,
267
4,91
81,
709
718
631
1,99
9
At l
east
2 b
ut le
ss th
an 4
yea
rs17
,805
13,2
781,
427
721
698
159
325
909
Men
9,00
56,
687
517
319
387
8613
369
0W
omen
8,80
06,
591
910
402
311
7319
221
9
Pos
tbac
cala
urea
te c
ertif
icat
es3.
736
2,71
411
191
252
1518
020
3
Men
1,45
01,
077
3735
627
8189
Wom
en2,
286
1,63
774
5619
08
9911
4
Pos
t-m
aste
r's c
ertif
icat
s7,
426
5,38
955
322
525
822
512
463
Men
2,92
91,
979
136
7017
410
347
198
Wom
en4,
497
3,41
041
715
584
1216
526
5
* T
otal
s in
clud
e 2,
003
less
than
1 y
ear;
2,2
50 a
t lea
st 1
but
less
than
2 y
ears
; 288
at l
east
2 b
ut le
ss th
an 4
year
s:17
0 po
stba
ccal
aure
ates
; and
4 p
ost-
mas
ters
'ce
rtifi
cate
s fo
r w
hich
rac
e/et
hnic
ity w
as n
ot r
epor
ted.
SO
UR
CE
: U.S
. Dep
artm
ent o
f Edu
catio
n, N
atio
nal C
ente
r fo
r E
duca
tion
Sta
tistic
s, In
tegr
ated
Pos
tsec
onda
ry E
duca
tion
Dat
a S
jiste
m, "
Com
plet
ions
" su
rvey
, 199
1-92
and
"Con
solid
ated
".su
rvey
, 199
2.
23
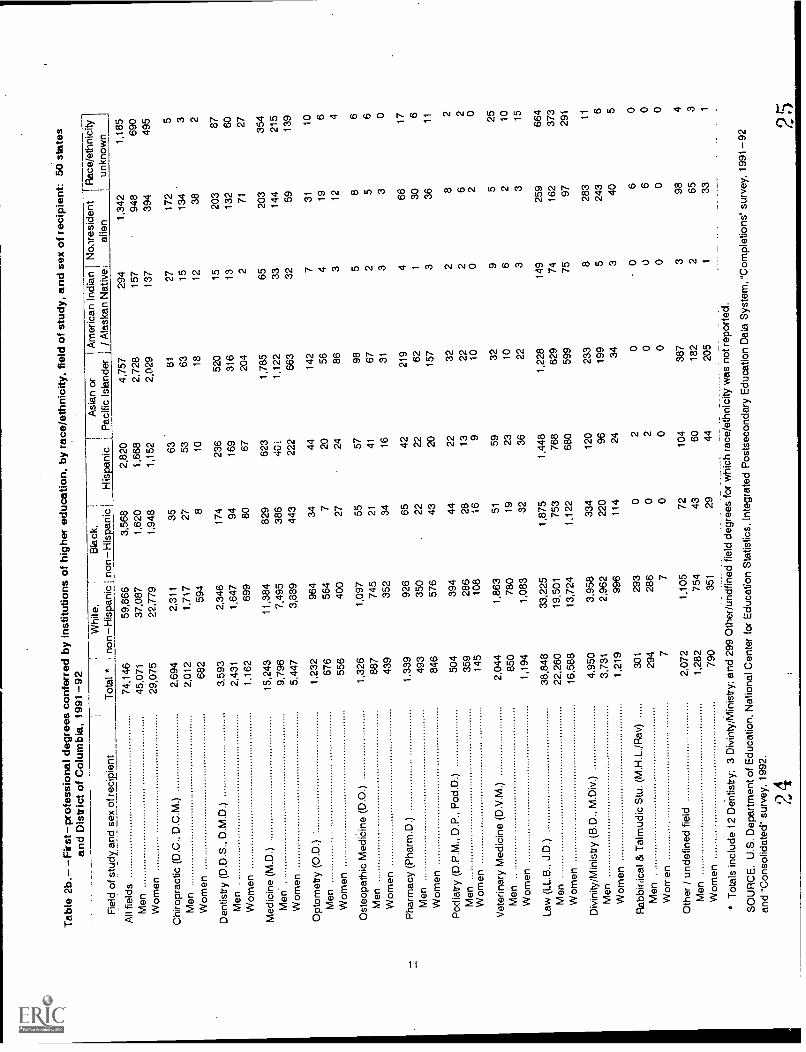
Tab
le 2
b.-
-Firs
t-pr
ofes
sion
al d
egre
es c
onfe
rred
by
inst
itutio
nsof
hig
her
educ
atio
n, b
y ra
ce/e
thni
city
, fie
ld o
f stu
dy, a
nd s
ex o
f rec
ipie
nt:
and
Dis
tric
t of C
olum
bia,
199
1-92
50 s
tate
s
Fie
ld
;,
Whi
te,
Bla
ck,
Asi
an o
rI A
mer
ican
Indi
an I
Nox
esid
ent
I Rac
e/et
hnic
ity I
of s
tudy
and
sex
of r
ecip
ient
Tot
al *
; non
-His
pani
c ; n
on-H
ispa
nic
IH
ispa
nic
II. P
acifi
c Is
land
er;
/ Ala
skan
Nat
ive;
alie
n1,3
42
Iun
know
n
All
field
s74
,146
59,8
663,
568
21,6
8628
0
4,75
729
4
j
Men
45,0
7137
,087
1,62
02,
728
157
948
1,61
9085
Wom
en29
,075
.22,
779
1,94
81,
152
2,02
913
739
449
5
Chi
ropr
actic
(D
.C.,
D.C
.M.)
2,69
42
,311
3563
.
8127
Men
2 01
2,
1,71
727
5363
15
172
134
5 3
Wom
en68
259
48
1018
1238
2
Den
tistr
y (D
.D.S
., D
.M.D
.)3
,593
2,34
617
423
652
015
203
87
Men
2,43
11
9416
931
613
Wom
en1
162
,
,647 69
9ao
6720
42
132
71
60 27
Med
icin
e (M
.D.)
15,2
4311
,384
829
623
1,78
565
203
Men
'9,
796
7,49
538
640
:1,
122
3314
4
354
215
Wom
en5,
447
3,88
944
322
266
332
5913
9
Opt
omet
ry (
0.D
.)1,
232
964
3444
142
731
10
Men
676
564
720
564
196
Wom
en55
640
027
2486
312
4
Ost
eopa
thic
Med
iCin
e (D
.O.)
1,32
61,
097
5557
985
86
Men
887
745
2141
672
56
Wom
en43
935
234
1631
33
0
Pha
rmac
y (P
harm
.D.)
1.33
992
665
4221
94
6617
Men
493
350
2222
621
306
Wom
en84
657
643
2015
73
3611
Pod
iatr
y (D
.P.M
., D
.P.,
Pod
.D.)
504
394
4422
322
82
Men
Wom
en35
928
628
1322
26
2
145
108
169
100
20
Vet
erin
ary
Med
icin
e (D
.V.M
.)2,
044
1,86
351
5932
95
25
Men
850
780
1923
106
210
Wom
en1,
194
1,08
332
3622
33
15
Law
(LL
.B.,
J.D
.)38
,848
33,2
251,
875
1,44
81,
228
149
259
664
Men
22,2
6019
,501
753
768
629
7416
237
3
Wom
en16
,588
13,7
241,
122
680
599
7597
291
Div
inity
/Min
istr
y (B
.D.,
M.D
iv.)
4,95
03,
958
334
120
233
828
311
Men
3,73
12,
962
220
9619
95
243
6
Wom
en1,
219
996
114
2434
340
5
Rab
bit-
dull
& T
alm
udic
Stu
. (M
.H.L
./Rav
)30
129
30
20
06
0
Men
294
286
02
00
60
Wor
ren
77
00
00
00
Oth
er /
unde
fined
fiel
d2,
072
1,10
572
104
387
398
4
Men
1,28
275
443
6018
22
653
Wom
en79
035
129
4420
51
331
* T
otal
s in
clud
e 12
Den
tistr
y: 3
Div
inty
/Min
istr
y: a
nd 2
99 O
the4
A-in
dfin
ediie
ld d
egre
es fo
r w
hich
rac
e/et
hnic
ity w
as n
ot r
epor
ted.
SO
UR
CE
. U.S
. Dep
artm
ent o
f Edu
catio
n, N
atio
nal C
ente
r fo
r E
duca
tion
Sta
tistic
s, In
tegr
ated
Pos
tsec
onda
ry E
duca
tion
Dat
a S
yste
m, "
Com
plet
ions
'. su
rvey
,19
91-9
2
and
"Con
solid
ated
" su
rvey
, 199
2.
2425
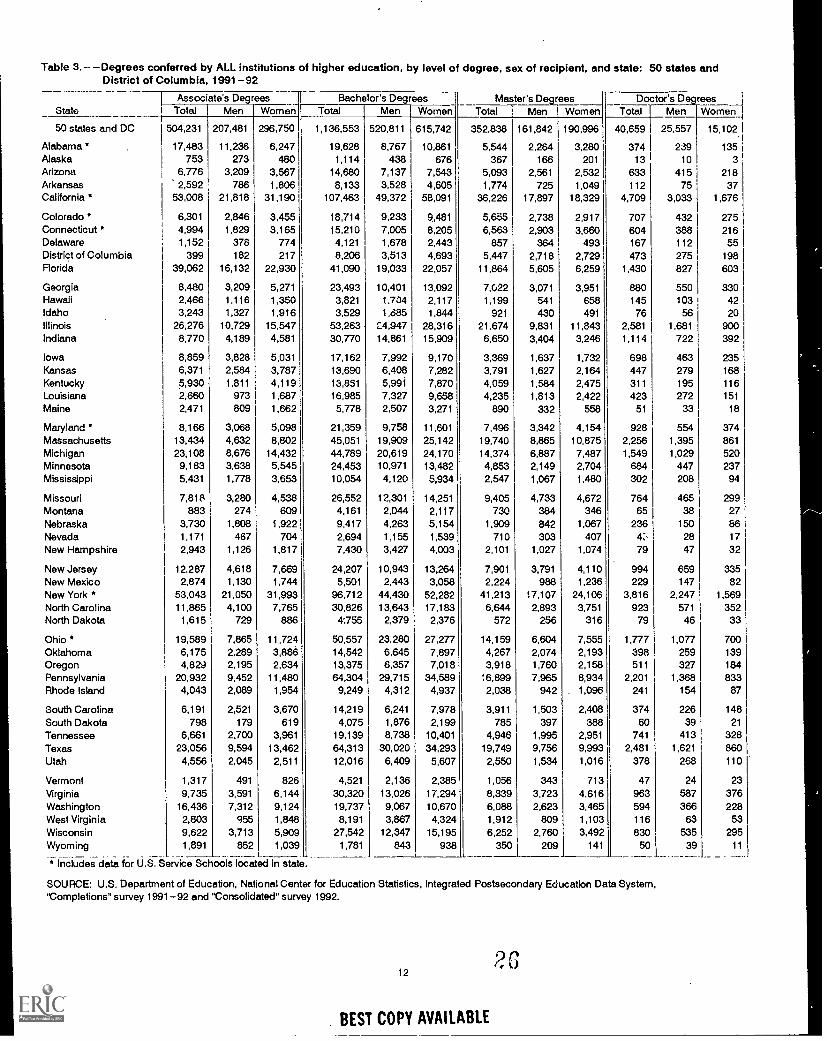
Table 3.- -Degrees conferred by ALL institutions of higher education, by level of degree, sex of recipient, and state: 50 states andDistrict of Columbia, 1991-92
State
50 states and DC
Alabama *AlaskaArizonaArkansasCalifornia *
Colorado *Connecticut *DelawareDistrict of ColumbiaFlorida
GeorgiaHawaiiIdahoIllinoisIndiana
IowaKansasKentuckyLouisianaMaine
Maryland *MassachusettsMichiganMinnesotaMississippi
MissouriMontanaNebraskaNevadaNew Hampshire
New JerseyNew MexicoNew York *North CarolinaNorth Dakota
Ohio *OklahomaOregonPennsylvaniaRhode Island
South CarolinaSouth DakotaTennesseeTexasUtah
VermontVirginiaWashingtonWest VirginiaWisconsinWyoming
Associate's D , rees Bachelor's 0 rees Master's D rees Doctor's Degrs ___I
Women 1Total Men Women Total Men Women Total Men Women Total Men
504,231 207,481 296,750 1,136,553 520,811 615,742 352,838 161,842 190,996 40,659 25,557 15.102
17,483 11,236 6,247 19,628 8,767 10,861 5,544 2,264 3,280 1 374 239 135753 273 480 1,114 438 676 367 166 201 I 13 10 I 3
6,776 3,209 3,567 14,680 7,137 7,543 5,093 2,561 2,532 633 415 2182,592 786 1,806 8,133 3,528 4,605 1,774 725 1.049 112 75 37
53.008 21,818 31,190 107,463 49,372 58,091 36,226 17,897 18,329 4,709 3,033 1,676
6,301 2,846 3,455 18,714 9,233 9,481 5,655 2,738 2,917 I 707 432 2754,994 1,829 3,165 15,210 7,005 8,205 6,563 2,903 3,660 604 388 2161,152 378 774 4,121 1,678 2,4-43 857 364 493 167 112 55
399 182 217 8,206 3,513 4,693 5,447 2,718 2,729 473 275 19839,062 16,132 22,930 41,090 19,033 22,057 11,664 5,605 6,259 1,430 827 603
8,480 3,209 5,271 23,493 10,401 13,092 7.022 3,071 3,951 880 550 3302,466 1.116 1,350 3,821 1,704 2,117 1,199 541 658 145 103 423,243 1,327 1,916 3,529 1,685 1,844 921 430 491 76 56 20
26,276 10,729 15,547 53,263 24,947 28,316 21,674 9,831 11,843 2,581 1,681 9008,770 4,189 4,581 30,770 14.861 15,909 6,650 3,404 3,246 1,114 722 392
8,859 3,828 5,031 17,162 7,992 9,170 3,369 1,637 1,732 698 463 2356,371 2,584 3,787 13,690 6,408 7,282 3,791 1,627 2,164 447 279 1685,930 1,811 4,119 13,851 5,991 7,870 4,059 1,584 2,475 311 195 1162,660 973 1,687 16,985 7,327 9,658 4,235 1,813 2,422 423 272 151
2,471 809 1,662 5.778 2,507 3,271 890 332 558 51 33 18
8,166 3,068 5,098 21,359 9,758 11,601 7,496 3,342 4,154 928 554 37413,434 4,632 8,802 45,051 19,909 25,142 19,740 8,865 10,875 2,256 1,395 861
23,108 8,676 14,432 44,789 20,619 24,170 14,374 6,887 7,487 1,549 1,029 5209,183 3,638 5,545 24,453 10,971 13,482 4,853 2,149 2,704 684 447 2375,431 1,778 3,653 10,054 4,120 5,934 2,547 1,067 1,480 302 208 94
7,818 3,280 4,538 26,552 12,301 14,251 9,405 4,733 4,672 764 465 299883 274 609 4.161 2,044 2,117 730 384 346 65 38 27
3,730 1,808 1,922 9,417 4,263 5,154 1.909 842 1,067 236 150 861,171 467 704 2,694 1.155 1,539 710 303 407 4, 28 172,943 1,126 1,817 7,430 3,427 4,003 2,101 1,027 1,074 79 47 32
12,287 4,618 7,669 24,207 10,943 13,264 7,901 3,791 4,110 994 659 3352,874 1,130 1,744 5,501 2,443 3,058 2,224 988 1.236 229 147 82
53,043 21,050 31,993 96,712 44,430 52,282 41,213 17,107 24,106 3,816 2,247 1,56911,865 4,100 7,765 30,826 13,643 17,183 6,644 2,893 3,751 923 571 352
1,615 729 886 4;755 2,379 2,376 572 256 316 79 46 33
19,589 7.865 11,724 50,557 23,280 27,277 14,159 6,604 7,555 1,777 1,077 7006,175 2,289 3,886 14,542 6,645 7,897 4,267 2,074 2,193 398 259 1394,829 2,195 2,634 13,375 6,357 7,018 3,918 1,760 2,158 511 327 184
20,932 9,452 11,480 64,304 29,715 34,589 16,899 7,965 8,934 2,201 1,368 8334,043 2,089 1,954 9,249 4,312 4,937 2,038 942 1,096 241 154 87
6,191 2,521 3,670 14,219 6,241 7,978 3,911 1,503 2,408 374 226 148
798 179 619 4,075 1,876 2,199 785 397 388 60 39 21
6,661 2,700 3,961 19,139 8,738 10,401 4,946 1,995 2,951 741 413 32823,056 9,594 13,462 64,313 30,020 34,293 19,749 9,756 9,993 2,481 1,621 8604,556 2,045 2,511 12,016 6,409 5,607 2,550 1,534 1,016 378 268 110
1,317 491 826 4,521 2,136 2,385 1,056 343 713 47 24 239,735 3,591 6,144 30,320 13,026 17.294 8,339 3,723 4.616 963 587 376
16,436 7,312 9,124 19,737 9,067 10,670 6,088 2,623 3,465 594 366 2282,803 955 1,848 8,191 3,867 4,324 1,912 809 1,103 116 63 539,622 3,713 5,909 27,542 12,347 15,195 6,252 2,760 3,492 830 535 2951,891 852 1,039 1,781 843 938 350 209 141 50 39 11
* Includes data for U.S. Service Schools located in state
SOURCE: U.S. Department of Education, National Center for Education Statistics, Integrated Postsecondary Education Data System,'Completions" survey 1991-92 and 'Consolidated" survey 1992.
12
BEST COPY AVAILABLE
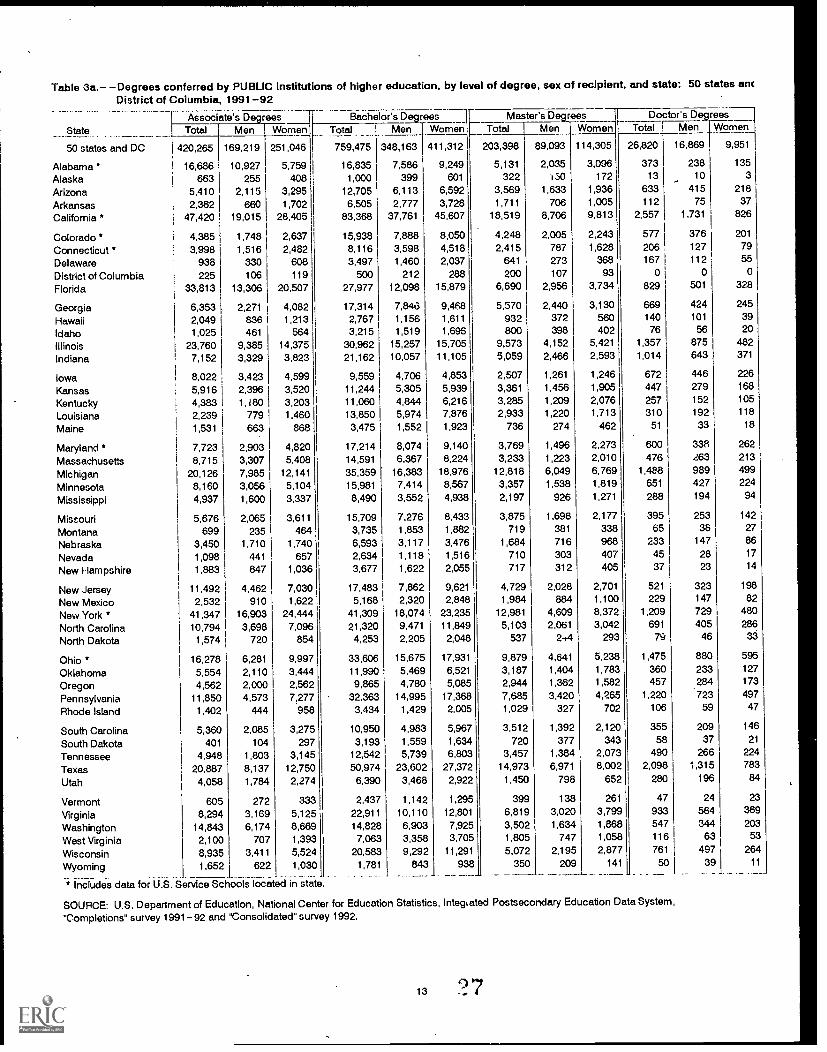
Table 3a.- -Degrees conferred by PUBLIC institutions of higher education, by level of degree, sex of recipient, and state: 50 states ancDistrict of Columbia, 1991-92
State
50 states and DC
Alabama *AlaskaArizonaArkansasCalifornia *
Colorado *Connecticut *DelawareDistrict of ColumbiaFlorida
GeorgiaHawaiiIdahoIllinoisIndiana
IowaKansasKentuckyLouisianaMaine
Maryland *MassachusettsMichiganMinnesotaMississippi
MiscouriMontanaNebraskaNevadaNew Hampshire
New JerseyNew MexicoNew York *North CarolinaNorth Dakota
Ohio *OklahomaOregonPennsylvaniaRhode Island
South CarolinaSouth DakotaTennesseeTexasUtah
VermontVirginiaWashingtonWest VirginiaWisconsinWyoming
Associate's D rees-1--
Bachelor% DegreesWomen
Master'sTotal
DegreesMen Women
Doctor'sTotal
DegreesMen WomenTotal Men Women Total Men
420,265 169,219 251,046 759,475 348,163 411,312 203,398 89,093 114,305 26,820 16,869 9,951
16,686 10,927 5,759 16,835 7,586 9,249 5,131 2,035 3,096 373 238 135
663 255 408 1,000 399 601 322 130 172 13 10 3
5,410 2,115 3,295 12,705 6,113 6,592 3,569 1,633 1,936 633 415 218
2,362 660 1,702 6,505 2,777 3,728 1,711 706 1,005 112 75 37
47,420 19,015 28,405 83,368 37,761 45,607 18,519 8,706 9,813 2,557 1,731 826
4,385 1,748 2,637 I 15,938 7,888 8,050 4,248 2,005 2,243 577 376 201
3,998 1,516 2,482 8,116 3,598 4,518 2,415 787 1,628 206 127 79
938 330 608 3,497 1,460 I 2,037 641 273 368 167 112 55
225 106 119 500 212 288 200 107 93 0 0 0
33,813 13,306 20,507 27,977 12,098 15,879 6,690 2,956 3,734 829 501 328
6,353 2,271 4,082 17,314 7,846 9,468 5,570 2,440 3.130 669 424 245
2,049 836 1,213 2,767 1,156 1,611 932 372 560 140 101 39
1.025 461
5643.215 1.519 1,696 800 398 402 76 56 20
23,760 9,385 14,375 1 30,962 15,257 15,705 9,573 4,152 5,421 1,357 875 482
7,152 3,329 3,823 21,162 10,057 11,105 5.059 2,466 2.593 1,014 643 371
8,022 3,423 4,599 9,559 4,706 4,853 2,507 1,261 1,246 672 446 226
5,916 2,396 3.520 11,244 5,305 5,939 3,361 1.456 1,905 447 279 168
4,383 1,180 3,203 , 11,060 4,844 6,216 3,285 1,209 2,076 257 152 105
2,239 779 1,460 I 13,850 5,974 7,876 2.933 1,220 1,713 310 192 118
1,531 663 868 I 3,475 1,552 1,923 736 274 462 51 33 18
7,723 2,903 4,820 17,214 8,074 9,140 3,769 1.496 2,273 600 338 262
8,715 3.307 5,408 14,591 6,367 8,224 3,233 1,223 2,010 476 263 213
20,126 7,985 12,141 35,359 16,383 18,976 12.818 6,049 6,769 1,488 989 499
8,160 3,056 5,104 15,981 7,414 8,567 3,357 1,538 1,819 651 427 224
4,937 1,600 3,337 8,490 3,552 4,938 2,197 926 1,271 288 194 94
5,676 2,065 3,611 15,709 7,276 8,433 3.875 1.698 2,177 395 253 142
699 235 464 3,735 1,853 1,882 719 381 338 65 38 27
3,450 1,710 1,740 6,593 3,117 3,476 1,684 716 968 233 147 86
1,098 441 657 2,634 1,118 1,516 710 303 407 45 28 17
1,883 847 1 .036 3,677 1,622 2,055 717 312 405 37 23 14
11.492 4,462 7,030 17,483 7,862 9,621 4,729 2,028 2,701 521 323 198
2,532 910 1,622 5,168 2,320 2,848 1,984 884 1,100 229 147 82
41,347 16,903 24,444 41,309 18,074 23,235 12,981 4,609 8,372 1,209 729 480
10,794 3,698 7,096 21,320 9,471 11,849 5,103 2,061 3,042 691 405 286
1,574 720 854 4,253 2,205 2,048 537 244 293 79 46 33
16,278 6,281 9,997 33,606 15,675 17,931 9,879 4,641 5,238 1,475 860 595
5,554 2,110 3,444 11,990 5,469 6,521 3,187 1,404 1,783 360 233 127
4,562 2,000 2,562 9,865 4,780 5,085 2,944 1,362 1,582 457 284 173
11,850 4,573 7,277 32,363 14,995 17,368 7,685 3,420 4.265 1,220 723 497
1,402 444 958 3,434 1,429 2,005 1,029 327 702 106 59 47
5,360 2,085 3.275 10,950 4,983 5,967 3,512 1,392 2.120 355 209 146
401 104 297 3,193 1,559 1,634 720 377 343 58 37 21
4,948 1,803 3,145 12,542 5,739 6,803 3,457 1,384 2,073 490 266 224
20,887 8,137 12,750 50,974 23,602 27,372 14,973 6,971 8,002 2,098 1,315 783
4,058 1,784 2,274 6,390 3,468 2,922 1,450 798 652 280 196 84
605 272 333 2,437 1,142 1,295 399 138 261 47 24 23
8,294 3,169 5,125 22,911 10,110 12,801 6,819 3,020 3,799 933 564 369
14,843 6,174 8,669 14,828 6,903 7,925 3,502 1,634 1,868 547 344 203
2,100 707 1,393 7,063 3,358 3,705 1,805 747 1,058 116 63 53
8,935 3,411 5,524 20,583 9.292 11,291 5,072 2.195 2.877 761 497 264
1,652 622 1,030 1,781 843 938 350 209 141 50 39 11
* Includes data for U.S. Service Schools located in state
SOURCE: U.S. Department of Education, National Center for Education Statistics, Integi ated Postsecondary Education Data System,
"Completions" survey 1991- 92 and *Consolidated" survey 1992.
134)7
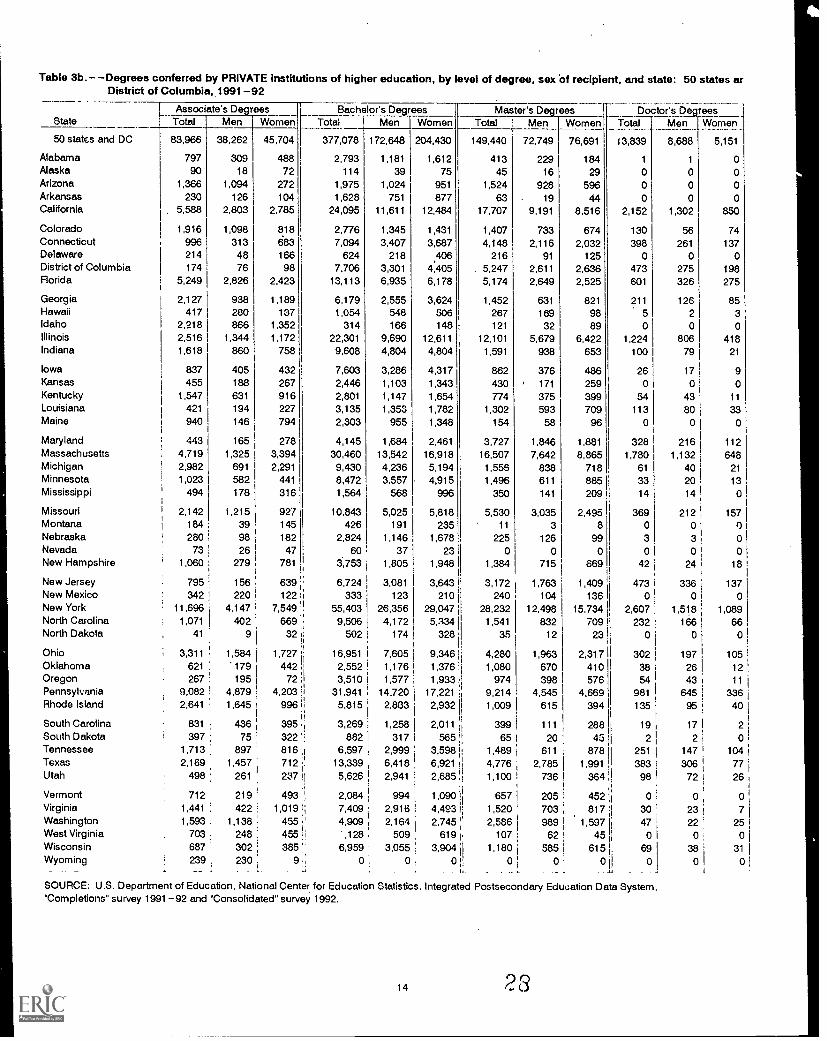
Table 3b.- -Degrees conferred by PRIVATE institutions of higher education, by level of degree, sex Of recipient, and state: 50 states arDistrict of Columbia, 1991-92
StateAssociate's De9ree s Bachelor'sTotal Men Women Total
50 states and DC 83,966 38,262 45,704 377,078
Alabama 797 309 488 2,793Alaska 90 18 72 114Arizona 1,366 1,094 272 1,975Arkansas 230 126 104 1,628California 5,588 2,803 2,785 24,095
Colorado 1,916 1,098 818 2,776Connecticut 996 313 683 7,094Delaware 214 48 166 624District of Columbia 174 76 98 7706Florida 5,249 2,826 2,423 13,113
Georgia 2,127 938 1,189 6,179Hawaii 417 280 137 1,054Idaho 2,18 866 1,352 314Illinois 2,516 1,344 1,172 22,301Indiana 1,618 860 758 9,608
Iowa 837 405 432 7,603Kansas 455 188 267 2,446Kentucky 1,547 631 916 2,801Louisiana 421 194 227 3,135Maine i 940 146 794 2,303
Maryland 443 165 278 4,145Massachusetts 4,719 1,325 3,394 30,460Michigan 2,982 691 2,291 9,430Minnesota 1,023 582 441 8,472Mississippi 494 178 316 1,564
Missouri 2,142 1.215 927 10,843Montana 184 39 145 426Nebraska 280 98 182 2,824Nevada 73 26 47 60New Hampshire 1,060 279 781 3,753
New Jersey 795 156 639 6.724New Mexico 342 220 I 122 333New York 11,696 4.147 7,549 1 55,403North Carolina 1,071 402 669 9,506North Dakota 41 9 32 502
Ohio 3,311 1.584 1,727 16.951 I
Oklahoma 621 179 442 2,552Oregon 267 195 72 3,510Pennsylvania 9,082 4.879 4,203 31,941Rhode Island 2,641 1,645 996 5.815
South Carolina 831 : 436 395 3,269South Dakota I 397 75 322 882Tennessee 1,713 897 816 6,597Texas 2,169 1,457 712 13,339
1
Utah 498 : 261 237 1 5,626
Vermont 712 219 493 2,084Virginia 1,441 ! 422 ' 1,019 , 7,409Washington 1,593 1,138 455 4.909West Virginia 703 j 248 455 I .128Wisconsin 687 302 385 6,959Wyoming 239 ; 230 9 0
D reesMen Women
172,648 204,430
1,181
391,024
751
11,611
1.3453.407
2183,3016,935
2,555548166
9,6904,804
3,2861,1031,1471,353
955
1,68413,5424,2363,557
568
5,025191
1.14637
1,805
3,081123
26,3564,172
174
1,61275
951
87712,484
1,431
3,687,406
4,4056,178
3,624506148
12,6114,804
Master's DTotal Men
149,440 72,749
413 22945 16
1,524 92863 19
17,707 9,191
1,4074,148
2165,2475,174
1,452267121
12,101
1,591
4.317 I 8621,343 4301,654 7741,782 1,3021,348 154
2,46116,9185,1944,915
996
5,818235
1,67823
1,948
3,643210
29,0475,A34
328
3,72716,507
1,5561,496
350
5,53011
2250
1.384
3,172240
28,2321,541
35
7,605 9,346 4,2801,176 1,376 1,0801,577 1,933 974
14,720 17,221 9,214I2,833 2,932 1 1,009
1.258 2,011 1
317 565 12,999 3,598 ;
6.418 6,921 1
2,941 2,6851
7332,116
91
2,6112,649
631169
325,679
938
376171
375593
58
rees Doctor's De rees
1,8467,642
838611
141
3,0353
1260
715
Women Total
76,691 I 3,839
18429
59644
8.516
6742,032
1252,6362,525
8219889
6,422653
486259399709
96
1,881
8,865718885209
1
000
2,152
130398
0473601
211
50
1,224100
260
54
1130
3281,780
61
3314
2,495 3698 0
99 1 3
(0
6693 I 42!
1,763 1,409 I 473104 136 I 0
12,498 15,734 . 2,607832 709 ! 232
12 231 0
2,317 I 302410 38576 54
4,669 981
394 135
1,963670398
4,545615
399 111 288 19 1
65 I 20 45 2 1
1,489 611 878 251 I
4,776 2.785 1,991 3831,100 736 364 98 1
994 1,090 , 657 205 4522.916 4,493 1 1,520 703 8172,164 2,745 2,586 989 1,597
509 619 , 107 62 453.055 3,904 I 1,180 565 615
0 0 : 0 0 0-
0
3047 i0 I
690
SOURCE: U.S. Department of Education, National Center for Education Statistics, Integrated Postsecondary Edth.:ation Data System,"Completions" survey 1991- 92 and "Consolidated" survey 1992.
14 23
Men Women
8,688 I 5,151
1 00 00 00 0
1,302 850
56 74261 137
0 0275 198326 275
126 852 30 0
806 41879 21
17 90 o
43 11
80 330 0
216 1121,132 648
40 21
20 13
14 0
212 1570 03 0
90
24 18
336 1370 0
1.518 1,089166 66
0 0i
I
197 105 i26 12 I
43 11 !
645 336 j95 40 1
17 2 1 ;i
2 0 ,147 104 1
306 77 I72 26 ,
097 123
22 25 1
0 0 I38 31
0 0
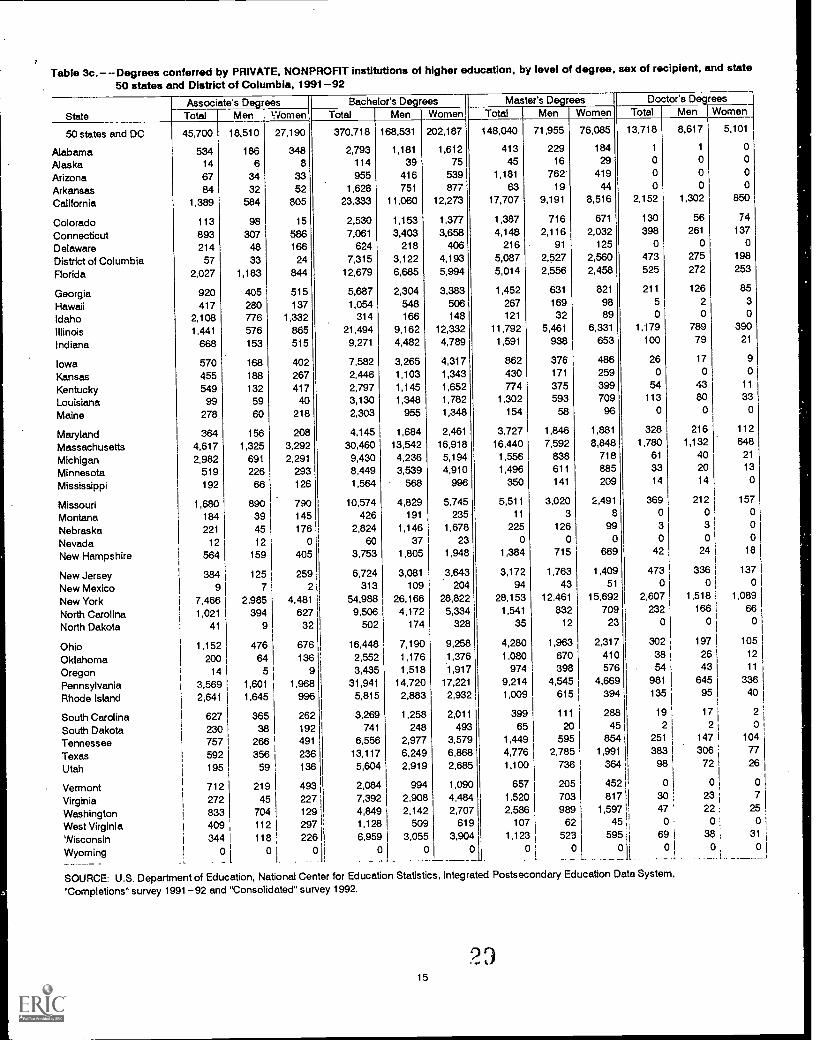
Table 3c.- -Degrees conferred by PRIVATE. NONPROFIT institutions of higher education, by level of degree, sex of recipient, and state50 states and District of Columbia, 1991-92
StateAssociate's Degrees Bachelor's Degrees Master's Degrees Doctor's D rees
Total Men Viomen Total Men Women Total Men Women Total Men Women
50 states and DC 45,700 18,510 27,190 370,718 168,531 202,187 148,040 71,955 76,085 13,718 8,617 5,101
Alabama 534 186 348 2,793 1,181 1,612 413 229 184 1 1 0
Alaska 14 6 8 114 39 75 45 16 29 0 o o
Arizona 67 34 33 955 416 539 1,181 762 419 0 0 o
Arkansas 64 32 52 1,628 751 877 63 19 44 o o o
California 1,389 584 805 23,333 11,060 12,273 17,707 9,191 8,516 2,152 1,302 650
Colorado 113 96 15 2,530 1,153 1,377 1,387 716 671 130 56 74
Connecticut 893 307 586 7,061 3,403 3,658 4,148 2,116 2,032 398 261 137
Delaware 214 48 166 624 218 406 216 91 125 o 0 0
District of Columbia 57 33 24 7,315 3,122 4,193 5,087 2,527 2,560 473 275 198
Florida 2,027 1,183 844 12,679 6,685 5,994 5,014 2,556 2,458 525 272 253
Georgia 920 405 515 5,687 2,304 3,383 1,452 631 821 211 126 85
Hawaii 417 280 137 1,054 548 506 267 169 98 5 2 3
Idaho 2,108 776 1,332 314 166 148 121 32 89 0 o o
Illinois 1,441 576 865 21,494 9,162 12,332 11,792 5,461 6,331 1,179 789 390
Indiana 668 153 515 9,271 4,482 4,789 1,591 938 653 100 79 21
Iowa 570 168 402 7,582 3,265 4,317 862 376 486 26 17 9
Kansas 455 188 267 2,446 1,103 1,343 430 171 259 0 0 o
Kentucky 549 132 417 2,797 1,145 1,652 774 375 399 54 43 11
Louisiana 99 59 40 3,130 1,348 1,782 1,302 593 709 113 80 33
Maine 278 60 218 2,303 955 1,348 154 58 96 o 0 0
Maryland 364 156 208 4,145 1,684 2,461 3,727 1,846 1,881 328 216 112
Massachusetts 4,617 1,325 3,292 30,460 13,542 16,918 16,440 7,592 8,848 1,780 1,132 648
Michigan 2,982 691 2,291 9,430 4,236 5,194 1,556 838 718 61 40 21
Minnesota 519 226 293 8,449 3,539 4,910 1,496 611 885 33 20 13
Mississippi 192 66 126 1,564 568 996 350 141 209 14 14 o
Missouri 1,680 890 790 10,574 4,829 5,745 5,511 3,020 2,491 369 212 157
Montana 184 39 145 426 191 235 11 3 8 0 0 o
Nebraska 221 45 176 2,824 1,146 1,678 225 126 99 3 3 o
Nevada 12 12 o 60 37 23 o 0 0 0 o o
New Hampshire 564 159 405 3,753 1,805 1,948 1,384 715 669 42 24 18
New Jersey 384 125 259 6,724 3,081 3,643 3,172 1,763 1,409 473 336 137
New Mexico 9 7 2 313 109 204 94 43 51 o 0 o
New York 7,466 2,985 4,481 54,988 26,166 28,822 28,153 12,461 15,692 2,607 1,518 1,089
North Carolina 1,021 394 627 9,506 4,172 5,334 1,541 832 709 232 166 66
North Dakota 41 9 32 502 174 328 35 12 23 0 0 o
Ohio 1,152 476 676 16,448 7,190 9,258 4,280 1,963 2,317 302 197 105
Oklahoma 200 64 136 2,552 1,176 1,376 1,080 670 410 38 26 12
Oregon 14 5 9 3,435 1,518 .1,917 974 398 576 54 43 11
Pennsylvania 3,569 1,601 1,968 31,941 14,720 17,221 9,214 4,545 4,669 981 645 336
Rhode Island 2,641 1,645 996 5,815 2,883 2,932 1,009 615 394 135 95 40
South Carolina 627 365 262 3,269 1,258 2,011 399 111 288 19 17 2
South Dakota 230 38 192 741 248 493 65 20 45 2 2 o
Tennessee 757 266 491 6,556 2,977 3,579 1,449 595 854j 251 147 104
Texas 592 356 236 13,117 6,249 6,868 4,776 2,785 1,991 383 306 77
Utah 195 59 136 5,604 2,919 2,685 1,100 736 364 98 72 26
Vermont 712 219 493 2,084 994 1,090 657 205 452 o o o
Virginia 272 45 227 7,392 2,908 4,484 1,520 703 817 30 23 7
Washington 833 704 129 4,849 2,142 2,707 2,586 989 1,597 47 22 25
West Virginia 409 112 297 1,128 509 619 107 62 45 0 0 0
Wisconsin 344 118 226 I 6,959 3,055 3,904 1,123 523 69 38 31
Wyoming 0 i 0 0 0 0 0 o 0 0 o 0 0
SOURCE: U.S. Department of Education, National Center for Education Statistics, Integrated Postsecondary Education Data System,
"Completions" survey 1991-92 and "Consolidated" survey 1992.
15
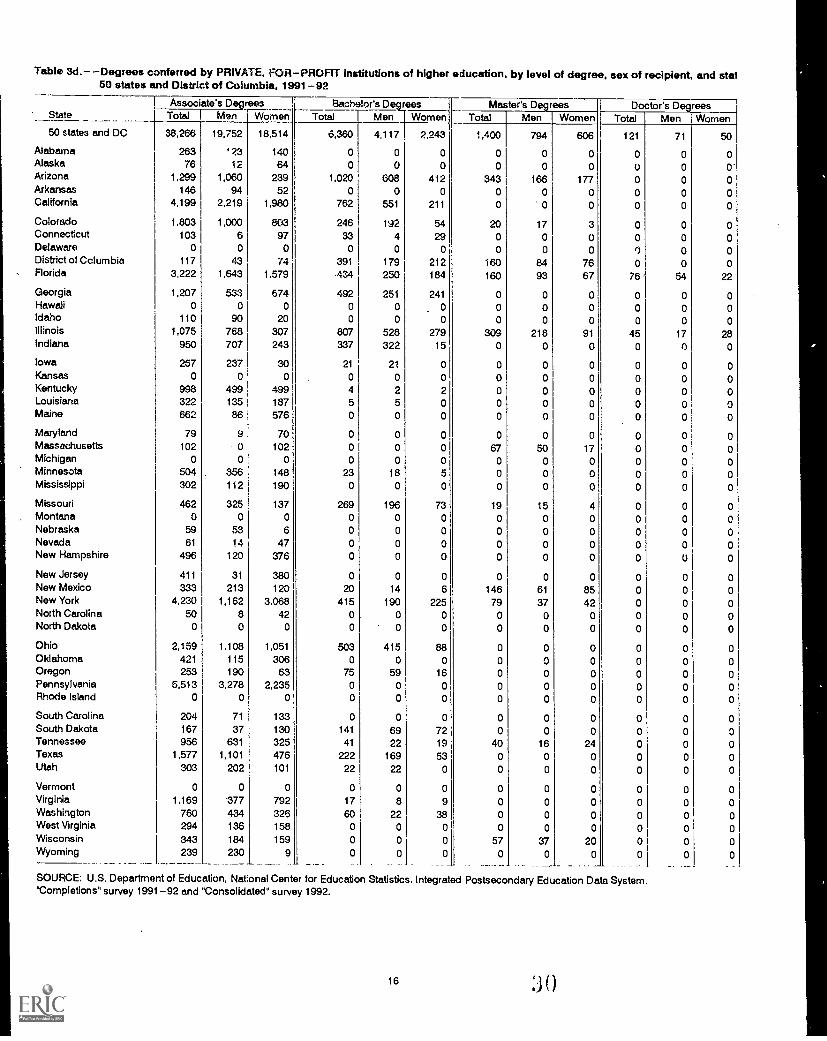
Table 3d.- -Degrees conferred by PRIVATE. FOR-PROFIT institutions of higher education, by level of degree, sex of recipient, and sta150 states and District of Columbia, 1991-92
-1Assoc'ate's Degrees Bachelor's Degrees Master's D- rees Doctor's D reesState Total Men Women Total Men Women Total Men Women Total Men Women50 states and DC 38,266 19,752 18,514 6,360 4,117 2,243 1,400 794 606 121 71 50
labama 263 423 140 o o o o o o o o olaska 76 12 64 o 0 o o o 0 u o 0'rizona 1,299 1,060 239 1,020 608 412 343 166 177 o 0rkansas 146 94 52 0 0 o o o 0 o o oalifornia 4,199 2.219 1,980 762 551 211 0 o o o o o
1olorado 1,803 1,000 803 246 192 54 20 17 3 o o o:onnectcut 103 6 97 33 4 29 0 0 0 0 o oIelaware 0 0 o o o o o o o o o olistrict of Columbia 117 43 74 391 179 212 160 84 76 0 0 olorida 3,222 1,643 1,579 .434 250 184 160 93 67 76 54 22
ieorgia 1,207 533 674 492 251 241 0 o o o o 0lawaii 0 o o o o o o 0 o o o olaho 110 so 20 0 0 o o o 0 o o oiinois 1,075 768 307 807 528 279 309 218 91 45 17 28idiana 950 707 243 337 322 15 0 0 0 0 0 0
Wiei 267 237 30 21 21 0 0 0 o o o 0:ansas 0 0 0 0 0 0 0 o 0 o o 0;entucky sas 499 499
1
4 2 2 0 0 o 0 o 0.ouisiana 322 135 187 5 5 0 o o o o 0 04aine 662 86 576 1 0 0 0 0 0 o o o 0
4aryland 79 9 70 1 0 0 0 0 0 0 o o 0Aassechusetts 102 0 102 1 0 0 0 67 50 17 0 0 0Aichigan 0 0 Oj o o o o o o o 0 0Ainnesota 504 . 356 148 23 18 5 0 0 0 0 0 0Aississippi 302 112 190 0 0 0 0 0 0 o o 0
Aissouri 462 325 137 269 196 73 19 15 4 0 0 0Aontana 0 0 0 0 o o o o o o o 0Jebraska 59 53 6 0 o o o o o o o 0Nlevada 61 14 47 o 0 0 o o o o o 0Jew Hampshire 496 120 376 0 0 o o o o I o 0 o
Jew Jersey 411 31 380 0 0 o o o o o o 0Jew Mexico 333 213 120 20 14 6 146 61 85 0 0 0Jew York 4,230 1,162 3,068 415 190 225 79 37 42 0 0 0gorth Carolina 50 8 42 o o o o o o o o 0Jorth Dakota 0 0 o o o o o o o o o 0
Dhio 2,159 1,108 1,051 503 415 88 0 0 0 0 0 0Dklahoma 421 115 306 0 0 0 0 0 o o o 0Dragon 253 190 63 75 59 16 0 0 o o o 0ennsylvania 5,513 3,278 2,235 0 0 0 0 0 0 0 0 0
Rhode Island o o o o o o o 0 o o o 0
South Carolina 204 71 133 0 0 0 0 0 0 0 0 0South Dakota 167 37 130 141 69 72 o o o o o 0Tennessee 956 631 325 41 22 19 40 16 24 0 0 0Texas 1.577 1,101 476 222 169 53 0 o 0 o o cUtah 303 202 101 22 22 o o o o o o c
Vermont 0 0 0 0 0 0 0 o o o o cVirginia 1 .169 '377 792 17 8 9 o o o o o C
Washington 760 434 326 60 22 38 o o o o o cWest Virginia 294 136 158 0 o o o o o o o cWisconsin 343 184 159 0 0 0 57 37 20 0 0 C
Wyoming 239 230 9 o o o o o 01_
SOURCE: U.S. Department of Education. Natonal Center for Education Statistics, Integrated Postsecondary Education Data System.'Completions" survey 1991-92 and "Consolidated" survey 1992.
16 30
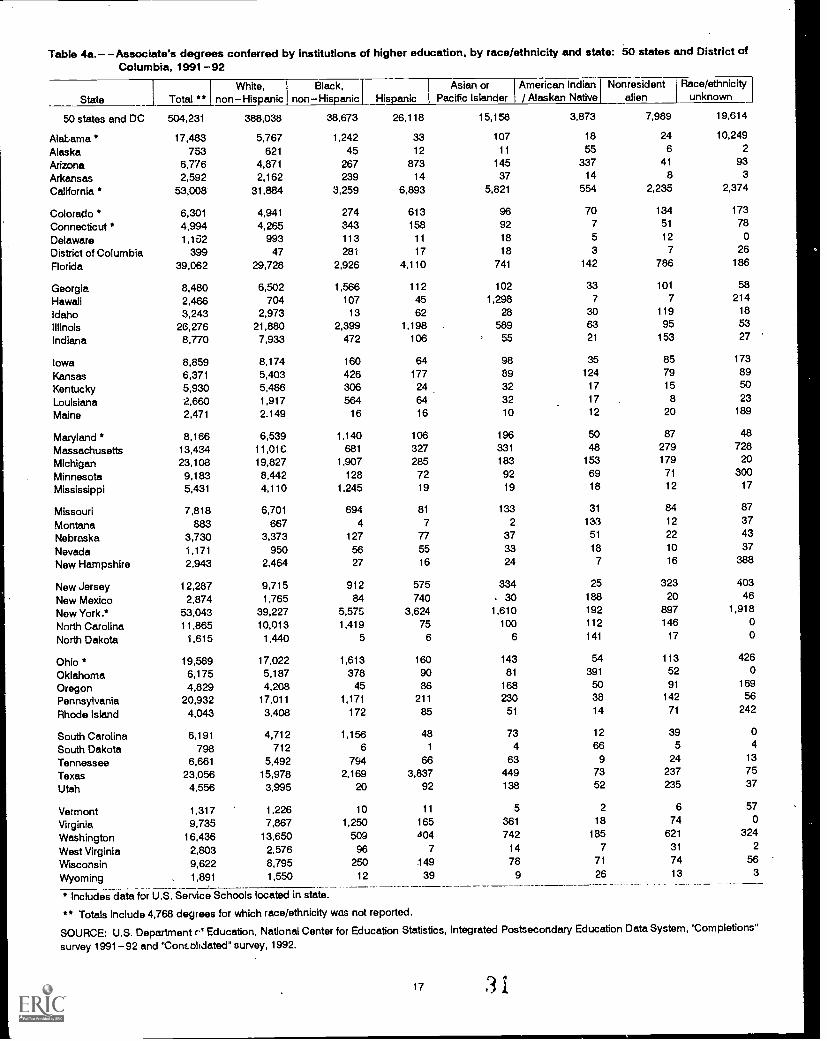
Table 4a.- -Associate's degrees conferred by institutions of higher education, by race/ethnicity and state: 60 states and District ofColumbia, 1991-92
State Total **White, Black,
1
non-Hispanic , non-Hispanic L HispanicAsian or
Pacific IslanderAmerican Indian I Nonresident I Race/ethnicity/ Alaskan Native L alien I unknown
50 states and DC 504,231 388,038 38,673 26,118 15,158 3,873 7,989 19,614
Alabama * 17,483 5,767 1,242 33 107 18 24 10,249
Alaska 753 621 45 12 11 55 6 2
Arizona 6,776 4,871 267 873 145 337 41 93
Arkansas 2,592 2,162 239 14 37 14 8 3
California * 53,008 31,884 3,259 6,893 5,821 554 2,235 2,374
Colorado * 6,301 4,941 274 613 96 70 134 173
Connecticut * 4,994 4,265 343 158 92 7 51 78
Delaware 1,162 993 113 11 18 5 12 0
District of Columbia 399 47 281 17 18 3 7 26
Florida 39,062 29,728 2,926 4,110 741 142 786 186
Georgia 8,480 6,502 1,566 112 102 33 101 58
Hawaii 2,466 704 107 45 1,298 7 7 214
Idaho 3,243 2,973 13 62 28 30 119 18
Illinois 26,276 21,880 2,399 1,198 589 63 95 53
Indiana 8,770 7,933 472 106 55 21 153 27
Iowa 8,859 8,174 160 64 98 35 85 173
Kansas 6,371 5,403 426 177 89 124 79 89
Kentucky 5,930 5,486 306 24 32 17 15 50
Louisiana 2,660 1,917 564 64 32 17 8 23
Maine 2,471 2.149 16 16 10 12 20 189
Maryland * 8,166 6,539 1,140 106 196 50 87 48
Massachusetts 13,434 11,01C 681 327 331 48 279 728
Michigan 23,108 19,827 1,907 285 183 153 179 20
Minnesota 9,183 8,442 128 72 92 69 71 300
Mississippi 5,431 4,110 1,245 19 19 18 12 17
Missouri 7,818 6,701 694 81 133 31 84 87
Montana 883 667 4 7 2 133 12 37
Nebraska 3,730 3,373 127 77 37 51 22 43
Nevada 1 ;171 950 56 55 33 18 10 37
New Hampshire 2,943 2,464 27 16 24 7 16 388
New Jersey 12,287 9,715 912 575 334 25 323 403
New Mexico 2,874 1,765 84 740 30 188 20 46
New York.* 53,043 39,227 5,575 3,624 1,610 192 897 1,918
North Carolina 11,865 10,013 1,419 75 100 112 146 0
North Dakota 1,615 1,440 5 6 6 141 17 0
Ohio * 19,589 17,022 1,613 160 143 54 113 426
Oklahoma 6,175 5,187 378 90 81 391 52 0
Oregon 4,829 4,208 45 86 168 50 91 169
Pennsylvania 20.932 17,011 1,171 211 230 38 142 56
Rhode Island 4,043 3,408 172 85 51 14 71 242
South Carolina 6,191 4,712 1,156 48 73 12 39 0
South Dakota 798 712 6 1 4 66 5 4
Tennessee 6,661 5,492 794 66 63 9 24 13
Texas 23,056 15,978 2,169 3,837 449 73 237 75
Utah 4,556 3,995 20 92 138 52 235 37
Vermont 1,317 1,226 10 11 5 2 6 57
Virginia 9,735 7,867 1,250 165 361 18 74 0
Washington 16,436 13,650 509 404 742 185 621 324
West Virginia 2,803 2,576 96 7 14 7 31 2
Wisconsin 9,622 8,795 250 149 78 71 74 56
Wyoming . 1,891.
1,550 12 39 9 26 13 3
* Includes data for U.S. Service Schools located in state.
** Totals include 4,768 degrees for which race/ethnicity was not reported.
SOURCE: U.S. Department c Education, National Center for Education Statistics, Integrated PostsecondaryEducation Data System, 'Completions"
survey 1991-92 and "Conr-oltdated" survey, 1992.
17 :31
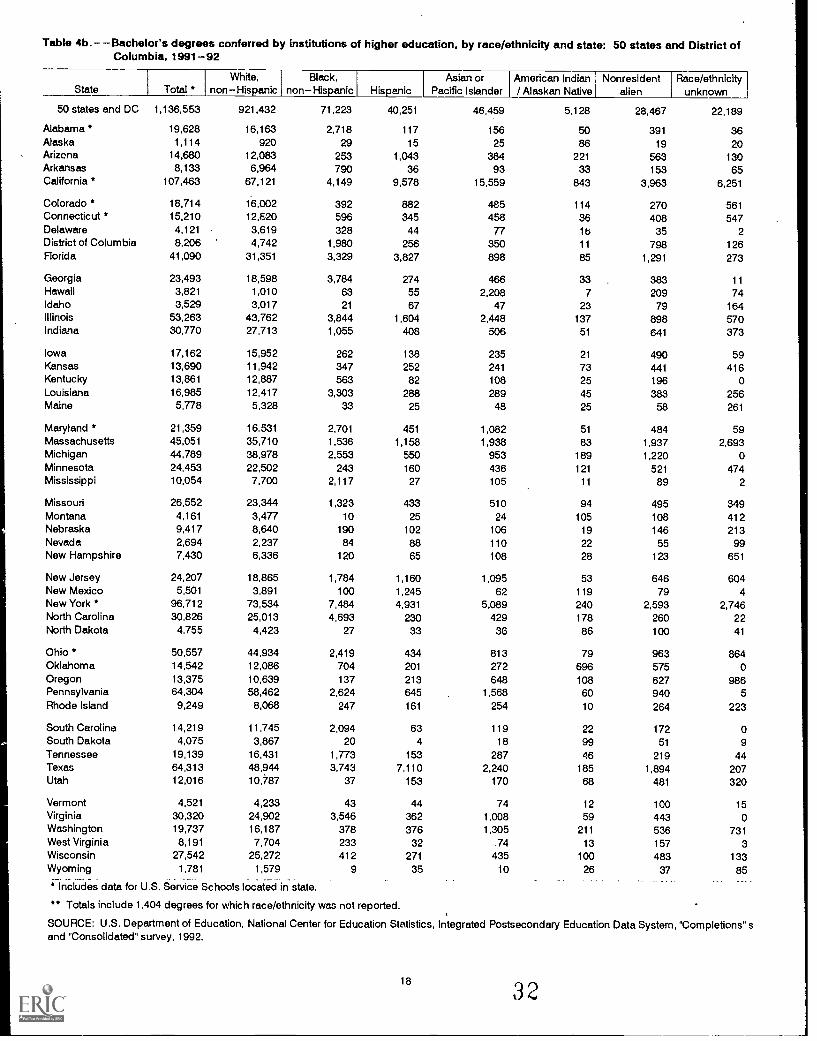
Table 4b.- -Bachelor's degrees conferred by institutions of higher education, by race/ethnicity and state: 50 states and District ofColumbia, 1991-92
State Total *White,
non-HispanicBlack,
non-Hispanic HispanicAsian or
Pacific IslanderAmerican Indian/ Alaskan Native
Nonresidentalien
Race/ethnicityunknown
50 states and DC 1,136,553 921,432 71,223 40,251 46,459 5,128 28,467 22,189
Alabama ' 19,628 16,163 2,718 117 156 50 391 36Alaska 1,114 920 29 15 25 86 19 20Arizona 14,680 12,083 253 1,043 384 221 563 130Arkansas 8,133 6,964 790 36 93 33 153 65California * 107,463 67,121 4,149 9,578 15,559 843 3,963 6,251
Colorado * 18,714 16,002 392 882 485 114 270 561Connecticut * 15,210 12,820 596 345 458 36 408 547Delaware 4,121 3,619 328 44 77 lb 35 2District of Columbia 8,206 4,742 1.980 256 350 11 798 126Florida 41,090 31,351 3,329 3,827 898 85 1,291 273
Georgia 23,493 18,598 3,784 274 466 33 383 11Hawaii 3,821 1,010 63 55 2,208 7 209 74Idaho 3,529 3,017 21 67 47 23 79 164Illinois 53,263 43,762 3,844 1,604 2,448 137 898 570Indiana 30,770 27,713 1,055 408 506 51 641 373
Iowa 17,162 15,952 262 138 235 21 490 59Kansas 13,690 11,942 347 252 241 73 441 416Kentucky 13,861 12,887 563 82 108 25 t 96 0Louisiana 16,985 12,417 3,303 288 289 45 383 256Maine 5,778 5,328 33 25 48 25 58 261
Maryland ' 21,359 16,531 2,701 451 1,082 51 484 59Massachusetts 45,051 35,710 1,536 1,158 1,938 83 1,937 2,693Michigan 44,789 38,978 2,553 550 953 189 1,220 0Minnesota 24,453 22,502 243 160 436 121 521 474Mississippi 10,054 7,700 2,117 27 105 11 89 2
Missouri 26,552 23,344 1,323 433 510 94 495 349Montana 4,161 3,477 10 25 24 105 108 412Nebraska 9,417 8,640 190 102 106 19 146 213Nevada 2,694 2,237 84 88 110 22 55 99New Hampshire 7,430 6,336 120 65 108 28 123 651
New Jersey 24,207 18,865 1,784 1,160 1,095 53 646 604New Mexico 5,501 3,891 100 1,245 62 119 79 4New York * 96,712 73,534 7,484 4,931 5,089 240 2,593 2,746North Carolina 30,826 25,013 4,693 230 429 178 260 22North Dakota 4,755 4,423 27 33 36 86 100 41
Ohio * 50,557 44,934 2,419 434 813 79 963 864Oklahoma 14,542 12,086 704 201 272 696 575 0Oregon 13,375 10,639 137 213 648 108 627 986Pennsylvania 64,304 58,462 2,624 645 1,568 60 940 5Rhode Island 9,249 8,068 247 161 254 10 264 223
South Carolina 14,219 11,745 2,094 63 119 22 172 0South Dakota 4,075 3.867 20 4 18 99 51 9Tennessee 19,139 16,431 1,773 153 287 46 219 44Texas 64,313 48,944 3,743 7,110 2,240 185 1,894 207Utah 12,016 10,787 37 153 170 68 481 320
Vermont 4,521 4,233 43 44 74 12 100 15Virginia 30,320 24,902 3,546 362 1,008 59 443 0Washington 19,737 16,187 378 376 1,305 211 536 731West Virginia 8,191 7,704 233 32 -74 13 157 3Wisconsin 27,542 25,272 412 271 435 100 483 133Wyoming 1,781 1,579 9 35 10 26 37 85
' Includes data for U.S. SerViCe Schools locate-d in state.
** Totals include 1,404 degrees for which race/ethnicity was not reported.,
SOURCE: U.S. Department of Education, National Center for Education Statistics, Integrated Postsecondary Education Data System, "Completions" sand "Consolidated" survey, 1992.
18
32
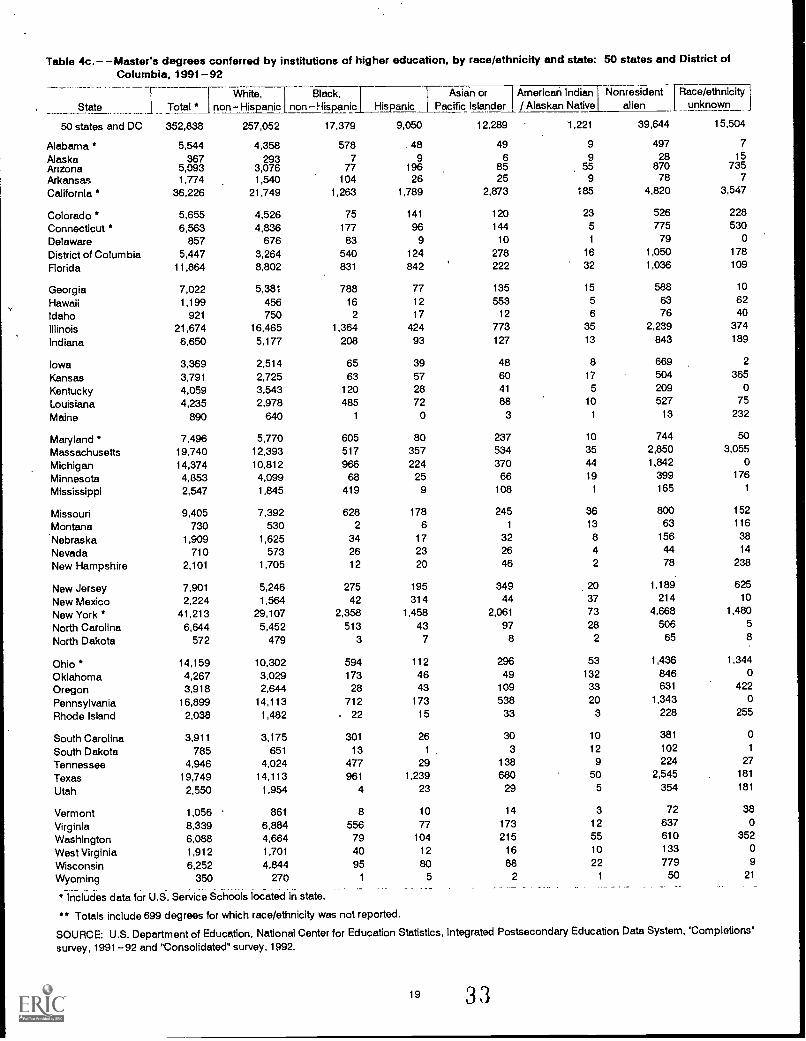
Table 4c.- -Master's degrees conferred by institutions of higher education, by race/ethnicity and state: 50 states and District ofColumbia, 1991-92
State 1 Total * j nonWhite, I
Hispanic].Black,
non - panicj HispanicAsian or 'an
Pacific IslanderAmerican India-r1.1 Nonresident [Race/ethnicity/ Alask Native I alien unknown
50 states and DC 352,838 257,052 17,379 9,050 12,289 1,221 39,644 15,504
Alabama * 5,544 4,358 578 48 49 9 497 7
Alaska 367 293 7 9 6 9 28 15Arizona 5,093 3,076 77 196 85 55 870 735
Arkansas 1,774 1,540 104 26 25 9 78 7
California * 36,226 21.749 1,263 1,789 2,873 185 4,820 3,547
Colorado * 5,655 4,526 75 141 120 23 526 228
Connecticut * 6,563 4,836 177 96 144 5 775 530
Delaware 857 676 83 9 10 1 79 0
District of Columbia 5,447 3,264 540 124 278 16 1,050 178
Florida 11,864 8,802 831 842 222 32 1,036 109
Georgia 7,022 5,381 788 77 135 15 588 10
Hawaii 1,199 456 16 12 553 5 63 62
Idaho 921 750 2 17 12 6 76 40
Illinois 21,674 16,465 1,364 424 773 35 2,239 374
Indiana 6.650 5,177 208 93 127 13 843 189
Iowa 3,369 2,514 65 39 48 8 669 2
Kansas 3,791 2,725 63 57 60 17 504 365
Kentucky 4,059 3,543 120 28 41 5 209 0
Louisiana 4,235 2,978 485 72 88 10 527 75
Maine 890 640 1 0 3 1 13 232
Maryland * 7,496 5,770 605 80 237 10 744 50
Massachusetts 19,740 12,393 517 357 534 35 2,850 3,055
Michigan 14,374 10,812 966 224 370 44 1,842 o
Minnesota 4,853 4,099 68 25 66 19 399 176
Mississippi 2,547 1,845 419 9 108 1 165 1
Missouri 9,405 7,392 628 178 245 36 800 152
Montana 730 530 2 6 1 13 63 116
Nebraska 1909, 1,625 34 17 32 8 156 38
Nevada 710 573 26 23 26 4 44 14
New Hampshire 2,101 1,705 12 20 46 2 78 238
New Jersey 7,901 5,246 275 195 349 20 1,189 625
New Mexico 2,224 1,564 42 314 44 37 214 10
New York ' 41,213 29,107 2,358 1,458 2,061 73 4,668 1,480
North Carolina 6,644 5,452 513 43 97 28 506 5
North Dakota 572 479 3 7 8 2 65 8
Ohio * 14,159 10,302 594 112 296 53 1,436 1,344
Oklahoma 4,267 3,029 173 46 49 132 846 0
Oregon 3,918 2,644 28 43 109 33 631 422
Pennsylvania 16,899 14,113 712 173 538 20 1,343 0
Rhode Island 2,038 1,482 . 22 15 33 3 228 255
South Carolina 3,911 3,175 301 26 30 10 381 0
South Dakota 785 651 13 1 3 12 102 1
Tennessee 4,946 4,024 477 29 138 9 224 27
Texas 19,749 14,113 961 1,239 680 50 2,545 181
Utah 2,550 1,954 4 23 29 5 354 181
Vermont 1.056 861 8 10 14 3 72 38
Virginia 8,339 6,884 556 77 173 12 637 0
Washington 6,088 4,664 79 104 215 55 610 352
West Virginia 1,912 1,701 40 12 16 10 133 o
Wisconsin 6,252 4,844 95 ao 88 22 779 9
Wyoming 350 270 1 5 2 1 50 21
* Includes data for U.S. Service Schools located in state.
* Totals include 699 degrees for which race/ethnicity was not reported.
SOURCE: U.S. Department of Education, National Center for Education Statistics, Integrated Postsecondary Education Data System, "Completions"
survey, 1991-92 and "Consolidated" survey, 1992.
19 33
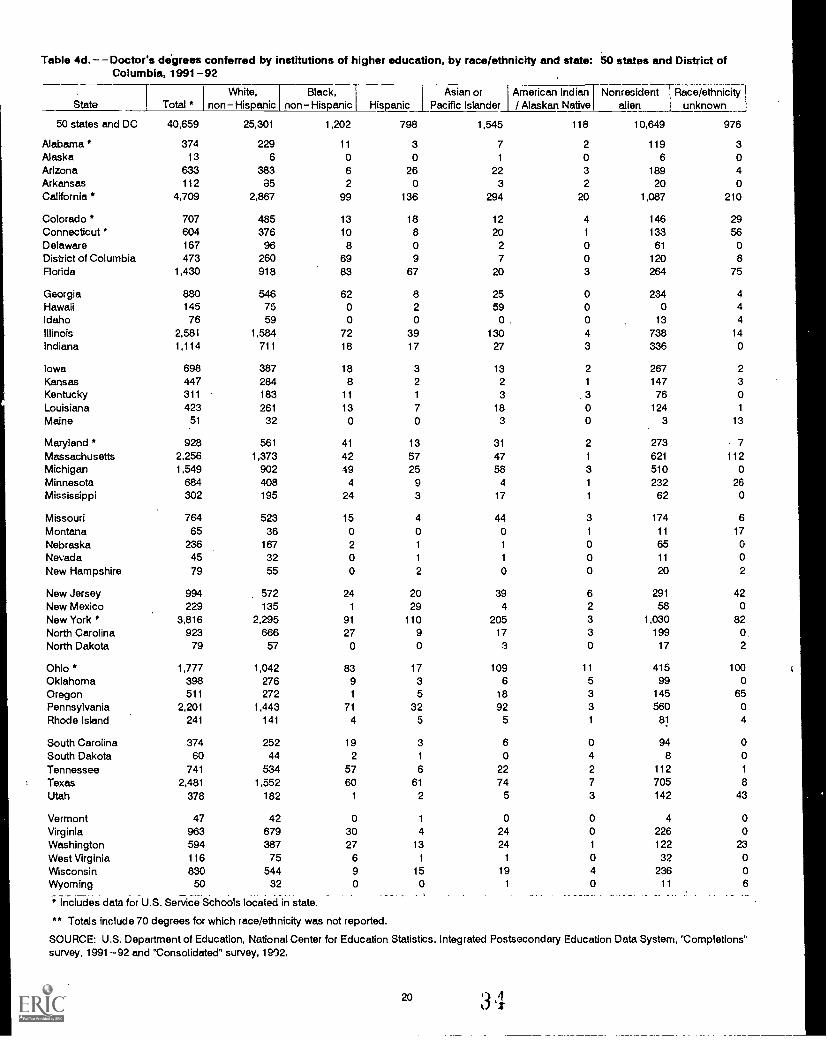
Table 4d. Doctor's digress conferred by institutions of higher education, by race/ethnicity and state: 50 states and District ofColumbia, 1991-92
State Total *White,
nonHispanicBlack,
non Hispanic HispanicAsian or
Pacific IslanderAmerican Indian I Nonresident/ Alaskan Native alien
Race/ethnicityunknown
50 states and DC 40,659 25,301 1202, 798 1,545 118 10,649 976
Alabama * 374 229 11 3 7 2 119 3Alaska 13 6 0 0 1 0 6 0Arizona 633 383 6 26 22 3 189 4Arkansas 112 35 2 0 3 2 20 0California * 4,709 2,867 99 136 294 20 1,087 210
Colorado * 707 485 13 18 12 4 146 29Connecticut 604 376 10 8 20 1 133 56Delaware 167 96 8 0 2 0 61 0District of Columbia 473 260 69 9 7 0 120 8Florida 1,430 918 83 67 20 3 264 75
Georgia 880 546 62 8 25 0 234 4Hawaii 145 75 0 2 59 0 0 4Idaho 76 59 0 0 0 . 0 13 4Illinois 2,581 1,584 72 39 130 4 738 14Indiana 1,114 711 18 17 27 3 336 0
Iowa 698 387 18 3 13 2 267 2
Kansas 447 284 8 2 2 1 147 3Kentucky 311 183 11 1 3 76 0Louisiana 423 261 13 7 18 0 124 1
Maine 51 32 0 0 3 0.
3 13
Maryland * 928 561 41 13 31 2 273 7
Massachusetts 2,256 1,373 42 57 47 1 621 112Michigan 1,549 902 49 25 58 3 510 0
Minnesota 684 408 4 9 4 1 232 26Mississippi 302 195 24 3 17 1 62 0
Missouri 764 523 15 4 44 3 174 6
Montana 65 36 0 0 0 1 11 17
Nebraska 236 167 2 1 1 0 65 0
Nevada 45 32 0 1 1 0 11 0
New Hampshire 79 55 0 2 0 0 20 2
New Jersey 994 572 24 20 39 6 291 42New Mexico 229 135 1 29 4 2 58 0New York * 3,816 2,295 91 110 205 3 1,030 82North Carolina 923 666 27 9 17 3 199 0
North Dakota 79 57 0 0 3 0 17 2
Ohio * 1,777 1,042 83 17 109 11 415 100Oklahoma 398 276 9 3 6 5 99 0
Oregon 511 272 1 5 18 3 145 65
Pennsylvania 2,201 1,443 71 32 92 3 560 0
Rhode Island 241 141 4 5 5 1 81 4
South Caroiina 374 252 19 3 6 0 94 0
South Dakota 60 44 2 1 0 4 8 0
Tennessee 741 534 57 6 22 2 112 1
Texas 2,481 1,552 60 61 74 7 705 8
Utah 378 182 1 2 5 3 142 43
Vermont 47 42 0 1 0 0 4 0
Virginia 963 679 30 4 24 0 226 0
Washington 594 387 27 13 24 1 122 23
West Virginia 116 75 6 1 1 0 32 0
Wisconsin 830 544 9 15 19 4 236 0
Wyoming 50 32 0 0 1 0 11 6
* in-clt.".7des data for U.S. Service Schools located in state.
** Totals include 70 degrees for which race/ethnicity was not reported.
SOURCE: U.S. Department of Education, National Center for Education Statistics, Integrated Postsecondary Education Data System, 'Completions"survey, 1991-92 and "Consolidated" survey, 1992.
20'3 ,11
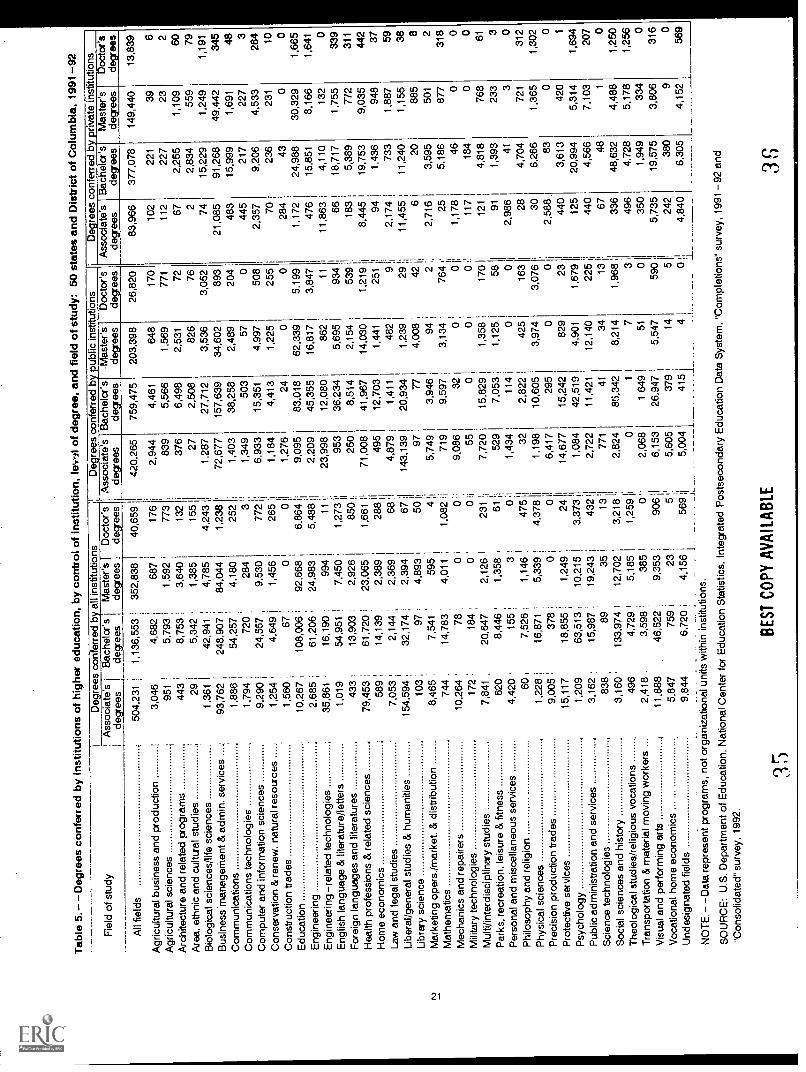
ts,
Tab
le 5
.- -
Deg
rees
con
ferr
ed b
y in
stitu
tions
of h
ighe
r ed
ucat
ion,
by
cont
rol o
f ins
titut
ion.
Wel
l of d
egre
e,an
d fie
ld o
f stu
dy: 5
0 st
ates
and
Dis
tric
t of C
olum
bia,
199
1-92
Fie
ld o
f stu
dyP
Ass
ocia
t1
De
degr
ee
All
field
s50
4,2
Agr
icul
tura
l bus
ines
s an
d pr
oduc
tion
3,0
Agr
icul
tura
l sci
ence
s9
Arc
hite
ctur
e an
d re
late
d pr
ogra
ms
4
Are
a, e
thni
c an
d cu
ltisa
l stu
dies
Bio
logi
cal s
cien
ces/
life
scie
nces
1,
Bus
ines
s m
anag
eMen
t & a
dmin
. ser
vice
s93
,7
Com
mun
icat
ions
1,8
Com
mun
icat
ions
tech
nolo
gies
1,7
Com
pute
r an
d in
form
atio
n sc
ienc
es9,
2C
onse
rvat
ion
& r
enew
. nat
ural
res
oace
s1.
2
Con
stru
ctio
n tr
ades
1,5
Edu
catio
n10
,2
Eng
inee
ring
2,6
Eng
inee
ring
-rel
ated
tech
nolo
g ie
s35
,8
Eng
lish
lang
uage
& li
tera
ture
/lette
rs1,
0
For
eign
lang
uage
s an
d lit
erat
ures
4
Hea
lth p
rofe
ssio
ns &
rel
ated
sci
ence
s79
,4
Hom
e ec
onom
ics
5
Law
and
lega
l stu
dies
7,0
Libe
ral/g
ener
al s
tudi
es &
hum
aniti
es15
4,5
Libr
ety
scie
nce
1
Mar
ketin
g op
ersi
mar
ket.
& d
istr
ibut
ion
8,4
Mat
hem
atic
s7
Mec
hani
cs a
nd r
epai
rers
10,2
Mili
tary
tech
nolo
gies
1
Mul
ti/in
terd
isci
plin
ery
stud
ies
7,8
Par
ks, r
ecre
atio
n, le
isur
e &
fitn
ess
6
Per
sona
l and
mis
cella
neou
s se
rvic
es4,
4
Phi
loso
phy
and
relig
ion
Phy
sica
l sci
ence
s1,
2
Pre
cisi
on p
rodu
ctio
n tr
ades
9,
Pro
tect
ive
serv
ices
15,1
Psy
chol
ogy
1,2
Pub
lic a
dmin
istr
atio
n an
d se
rvic
es3.
1
Sci
ence
tech
nolo
gies
8
Soc
ial s
cien
ces
and
hist
ory
3,1
The
olog
ical
stu
dies
/rel
igio
us v
ocat
ions
4
Tra
nspo
rtat
ion
& m
ater
ial m
ovin
g w
orke
rs2,
4
Vis
ual a
nd p
erfo
rmin
g ar
ts(
11,
Voc
atio
nal h
ome
econ
omic
s5,
8
Und
esig
nate
d fie
lds
9,8
NO
TE
.- -
Dat
a re
pres
ent p
togr
arns
, not
org
aniz
atio
nalFee
sco
nter
red
byB
ache
lcr's
Ide
gree
sI
all i
nstit
utio
nsM
aste
r's 1
degr
ees
ID
octo
r s
dee
sA
ssoc
iate
'sD
egre
es c
onfe
rred
bub
lic in
stitu
tions
Deg
rees
Ass
ocia
te's
degr
ees
conf
erre
d by
Bac
helo
r'sde
gree
s
priv
ate
inst
itutio
nsM
aste
r'sde
gree
sD
octo
r'sde
gree
sR
'SI
s_I
degr
ees
Bac
helc
r'sde
gree
s.M
aste
r'sde
gree
sD
octo
r'sde
gree
s
311
1,13
6,55
335
2,83
840
,659
420,
265
759,
475
203,
398
26,8
2083
,966
377,
078
149,
440
13,8
39
464,
682
687
176
2,94
44,
461
648
170
102
221
396
51!
5,79
31,
592
773
839
5,56
61,
569
771
112
227
232
43 ;
8,75
33,
640
132
376
6,49
82,
531
7267
2,25
51,
109
60
29 i
5,34
21,
385
155
272,
508
826
762
2,83
455
979
61I
42,9
414,
785
4,24
31,
287
27,7
123,
536
3,05
274
15,2
291,
249
1,19
1
62 I
248,
907
84,0
441,
238
72,6
7715
7,63
934
,602
893
21,0
8591
,268
49,4
4234
5
86 1
54,2
574,
180
252
1,40
338
,258
2,48
920
448
315
,999
1,69
148
94 ;
720
284
31,
349
503
570
445
217
227
3
90 j
24.5
57,
9,53
077
26,
933
15,3
514,
997
508
2,35
79,
206
4,53
326
4
54 !
4,64
9 I
1,45
626
5 I
1,18
44,
413
1,22
525
570
236
231
10
60 1
,67
:0
01,
276
240
028
443
00
67 1
108,
006
'92
,668
6,86
49,
095
83,0
1862
,339
5,19
91,
172
24,9
8830
,329
1,66
5
85 ;
61,2
06 '
24,9
835,
488
;2,
209
45,3
5516
,817
3,84
747
615
,851
8,16
61,
641
6116
,190
:99
411
23,9
9812
,080
862
1111
,863
4,11
013
20
1954
,951
7,45
01,
273
953
36,2
345,
695
934
6618
,717
1,75
533
9
33 :
13,9
03 .
2,92
685
025
08.
514
2,15
453
918
35,
389
772
311
53 :
61,7
20 !
23,0
651,
661
71,0
0841
,967
14,0
301,
219
8,44
519
,753
9,03
544
2
8914
,139
,2,
389
288
495
12,7
031,
441
251
'94
1,43
694
837
532,
144
:2,
369
684,
879
1,41
148
29
2,17
473
31,
887
59
94 ;
32,1
74 ;
2,39
467
143,
139
20,9
341,
239
2911
,455
11,2
401,
155
38
03 1
97 ! '
4,89
350
97'
774,
008
426
2088
58
65 :
7,54
159
54
5,74
93,
946
942
2,71
63,
595
501
2
44 .
14,7
83 ;
4,01
1'
1,08
2 '
719
9,59
73,
134
764
255,
186
877
318
64 '
78 :
00
9,08
632
00
1,17
846
00
72:
184:
001
550
00
117
184
00
41,
20,6
472,
126
;23
1:
7,72
015
,829
1,35
817
012
14,
818
768
61
208,
446
'1,
358
'
6152
97,
053
1,12
558
911,
393
233
3
2015
53
01,
434
1
114
00
2,98
641
30
60 i
7,52
6 i
1,14
647
532
2,82
242
516
328
4,70
472
131
2
2816
,871
:5,
339
4,37
81,
198
10,6
053,
974
3,07
630
6,26
61,
365
1,30
2
05 '
378
'0
0,
6,41
729
50
02,
588
830
0
1718
,855
1,24
924
14,6
7715
,242
829
2344
03,
613
420
1
0963
,513
110
,215
3,37
311,
084
42,5
194,
901
1,67
912
520
,994
5,31
41,
694
62 :
15,9
87 !
19,2
4343
22,
722
11,4
2112
,140
225
440
4,56
67,
103
207
3889
3513
771
4134
1367
481
0
60 '
133,
974
112
,702
3,21
82,
824
85,3
428,
214
1,96
833
648
,632
4,48
81,
250
96 '
4.72
9 !
5,18
51,
259
01
73
496
4,72
85,
178
1,25
6
18.
3,59
8 '
385
02,
068
1 64
951
035
01,
949
334
0
8846
,522
,9,
353
]90
66,
153
26,9
475,
547
590
5,73
519
,575
3,80
631
6
4775
9 !
235
,5,
605
379
145
242
380
90
44,
6,72
0 1
4,15
656
9 i
5,00
441
514
0ii
4,84
06,
305
4,15
256
9J1-
II__
SO
UR
CE
: U.S
. Dep
artm
ent o
f Edu
catio
n. N
atio
nal C
ente
r fo
r E
duca
tion
Sta
tistic
s, In
tegr
ated
Pos
tsec
onda
ryE
duca
tion
Dat
a S
yste
m, "
Com
plet
ions
" su
rvey
, 199
1-92
and
"Con
solid
ated
" su
rvey
, 199
2.
3B
ES
T C
OP
Y A
VA
ILA
BLE
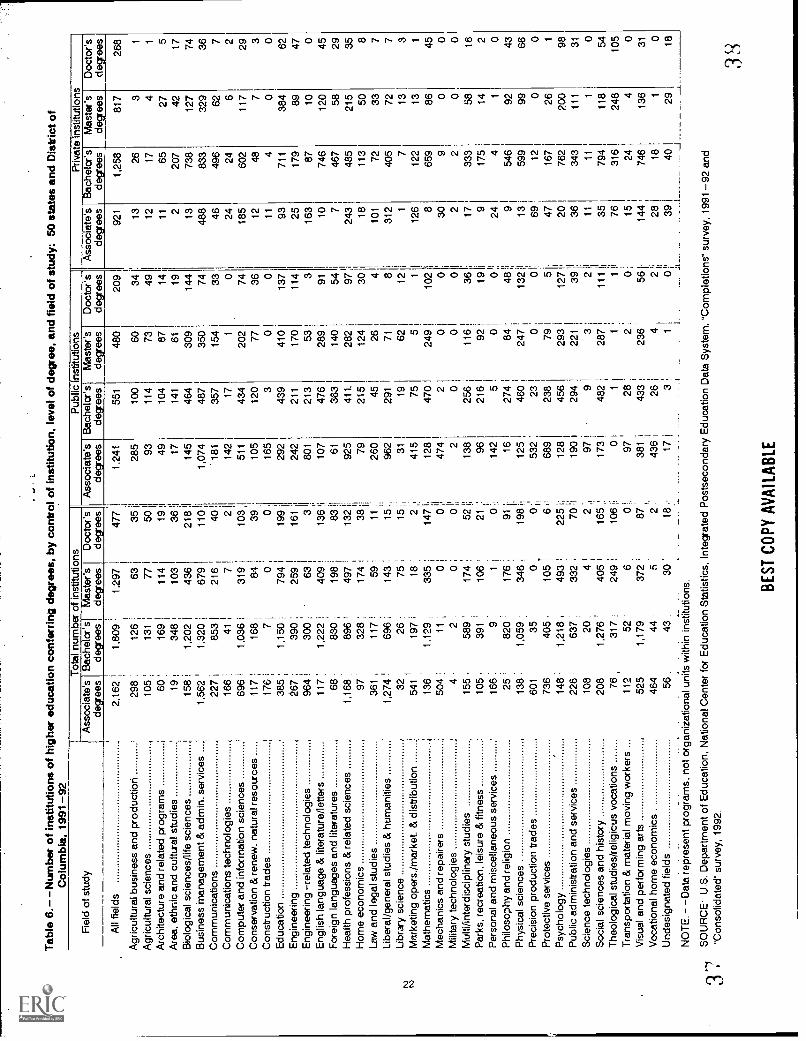
I.
Tab
le 6
.- -
Num
ber
of in
stitu
tions
of h
ighe
r ed
ucat
ion
conf
errin
g de
gree
s, b
y co
ntro
l of i
nstit
utio
n, le
vel o
f deg
ree,
and
fiel
d of
stu
dy: 5
0 st
ates
and
Dis
tict o
fC
olum
bia,
199
1-92
Tot
al n
umbe
r of
inst
itutio
nsP
ublic
inst
itutio
nsP
rivat
e in
stitu
tions
Fie
ld o
f stu
dyA
ssoc
iate
'sde
gree
sB
ache
lor's
degr
ees
Mas
ter's
desr
ees
Doc
tor's
degr
ees
Ass
ocia
te's
degr
ees
Bac
helo
r'sde
gree
sM
aste
r'sde
gree
sD
octo
r'sde
gree
sde
gree
sB
ache
lor's
degr
ees
Mas
ter's
degr
ees
Doc
tor's
degr
ees
All
field
s2,
162
11,
809
1,29
747
711,
241
551
480
209
921
1,25
881
726
8
Agr
icul
tura
l bus
ines
s an
d pr
oduc
tion
298
:12
663
351
285
100
6034
1326
31
Agr
icul
tura
l sci
ence
s10
5 1
131
7750
1 1
9311
473
4912
174
1
Arc
hite
ctur
e an
d re
late
d pr
ogra
ms
Are
a, e
thni
c an
d cu
ltiza
l stu
dies
60 '
19 1
169
114
11
348
103
191
361
49 1710
414
1
87 61
14 1911 2
65 207
27 425 17
Bio
logi
cal s
cien
ces/
life
scie
nces
158
i 1
1,20
2 1
436
2181
145
464
309
144
1373
812
774
Bus
ines
s M
anag
emen
t & a
dmin
. ser
vice
si
1,56
21,
320
167
911
011,
074
487
350
7448
883
332
936
Com
mun
icat
ions
227
185
3 1
216
401
181
357
154
3346
496
627
Com
mun
icat
ions
tech
nolo
gies
166
.41
71
2 i
142
171
024
246
2C
ompu
ter
and
info
rmat
ion
scie
nces
696
i1,
036
I31
910
3;51
143
420
274
185
602
117
29C
onse
rvat
ion
& r
enew
, nat
ural
res
oirc
es11
7 1
168
,
8439
110
512
077
3612
487
3C
onst
ruct
ion
trad
es17
5 ;
7 1
001
165
30
011
40
0E
duca
tion
385
;1,
150
i79
419
9129
243
941
013
793
711
384
62E
ngin
eerin
g26
7 ;
390
125
916
1124
221
117
011
425
179
8947
Eng
inee
ring
-rel
ated
tech
nolo
gies
964
!30
0 :
633
!80
121
353
316
387
100
Eng
lish
lang
uage
& li
tera
ture
/lette
rs11
7 '
1,22
2 !
409
136
'10
747
628
991
1074
612
045
For
eign
lang
uage
s an
d lit
erat
ures
68 .
830
,19
883
161
363
140
547
467
5829
Hea
lth p
rofe
ssio
ns &
rel
ated
sci
ence
s1,
168
,89
6 1
497
1321
925
411,
282
9724
348
521
535
Hom
e ec
onom
ics
Law
and
lega
l97
,32
8 ;
174
!38
i79
215
124
3018
113
508
stud
ies
Libe
ral/g
ener
al s
tudi
es &
hum
aniti
es36
1,
1,27
4 1
117
159
696
114
3
11.
260
15 ;
962
4529
126 71
4 810
1
312
72 405
33 727 7
Libr
,my
scie
nce
321
26 ;
75 1
151,
3119
6212
17
133
Mar
ketin
g op
ers.
/mar
ket.
& d
istr
ibut
ion
Mat
hem
atic
s54
119
7 1
182
415
i
755
112
612
213
1
I
Mec
hani
cs a
nd r
epai
rers
136
504
1
1,12
9 .
335
11;
014
712
81
1
0 ,,
474
470 2
249
102
00
8 3065
9 986 0
450
Mili
tary
tech
nolo
gies
42
001
.2
00
02
20
0M
ulti/
inte
rdis
cipl
inar
y st
udie
s,
155
;58
9 '
174
5211
138
256
116
3617
333
5816
Par
ks, r
ecre
atio
n, le
isur
e &
fitn
ess
105
391
'
106
2196
1:21
692
199
175
142
Per
sona
l and
mis
cella
neou
s se
rvic
es16
6 .
9.
101
:14
25
00
244
10
Phi
loso
phy
and
relig
ion
25 '
820
176
911.
1627
41
8448
954
692
43P
hysi
cal s
cien
ces
,13
8 .
1,05
934
619
8 I,
125
460
247
132
1359
999
66P
reci
sion
pro
duct
ion
trad
es,
Pro
tect
ive
serv
ices
.
601
736
350
405
;10
5i
0 i!
532
230
0
611
689
238
795
69 4712
167
0
260 1
Psy
chol
ogy
148
'1.
218
,49
322
51;
128
456
293
127
2076
220
098
Pub
lic a
dmin
istr
atio
n an
d se
rvic
es22
6 -
637
:33
270
1119
029
422
139
1136
343
111
31
Sci
ence
tech
nolo
gies
108
20 .
41
2 1,
979
321
1111
10
Soc
ial s
cien
ces
and
hist
ory
208
1,27
640
516
5 ,1
173
482
287
1111
3579
411
854
The
olog
ical
stu
dies
/rel
igic
us v
ocat
ions
7631
7 :
249
1061
10
11
1176
316
248
105
Tra
nspo
rtat
ion
& m
ater
ial m
ovin
g w
orke
rs11
252
'6
01.
9728
201
1524
40
Vis
ual a
nd p
erfo
rmin
g ar
ts,
525
1,17
937
287
1,38
1i
433
236
5611
144
746
136
31V
ocat
iona
l hom
e ec
onom
ics
.46
444
52
436
264
211
2818
10
Und
esig
nate
d fie
lds
56 .
4330
18 .
173
11
0 r
3940
2918
NO
TE
.- -
Dat
a re
pres
ent p
rogr
ams,
not
org
aniz
atio
nal u
nits
with
in in
stitu
tions
.
SO
UR
CE
. U.S
. Dep
artm
ent o
f Edu
catio
n, N
atio
nal C
ente
r fo
r E
duca
tion
Sta
tistic
s, In
tega
ted
Pos
tsec
onda
ry E
duca
tion
Dat
a S
yste
m, "
Com
plet
ions
" su
rvey
, 199
1-92
and
j a"C
onso
lidat
ed"
surv
ey, 1
992.
BE
ST
CO
PY
AV
AIL
AB
LE
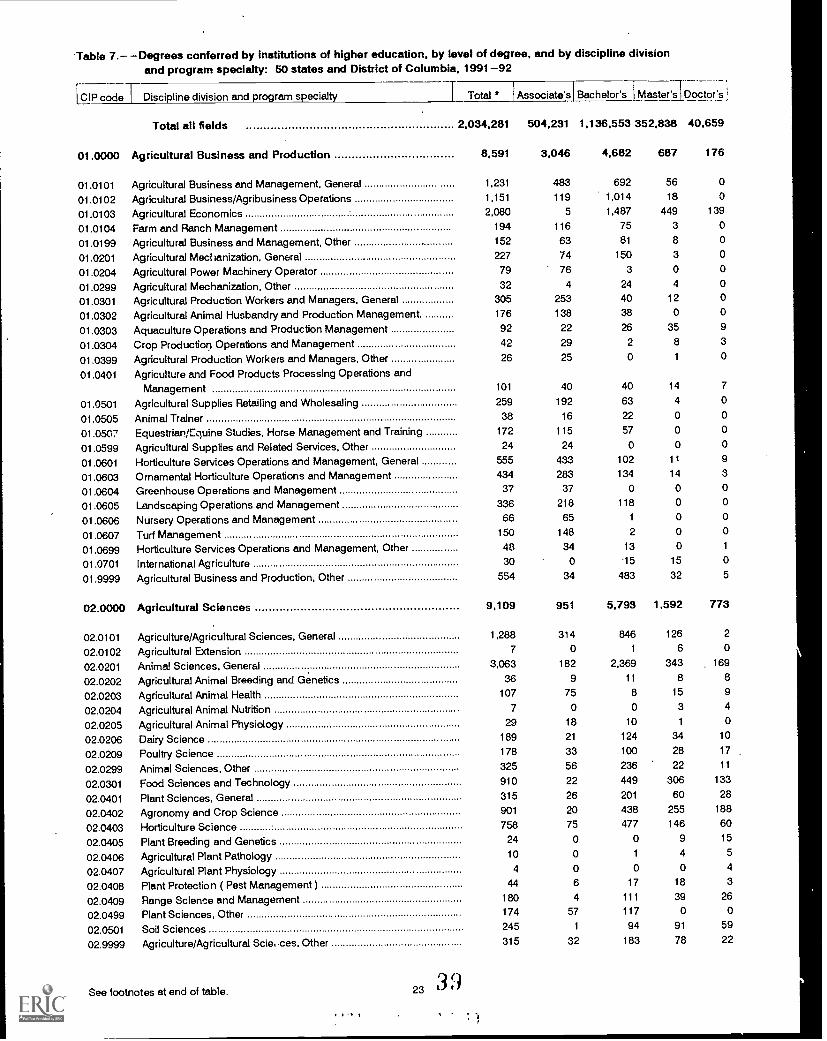
Table 7.- -Degrees conferred by institutions of higher education, by level of degree, and by discipline division
[GIP code
and program specialty: 50 states and District of Columbia, 1991-92
7 Discipline division and program specialty Total * Associate's Bachelor's I Master's Doctor's1
Total all fields 2,034,281 504,231 1,136,553 352,838 40,659
01.0000 Agricultural Business and Production 8,591 3,046 4,682 687 176
01.0101 Agricultural Business and Management, General 1,231 483 692 56 0
01.0102 Agricultural Business/Agribusiness Operations 1,151 119 1,014 18 0
01.0103 Agricultural Economics 2,080 5 1,487 449 139
01.0104 Farm and Ranch Management 194 116 75 3 0
01.0199 Agricultural Business and Management, Other 152 63 81 8 0
01.0201 Agricultural Mechanization, General 227 74 150 3 0
01.0204 Agricultural Power Machinery Operator 79 76 3 0 0
01.0299 Agricultural Mechanization, Other 32 4 24 4 0
01.0301 Agricultural Production Workers and Managers, General 305 253 40 12 0
01.0302 Agricultural Animal Husbandry and Production Management. 176 138 38 0 0
01.0303 Aquaculture Operations and Production Management 92 22 26 35 9
01.0304 Crop Production Operations and Management 42 29 2 8 3
01.0399 Agricultural Production Workers and Managers, Other 26 25 0 1 0
01.0401 Agriculture and Food Products Processing Operations andManagement 101 40 40 14 7
01.0501 Agricultural Supplies Retailing and Wholesaling 259 192 63 4 0
01.0505 Animal Trainer 38 16 22 0 0
01.0507 Equestrian/Equine Studies, Horse Management and Training 172 115 57 0 0
01.0599 Agricultural Supplies and Related Services, Other 24 24 0 0 0
01.0601 Horticulture Services Operations and Management, General 555 433 102 11 9
01.0603 Ornamental Horticulture Operations and Management 434 283 134 14 3
01.0604 Greenhouse Operations and Management 37 37 0 0 0
01.0605 Landscaping Operations and Management 336 218 118 0 0
01.0606 Nursery Operations and Management 66 65 1 0 0
01.0607 Turf Management 150 148 2 0 0
01.0699 Horticulture Services Operations and Management, Other 48 34 13 0 1
01.0701 International Agriculture 30 0 15 15 0
01.9999 Agricultural Business and Production, Other 554 34 483 32 5
02.0000 Agricultural Sciences 9,109 951 5,793 1,592 773
02.0101 Agriculture/Agricultural Sciences, General 1,288 314 846 126 2
02.0102 Agricultural Extension 7 0 1 6 0
02.0201 Animal Sciences, General 3,063 182 2,369 343 169
02.0202 Agricultural Animal Breeding and Genetics 36 9 11 8 8
02.0203 Agricultural Animal Health 107 75 8 15 9
02.0204 Agricultural Animal Nutrition 7 0 0 3 4
02.0205 Agricultural Animal Physiology 29 18 10 1 0
02.0206 Dairy Science 189 21 124 34 10
02.0209 Poultry Science 178 33 100 28 17
02.0299 Animal Sciences, Other 325 56 236 22 11
02.0301 Food Sciences and Technology 910 22 449 306 133
02.0401 Plant Sciences, General 315 26 201 60 28
02.0402 Agronomy and Crop Science 901 20 438 255 188
02.0403 Horticulture Science 758 75 477 146 60
02.0405 Plant Breeding and Genetics 24 0 0 9 15
02.0406 Agricultural Plant Pathology 10 0 1 4 5
02.0407 Agricultural Plant Physiology 4 0 0 0 4
02.0408 Plant Protection ( Pest Management ) 44 6 17 18 3
02.0409 Range Science and Management 180 4 111 39 26
02.0499 Plant Sciences, Other 174 57 117 0 0
02.0501 Soil Sciences 245 1 94 91 59
02.9999 Agriculture/Agricultural Scie, ,ces, Other 315 32 183 78 22
See footnotes at end of table. 23 3
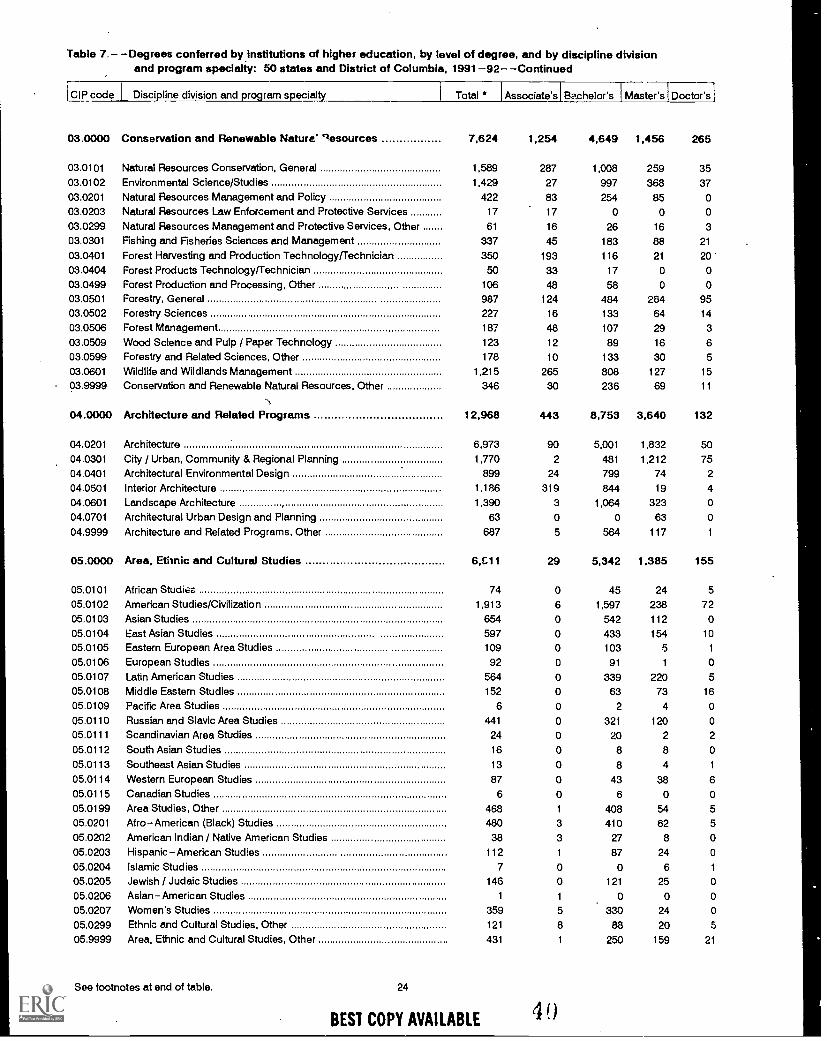
Table 7.- -Degrees conferred by.institutions of higher education, by level of degree, and by discipline divisionand program specialty: 50 states and District of Columbia, 1991-92- -Continued
I CIP code Discipline division and program specialty Total * Associate's Bachelor's Master's Doctor's
03.0000 Conservation and Renewable Nature' raesources 7,624 1,254 4,649 1,456 265
03.0101 Natural Resources Conservation, General 1,589 287 1,008 259 3503.0102 Environmental Science/Studies 1,429 27 997 368 37
03.0201 Natural Resources Management and Policy 422 83 254 85 003.0203 Natural Resources Law Enforcement and Protective Services 17 17 0 0 003.0299 Natural Resources Management and Protective Services, Other 61 16 26 16 3
03.0301 Fishing and Fisheries Sciences and Management 337 45 183 88 21
03.0401 Forest Harvesting and Production Technology/Technician 350 193 116 21 20
03.0404 Forest Products Technology/Technician 50 33 17 0 003.0499 Forest Production and Processing, Other 106 48 58 0 003.0501 Forestry, General 987 124 484 284 95
03.0502 Forestry Sciences 227 16 133 64 14
03.0506 Forest Management 187 48 107 29 303.0509 Wood Science and Pulp / Paper Technology 123 12 89 16 6
03.0599 Forestry and Related Sciences, Other 178 10 133 30 5
03.0601 Wildlife and Wildlands Management 1,215 265 808 127 15
03.9999 Conservation and Renewable Natural Resources, Other 3-46 30 236 69 11
\04.0000 Architecture and Related Programs 12,968 443 8,753 3,640 132
04.0201 Architecture 6,973 90 5,001 1,832 50
04.0301 City / Urban, Community & Regional Planning 1,770 2 481 1,212 7504.0401 Architectural Environmental Design 899 24 799 74 2
04.0501 Interior Architecture 1,186 319 844 19 4
04.0601 Landscape Architecture 1,390 3 1,064 323 0
04.0701 Architectural Urban Design and Planning 63 0 0 63 0
04.9999 Architecture and Related Programs, Other 687 5 564 117 1
05.0000 Area, Ethnic and Cultural Studies 6,C11 29 5,342 1,385 155
05.0101 African Studies 74 0 45 24 5
05.0102 American Studies/Civilization 1,913 6 1,597 238 72
05.0103 Asian Studies 654 0 542 112 0
05.0104 East Asian Studies 597 0 433 154 10
05.0105 Eastern European Area Studies 109 0 103 5 1
05.0106 European Studies 92 0 91 1 0
05.0107 Latin American Studies 564 0 339 220 5
05.0108 Middle Eastern Studies 152 0 63 73 16
05.0109 Pacific Area Studies 6 0 2 4 0
05.0110 Russian and Slavic Area Studies 441 0 321 120 0
05.0111 Scandinavian Area Studies 24 0 20 2 2
05.0112 South Asian Studies 16 0 8 8 0
05.0113 Southeast Asian Studies 13 0 8 4 1
05.0114 Western European Studies 87 0 43 38 6
05.0115 Canadian Studies 6 0 6 0 0
05.0199 Area Studies, Other 468 1 408 54 5
05.0201 Afro-American (Black) Studies 480 3 410 62 5
05.0202 American Indian / Native American Studies 38 3 27 8 0
05.0203 Hispanic -American Studies 112 1 87 24 0
05.0204 Islamic Studies 7 0 0 6 1
05.0205 Jewish / Judaic Studies 146 0 121 25 0
05.0206 Asian- American Studies 1 1 0 0 0
05.0207 Women's Studies 359 5 330 24 0
05.0299 Ethnic and Cultural Studies, Other 121 8 88 20 5
05.9999 Area, Ethnic and Cultural Studies, Other 431 1 250 159 21
See footnotes at end of table. 24
BEST COPY AVAILABLE 4 0
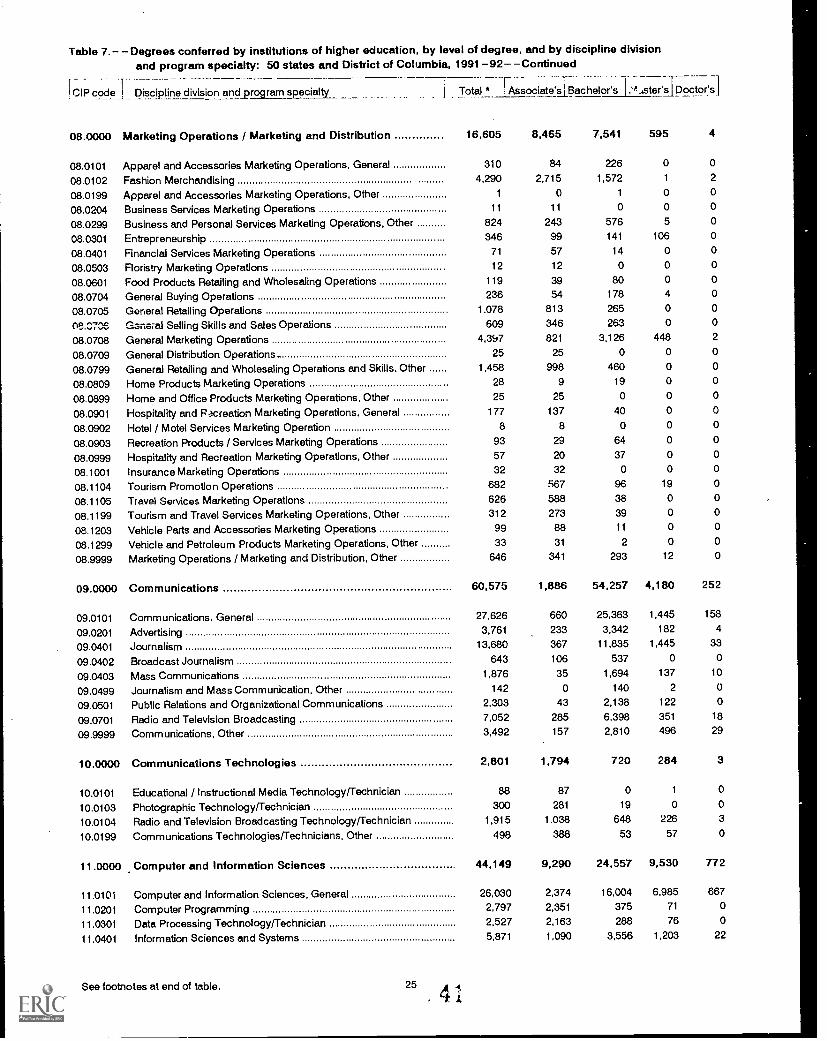
Table 7.- -Degrees conferred by institutions of higher education, by level of degree, and by discipline division
CIP code
and program specialty: 50 states and District of Columbia, 1991 -92- -Continued
Associate'sFBachelor's 1."ster'siDoctors]I Discipline division and pr_ram sRecialty -1" Total *
08.0000 Marketing Operations / Marketing and Distribution 16.605 8,465 7,541 595 4
08.0101 Apparel and Accessories Marketing Operations, General 310 84 226 0 0
08.0102 Fashion Merchandising 4,290 2,715 1,572 1 2
08.0199 Apparel and Accessories Marketing Operations, Other 1 0 1 0 0
08.0204 Business Services Marketing Operations 11 11 0 0 0
08.0299 Business and Personal Services Marketing Operations, Other 824 243 576 5 0
08.0301 Entrepreneurship 346 99 141 106 0
08.0401 Financial Services Marketing Operations 71 57 14 0 0
08.0503 Floristry Marketing Operations 12 12 0 0 0
08.0601 Food Products Retailing and Wholesaling Operations 119 39 80 0 0
08.0704 General Buying Operations 236 54 178 4 0
08.0705 General Retailing Operations 1,078 813 265 0 0
08.070e G.Griaral Selling Skills and Sales Operations 609 346 263 0 0
08.0708 General Marketing Operations 4,397 821 3,126 448 2
08.0709 General Distribution Operations 25 25 0 0 0
08.0799 General Retailing and Wholesaling Operations and Skills. Other 1,458 998 460 0 0
08.0809 Home Products Marketing Operations 28 9 19 0 0
08.0899 Home and Office Produc% Marketing Operations, Other 25 25 0 0 0
08.0901 Hospitality and Pacreation Marketing Operations, General 177 137 40 0 0
08.0902 Hotel / Motel Services Marketing Operation 8 8 0 0 0
08.0903 Recreation Products / Services Marketing Operations 93 29 64 0 0
08.0999 Hospitality and Recreation Marketing Operations, Other 57 20 37 0 0
08.1001 Insurance Marketing Operations 32 32 0 0 0
08.1104 Tourism Promotion Operations 682 567 96 19 0
08.1105 Travel Services Marketing Operations 626 588 38 0 0
08.1199 Tourism and Travel Services Marketing Operations, Other 312 273 39 0 0
08.1203 Vehicle Parts and Accessories Marketing Operations 99 88 11 0 0
08.1299 Vehicle and Petroleum Products Marketing Operations, Other 33 31 2 0 0
08.9999 Marketing Operations / Marketing and Distribution, Other 646 341 293 12 0
09.0000 Communications 60,575 1,886 54,257 4,180 252
09.0101 Communications, General 27,626 660 25,363 1,445 158
09.0201 Advertising 3,761 233 3,342 182 4
09.0401 Journalism 13,680 367 11,835 1,445 33
09.0402 Broadcast Journalism 643 106 537 0 0
09.0403 Mass Communications 1,876 35 1,694 137 10
09.0499 Journalism and Mass Communication, Other 142 0 140 2 0
09.0501 Public Relations and Organizational Communications 2,303 43 2,138 122 0
09.0701 Radio and Television Broadcasting 7,052 285 6,398 351 18
09.9999 Communications, Other 3,492 157 2,810 496 29
10.0000 Communications Technologies 2,801 1,794 720 284 3
10.0101 Educational / Instructional Media Technology/Technician 88 87 0 1 0
10.0103 Photographic Technology/Technician 300 281 19 0 0
10.0104 Radio and Television Broadcasting Technology/Technician 1,915 1.038 648 226 3
10.0199 Communications Technologies/Technicians, Other 498 388 53 57 0
11.0000 Computer and Information Sciences 44,149 9,290 24,557 9.530 772
11.0101 Computer and Information Sciences, General 26,030 2,374 16,004 6,985 667
11.0201 Computer Programming 2,797 2,351 375 71 0
11.0301 Data Processing Technology/Technician 2,527 2,163 288 76 0
11.0401 Information Sciences and Systems 5,871 1,090 3,556 1,203 22
See footnotes at end of table. 25
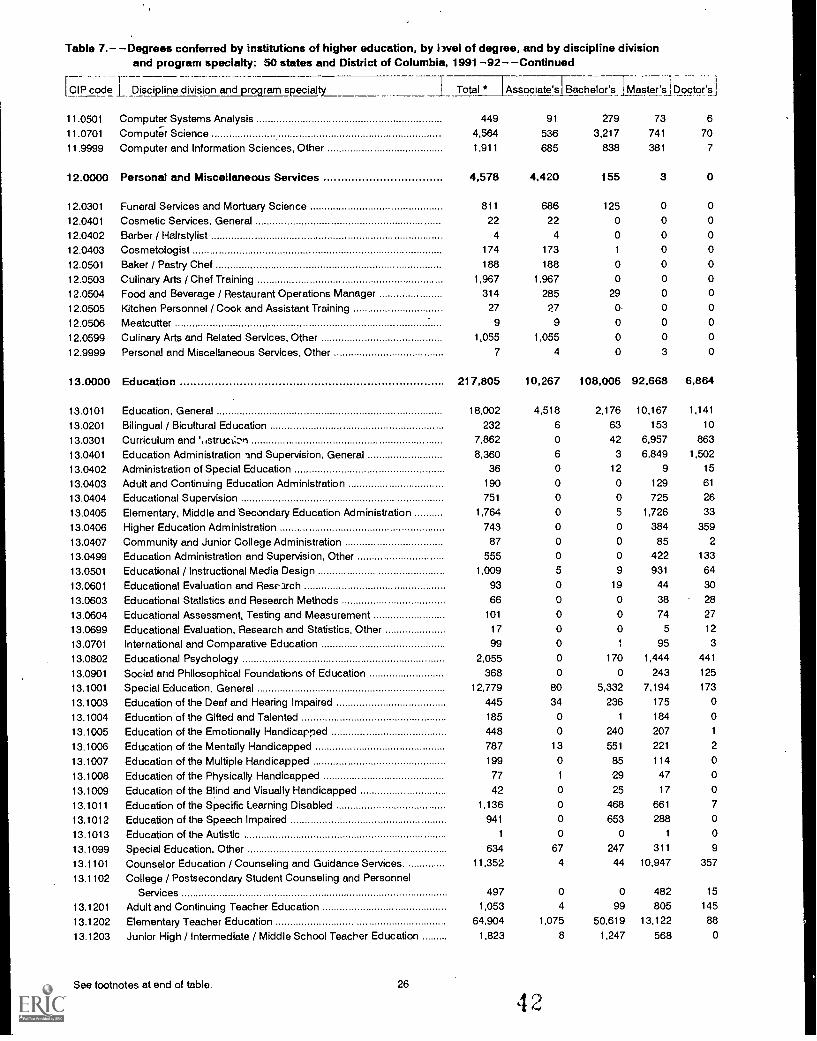
Table 7.- -Degrees conferred by institutions of higher education, by hvel of degree, and by discipline divisionand program specialty: 50 states and District of Columbia, 1991-92- -Continued
[CIP code Discipline division and program specialty Total * Associate's Bachelor's
11.0501 Computer Systems Analysis 449 91 279
11.0701 Comput& Science 4,564 536 3,217
11.9999 Computer and Information Sciences, Other 1911, 685 838
12.0000 Personal and Miscellaneous Services 4,578 4,420 155
12.0301 Funeral Services and Mortuary Science 811 686 125
12.0401 Cosmetic Services. General 22 22 0
12.0402 Barber / Hairstylist 4 4 0
12.0403 Cosmetologist 174 173 1
12.0501 Baker / Pastry Chef 188 188 0
12.0503 Culinary Arts / Chef Training 1,967 1,967 0
12.0504 Food and Beverage / Restaurant Operations Manager 314 285 29
12.0505 Kitchen Personnel / Cook and Assistant Training 27 27 0
12.0506 Meatcutter 9 9 0
12.0599 Culinary Arts and Related Services, Other 1,055 1,055 0
12.9999 Personal and Miscellaneous Services, Other 7 4 0
13.0000 Education 217,805 10,267 108,006
13.0101 Education. General 18,002 4,518 2,176
13.0201 Bilingual / Bicultural Education 232 6 63
13.0301 Curriculum and ',istruct:.?n 7,862 0 42
13.0401 Education Administration and Supervision. General 8,360 6 3
13.0402 Administration of Special Education 36 0 12
13.0403 Adult and Continuing Education Administration 190 0 0
13.0404 Educational Supervision 751 0 0
13.0405 Elementary. Middle and Secondary Education Administration 1,764 0 5
13.0406 Higher Education Administration 743 0 0
13.0407 Community and Junior College Administration 87 0 0
13.0499 Education Administration and Supervision. Other 555 0 0
13.0501 Educational / Instructional Media Design 1,009 5 9
13.0601 Educational Evaluation and Resc.arch 93 0 19
13.0603 Educational Statistics and Research Methods 66 0 0
13.0604 Educational Assessment, Testing and Measurement 101 0 0
13.0699 Educational Evaluation. Research and Statistics, Other 17 0 0
13.0701 International and Comparative Education 99 0 ' .
13.0802 Educational Psychology 2,055 0 170
13.0901 Social and Philosophical Foundations of Education 368 0 0
13.1001 Special Education, General 12.779 80 5.332
13.1003 Education of the Deaf and Hearing Impaired 445 34 236
13.1004 Education of the Gifted and Talented 185 0 1
13.1005 Education of the Emotionally Handicapped 448 0 240
13.1006 Education of the Mentally Handicapped 787 13 551
13.1007 Education of the Multiple Handicapped 199 0 85
13.1008 Education of the Physically Handicapped 77 1 29
13.1009 Education of the Blind and Visually Handicapped 42 0 25
13.1011 Education of the Specific Learning Disabled 1,136 0 468
13.1012 Education of the Speech Impaired 941 0 653
13.1013 Education of the Autistic 1 0 0
13.1099 Special Education. Other 634 67 247
13.1101 Counselor Education / Counseling and Guidance Services. 11,352 4 44
13.1102 College / Postsecondary Student Counseling and PersonnelServices 497 0 0
13.1201 Adult and Continuing Teacher Education 1,053 4 99
13.1202 Elementary Teacher Education 64,904 1,075 50,619
13.1203 Junior High / Intermediate / Middle School Teacher Education 1,823 8 1.247
See footnotes at end of table. 26
4 4,
1
Master:Al Doctor's]
73 6
741 70
381 7
3 0
0 0
0 0
0 0
0 0
0 0
0 0
0 0
0 0
0 0
0 0
3 0
92,668 6,864
10,167 1,141
153 10
6,957 863
6,849 1.502
9 15
129 61
725 26
1,726 33
384 359
85 2
422 133
931 64
44 30
38 28
74 27
5 12
95 3
1,444 441
243 125
7.194 173
175 0
184 0
207 1
221 2
114 0
47 0
17 0
661 7
288 0
1 0
311 9
10,947 357
482 15
805 145
13,122 88
568 0
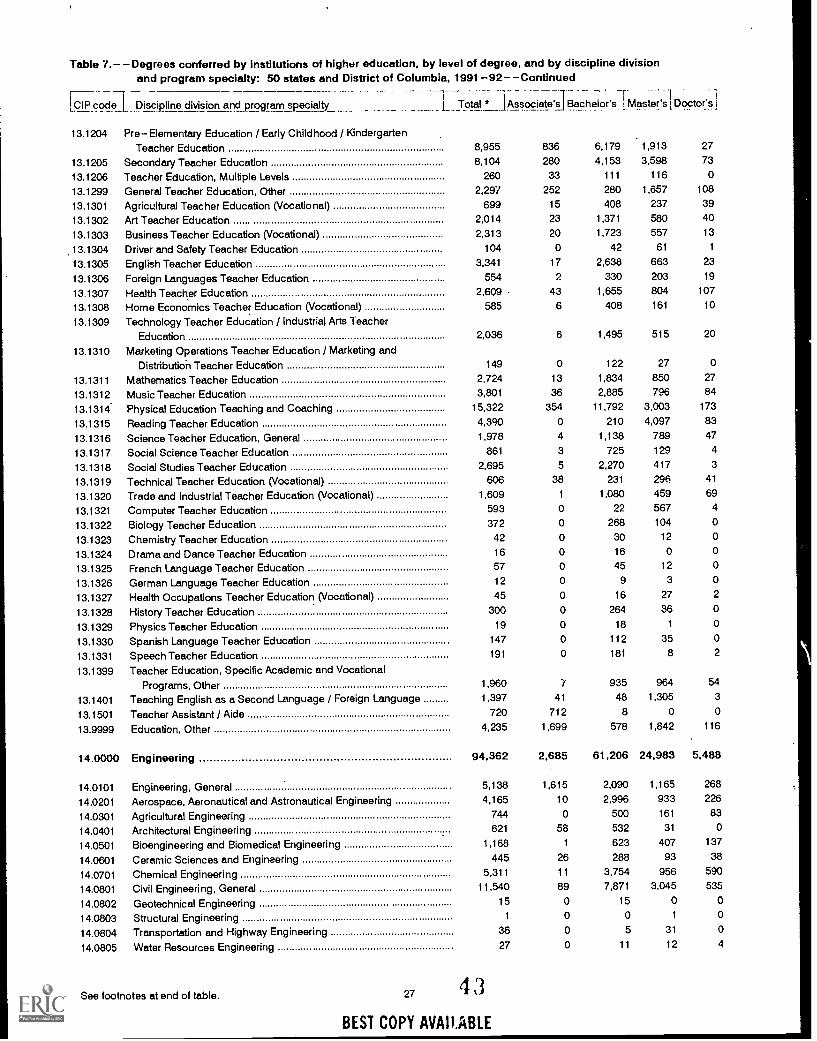
Table 7.- -Degrees conferred by institutions of higher education, by level of degree, and by discipline divisionand program specialty: 50 states and District of Columbia, 1991-92- -Continued
{-.&7:_code {_Discipline division anclprogrem specialty L_ Total* _..{Associate's1 Bachelor's_ {Master's I Doctor s
13.1204 Pre- Elementary Education / Early Childhood / KindergartenTeacher Education 8,955
13.1205 Secondary Teacher Education 8,104
13.1206 Teacher Education, Multiple Levels 260
13.1299 General Teacher Education, Other 2,297
13.1301 Agricultural Teacher Education (Vocational) 699
13.1302 Art Teacher Educaton 2,014
13.1303 Business Teacher Education (Vocational) 2,313
.13.1304 Driver and Safety Teacher Education 104
13.1305 English Teacher Education 3,341
13.1306 Foreign Languages Teacher Education 554
13.1307 Health Teacher Education 2,609
13.1308 Home Economics Teacher Education (Vocational) 585
13.1309 Technology Teacher Education / Industrial Arts TeacherEducation 2,036
13.1310 Marketing Operations Teacher Education / Marketing andDistribution Teacher Education 149
13.1311 Mathematics Teacher Education 2,724
13.1312 Music Teacher Education 3,801
13.1314 Physical Education Teaching and Coaching 15,322
13.1315 Reading Teacher Education 4,390
13.1316 Science Teacher Education, General 1,978
13.1317 Social Science Teacher Education 861
13.1318 Social Studies Teacher Education 2,695
13.1319 Technical Teacher Education (Vocational) 606
13.1320 Trade and Industrial Teacher Education (Vocational) 1,609
13.1321 Computer Teacher Education 593
13.1322 Biology Teacher Education 372
13.1323 Chemistry Teacher Education 42
13.1324 Drama and Dance Teacher Education 16
13.1325 French Language Teacher Education 57
13.1326 German Language Teacher Education 12
13.1327 Health Occupations Teacher Education (Vocational) 45
13.1328 History Teacher Education 300
13.1329 Physics Teacher Education 19
13.1330 Spanish Language Teacher Education 147
13.1331 Speech Teacher Education 191
13.1399 Teacher Education, Specific Academic and VocationalPrograms, Other 1,960
13.1401 Teaching English as a Second Language / Foreign Language 1,397
13.1501 Teacher Assistant / Aide 720
13.9999 Education, Other 4,235
14.0000 Engineering 94,362
14.0101 Engineering, General 5,138
14.0201 Aerospace, Aeronautical and Astronautical Engineering 4,165
14.0301 Agricultural Engineering 744
14.0401 Architectural Engineering 621
14.0501 Bioengineering and Biomedical Engineering 1,168
14.0601 Ceramic Sciences and Engineering 445
14.0701 Chemical Engineering 5,311
14.0801 Civil Engineering, General 11,540
14.0802 Geotechnical Engineering 15
14.0803 Structural Engineering 1
14.0804 Transportation and Highway Engineering 36
14.0805 Water Resources Engineering 27
See footnotes at end of table. 27 4 3
BEST COPY AVAII.ABLE
836 6,179 1,913 27
280 4,153 3,598 73
33 111 116 0
252 280 1,657 108
15 408 237 39
23 1,371 580 40
20 1,723 557 13
0 42 61 1
17 2,638 663 23
2 330 203 19
43 1,655 804 107
6 408 161 10
6 1,495 515 20
0 122 27 0
13 1,834 850 27
36 2,885 796 84
354 11,792 3,003 173
0 210 4,097 83
4 1,138 789 47
3 725 129 4
5 2,270 417 3
38 231 296 41
1 1,080 459 69
0 22 567 4
0 268 104 0
0 30 12 0
0 16 0 0
0 45 12 0
0 9 3 0
0 16 27 2
0 264 36 0
0 18 1 0
0 112 35 0
0 181 8 2
7 935 964 54
41 48 1,305 3
712 8 0 0
1,699 578 1,842 116
2,685 61,206 24,983 5,488
1,615 2,090 1,165 268
10 2,996 933 226
0 500 161 83
58 532 31 0
1 623 407 137
26 288 93 38
11 3,754 956 590
89 7,871 3,045 535
0 15 0 0
0 0 1 0
0 5 31 0
0 11 12 4
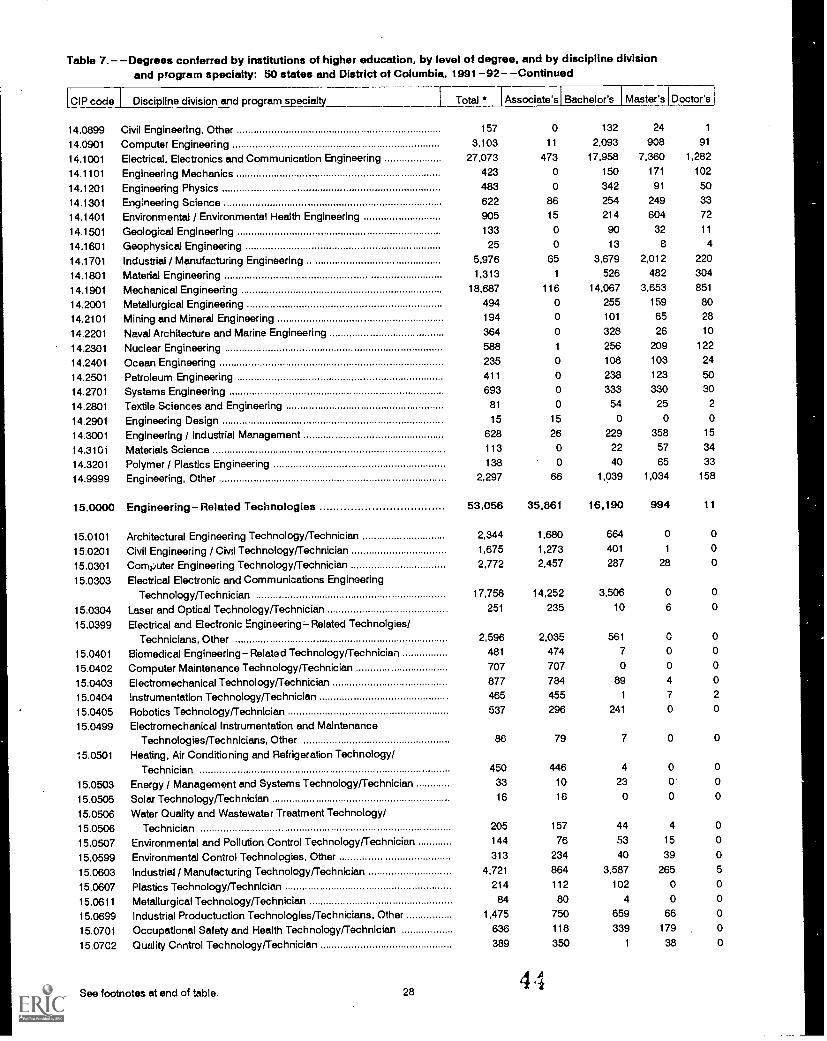
Table 7.- -Degrees conferred by institutions of higher education, by level of degree, and by discipline divisionand program specialty: 50 states and District of Columbia, 1991-92- -Continued
[-GIP code Discipline division and program specialty LTotal Associate's Bachelor's Master's Doctc7r;1
14.0899 Civil Engineering, Other 157 0 132 24 1
14.0901 Computer Engineering 3,103 11 2,093 908 91
14.1001 Electrical, Electronics and Communication Engineering 27,073 473 17,958 7,360 1,282
14.1101 Engineering Mechanics 423 0 150 171 102
14.1201 Engineering Physics 483 0 342 91 50
14.1301 Engineering Science 622 86 254 249 33
14.1401 Environmental / Environmental Health Engineering 905 15 214 604 72
14.1501 Geological Engineering 133 0 90 32 11
14.1601 Geophysical Engineering 25 0 13 8 4
14.1701 Industrial / Manufacturing Engineering 5,976 65 3,679 2,012 220
14.1801 Material Engineering 1,313 1 526 482 304
14.1901 Mechanical Engineering 18,687 116 14,067 3,653 851
14.2001 Metallurgical Engineering 494 0 255 159 80
14.2101 Mining and Mineral Engineering 194 0 101 65 28
14.2201 Naval Architecture and Marine Engineering 364 0 328 26 10
14.2301 Nuclear Engineering 588 1 256 209 122
14.2401 Ocean Engineering 235 0 108 103 24
14.2501 Petroleum Engineering 411 0 238 123 50
14.2701 Systems Engineering 693 0 333 330 30
14.2801 Textile Sciences and Engineering 81 0 54 25 2
14.2901 Engineering Design 15 15 0 0 0
14.3001 Engineering / Industrial Management 628 26 229 358 15
14.3101 Materials Science 113 0 22 57 34
14.3201 Polymer / Plastics Engineering 138 0 40 65 33
14.9999 Engineering, Other 2,297 66 1,039 1,034 158
15.0000 Engineering-Related Technologies 53,056 35,861 16,190 994 11
15.0101 Architectural Engineering Technology/Technician 2,344 1,680 664 0 0
15.0201 Civil Engineering / Civil Technology/Technician 1,675 1,273 401 1 0
15.0301 Computer Engineering Technology/Technician 2,772 2,457 287 28 0
15.0303 Electrical Electronic and Communications EngineeringTechnology/Technician 17,758 14,252 3,506 0 0
15.0304 Laser and Optical Technology/Technician 251 235 10 6 0
15.0399 Electrical and Electronic Engineering Related Technolgies/
Technicians, Other 2,596 2,035 561 0 0
15.0401 Biomedical Engineering-Related Technology/Technician 481 474 7 0 0
15.0402 Computer Maintenance Technology/Technician 707 707 0 0 0
15.0403 Electromechanical Technology/Technician 877 784 89 4 0
15.0404 Instrumentation TechnologyfTechnician 465 455 1 7 2
15.0405 Robotics Technology/Technician 537 296 241 0 0
15.0499 Electromechanical Instrumentation and MaintenanceTechnologies/Technicians, Other 86 79 7 0 0
15.0501 Heating, Air Conditioning and Refrigeration Technology/Technician 450 446 4 0 0
15.0503 Energy / Management and Systems Technology/Technician 33 10 23 0 0
15.0505 Solar Technology/Technician 16 16 0 0 0
15.0506 Water Quality and Wastewater Treatment Technology/15.0506 Technician 205 157 44 4 0
15.0507 Environmental and Pollution Control Technology/Technician 144 76 53 15 0
15.0599 Environmental Control Technologies, Other 313 234 40 39 0
15.0603 Industrial / Manufacturing Technology/Technician 4,721 864 3,587 265 5
15.0607 Plastics Technology/Technician 214 112 102 0 0
15.0611 Metallurgical Technology/Technician 84 80 4 0 0
15.0699 Industrial Productuction Technologies/Technicians, Other 1,475 750 659 66 0
15.0701 Occupational Safety and Health Technology/Technician 636 118 339 179 0
15.07C2 Quality Control TechnologyfTechnician 389 350 1 38 0
4,1See footnotes at end of table. 28
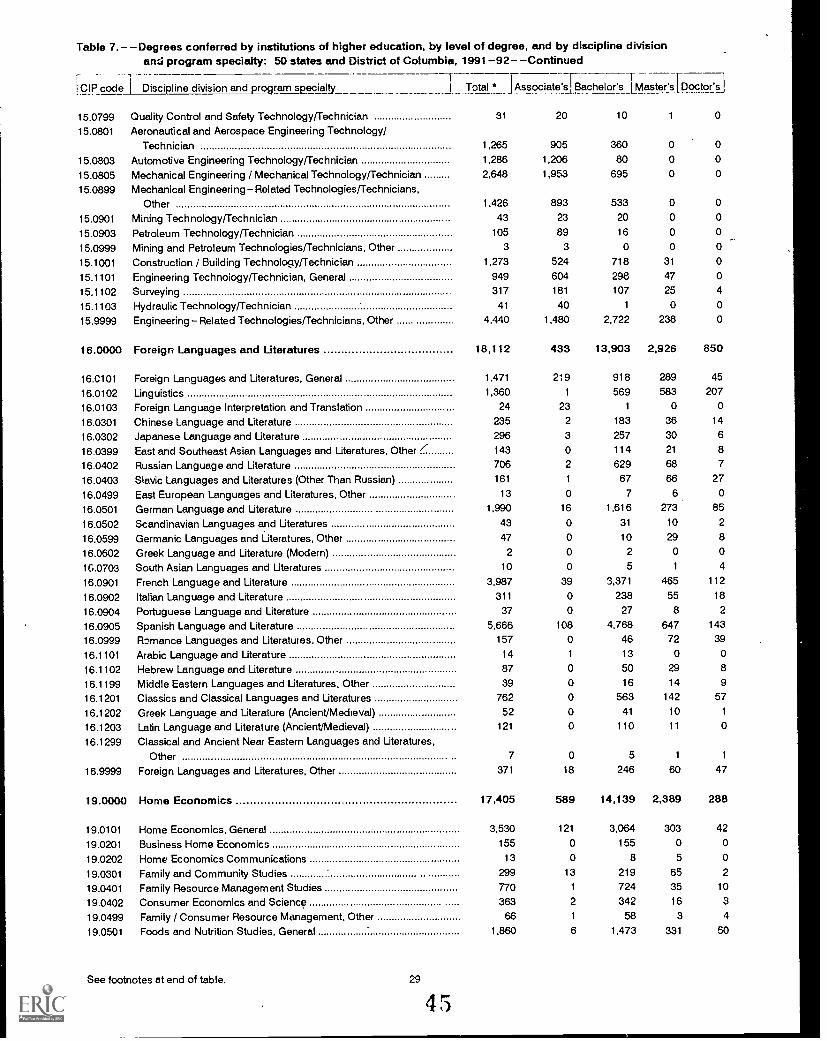
Table 7.- -Degrees conferred by institutions of higher education, by level of degree, and by discipline divisionand program specialty: 50 states and District of Columbia, 1991 -92- -Continued
1-1-CIP code I Discipline division and program specialty Total * FAssociate's[Bachelor's L.Master's1Doct;:si
15.0799 Quality Control and Safety Technologyfrechnician 31 20
15.0801 Aeronautical and Aerospace Engineering Technology/Technician 1,265 905
15.0803 Automotive Engineering Technology/Technician 1,286 1,206
15.0805 Mechanical Engineering / Mechanical Technology/Technician 2,648 1,953
15.0899 Mechanical Engineering-Related Technologies/Technicians,Other 1,426 893
15.0901 Mining TechnologyfTechnician 43 23
15.0903 Petroleum Technology/Technician 105 89
15.0999 Mining and Petroleum Technologies/Technicians, Other 3 3
15.1001 Construction / Building Technology/Technician 1,273 524
15.1101 Engineering Technoiogy/Technician, General 949 604
15.1102 Surveying 317 181
15.1103 Hydraulic Technologyfrec hnician 41 40
15.9999 Engineering-Related Technologies/Technicians, Other 4,440 1,480
16.0000 Foreign Languages and Literatures 18,112 433
16.0101 Foreign Languages and Literatures, General 1,471 219
16.0102 Linguistics 1,360 1
16.0103 Foreign Language Interpretation and Translation 24 23
16.0301 Chinese Language and Literature 235 2
16.0302 Japanese Language and Literature 296 3
16.0399 East and Southeast Asian Languages and Literatures, Other / 143 0
16.0402 Russian Language and Literature 706 2
16.0403 Slavic Languages and Literatures (Other Than Russian) 161 1
16.0499 East European Languages and Literatures, Other 13 0
16.0501 German Language and Literature 1,990 16
16.0502 Scandinavian Languages and Literatures 43 0
16.0599 Germanic Languages and Literatures, Other 47 0
16.0602 Greek Language and Literature (Modern) 2 0
16.0703 South Asian Languages and Literatures 10 0
16.0901 French Language and Literature 3,987 39
16.0902 Italian Language and Literature 311 0
16.0904 Portuguese Language and Literature 37 0
16.0905 Spanish Language and Literature 5,666 108
16.0999 %mance Languages and Literatuies. Other 157 0
16.1101 Arabic Language and Literature 14 1
16.1102 Hebrew Language and Literature 87 0
16.1199 Middle Eastern Languages and Literatures, Other 39 0
16.1201 Classics and Classical Languages and Literatures 762 0
16.1202 Greek Language and Literature (Ancient/Medieval) 52 0
16.1203 Latin Language and Literature (Ancient/Medieval) 121 0
16.1299 Classical and Ancient Near Eastern Languages and Literatures.Other 7 0
16.9999 Foreign Languages and Literatures, Other 371 18
19.0000 Home Economics 17,405 589
19.0101 Home Economics, General 3,530 121
19.0201 Business Home Economics 155 0
19.0202 Home Economics Communications 13 0
19.0301 Family and Community Studies 299 13
19.0401 Family Resource Management Studies 770 1
19.0402 Consumer Economics and Science 363 2
19.0499 Family / Consumer Resource Management, Other 66 1
19.0501 Foods and Nutrition Studies, General 1,860 6
See footnotes at end of table. 29
4 5
10 1 0
360 0 0
80 0 0
695 0 0
533 0 020 0 0
16 0 0
0 0 0
718 31 0
298 47 0
107 25 4
1 0 0
2,722 238 0
13,903 2,926 850
918 289 45
569 583 207
1 0 0
183 36 14
257 30 6
114 21 8
629 68 7
67 66 27
7 6 0
1,616 273 85
31 10 2
10 29 8
2 0 0
5 1 4
3,371 465 112
238 55 18
27 8 2
4,768 647 143
46 72 39
13 0 0
50 29 8
16 14 9
563 142 57
41 10 1
110 11 0
5 1 1
246 60 47
14,139 2,389 288
3,064 303 42
155 0 0
8 5 0
219 65 2
724 35 10
342 16 3
58 3 4
1 ,473 331 50
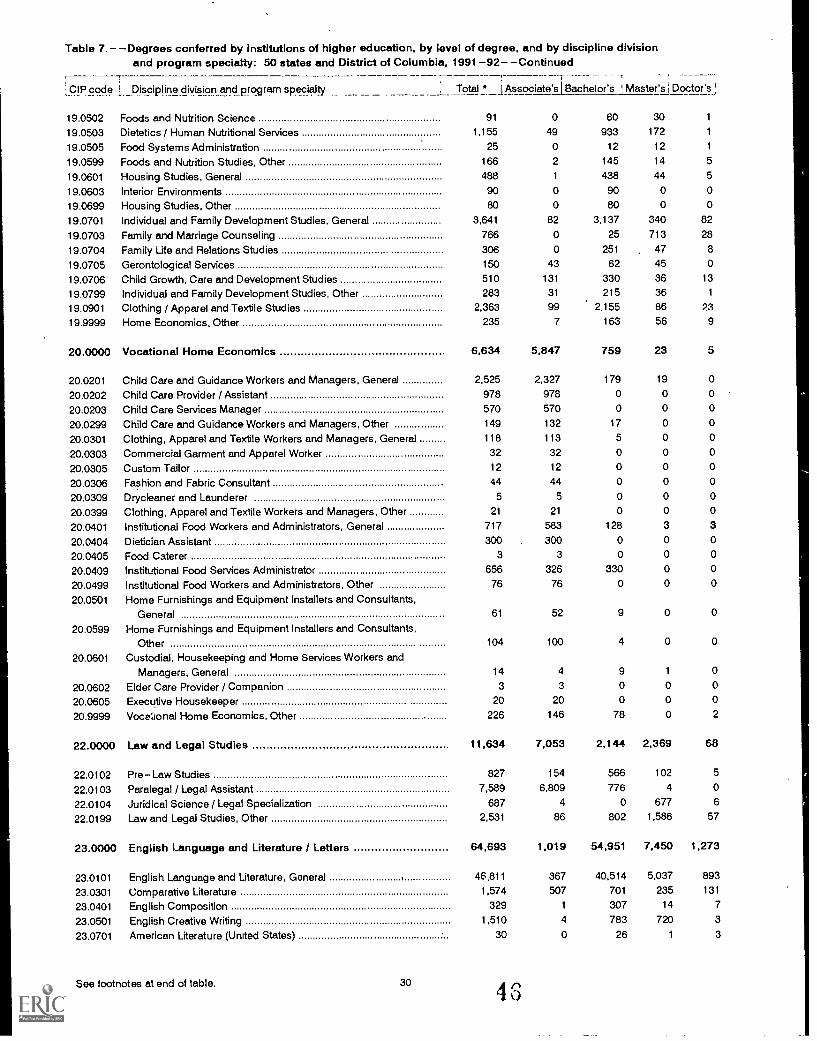
Table 7.- -Degrees conferred by institutions of higher education, by level of degree, and by discipline divisionand program specialty: 50 states and District of Columbia, 1991-92- -Continued
CIP code I. Discipline division and program specialty Total * lAssociate'sTBachelor's ' Master's Doctor's
19.0502 Foods and Nutrition Science 91
19.0503 Dietetics / Human Nutritional Services 1,155
19.0505 Food Systems Administration 25
19.0599 Foods and Nutrition Studies, Other 166
19.0601 Housing Studies, General 488
19.0603 Interior Environments 90
19.0699 Housing Studies, Other 80
19.0701 Individual and Family Development Studies, General 3,641
19.0703 Family and Marriage Counseling 766
19.0704 Family Life and Relations Studies 306
19.0705 Gerontological Services 150
19.0706 Child Growth, Care and Development Studies 510
19.0799 Individual and Family Development Studies, Other 283
19.0901 Clothing / Apparel and Textile Studies 2,363
19.9999 Home Economics, Other 235
20.0000 Vocational Home Economics 6,634
20.0201 Child Care and Guidance Workers and Managers. General 2,525
20.0202 Child Care Provider / Assistant 978
20.0203 Child Care Services Manager 570
20.0299 Child Care and Guidance Workers and Managers, Other 149
20.0301 Clothing, Apparel and Textile Workers and Managers, General 118
20.0303 Commercial Garment and Apparel Worker 32
20.0305 Custom Tailor 12
20.0306 Fashion and Fabric Consultant 44
20.0309 Drycleaner and Launderer 5
20.0399 Clothing, Apparel and Textile Workers and Managers. Other 21
20.0401 Institutional Food Workers and Administrators, General 717
20.0404 Dietician Assistant 300
20.0405 Food Caterer 3
20.0409 Institutional Food Services Administrator 656
20.0499 Institutional Food Workers and Administrators, Other 76
20.0501 Home Furnishings and Equipment Installers and Consultants,General 61
20.0599 Home Furnishings and Equipment Installers and Consultants,Other 104
20.0601 Custodial, Housekeeping and Home Services Workers andManagers, General 14
20.0602 Elder Care Provider / Companion 3
20.0605 Executive Housekeeper 20
20.9999 Voce'ional Home Economics, Other 226
22.0000 Law and Legal Studies 11,634
22.0102 Pre- Law Studies 827
22.0103 Paralegal / Legal Assistant 7,589
22.0104 Juridical Science / Legal Specialization 687
22.0199 Law and Legal Studies, Other 2,531
23.0000 English Language and Literature / Letters 64,693
23.0101 English Language and Literature, General , 46.811
23.0301 Comparative Literature 1,574
23.0401 English Composition 329
23.0501 English Creative Writing 1,510
23.0701 American Literature (United States) 30
See footnotes at end of table. 304 3
0 60 30 1
49 933 172 1
0 12 12 1
2 145 14 5
1 438 44 5
0 90 0 0
0 80 0 0
82 3,137 340 82
0 25 713 28
0 251 47 8
43 62 45 0
131 330 36 13
31 215 36 1
99 2,155 86 23
7 163 56 9
5,847 759 23 5
2,327 179 19 0
978 0 0 0
570 0 0 0
132 17 0 0
113 5 0 0
32 0 0 0
12 0 0 0
44 0 0 0
5 0 0 0
21 0 0 0
583 128 3 3
300 0 0 0
3 0 0 0
326 330 0 0
76 0 0 0
52 9 0 0
100 4 0 0
4 9 1 0
3 0 0 0
20 0 0 0
146 78 0 2
7,053 2,144 2,369 68
154 566 102 5
6,809 776 4 0
4 0 677 6
86 802 1,586 57
1,019 54,951 7,450 1,273
367 40,514 5,037 893
507 701 235 131
1 307 14 7
4 783 720 3
0 26 1 3
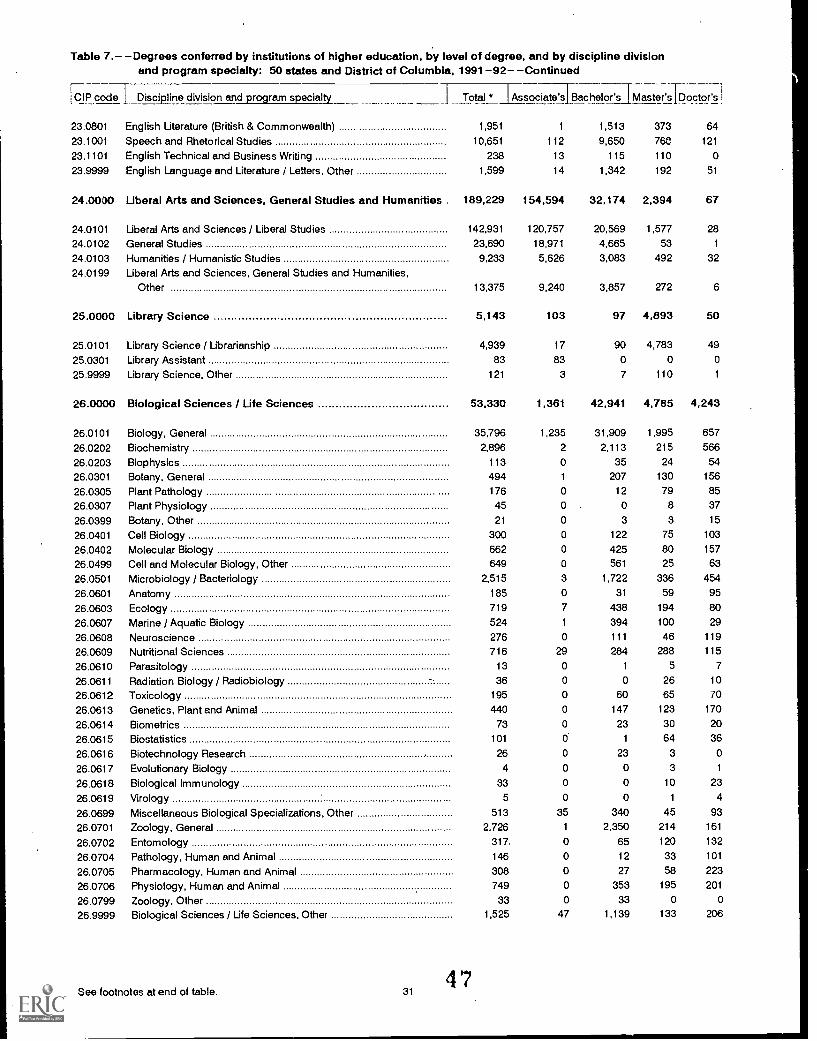
Table 7.- -Degrees conferred by institutions of higher education, by level of degree, and by discipline divisionand program specialty: 50 states and District of Columbia, 1991 -92- -Continued
CIP code t Discipline division and program specialty Total * Associate's] Bachelors1Master's l Doctor's!
23.0801 English Literature (British & Commonwealth) 1,951 1 1,513 373 64
23.1001 Speech and Rhetorical Studies 10,651 112 9,650 ne 121
23.1101 English Technical and Business Writing 238 13 115 110 0
23.9999 English Language and Literature / Letters, Other 1,599 14 1,342 192 51
24.0000 Liberal Arts and Sciences, General Studies and Humanities . 189,229 154,594 32,174 2,394 67
24.0101 Liberal Arts and Sciences / Liberal Studies 142,931 120,757 20,569 1,577 28
24.0102 General Studies 23,690 18,971 4,665 53 1
24.0103 Humanities / Humanistic Studies 9,233 5,626 3,083 492 32
24.0199 Liberal Arts and Sciences, General Studies and Humanities,Other 13,375 9,240 3,857 272 6
25.0000 Library Science 5,143 103 97 4,893 50
25.0101 Library Science / Librarianship 4,939 17 90 4,783 49
25.0301 Library Assistant 83 83 0 0 0
25.9999 Library Science, Other 121 3 7 110 1
26.0000 Biological Sciences / Life Sciences 53,330 1,361 42.941 4,785 4,243
26.0101 Biology, General 35,796 1,235 31,909 1,995 657
26.0202 Biochemistry 2,896 2 2,113 215 566
26.0203 Biophysics 113 0 35 24 54
26.0301 Botany, General 494 1 207 130 156
26.0305 Plant Pathology 176 0 12 79 85
26.0307 Plant Physiology 45 0 0 8 37
26.0399 Botany, Other 21 0 3 3 15
26.0401 Cell Biology 300 0 122 75 103
26.0402 Molecular Biology 662 0 425 80 157
26.0499 Cell and Molecular Biology, Other 649 0 561 25 63
26.0501 Microbiology / Bacteriology 2,515 3 1,722 336 454
26.0601 Anatomy 185 0 31 59 95
26.0603 Ecology 719 7 438 194 80
26.0607 Marine / Aquatic Biology 524 1 394 100 29
26.0608 Neuroscience 276 0 111 46 119
26.0609 Nutritional Sciences 716 29 284 288 115
26.0610 Parasitology 13 0 1 5 7
26.0611 Radiation Biology / Radiobiology 36 0 0 26 10
26.0612 Toxicology 195 0 60 65 70
26.0613 Genetics, Plant and Animal 440 0 147 123 170
26.0614 Biometrics 73 0 23 30 20
26.0615 Biostatistics 101 0' 1 64 36
26.0616 Biotechnology Research 26 0 23 3 0
26.0617 Evolutionary Biology 4 0 0 3 1
26.0618 Biological Immunology 33 0 0 10 23
26.0619 Virology 5 0 0 1 4
26.0699 Miscellaneous Biological Specializations, Other 513 35 340 45 93
26.0701 Zoology, General 2,726 1 2,350 214 161
26.0702 Entomology 317. 0 65 120 132
26.0704 Pathology, Human and Animal 146 0 12 33 101
26.0705 Pharmacology, Human and Animal 308 0 27 58 223
26.0706 Physiology, Human and Animal 749 0 353 195 201
26.0799 Zoology, Other 33 0 33 0 0
26.9999 Biological Sciences / Life Sciences, Other 1,525 47 1,139 133 206
See footnotes at end of table. 314 7
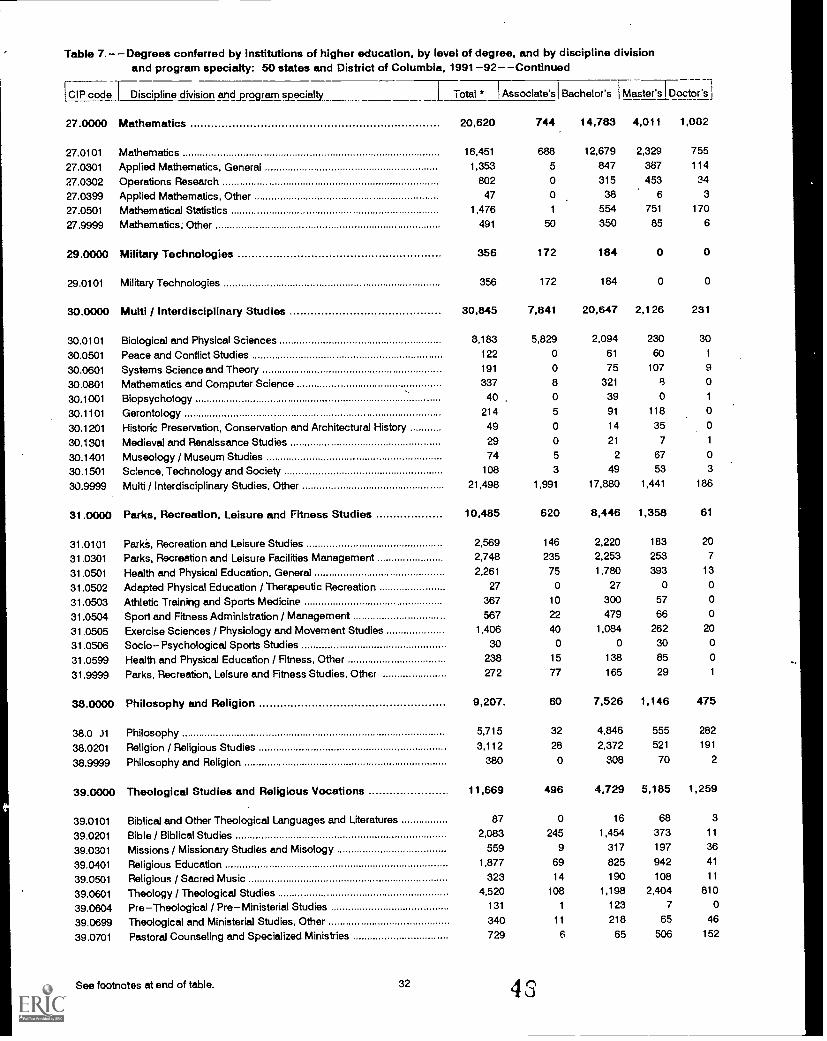
Table 7.- -Degrees conferred by institutions of higher education, by level of degree, and by discipline division
code
and program specialty: 50 states and District of Columbia, 1991 -92- -Continued
Discipline division anciprogram specialty7--
Total * Ass oc i ate's I Bachelor's [Master's I Doctor's]
27.0000 Mathematics 20,620 744 14,783 4,011 1,082
27.0101 Mathematics 16,451 688 12.679 2,329 755
27.0301 Applied Mathematics, General 1,353 5 847 387 114
27.0302 Operations Research 802 0 315 453 34
27.0399 Applied Mathematics, Other 47 0 38 6 3
27.0501 Mathematical Statistics 1,476 1 554 751 170
27.9999 Mathematics, Other 491 50 350 85 6
29.0000 Military Technologies 356 172 184 0 0
29.0101 Military Technologies 356 172 184 0 0
30.0000 Multi / Interdisciplinary Studies 30,845 7,841 20.647 2,126 231
30.0101 Biological and Physical Sciences 8,183 5,829 2,094 230 30
30.0501 Peace and Conflict Studies 122 0 61 60 1
30.0601 Systems Science and Theory 191 0 75 107 9
30.0801 Mathematics and Computer Science 337 8 321 i3 0
30.1001 Biopsychology 40 0 39 0 1
30.1101 Gerontology 214 5 91 118 0
30.1201 Historic Preservation, Conservation and Architectural History 49 0 14 35 0
30.1301 Medieval and Renaissance Studies 29 0 21 7 1
30.1401 Museology / Museum Studies 74 5 2 67 0
30.1501 Science, Technology and Society 108 3 49 53 3
30.9999 Multi / Interdisciplinary Studies, Other 21,498 1,991 17,880 1,441 186
31.0000 Parks, Recreation, Leisure and Fitness Studies 10,485 620 8,446 1,358 61
31.0101 Park, Recreation and Leisure Studies 2,569 146 2,220 183 20
31.0301 Parks, Recreation and Leisure Facilities Management 2,748 235 2,253 253 7
31.0501 Health and Physical Education, General 2,261 75 1,780 393 13
31.0502 Adapted Physical Education / Therapeutic Recreation 27 0 27 0 0
31.0503 Athletic Training and Sports Medicine 367 10 300 57 0
31.0504 Sport and Fitness Administration / Management 567 22 479 66 0
31.0505 Exercise Sciences / Physiology and Movement Studies 1,406 40 1.084 262 20
31.0506 Socio- Psychological Sports Studies 30 0 0 30 0
31.0599 Health and Physical Education / Fitness, Other 238 15 138 85 0
31.9999 Parks, Recreation, Leisure and Fitness Studies, Other 272 77 165 29 1
38.0000 Philosophy and Religion 9,207. 60 7,526 1,146 475
38.0 31 Philosophy 5,715 32 4,846 555 282
38.0201 Religion / Religious Studies 3,112 28 2,372 521 191
38.9999 Philosophy and Religion 380 0 308 70 2
39.0000 Theological Studies and Religious Vocations 11,669 496 4,729 5,185 1,259
39.0101 Biblical and Other Theological Languages and Literatures 87 0 16 68 3
39.0201 Bible / Biblical Studies 2083, 245 1,454 373 11
39.0301 Missions / Missionary Studies and Misology 559 9 317 197 36
39.0401 Religious Education 1,877 69 825 942 41
39.0501 Religious / Sacred Music 323 14 190 108 11
39.0601 Theology / Theological Studies 4,520 108 1,198 2,404 810
39.0604 Pre-Theological / Pre-Ministerial Studies 131 1 123 7 0
39.0699 Theological and Ministerial Studies, Other 340 11 218 65 46
39.0701 Pastoral Counseling and Specialized Ministries 729 6 65 506 152
See footnotes at end of table. 32 43
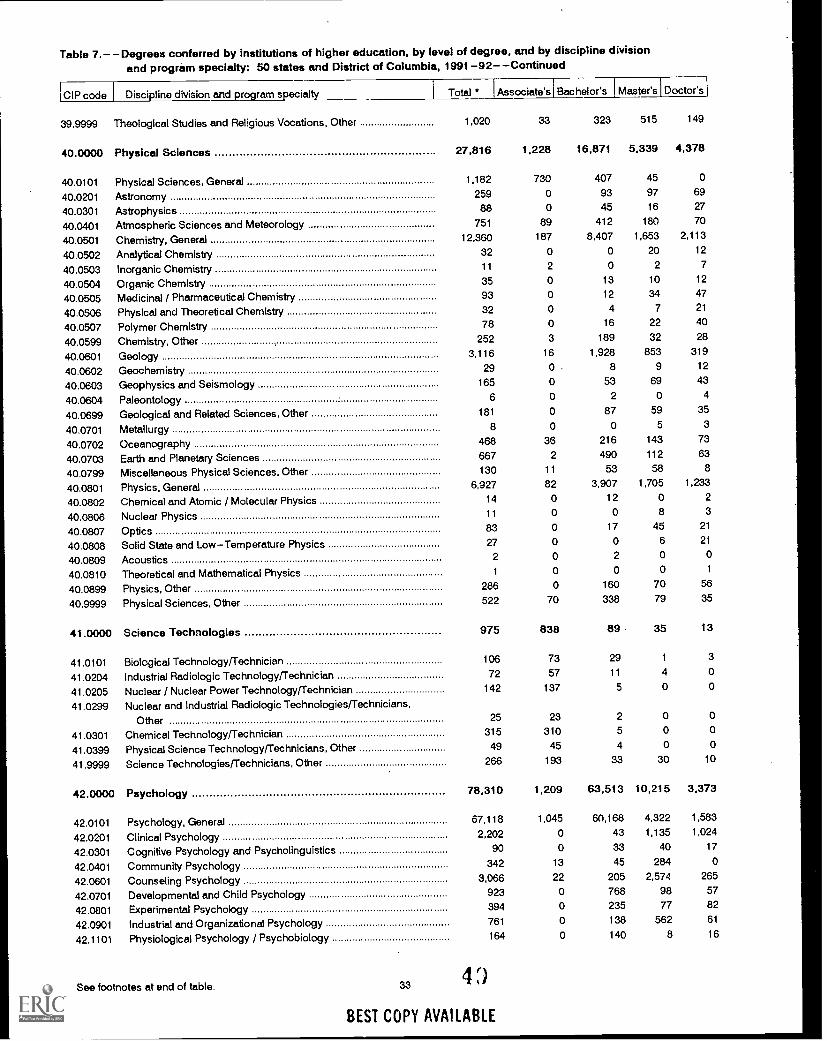
Table 7.- -Degrees conferred by institutions of higher education, by level of degree, and by discipline divisionand program specialty: 50 states and District of Columbia, 1991-92- -Continued
1CIP code Discipline division and program specialty Total * Associate's Bachelor's I Master's Doctor's
39.9999 Theological Studies and Religious Vocations, Other 1,020 33 323 515 149
40.0000 Physical Sciences 27,816 1,228 16,871 5,339 4,378
40.0101 Physical Sciences, General 1,182 730 407 45 0
40.0201 Astronomy 259 0 93 97 69
40.0301 Astrophysics 88 0 45 16 27
40.0401 Atmospheric Sciences and Meteorology 751 89 412 180 70
40.0501 Chemistry, General 12,360 187 8,407 1,653 2,113
40.0502 Analytical Chemistry 32 0 0 20 12
40.0503 Inorganic Chemistry 11 2 0 2 7
40.0504 Organic Chemistry 35 0 13 10 12
40.0505 Medicinal / Pharmaceutical Chemistry 93 0 12 34 47
40.0506 Physical and Theoretical Chemistry 32 0 4 7 21
40.0507 Polymer Chemistry 78 0 16 22 40
40.0599 Chemistry, Other 252 3 189 32 28
40.0601 Geology 3.116 16 1,928 853 319
40.0602 Geochemistry 29 0 . 8 9 12
40.0603 Geophysics and Seismology 165 0 53 69 43
40.0604 Paleontology 6 0 2 0 4
40.0699 Geological and Related Sciences, Other 181 0 87 59 35
40.0701 Metallurgy 8 0 0 5 3
40.0702 Oceanography 468 36 216 143 73
40.0703 Earth and Planetary Sciences 667 2 490 112 63
40.0799 Miscellaneous Physical Sciences, Other 130 11 53 58 8
40.0801 Physics, General 6,927 82 3,907 1,705 1,233
40.0802 Chemical and Atomic / Molecular Physics 14 0 12 0 2
40.0806 Nuclear Physics 11 0 0 8 3
40.0807 Optics 83 0 17 45 21
40.0808 Solid State and Low-Temperature Physics 27 0 0 6 21
40.0809 Acoustics 2 0 2 0 0
40.0810 Theoretical and Mathematical Physics 1 0 0 0 1
40.0899 Physics, Other 286 0 160 70 56
40.9999 Physical Sciences, Other 522 70 338 79 35
41.0000 Science Technologies 975 838 89 35 13
41.0101 Biological Technology/Technician 106 73 29 1 3
41.0204 Industrial Radiologic Technology/Technician 72 57 11 4 0
41.0205 Nuclear / Nuclear Power Technology/Technician 142 137 5 0 0
41.0299 Nuclear and Industrial Radiologic Technologies/Technicians,Other 25 23 2 0 0
41.0301 Chemical TechnologyfTechnician 315 310 5 0 0
41.0399 Physical Science TechnologyfTechnicians, Other 49 45 4 0 0
41.9999 Science Technologies/Technicians, Other 266 193 33 30 10
42.0000 Psychology 78,310 1,209 63.513 10,215 3,373
42.0101 Psychology, General 67,118 1,045 60,168 4,322 1.583
42.0201 Clinical Psychology 2,202 0 43 1,135 1,024
42.0301 Cognitive Psychology and Psycholinguistics 90 0 33 40 17
42.0401 Community Psychology 342 13 45 284 0
42.0601 Counseling Psychology 3,066 22 205 2,574 265
42.0701 Developmental and Child Psychology 923 0 768 98 57
42.0801 Experimental Psychology 394 0 235 77 82
42.0901 Industrial and Organizational Psychology 761 0 138 562 61
42.1101 Physiological Psychology / Psychobiology 164 0 140 8 16
See footnotes at end of table. 33 4 ;)
BEST COPY AVAILABLE
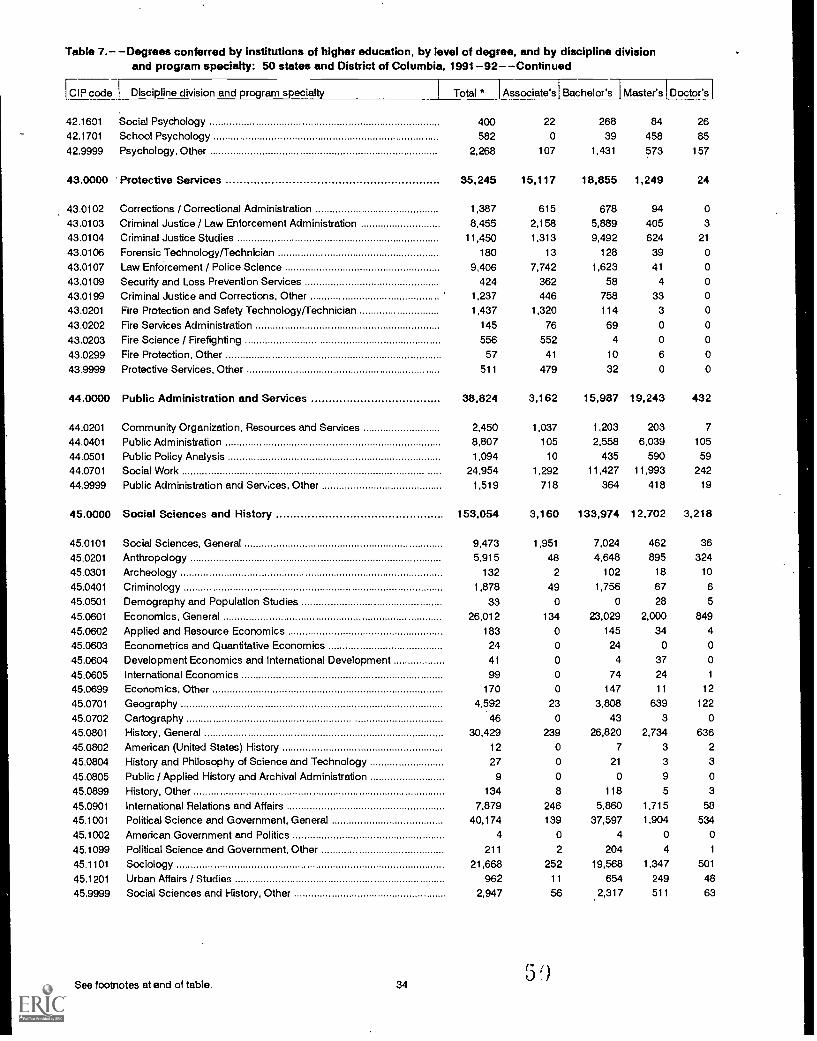
Table 7.- -Degrees conferred by institutions of higher education, by level of degree, and by discipline divisionand program specialty: 50 states and District of Columbia, 1991 -92- -Continued
[CIP code Discipline division and program specialty Total * Associate's Bachelor's Master's Docto
42.1601 Social Psychology 400 22 268 84 26
42.1701 School Psychology 582 0 39 458 85
42.9999 Psychology, Other 2,268 107 1,431 573 157
43.0000 Protective Services 35,245 15,117 18,855 1,249 24
43.0102 Corrections / Correctional Administration 1,387 615 678 94 0
43.0103 Criminal Justice / Law Enforcement Administration 8,455 2,158 5,889 405 3
43.0104 Criminal Justice Studies 11,450 1,313 9,492 624 21
43.0106 Forensic Technology/Technician 180 13 128 39 0
43.0107 Law Enforcement / Police Science 9,406 7,742 1,623 41 0
43.0109 Security and Loss Prevention Services 424 362 58 4 0
43.0199 Criminal Justice and Corrections, Other 1,237 446 758 33 0
43.0201 Fire Protection and Safety Technology/Technician 1,437 1,320 114 3 0
43.0202 Fire Services Administration 145 76 69 0 0
43.0203 Fire Science / Firefighting 556 552 4 0 0
43.0299 Fire Protection, Other 57 41 10 6 0
43.9999 Protective Services, Other 511 479 32 0 0
44.0000 Public Administration and Services 38,824 3,162 15,987 19,243 432
44.0201 Community Organization, Resources and Services 2,450 1,037 1,203 203 7
44.0401 Public Administration 8,807 105 2,558 6,039 105
44.0501 Public Policy Analysis 1,094 10 435 590 59
44.0701 Social Work 24,954 1,292 11,427 11,993 242
44.9999 Public Administration and Services, Other 1,519 718 364 418 19
45.0000 Social Sciences and History 153,054 3,160 133,974 12,702 3,218
45.0101 Social Sciences, General 9,473 1,951 7,024 462 36
45.0201 Anthropology 5,915 48 4,648 895 324
45.0301 Archeology 132 2 102 18 10
45.0401 Criminology 1,878 49 1,756 67 6
45.0501 Demography and Population Studies 33 0 0 28 5
45.0601 Economics, General 26,012 134 23,029 2,000 849
45.0602 Applied and Resource Economics 183 0 145 34 4
45.0603 Econometrics and Quantitative Economics 24 0 24 0 0
45.0604 Development Economics and International Development 41 0 4 37 0
45.0605 International Economics 99 0 74 24 1
45.0699 Economics. Other 170 0 147 11 12
45.0701 Geography 4,592 23 3,808 639 122
45.0702 Cartography 46 0 43 3 0
45.0801 History, General 30,429 239 26,820 2,734 636
45.0802 American (United States) History 12 0 7 3 2
45.0804 History and Philosophy of Science and Technology 27 0 21 3 3
45.0805 Public / Applied History and Archival Administration 9 0 0 9 0
45.0899 History, Other 134 8 118 5 3
45.0901 International Relations and Affairs 7,879 246 5,860 1,715 53
45.1001 Political Science and Government. General 40,174 139 37,597 1,904 534
45.1002 American Government and Politics 4 0 4 0 0
45.1099 Political Science and Government, Other 211 2 204 4 1
45.1101 Sociology 21,668 252 19,568 1.347 501
45.1201 Urban Affairs / Studies 962 11 654 249 48
45.9999 Social Sciences and History, Other 2,947 56 2,317 511 63
See footnotes at end of table. 345')
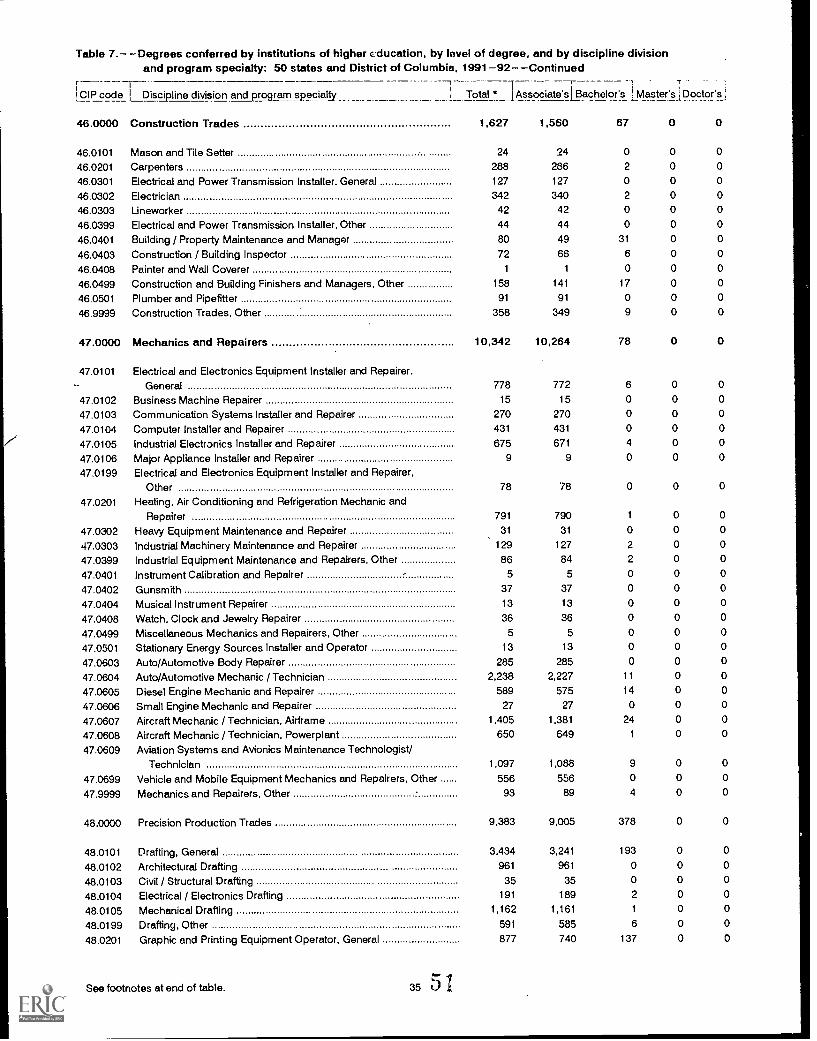
Table 7.- -Degrees conferred by institutions of higher education. by level of degree, and by discipline divisionand program specialty: 50 states and District of Columbia, 1991-92- -Continued
CIP code L_Discipline division and_programpecialV Total * Associate's iBachelor's I Master's Doctor's
46.0000 Construction Trades
46.0101 Mason and Tile Setter46.0201 Carpenters46.0301 Electrical and Power Transmission Installer, General46.0302 Electrician46.0303 Uneworker46.0399 Electrical and Power Transmission Installer, Other46.0401 Building / Property Maintenance and Manager46.0403 Construction / Building Inspector46.0408 Painter and Wall Coverer46.0499 Construction and Building Finishers and Managers, Other46.0501 Plumber and Pipefitter46.9999 Construction Trades, Other
47.0000 Mechanics and Repairers
47.0101 Electrical and Electronics Equipment Installer and Repairer,General
47.0102 Business Machine Repairer47.0103 Communication Systems Installer and Repairer47.0104 Computer Installer and Repairer47.0105 Industrial Electronics Installer and Repairer47.0106 Major Appliance Installer and Repairer47.0199 Electrical and Electronics Equipment Installer and Repairer.
Other47.0201 Heating, Air Conditioning and Refrigeration Mechanic and
Repairer
47.0302 Heavy Equipment Maintenance and Repairer47.0303 Industrial Machinery Maintenance and Repairer47.0399 Industrial Equipment Maintenance and Repairers, Other47.0401 Instrument Calibration and Repairer47.0402 Gunsmith47.0404 Musical Instrument Repairer47.0408 Watch, Clock and Jewelry Repairer47.0499 Miscellaneous Mechanics and Repairers. Other47.0501 Stationary Energy Sources Installer and Operator47.0603 Auto/Automotive Body Repairer47.0604 Auto/Automotive Mechanic / Technician47.0605 Diesel Engine Mechanic and Repairer47.0606 Small Engine Mechanic and Repairer47.0607 Aircraft Mechanic / Technician, Airframe47.0608 Aircraft Mechanic / Technician, Powerplant47.0609 Aviation Systems and Avionics Maintenance Technologist/
Technician47.0699 Vehicle and Mobile Equipment Mechanics and Repairers, Other47.9999 Mechanics and Repairers. Other
48.0000 Precision Production Trades
48.0101 Drafting, General
48.0102 Architectural Drafting48.0103 Civil / Structural Drafting
48.0104 Electrical / Electronics Drafting48.0105 Mechanical Drafting48.0199 Drafting, Other
48.0201 Graphic and Printing Equipment Operator, General
See footnotes at end of table. 35 51
1,627 1,560
24 94
288 286
127 127
342 34042 42
44 44
80 49
72 66
1 1
158 141
91 91
358 349
10,342 10,264
778 772
15 15
270 270
431 431
675 671
9 9
78 78
791 790
31 31
129 127
86 84
5 5
37 37
13 13
36 36
5 5
13 13
285 285
2,238 2,227589 575
27 27
1,405 1,381
650 649
1,097 1,088
556 55693 89
9,383 9,005
3,434 3.241
961 961
35 35
191 189
1,162 1,161
591 585
877 740
67 0 0
0 0 0
2 0 0
0 0 0
2 0 0
0 0 0
0 0 0
31 0 0
6 0 0
0 0 0
17 0 0
0 0 0
9 0 0
78 0 0
6 0 0
0 0 0
0 0 0
0 0 0
4 0 0
0 0 0
0 0 0
1 0 0
0 0 0
2 0 0
2 0 0
0 0 0
0 0 0
0 0 0
0 0 0
0 0 0
0 0 0
0 0 0
11 0 0
14 0 0
0 0 0
24 0 0
1 0 0
9 0 0
0 0 0
4 0 0
378 0 0
193 0 0
0 0 0
0 0 0
2 0 0
1 0 0
6 0 0
137 0 0
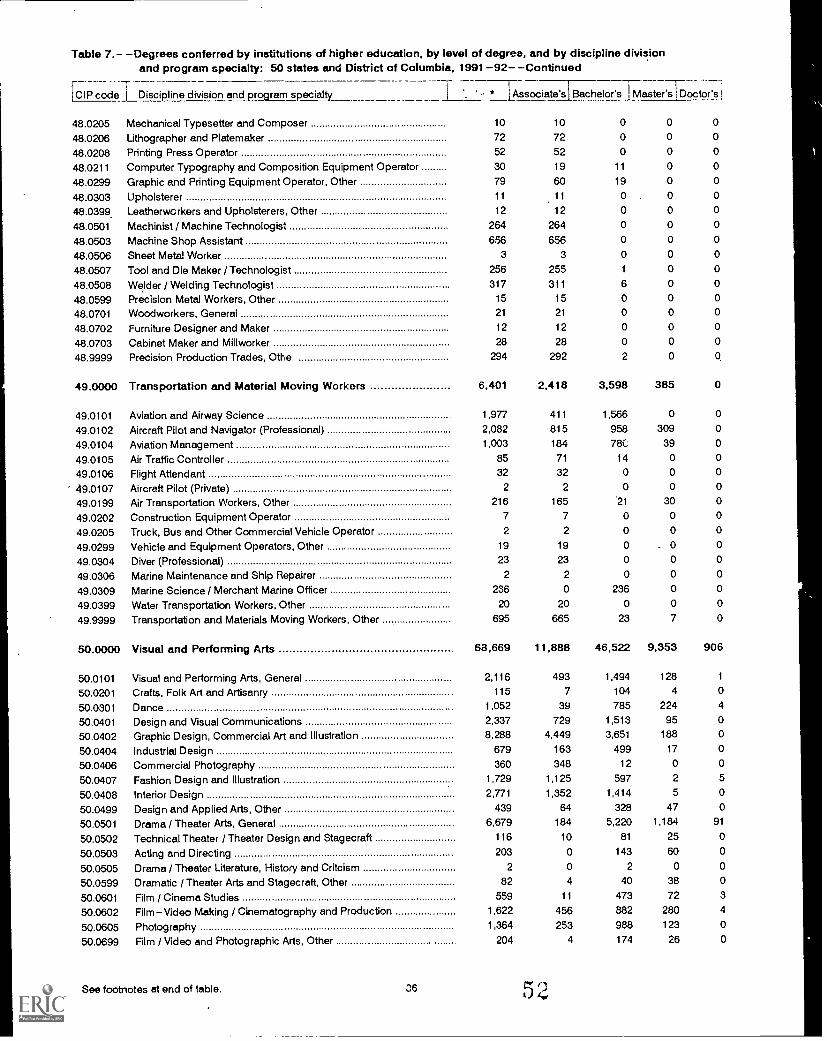
Table 7.- -Degrees conferred by institutions of higher education, by level of degree, and by discipline divisionand program specialty: 50 states and District of Columbia, 1991 -92- -Continued
LCIP codel Discipline division and program specialbt I * I Associate's Bachelor'sj MasterTDoctor's1
48.0205 Mechanical Typesetter and Composer 10 10 0 0 0
48.0206 Lithographer and Platemaker 72 72 0 0 0
48.0208 Printing Press Operator 52 52 0 0 0
48.0211 Computer Typography and Composition Equipment Operator 30 19 11 0 0
48.0299 Graphic and Printing Equipment Operator, Other 79 60 19 0 0
48.0303 Upholsterer 11 11 0 0 0
48.0399. Leatherworkers and Upholsterers, Other 12 12 0 0 0
48.0501 Machinist / Machine Technologist 264 264 0 0 0
48.0503 Machine Shop Assistant 656 656 0 0 0
48.0506 Sheet Metal Worker 3 3 0 0 0
48.0507 Tool and Die Maker / Technologist 256 255 1 0 0
48.0508 Welder / Welding Technologist 317 311 6 0 0
48.0599 Precision Metal Workers, Other 15 15 0 0 0
48.0701 Woodworkers, General 21 21 0 0 0
48.0702 Furniture Designer and Maker 12 12 0 0 0
48.0703 Cabinet Maker and Millworker 28 28 0 0 0
48.9999 Precision Production Trades, Othe 294 292 2 0 0
49.0000 Transportation and Material Moving Workers 6,401 2,418 3,598 385 0
49.0101 Aviation and Airway Science 1,977 411 1,566 0 0
49.0102 Aircraft Pilot and Navigator (Professional) 2,082 815 958 309 0
49.0104 Aviation Management 1,003 184 78C 39 0
49.0105 Air Traffic Controller 85 71 14 0 0
49.0106 Flight Attendant 32 32 0 0 0
49.0107 Aircraft Pilot (Private) 2 2 0 0 0
49.0199 Air Transportation Workers, Other 216 165 .21 30 0
49.0202 Construction Equipment Operator 7 7 0 0 0
49.0205 Truck, Bus and Other Commercial Vehicle Operator 2 2 0 0 0
49.0299 Vehicle and Equipment Operators, Other 19 19 0 0 0
49.0304 Diver (Professional) 23 23 0 0 0
49.0306 Marine Maintenance and Ship Repairer 2 2 0 0 0
49.0309 Marine Science / Merchant Marine Officer 236 0 236 0 0
49.0399 Water Transportation Workers, Other 20 20 0 0 0
49.9999 Transportation and Materials Moving Workers, Other 695 665 23 7 0
50.0000 Visual and Performing Arts 68,669 11,888 46,522 9,353 906
50.0101 Visual and Performing Arts, General 2,116 493 1,494 128 1
50.0201 Crafts, Folk Art and Artisanry 115 7 104 4 0
50.0301 Dance 1,052 39 785 224 4
50.0401 Design and Visual Communications 2,337 729 1,513 95 0
50.0402 Graphic Design, Commercial Art and Illustration 8,288 4,449 3,651 188 0
50.0404 Industrial Design 679 163 499 17 0
50.0406 Commercial Photography 360 348 12 0 0
50.0407 Fashion Design and Illustration 1,729 1,125 597 2 5
50.0408 Interior Design 2,771 1,352 1,414 5 0
50.0499 Design and Applied Arts, Other 439 64 328 47 0
50.0501 Drama / Theater Arts, General 6,679 184 5,220 1,184 91
50.0502 Technical Theater / Theater Design and Stagecraft 116 10 81 25 0
50.0503 Acting and Directing 203 0 143 60 0
50.0505 Drama / Theater Literature, History and Critcism 2 0 2 0 0
50.0599 Dramatic / Theater Arts and Stagecraft, Other 82 4 40 38 0
50.0601 Film / Cinema Studies 559 11 473 72 3
50.0602 Film-Video Making / Cinematography and Production 1,622 456 882 280 4
50.0605 Photography 1,364 253 988 123 0
50.0699 Film / Video and Photographic Arts, Other 204 4 174 26 0
See footnotes at end of table.
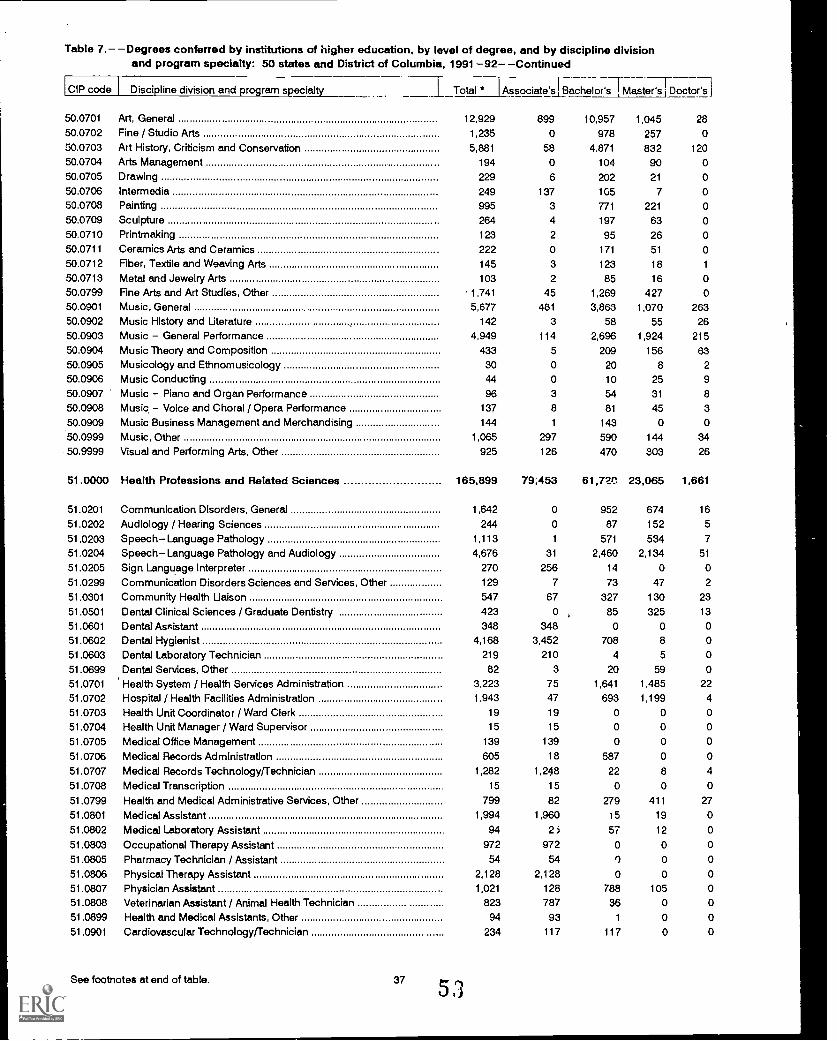
Table 7.- -Degrees conferred by institutions of higher education, by level of degree, and by discipline divisionand program specialty: 50 states and District of Columbia, 1991-92- -Continued
ICIP code Discipline division and program specialty Total * Associate's! Bachelor's I MastEWDoctorr'sj
50.0701 Art, General 12,929 899 10,957 1,045 2850.0702 Fine / Studio Arts 1,235 0 978 257 050.0703 Art History, Criticism and Conservation 5,881 58 4,871 832 120
50.0704 Arts Management 194 0 104 90 050.0705 Drawing 229 6 202 21 0
50.0706 Intermedia 249 137 105 7 050.0708 Painting 995 3 771 221 050.0709 Sculpture 264 4 197 63 050.0710 Printmaking 123 2 95 26 050.0711 Ceramics Arts and Ceramics 222 0 171 51 0
50.0712 Fiber, Textile and Weaving Arts 145 3 123 18 1
50.0713 Metal and Jewelry Arts 103 2 85 16 050.0799 Fine Arts and Art Studies, Other 1,741 45 1,269 427 0
50.0901 Music, General 5,677 481 3,863 1,070 26350.0902 Music History and Literature ., 142 3 58 55 26
50.0903 Music General Performance 4,949 114 2,696 1,924 21550.0904 Music Theory and Composition 433 5 209 156 6350.0905 Musicology and Ethnomusicology 30 0 20 8 2
50.0906 Music Conducting 44 0 10 25 9
50.0907 Music - Piano and Organ Performance 96 3 54 31 8
50.0908 Music - Voice and Choral / Opera Performance 137 8 81 45 3
50.0909 Music Business Management and Merchandising 144 1 143 0 0
50.0999 Music, Other 1,065 297 590 144 3450.9999 Visual and Performing Arts, Other 925 126 470 303 26
51.0000 Health Professions and Related Sciences 165,899 79453 61,72C 23,065 1,661
51.0201 Communication Disorders, General 1,642 0 952 674 16
51.0202 Audiology / Hearing Sciences 244 0 87 152 5
51.0203 Speech- Language Pathology 1,113 1 571 534 7
51.0204 Speech-Language Pathology and Audiology 4,676 31 2,460 2,134 51
51.0205 Sign Language Interpreter 270 256 14 0 0
51.0299 Communication Disorders Sciences and Services, Other 129 7 73 47 2
51.0301 Community Health Liaison 547 67 327 130 23
51.0501 Dental Clinical Sciences / Graduate Dentistry 423 0 , 85 325 13
51.0601 Dental Assistant 348 348 0 0 0
51.0602 Dental Hygienist 4,168 3,452 708 8 0
51.0603 Dental Laboratory Technician 219 210 4 5 0
51.0699 Dental Services, Other 82 3 20 59 0
51.0701 Health System / Health Services Administration 3,223 75 1,641 1,485 22
51.0702 Hospital / Health Facilities Administration 1,943 47 693 1,199 4
51.0703 Health Unit Coordinator / Ward Clerk 19 19 0 0 0
51.0704 Health Unit Manager / Ward Supervisor 15 15 0 0 0
51.0705 Medical Office Management 139 139 0 0 0
51.0706 Medical Records Administration 605 18 587 0 0
51.0707 Medical Records Technology/Technician 1,282 1,248 22 8 4
51.0708 Medical Transcription 15 15 0 0 0
51.0799 Health and Medical Administrative Services, Other 799 82 279 411 27
51.0801 Medical Assistant 1,994 1,960 15 19 0
51.0802 Medical Laboratory Assistant 94 25 57 12 0
51.0803 Occupational Therapy Assistant 972 972 0 0 0
51.0805 Pharmacy Technician / Assistant 54 54 r) 0 0
51.0806 Physical Therapy Assistant 2,128 2,128 0 0 0
51.0807 Physician Assistant 1,021 128 788 105 0
51.0808 Veterinarian Assistant / Animal Health Technician 823 787 36 0 0
51.0899 Health and Medical Assistants, Other 94 93 1 0 0
51.0901 Cardiovascular Technology/Technician 234 117 117 0 0
See footnotes at end of table. 37
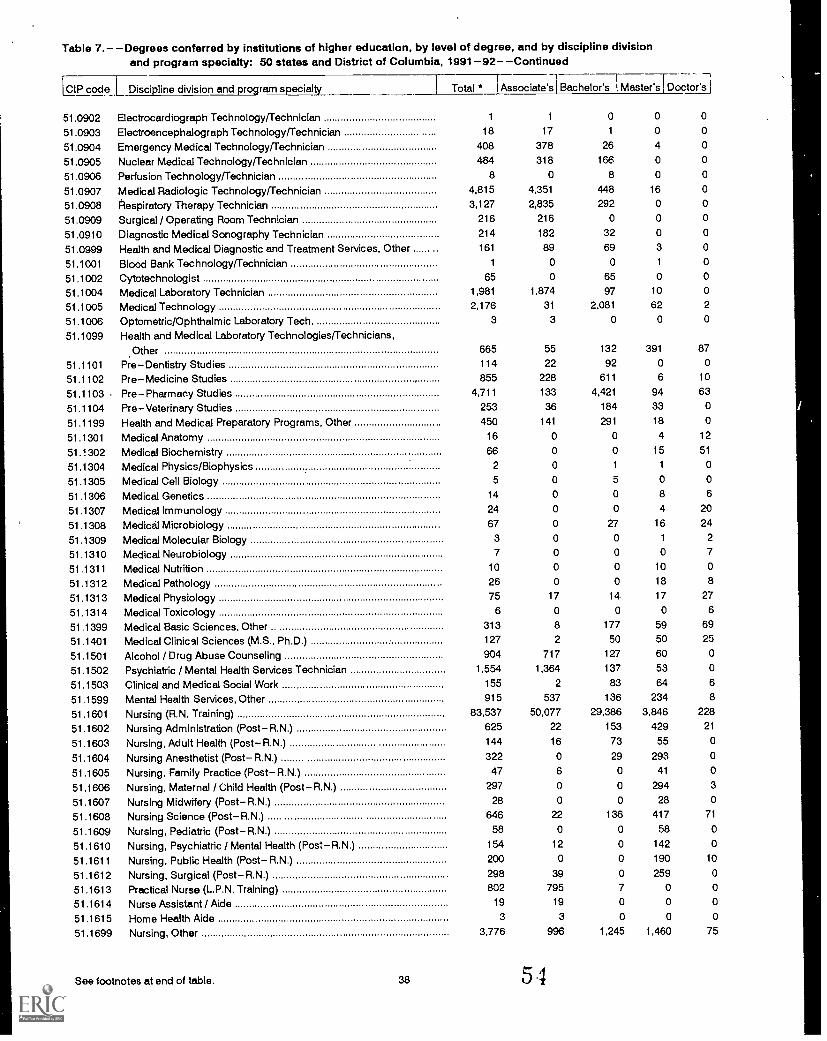
Table 7.- -Degrees conferred by institutions of higher education, by level of degree, and by discipline divisionand program specialty: 50 states and District of Columbia, 1991-92- -Continued
[CiP code L Discipline division and program specialty Total * Associate's I Bachelor's Master's iDoctor'si
51.0902 Electrocardiograph Technology/Technician 1 1 0 0 0
51.0903 Electroencephalograph Technology/Technician 18 17 1 0 0
51.0904 Emergency Medical Technology/Technician 408 378 26 4 0
51.0905 Nuclear Medical Technology/Technician 484 318 166 0 0
51.0906 Perfusion Technology/Technician 8 0 8 0 0
51.0907 Medical Radiologic Technology/Technician 4,815 4,351 448 16 0
51.0908 Respiratory Therapy Technician 3,127 2,835 292 0 0
51.0909 Surgical / Operating Room Technician 216 216 0 0 0
51.0910 Diagnostic Medical Sonography Technician 214 182 32 0 0
51.0999 Health and Medical Diagnostic and Treatment Services, Other ...... .. 161 89 69 3 0
51.1001 Blood Bank Technology/Technician 1 0 0 1 0
51.1002 Cytotechnologist 65 0 65 0 0
51.1004 Medical Laboratory Technician 1,981 1,874 97 10 0
51.1005 Medical Technology 2,176 31 2,081 62 2
51.1006 Optometric/Ophthalmic Laboratory Tech. 3 3 0 0 0
51.1099 Health and Medical Laboratory Technologies/Technicians,Other 665 55 132 391 87
51.1101 Pre-Dentistry Studies 114 22 92 0 0
51.1102 Pre- Medicine Studies 855 228 611 6 10
51.1103 Pre-Pharmacy Studies 4,711 133 4,421 94 63
51.1104 Pre-Veterinary Studies 253 36 184 33 0
51.1199 Health and Medical Preparatory Programs, Other 450 141 291 18 0
51.1301 Medical Anatomy 16 0 0 4 12
51.1302 Medical Biochemistry 66 0 0 15 51
51.1304 Medical Physics/Biophysics 2 0 1 1 0
51.1305 Medical Cell Biology 5 0 5 0 0
51.1306 Medical Genetics 14 0 0 8 6
51.1307 Medical Immunology 24 0 0 4 20
51.1308 Medical Microbiology 67 0 27 16 24
51.1309 Medical Molecular Biology 3 0 0 1 2
51.1310 Medical Neurobiology 7 0 0 0 7
51.1311 Medical Nutrition 10 0 0 10 0
51.1312 Medical Pathology 26 0 0 18 8
51.1313 Medical Physiology 75 17 14 17 27
51.1314 Medical Toxicology 6 0 0 0 6
51.1399 Medical Basic Sciences, Other 313 8 177 59 69
51.1401 Medical Clinical Sciences (M.S., Ph.D.) 127 2 50 50 25
51.1501 Alcohol / Drug Abuse Counseling 904 717 127 60 0
51.1502 Psychiatric / Mental Health Services Technician 1,554 1,364 137 53 0
51.1503 Clinical and Medical Social Work 155 2 83 64 6
51.1599 Mental Health Services, Other 915 537 136 234 8
51.1601 Nursing (R.N. Training) 83,537 50,077 29,386 3,846 228
51.1602 Nursing Administration (Post- R.N.) 625 22 153 429 21
51.1603 Nursing, Adult Health (Post- R.N.) 144 16 73 55 0
51.1604 Nursing Anesthetist (Post- R.N.) 322 0 29 293 0
51.1605 Nursing, Family Practice (Post-RN.) 47 6 0 41 0
51.1606 Nursing, Maternal / Child Health (Post- R.N.) 297 0 0 294 3
51.1607 Nursing Midwifery (Post- R.N.) 28 0 0 28 0
51.1608 Nursing Science (Post-R.N.) 646 22 136 417 71
51.1609 Nursing, Pediatric (Post-RN.) 58 0 0 58 0
51.1610 Nursing, Psychiatric / Mental Health (Post- R.N.) 154 12 0 142 0
51.1611 Nursing, Public Health (Post- R.N.) 200 0 0 190 10
51.1612 Nursing, Surgical (Post-R.N.) 298 39 0 259 0
51.1613 Practical Nurse (L.P.N. Training) 802 795 7 0 0
51.1614 Nurse Assistant / Aide 19 19 0 0 0
51.1615 Home Health Aide 3 3 0 0 0
51.1699 Nursing, Other 3,776 996 1,245 1,460 75
See footnotes at end of table. 38 5,4
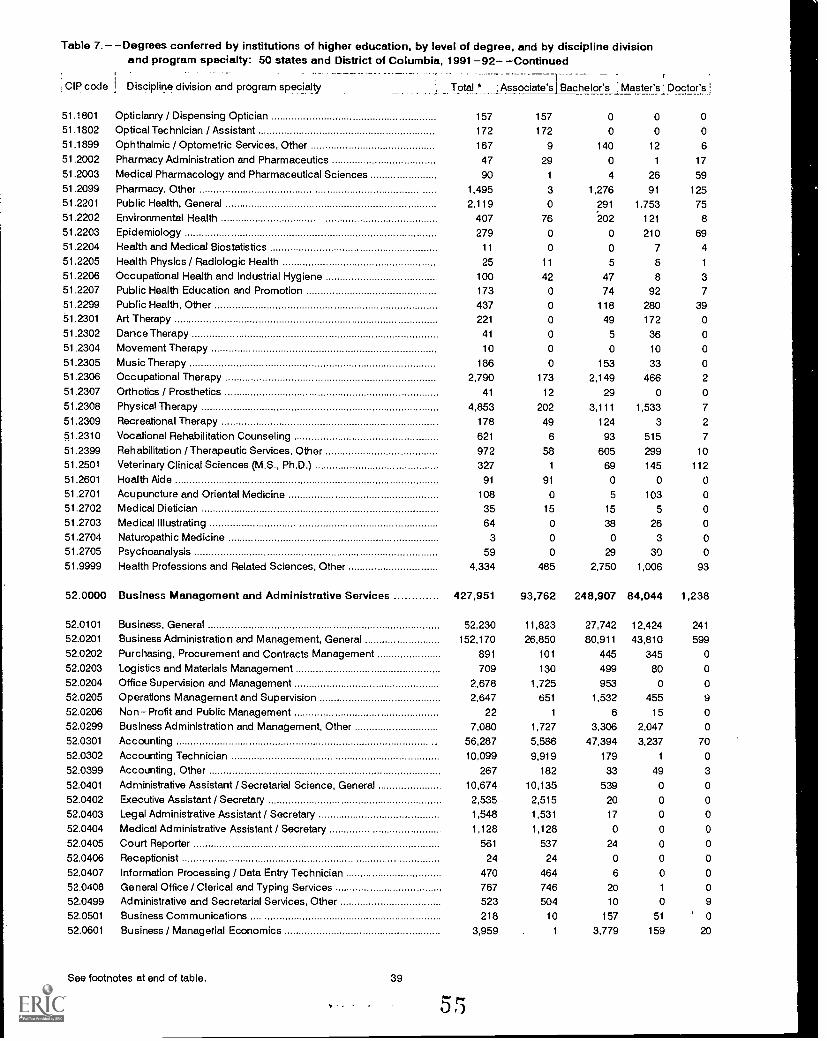
Table 7.- -Degrees conferred by institutions of higher education, by level of degree, and by discipline division
Clp code
and program specialty: 50 states and District of Columbia,
Discipline division and program specialty
1991 -92- -Continued
Total * I Associate's I Bachelor's Master's ; Doctor's
51.1801 Opticianry / Dispensing Optician 157 157 0 0 051.1802 Optical Technician / Assistant 172 172 0 0 051.1899 Ophthalmic / Optometric Services, Other 167 9 140 12 6
51.2002 Pharmacy Administration and Pharmaceutics 47 29 0 1 17
51.2003 Medical Pharmacology and Pharmaceutical Sciences 90 1 4 26 5951.2099 Pharmacy, Other 1,495 3 1,276 91 12551.2201 Public Health, General 2,119 0 291 1,753 7551.2202 Environmental Health 407 76 202 121 851.2203 Epidemiology 279 0 0 210 6951.2204 Health and Medical Biostatistics 11 0 0 7 451.2205 Health Physics / Radiologic Health 25 11 5 8 1
51.2206 Occupational Health and Industrial Hygiene 100 42 47 8 351.2207 Public Health Education and Promotion 173 0 74 92 7
51.2299 Public Health, Other 437 0 118 280 3951.2301 Art Therapy 221 0 49 172 051.2302 Dance Therapy 41 0 5 36 0
51.2304 Movement Therapy 10 0 0 10 051.2305 Music Therapy 186 0 153 33 051.2306 Occupational Therapy 2,790 173 2,149 466 2
51.2307 Orthotics / Prosthetics 41 12 29 0 0
51.2308 Physical Therapy 4,853 202 3,111 1,533 7
51.2309 Recreational Therapy 178 49 124 3 2
51.2310 Vocational Rehabilitation Counseling 621 6 93 515 7
51.2399 Rehabilitation / Therapeutic Services, Other 972 58 605 299 10
51.2501 Veterinary Clinical Sciences (M.S., Ph.D.) 327 1 69 145 112
51.2601 Health Aide 91 91 0 0 0
51.2701 Acupuncture and Oriental Medicine 108 0 5 103 051.2702 Medical Dietician 35 15 15 5 051.2703 Medical Illustrating 64 0 38 26 0
51.2704 Naturopathic Medicine 3 0 0 3 051.2705 Psychoanalysis 59 0 29 30 051.9999 Health Professions and Related Sciences, Other 4,334 485 2,750 1,006 93
52.0000 Business Management and Administrative Services 427,951 93,762 248,907 84,044 1,238
52.0101 Business, General 52,230 11,823 27,742 12,424 241
52.0201 Business Administration and Management, General 152,170 26,850 80,911 43,810 59952.0202 Purchasing, Procurement and Contracts Management 891 101 445 345 052.0203 Logistics and Materials Management 709 130 499 80 0
52.0204 Office Supervision and Management 2,678 1,725 953 0 0
52.0205 Operations Management and Supervision 2,647 651 1,532 455 9
52.0206 Non-Profit and Public Management 22 1 6 15 0
52.0299 Business Administration and Management, Other 7,080 1,727 3,306 2,047 0
52.0301 Accounting 56,287 5,586 47,394 3,237 7052.0302 Accounting Technician 10,099 9,919 179 1 0
52.0399 Accounting, Other 267 182 33 49 3
52.0401 Administrative Assistant / Secretarial Science, General 10,674 10,135 539 0 0
52.0402 Executive Assistant / Secretary 2,535 2,515 20 0 0
52.0403 Legal Administrative Assistant / Secretary 1,548 1,531 17 0 0
52.0404 Medical Administrative Assistant / Secretary 1,128 1,128 0 0 0
52.0405 Court Reporter 581 537 24 0 0
52.0406 Receptionist 24 24 0 0 0
52.0407 Information Processing / Data Entry Technician 470 464 6 0 0
52.0408 General Office / Clerical and Typing Services 767 746 20 1 0
52.0499 Administrative and Secretarial Services, Other 523 504 10 0 9
52.0501 Business Communications 218 10 157 51 0
52.0601 Business / Managerial Economics 3,959 1 3,779 159 20
See footnotes at end of table. 39
55
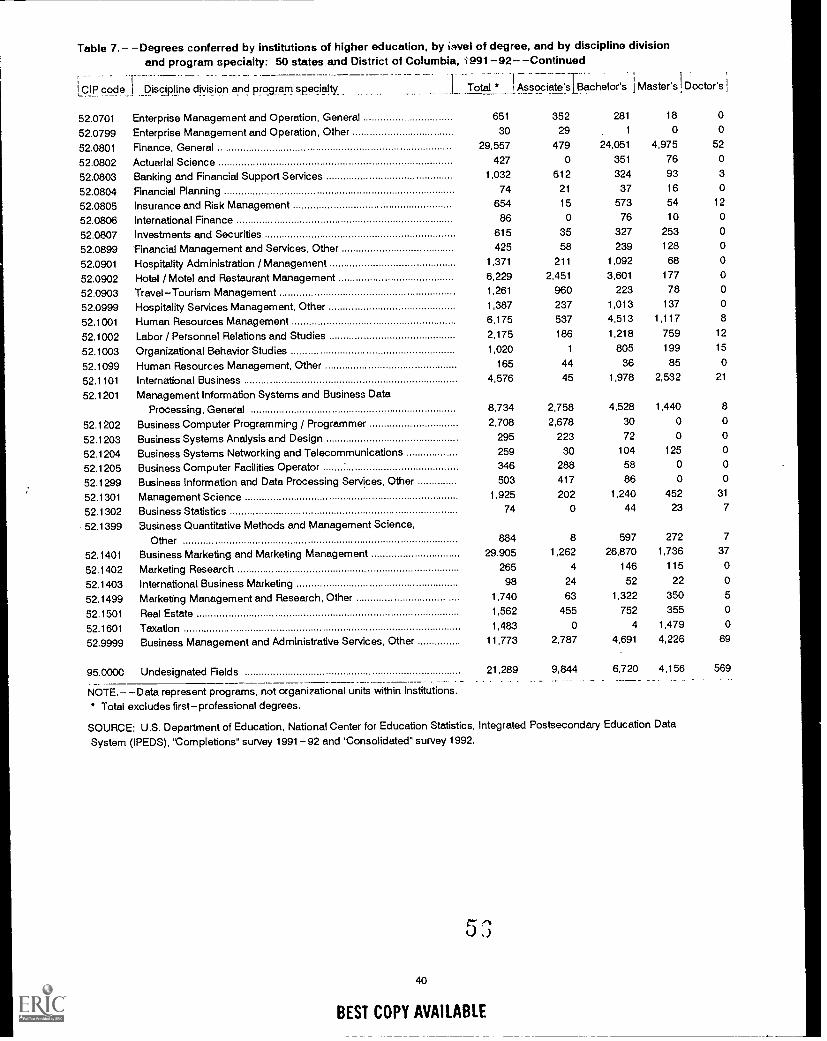
Table 7.- -Degrees conferred by institutions of higher education, by ievel of degree, and by discipline divisionand program specialty: 50 states and District of Columbia, 1991-92- -Continued
LCIP code 1 Discipline division and program specialty ITotal * I AssociateqBachelor's Master's ! Doctor's
52.0701 Enterprise Management and Operation, General 651 352 281 18 0
52.0799 Enterprise Management and Operation, Other 30 29 1 0 0
52.0801 Finance, General 29,557 479 24,051 4,975 52
52.0802 Actuarial Science 427 0 351 76 0
52.0803 Banking and Financial Support Services 1,032 612 324 93 3
52.0804 Financial Planning 74 21 37 16 0
52.0805 Insurance and Risk Management 654 15 573 54 12
52.0806 International Finance 86 0 76 10 0
52.0807 Investments and Securities 615 35 327 253 0
52.0899 financial Management and Services, Other 425 58 239 128 0
52.0901 Hospitality Administration / Management 1,371 211 1,092 68 0
52.0902 Hotel / Motel and Restaurant Management 6,229 2,451 3,601 177 0
52.0903 Travel-Tourism Management 1,261 960 223 78 0
52.0999 Hospitality Services Management, Other 1,387 237 1,013 137 0
52.1001 Human Resources Management 6,175 537 4,513 1,117 8
52.1002 Labor / Personnel Relations and Studies 2,175 186 1,218 759 12
52.1003 Organizational Behavior Studies 1,020 1 805 199 15
52.1099 Human Resources Management, Other 165 44 36 85 0
52.1101 International Business 4,576 45 1,978 2,532 21
52.1201 Management Information Systems and Business DataProcessing, General 8,734 2,758 4,528 1,440 8
52.1202 Business Computer Programmirg / Programmer 2,708 2,678 30 0 0
52,1203 Business Systems Analysis and Design 295 223 72 0 0
52.1204 Business Systems Networking and Telecommunications 259 30 104 125 0
52.1205 Business Computer Facilities Operator 346 288 58 0 0
52.1299 Business Information and Data Processing Services, Other 503 417 86 0 0
52.1301 Management Science 1,925 202 1,240 452 31
52.1302 Business Statistics 74 0 44 23 7
52.1399 Business Quantitative Methods and Management Science,
Other 884 8 597 272 7
52.1401 Business Marketing and Marketing Management 29,905 1,262 26,870 1,736 37
52.1402 Marketing Research 265 4 146 115 0
52.1403 International Business Marketing 98 24 52 22 0
52.1499 Marketing Management and Research, Other 1,740 63 1,322 350 5
52.1501 Real Estate 1,562 455 752 355 0
52.1601 Taxation 1,483 0 4 1,479 0
52.9999 Business Management and Administrative Services, Other 11,773 2,787 4,691 4,226 69
95.0000 Undesignated Fields 21,289 9,844 6,720 4,156 569
NOTE.- -Data represent programs, not organizational units within institutions.* Total excludes first- professional degrees.
SOURCE: U.S. Department of Education, National Center for Education Statistics, Integrated Postsecondary Education Data
System (IPEDS), 'Completions" survey 1991-92 and 'Consolidated" survey 1992.
40
BEST COPY AVAILABLE

United B.tates -Department oi Educationashington, DC 20208-5652W
Official BusinessPenalty tor Pr Nate Use, $300
-
Postage and Fees Paid
U.S. Department oi EducatonPermit No. G-17
Third Class
BEST COPYAVAILABLE57