Embed Size (px)
Citation preview
1
Dehydration and Hyponatremia in Professional Rugby Union Players; A Cohort Study
observing English Premiership Rugby Union Players during Match Play, Field and
Gym Training in Cool Environmental Conditions
Running Head: Dehydration and Hyponatremia in Professional Rugby Union Players
Ben Jones, John Paul O’Hara, Kevin Till, and Roderick Frederick Gerardus Joseph King
Research Institute Sport, Physical Activity and Leisure, Leeds Metropolitan University,
Leeds, West Yorkshire, United Kingdom
Corresponding Author:
Dr. Ben Jones
Room 112, Fairfax Hall
Research Institute for Sport, Physical Activity and Leisure
Centre for Sports Performance
Headingley Campus, Leeds Metropolitan University
W.Yorkshire, LS6 3QS
Phone: (044-11) 01132-832600 Ext: 24009
Email: [email protected]
2
Dehydration and Hyponatremia in Professional Rugby Union Players; A Cohort Study
observing English Premiership Rugby Union Players during Match Play, Field and
Gym Training in Cool Environmental Conditions
3
ABSTRACT Fluid and sodium balance is important for performance and health; however limited data in
rugby union players exists. The purpose of the study was to evaluate body mass (BM) change
(dehydration) and blood[Na+] change during exercise. Data was collected from 10 premiership
rugby union players, over a 4-week period. Observations included match play (23 subject
observations), field (45 subject observations) and gym (33 subject observations) training
sessions. Arrival urine samples were analysed for osmolality and samples during exercise
were analysed for [Na+]. BM and blood[Na+] were determined pre- and post-exercise.
Sweat[Na+] was analysed from sweat patches worn during exercise and fluid intake was
measured during exercise. Calculations of fluid and Na+ loss were made. Mean arrival urine
osmolality was 423±157 mOsm/kg, suggesting players were adequately hydrated. Following
match play, field and gym training BM loss was; 1.0±0.7, 0.3±0.6 and 0.1±0.6%. Fluid loss
was significantly greater during match play (1.404±0.977 kg) than field (1.008±0.447 kg,
P=0.021) and gym training (0.639±0.536 kg, P<0.001). Fluid intake was 0.955±0.562,
1.224±0.601 and 0.987±0.503 kg during match play, field and gym training. On 43% of
observations, players were hyponatremic when BM increased, 57% when BM was maintained
and 35% when there was a BM loss of 0.1 to 0.9%. Blood[Na+] was representative of
normonatremia when BM loss was >1.0%. The findings demonstrate that RU players are
adequately hydrated on arrival, fluid intake is excessive compared to fluid loss and some
players are at risk of developing hyponatremia.
Key words; Dehydration, Nutrition, Fluid Balance, Rugby, Electrolytes, Sodium
4
INTRODUCTION
Fluid losses during team sports and the potential risk of dehydration, known as
hyperosmol-hypovolemia (6), have been reported for a number of years (37). Rugby union
players should attempt to prevent severe (>2%) dehydration (insufficient fluid intake:fluid loss)
or hyperhydration (excessive fluid intake:fluid loss) during match play and training, thus
maintaining fluid balance, due to the effect total body water has on tightly regulated
homeostatic variables (6,8,29) and exercise performance (5,6). Athletes in other sports, albeit
endurance, have been reported to over-drink during exercise (25,26,27,28) diluting tightly
regulated blood[Na+] (135 – 145 mmol/L) (29). This can lead to hyponatremia (blood[Na+] <135
mmol/L), shown in endurance athletes to have negative effects on performance (28) and in
extreme circumstances cause fatalities (15,30). The health of a recreational tennis player has
also been compromised due to hyponatremia, resulting in cellular edema and brain swelling
(40). To date, despite rugby union’s popularity as a professional and amateur sport in England,
UK, studies have only explored body mass change during match play, reporting a loss of 1.94
± 0.14 kg for forwards and 1.04 ± 0.17 kg for backs (24). With the exclusion of fluid intake,
fluid loss, sodium loss and blood sodium concentration from studies of this type, there are no
data for fluid balance and sodium homeostasis during match play and training in such a cohort.
Rugby union is an intermittent collision team sport played between two teams of 15
players, over two 40 minute periods, separated by a 10 minute rest interval (10,12). Players
cover on average 6953m, at approximately 80-85% 2maxOV , corresponding with an estimated
energy expenditure of approximately 7.5 MJ (10), likely to cause elevated mean post-match
rectal temperatures, previously observed in two studies; 39.41 ± 0.14oC (14) and 39.17 ±
0.06oC (7). Sweat loss is the key mechanism for heat dissipation to maintain body temperature
(38) but it is unclear whether rugby union players habitually alter their drinking strategies
during cooler environmental temperatures when there is a reduction in sweat loss.
International English rugby union U21 forwards and backs were reported to have a
mean body mass loss of 1.03 ± 0.98 and 0.95 ± 0.99% during match play, while competing in
5
an international tournament (23). The magnitude of body mass loss is less than previously
reported in South African university rugby union players; 1.5% (14) and 2.9% (7). Although
studies report the level of dehydration, the absence of blood[Na+] limits a more insightful
interpretation. Recently, blood[Na+] in addition to assessments of hydration status have been
explored in New Zealand rugby union players during training in warm environmental
conditions; 21 and 27oC (9). Some players consumed fluid at a sufficient rate to gain body
mass, although all players were normonatremic post-training. Findings show that body mass
loss was always <2%, thus it is unlikely that dehydration was sufficient to reduce exercise
performance (5,6,38). Rugby union in the UK is played during the winter months, whereby
environmental conditions would be cooler than reported by Cosgrove et al., (9). This would
suggest that sweat loss would be less during exercise (39) and if fluid intake is similar, over-
drinking, resulting in a dilution of blood[Na+] may occur (29).
Due to the limited information that is available for rugby union players in the UK,
(re)hydration practices formulated from an evidence base are not possible. The purpose of
the study was firstly to evaluate body mass change (∆BM) (dehydration) and blood[Na+]
change during exercise. Due to the known positive relationship between ∆BM and ∆blood[Na+]
(n=2135, r=0.32, P<0.0001) (29), players were categorized according to ∆BM to explore any
observations of hyponatremia. A second purpose of the study was to measure sweat and
urine[Na+], fluid intake, determine plasma volume change and calculate fluid loss in
professional rugby union players. Comparisons were made between match play, field and gym
training sessions, allowing an overall evaluation of professional rugby union playing and
training programme. It is hypothesized that due to the cool environmental conditions;
professional rugby union players will not experience dehydration (>2%) sufficient to reduce
exercise performance and b) will develop dilutional hyponatremia.
METHODS Experimental Approach to the Problem
6
The study was designed to investigate fluid balance (∆BM, estimated fluid intake and
calculated fluid loss) and Na+ homeostasis (Na+ intake, Na+ loss and ∆blood[Na+]) in a field
setting over a four-week period (November to December). All procedures were designed to
cause minimal disruption to players’ habitual routines. Although no pre-observation controls
were employed, the data collected on arrival to match play and training explored the habitual
arrival status of professional rugby union players. Likewise, data collected for the duration of
match play and training determined habitual fluid balance during exercise. Data collected post-
match play and training quantified the effects of habitual fluid balance in professional rugby
union players during their normal routine. Players were observed during four Premiership
matches (two home and two away fixtures; 23 subject observations), six field training sessions
(inclusive of technical, tactical and conditioning training; 45 subject observations) and four
gym training session (resistance training; 33 subject observations). Data were categorized
according to ∆BM to explore relationships. Environmental temperature and humidity (match
play; 6.9 ± 4.3oC & 64 ± 16%, field training; 8.1 ± 4.3oC & 88 ± 14% and gym training; 10.2 ±
5.5oC & 83 ± 20%, respectively) was measured using a digital weather station (Oregon
Scientific, UK). The gym had no climate control capabilities.
Subjects
Ten professional male rugby union players (age 28.1 ± 3.6 yrs., body mass 107.3 ±
11.5 kg, stature 188.1 ± 8.0 cm) competing in the English Premiership volunteered to
participate in the study. The cohort was a heterogeneous sample regarding playing position;
3 props, 3 second rows, 2 centers, 1 scrum half and 1 winger. All protocols received
institutional ethics approval and complied with the Declaration of Helsinki on human research.
Written informed consent was provided along with permission from the rugby union club.
Procedures
On arrival (match play; 60 mins prior to kick off, field and gym training; 30 mins prior to
training) a urine sample was provided. Players were toweled dry (to remove any sweat from
7
the skin) prior to assessment of body mass wearing underwear. Body mass was determined
to the nearest 100g using calibrated digital scales (Seca, 700 1321008, Germany). Sweat
patch sites (forearm, scapula, chest and thigh) were prepared (3) prior to sweat patch
application (Tagaderm +Pad, 3M, Loughborough, UK) (34). Fingertip blood samples were
taken while subjects assumed a semi-recumbent position for 5 minutes. Blood samples were
analysed with a GEM® PremierTM 4000 containing a 30-day disposable cartridge (GEM®
PremierTM 4000 PAK) to determine blood[Na+], hematocrit percentage and hemoglobin
concentration (to calculate ∆PV) (11).
A pre-weighed individually labeled drinks bottle (containing water) and two pre-
weighed individually labeled 500 mL commercially available sports drinks were provided, for
ad libitum consumption. The drinks (choice and quantity) provided were determined by the
professional clubs sports science staff, and reported as their normal hydration strategy. Extra
fluid was available for players if required. Players were advised not to spit out or use their fluid
for anything other than fluid intake, which was observed throughout by the researchers. Fluid
intake was recorded during the pre-match period and during the half-time period for match
play and for the duration of field and gym training. Fluid intake was not recorded during actual
match play, as practicality issues made this impossible. The researcher observed limited
opportunities to consume fluid during match play, although it is accepted that fluid intake and
calculated fluid loss during match play may be underestimated. Pre-weighed individually
labeled jerry cans were provided to collect any urine output produced during match play
(aggregated for the pre-match period and during half-time), field or gym training.
Post-match play, field and gym training sweat patches were removed and placed in air
tight containers. If any of the four sweat patches had been lost or was not air-tight, sweat patch
samples were discarded for that subject observation. A urine sample was collected (to ensure
an empty bladder prior to body mass assessment), a fingertip blood sample was taken and
body mass was determined in the same manner (i.e., underwear only and toweled dry) as pre-
match play, field and gym training. All post-match play, field and gym training measurements
were undertaken prior to fluid intake, once training had finished or after the full-time whistle for
8
match play. All pre-weighed fluid containers were weighed post-exercise in triplicate
independently, using bench top scales (resolution 0.001 kg, CS-2000, Ohaus, USA).
Differences in mass of container from pre to post-match play, field or gym training determined
fluid intake and urine output.
Fluid loss was calculated as described by King et al. (17) rather than sweat loss (20).
Absolute fluid loss is presented due to the time points of measurements (pre- and post-
exercise), which did not account for precise exercise duration or activity. Individual match play
duration (excluding a 16 minute warm up) was; 80 mins, n = 10 subject observations, 79 – 70
mins, n = 3 subject observations, 69 – 60 mins, n = 6 subject observations and 59 – 50 mins,
n = 4 subject observations. The average duration of field and gym training sessions were 91
± 3 and 62 ± 4 mins, respectively.
Urine Analysis: All urine samples were analysed for osmolality within 4 hours using a
calibrated freezing point osmometer (Genotec Osmomat 030-D, 040906, Germany). Samples
were categorized into euhydration (≤700 mOsmol/kg) or hypohydration (≥900 mOsmol/kg)
(38,42). The measure had a co-efficient of variation of 1.6, 1.3 and 0.5%, determined against
stock solutions of 100, 300 and 850 mOsmol/kg standard, respectively. All urine samples
collected between fingertip blood sampling were analysed for [Na+] within 4 hours using
specific kits on iLab 300 with an additional ISE module (IL Instrumentation laboratories,
Warrington, UK). The measure had a co-efficient of variation of 0.8, 0.6, 0.5 and 1.0%
determined against stock solutions of 70.0, 128.0, 140.0 and 151.0 mmol/L, respectively.
Sweat Analysis: Sweat patches were placed in air tight containers immediately and
frozen within 2 hours. Frozen sweat patches were weighed gravimetrically (resolution 0.001
g, OHAUS Corp, EP214, USA) to determine the mass of fluid on the sweat patch. The mass
of the dry sweat patch (prior to application) was determined through measuring 20 sweat
patches to 0.001g (0.274 ± 0.014 g; co-efficient of variation of 0.05%).
Sweat patches with the absorbent gauze exposed were placed into a filtration unit
within a centrifuge tube (Amicon Ultra-15 Centrifugal Filter Unit with Ultracel-10 membrane
Millipore Centrifuge Tube, Darmstadt, Germany). 15.000 mL of distilled water (measured
9
gravimetrically to 0.001 g) was added using an air displacement pipette, (Gilson, France) to
the patch. Samples were spun using a centrifuge (ALC Multispeed Refrigerated Centrifuge,
PK131R, Italy) at 3000 rpm for 10 mins prior to [Na+] analysis using a flame photometer
(Jenway, PFP7 Flame Photometer, Essex, UK). The measure had a co-efficient of variation
of 5.6, 2.6, 1.9, 2.1, 1.8 and 1.9% determined against stock solutions of 0.00, 0.44, 0.88, 1.75,
3.51 and 7.01 mmol/L, respectively.
Whole-body sweat[Na+] (r=0.88, P<0.05) was calculated (eq. [1]) using the same 4 site
model (34).
Whole-body sweat[Na+] = 28.2% chest + 28.2% scapula + 11.3% forearm + 32.3%
thigh [1]
Data were not corrected for possible over estimation of [Na+] in comparisons to whole-body
wash-down [Na+] (see Patterson et al. (34)). Sweat patches were also analysed for [K+] to
ensure the values obtained were from sweat samples rather than skin leaching (45). Na+ loss
was calculated for sweat and urine using eq. [2] and then converted using eq. [3]. Total Na+
loss was calculated using eq. [4].
Na+ (mmol) = [Na+] * FL or UO [2]
Na+ (g) = Na+ (mmol)/1000 * 22.99 [3]
Total Na+ loss = Urine Na+ loss + Sweat Na+ loss [4]
Analysis of Data
Data were tested for normality of distribution (Kolmogorov-Smirnov test) and were
presented as mean ± SD, with the range of data given in parentheses where appropriate.
Mean differences between variables were tested for significance with two-tailed student’s t
tests (paired or unpaired, as applicable), with Bonferroni corrections used for multiple
comparisons. Data sets complete for all observations were used to explore correlations.
10
Pearson product moment correlations were calculated to determine bivariate correlation for
parametric data and Spearman’s rank correlations for non-parametric data for selected
variables. Significance was set as P<0.05 for all statistical tests.
RESULTS
Mean urine osmolality on arrival to match play was significantly less than field and gym
training (P<0.001, table 1). Arrival urine osmolality was only >900 mOsmol/kg on five
occasions (6%), all prior to gym training. At all other points (during or post-match play, field
and gym training) osmolality was indicative of euhydration; <700 mOsmol/kg.
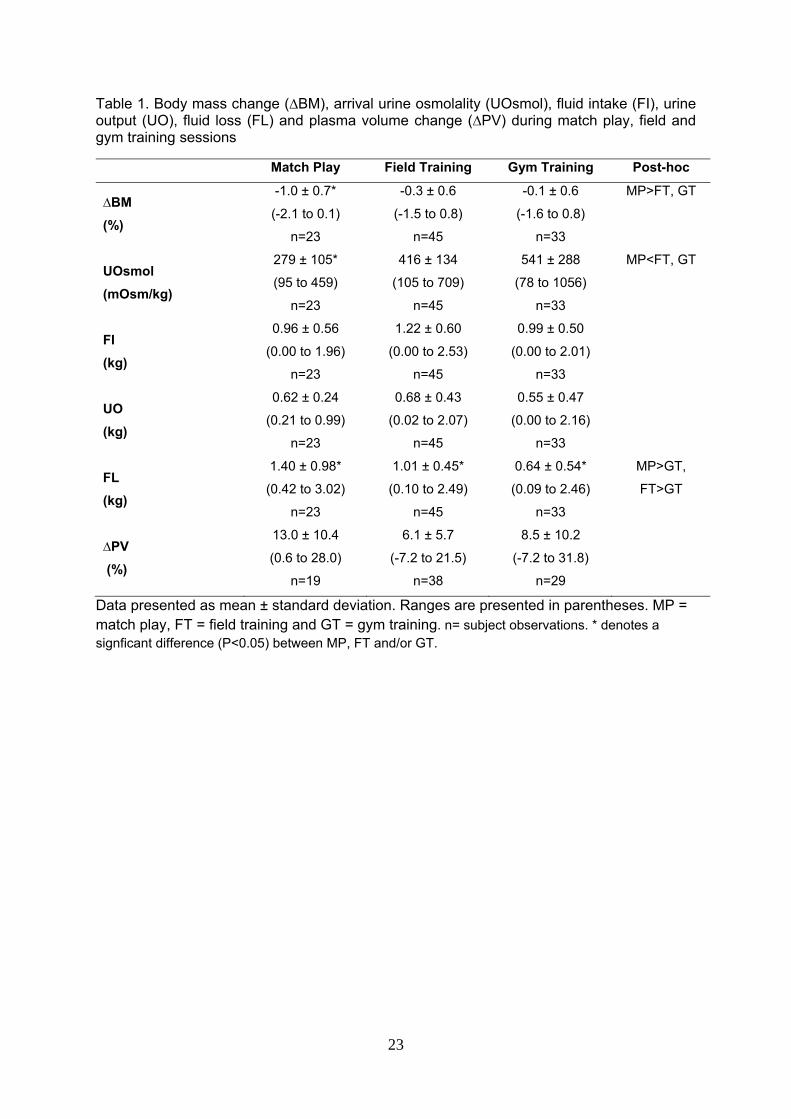
Table 1 shows mean ∆BM, fluid intake, urine output, fluid loss and plasma volume
change during match play, field and gym training. The reduction in body mass was significantly
greater during match play than field (P<0.001) and gym training (P=0.006) and there was no
significant difference in ∆BM between field and gym training. Overall, for all observations mean
fluid intake was significantly greater than fluid loss (1.16 ± 0.50 vers. 0.91 ± 0.57 kg, P=0.007).
Water intake accounted for 61% of fluid intake compared to 39% for sports drink (P<0.001).
Fluid loss was significantly greater for match play than gym training (P=0.001) and field training
was greater than gym training (P=0.021), whereas there was no significant difference between
match play and field training. There was a mean increase in plasma volume during match play,
field and gym training sessions, although large ranges were evident (table 1). There was no
significant difference between match play, field and gym training for ∆PV.
***Insert Table 1 near here***
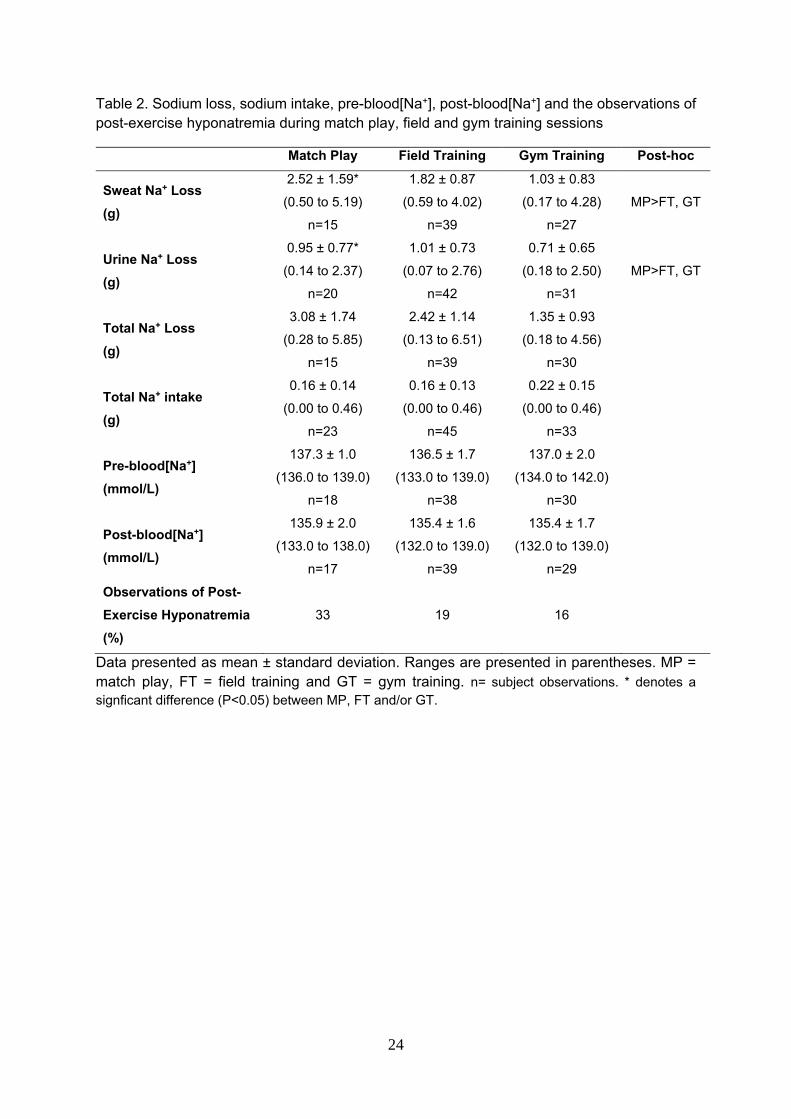
There was no significant difference for sweat[Na+] between match play (78.3 ± 21.2
mmol/L), field (78.3 ± 11.3 mmol/L) or gym training (70.0 ± 10.9 mmol/L). Sodium balance and
observations of post-exercise hyponatremia during match play, field and gym training sessions
can be seen in table 2. There were no significant differences between match play, field and
gym training session for post-exercise blood[Na+], although mean post-exercise blood[Na+]
was greatest for match play. However, match play produced the greatest number of individual
post-exercise observations of post-exercise hyponatremia (33%).
11
***Insert Table 2 near here***
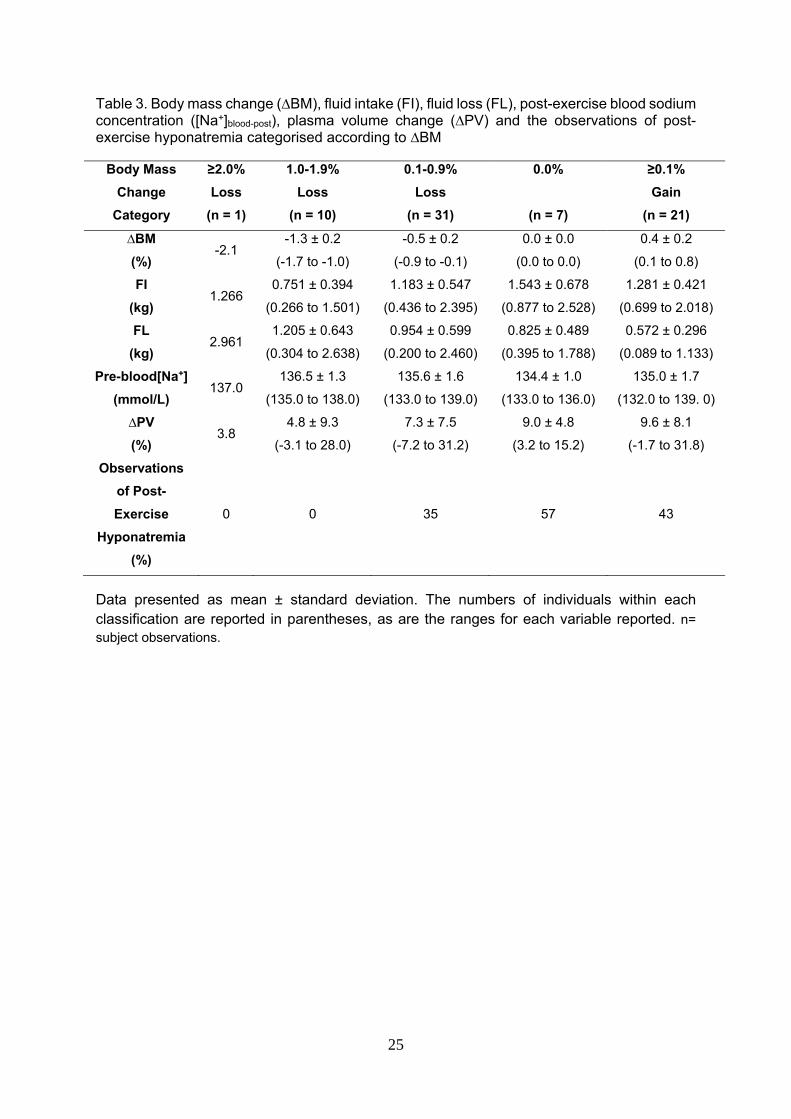
Of the complete observations (i.e. all variables were collected; n = 70 subject
observations), data were categorized according to percentage of ∆BM (table 3). Subjects who
lost 1.0% of body mass did not experience post-exercise hyponatremia, whereas 35% of
subjects were hyponatremic post-exercise when ∆BM was between -0.1 and -0.9%, which
increased to 57% when subjects maintained body mass. When body mass increased during
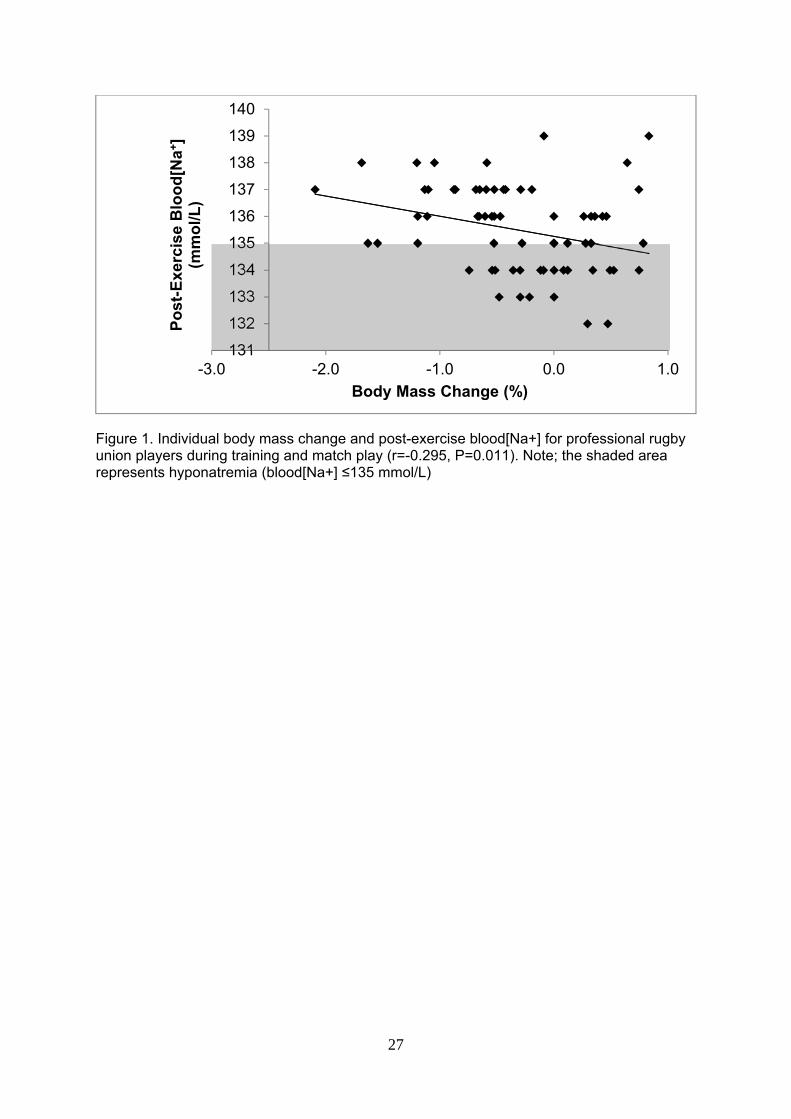
exercise subjects were hyponatremic on 43% of occasions. The relationship of ∆BM and post-
exercise blood[Na+] can be seen in figure 1, which shows that greater body mass losses are
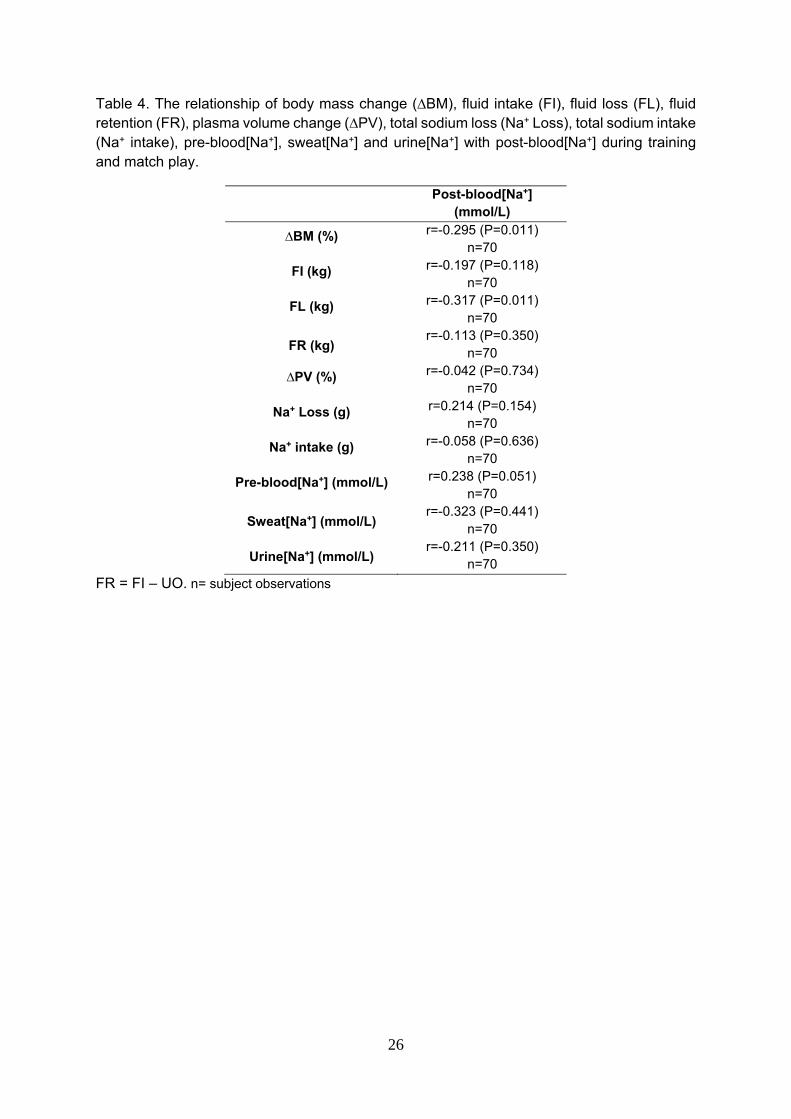
associated with greater post-exercise blood[Na+]. Table 4 shows the relationships of post-
exercise blood[Na+] with associated variables. Statistically significant relationships were
observed between ∆BM, fluid loss and post-exercise blood[Na+].
***Insert Table 3 near here***
***Insert Table 4 near here***
DISCUSSION
In professional rugby union players, limited information is available that evaluates ∆BM
(change in hydration) and blood[Na+] change following match play and training, required to
provide an evidence base for hydration practices. This study demonstrated that rugby union
players experience a mean ∆BM of -1.0 ± 0.7, -0.3 ± 0.6 and -0.1 ± 0.6% following match play,
field and gym training. As hypothesized (a) observations of this specific cohort suggest that
severe dehydration (>2%) is not problematic when exercising in cool environmental conditions
(approximately 10oC), with ad libitum fluid availability. Post match play, field and gym training,
despite a mean blood sodium concentrations of 135.9 ± 2.0, 135.4 ± 1.6 and 135.4 ± 1.7
mmol/L, on 33, 19 and 16% of occasion’s players from this cohort were hyponatremic, as
hypothesized (b).
∆BM during exercise is a result of a fluid imbalance, with some consideration for non-
fluid mass loss (17,20). The magnitude of ∆BM in this study is less than previously reported
12
in English rugby union Premiership players (∆BM -1.94 ± 0.14 kg for forwards and -1.04 ± 0.17
kg for backs), where 16 forwards (80%) recorded ∆BM of ≥-2% (24). Loss of mass by means
of sweat is an unconscious thermoregulatory negative feedback mechanism to reduce or
prevent a rise in core temperature, thus regardless of direction ∆BM is attributed to either
sufficient or insufficient fluid intake. Although no measures of other mass losses occurred in
this study, substrate metabolism (loss of ~200 g carbohydrate) and the gaining of metabolic
water (~150 g) (17,20), may further reduce the need for fluid intake to preserve total body
water. If body mass is maintained, total body water must have increased (32) to reconcile
losses mathematically; see King et al. (17). Thus, based on ∆BM from this cohort, some
professional rugby union players training in cool environment conditions may over-drink
relative to fluid loss (∆BM, fluid intake and fluid loss during field and gym training; -0.3 ± 0.6%,
1.22 ± 0.60, 1.01 ± 0.45 kg and -0.1% ± 0.6%, 0.99 ± 0.50, 0.55 ± 0.47 kg), which has
previously not been reported. Fluid intake in comparison to fluid loss, appears more
appropriate during match play than training (table 1), although hyponatremia was still observed
on 33% of observations (table 2).
Inclusive of match play and training (table 3), this specific cohort of professional rugby
union players were hyponatremic post-exercise on 36% of observations. This would be even
greater (51%) if subjects with a post-exercise blood[Na+] of 135 mmol/L (regarded as
borderline) were included. Findings demonstrate that when body mass is maintained, post-
exercise hyponatremia is observed on 57% of occasions. Again as discussed previously,
maintenance of body mass would suggest an increase in total body water. Post-exercise
hyponatremia was also observed on 43% and 35% of occasions when there was an increase
in body mass and body mass loss of 0.1 – 0.9%, respectively. In contrast, all players from this
study were normonatremic on all occasions when they lost ≥1.0% of body mass, suggesting
that this may be the desired reduction in body mass during exercise to prevent dilutional
hyponatremia.
Accepting the observations of hyponatremia are associated with over-drinking (in
relation to fluid loss) (table 3), drink choice may also be a consideration. Players favored water
13
over the commercially available sports drink, thus it may be recommended that players
consume a sports drink instead of water to increase their Na+ intake during exercise. It should
be noted that due to the excessive overall volume of fluid intake in relation to fluid loss in some
players who had a ∆BM of -0.1 – -0.9, 0.0 and ≥0.1% (table 3), even if players only consumed
the respective sports drink (approximate 20 mmol/L [Na+]) instead of water, it may not have
prevented hyponatremia, due to the hypotonic nature of the drink in relation to sweat (29).
Despite no relationship between post-exercise blood[Na+] and fluid intake, and no relationship
between Na+ loss and change in blood[Na+] pre- to post-exercise, a concurrent decrease in
fluid intake and increase in [Na+] would initially appear to be the recommendation for rugby
union players observed in this study who were hyponatremic, to prevent a dilution of
blood[Na+]. Alternatively, if the observations of hyponatremia have no effect on rugby
performance per se, although this is unknown and beyond the scope of this study, the
consumption of a normal British diet (3.8 and 14.3 grams of Na+ (16)) post-exercise to replace
the 0.2 to 5.4 grams of Na+ lost in this study would likely restore fluid balance and Na+
homeostasis. Thus future studies should look to explore the effects of hyponatremia on rugby
performance.
During exercise in cold environmental conditions, it has been proposed that there is a
reduced thirst sensation in comparison to exercise in warmer environmental conditions (21).
In addition, during exercise in the cold, sweat loss is reduced in comparison to exercise in
warmer environmental conditions. The concurrent nature of a reduced thirst sensation and
reduced sweat loss would theoretically allow players to remain in fluid balance, regardless of
environmental condition. This did not appear to be the case for some players within this
specific cohort (i.e. those players that had a ∆BM -0.1 – -0.9, 0.0 and ≥0.1%, table 3). It is
speculated by the authors, that fluid intake was not determined by a reduction in total body
water (onset of thirst), as players did not appear to be dehydrated during observations.
Possible explanations may be the exaggerated awareness of dehydration per se (25), an
isolated occurrence from individuals within a cohort of professional rugby union players or

14
drinking due to thermal discomfort, as proposed in tetraplegic athletes (36). The proposed
explanations warrant further investigation.
Hyponatremia may also be attributed to pre-exercise hydration status. There were
more observations of post-exercise hyponatremia in this study (on 36% of occasions when
94% of players were euhydrated) versus normonatremia (on 0% of occasions when 89% of
players were hypohydrated) in a similar study by Cosgrove et al. (9). Despite no player
experiencing dehydration greater than 2% and the lowest blood[Na+] reported as 137 mmol/L,
it was recommended that players should work on starting exercise euhydrated (9). These
recommendations may be appropriate for players exercising in 21oC and 27oC, although
during exercise in cool environmental conditions (such as the UK), if the reason that some
players consumed excessive fluid (in relation to fluid loss) was due to (proposed) thermal
discomfort (36) rather than a reduction in total body water, it may be beneficial for those
players to start exercise hypohydrated, as observed by Cosgrove et al. (9). Theoretically, this
would mean that pre-exercise blood[Na+] would be elevated and the consumption of excessive
fluid in relation to fluid loss in those players who had a ∆BM of -0.1 – -0.9, 0.0 and ≥0.1%
(table 3) would likely result in normonatremia as opposed to the prevalence (35, 57 and 43%)
of hyponatremia post-exercise. The greatest number of observations of post-exercise
hyponatremia were following match play (table 2) when urine osmolality was significantly less
than training. This was even despite a greater body mass loss and lower fluid intake during
match play compared to training (table 1). This highlights the importance of an individualized
hydration strategy and requires further research. To the author’s knowledge, no study has
shown that starting exercise hypohydrated with ad libitum fluid availability in similar
environmental condition, exercise type and duration has a negative effect on exercise
performance. Also, this arrival state does appear to be the habitual status of athletes on arrival
(9,13,18,19,21,22,35,41). Of note, if environmental temperatures are great, exercise duration
is prolonged and fluid is restricted during exercise, starting exercise euhydrated should be the
paramount concern of the athlete.
15
The syndrome of inappropriate anti-diuretic hormone secretion (SIADH), causing fluid
retention beyond requirements for fluid homeostasis (29) has been associated with
hyponatremia (43). An increase in blood[Na+], caused by hypotonic fluid loss in relation to [Na+]
in extracellular fluid, is the major stimulus for ADH secretion during exercise (8). Urine[Na+]
outside of normal ranges (30 to 90 mmol/L) may suggest SIADH (40), as SIADH causes fluid
retention (i.e. the concentration of urine is greater when produced). This was not the case in
this study as large urine volumes were observed (table 1) and urine concentrations were dilute
in comparison to dehydrated urine samples (1,2). When urine[Na+] were below normal ranges
(<30 mmol/L, suggesting dilutional hyponatremia) post-exercise hyponatremia was observed
on 27% of observations (47% if 135 mmol/L blood[Na+] is included). When above normal
ranges (>90 mmol/L, suggesting SIADH) post-exercise hyponatremia was observed on 56%
of observations (78% if 135 mmol/L blood[Na+] is included). This suggests that for some
players SIADH may have occurred. For other players it is proposed that ingested fluid was not
‘intentionally’ retained, but it was simply an inability to excrete the excess fluid intake, resulting
in dilutional hyponatremia. This is supported by the maximum rate of 500 mL/hr for urine
production by the kidneys (31), exceeded by fluid intake. Maximum rates of urine production
are usually coupled with greater sweat rates during exercise, up to 3 L/hr, (37) not evident in
this study (mean <1 L/hr).
Homeostatically controlled sweat[Na+] is often discussed with post-exercise
hyponatremia and ∆blood[Na+] (44), whereas regulated urine[Na+] may be more appropriate
and warrant further investigation. Especially considering the association between SIADH, fluid
retention, hyponatremia and urine[Na+] (40). It should be noted that a practical and precise
method for collecting and determining sweat sodium loss is still debatable (3,34,45), thus
sweat[Na+] in this study maybe a gross overestimation of whole-body[Na+] (45). Contrary
blood[Na+], the key measure for quantifying sodium homeostasis was undertaken with
precision. Further research is required to evaluate if observations from this study are present
in other professional rugby union players, in varying environmental conditions and also if high
fluid intake in relation to fluid loss occurs in other sporting populations (table 3) who compete
16
in cold environmental conditions, in addition to establishing the associated mechanisms. In
addition, due to the fact this study did not quantify the differences in work performed within
and between training sessions, future research should look at the effects of various field based
sessions, quantified using global positioning system technology on fluid balance and rugby
specific exercise performance.
In conclusion, based on observations of a cohort of professional rugby union players,
severe dehydration sufficient to impair exercise performance does not appear to be
problematic. On occasions, it appears fluid intake is excessive during match play and training
in relation to fluid loss, resulting in observations of post-exercise hyponatremia, occurring on
35, 57 and 43% of occasions when ∆BM is -0.1 – -0.9, 0.0 and ≥0.1%. However when players
experience a ∆BM ≥-1%, they do not experience post-exercise hyponatremia. Practitioners
should be aware of the prevalence of over-drinking in addition to previously reported
dehydration.
PRACTICAL APPLICATIONS
This study suggests that strength and conditioning coaches, sports science staff and
nutritionists should be aware of over-drinking in some rugby union players competing in cooler
environmental conditions, as post-exercise hyponatremia was observed on numerous
occasions. Fluid losses appear greatest during match play and lowest during gym training
sessions; contrary to this fluid intake appears greatest during field training sessions and lowest
during match play. Players may need advising on appropriate fluid intake rates to prevent
over-drinking. The addition of sodium to fluid may also be advantageous. Although a loss of
body mass is indicative of dehydration, if players start exercise euhydrated (urine osmolality
<700 mOsmol/kg) and have a ∆BM of -0.1 – -0.9, 0.0 and ≥0.1%, post-exercise hyponatremia
was observed on 35, 57 and 43% of occasions. A ∆BM of 1% or greater during exercise may
prevent post-exercise hyponatremia (blood[Na+] <135 mmol/L). Support staff should also be
aware of the non-fluid mass losses that occur during exercise (see 17) when using body mass

17
change to determine fluid loss and for rehydration purposes; i.e. a maintenance of body mass
during exercise reconciles with an increase in total body water.
18
REFERENCES
1. Armstrong, LE, Herrera Soto, JA, Hacker, FT, Casa, DJ, Kavouras, SA, and Maresh,
CM. Urinary indices during dehydration, exercise, and rehydration. Int J Sport Nutr 8:
345-355, 1998.
2. Armstrong, LE, Maresh, CM, Castellani, JW, Bergeron, MF, Kenefick, RW, LaGasse,
KE, and Riebe, D. Urinary indices of hydration status. Int J Sport Nutr 4: 265-279,
1994.
3. Baker, LB, Stofan, J, Hamilton, AA, and Horswill, C. Comparison of regional patch
collection vs. Whole-body washdown for measuring sweat sodium and potassium
during exercise. J Appl Physiol 107: 887-895, 2009.
4. Beltrami, FG, Hew-Butler, T, and Noakes, TD. Drinking policies and exercise-
associated hyponatremia: is anyone still promoting overdrinking. Br J Sports Med 42:
496-501, 2008.
5. Cheuvront, SN, Carter, R, and Sawka, MN. Fluid balance and endurance exercise
performance. Curr Sports Med Rep 2: 202-208, 2003.
6. Cheuvront, SN and Kenefick, RW. Dehydration: Physiology, Assessment, and
Performance Effects. Compr Physiol 4: 257-285, 2014.
7. Cohen, I, Mitchell, D, Seider, R, Kahn, A, and Phillips, F. The effect of water defecit on
body temperature during rugby. S Afr Med J 60: 11-14, 1981.
8. Convertino, VA, Keil, LC, Bernauer, EM, and Greenleaf, JE. Plasma volume,
osmolality, vasporessin and renin activity during graded exercise in man. J Appl
Physiol 50: 123-128, 1981.
9. Cosgrove, SD, Love, TD, Brown, RC, Baker, DF, Howe, AS, and Black, KE. Fluid and
electrolyte balance during two different pre-season training session in elite rugby union
players. J Strength Cond Res Epub ahead of print; 2013.
10. Cunniffe, B, Proctor, W, Baker, JS, and Davies, B. An evaluation of the physiological
demands of elite rugby union using gps tracking software. J Strength Cond Res 23:
1195-1203, 2009.
19
11. Dill, DB, and Costill, DL. Calculation of percentage changes in volumes of blood,
plasma and red cells in dehydration. J Appl Physiol 37: 247-248, 1974.
12. Duthie, GM, Pyne, DB, and Hooper, SL. Applied physiology and game analysis of
rugby union. Sports Med 33: 973-991, 2003.
13. Godek, SF, Godek, JJ, and Bartolozzi, AR. Hydration status in college football players
during consecutive days of twice-a-day preseason practices. Am J Sport Med 33: 843-
851, 2005.
14. Goodman, C, Cohen, I, and Watson, J. The effect of water intake on body temperature
during rugby matches. S Afr Med J 67: 542-544, 1985.
15. Goudie, AM, Tustall-Pedoe, DS, Kerins, M, and Terris, J. Exercise-associated
hyponatremia after a marathon: case series. J Roy Soc Med 99: 363-367, 2006.
16. Gregory, J, Foster, K, Tyler, H, and Wiseman, M. The dietary and nutritional survey of
British adults. London: HMSO, 1990.
17. King, RFGJ, Cooke, CB, Carroll, S, and O’Hara, J. Estimating changes in hydration
status from changes in body mass: considerations regarding metabolic water and
glycogen storage. J Sports Sci 26: 1361-1363, 2008.
18. Maughan, RJ, Dargavel, LA, Hares, R, and Shirreffs, SM. Water and salt balance of
well-trained swimmers in training. Int J Sport Nutr Exerc Metab 19: 598-606, 2009.
19. Maughan, RJ, Merson, SJ, Broad, NP, and Shirreffs, SM. Fluid and electrolyte intake
and loss in elite soccer players during training. Int J Sport Nutr Exerc Metab 14: 333-
346, 2004.
20. Maughan, RJ, Shirreffs, SM, and Leiper, JB. Errors in the estimation of hydration status
from changes in body mass. J Sports Sci 25: 797-804, 2007.
21. Maughan, RJ, Shirreffs, SM, Merson, SJ, and Horswill, CA. Fluid and electrolyte
balance in elite male football (soccer) players training in a cool environment. J Sports
Sci 23: 73-79, 2005.
22. Maughan, RJ, Watson, P, Evans, GH, Broad, N, and Shirreffs, SM. Water balance and
salt losses in competitive football. Int J Sport Nutr Exerc Metab 17: 583-594, 2007.
20
23. Meir, RA, and Halliday, AJ. Pre- and post-game body mass changes during an
international rugby tournament: a practical perspective. J Strength Cond Res 19: 713-
716, 2005.
24. Meir, RA, Brooks, L and Rogerson, S. What do changes in pre-match versus post-
match, 1, 2 and 3 days post-match body weight tell us about fluid status in English
Premiership rugby union players? The Journal of Strength and Conditioning Research,
25:2337-2343, 2011.
25. Noakes, TD. Is drinking to thirst optimum? Ann Nutr Metab 57: 9 – 17, 2010.
26. Noakes, TD. Overconsumption of fluid by athletes. BMJ 327: 113-114, 2003.
27. Noakes, TD. Water intoxication - considerations for patients, athletes and physicians.
Nutrition Issues in Gastroenterology 66: 46-53, 2008.
28. Noakes, TD. Why marathon runners collapse. S Afr Med J 73: 569-570, 1988.
29. Noakes, TD, Sharwood, K, Speedy, DB, Hew-Butler, T, Reid, S, Dugas, J, Almond, C,
Wharam, P, and Weschler, LB. Three independent biological mechanisms cause
exercise-associated hyponatremia: evidence from 2,135 weighed competitive athletic
performances. Proc Natl Acad Sci USA 102: 18550-18555, 2005.
30. Noakes, TD, Speedy DB. Case proven: exercise associated hyponatraemia is due to
overdrinking. So why did it take 20 years before the original evidence was accepted?
Br J Sports Med 2006; 40: 567-572.
31. Noakes, TD, Wilson, G, Gray, DA, Lambert, MI, and Dennis, SC. Peak rates of diuresis
in healthy humans during oral fluid overload. S Afr Med J 91: 852-857, 2001.
32. Nolte, HW, Noakes, TD, and Van Vuuren, B. Protection of total body water content and
absence of hyperthermia despite 2% body mass loss ('voluntary dehydration') in
soldiers drinking ad libitum during prolonged exercise in cool environmental conditions.
Br J Sports Med 45: 1106-1112, 2011.
33. O'Hara, JP, Jones, BL, Tsakirides, C, Carroll, S, Cooke, CB, and King, RFGJ.
Hydration status of rugby league players during home match play throughout the 2008
super league season. Appl Physiol Nutr Metab, 35: 790-796, 2010.
21
34. Patterson, MJ, Galloway, SDR, and Nimmo, MA. Variations in regional sweat
composition in normal human males. Exp Physiol 85: 869-875, 2000.
35. Pickering, AJ, Rehrer, NJ, and Hellemans, IJ. Hydration status of male football players
across a week of training and competition. Medicina Sportiva 15: 125-131, 2011.
36. Price, MJ, and Campbell, IG. Effects of spinal cord lesion level upon thermoregulation
during exercise in the heat. Med Sci Sport Exer 35: 1100-1107, 2003.
37. Rehrer, NJ, and Burke, LM. Sweat losses during various sports. Aust J Nutr Diet 53;
13-17, 1996.
38. Sawka, MN, Burke, LM, Eichner, R, Maughan, RJ, Montain, SJ, and Stachenfeld, NS.
ACSM position stand: exercise and fluid replacement. Med Sci Sport Exer 39: 377-
390, 2007.
39. Sawka, MN, Gonzalez, PR, Young, AJ, Dennis, RC, Valeri, CR, Pandolf, KB. Control
of thermoregulatory sweating during exercise in the heat. Am J Physiol 257: 311-316,
1989.
40. Schucany, WG. Exercise-associated hyponatremia. Proceedings (Baylor University.
Medical Center) 20: 398-401, 2007.
41. Shirreffs, SM, Aragon-Vargus, LF, Chamorro, M, Maughan, RJ, Serratosa, L, and
Zachwieja, JJ. The sweating response of elite professional soccer players to training
in the heat. Int J Sports Med 26: 90-95, 2005.
42. Shirreffs, SM, and Maughan, RJ. Urine osmolality and conductivity as indices of
hydration status in athletes in the heat. Med Sci Sport Exer 30: 1598-1602, 1998.
43. Speedy, DB, Rogers, IR, Noakes, TD, Wright, S, Thompson, JM, Campbell, R,
Hellemans, IJ, Kimber, NE, Boswell, DR, Kuttner, JA, and Safih, S. Exercise-induced
hyponatremia in ultradistance triathletes is caused by inappropriate fluid retention. Clin
J Sport Med 10: 272-278, 2000.
44. Stofan, JR, Zachwieja, JJ, Horswill, CA, Murray, R, Anderson, SA, and Eichner, R.
Sweat and sodium losses in NCAA football players: a precursor to heat cramps? Int J
Sport Nutr Exerc Metab 15: 641-652, 2005.

22
45. Weschler, LB. Sweat electrolyte concentrations obtained from within occlusive
coverings are falsely high because sweat itself leaches skin electrolytes. J Appl
Physiol 105: 1376-1377, 2008.
23
Table 1. Body mass change (∆BM), arrival urine osmolality (UOsmol), fluid intake (FI), urine output (UO), fluid loss (FL) and plasma volume change (∆PV) during match play, field and gym training sessions
Match Play Field Training Gym Training Post-hoc
∆BM
(%)
-1.0 ± 0.7*
(-2.1 to 0.1)
n=23
-0.3 ± 0.6
(-1.5 to 0.8)
n=45
-0.1 ± 0.6
(-1.6 to 0.8)
n=33
MP>FT, GT
UOsmol
(mOsm/kg)
279 ± 105*
(95 to 459)
n=23
416 ± 134
(105 to 709)
n=45
541 ± 288
(78 to 1056)
n=33
MP<FT, GT
FI
(kg)
0.96 ± 0.56
(0.00 to 1.96)
n=23
1.22 ± 0.60
(0.00 to 2.53)
n=45
0.99 ± 0.50
(0.00 to 2.01)
n=33
UO
(kg)
0.62 ± 0.24
(0.21 to 0.99)
n=23
0.68 ± 0.43
(0.02 to 2.07)
n=45
0.55 ± 0.47
(0.00 to 2.16)
n=33
FL
(kg)
1.40 ± 0.98*
(0.42 to 3.02)
n=23
1.01 ± 0.45*
(0.10 to 2.49)
n=45
0.64 ± 0.54*
(0.09 to 2.46)
n=33
MP>GT,
FT>GT
∆PV
(%)
13.0 ± 10.4
(0.6 to 28.0)
n=19
6.1 ± 5.7
(-7.2 to 21.5)
n=38
8.5 ± 10.2
(-7.2 to 31.8)
n=29
Data presented as mean ± standard deviation. Ranges are presented in parentheses. MP = match play, FT = field training and GT = gym training. n= subject observations. * denotes a signficant difference (P<0.05) between MP, FT and/or GT.
24
Table 2. Sodium loss, sodium intake, pre-blood[Na+], post-blood[Na+] and the observations of post-exercise hyponatremia during match play, field and gym training sessions
Match Play Field Training Gym Training Post-hoc
Sweat Na+ Loss
(g)
2.52 ± 1.59*
(0.50 to 5.19)
n=15
1.82 ± 0.87
(0.59 to 4.02)
n=39
1.03 ± 0.83
(0.17 to 4.28)
n=27
MP>FT, GT
Urine Na+ Loss
(g)
0.95 ± 0.77*
(0.14 to 2.37)
n=20
1.01 ± 0.73
(0.07 to 2.76)
n=42
0.71 ± 0.65
(0.18 to 2.50)
n=31
MP>FT, GT
Total Na+ Loss
(g)
3.08 ± 1.74
(0.28 to 5.85)
n=15
2.42 ± 1.14
(0.13 to 6.51)
n=39
1.35 ± 0.93
(0.18 to 4.56)
n=30
Total Na+ intake
(g)
0.16 ± 0.14
(0.00 to 0.46)
n=23
0.16 ± 0.13
(0.00 to 0.46)
n=45
0.22 ± 0.15
(0.00 to 0.46)
n=33
Pre-blood[Na+]
(mmol/L)
137.3 ± 1.0
(136.0 to 139.0)
n=18
136.5 ± 1.7
(133.0 to 139.0)
n=38
137.0 ± 2.0
(134.0 to 142.0)
n=30
Post-blood[Na+]
(mmol/L)
135.9 ± 2.0
(133.0 to 138.0)
n=17
135.4 ± 1.6
(132.0 to 139.0)
n=39
135.4 ± 1.7
(132.0 to 139.0)
n=29
Observations of Post-
Exercise Hyponatremia
(%)
33 19 16
Data presented as mean ± standard deviation. Ranges are presented in parentheses. MP = match play, FT = field training and GT = gym training. n= subject observations. * denotes a signficant difference (P<0.05) between MP, FT and/or GT.
25
Table 3. Body mass change (∆BM), fluid intake (FI), fluid loss (FL), post-exercise blood sodium concentration ([Na+]blood-post), plasma volume change (∆PV) and the observations of post-exercise hyponatremia categorised according to ∆BM
Body Mass
Change
Category
≥2.0%
Loss
(n = 1)
1.0-1.9%
Loss
(n = 10)
0.1-0.9%
Loss
(n = 31)
0.0%
(n = 7)
≥0.1%
Gain
(n = 21)
∆BM
(%) -2.1
-1.3 ± 0.2
(-1.7 to -1.0)
-0.5 ± 0.2
(-0.9 to -0.1)
0.0 ± 0.0
(0.0 to 0.0)
0.4 ± 0.2
(0.1 to 0.8)
FI
(kg) 1.266
0.751 ± 0.394
(0.266 to 1.501)
1.183 ± 0.547
(0.436 to 2.395)
1.543 ± 0.678
(0.877 to 2.528)
1.281 ± 0.421
(0.699 to 2.018)
FL
(kg) 2.961
1.205 ± 0.643
(0.304 to 2.638)
0.954 ± 0.599
(0.200 to 2.460)
0.825 ± 0.489
(0.395 to 1.788)
0.572 ± 0.296
(0.089 to 1.133)
Pre-blood[Na+]
(mmol/L) 137.0
136.5 ± 1.3
(135.0 to 138.0)
135.6 ± 1.6
(133.0 to 139.0)
134.4 ± 1.0
(133.0 to 136.0)
135.0 ± 1.7
(132.0 to 139. 0)
∆PV
(%) 3.8
4.8 ± 9.3
(-3.1 to 28.0)
7.3 ± 7.5
(-7.2 to 31.2)
9.0 ± 4.8
(3.2 to 15.2)
9.6 ± 8.1
(-1.7 to 31.8)
Observations
of Post-
Exercise
Hyponatremia
(%)
0 0 35 57 43
Data presented as mean ± standard deviation. The numbers of individuals within each classification are reported in parentheses, as are the ranges for each variable reported. n= subject observations.
26
Table 4. The relationship of body mass change (∆BM), fluid intake (FI), fluid loss (FL), fluid retention (FR), plasma volume change (∆PV), total sodium loss (Na+ Loss), total sodium intake (Na+ intake), pre-blood[Na+], sweat[Na+] and urine[Na+] with post-blood[Na+] during training and match play.
Post-blood[Na+] (mmol/L)
∆BM (%) r=-0.295 (P=0.011) n=70
FI (kg) r=-0.197 (P=0.118) n=70
FL (kg) r=-0.317 (P=0.011) n=70
FR (kg) r=-0.113 (P=0.350)
n=70
∆PV (%) r=-0.042 (P=0.734) n=70
Na+ Loss (g) r=0.214 (P=0.154) n=70
Na+ intake (g) r=-0.058 (P=0.636) n=70
Pre-blood[Na+] (mmol/L) r=0.238 (P=0.051) n=70
Sweat[Na+] (mmol/L) r=-0.323 (P=0.441)
n=70
Urine[Na+] (mmol/L) r=-0.211 (P=0.350)
n=70
FR = FI – UO. n= subject observations
27
Figure 1. Individual body mass change and post-exercise blood[Na+] for professional rugby union players during training and match play (r=-0.295, P=0.011). Note; the shaded area represents hyponatremia (blood[Na+] ≤135 mmol/L)
131
132
133
134
135
136
137
138
139
140
-3.0 -2.0 -1.0 0.0 1.0
Po
st-E
xerc
ise
Blo
od
[Na+
] (m
mo
l/L)
Body Mass Change (%)