Embed Size (px)
Citation preview

U.S. PUBLIC FINANCE
CREDIT OPINION1 August 2019
Analyst Contacts
Matthew Butler +1.212.553.7108VP-Senior [email protected]
Genevieve Nolan +1.212.553.3912VP-Senior [email protected]
CLIENT SERVICES
Americas 1-212-553-1653
Asia Pacific 852-3551-3077
Japan 81-3-5408-4100
EMEA 44-20-7772-5454
Delaware (State of)Update to credit analysis
SummaryThe State of Delaware (Aaa stable) maintains a strong credit position that is largelysupported by its strong management and governance and its healthy and stable finances.The state's well-established process for monitoring revenue and its statutory limits onannual spending growth are important tools that aid financial management. The state'shealthy reserves provide a cushion in the event of a revenue downturn, which could be morepronounced in Delaware given its high reliance on business taxes.
The state's economic profile is solid, though it lags the US on several growth measures.Delaware has seen less growth in recent years in its financial services sector, which hasslowed the rise in state income relative to the nation. However, certain sectors of theeconomy have potential to expand and the state's lower business costs and cost of livingcould continue to attract residents to fill new positions.
Relative to highly-rated states, Delaware's leverage is high and consists mostly of unfundedpensions and retiree healthcare liabilities. The high leverage largely stems from the stateassuming total responsibility for funding post-employment benefits of local school districts.The state recently began an effort to explore options for addressing retiree healthcareobligations, which could present it with an opportunity to reduce its overall leverage.
Exhibit 1
Delaware increased its available fund balanceafter steadily drawing down through 2017Components of general fund balance and balancerelative to revenue by fiscal year
Exhibit 2
Liquidity across the general fund and othergovernmental funds is stable and strongCash and investments across funds and relative torevenue by fiscal year
20%
40%
60%
0%
5%
10%
15%
20%
25%
30%
35%
$0.0
$0.2
$0.4
$0.6
$0.8
$1.0
$1.2
$1.4
$1.6
Billio
ns
Restricted and nonspendableAssigned and committedUnassignedAvailable fund balance / revenue
Available fund balance is the sum of unassigned, assignedand committed fund balance. It excludes restricted andnonspendable fund balance.Source: Delaware's audited financial statements
0%
20%
40%
60%
$0.0
$1.0
$2.0
$3.0
Billio
ns
Cash and investments - other governmental fundsCash and investments - general fundTotal cash / own-source revenue (right axis)Total cash / total governmental revenue (right axis)
Other governmental fund cash and investments and revenueincludes amounts reported by the Delaware Department ofTransportation, which is a business enterprise of the state.Source: Delaware's audited financial statements

MOODY'S INVESTORS SERVICE U.S. PUBLIC FINANCE
Credit strengths
» Stable budget reserve account backed by additional unencumbered reserves following strong operations in fiscal years 2018 and2019
» Very healthy liquidity and improved GAAP-basis fund balance
» Strong financial management and governance indicated by frequent revenue forecasting and statutory limit on spending
» Lower business costs and cost of living relative to neighboring states could continue to attract new residents as certain economicsectors have the potential to expand
Credit challenges
» Low industrial diversity among US states given sizeable economic concentration in financial services
» Heavy dependence on business taxes and a sustained role as the preferred legal home of many publicly traded companies
» Medicaid expenditures are steadily rising and consuming a growing share of the state's total revenue
Rating outlookThe stable outlook is supported by the state's strong structural governance features that will keep the state in a sound position relativeto peers through future economic cycles.
Factors that could lead to an upgradeNo applicable.
Factors that could lead to a downgrade
» Growth in spending that the state accommodates with nonrecurring resources or a material use of reserves
» A sustained and material slowdown in economic expansion that is a drag on revenue growth
» Growth in long-term liabilities that outpaces expansion of the state's economy
Key indicators
Exhibit 3
Delaware (State of) 2014 2015 2016 2017 2018 50-State Median
(2017)
Operating Fund Revenues (000s) 4,255,647 4,749,041 4,816,998 4,854,688 5,265,653 10,869,281
Available Balances as % of Operating Fund Revenues 24.7% 21.9% 13.6% 5.7% 13.0% 4.6%
Nominal GDP (billions) 67.2 70.9 70.4 72.2 75.0 224.0
Nominal GDP Growth 10.7% 5.5% -0.7% 2.5% 3.9% 3.9%
Total Non-Farm Employment Growth 2.3% 2.3% 1.0% 0.8% 1.1% 1.1%
Fixed Costs as % of Own-Source Revenue NA 13.8% 13.7% 14.2% 13.2% 8.9%
Adjusted Net Pension Liabilities (000s) 4,161,993 3,859,643 3,406,059 6,373,422 5,827,393 12,033,341
Net Tax-Supported Debt (000s) 2,818,890 2,789,718 2,939,056 2,985,593 3,101,007 4,412,204
(Adjusted Net Pension Liability + Net Tax-Supported Debt) / GDP 10.4% 9.4% 9.0% 13.0% 11.9% 8.2%
Source: Delaware's audited financial statements, US Bureau of Economic Analysis and Moody's Investors Service
This publication does not announce a credit rating action. For any credit ratings referenced in this publication, please see the ratings tab on the issuer/entity page onwww.moodys.com for the most updated credit rating action information and rating history.
2 1 August 2019 Delaware (State of): Update to credit analysis
MOODY'S INVESTORS SERVICE U.S. PUBLIC FINANCE
ProfileDelaware is the sixth-smallest state, based on its estimated population of just over 960,000. The state's gross domestic product,currently about $75 billion, ranks 41st among states. Delaware's personal income per capita in 2018 was $51,500, or 96% of thenational level.
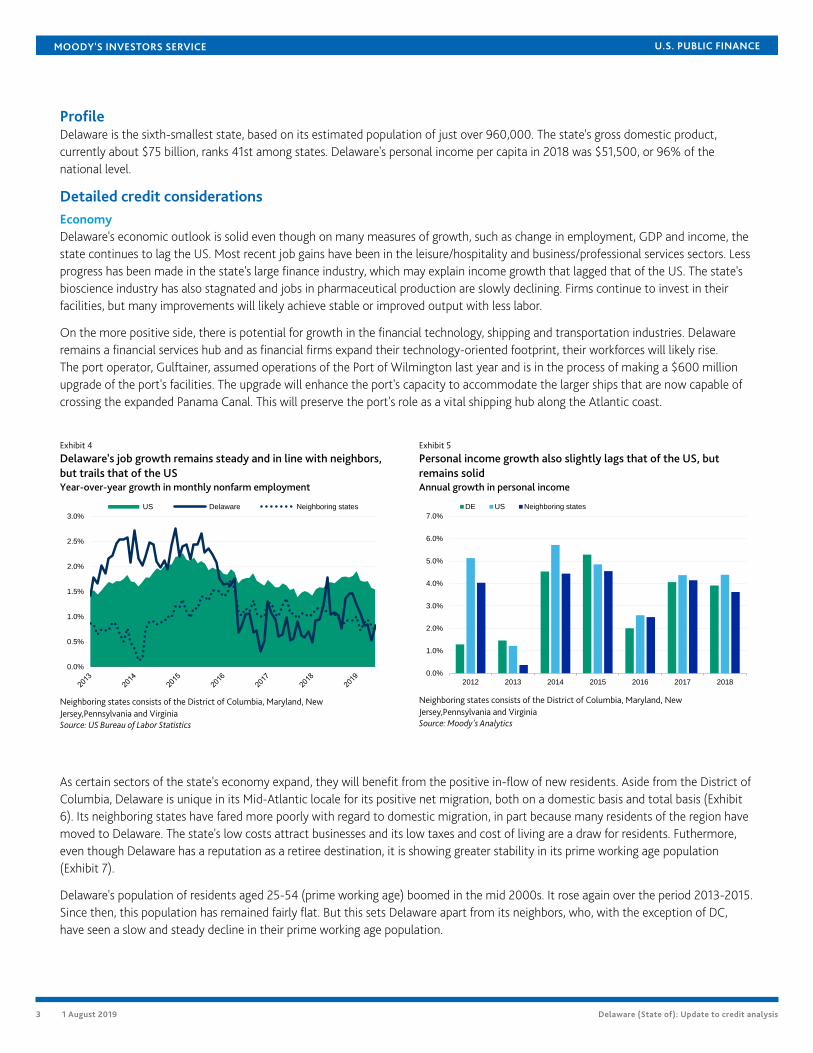
Detailed credit considerationsEconomyDelaware's economic outlook is solid even though on many measures of growth, such as change in employment, GDP and income, thestate continues to lag the US. Most recent job gains have been in the leisure/hospitality and business/professional services sectors. Lessprogress has been made in the state's large finance industry, which may explain income growth that lagged that of the US. The state'sbioscience industry has also stagnated and jobs in pharmaceutical production are slowly declining. Firms continue to invest in theirfacilities, but many improvements will likely achieve stable or improved output with less labor.
On the more positive side, there is potential for growth in the financial technology, shipping and transportation industries. Delawareremains a financial services hub and as financial firms expand their technology-oriented footprint, their workforces will likely rise.The port operator, Gulftainer, assumed operations of the Port of Wilmington last year and is in the process of making a $600 millionupgrade of the port's facilities. The upgrade will enhance the port's capacity to accommodate the larger ships that are now capable ofcrossing the expanded Panama Canal. This will preserve the port's role as a vital shipping hub along the Atlantic coast.
Exhibit 4
Delaware's job growth remains steady and in line with neighbors,but trails that of the USYear-over-year growth in monthly nonfarm employment
Exhibit 5
Personal income growth also slightly lags that of the US, butremains solidAnnual growth in personal income
0.0%
0.5%
1.0%
1.5%
2.0%
2.5%
3.0%
US Delaware Neighboring states
Neighboring states consists of the District of Columbia, Maryland, NewJersey,Pennsylvania and VirginiaSource: US Bureau of Labor Statistics
0.0%
1.0%
2.0%
3.0%
4.0%
5.0%
6.0%
7.0%
2012 2013 2014 2015 2016 2017 2018
DE US Neighboring states
Neighboring states consists of the District of Columbia, Maryland, NewJersey,Pennsylvania and VirginiaSource: Moody's Analytics
As certain sectors of the state's economy expand, they will benefit from the positive in-flow of new residents. Aside from the District ofColumbia, Delaware is unique in its Mid-Atlantic locale for its positive net migration, both on a domestic basis and total basis (Exhibit6). Its neighboring states have fared more poorly with regard to domestic migration, in part because many residents of the region havemoved to Delaware. The state's low costs attract businesses and its low taxes and cost of living are a draw for residents. Futhermore,even though Delaware has a reputation as a retiree destination, it is showing greater stability in its prime working age population(Exhibit 7).
Delaware's population of residents aged 25-54 (prime working age) boomed in the mid 2000s. It rose again over the period 2013-2015.Since then, this population has remained fairly flat. But this sets Delaware apart from its neighbors, who, with the exception of DC,have seen a slow and steady decline in their prime working age population.
3 1 August 2019 Delaware (State of): Update to credit analysis

MOODY'S INVESTORS SERVICE U.S. PUBLIC FINANCE
Exhibit 6
Net migration, both domestic and total, is more positive inDelaware than most of its neighborsFive-year average of annual migration as a percentage of state population
Exhibit 7
Delaware's prime working age population grew faster than peersover the past several yearsPrime working age population relative to the year 2000
-0.6%
-0.4%
-0.2%
0.0%
0.2%
0.4%
0.6%
0.8%
1.0%
DE DC MD NJ PA VA
Domestic net migration Total net migration
Source: Moody's Analytics
0.85
0.90
0.95
1.00
1.05
1.10
1.15
US DE Neighboring states
Neighboring states consists of the District of Columbia, Maryland, NewJersey,Pennsylvania and VirginiaSource: Moody's Analytics
As a US state, Delaware will continue to demonstrate high resilience to environmental risks, especially relative to other sectors. Ingeneral, US states face low credit risk stemming from environmental events, the most likely to occur being natural disasters. Whendisaster strikes, states typically incur minimal costs, with the federal government, via FEMA, taking a large role in funding recovery. Thatsaid, Delaware's exposure to flood and storm risk is higher than many states given its small size and location on the Atlantic Ocean.
An estimated 10% of Delaware's dwelling units are located in a 100/500 year floodplain, which is equal to the median ratio amongstates with coastlines. The state has been spared extensive damage by storms that hit areas further south and north along the easternseaboard. From 1980 through 2017, damage from tropical storms, adjusted for annual inflation, was a small 0.9% of Delaware's GDP.This is a ratio lower than that of some of the state's neighbors, including New Jersey (5.7%), Virginia (1.4%) and Maryland (1.2%), andstates further south along the coast, such as North Carolina (5.5%) and South Carolina (7.4%).
FinancesDelaware's finances are strong. The state faced a large budget gap in fiscal 2018 after expenditures grew more quickly than revenuefor several years. The state enacted a mix of spending reductions and tax increases to more than offset the gap. On a budgetary basis,the state closed fiscal 2018 with a $275 million general fund operating surplus. On a GAAP-basis, the state increased its availablefund balance to 13% of revenue from 5.7% in fiscal 2017 (see Exhibit 1 above). On a budgetary basis, the state's unencumberedreserves grew to just under 13% of revenue (see Exhibit 8 below). This consists of the state's mandated 5% budget reserve and otherunencumbered cash.
The fiscal 2019 budget kept recurring revenue well above recurring expenses. The budget included $238 million of nonrecurringspending (80% for capital investments) and assumed general fund budgetary reserves would drop to about 11% of revenue from 13%in fiscal 2018. However, revenue and spending assumptions were conservative and the state estimates year-end fiscal 2019 generalfund reserves at just under 14% of revenue.
The fiscal 2020 budget includes growth in recurring spending of 4.2%, with the bulk of increased spending accommodating schools.The budget also sets aside about $126 million in a new savings account separate from the state's statutory budget reserve. Combined,the year-end budget reserve and savings account should amount to at least 8% of fiscal 2020 general fund revenue. It is very likely thestate will also close the year with an additional balance of unencumbered cash.
Delaware's tax revenue system relies on the state's role as the preferred legal home for publicly traded companies. About half of allUS publicly traded firms and more than two-thirds of the Fortune 500 are organized under Delaware law. The state derives half ofits general fund revenue from taxes on businesses (see Exhibit 9 below). The two largest components of business-related revenue are
4 1 August 2019 Delaware (State of): Update to credit analysis

MOODY'S INVESTORS SERVICE U.S. PUBLIC FINANCE
franchise taxes levied on corporations based in the state and abandoned property revenue. Together, these two sources account foralmost 30% of the state's anticipated fiscal 2020 general fund revenue.
Exhibit 8
Delaware added to its available reserves over the past couple yearsBudgetary-basis reserves by fiscal year
Exhibit 9
Delaware's general fund is heavily dependent on business taxesComposition of projected fiscal 2020 general fund revenue
0%
2%
4%
6%
8%
10%
12%
14%
16%
$-
$100
$200
$300
$400
$500
$600
$700
2012 2013 2014 2015 2016 2017 2018 2019
Millio
ns
Other unencumbered cashBudget reserveTotal cash reserves / revenue (right axis)
Source: Delaware budget documentation
Business taxes50%
Personal income taxes34%
Other taxes9%
Other revenue7%
Source: June 2019 report of the Delaware Economic and Financial Advisory Council
The state created the secondary general fund savings account in the fiscal 2020 budget primarily to better prepare itself for a downturnin revenue that could be exacerbated by the concentration of business taxes. The new savings account is on top of the state's budgetreserve account, which it has maintained since 1980. The budget reserve can have as much as 5% of the state general fund's estimatedbudgetary revenue. Drawing these funds requires approval by three-fifths of both legislative chambers.
By observing a limit on appropriations, Delaware creates a second buffer against revenue underperformance. The state can onlyappropriate 98% of estimated available funds (sum of general fund revenue and unencumbered cash outside of the budget reserveaccount), and this can only be waived with approval of three-fifths of the legislature.
As in most states, education and healthcare dominate Delaware's spending (Exhibit 10). Medicaid spending makes up about two-thirds of the state's total health and human services spending, or 26% of total state spending. As of April 2019, 25% of Delawareresidents were covered by Medicaid, compared to 22% nationwide. The share of state spending on Medicaid has remained stable asa share of Delaware's own-source revenue (Exhibit 11), and, at 16%, it is just lower than the 50-state median of 17%. At the sametime, however, total Medicaid spending is rising. Most of this spending growth has been accommodated with federal funds, but totalMedicaid spending now consumes 35% of Delaware's total governmental revenue, up from 22% in 2012. A change in federal funding ofMedicaid could present the state with difficult spending and policy decisions.
Exhibit 10
As in most states, education and health services dominateDelaware's state spendingComposition of total state spending, fiscal 2018
Exhibit 11
Medicaid spending from state funds is flat, but total expendituresare rising steadilyMedicaid spending by state funding source
Heath and human services39%
Education29%
Public safety8%
Transportation8%
General gov.6%
Debt service4%
Capital outlay3%
Other3%
Source: Delaware's audited financial statements
0%
10%
20%
30%
40%
$0.0
$0.5
$1.0
$1.5
$2.0
$2.5
2012 2013 2014 2015 2016 2017 2018
Billio
ns
Other state fundsFederal fundsGeneral fundState spending / own-source revenue (right axis)Total spending / governmental revenue (right axis)
Source: National Association of State Budget Officers, Delaware's audited financialstatements, and Moody's Investors Service
5 1 August 2019 Delaware (State of): Update to credit analysis

MOODY'S INVESTORS SERVICE U.S. PUBLIC FINANCE
LIQUIDITYDelaware's liquidity has always been strong. The state reports most of its pooled cash and investments in its general fund and closedfiscal 2018 with just under $2 billion of cash and investments in that fund (see Exhibit 2 above). Across governmental activities,liquidity has remained stable for several years and Delaware has not had to issue bond- or revenue-anticipation notes in more than 40years.
Debt and pensionsDelaware's debt and pension burden is high among states relative to GDP. Relative to revenue, Delaware's burden is much closer to thestate median (see Exhibits 12 and 13 below). A share of Delaware's revenue is derived from economic activity outside the state becauseof the state's taxes and franchise fees on businesses incorporated in the state. This largely accounts for the difference in the debt andpension burdens as shares of GDP and revenue relative to other states.
Exhibit 12
Delaware's debt and pension burden is well above the state medianrelative to GDP...
Exhibit 13
...but much more aligned with other states when compared tostate revenue
0%
2%
4%
6%
8%
10%
12%
14%
2014 2015 2016 2017 2018 2019
ANPL / GDP
NTSD / GDP
State median (ANPL and NTSD / GDP)
NTSD is net tax supported debt. ANPL is adjusted net pension liability. 2019 ratios assumegrowth in state GDP equal to the average growth rate of the past five years. Sufficientinformation is not yet available for all states to compute medians for 2018 and 2019.Source: Audited financial statements of Delaware and its pension plans, and Moody's InvestorsService
0%
20%
40%
60%
80%
100%
120%
140%
160%
180%
2014 2015 2016 2017 2018 2019
NTSD / revenue
ANPL / revenue
State median (ANPL and NTSD / revenue)
NTSD is net tax supported debt. ANPL is adjusted net pension liability. 2019 ratios assumegrowth in state revenue equal to the average growth rate of the past five years. Sufficientinformation is not yet available for all states to compute medians for 2018 and 2019.Source: Audited financial statements of Delaware and its pension plans, and Moody's InvestorsService
It is also important to note that Delaware's pension burden accounts for all assets and liabilities of plans associated with local schooldistricts, which is not the case for all states. Despite remaining above the annual state median, Delaware's combined debt andpension burden is not on a rapidly growing path. Available financial statements of Delaware's pension plans indicate the state's ANPLdeclined moderately in the plans' most recently completed fiscal years. This ANPL will be reported in the state's fiscal 2019 financialstatements.1
Delaware also carries a large unfunded OPEB liability, which, as Exhibit 14 below indicates, is the principal component of the state'sleverage. As with pensions, the state's OPEB liability incorporates retiree healthcare benefits of local school districts, the employees ofwhich are state employees. At the close of fiscal 2018, the state's reported net OPEB liability was $7.6 billion, or 10% of GDP and 120%of own-source revenue. There is no constitutional guarantee of retiree healthcare benefits and we discuss below a new effort by thestate to address these unfunded obligations.
General obligation bonds account for nearly two-thirds of Delaware's outstanding net tax-supported debt (Exhibit 15). Theremainder mostly consists of bonds issued by the Delaware Transportation Authority, a component of the Delaware Department ofTransportation. The state has a small amount of debt outstanding secured by annual appropriations of the legislature. The state'sgeneral obligation bonds include about $500 million of bonds paid with school district property taxes. The state accounts for theproperty taxes in its audited financial statements and, because the taxes are part of the state's revenue base, we include these bonds innet tax-supported debt.
6 1 August 2019 Delaware (State of): Update to credit analysis

MOODY'S INVESTORS SERVICE U.S. PUBLIC FINANCE
Exhibit 14
Unfunded post-employment benefits liabilities (pensions andOPEB) dominate Delaware's leverageComposition of leverage
Exhibit 15
The majority of net tax-supported debt consists of generalobligation bondsComposition of Delaware's bonded debt, fiscal 2019 plus forthcomingrevenue bonds
Net OPEB liability47%
Adjusted net pension liability (ANPL)33%
GO bonds13%
Transportation Authority bonds7%
Appropriation bonds0%
Includes an estimated $146 million of in soon-to-be-issued Delaware TransportationAuthority bonds.Source: Audited financial statements of Delaware and its pension plans, and Moody's InvestorsService
Type of debt Principal (millions)
GO bonds $2,080.9
Appropriation bonds $42.1
Delaware Transportation Authority
Transportation system revenue bonds $714.7
US 301 project revenue bonds $398.1
GARVEEs $56.7
Total tax-supported debt $3,292.4
Includes an estimated $146 million of in soon-to-be-issued Delaware TransportationAuthority bonds.Source: Delaware's audited financial statements and Moody's Investors Service
DEBT STRUCTUREAll of Delaware's debt is fixed rate.
DEBT-RELATED DERIVATIVESThe state is not party to any debt-related derivative agreements.
PENSIONS AND OPEBThe state reports 100% of local school district retirement liabilities on its own balance sheet and these are incorporated in ourcalculation of the state's adjusted liabilities. The rise in the ANPL from 2016 to 2017 was driven by several factors. These includepension fund asset losses, an increase in the reported liability due to a change in mortality assumptions, and a drop in the market-based interest rate we use to value accrued pension liabilities when calculating a government's ANPL. The market-based interest rateused to calculate the state's fiscal 2017 ANPL was 3.6%, down from 4.4% used to calculate the fiscal 2016 ANPL. The market-basedinterest rate rose moderately to 3.9% for the state's fiscal 2018 ANPL and further to 4.14% for estimating the fiscal 2019 ANPL.
Delaware's fiscal 2018 fixed costs were 13.2% of its own-source revenue (all governmental revenue and transportation revenue lessfederal revenue). Fixed costs consist of debt service, pension contributions and payments of other post-employment benefits (OPEB).Delaware's fiscal 2018 OPEB payment was $218 million. For the pension contribution, we calculate a pension “tread water” indicator,which is an estimate of the payment to a government's pension plans that keeps reported net pension liabilities from growing,assuming other actuarial assumptions hold. For fiscal 2018, we estimate Delaware's “tread water” indicator at about $244 million. Thestate's actual pension contribution was $247 million.
On July 10, the governor issued an executive order creating a Retirement Benefit Study Committee and directing that committeeto identify options for eliminating or reducing the state's unfunded OPEB liability. The order directs the committee to commenceregular meetings no later than September 15, 2019 and to present preliminary findings no later than March 2020. Given the lack of aconstitutional protection of retiree healthcare benefits in Delaware, it is possible that the committee could determine a reduction inbenefits or a shift in the financing of benefits from the state to employees and retirees to be prudent options and recommend thoseactions to the governor. There could still be political obstacles to implementing these kinds of adjustments, but they would present thestate with some options to reduce its obligations without a significant increase in spending.
GovernanceDelaware's Aaa rating is based in large part on legal provisions that will encourage the state to maintain a strong financial profile overa long period. A panel of 31 gubernatorial appointees, known as the Delaware Economic and Financial Advisory Council, provides the
7 1 August 2019 Delaware (State of): Update to credit analysis

MOODY'S INVESTORS SERVICE U.S. PUBLIC FINANCE
state's revenue estimates. This panel, which includes officials from the public and private sector, meets six times each year and issuesrevenue and expenditure forecasts used by both the executive and legislative branches of government during the budget process.
The state's requirements for consensus forecasts, well-managed expenditure growth, and a limit on appropriations support long-termprospects for financial strength. Delaware's otherwise strong management profile is tempered by a constitutional requirement that taxincreases be approved by a three-fifths legislative majority, which reduces the state's financial flexibility.
Rating methodology and scorecard factorsThe US States and Territories Rating Methodology includes a scorecard, which summarizes the 10 rating factors generally mostimportant to state and territory credit profiles. Because the scorecard is a summary, and may not include every consideration in thecredit analysis for a specific issuer, a scorecard-indicated outcome may or may not map closely to the actual rating assigned.
Delaware's Aaa rating is one notch above its scorecard-indicated outcome because it incorporates a history of quickly responding tooperating challenges identified by its strong forecasting methods in order to avoid the use of reserves to close budget gaps.
Exhibit 16
US state and territories rating methodology scorecardDelaware (State of)
Rating Factors Measure Score
Factor 1: Economy (25%)
a) Per Capita Income Relative to US Average [1] 95.8% Aa
b) Nominal Gross Domestic Product ($ billions) [1] $75.0 Aaa
Factor 2: Finances (30%)
a) Structural Balance Aaa Aaa
b) Fixed Costs / State Own-Source Revenue [2] 13.3% Aa
c) Liquidity and Fund Balance Aa Aa
Factor 3: Governance (20%)
a) Governance / Constitutional Framework Aaa Aaa
Factor 4: Debt and Pensions (25%)
a) (Moody's ANPL + Net Tax-Supported Debt) / State GDP [2] [3] 11.9% Aa
Factors 5 - 10: Notching Factors [4]
Adjustments Up: None 0
Adjustments Down: Pension or OPEB Characteristics -0.5
Rating:
a) Scorecard-Indicated Outcome Aa1
b) Actual Rating Assigned Aaa
[1] Economy measures are based on data from the most recent year available.[2] Fixed costs and debt and pensions measures are based on data from the most recent debt and pensions medians report published by Moody's.[3] ANPL stands for adjusted net pension liability.[4] Notching factors 5-10 are specifically defined in the US States and Territories Rating Methodology.Source: US Bureau of Economic Analysis, Delaware's audited financial statements and Moody's Investors Service
Endnotes1 The state's pension reporting lags the financial reporting of its pension plans by one year. The total pension liability and plan fiduciary position included in
the plans' available fiscal 2018 audited financial statements will be incorporated in the state's fiscal 2019 audited financial statements. We use the plans'fiscal 2018 reports to calculate the state's fiscal 2019 ANPL.
8 1 August 2019 Delaware (State of): Update to credit analysis

MOODY'S INVESTORS SERVICE U.S. PUBLIC FINANCE
© 2019 Moody’s Corporation, Moody’s Investors Service, Inc., Moody’s Analytics, Inc. and/or their licensors and affiliates (collectively, “MOODY’S”). All rights reserved.
CREDIT RATINGS ISSUED BY MOODY'S INVESTORS SERVICE, INC. AND ITS RATINGS AFFILIATES (“MIS”) ARE MOODY’S CURRENT OPINIONS OF THE RELATIVE FUTURE CREDITRISK OF ENTITIES, CREDIT COMMITMENTS, OR DEBT OR DEBT-LIKE SECURITIES, AND MOODY’S PUBLICATIONS MAY INCLUDE MOODY’S CURRENT OPINIONS OF THERELATIVE FUTURE CREDIT RISK OF ENTITIES, CREDIT COMMITMENTS, OR DEBT OR DEBT-LIKE SECURITIES. MOODY’S DEFINES CREDIT RISK AS THE RISK THAT AN ENTITYMAY NOT MEET ITS CONTRACTUAL FINANCIAL OBLIGATIONS AS THEY COME DUE AND ANY ESTIMATED FINANCIAL LOSS IN THE EVENT OF DEFAULT OR IMPAIRMENT. SEEMOODY’S RATING SYMBOLS AND DEFINITIONS PUBLICATION FOR INFORMATION ON THE TYPES OF CONTRACTUAL FINANCIAL OBLIGATIONS ADDRESSED BY MOODY’SRATINGS. CREDIT RATINGS DO NOT ADDRESS ANY OTHER RISK, INCLUDING BUT NOT LIMITED TO: LIQUIDITY RISK, MARKET VALUE RISK, OR PRICE VOLATILITY. CREDITRATINGS AND MOODY’S OPINIONS INCLUDED IN MOODY’S PUBLICATIONS ARE NOT STATEMENTS OF CURRENT OR HISTORICAL FACT. MOODY’S PUBLICATIONS MAYALSO INCLUDE QUANTITATIVE MODEL-BASED ESTIMATES OF CREDIT RISK AND RELATED OPINIONS OR COMMENTARY PUBLISHED BY MOODY’S ANALYTICS, INC. CREDITRATINGS AND MOODY’S PUBLICATIONS DO NOT CONSTITUTE OR PROVIDE INVESTMENT OR FINANCIAL ADVICE, AND CREDIT RATINGS AND MOODY’S PUBLICATIONSARE NOT AND DO NOT PROVIDE RECOMMENDATIONS TO PURCHASE, SELL, OR HOLD PARTICULAR SECURITIES. NEITHER CREDIT RATINGS NOR MOODY’S PUBLICATIONSCOMMENT ON THE SUITABILITY OF AN INVESTMENT FOR ANY PARTICULAR INVESTOR. MOODY’S ISSUES ITS CREDIT RATINGS AND PUBLISHES MOODY’S PUBLICATIONSWITH THE EXPECTATION AND UNDERSTANDING THAT EACH INVESTOR WILL, WITH DUE CARE, MAKE ITS OWN STUDY AND EVALUATION OF EACH SECURITY THAT IS UNDERCONSIDERATION FOR PURCHASE, HOLDING, OR SALE.
MOODY’S CREDIT RATINGS AND MOODY’S PUBLICATIONS ARE NOT INTENDED FOR USE BY RETAIL INVESTORS AND IT WOULD BE RECKLESS AND INAPPROPRIATE FORRETAIL INVESTORS TO USE MOODY’S CREDIT RATINGS OR MOODY’S PUBLICATIONS WHEN MAKING AN INVESTMENT DECISION. IF IN DOUBT YOU SHOULD CONTACTYOUR FINANCIAL OR OTHER PROFESSIONAL ADVISER. ALL INFORMATION CONTAINED HEREIN IS PROTECTED BY LAW, INCLUDING BUT NOT LIMITED TO, COPYRIGHT LAW,AND NONE OF SUCH INFORMATION MAY BE COPIED OR OTHERWISE REPRODUCED, REPACKAGED, FURTHER TRANSMITTED, TRANSFERRED, DISSEMINATED, REDISTRIBUTEDOR RESOLD, OR STORED FOR SUBSEQUENT USE FOR ANY SUCH PURPOSE, IN WHOLE OR IN PART, IN ANY FORM OR MANNER OR BY ANY MEANS WHATSOEVER, BY ANYPERSON WITHOUT MOODY’S PRIOR WRITTEN CONSENT.
CREDIT RATINGS AND MOODY’S PUBLICATIONS ARE NOT INTENDED FOR USE BY ANY PERSON AS A BENCHMARK AS THAT TERM IS DEFINED FOR REGULATORY PURPOSESAND MUST NOT BE USED IN ANY WAY THAT COULD RESULT IN THEM BEING CONSIDERED A BENCHMARK.
All information contained herein is obtained by MOODY’S from sources believed by it to be accurate and reliable. Because of the possibility of human or mechanical error as wellas other factors, however, all information contained herein is provided “AS IS” without warranty of any kind. MOODY'S adopts all necessary measures so that the information ituses in assigning a credit rating is of sufficient quality and from sources MOODY'S considers to be reliable including, when appropriate, independent third-party sources. However,MOODY’S is not an auditor and cannot in every instance independently verify or validate information received in the rating process or in preparing the Moody’s publications.
To the extent permitted by law, MOODY’S and its directors, officers, employees, agents, representatives, licensors and suppliers disclaim liability to any person or entity for anyindirect, special, consequential, or incidental losses or damages whatsoever arising from or in connection with the information contained herein or the use of or inability to use anysuch information, even if MOODY’S or any of its directors, officers, employees, agents, representatives, licensors or suppliers is advised in advance of the possibility of such losses ordamages, including but not limited to: (a) any loss of present or prospective profits or (b) any loss or damage arising where the relevant financial instrument is not the subject of aparticular credit rating assigned by MOODY’S.
To the extent permitted by law, MOODY’S and its directors, officers, employees, agents, representatives, licensors and suppliers disclaim liability for any direct or compensatorylosses or damages caused to any person or entity, including but not limited to by any negligence (but excluding fraud, willful misconduct or any other type of liability that, for theavoidance of doubt, by law cannot be excluded) on the part of, or any contingency within or beyond the control of, MOODY’S or any of its directors, officers, employees, agents,representatives, licensors or suppliers, arising from or in connection with the information contained herein or the use of or inability to use any such information.
NO WARRANTY, EXPRESS OR IMPLIED, AS TO THE ACCURACY, TIMELINESS, COMPLETENESS, MERCHANTABILITY OR FITNESS FOR ANY PARTICULAR PURPOSE OF ANY CREDITRATING OR OTHER OPINION OR INFORMATION IS GIVEN OR MADE BY MOODY’S IN ANY FORM OR MANNER WHATSOEVER.
Moody’s Investors Service, Inc., a wholly-owned credit rating agency subsidiary of Moody’s Corporation (“MCO”), hereby discloses that most issuers of debt securities (includingcorporate and municipal bonds, debentures, notes and commercial paper) and preferred stock rated by Moody’s Investors Service, Inc. have, prior to assignment of any rating,agreed to pay to Moody’s Investors Service, Inc. for ratings opinions and services rendered by it fees ranging from $1,000 to approximately $2,700,000. MCO and MIS also maintainpolicies and procedures to address the independence of MIS’s ratings and rating processes. Information regarding certain affiliations that may exist between directors of MCO andrated entities, and between entities who hold ratings from MIS and have also publicly reported to the SEC an ownership interest in MCO of more than 5%, is posted annually atwww.moodys.com under the heading “Investor Relations — Corporate Governance — Director and Shareholder Affiliation Policy.”
Additional terms for Australia only: Any publication into Australia of this document is pursuant to the Australian Financial Services License of MOODY’S affiliate, Moody’s InvestorsService Pty Limited ABN 61 003 399 657AFSL 336969 and/or Moody’s Analytics Australia Pty Ltd ABN 94 105 136 972 AFSL 383569 (as applicable). This document is intendedto be provided only to “wholesale clients” within the meaning of section 761G of the Corporations Act 2001. By continuing to access this document from within Australia, yourepresent to MOODY’S that you are, or are accessing the document as a representative of, a “wholesale client” and that neither you nor the entity you represent will directly orindirectly disseminate this document or its contents to “retail clients” within the meaning of section 761G of the Corporations Act 2001. MOODY’S credit rating is an opinion as tothe creditworthiness of a debt obligation of the issuer, not on the equity securities of the issuer or any form of security that is available to retail investors.
Additional terms for Japan only: Moody's Japan K.K. (“MJKK”) is a wholly-owned credit rating agency subsidiary of Moody's Group Japan G.K., which is wholly-owned by Moody’sOverseas Holdings Inc., a wholly-owned subsidiary of MCO. Moody’s SF Japan K.K. (“MSFJ”) is a wholly-owned credit rating agency subsidiary of MJKK. MSFJ is not a NationallyRecognized Statistical Rating Organization (“NRSRO”). Therefore, credit ratings assigned by MSFJ are Non-NRSRO Credit Ratings. Non-NRSRO Credit Ratings are assigned by anentity that is not a NRSRO and, consequently, the rated obligation will not qualify for certain types of treatment under U.S. laws. MJKK and MSFJ are credit rating agencies registeredwith the Japan Financial Services Agency and their registration numbers are FSA Commissioner (Ratings) No. 2 and 3 respectively.
MJKK or MSFJ (as applicable) hereby disclose that most issuers of debt securities (including corporate and municipal bonds, debentures, notes and commercial paper) and preferredstock rated by MJKK or MSFJ (as applicable) have, prior to assignment of any rating, agreed to pay to MJKK or MSFJ (as applicable) for ratings opinions and services rendered by it feesranging from JPY125,000 to approximately JPY250,000,000.
MJKK and MSFJ also maintain policies and procedures to address Japanese regulatory requirements.
REPORT NUMBER 1187060
9 1 August 2019 Delaware (State of): Update to credit analysis

MOODY'S INVESTORS SERVICE U.S. PUBLIC FINANCE
CLIENT SERVICES
Americas 1-212-553-1653
Asia Pacific 852-3551-3077
Japan 81-3-5408-4100
EMEA 44-20-7772-5454
10 1 August 2019 Delaware (State of): Update to credit analysis