Embed Size (px)
Citation preview
The Journal of Neuroscience, March 1, 1996, 76(5):1634-l 644
Delayed Clearance of Transmitter and the Role of Glutamate Transporters at Synapses with Multiple Release Sites
Thomas S. Otis, Yuh-Cherng Wu, and Laurence 0. Trussell
Department of Neurophysiology, University of Wisconsin School of Medicine, Madison, Wisconsin 53706
The roles of glutamate diffusion, uptake, and channel kinetics in shaping the AMPA receptor EPSC were examined at a calyceal synapse. The EPSC decay was described by three exponential components: two matching desensitizing channel kinetics, and a third component at least IO times slower. The slowest com- ponent had identical voltage dependence to the steady-state AMPA current and was selectively increased and prolonged by blockade of glutamate uptake, indicating that the slow EPSC represented rebinding of glutamate at partially desensitized AMPA receptors. The data were in strong agreement with the predictions of a model of transmitter diffusion from multiple release sites into a large synaptic cleft. Within the first millisec- ond after release, transmitter concentrations in the cleft fell
below millimolar levels, causing the fastest parts of the EPSC to be shaped by channel kinetics. The slowest component was determined by the removal over tens of milliseconds of the final lo-100 PM glutamate by diffusion and uptake. The data and modeling indicate that transmitter uptake and cooperation be- tween release sites are significant determinants of a slow “tail” of glutamate in the synaptic cleft. This slow clearance of glu- tamate is likely to limit postsynaptic receptor availability through desensitization.
Key words: AMPA receptor; diffusion; desensitization; nu- cleus magnocellularis; cochlear nucleus; transmitter uptake: channel kinetics
The time course of synaptic currents mediated by ionotropic receptors is determined by factors that fall into three categories: those affecting the time course of transmitter release, those af- fecting the lifetime of transmitter in the synaptic cleft (i.e., diffu- sion and uptake), and the properties of postsynaptic receptors (i.e., gating kinetics and transmitter affinity). For the AMPA subtype of glutamate receptors, macroscopic gating kinetics rele- vant to transmission are deactivation, which is the decay time of the current in response to a very short pulse of glutamate, and desensitization, which is the time for inactivation of receptors during prolonged exposure to glutamate (Trussell and Otis, 1996). Recent studies disagree as to the precise contributions of gluta- mate release, clearance, and receptor kinetics to shaping the AMPA receptor EPSC. For example, at some synapses it is proposed that receptor desensitization is not important in deter- mining the time course of decay of a single EPSC (Colquhoun et al., 1992; Hestrin, 1992; Diamond and Jahr, 1995; Isaacson and Walmsley, 1995). Other studies suggest that desensitization does shape the synaptic current decay, because of a prolonged presence of glutamate in the synaptic cleft (Trussell et al., 1993; Barbour et al., 1994; Takahashi et al., 1995). It is likely that these contrasting views result from variations in specific physiological and morpho- logical features of different synapses, for example, the time of activation of different synaptic boutons, the size and shape of the cleft, the distance between synaptic release sites, the amount of transmitter released, and the kinetics of receptors relative to the lifetime of the transmitter.
Received Oct. 12, 1995; revised Nov. 30, 1995; accepted Dec. 4, 1995. This work was supported by Grants NS28901 (L.O.T.) and GM16300 (T.S.O.)
from National Institutes of Health. We thank Drs. Robert Fettiplace, Indira Raman, and Robert Turner for helpful comments.
Correspondence should be addressed to L. Trussell, Department of Neurophysi- ology, University of Wisconsin, Madison, 1300 University Avenue, Madison, WI 53706. Copyright 0 1996 Society for Neuroscience 0270-6474/96/161634-11$05.00/O
In this study, we have identified how these factors contribute to determining the shape of the EPSC and the availability of recep- tors for activation by sequential synaptic stimuli. We have taken advantage of a calyceal somatic synapse made by auditory nerve fibers in the chick nucleus magnocellularis (nMAG) that is par- ticularly well suited for voltage-clamp studies of fast EPSCs. Whereas previous results have suggested that postsynaptic recep- tor desensitization plays a significant role in determining the EPSC time course at this synapse (Trussell et al., 1993) this interpretation may be confounded by nonspecific actions of drugs used to block desensitization (Diamond and Jahr, 1995). Accord- ingly, the voltage-dependent gating of AMPA receptors, previ- ously examined in detail in outside-out patches from these cells (Raman and Trussell, 1995b), was exploited to understand the contribution of channel kinetics to the EPSC decay. This ap- proach, in conjunction with a diffusion and receptor-gating model, suggests that after release there are two phases of transmitter clearance from the calyx: a fast phase accounting for the majority of the EPSC decay, and a much slower phase that is dependent on cooperation between release sites and the activity of glutamate transporters. Pharmacological agents that block glutamate uptake markedly and selectively enhance the slower phase of clearance, raising the possibility that uptake systems may indirectly control the recovery of receptors from desensitized states at this synapse.
MATERIALS AND METHODS Recordings and slice preparation. Slices were prepared from White Leg- horn chicken embryos (days 16-21) as described previously (Otis et al., 1995). Chicks were decapitated, and the area of the brainstem containing the cochlear nucleus was dissected and blocked. The 200-250 pm slices were stored in oxygenated solution containing (in mM): 140 NaCl, 20 glucose, 10 HEPES, 5 KCl, 3 CaCl,, and 1 MgCl,. Three millimolar Ca*+ is in the physiological range for avian CSF (Maki et al., 1990). During recordings, this solution continuously perfused the slices at l-3 ml/min, except for the experiments isolating NMDA currents, in which MgCl, was omitted and 10 PM glycine was included, and the experiments in different
Otis et al. l Transmitter Clearance and the EPSC J. Neurosci., March 1, 1996, 76(5):1634-1644 1635
Ca” concentrations, in which a CaCI, concentration equal to that stated was substituted for 3 mM CaC12. In all experiments, 50 PM bicuculline methiodide and, in most experiments, 2 pM strychnine were included in the bath to block any inhibitory conductances. For experiments isolating mEPSCs for kinetic measurements, 1 HAM tetrodotoxin and 5 mivt tetra- ethylammonium (TEA) were added to the bath solution. All other drugs were added to the bath solution at indicated concentrations. The pipette solution contained (in mM): 70 Cs,SO,, 40 TEA-Cl, 10 HEPES, 5 bis(2- aminophenoxy)ethane-N,N,N’,N’-tetra-acetic acid (BAPTA), 4 NaCI, and 1 MgCI,, neutralized with CsOH to pH 7.3. For the experiments isolating NMDA currents, the pipettes contained 3 mM Mg-ATP substi- tuted for the MgCI,. These solutions gave rise to an 8 mV junction potential that was subtracted from all reported holding potentials. Series resistance (mean 5.1 i 3.1 MR, 40 cells) was compensated by >80%. As discussed previously (Zhang and TrusselI, 1995b), this level of compen- sation should be adequate to accurately monitor EPSC kinetics, as confirmed by experiments (see below) using more weakly permeating electrode-filling solutions.
Whole-cell recordings (Hamill et al., 1981) were made at room tem- perature with an Axopatch 200A patch clamp (Axon Instruments, Foster City, CA) from visually identified cells as described previously (Zhang and Trussell, 1994b). Synaptic currents were evoked by delivering 20-100 V, 0.1-0.2 msec pulses through a patch pipette filled with bath solution and located within 100 p,rn of the recorded cell. EPSCs in all cases showed an all-or-none threshold for activation, consistent with the behavior of a single axonal input to the recorded cell (Zhang and Trussell, 1994a). To record the slowest phases of the EPSC accurately, the membrane poten- tial of the cell was stepped to the potential for 0.5-2 set before the synaptic stimulus. This protocol avoided contamination by time- dependent leak currents.
AMPA and NMDA were dissolved in bath solution and pressure- applied (2-5 psi) through a patch pipette located within SO pm of the recorded cell. Voltage steps were delivered after the current had reached a steady-state level. Identical steps were delivered in the absence of agonist and subtracted from those in the presence of AMPA or NMDA to yield the current-voltage (1-v) relationships displayed in Figure 3. The o,L-2-amino-5-phosphonovaleric acid (D,L-APV), NMDA, bicucullinc methiodide, and strychnine were purchased from Sigma (St. Louis, MO); o,L-threo-j-hydroxyaspartic acid (THA) and r.-truns-pyrrolidine-2,4- dicarboxylatc (L-trans-PDC) were from Tocris Cookson (Bristol, UK); and AMPA was from Cambridge Research Biochemicals (Cheshire, UK).
Depolarization of nMAG cells activated an outward leakage current, apparently carried by Cs ions. To ensure that the estimates of the measured parameters of the EPSC at positive potentials were not dis- torted significantly by clamp errors resulting from the change in resting conductance, we performed a series of control experiments (n = 6 cells) using a pipette solution [(in mM): 170 N-methyl-o-ghicamine chloride, 10 HEPES, 5 BAPTA, and 1 MgCIz] that more completely blocked outward leak currents. This solution also shifted the reversal potential of the EPSC about +50 mV, such that the driving force was smaller at very positive potentials. Exponential decay times and their weights, as well as the extent of depression with paired stimuli, were indistinguishable from those obtained with the Cs,SO,/TEA solution. These results also exclude the possibility that Cs leakage from the postsynaptic cells during voltage jumps affects the shape or size of the EPSC by altering the physiology of the presynaptic terminal.
Exponential fitting and mEPSC analysis. Exponential fitting of the stimulus-evoked EPSCs was performed using the Chebyshcv algorithm in pClamp (version 6, Axon Instruments). The decay phases of Ieak- subtracted single or average current traces were fit with the sums of up to three exponentials of the form:
A, X exp(-t/r,) + A2 X cxp(-t/r2) + A3 X exp((t/r&
where A,, A?, and A, are weights and r,, r2, and r1 are time constants. Because fitting was performed starting 100-300 psec after the peak, relative weights were computed by extrapolating weight values from the fitted equations back to the time at which the current rose from the noise, and then expressing the weights as the percentage 100 x @X/U), where x is 2 or 3.
To analyze mEPSCs, current was filtered at 10 kHz and digitized onto videotape at 44 kHz. An analog output was later refiltered at 10 kHz and redigitized at 20-40 kHz using STRATHCLYDE Electrophysiology Software (J. Dempster, Strathclyde, UK). Signals exceeding an amplitude threshold of 4-8 pA for >300 Fsec were classified as events and placed in a separate file, at which point glitches, multiple mEPSC traces, or
mEPSC traces that did not return to a flat zero baseline were discarded before averaging the traces. For calculation of mEPSC frequency, multiple-event traces and traces without a flat baseline were included in analysis.
Most traces are single responses or averages of two or three responses; some traces have part of the stimulus artifact removed for clarity. Dis- played signals have been filtered at 10 kHz, except for the slow time base traces in Figures 3A and 4, A and B, which have been filtered digitally at 500 Hz. All values arc reported as mean -t SD, unless noted otherwise.
Diffusion and receptor modeling. An analytical expression for diffusion from an instantaneous point source into the space bordered by two infinite, impermeable parallel planes was derived from the diffusion equation:
WI -=D @[A]
at 1 az2’
Solutions to this equation, based on Equation 14.10 (18) of Carslaw and Jaeger (1959) then were summed for N point sources spaced a distance r apart, as shown in Figure 6A. The resulting equation was:
[Al(x,~,z,f) = ;“iexp ~ ~ [(x - &Y + 0, - YJ?l
4Dt /=I
where [A] is concentration, x and y are coordinates in the plane of the clcfl, z is distance from prcsynaptic to postsynaptic membrane, D is the diffusion cocfficicnt, w is the cleft width, t is time, Q is the number of glutamate molecules per vesicle, and N is the number of release sites. x, and y, are coordinates of release site i. [A] was determined at different x, y, and t points using in-house software.
D was set lo 0.4 km*/msec, because D for transmitters in the brain is reduced from the free solution values (Longsworth, 1953) by -5O-60% (Nicholson and Phillips, 1981; Rice et al., 1985). Q was assumed to be 4000, based on the estimates of glutamate concentration in a vesicle (Riveros et al., 1986), and the cleft width was set at 20 nm (Peters et al., 1991). The spacing between release sites, r, was estimated at 0.71 km, based on measurements given in a freeze-fracture study of calyceal terminals in guinea pig (Gulley et al., 1977), and is similar to the apparent spacing in micrographs made from the chick nMAG (Mattox et al., 1985; Parks et al., 1990). However, not all of these release sites might be active during the EPSC, and so we sought another estimate of r from the quanta1 content of the EPSC, assuming that one quantum corresponds to one release site. Auditory nerve terminals occupy -45% of the 1500 Km’ surface of nMAG cells (Parks et al., 1990; Raman and Trussell, 1992). Given three axon terminals per cell, each with a quanta1 content (peak EPSCipeak mEPSC) of 103 (Zhang and TrusselI, 1994a,b), there exist at least 0.5 release sites/km2, or 1.4 pm between sites. In fact, the density of sites is likely to be higher because quanta1 content estimated from the peak alone does not account for dispersion of quanta1 release. Further- more, release sites may not be distributed uniformly. Thus, the spacing in chick may be <l pm, consistent with the electron micrographs. Because the calyceal terminal consists of numerous thick fingers, rather than a sheet, it is not appropriate to model all 100-200 release sites in one cleft. Therefore, we modeled a X.07 pm’ terminal, corresponding to a section of a single finger of 2.84 pm width, using an array of 25 release sites with r = 0.71 pm.
Concentration profiles were used as driving functions for a kinetic model previously used to describe AMPA receptor kinetics in Raman and Trussell (1995a). The transmitter concentration falls more quickly at the edges of the array of release sites than at the center (Fig. 6B). Thus, concentration profiles and receptor response profiles were determined for a postsynaptic site under each presynaptic release site, and the resulting population response was averaged. When the response to a single quantum was simulated, the model was only evaluated at the postsynaptic membrane opposite the active site, because simulations of neighboring postsynaptic sites produced negligible responses. The possi- bility that AMPA receptors might themselves buffer the transmitter was ignored because the number of receptors at each synapse (Zhang and Trussell, 1994b) is much lower than the number of transmitter molecules in a vesicle.
1636 J. Neurosci., March 1, 1996, 76(5):1634-1644 Otis et al. . Transmitter Clearance and the EPSC
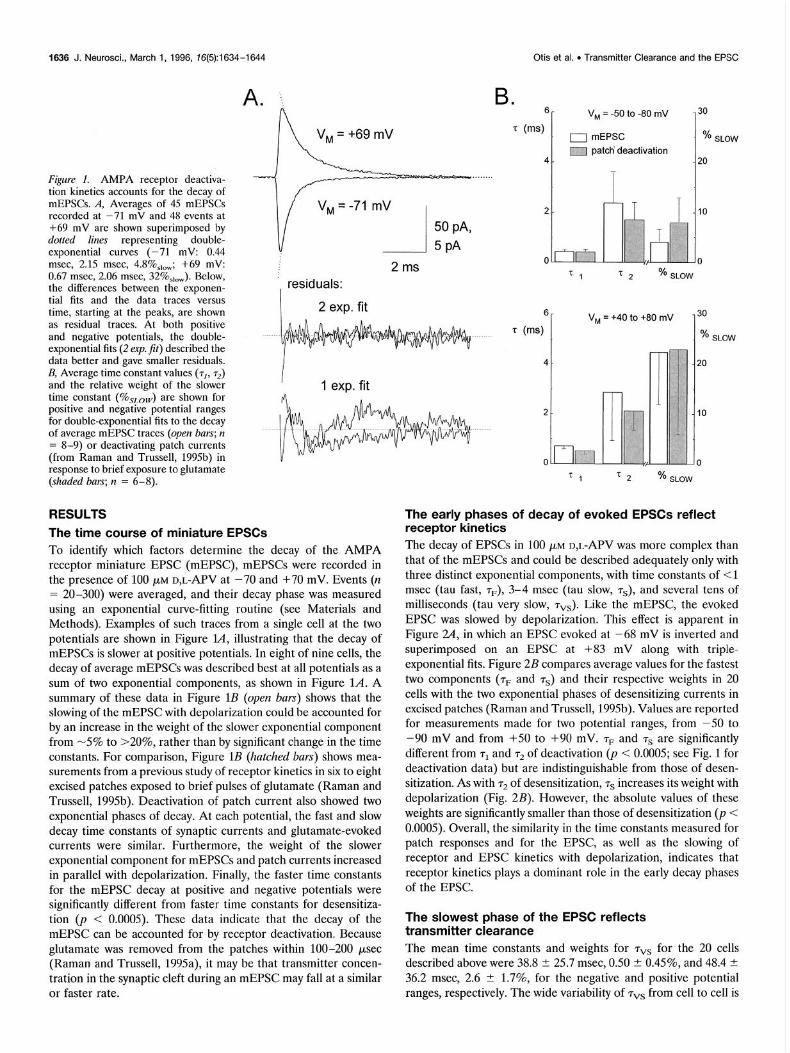
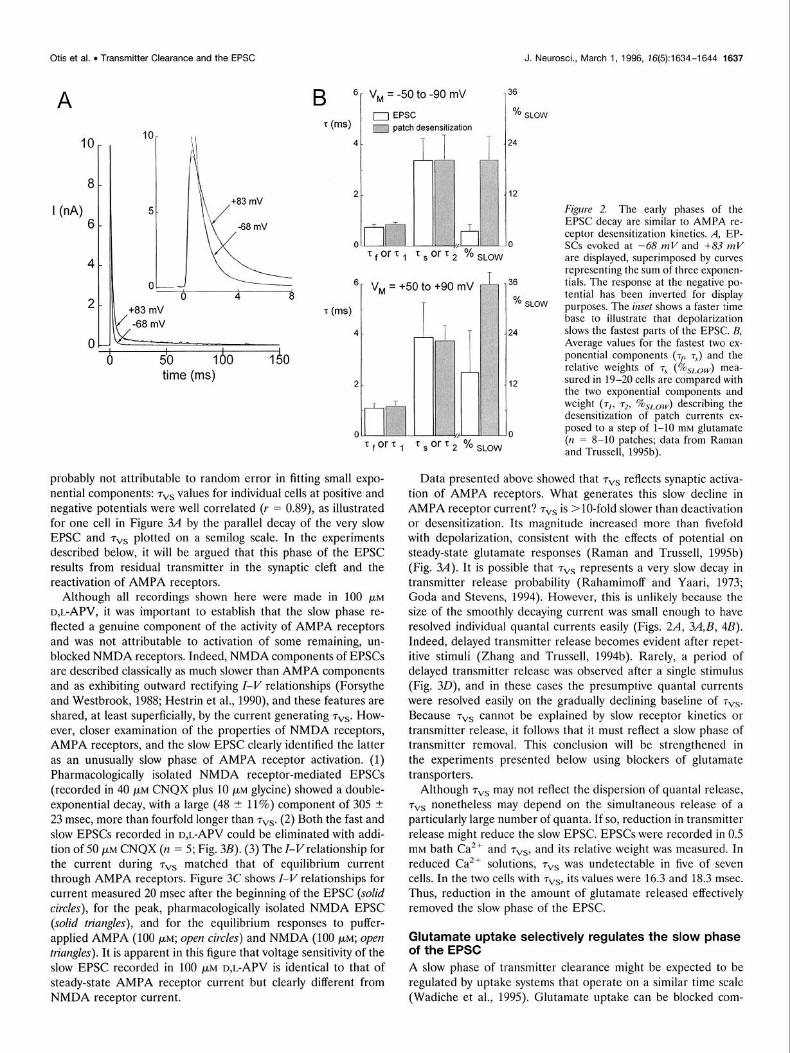
Fi.qure 1. AMPA receptor deactiva- tion kinetics accounts for the decay of mEPSCs. A. Averages of 45 mEPSCs recorded at’-71 rnv and 48 events at +69 mV are shown superimposed by dotted lines representing double- exponential curves (-71 mV: 0.44 msec, 2.15 msec, 4.8%,,,; +69 mV: 0.67 msec, 2.06 msec, 32%,,,). Below, the differences between the exponen- tial fits and the data traces versus time, starting at the peaks, are shown as residual traces. At both positive and negative potentials, the double- exponential fits (2 erp. fit) described the data better and gave smaller residuals. B, Average time constant values (rl, r2) and the relative weight of the slower time constant (%sLon,) are shown for positive and negative potential ranges for double-exponential fits to the decay of average mEPSC traces (open bars; n = 8-9) or deactivating patch currents (from Raman and Trussell, 1995b) in response to brief exposure to glutamate (shaded bars; n = 6-S).
v v, = -71 mV
2 ms residuals:
2 exp. fit
50 PA,
5 PA
I 1 exp. fit
RESULTS
The time course of miniature EPSCs To identify which factors determine the decay of the AMPA receptor miniature EPSC (mEPSC), mEPSCs were recorded in the presence of 100 PM D,L-APV at -70 and +70 mV. Events (n = 20-300) were averaged, and their decay phase was measured using an exponential curve-fitting routine (see Materials and Methods). Examples of such traces from a single cell at the two potentials are shown in Figure l.4, illustrating that the decay of mEPSCs is slower at positive potentials. In eight of nine cells, the decay of average mEPSCs was described best at all potentials as a sum of two exponential components, as shown in Figure L4. A summary of these data in Figure 1B (open bars) shows that the slowing of the mEPSC with depolarization could be accounted for by an increase in the weight of the slower exponential component from -5% to >20%, rather than by significant change in the time constants. For comparison, Figure 1B (hatched bars) shows mea- surements from a previous study of receptor kinetics in six to eight excised patches exposed to brief pulses of glutamate (Raman and Trussell, 1995b). Deactivation of patch current also showed two exponential phases of decay. At each potential, the fast and slow decay time constants of synaptic currents and glutamate-evoked currents were similar. Furthermore, the weight of the slower exponential component for mEPSCs and patch currents increased in parallel with depolarization. Finally, the faster time constants for the mEPSC decay at positive and negative potentials were significantly different from faster time constants for desensitiza- tion (p < 0.0005). These data indicate that the decay of the mEPSC can be accounted for by receptor deactivation. Because glutamate was removed from the patches within 100-200 psec (Raman and Trussell, 1995a), it may be that transmitter concen- tration in the synaptic cleft during an mEPSC may fall at a similar or faster rate.
B. 6 T (ms)
4
V, = -50 to -80 mV
0 mEPSC
patctideactivation
7 V, = +40 to +80 mV
f 0-W
4.
2.
O/o SLOW
30
% SLOW
20
IO
1
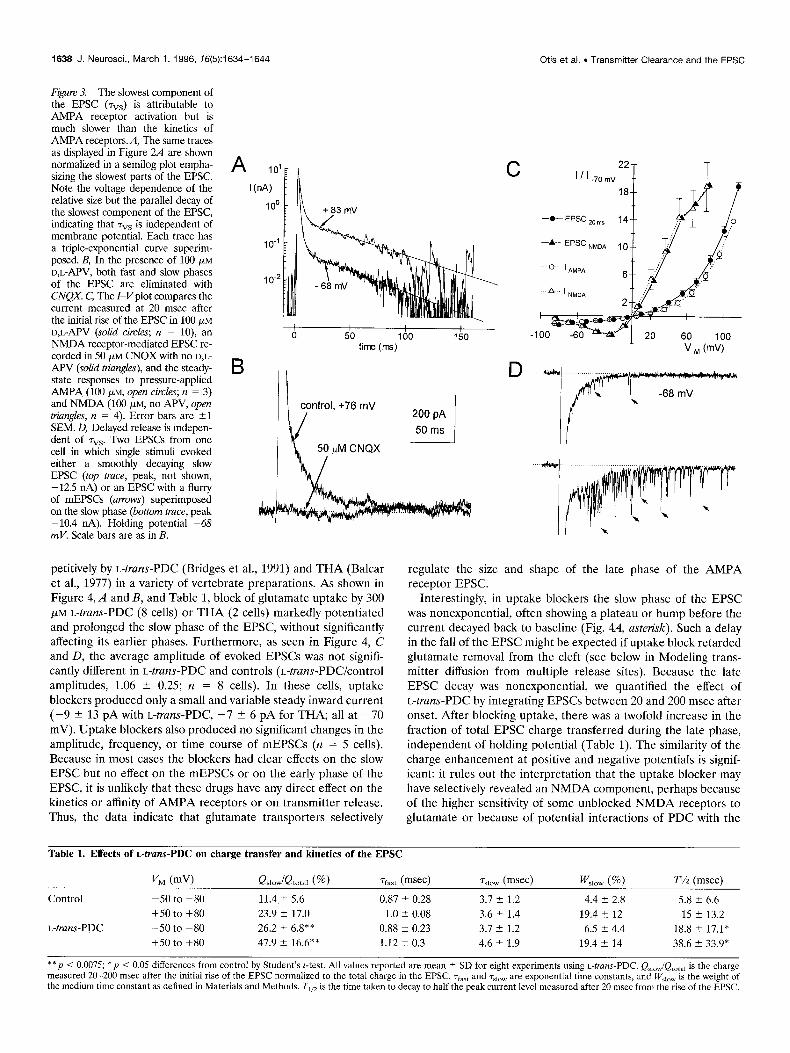
The early phases of decay of evoked EPSCs reflect receptor kinetics The decay of EPSCs in 100 PM D,L-APV was more complex than that of the mEPSCs and could be described adequately only with three distinct exponential components, with time constants of <l msec (tau fast, or), 3-4 msec (tau slow, TV), and several tens of milliseconds (tau very slow, 7vs). Like the mEPSC, the evoked EPSC was slowed by depolarization. This effect is apparent in Figure 2A, in which an EPSC evoked at -68 mV is inverted and superimposed on an EPSC at +83 mV along with triple- exponential fits. Figure 2B compares average values for the fastest two components (+ and TV) and their respective weights in 20 cells with the two exponential phases of desensitizing currents in excised patches (Raman and Trussell, 1995b). Values are reported for measurements made for two potential ranges, from -50 to -90 mV and from +50 to +90 mV. TF and Ts are significantly different from TV and 72 of deactivation (‘p < 0.0005; see Fig. 1 for deactivation data) but are indistinguishable from those of desen- sitization. As with 72 of desensitization, TV increases its weight with depolarization (Fig. 2B). However, the absolute values of these weights are significantly smaller than those of desensitization 07 < 0.0005). Overall, the similarity in the time constants measured for patch responses and for the EPSC, as well as the slowing of receptor and EPSC kinetics with depolarization, indicates that receptor kinetics plays a dominant role in the early decay phases of the EPSC.
The slowest phase of the EPSC reflects transmitter clearance The mean time constants and weights for 7vs for the 20 cells described above were 38.8 + 25.7 msec, 0.50 t 0.45%, and 48.4 + 36.2 msec, 2.6 + 1.7%, for the negative and positive potential ranges, respectively. The wide variability of 7vs from cell to cell is
Otis et al. . Transmitter Clearance and the EPSC J. Neurosci., March 1, 1996, 16(5):1634-1644 1637
8 1 W
6
10
5
0
+a3 mV
L
5'0 lb0 IS0 time (ms)
B ’ T (ms)
4
T 0-M I 4
I
V, = -50 to -90 mV
0 EPSC
patch desensitization I
36
% SLOW
24
probably not attributable to random error in fitting small expo- nential components: 7vs values for individual cells at positive and negative potentials were well correlated (I = 0.89), as illustrated for one cell in Figure 3A by the parallel decay of the very slow EPSC and 7vs plotted on a semilog scale. In the experiments described below, it will be argued that this phase of the EPSC results from residual transmitter in the synaptic cleft and the reactivation of AMPA receptors.
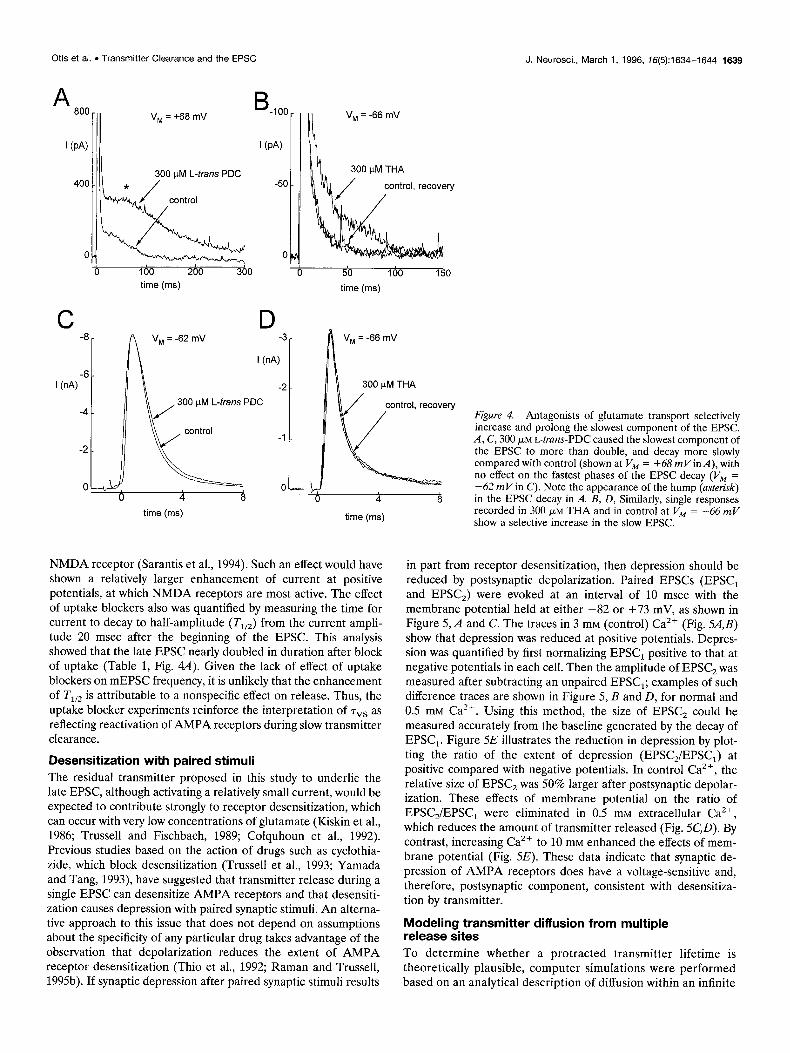
Although all recordings shown here were made in 100 PM D,L-APV, it was important to establish that the slow phase re- flected a genuine component of the activity of AMPA receptors and was not attributable to activation of some remaining, un- blocked NMDA receptors. Indeed, NMDA components of EPSCs are described classically as much slower than AMPA components and as exhibiting outward rectifying Z-V relationships (Forsythe and Westbrook, 1988; Hestrin et al., 1990), and these features are shared, at least superficially, by the current generating 7”s. How- ever, closer examination of the properties of NMDA receptors, AMPA receptors, and the slow EPSC clearly identified the latter as an unusually slow phase of AMPA receptor activation. (1) Pharmacologically isolated NMDA receptor-mediated EPSCs (recorded in 40 PM CNQX plus 10 PM glycine) showed a double- exponential decay, with a large (48 t 11%) component of 305 2 23 msec, more than fourfold longer than 7”s. (2) Both the fast and slow EPSCs recorded in D,L-APV could be eliminated with addi- tion of 50 PM CNQX (n = 5; Fig. 3B). (3) The I-Vrelationship for the current during + matched that of equilibrium current through AMPA receptors. Figure 3C shows Z-V relationships for current measured 20 msec after the beginning of the EPSC (solid circles), for the peak, pharmacologically isolated NMDA EPSC (solid triangles), and for the equilibrium responses to puffer- applied AMPA (100 pM; open circles) and NMDA (100 PM; open
triangles). It is apparent in this figure that voltage sensitivity of the slow EPSC recorded in 100 PM D,L-APV is identical to that of steady-state AMPA receptor current but clearly different from NMDA receptor current.
36
% SLOW
Figzrre 2. The early phases of the EPSC decay are similar to AMPA re- ceptor desensitization kinetics. A, EP- SCs evoked at -68 mV and +83 ml/ are displayed, superimposed by curves representing the sum of three exponen- tials. The response at the negative po- tential has been inverted for display purposes. The illset shows a faster time base to illustrate that depolarization slows the fastest parts of the EPSC. B, Average values for the fastest two ex- ponential components (-rf, 7,) and the ielative weigh& of 7s (%&.,,,,) mea- sured in 19-20 cells are cornoared with the two exponential compdnents and weight (T], L72, %sLo,,,) describing the desensitization of oatch currents ex- posed to a step of i-10 rniM glutamate (n = 8-10 patches; data from Raman and Trussell, 1995b).
Data presented above showed that 7vs reflects synaptic activa- tion of AMPA receptors. What generates this slow decline in AMPA receptor current? TVs is >lO-fold slower than deactivation or desensitization. Its magnitude increased more than fivefold with depolarization, consistent with the effects of potential on steady-state glutamate responses (Raman and Trussell, 1995b) (Fig. 3A). It is possible that 7vs represents a very slow decay in transmitter release probability (Rahamimoff and Yaari, 1973; Goda and Stevens, 1994). However, this is unlikely because the size of the smoothly decaying current was small enough to have resolved individual quanta1 currents easily (Figs. 2A, 3A,B, 4B). Indeed, delayed transmitter release becomes evident after repet- itive stimuli (Zhang and Trussell, 1994b). Rarely, a period of delayed transmitter release was observed after a single stimulus (Fig. 30), and in these cases the presumptive quanta1 currents were resolved easily on the gradually declining baseline of 7”s. Because 7vs cannot be explained by slow receptor kinetics or transmitter release, it follows that it must reflect a slow phase of transmitter removal. This conclusion will be strengthened in the experiments presented below using blockers of glutamate transporters.
Although 7vs may not reflect the dispersion of quanta1 release, 7vs nonetheless may depend on the simultaneous release of a particularly large number of quanta. If so, reduction in transmitter release might reduce the slow EPSC. EPSCs were recorded in 0.5 mM bath Ca2+ and TVs, and its relative weight was measured. In reduced Ca*+ solutions, 7vs was undetectable in five of seven cells. In the two cells with T"~, its values were 16.3 and 18.3 msec. Thus, reduction in the amount of glutamate released effectively removed the slow phase of the EPSC.
Glutamate uptake selectively regulates the slow phase of the EPSC A slow phase of transmitter clearance might be expected to be regulated by uptake systems that operate on a similar time scale (Wadiche et al., 1995). Glutamate uptake can be blocked com-
1638 J. Neurosci., March 1, 1996, 16(5):1634-1644 Otis et al. . Transmitter Clearance and the EPSC
Figure 3. The slowest component of the EPSC (7”s) is attributable to AMPA receptor activation but is much slower than the kinetics of AMPA receptors.il, The same traces as displayed in Figure 2A are shown normalized in a semilog plot empha- sizing the slowest parts of the EPSC. Note the voltage dependence of the relative size but the parallel decay of the slowest component of the EPSC, indicating that rvs is independent of membrane potential. Each trace has a triple-exponential curve superim- posed. B, In the presence of 100 FM D,L-APV, both fast and slow phases of the EPSC are eliminated with CNQX. C, The I-Vplot compares the current measured at 20 msec after the initial rise of the EPSC in 100 PM D,L-APV (solid circles; n = lo), an NMDA receptor-mediated EPSC re- corded in 50 PM CNQX with no D,L- APV (solid triangles), and the steady- state responses to pressure-applied AMPA (100 pM, open circles; II = 3) and NMDA (100 PM, no APV, open hiungles, rz = 4). Error bars are +l SEM. 0, Delayed release is indepen- dent of rvs. Two EPSCs from one cell in which single stimuli evoked either a smoothly decaying slow EPSC (top trace, peak, not shown, -12.5 “A) or an EPSC with a flurry of mEPSCs (arrows) superimposed on the slow phase (bottom trace, peak -10.4 nA). Holding potential -68 mV. Scale bars are as in B.
A 101
1 W) El
0 50 100 150 time (ms)
B II
control, +76 mV
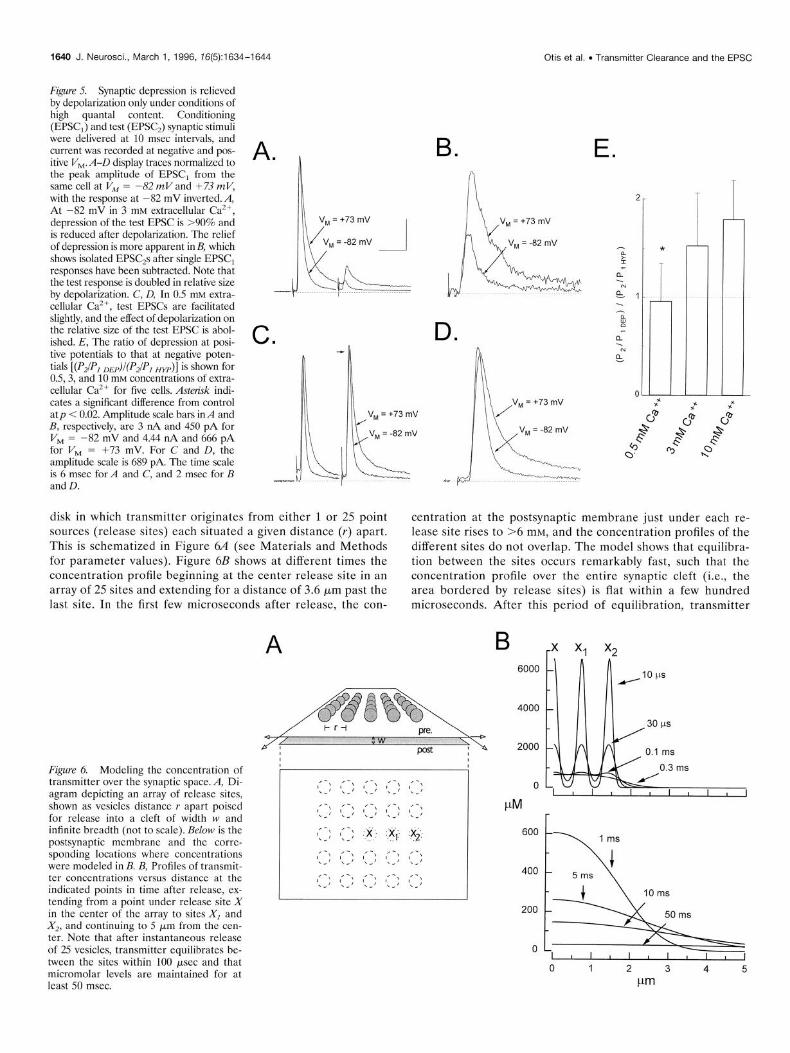
petitively by L-truns-PDC (Bridges et al., 1991) and THA (Balcar et al., 1977) in a variety of vertebrate preparations. As shown in Figure 4, A and B, and Table 1, block of glutamate uptake by 300 WM L-truns-PDC (8 cells) or THA (2 cells) markedly potentiated and prolonged the slow phase of the EPSC, without significantly affecting its earlier phases. Furthermore, as seen in Figure 4, C and D, the average amplitude of evoked EPSCs was not signifi- cantly different in L-truns-PDC and controls (L-trans-PDC/control amplitudes, 1.06 i 0.25; n = 8 cells). In these cells, uptake blockers produced only a small and variable steady inward current (-9 -C 13 pA with L-truns-PDC, -7 5 6 pA for THA; all at -70 mV). Uptake blockers also produced no significant changes in the amplitude, frequency, or time course of mEPSCs (n = 5 cells). Because in most cases the blockers had clear effects on the slow EPSC but no effect on the mEPSCs or on the early phase of the EPSC, it is unlikely that these drugs have any direct effect on the kinetics or affinity of AMPA receptors or on transmitter release. Thus, the data indicate that glutamate transporters selectively
regulate the size receptor EPSC.
C
-*-EPSC Mmo , :x L
I V M 0-W
and shape of the late phase of the AMPA
Interestingly, in uptake blockers the slow phase of the EPSC was nonexponential, often showing a plateau or hump before the current decayed back to baseline (Fig. 4A, asterisk). Such a delay in the fall of the EPSC might be expected if uptake block retarded glutamate removal from the cleft (see below in Modeling trans- mitter diffusion from multiple release sites). Because the late EPSC decay was nonexponential, we quantified the effect of L-trans-PDC by integrating EPSCs between 20 and 200 msec after onset. After blocking uptake, there was a twofold increase in the fraction of total EPSC charge transferred during the late phase, independent of holding potential (Table 1). The similarity of the charge enhancement at positive and negative potentials is signif- icant: it rules out the interpretation that the uptake blocker may have selectively revealed an NMDA component, perhaps because of the higher sensitivity of some unblocked NMDA receptors to glutamate or because of potential interactions of PDC with the
Table 1. Effects of L-tram-PDC on charge transfer and kinetics of the EPSC
VM NV) QsdQm,, (“ro) sat (msec) hw (msec) K,,, 6) F/z (msec)
Control -50 to -80 11.4 +- 5.6 0.87 5 0.28 3.7 k 1.2 4.4 t 2.8 5.8 + 6.6
+50 to +80 23.9 2 17.0 1.0 2 0.08 3.6 -c 1.4 19.4 2 12 15 -c 13.2
L-trans-PDC -50 to -80 26.2 k 6.8** 0.88 ? 0.23 3.7 F 1.2 6.5 k 4.4 18.8 ? 17.1*
+50 to +80 47.9 k 16.6** 1.12 2 0.3 4.6 k 1.9 19.4 2 14 38.6 i 33.9*
**p < 0.0075; *p < 0.05 differences from control by Student’s t-test. All values reported are mean -C SD for eight experiments using L-trans-PDC. Q,,,,,,/Q,,,,, is the charge measured 20-200 msec after the initial rise of the EPSC normalized to the total charge in the EPSC. 7haat and ~~~~~~ are exponential time constants, and IV,,,, is the weight of the medium time constant as defined in Materials and Methods. T,,, is the time taken to decay to half the peak current level measured after 20 msec from the rise of the EPSC.
Otis et al. l Transmitter Clearance and the EPSC J. Neurosci., March 1, 1996, 16(5):1634-1644 1639
1 (PA)
hl V, = -66 mV
100 200 300 0 50 100 150 time (ms) time (ms)
Figure 4. Antagonists of glutamate transport selectively increase and orolong the slowest component of the EPSC. A, C, 300 FM krans:PDC caused the slowest component of the EPSC to more than double, and decay more slowly compared with control (shown at V, = +68 mVin A), with no effect on the fastest phases of the EPSC decay (VM = -62 mV in C). Note the appearance of the hump (asterisk) in the EPSC decay in A. B, D, Similarly, single responses recorded in 300 pM THA and in control at V, = -66 mV show a selective increase in the slow EPSC.
NMDA receptor (Sarantis et al., 1994). Such an effect would have shown a relatively larger enhancement of current at positive potentials, at which NMDA receptors are most active. The effect of uptake blockers also was quantified by measuring the time for current to decay to half-amplitude (T,,,) from the current ampli- tude 20 msec after the beginning of the EPSC. This analysis showed that the late EPSC nearly doubled in duration after block of uptake (Table 1, Fig. 4A). Given the lack of effect of uptake blockers on mEPSC frequency, it is unlikely that the enhancement of T,,, is attributable to a nonspecific effect on release. Thus, the uptake blocker experiments reinforce the interpretation of ~vs as reflecting reactivation of AMPA receptors during slow transmitter clearance.
Desensitization with paired stimuli The residual transmitter proposed in this study to underlie the late EPSC, although activating a relatively small current, would be expected to contribute strongly to receptor desensitization, which can occur with very low concentrations of glutamate (Kiskin et al., 1986; Trussell and Fischbach, 1989; Colquhoun et al., 1992). Previous studies based on the action of drugs such as cyclothia- zide, which block desensitization (Trussell et al., 1993; Yamada and Tang, 1993), have suggested that transmitter release during a single EPSC can desensitize AMPA receptors and that desensiti- zation causes depression with paired synaptic stimuli. An alterna- tive approach to this issue that does not depend on assumptions about the specificity of any particular drug takes advantage of the observation that depolarization reduces the extent of AMPA receptor desensitization (Thio et al., 1992; Raman and Trussell, 1995b). If synaptic depression after paired synaptic stimuli results
in part from receptor desensitization, then depression should be reduced by postsynaptic depolarization. Paired EPSCs (EPSC, and EPSC,) were evoked at an interval of 10 msec with the membrane potential held at either -82 or +73 mV, as shown in Figure 5, A and C. The traces in 3 mM (control) Ca2+ (Fig. 5A,B) show that depression was reduced at positive potentials. Depres- sion was quantified by first normalizing EPSC, positive to that at negative potentials in each cell. Then the amplitude of EPSC, was measured after subtracting an unpaired EPSC,; examples of such difference traces are shown in Figure 5, B and D, for normal and 0.5 mM Ca*+. Using this method, the size of EPSC, could be measured accurately from the baseline generated by the decay of EPSC,. Figure 5E illustrates the reduction in depression by plot- ting the ratio of the extent of depression (EPSC,/EPSC,) at positive compared with negative potentials. In control Ca*+, the relative size of EPSC, was 50% larger after postsynaptic depolar- ization. These effects of membrane potential on the ratio of EPSC2/EPSC, were eliminated in 0.5 mM extracellular Ca’+, which reduces the amount of transmitter released (Fig. 5C,D). By contrast, increasing Ca*+ to 10 mM enhanced the effects of mem- brane potential (Fig. 5E). These data indicate that synaptic de- pression of AMPA receptors does have a voltage-sensitive and, therefore, postsynaptic component, consistent with desensitiza- tion by transmitter.
Modeling transmitter diffusion from multiple release sites To determine whether a protracted transmitter lifetime is theoretically plausible, computer simulations were performed based on an analytical description of diffusion within an infinite
1640 J. Neurosci., March 1, 1996, 76(5):1634-1644 Otis et al. . Transmitter Clearance and the EPSC
Figure 5. Synaptic depression is relieved by depolarization only under conditions of high quanta1 content. Conditioning (EPSC,) and test (EPSC,) synaptic stimuli were delivered at 10 msec intervals, and current was recorded at negative and pos- itive V,. A-D display traces normalized to the peak amplitude of EPSC, from the same cell at V, = -82 mV and +73 mV, with the response at -82 mV inverted. A, At -82 mV in 3 mM extracellular Ca*+, depression of the test EPSC is >90% and is reduced after depolarization. The relief of depression is more apparent in B, which shows isolated EPSCQ after single EPSC, responses have been subtracted. Note that the test response is doubled in relative size by depolarization. C, D, In 0.5 mM extra- cellular Ca*+, test EPSCs are facilitated slightly, and the effect of depolarization on the relative size of the test EPSC is abol- ished. E, The ratio of depression at posi- tive potentials to that at negative poten- tials [(Pa/PI D,&I(P#‘I -)I is shown for 0.5,3, and 10 ITIM concentrations of extra- cellular Ca*+ for five cells. Asterisk indi- cates a significant difference from control atp < 0.02. Amplitude scale bars inA and B, respectively, are 3 nA and 450 pA for V, = -82 mV and 4.44 nA and 666 pA for V, = +73 mV. For C and D, the amplitude scale is 689 pA. The time scale is 6 msec for A and C, and 2 msec for B and D.
-
C .
-
,V, = +73 mV
,Vhn = -82 mV
i
B.
V, = +73 mV
~
V, = -a2 mV
D.
V, = +73 mV
a:. J
V, = -82 mV
E.
2r
disk in which transmitter originates from either 1 or 25 point centration at the postsynaptic membrane just under each re- sources (release sites) each situated a given distance (Y) apart. lease site rises to >6 mM, and the concentration profiles of the This is schematized in Figure 6A (see Materials and Methods different sites do not overlap. The model shows that equilibra- for parameter values). Figure 6B shows at different times the tion between the sites occurs remarkably fast, such that the concentration profile beginning at the center release site in an concentration profile over the entire synaptic cleft (i.e., the array of 25 sites and extending for a distance of 3.6 Frn past the area bordered by release sites) is flat within a few hundred last site. In the first few microseconds after release, the con- microseconds. After this period of equilibration, transmitter
Figure 6. Modeling the concentration of transmitter over the synaptic space. A, Di- agram depicting an array of release sites, shown as vesicles distance r apart poised for release into a cleft of width w and infinite breadth (not to scale). Below is the postsynaptic membrane and the corre- sponding locations where concentrations were modeled in B. B, Profiles of transmit- ter concentrations versus distance at the indicated points in time after release, ex- tending from a point under release site X in the center of the array to sites XI and X,, and continuing to 5 wrn from the cen- ter. Note that after instantaneous release of 25 vesicles, transmitter equilibrates be- tween the sites within 100 psec and that micromolar levels are maintained for at least 50 msec.
0
IJM
600
400
200
0
r 1 ms
1 5ms
l&i?+ i IO ms
50 ms
0 1 2 3 4 5
Otis et al. l Transmitter Clearance and the EPSC J. Neurosci., March 1, 1996, 76(5):1634-1644 1641
A 1000
t ri
800
pM ‘O” 400
200
0
0 4 8 12 16 20
C 0.010
0.008
PO 0.006
0.004
I I I I I 0 50 100 150 200
ms 0 2 4 6 8 10
ms
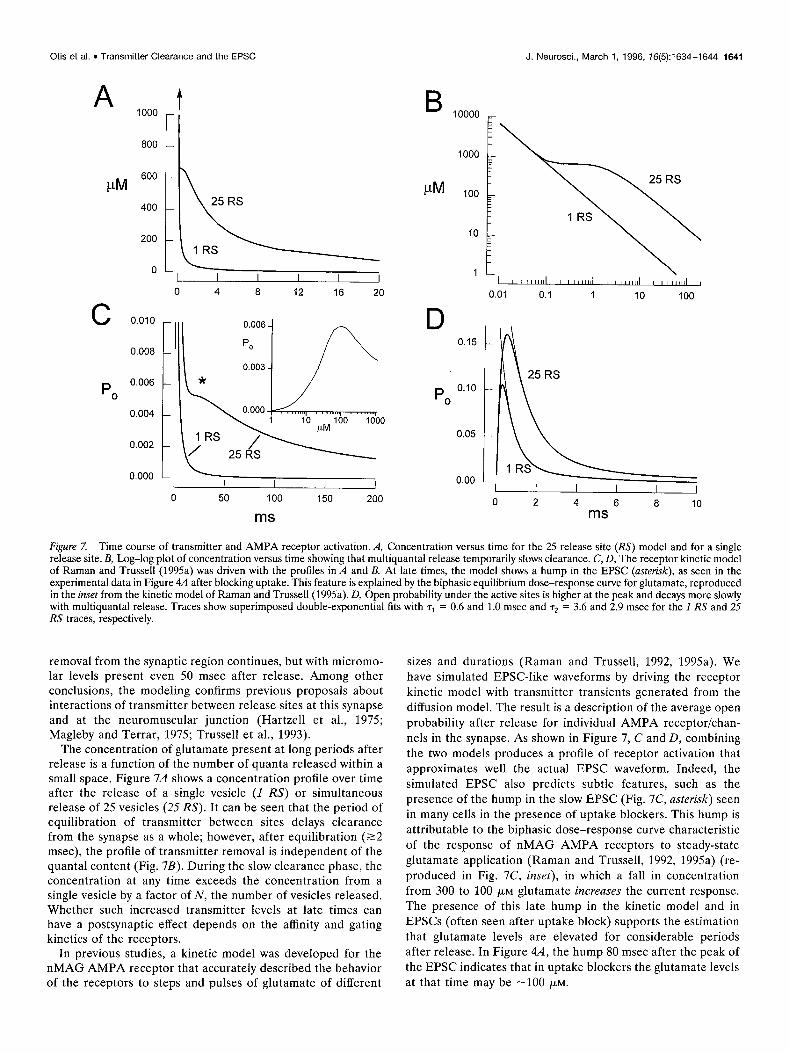
Figure 7. Time course of transmitter and AMPA receptor activation. A, Concentration versus time for the 25 release site (RS) model and for a single release site. B, Log-log plot of concentration versus time showing that multiquantal release temporarily slows clearance. C, D, The receptor kinetic model of Raman and Trussell (1995a) was driven with the profiles in A and B. At late times, the model shows a hump in the EPSC (asterisk), as seen in the experimental data in Figure 4A after blocking uptake. This feature is explained by the biphasic equilibrium dose-response curve for glutamate, reproduced in the inset from the kinetic model of Raman and Trussell (1995a). D, Open probability under the active sites is higher at the peak and decays more slowly with multiquantal release. Traces show superimposed double-exponential fits with r1 = 0.6 and 1.0 msec and r2 = 3.6 and 2.9 msec for the I RS and 25 RS traces, respectively.
removal from the synaptic region continues, but with micromo- lar levels present even 50 msec after release. Among other conclusions, the modeling confirms previous proposals about interactions of transmitter between release sites at this synapse and at the neuromuscular junction (Hartzell et al., 1975; Magleby and Terrar, 1975; Trussell et al., 1993).
The concentration of glutamate present at long periods after release is a function of the number of quanta released within a small space. Figure 7A shows a concentration profile over time after the release of a single vesicle (I RS) or simultaneous release of 25 vesicles (25 RS). It can be seen that the period of equilibration of transmitter between sites delays clearance from the synapse as a whole; however, after equilibration (~2 msec), the profile of transmitter removal is independent of the quanta1 content (Fig. 7B). During the slow clearance phase, the concentration at any time exceeds the concentration from a single vesicle by a factor of N, the number of vesicles released. Whether such increased transmitter levels at late times can have a postsynaptic effect depends on the affinity and gating kinetics of the receptors.
In previous studies, a kinetic model was developed for the nMAG AMPA receptor that accurately described the behavior of the receptors to steps and pulses of glutamate of different
sizes and durations (Raman and Trussell, 1992, 1995a). We have simulated EPSC-like waveforms by driving the receptor kinetic model with transmitter transients generated from the diffusion model. The result is a description of the average open probability after release for individual AMPA receptor/chan- nels in the synapse. As shown in Figure 7, C and D, combining the two models produces a profile of receptor activation that approximates well the actual EPSC waveform. Indeed, the simulated EPSC also predicts subtle features, such as the presence of the hump in the slow EPSC (Fig. 7C, asterisk) seen in many cells in the presence of uptake blockers. This hump is attributable to the biphasic dose-response curve characteristic of the response of nMAG AMPA receptors to steady-state glutamate application (Raman and Trussell, 1992, 1995a) (re- produced in Fig. 7C, inset), in which a fall in concentration from 300 to 100 PM glutamate increases the current response. The presence of this late hump in the kinetic model and in EPSCs (often seen after uptake block) supports the estimation that glutamate levels are elevated for considerable periods after release. In Figure 4A, the hump 80 msec after the peak of the EPSC indicates that in uptake blockers the glutamate levels at that time may be -100 PM.
1642 J. Neurosci., March 1, 1996, 76(5):1634-1644 Otis et al. l Transmitter Clearance and the EPSC
DISCUSSION
Multiple phases of the EPSC Termination of glutamate action at the nMAG synapse is influ- enced by deactivation/desensitization kinetics intrinsic to the re- ceptors and by the clearance rate of the transmitter. Our data indicate that these factors come into play at specific times during the synaptic response. At early times, diffusion reduces transmit- ter levels quickly enough that receptor kinetics plays a dominant role. By contrast, at later times, a very slow uptake-dependent removal dictates the time course of the current.
For single quanta, the removal time of the transmitter is suffi- ciently fast that deactivation kinetics determines the decay time of the synaptic current. When many vesicles are released, the two decay rates describing the early phase of the EPSC are indistin- guishable from the desensitization time constants, suggesting that the EPSC decay is curtailed by the onset of receptor desensitiza- tion. Alternatively, the early phase of the EPSC might not reflect desensitization but, rather, may be shaped predominantly by the time course of the release process (Diamond and Jahr, 1995; Isaacson and Walmsley, 199.5) which would match only coinci- dentally the time course of desensitization. Indeed, the slower rise time of the EPSC versus the mEPSC suggests that multiquantal release is not completely synchronous. However, it is unlikely in nMAG that dispersion of release is the dominating factor in shaping the early part of the EPSC. The slowing of the EPSC with postsynaptic depolarization (which presumably would not alter release) can be explained most easily by the voltage sensitivity of the receptors, indicating that receptor kinetics plays a key role in shaping the EPSC (Magleby and Stevens, 1972).
The late portion of the AMPA receptor EPSC described here requires that transmitter levels fall very gradually, remaining at micromolar levels tens of milliseconds after release. Based on previous studies estimating the time course of transmitter at noncalyceal central synapses (Busch and Sakmann, 1990; Clem- ents et al., 1992; Faber et al., 1992; Barbour et al., 1994), such a slow removal time was unexpected. One clue to the origin of slow removal is that the late EPSC is most apparent at high levels of release. Given the structure of the calyceal nerve endings, delayed removal of transmitter may result from pooling of transmitter from neighboring release sites. Based on the modeling we have shown, a gradual clearance after instantaneous release is theoret- ically possible given synaptic morphology and classical diffusion theory.
The simulations also made some unexpected predictions about the early phases of the EPSC. Transmitter release is presumably not instantaneous and, thus, the profile of release over time may influence the shape of the EPSC (Barrett and Stevens, 1972; Diamond and Jahr, 1995; Isaacson and Walmsley, 1995). However, it is of interest that, assuming instantaneous release, the simulated EPSC both rises and decays more slowly than the simulated mEPSC (Fig. 70), indicating that the slowing of the multiquantal EPSC reflects the equilibration of transmitter within the synaptic cleft as well as release time course. Thus, quantitative information regarding both these processes is re- quired to understand the shape of the fast EPSC and the role of desensitization in determining the fast phase of decay. An addi- tional finding from the model is that release of a single vesicle produces a smaller peak open probability than does release of multiple vesicles for receptors opposite active sites (Fig. 70). It may be that when release sites are close together, increasing
quanta1 content may increase not only the total synaptic conduc- tance but also the effectiveness of each quantum.
In this study, we have considered specifically the case of a calyceal synapse, which is specialized for release of many trans- mitter quanta. Indeed, it was the high receptor density on nMAG neurons and the large EPSC that allowed electrophysiological detection of the slow clearance of transmitter. However, such “residual” glutamate in the cleft may occur in a wider variety of synapses than those of the auditory system. Indeed, the diffusion model we have explored suggests that the delay in clearance must occur whenever unrestricted diffusion occurs between nearby and synchronously active synapses. Thus, neurons densely innervated by many different axon terminals, each making one or more release sites, might also experience delayed clearance. A similar scenario may hold for glomerular synapses, in which a single terminal releases onto many adjacent postsynaptic cells. In this regard, at the large synapse formed by cerebellar mossy fibers onto unipolar brush cells, a CNQX-sensitive, slow EPSC is ap- parent (Rossi et al., 1995). More realistic modeling that accounts quantitatively for diffusional pathways around neurons and glia may help define the extent of “cross-talk” between release sites at different types of synapses.
Roles for glutamate uptake in synaptic transmission Several reports have presented divergent views on the role of glutamate uptake in synaptic transmission. Barbour et al. (1994) and Takahashi et al. (1995) showed that block of uptake with o-aspartate or L-truns-PDC slows the fast phase of the EPSC in Purkinje cells and induces a steady inward current, the latter effect presumably attributable to glutamate accumulation or to gluta- mate heteroexchange at the transporter. We observed only weak and variable effects of uptake blockers on resting current and, consistent with reports that cloned and heterologously expressed transporters operate very slowly (Wadiche et al., 1995), no effect on the shape of the fastest parts of the EPSC. We also did not observe an increase in the amplitude of EPSCs after uptake block (Tong and Jahr, 1994), indicating that transporters do not act as rapid buffers of transmitter in the nMAG. Mennerick and Zorum- ski (1994,1995) showed effects of uptake block that were closer to those of the present study, although the effects in their study were only significant in the presence of cyclothiazide. Given the slow kinetics of transporters, it is most likely that uptake would alter slow transients or ambient glutamate levels, as observed in this study. Such an action may be relevant to dynamic aspects of neural activity in several ways.
First, regardless of the factors that shape the fast decay of the EPSC, it is likely that transmitter desensitizes receptors, because receptors continue to desensitize after free glutamate has been removed (Hestrin, 1992; Raman and Trussell, 1995a). Transport- ers thus may modulate receptor availability and speed recovery from desensitization during repetitive synaptic activity. A previous study proposing postsynaptic desensitization depended on the use of the drug cyclothiazide (Trussell et al., 1993); it may be argued that this drug simply enhanced release or made receptors more sensitive to low levels of transmitter. However, the present study confirms that high levels of release do lead to desensitization. (1) Paired-pulse depression was reduced by depolarization, a purely postsynaptic manipulation that reduces desensitization. (2) The early phases of the EPSC were slower than those of deactivation or the mEPSC, and were indistinguishable from desensitization time constants. (3) The concentration range of glutamate that would be required to produce the very slow phase of the EPSC is
Otis et al. . Transmitter Clearance and the EPSC J. Neurosci., March 1, 1996, 76(5):1634-1644 1643
sufficient to induce desensitization (Raman and Trussell, 1992). (4) The shape of the I-V curve of the late AMPA EPSC is the same as the that of the steady-state response to glutamate and AMPA (Fig. 3C) (Raman and Trussell, 1995b). (5) Unique fea- tures of the equilibrium dose-response curve appear in the slow EPSC. Recovery from desensitization will be dependent on the clearance time from the synapse. Thus, transporters could play a role in regulating the rate at which synapses could transmit effectively, by indirectly altering the recovery time from postsyn- aptic depression.
Second, the predicted concentration profile indicates that in the absence of uptake synapses with multiple release sites could produce a significant glutamate concentration outside the synaptic region. Such levels might be adequate to act on neighboring nerve terminals, either pre- or postsynaptically, as proposed for GABAergic synapses (Isaacson et al., 1993). In this way, active synapses might produce surround inhibition of neighboring ter- minals through presynaptic inhibitory metabotropic glutamate receptors or by AMPA receptor desensitization, dependent on the amount of transmitter released and the activity of transporters. However, it is unlikely that metabotropic glutamate receptors account for the strong paired-pulse depression in nMAG consid- ering the very rapid onset of depression (Zhang and Trussell, 1994b) and its apparent resistance to the metabotropic agonist trans-1-aminocyclopentane-1,3-dicarboxylic acid (T. Otis, unpub- lished observations; but see Barnes-Davies and Forsythe, 1995).
Finally, given the membrane properties of nMAG neurons, the absolute size of the slow EPSC, although small compared with the peak EPSC, is significant. In fact, a CNQX-sensitive, slow phase of the synaptic potential has been described that produces a plateau depolarization during high-frequency stimuli (Zhang and Trussell, 1994a). In that study, it was suggested that the plateau regulates temporal summation of the faster components of EPSPs and, thus, the generation of action potentials. In this regard, the action of the transporters may extend beyond the termination of transmitter action or maintenance of ambient glutamate levels and could play an active role in the firing properties of neurons in
v&o.
REFERENCES Balcar VJ, Johnston GAR, Twitchin B (1977) Stereospecificity of the
inhibition of L-glutamate and L-aspartate high affinity uptake in rat brain slices by threo-3-hydroxyaspartate. J Neurochem 28:1145-1146.
Barbour B, Keller BU, Llano I, Marty A (1994) Prolonged presence of glutamate during excitatory synaptic transmission to cerebellar Purkinje cells. Neuron 12:1331-1343.
Barnes-Davies M, Forsythe ID (1995) Pre- and postsynaptic glutamate receptors at a giant excitatory synapses in rat auditory brainstem slices. J Physiol (Lond) 488387-406.
Barrett EF, Stevens CF (1972) The kinetics of transmitter release at the frog neuromuscular junction. J Physiol (Lond) 227:691-708.
Bridges RJ, Stanley MS, Anderson MW, Cotman CW, Chamberlain AR (1991) Conformationally defined neurotransmitter analogues: selective inhibition of glutamate uptake by one pyrrolidine-2$dicarboxylate diasteromer. J Med Chem 34:717-725.
Busch C, Sakmann B (1990) Synaptic transmission in hippocampal neu- rons: numerical reconstruction of quanta1 IPSCs. Cold Spring Harb Symp Quant Biol 55:69-80.
Carslaw HS, Jaeger JC (1959) Conduction of heat in solids, 2nd Ed. Oxford: Clarendon.
Clements JD, Lester RAJ, Tong G, Jahr CE, Westbrook GL (1992) The time course of glutamate in the synaptic cleft. Science 258:1498-1501.
Colquhoun D, Jonas P, Sakmann B (1992) Action of brief pulses of glutamate on AMPA/kainate receptors in patches from different neu- rones of rat hippocampal slices. J Physiol (Lond) 458:261-287.
Diamond JS, Jahr CE (1995) Asynchronous release of synaptic vesicles determines the time course of the AMPA receptor-mediated EPSC. Neuron 15:1097-1107.
Faber DS, Young WS, Legendre P, Korn H (1992) Intrinsic variability due to stochastic properties of receptor-transmitter interactions. Sci- ence 2581494-1498.
Forsythe ID, Westbrook GL (1988) Slow excitatory postsynaptic currents mediated by N-methyl-D-aspartate receptors on cultured mouse central neurones. J Physiol (Lond) 396:515-533.
Goda Y, Stevens CF (1994) Two components of transmitter release at a central synapse. Proc Natl Acad Sci USA 91:12942-12946.
Gulley RL, Wenthold RJ, Neises GR (1977) Remodeling of afferent neuronal membranes as an early response to deafferentation. J Cell Biol 75:837-850.
Hamill OP, Marty A, Neher E, Sakmann B, S&worth FJ (1981) Im- proved patch-clamp techniques for high-resolution current recording from cells and cell-free membrane patches. Pfltigers Arch 391:85-100.
Hartzell HC, Kuffler SW, Yoshikami D (1975) Post-synaptic potentia- tion: interaction between quanta of acetylcholine at the skeletal neuro- muscular synapse. J Physiol (Lond) 251:427-463.
Hestrin S (1992) Activation and desensitization of glutamate-activated channels mediating fast excitatory synaptic currents in the visual cortex. Neuron 9:991-999.
Hestrin S, Nicoll RA, Perkel DJ, Sah P (1990) Analysis of excitatory synaptic action in pyramidal cells using whole-cell recording from rat hippocampal slices. J Physiol (Lond) 422:203-225.
Isaacson JS, Walmsley B (1995) Counting quanta: direct measurements of transmitter release at a central synapse. Neuron 15:875-884.
Isaacson JS, Solis JM, Nicoll RA (1993) Local and diffuse synaptic ac- tions of GABA in the hippocampus. Neuron 10:165-175.
Kiskin NI, Krishtal OA, Tsyndrenko AY (1986) Excitatory amino acid receptors in hippocampal neurons: kainate fails to desensitize them. Neurosci Lett 63:225-230.
Longsworth LG (1953) Diffusion measurements, at 25”, of aqueous so- lutions of amino acids, peptides and sugars. J Am Chem Sot 75:5705-5709.
Magelby KL, Stevens CF (1972) A quantitative description of endplate currents. J Physiol (Lond) 223:173-197.
Magleby KL, Terrar DA (1975) Factors affecting the time course of decay of end-plate currents: a possible cooperative action of acetylcho- line on receptors at frog neuromuscular junction. J Physiol (Lond) 2441467-495.
Maki AA, Beck MM, Gleaves EW, DeShazer JA, Eskridge KM (1990) CSF ion composition and manipulation during thermoregulation in an avian species, Gallus domesticus. Comp Biochem Physiol [A] 96:135-140.
Mattox DE, Olmos DR, Rubel EW (1985) Freeze-fracture of neurons in nucleus magnocellularis of the chick. Hear Res 17:67-78.
Mennerick S, Zorumski CF (1994) Glial contributions to excitatory neu- rotransmission in cultured hippocampal cells. Nature 355:50-55.
Mennerick S, Zorumski CF (1995) Presynaptic influence on the time course of fast excitatory synaptic currents in cultured hippocampal cells. J Neurosci 15:3178-3192.
Nicholson C, Phillips JM (1981) Ion diffusion modified by tortuosity and volume fraction in the extracellular microenvironment of the rat cere- bellum. J Physiol (Lond) 321:225-257.
Otis TS, Raman IM, Trussell LO (1995) AMPA receptors with high Ca2+ permeability mediate synaptic transmission in the auditory pathway. J Physiol (Lond) 482:309-315.
Parks TN, Taylor D, Jackson H (1990) Adaptations of synaptic form in an aberrant projection to the avian cochlear nucleus. J Neurosci 10:975-984.
Peters A, Palay SL, Webster HD (1991) The fine structure of the nervous system, 3rd Ed. New York: Oxford UP.
Rahamimoff R, Yaari Y (1973) Delayed release of transmitter at the frog neuromuscular junction. J Physiol (Lond) 228241-257.
Raman IM, Trussell LO (1992) The kinetics of the response to glutamate and kainate in neurons of the avian cochlear nucleus. Neuron 9:173-186.
Raman IM, Trussell LO (1995a) The mechanism of AMPA receptor desensitization after removal of glutamate. Biophys J 68137-146.
Raman IM, Trussell LO (1995b) Concentration jump analysis of voltage- dependent conductances activated by glutamate and kainate in neurons of the avian cochlear nucleus. Biophys J 69:1869-1879.
1644 J. Neurosci., March 1, 1996, 76(5):1634-1644 Otis et al. l Transmitter Clearance and the EPSC
Rice ME, Gerhardt GA, Hierl PM, Nagy G, Adams RN (1985) Diffusion coefficients of nemotransmitters and their metabolites in brain extra- cellular fluid space. Neuroscience 15:891-902.
Riveros N, Fiedler J, Lagos N, Munoz C, Orrego F (1986) Glutamate in rat brain cortex synaptic vesicles: influence of the vesicle isolation procedure. Brain Res 386:405-408.
Rossi DJ, Alford S, Mugnaini E, Slater NT (1995) Properties of trans- mission at a giant glutamatergic synapse in cerebellum: the mossy fiber-unipolar brush cell synapse. J Neurophysiol 74:24-42.
Sarantis M. Ballerini L. Miller B. Silver RA. Edwards M. Attwell D (1993) Glutamate uptake from the synaptic’ cleft does not shape the decay of the non-NMDA component of the synaptic current. Neuron 11:541-549.
Takahashi M, Kovalchuk Y, Attwell D (1995) Pre- and postsynaptic determinants of EPSC waveform at cerebellar climbing fiber and par- allel fiber to Purkinje cell synapses. J Neurosci 15:5693-5702.
Thio LL, Clifford DB, Zorumski CF (1991) Characterization of quisqual- ate receptor desensitization in cultured postnatal rat hippocampal neu- rons. J Neurosci 11:3430-3441.
Tong G, Jahr CE (1994) Block of glutamate transporters potentiates postsynaptic excitation. Neuron 13:1195-1203.
Trussell LO, Fischbach GD (1989) Glutamate receptor desensitization and its role in synaptic transmission. Neuron 3:209-2X
Trussell LO, Otis TS (1996) Physiology of AMPA receptors: biophysical properties that subserve the integrative roles of synapses. In: Excitatory amino acids and the cerebral cortex (Hicks TP, Conti F, eds). Cam- bridge: MIT, in press.
Trussell LO, Zhang S, Raman IM (1993) Desensitization of AMPA receptors upon multi-quanta1 neurotransmitter release. Neuron 10:1185-1196.
Wadiche JI, Arriza JL, Amara SG, Kavanaugh MP (1995) Kinetics of a human glutamate transporter. Neuron 14:1019-1027.
Yamada KA, Tang CM (1993) Benzothiadiazides inhibit rapid glutamate receptor desensitization and enhance glutamatergic synaptic currents. J Neurosci 13:3904-3915.
Zhang S, Trussell LO (1994a) A characterization of excitatory postsyn- aptic potentials in the avian nucleus magnocellularis. J Neurophysiol 721705-718.
Zhang S, Trussell LO (1994b) Voltage clamp analysis of excitatory syn- aptic transmission in the avian nucleus magnocellularis. J Physiol (Lond) 480:123-136.


![Esophageal motility abnormalities in …...ineffective esophageal acid and bolus clearance, delayed gastric emptying and impaired mucosal defensive fac-tors[9,10]. The recent advent](https://img.pdfslide.net/doc/110x75/5f02136b7e708231d40273b5/esophageal-motility-abnormalities-in-ineffective-esophageal-acid-and-bolus-clearance.jpg)