Embed Size (px)
Citation preview
Delegation and Pay-for-Performance: Evidence from Industrial Sales Force
Mrinal Ghosh W “H” and Callie Clark Associate Professor of Marketing
University of Arizona Email: [email protected]
Francine Lafontaine William Davidson Professor of Business
Economics & Public Policy University of Michigan Email: [email protected]
and
Desmond (Ho-Fu) Lo*
Assistant Professor of Marketing Santa Clara University Email: [email protected]
April 22, 2011
Preliminary and Incomplete Please Do Not Cite Without Permission
* Corresponding author
___________________ We thank participants at the Marketing Science Conference and in the Economics Department at Kansai University for helpful comments. We also thank our respective institutions for financial support. The usual disclaimer applies.
Preliminary and Incomplete. Please Do Not Cite Without Author Permission
Delegation and Pay-for-Performance: Evidence from Industrial Sales Force
ABSTRACT
Theory suggests that pay-for-performance incentives need to be aligned with
appropriate levels of delegation. Empirical research on the extent of delegation, and on the
relationship between delegation and pay-for-performance, remains scarce, however. We
offer evidence regarding these in the context of industrial sales forces. Consistent with
theory, we find that sales people are given more pricing authority when they have superior
local information, but less pricing authority when the need for coordination within the firm
is greater. Our data also show that managers give more pricing authority to sales people
who are more experienced. Most importantly, we find that sales persons’ pay-for-
performance is positively and robustly related to the level of delegation of pricing
authority. (JEL codes: D22; L14; M31; M52)
1
Preliminary and Incomplete. Please Do Not Cite Without Author Permission
1. INTRODUCTION
The allocation of decision rights and the design of compensation schemes are
important features of organizational design in firms, reflecting both how firms motivate
their employees and coordinate their activities. Theory suggests that companies should
centralize authority for coordination purposes when information is publicly available, i.e.,
symmetric (Acemoglu et al. 2007; Rantakari 2008), whereas they should delegate
decisions to a greater extent when the need to adapt to local environment under private
information becomes more prominent (e.g., Lal 1986; Aghion and Tirole 1997; Dessein
2002; Mishra and Prasad 2004). At the same time, as mentioned by Prendergast (2002),
pay-for-performance can be used to align incentives between employees and employers
when performance measures are readily available, and, “uncertainty affects the
responsibilities offered to workers, which in turn affects incentives” (p. 1075).
Evidence regarding the extent of delegation of responsibilities and its relationship with
performance pay is quite rare, however. Regarding the former, a few authors have
examined the allocation of control or decision rights in inter-firm contracts, namely in
technology alliances (Lerner and Merges, 1998; Ryall and Sampson, 2009) and in car
dealership agreements (Arrunãda, Garicano, and Vázquez, 2001). They have shown that
contracting parties allocate fewer decision rights to their partners when valuable assets are
potentially threatened by the actions of the partners. Others have considered delegation
decisions within firms, in the context of technology adoption (Acemoglu et al. 2007),
information-technology decisions (McElheran, 2010) and sales personnel (Frenzen et al.
2010), and consistent with theoretical models of delegation, they have shown that
delegation levels vary based on the value of local information – e.g. at the division level –
and the value of coordination. As for the relationship between performance pay and
delegation, to our knowledge, Nagar (2002) and Wulf (2007) are the only studies to have
addressed this question. Specifically, in his survey of retail banking management, Nagar
(2002) finds that branch managers who are given more discretion are also paid a greater
proportion of their pay in the form of bonus. Similarly, Wulf (2007) finds that the
compensation of division managers who have broader authority – i.e. those who are
designated as corporate officers rather than local managers – is more sensitive to firm-
level performance measures. However, in both these studies, measurement issues make it
difficult to infer whether the greater proportion of realized pay that is performance based
is the result of greater effort and capacity to affect firm profits on the part of these
2
Preliminary and Incomplete. Please Do Not Cite Without Author Permission
managers, or because the firm uses a pay scheme with more high-powered incentives to
compensate these individuals (see also Lafontaine and Bhattacharyya 1995, and Lo et al.
2011, on this issue).
In this paper, we use survey data from 261 industrial equipment firms and their sales
forces to examine (1) the determinants of the pricing authority accorded to an industrial
sales person, where pricing authority is a measure of delegation, and (2) the relationship
between pay-for-performance and pricing authority. The context of industrial-equipment
sales is especially appealing to investigate these issues for a variety of reasons. First,
incentive pay is the norm for sales-force compensation (e.g., John and Weitz 1989;
Zoltners et al. 2006, p.2). Second, most firms in the industrial equipment sector confer a
specific level of pricing discretion to their sales people. In particular, sales people in these
sectors usually have the authority to unilaterally offer price discounts off the list price to
their customers, up to a certain percentage – say 10% - without having to confer with
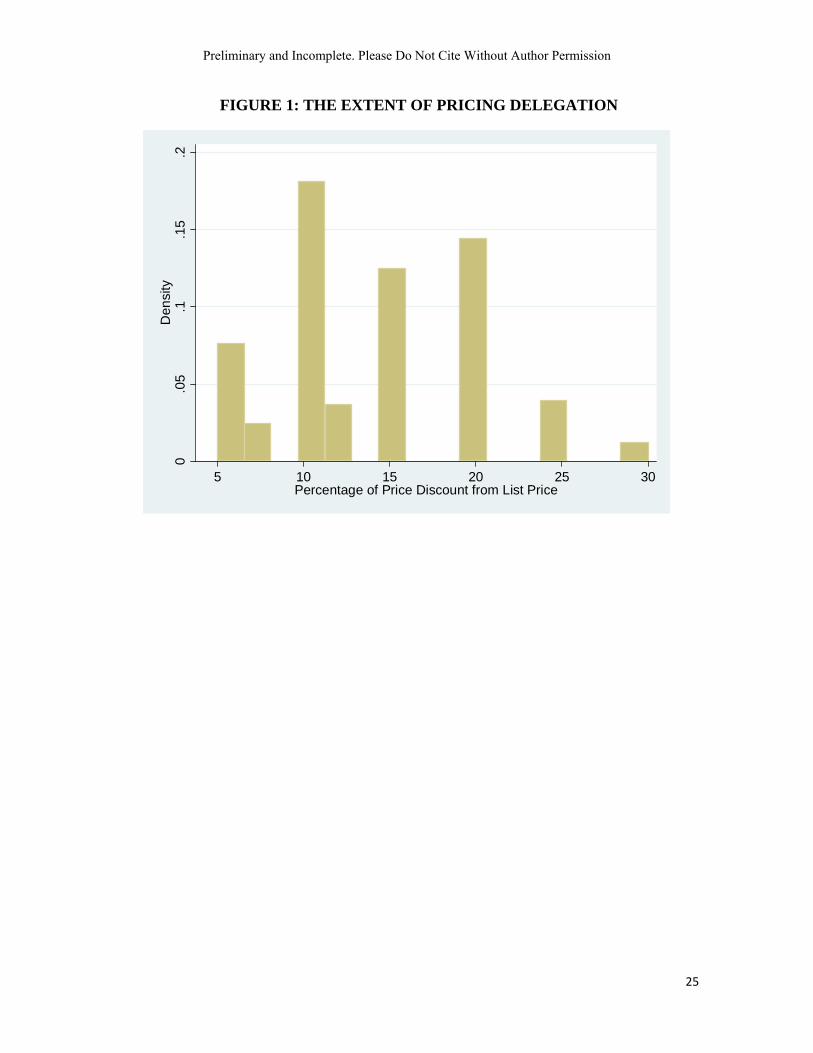
his/her superior. In our data, this authority ranges from 5% to 30% off the list price.
Discounts beyond the authorized level require approval from the supervising manager.
This discretionary authority can be different for different sales people within the same
organization or sales force. The sales force managers we surveyed agreed to give us data
on the percentage pricing discretion given to an individual sales person at each firm, along
with several characteristics of the sales person in question. In contrast, the measures of
delegation of authority in previous work have been perceptual or categorical (e.g., see
Nagar 2002; Colombo and Delmastro 2004; Wulf 2007; Frenzen et al. 2010).
Consistent with the rationale on the effect of superior local information, we find a
positive relationship between the extent of asymmetric information – captured by a
measure of customer heterogeneity - and the extent of price delegation. Furthermore, in
the sales-force context, the level of pricing authority usually is conferred to individual
employees, and, contrary to compensation schemes, need not be the same across all
members of the sales force. This implies that agent characteristics, in addition to task
characteristics, may affect the level of delegation. Consistent with this expectation, we
find that price delegation is increasing in a sales person’s tenure at the company. Our
results also support the prediction that to enhance internal coordination across different
functions, sales managers centralize pricing decisions – that is they reduce the sales
person’s authority – when the environment the firm operates in is more dynamic, e.g., fast
technological innovation and unpredictable demand.
3
Preliminary and Incomplete. Please Do Not Cite Without Author Permission
Of greatest interest, our data show a strong positive relationship between pricing
authority and pay-for-performance, whether we treat the extent to which the firm relies on
performance pay as exogenous or endogenous. This result is consistent with the evidence
on executive compensation and decision-making authority (Nagar 2002; Wulf 2007) and
supports Prendergast (2002)’s conjecture concerning the positive relationship between
authority delegation and pay-for-performance. It is also consistent with a model of
delegation that takes into account the extent to which the sales person’s incentives are
aligned with those of the principal via the compensation scheme, as described further
below. Moreover, the effects of various job and agent characteristics on pricing authority
are attenuated, but not eliminated, when we control for the commission rate. This implies
that job and agent characteristics, in conjunction with the extent of pay-for-performance,
determine the level of price delegation that firms choose.
The paper is organized as follows. In the next section, we present the theoretical
arguments that underlie our empirical analyses. We then describe our empirical context
and data collection process, as well as the measures used in our empirical analyses, in
Section 3. We formulate our econometric model and present our results in Section 4.
Section 5 concludes.
2. DELEGATION AND PAY-FOR-PERFORMANCE
The types of situations where it will be beneficial for the firm to give more discretion
to its agent are those where the agent has an informational advantage. In such a context,
delegation, or decentralization, is preferred because it allows agents to make better use of
their local information (Lafontaine and Bhattacharyya 1995; Alonso et al. 2008).
In industrial sales, sales people are likely to have superior information concerning the
needs of the customers in their territories since customers’ requirements for and usage of
sophisticated equipment and machines tends to vary. Moreover, business/organizational
purchasing often involves complex procedures, relationship building, and customer
services, which in turn require a high level of personal selling from a sales person (Dwyer
and Tanner 2009, Chapter 4). In these circumstances, both pricing discretion and pay-for-
performance would be important incentive mechanisms for selling and customer servicing
purposes, since the sales person must possess a good understanding of the product, but
also be competent and trustworthy in initiating, negotiating, and closing the sale without
4
Preliminary and Incomplete. Please Do Not Cite Without Author Permission
immediate supervision from his/her manager. Thus, sales people who attend to the needs
of more heterogeneous customers and face intense competition from similar products,
where the latter requires that they respond rapidly to competing offers, presumably will be
given more pricing authority.
On the other hand, firms that sell industrial equipment also may face fast technological
innovation and hard-to-predict industry-level demand fluctuation. Such disturbances affect
the conditions faced by all members of the sales force, and are exogenous to the sales
person’s effort. Reacting to such non-private information thus is likely to require
coordinated effort and decisions. Consequently, managers of sales forces are likely to
retain more pricing authority for sales-team or cross-functional coordination purposes
within the company in those firms where technological or demand shocks are more
common (Acemoglu et al. 2007; Rantakari 2008). We therefore expect sales people
pricing authority to be inversely related to the extent of technological or demand volatility
faced by the firm.
Another advantage of our setting is that in the market for capital industrial goods,
individual customers usually have specific needs, i.e., they require a specific number of
machines or computer equipment of a particular type. In essence then, these are markets
where we can treat customers as having unit demand: they do not choose quantity based
on price but rather send out “requests for proposals” for specific bundles of goods. The
consequence of this fact is that we can treat price discounts as affecting the likelihood of
closing the sale, and the number of customers served by the firm, but not individual
customer decisions on quantity. In turn, this implies that the level of authority delegated to
the sales person should be positively related with the commission rate offered by the firm.
As we show in our model below, this arises because when a sales person’s pay barely
depends on sales revenues generated, he/she will offer more price discounts to customers
so as to reduce the level of effort needed to close the sale (e.g., Stephenson et al. 1979;
Joseph 2001). To curb this “effort-aversion” tendency, firms will choose to keep the level
of pricing authority low when sales commission rates are also low. The sales person
whose pay is highly dependent on the sales revenues he/she generates will put in more
effort and try to keep the discount lower as his/her total compensation go down with the
level of discount.
5
Preliminary and Incomplete. Please Do Not Cite Without Author Permission
2.1. A Simple Model
In what follows, we adapt a basic model from Dessein (2002) to illustrate some of our
discussion above and generate the hypotheses that we bring to the data below. Consider an
employer or firm (the principal/she), who produces and sells industrial goods, and its sales
person (the agent/he). We assume that customers in this market have unitary demand, i.e.
they put out requests for proposals and buy from the seller with the most competitive
offer. The latter may or may not be the lowest price seller as sales person effort and
support, and interactions between customer current and proposed purchases, can help the
customer realize value from the equipment. Because he interacts with customers directly,
the sales person learns market conditions and customer needs and valuation, but the
principal only knows the distribution of values for its equipment. We assume that the
value of the good to customers is drawn from a uniform distribution whose support is [V,
3V] where V is assumed greater than 0.
The firm decides whether to delegate pricing authority to its sales person before the
latter learns market conditions or customer taste. We assume that the principal is
committed to this delegation decision.1, 2 The sale yields a benefit B(p, v) to the principal,
where p is price and v is customer value, which as described above is drawn from a
uniform distribution. The benefit to the principal of selling the equipment can be different
from the sales revenue generated due to various types of reasons. For example, a given
sale might increase the chances that the same customer buys complementary goods from
the firm in the future, or some of the customer’s competitors may be more or less likely to
buy from the firm as a result of this sale, or the terms of the sale may be such that they
affect other sales or future business more generally. For simplicity, we assume that the
benefit to the firm is greatest if the customer pays exactly his valuation for the good.
Specifically, we write the firm’s benefit function as which is
maximized at p = v. For the sales person, a sale generates a benefit of u(p, v, b), where b >
0 captures the agent’s bias. More specifically, we take the sales person’s utility function to
be u(p, v, b) . In other words, the sales person’s preferred price for the
good is below that which maximizes the benefit to the firm. This happens because the
R(p, v) 2K (p v)
2k (p (v b))
1 For simplicity, we assume the firm only chooses to delegate or not, and we do not allow for communication. See Crawford and Sobel (1978) and Dessein (2002) for models where communication is feasible. 2 Commitment is possible under self-enforcing relational contracts (Baker, Gibbons, and Murphy 1999), which seems to fit our context since the sales persons in our sample are in long term employment relationship with their employer. The average tenure of the sales persons in our data is over four years.
6
Preliminary and Incomplete. Please Do Not Cite Without Author Permission
sales person must put in effort for the customer to realize the value v, but the equipment
can be sold at a lower price with less effort. The sales person’s disregard of the effect of
his behavior on the prices at which the equipment can be sold in other territories, or lack
of attention toward non-sales functions such as marketing and product development, are
also potential sources of agent bias in the sense that they lead the agent to prefer a
different price from the one that the firm would choose. Specifically, such horizontal
externalities reflect coordination needs within the organization, which may cause an
individual sales person to charge a lower price that what the firm would like to offer.3
Both parties’ benefit functions, including the value of b, are common knowledge.
The decision to delegate pricing authority or not is based on a comparison of the firm’s
expected benefits. Under delegation, the sales person chooses p = v – b, from which the
firm obtains
DE(R ) K b2 . (1)
where the superscript D stands for delegation. If the firm retains control over the pricing
decision, it chooses p to maximize its expected benefits:
3VND 2
Vp p
1max E(R ) max (K (p v) ) dv
2V , (2)
where the superscript ND stands for non-delegation, and 1/(2V) is the probability density
function of v. Rewriting gives
2
2
p
13Vmax (K ) (p 4pV),
3
which implies the optimal p, p* = 2V. The firm’s maximized expected benefit under full
price control then is
2
ND VE(R ) K
3 . (3)
Comparing (1) and (3), the firm chooses to delegate pricing authority when
DE(R ) NDE(R ) 2
2 Vb , or b <
3 3
V
. (4)
Equation (4) says that given agent bias, the likelihood of delegation increases with V
(equivalently, the variance of v, V2/3). In the context of industrial sales, this translates into
the hypothesis that price delegation increases in the value of the sales person’s superior
information concerning market/customer conditions. Conversely, when the variance of
3 See e.g. Blair and Lafontaine (2005, pp.121-5) for discussions and theory of individual franchisee’s bias of charging a lower price than the optimal chain-wide price in the context of business-format franchising.
7
Preliminary and Incomplete. Please Do Not Cite Without Author Permission
customer valuation decreases, the firm has a more precise understanding of local market
conditions. To reduce the loss caused by agent bias, the firm opts for no delegation. In the
extreme case in which v degenerates at a mass point, in other words when the information
on market condition/customers becomes public (as is the case, e.g., with information
concerning technological change and shifts in industry demand), the firm always keeps
control over pricing decisions. Retaining price control benefits the firm in this situation in
that it facilitates coordination among different sales people and/or across different
functions such as sales, product development, and marketing within the company at large.
From the parties’ benefit functions and equation (4), it is clear that under information
asymmetry, delegation is more likely when agent bias is smaller, which is likely to be the
case for those sales people that the firm chooses to keep on the staff longer. In other
words, we expect sales person with longer tenure at the firm to be given greater pricing
authority as longer tenure (or retention) implies a better fit between job and agent
characteristics. The same prediction would also hold when the sales person is less like to
substitute price discounts with sales effort. This will be the case when the sales person has
a lower cost of sales effort; in other words, when he is more competent in customizing his
sales approach to customer needs and requirements.
Finally, we can introduce performance pay, which, as is well known, helps align the
interests of an agent to those of his principal, in our simple model as follows. Suppose the
firm shares the sales revenue in the form of a commission to the sales person. The benefit
function of the firm now is , whereSR (p, v) 2(1 )(K (p v) ) 0 1 is the sharing
parameter or commission rate, while the sales person’s benefit function becomes
{ }, which can be rewritten as 2k (p (v b)) 2(p v) )(K
S 2
S S 2
1u (p, v, b) (k K) (1 )(p (v b))
1
k (1 )(p (v b )) ,
where agent bias becomes Sb . This Sb is smaller than b since the fraction in front of b is
less than one. As can be easily verified, the manager still chooses to delegate under the
rule Sb <V/ 3 . Therefore, the manager is more likely to delegate pricing authority under
the incentivized compensation for her sales person as performance pay reduces effective
agent bias.
8
Preliminary and Incomplete. Please Do Not Cite Without Author Permission
3. EMPIRICAL CONTEXT AND DATA
An empirical analysis of the firm’s decision to delegate pricing authority, and of the
relationship between such price delegation and pay-for-performance, requires data not
only on individual-level pricing authority and compensation earned by a sales person but
also key task and agent characteristics. For that reason, we obtained our data using a mail
survey administered to sales managers in firms involved in equipment sales, which are
found in four major sectors, namely non-electrical machinery including computer
equipment (SIC 35), electrical and electronic machinery (SIC 36), transportation
equipment (SIC 37), and instruments (SIC 38). To ensure data quality, a number of steps
were taken, including (1) detailed pilot interviews with field sales managers to ascertain
the relevance of our issues to their sales contexts, (2) choosing the appropriate survey
participants, and (3) constructing appropriate measures of our variables. These steps are
described below.
3.1. Pilot Interviews
To better understand the issues firms face in choosing the extent of pricing discretion
they grant to individual sales people and designing compensation plans for them, we
conducted on-site field interviews with sales managers at 16 firms. Each interviewee was
directly responsible for managing the firm’s direct sales force. These interviews lasted for
an average of about 3 hours each. We also pre-tested our survey instrument during some
of these interviews. Insights from this pilot study were then used to refine the
questionnaire and generate the final survey instrument.
Regarding compensation plans for industrial sales forces, we learned that, in contrast
to executive compensation schemes, which are very individualized, pay plans for sales
forces are structured at the level of the sales force or sales group. More precisely, sales
people within a particular group/tier, selling similar products to customers with similar
profiles, and within similar geographies, are normally offered the same compensation
plan, albeit one where the fixed component may be adjusted for cost of living and/or travel
to office “dearness” allowances. These sales-force level plans are set to reflect the task
environment faced by these employees generally as well as to “attract/retain” the
appropriate type of sales person – one whom the manager thinks fits the job requirement
on hand (see Lo et al. 2011 for more on this). The managers also noted that the core
9
Preliminary and Incomplete. Please Do Not Cite Without Author Permission
components of their sales-force compensation plans were base salary and sales-based
commission.
Our discussions also revealed that the pricing authority or discretion accorded to a
sales person is usually chosen after the sales person joins the job. This pricing
discretion/authority usually takes the form of giving the sales person unilateral rights to
offer price discounts up to a certain percentage of the product’s list price. The choice of
this percentage is based on the manager’s assessment of the sales person’s ability and skill
as well as the particular task environment (e.g., competition intensity) in the sales person’s
territory. Furthermore this pricing discretion can change over time as the sales person
gains experience and the manager obtains more information about the sales person’s
ability.
These discussions also confirmed that allowing their sales people to offer price
discounts did not necessarily mean that the sales person “automatically” drops prices to
encourage the sale (i.e. substitutes price discounts for effort). The managers instead
indicated that the sales person whose pay depends heavily on commission will be very
deliberative about discounting because lower prices also mean that the sales person’s own
commission pay would be lower
3.2. Selection of Survey Participants and Data Collection Procedure
To obtain quality measures of our key variables, we used a two-stage procedure to
reach our survey participants. We first obtained a list of sales managers of manufacturing
firms with sales exceeding $100 million in the relevant industrial sectors from two list
brokers – the American List Council and Dunn and Bradstreet. The 1470 individuals on
these lists were then contacted by phone. To qualify as key informants, they had to meet
two criteria: they had to be primarily involved in managing the sales force for their
division/firm in a well-defined customer, product, or geographic market; and their firm
had to be using a direct sales force rather than contract dealers in those markets. Four
telephone calls on average were required to qualify each informant. To elicit cooperation,
we offered each manager a customized report summarizing the findings from our survey
and comparing their profile to the average patterns in the data. Of the initial 1470
individuals, 869 indicated that they use a direct sales force. In the second stage, we mailed
questionnaires to each of these 869 respondents. After two reminders, we had obtained
264 responses. Three of these were discarded for missing data, for a final sample of 261
responses (or a response rate of 30%).
10
Preliminary and Incomplete. Please Do Not Cite Without Author Permission
The survey questions were designed to be specific to a particular sales person that
these sales managers were currently supervising. To minimize selection bias on the sales
person, we asked the sales manager to identify a customer who had procured their
company’s product over the previous fiscal year (2004) and then identify the sales person
who was responsible for making that particular sale. We then requested that the manager
give responses pertaining to this and only this sales person. Hence, our unit of analysis is
an individual sales person, with each sales person, or data point, representing a different
firm.
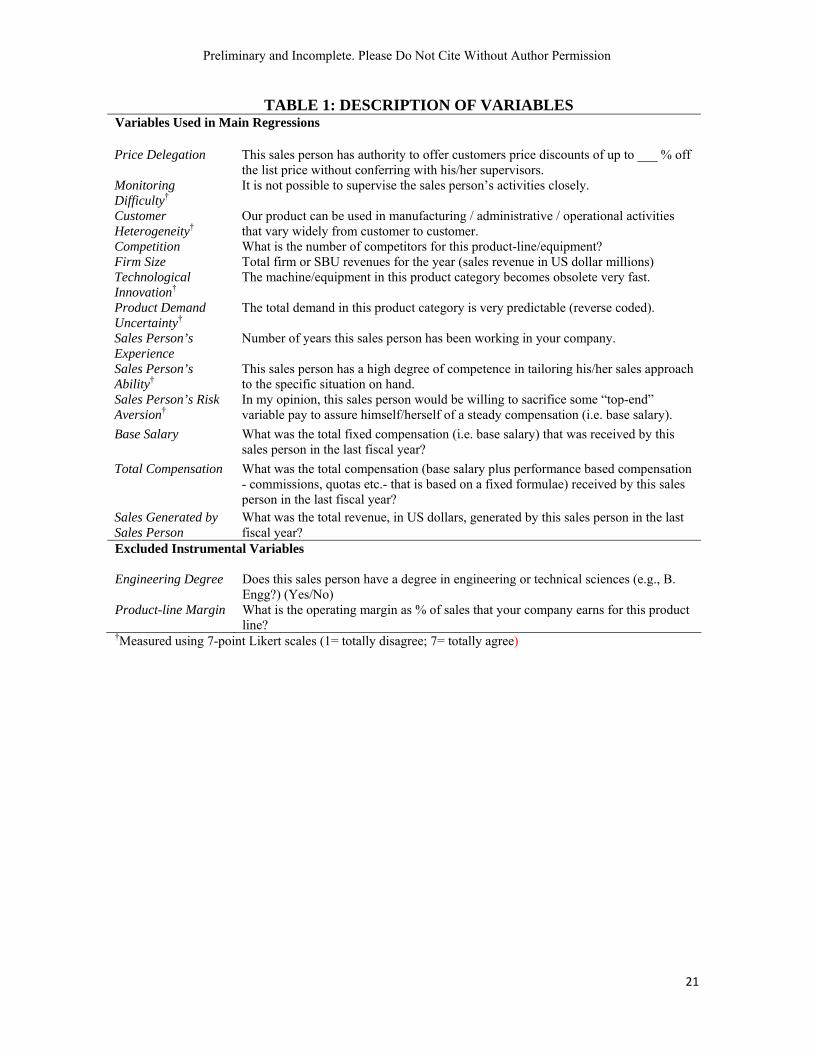
3.3. Variables and Measurement Issues
In this section, we describe the measures we use for our two main variables of interest,
namely pricing authority – our measure of the extent of delegation – and pay for
performance. We also describe the many other task or firm, and agent characteristics– as
perceived by the sales force manager - that we collected. While some of these are cardinal
(e.g. firm size, measured by total sales in the prior fiscal year), many are more difficult to
quantify directly. In those cases, we rely on categorical measures, obtained using 7-point
Likert scales.
Pricing Authority: Each manager was asked to report the percentage of price discounts
off the list price that the sales person is allowed to offer to customers without conferring
with the manager. This is our measure of Price Delegation. We would like to emphasize
the cardinal nature of this measure of delegation, as opposed to the perceptual or
categorical measures that have been used in prior studies (e.g. Nagar 2002; Wulf 2000;
Frenzen et al. 2010).
Compensation: For each sales person, we obtained measures of their base salary, total
compensation, and the sales revenue they generated during the year before our survey.
Base Salary is the dollar amount of fixed compensation received by this sales person in the
previous fiscal year. Total Compensation refers to the sum of the base salary and
performance-based compensation (e.g., bonus and commissions) received in the same
fiscal year. In our data, the proportion of performance-based (i.e. variable) to total
compensation is about 30%, similar to the 29% ratio in the John and Weitz (1989) sample,
but somewhat lower than Zoltner et al. (2006, p.2)’s estimate of around 40% for a typical
sales person in the U.S. We calculate the commission rate as:
Commission Rate = (Total Variable Compensation)/Sales Revenue
where Sales Revenue is the amount of sales generated by the sales person in the same
11
Preliminary and Incomplete. Please Do Not Cite Without Author Permission
fiscal year, also in US dollars. In the presence of non-revenue-based bonus pay, our
measure of Commission Rate will overestimate the power of ex ante incentives at the
margin. However, managers indicated that sales-based commissions rather than bonuses
comprise the majority of their sales force’ incentive pay. Hence, Commission Rate is a
good first-order approximation for actual sales-based performance pay, since bonuses are
comparatively small in our setting. Recent evidence moreover suggests that much bonus
payments are in fact revenue-based (Misra and Nair 2009), in the sense that these are
offered for achieving specific sales-revenue targets.
Task/Firm Characteristics: Respondents were asked to assess how difficult the sales
person’s activities are to supervise (Monitoring Difficulty) and the heterogeneity of
customer profiles faced by the sales person (Customer Heterogeneity). These two
variables measure the degree of asymmetric information between the sales manager and
the sales person and thus affect sales person’s pricing authority. Respondents also told us
how many direct competitors they faced in the relevant product category (Competition).
The intensity of competition should affect the bargaining power of industrial equipment
buyers and thus might enter into the firm’s decision as to how much pricing flexibility the
sales person should be given. Firm Size is measured by the previous year’s overall sales
revenue. Finally, Product Margin measures the operating margin for the relevant product
line and is used as an instrument variable for Commission Rate (see next section).
We asked managers to report two different measures of uncertainty: the pace of
product/equipment obsolescence (Technological Innovation) and the predictability of
product demand at the industry level (Product Demand Uncertainty). As mentioned above,
when industry-wide disturbances are high, we expect coordination among the sales team
and that across various functions such as sales, production, and product development
within the company to become more important so the firm can cope with such uncertainty
(Williamson 1985, pp.56-57). In other words, sales manager’s should retain more pricing
authority.
Agent Characteristics: We asked respondents to rate the ability level (Sales Person’s
Ability) of the sales person and to report the number of years that individual has worked in
the company (Sales Person’ Experience). As pricing authority could be sales-person
specific, sales person’s tenure and ability would affect his/her manager’s delegation
decision. Respondents indicated their sense of the sales person’s risk preference over
compensation volatility (Sales Person’s Risk Aversion) and we use it as a control variable
in some of our regressions. We further asked about the sales person education, specifically
12
Preliminary and Incomplete. Please Do Not Cite Without Author Permission
whether the sales person has an engineering degree, and the dummy variable is used as an
instrumental variable for Commission Rate (see next section).
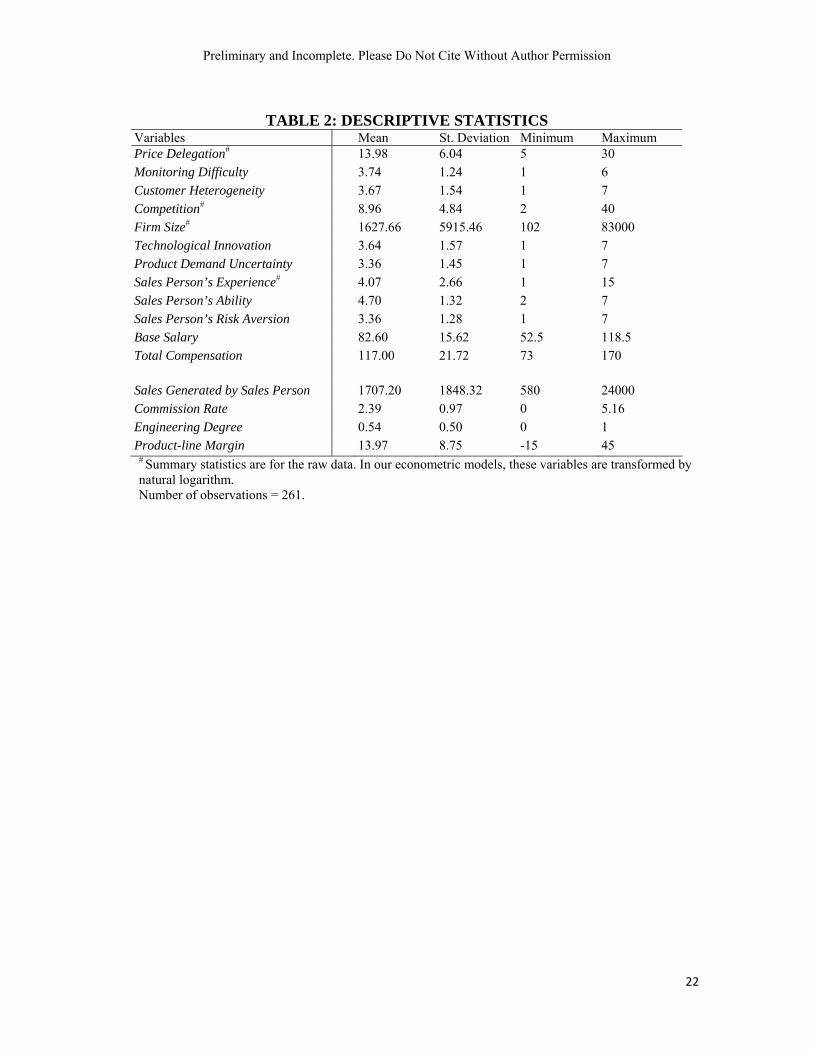
The questions we used to elicit all the above information are listed in Table 1.
Summary statistics for all the resulting variables are shown in Table 2.4 Finally, to give a
better sense of the extent of variation in the level of pricing authority delegation, we show
the distribution of this variable in Figure 1.
4. ECONOMETRIC METHOD AND RESULTS
Our goal in this section is to examine the determinants of the extent of delegation of
pricing authority in industrial sales forces, and assess the relationship between the
delegation decision and the choice of compensation.
4.1. Methodology
As described earlier, the compensation plan for sales persons is usually set at the time
of employment and is the same for all the individuals engaged in the same type of sales
job within the firm. The delegation of pricing authority in industrial sales forces, in
contrast, is more often conferred to sales people by their managers after an individual sales
person has started his/her job, and further modified when appropriate in the course of
one’s career within the firm. These facts imply that the commission rate can be taken as
“pre-determined” in our econometric specifications. Consequently, we begin our empirical
analyses by estimating:
'iLog( ) α β ui iPrice Delegation Commission Rate '
i ix z ,
where i denote for sales person (and implicitly the firm, as we have data relating to one
individual per firm), xi and zi are vectors of task/firm and agent characteristics
respectively. We use the log of price delegation as our dependent variable as this yields
4 We carried out several analyses to rule out response bias in our perceptual measures. First, given our survey procedure, it is possible that informants strategically chose customers and/or sales agents. To test this, we assessed two customer-side measures – the profitability of the customer to the firm and the firm’s satisfaction with this customer relationship, and the two sales person characteristics – ability and experience, for distribution bias. The data exhibited large variation along these measures and it does not seem as though the manager-informants strategically chose to report on their most profitable customers or their most able sales people. Second, informants might have inferred a sales person’s ability based on her total compensation or revenue generated. The pair-wise correlations between Sales Person’s Ability and Total Compensation and Sales Revenue generated by the sales person are 0.10 and -0.02, both insignificant at the 0.05 level.
13
Preliminary and Incomplete. Please Do Not Cite Without Author Permission
well-behaved error terms.5 We introduce most of our explanatory variables linearly as
most of them are indices with limited variation, but use the log of Firm Size, Competition,
and Experience to reduce the effect of outliers. While we believe that commission rate can
be treated as pre-determined in our analyses, one might also expect this variable to be
correlated with ui either because there are variables that the sampled firms use to determine
commission rates that are unobserved to us, and these also affect the decision to delegate
pricing authority, or because Price Delegationi and Commission Ratei are simultaneously
decided by company officials at the commencement, or during the period, of employment,
yet our regression equation does not model this simultaneity.
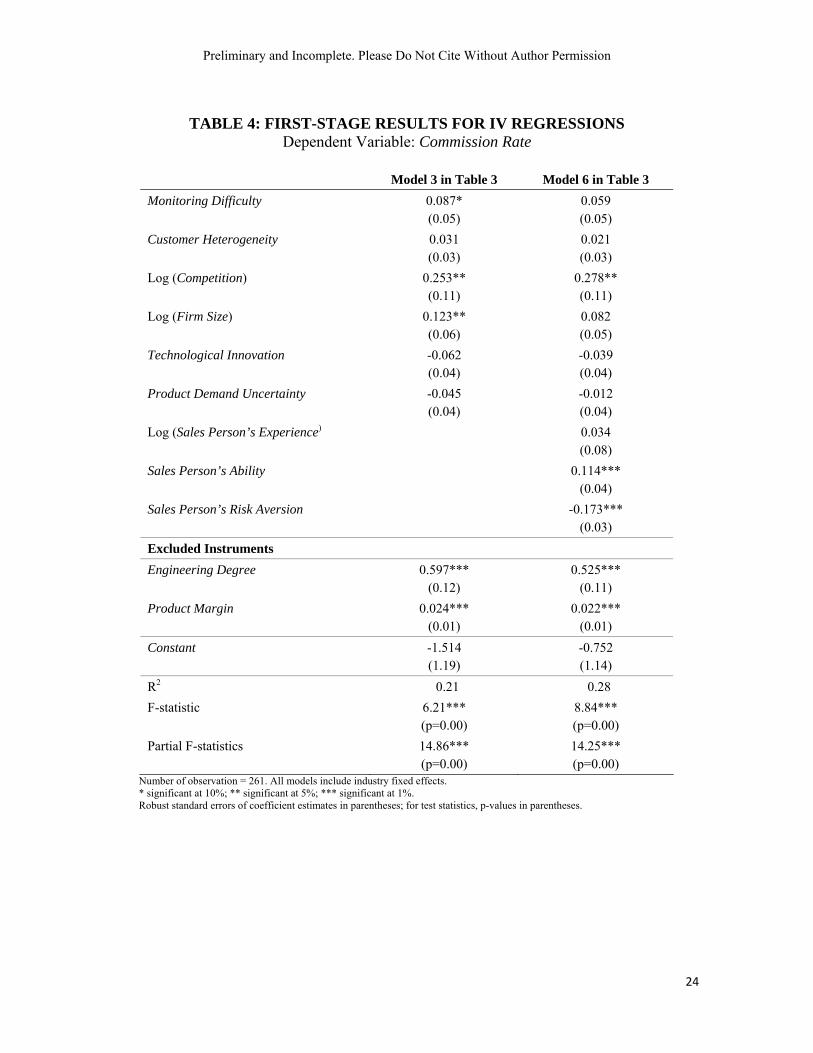
We adopt an instrumental-variable approach to address these potential issues. The two
excluded instruments we use for Commission rate are whether the sales person has an
Engineering Degree and Product-line Margin at the firm level. Commission rate is
expected to be positively correlated with both variables. In industrial-equipment sales,
having an engineering degree can be seen as an indicator that agent effort is especially
valuable, and thus agency theory would imply that the agent should be given higher
powered incentives (higher commission rate). Higher profit margins for a product category
at the firm level makes it possible for firms to set higher commission rate level, ceteris
paribus, and thus could also be a good instrument for the latter. At the same time, there is
no a priori reason to expect that sales agents with engineering degrees should be granted
more pricing authority, or that the firm’s product-line profit margin should be correlated
with the extent of pricing authority granted to an individual sales person. The validity of
our instruments is confirmed by our first-stage partial F statistics, and by the over-
identification tests (Hansen J statistics) (see Tables 3 and 4).
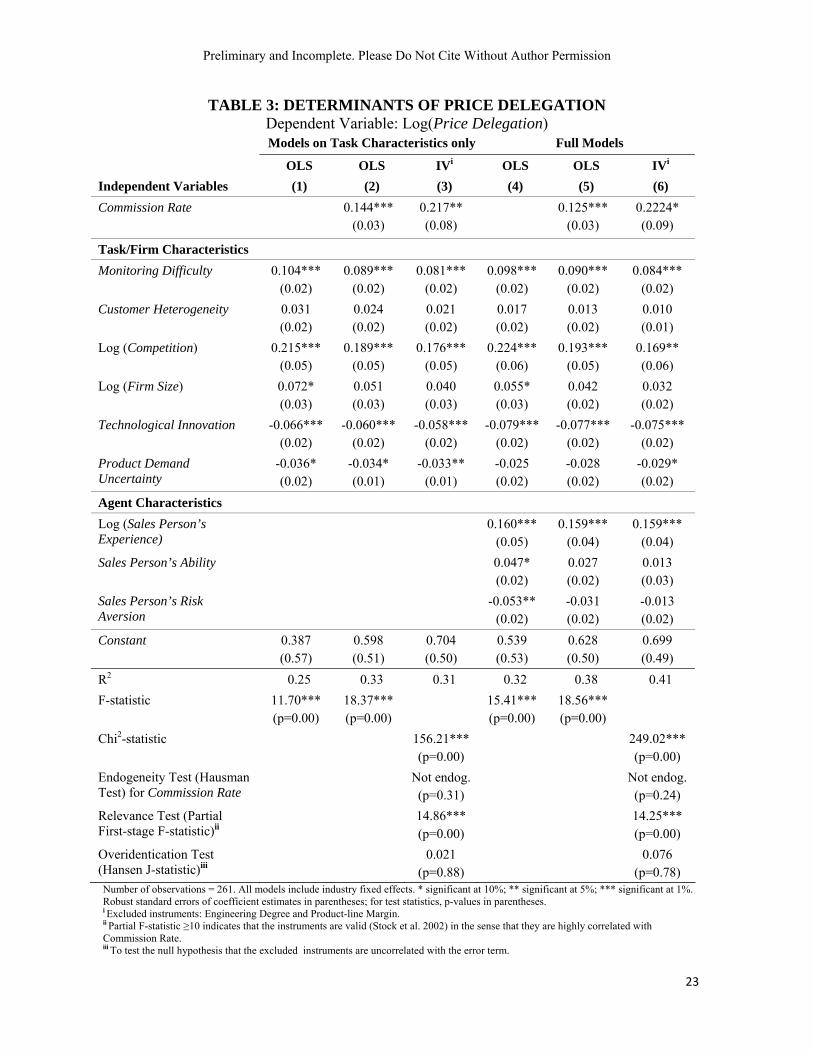
4.2. Results
We begin our empirical analyses by examining the relationship between delegation
and task/firm characteristics only, first without controlling for the power of incentives
under which the sales person operates (Column 1 of Table 3) and then with commission
rate as another factor affecting the level of pricing authority in Columns 2 and 3. In
column 2, we treat the commission rate as pre-determined and simply include it among our
regressors. In column 3, we use the linear optimal-weighted general method of moments
(GMM) (Cameron and Trivedi 2005, p.187; see also Stata 2009, p.741 and pp.747-749)
5 Our results, nonetheless, are robust with the specification using the raw measure of price delegation as dependent variable, or that under log-log formulation.
14
Preliminary and Incomplete. Please Do Not Cite Without Author Permission
with the two variables mentioned above (Product Margin and Engineering Degree) as
excluded instruments. Finally, in the last three columns of Table 3, we reproduce the same
analyses and add agent characteristics to the set of factors that can affect the level of
delegation of pricing authority. We find that our results are quite robust across these
different specifications.
Focusing for now on the effect of task/firm characteristics on price delegation, Column
1 shows that managers delegate more pricing authority to their sales people when the
latter’s activities are more difficult to monitor, involve more heterogeneous customers, and
when they face more competition. Monitoring Difficulty has the largest effect (0.104)
among task/firm characteristics that are measured on 7-point Likert scales. These results
are consistent with the notion that sales persons’ price discretion can be used to adapt to
local customer needs and/or respond to price negotiation in a more expeditious fashion.
The fact that the coefficients for both technological innovation and product demand
uncertainty are significant and negative is consistent with our expectation that when the
uncertainty is exogenous to the sales person’s selling effort, pricing authority is expected
to be more centralized to improve coordinated responses to such uncertainty. The effect of
Technological Innovation (-0.060) is almost twice that of Demand Uncertainty, which
may due to the fact that the firms in our data manufacture and market sophisticated and
high-tech industrial equipment such that innovation affects these markets most. The
control variable Firm Size impacts delegation in a positive way.
We include Commission rate in Columns 2 and 3, treating it first as predetermined in
Column 2, and then addressing the possibility that it might be correlated with the error
term in Column 3.6 However, it is important to note that, based on the typical Hausman
test (Cameron and Trivedi 2005, p.276), we cannot reject the null hypothesis that
Commission Rate is exogenous (p=0.31). As a result, we focus our discussion of results on
Column 2. Nonetheless, our IV results in Column 3 are qualitatively very similar.
When we control for commission rate, we find first and foremost that the effect of
performance pay on price delegation is positive and significant. Because of the semi-log
nature of the regression, the estimate of 0.144 means that a 1 unit (i.e., 1%) increase in
commission rate leads to 14.4% increase in the discounts (which are themselves stated as 6 Using the standard overidentification test, we cannot reject the null that our excluded instruments – Engineering Degree and Product-line Margin – are uncorrelated with the error term in our delegation equation. At the same time, these instruments are highly correlated with Commission rate – as the large partial F-statistics (>10) of the first-stage regressions show (Stoke et al. 2002). Therefore, our instruments satisfy the two key criteria of being valid instrumental variables. Table 4 lists the full results for the first-stage regressions corresponding to models 3 and 6 in Table 3.
15
Preliminary and Incomplete. Please Do Not Cite Without Author Permission
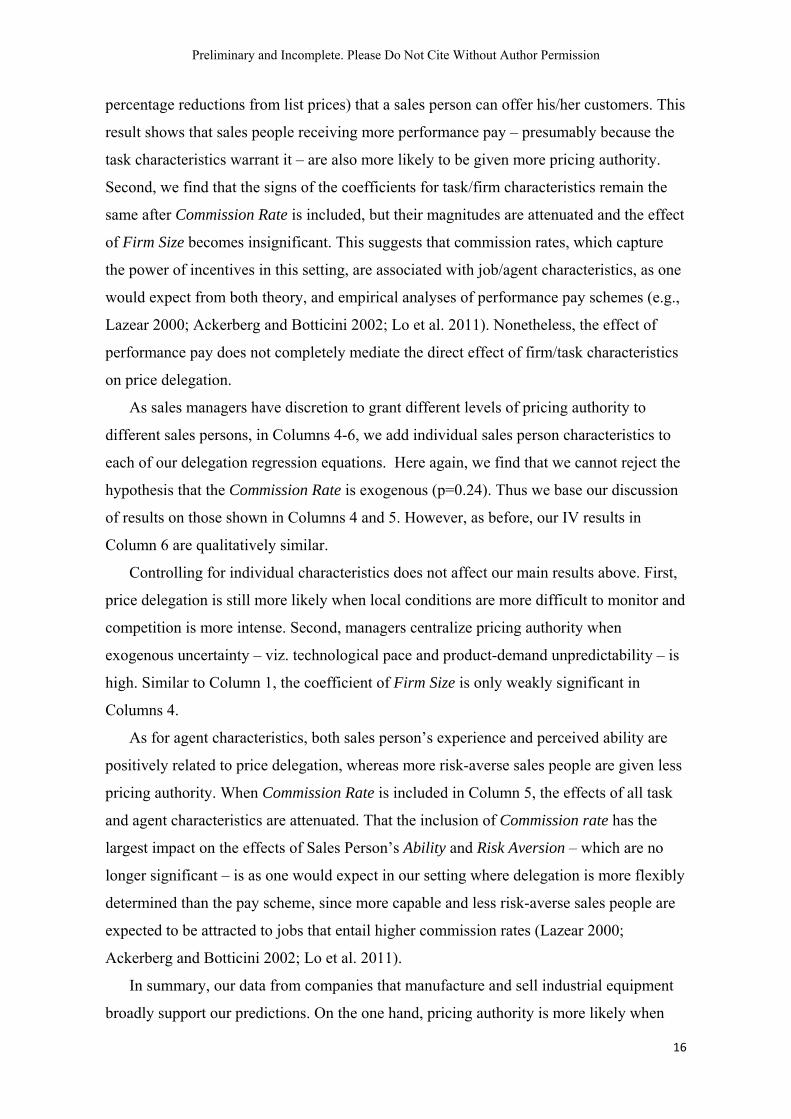
percentage reductions from list prices) that a sales person can offer his/her customers. This
result shows that sales people receiving more performance pay – presumably because the
task characteristics warrant it – are also more likely to be given more pricing authority.
Second, we find that the signs of the coefficients for task/firm characteristics remain the
same after Commission Rate is included, but their magnitudes are attenuated and the effect
of Firm Size becomes insignificant. This suggests that commission rates, which capture
the power of incentives in this setting, are associated with job/agent characteristics, as one
would expect from both theory, and empirical analyses of performance pay schemes (e.g.,
Lazear 2000; Ackerberg and Botticini 2002; Lo et al. 2011). Nonetheless, the effect of
performance pay does not completely mediate the direct effect of firm/task characteristics
on price delegation.
As sales managers have discretion to grant different levels of pricing authority to
different sales persons, in Columns 4-6, we add individual sales person characteristics to
each of our delegation regression equations. Here again, we find that we cannot reject the
hypothesis that the Commission Rate is exogenous (p=0.24). Thus we base our discussion
of results on those shown in Columns 4 and 5. However, as before, our IV results in
Column 6 are qualitatively similar.
Controlling for individual characteristics does not affect our main results above. First,
price delegation is still more likely when local conditions are more difficult to monitor and
competition is more intense. Second, managers centralize pricing authority when
exogenous uncertainty – viz. technological pace and product-demand unpredictability – is
high. Similar to Column 1, the coefficient of Firm Size is only weakly significant in
Columns 4.
As for agent characteristics, both sales person’s experience and perceived ability are
positively related to price delegation, whereas more risk-averse sales people are given less
pricing authority. When Commission Rate is included in Column 5, the effects of all task
and agent characteristics are attenuated. That the inclusion of Commission rate has the
largest impact on the effects of Sales Person’s Ability and Risk Aversion – which are no
longer significant – is as one would expect in our setting where delegation is more flexibly
determined than the pay scheme, since more capable and less risk-averse sales people are
expected to be attracted to jobs that entail higher commission rates (Lazear 2000;
Ackerberg and Botticini 2002; Lo et al. 2011).
In summary, our data from companies that manufacture and sell industrial equipment
broadly support our predictions. On the one hand, pricing authority is more likely when
16
Preliminary and Incomplete. Please Do Not Cite Without Author Permission
sales people have superior local information and face more intense competition, and when
they are more experienced. On the other hand, executives tend to centralize pricing
authority when the need of internal coordination – under higher exogenous uncertainties –
becomes more important. Finally, pay-for-performance is robustly and positively related
to delegation.
5. CONCLUSION
Despite considerable theoretical interest in decision allocation and its relationship with
incentive pay, evidence on these issues remains rare. Using a primary data set on
industrial-equipment sales, this paper bridges this gap by investigating the determinants of
pricing authority offered to field sales people by their business-unit/divisional managers,
and the relationship between sales persons’ performance pay and their pricing authority.
Our context and micro-data are appealing to investigate these issues since price delegation
and pay-for-performance are commonly used, and task and agent characteristics in these
industries vary.
We showed that managers delegate more pricing authority when their sales people
have superior local information and when they have been working for the firm longer. On
the other hand, when market uncertainty – be it on the technological or demand side - is
high, the sales agent receives less pricing authority. Furthermore, we find strong evidence
of a positive relationship between pricing authority and pay-for-performance. This result is
consistent with the idea that sales persons can be given more authority to discount price
when their own compensation is greatly affected by this decision. The inclusion of
commission rate attenuates but does not eliminate the effects of task/firm and sales
person’s characteristics on the level of pricing authority. This implies that both monetary
incentives and non-monetary factors impact the allocation of such authority within sales
organizations.
17
Preliminary and Incomplete. Please Do Not Cite Without Author Permission
References
Acemoglu, Daron, Philippe Aghion, Claire Lelarge, John Van Reenen, and Fabrizio Zilibotti (2007), “Technology, Information, and the Decentralization of the Firm,” Quarterly Journal of Economics, 122(4), 1759-1799.
Ackerberg, Daniel and Maristella Botticini (2002), “Endogenous Matching and the
Empirical Determinants of Contract Form,” Journal of Political Economy, 110(3), 564-591.
Aghion, Philippe and Tirole, Jean (1997), “Formal and Real Authority in Organizations,”
Journal of Political Economy, 105, 1-27. Alonso, Ricardo, Wonter Dessein, and Niko Matouschek (2008), “When Does
Coordination Require Centralization,” American Economic Review, 98(1), 145-179. Arrunãda, Benito, Luis Garicano, and Luis Vázquez (2001), “Contractual Allocation of
Decision Rights and Incentives: The Case of Automobile Distribution,” Journal of Law, Economics, and Organization, 17(1).
Baker, George, Robert Gibbons, and Kevin Murphy (1999), “Informal Authority in
Organizations,” Journal of Law, Economics, and Organization, 15, 56-73. Blair, Roger and Francine Lafontaine (2005), The Economics of Franchising, New York,
NY: Cambridge University Press. Cameron, A. Colin and Pravin K. Trivedi (2005), Microeconometrics: Methods and
Applications, New York, NY: Cambridge University Press. Colombo, Massimo G. and Marco Delmastro (2004), “Delegation of Authority in Business
Organizations: An Empirical Test,” Journal of Industrial Economics, 52(1), 53-80. Crawford, Vincent P. and Joel Sobel (1982), “Strategic Information Transmission,”
Econometrica, 50(6), 1431-1451. Dessein, Wouter (2002), “Authority and Communications in Organizations,” Review of
Economic Studies, 69(4), 811-838. Dwyer, F. Robert and John Tanner, Business Marketing: Connecting Strategy,
Relationships, and Learning. New York, NY: McGraw-Hill/Irwin. Frenzen, Heiko, Ann-Kristin Hansen, Manfred Krafft, Murali K. Mantrala, and Simone
Schmidt (2010), “Delegation of Pricing Authority to the Sales Force: An Agency-Theoretic Perspective of its Determinants and Impact on Performance,” International Journal of Research in Marketing, 27 (1), 58-68.
John, George and Barton Weitz (1989), “Sales force Compensation:: An Empirical
Investigation of Factors Related to Use of Salary Versus Incentive Compensation,” Journal of Marketing Research, 26, 1-14.
18
Preliminary and Incomplete. Please Do Not Cite Without Author Permission
Joseph, Kissan (2001), “On the Optimality of Delegating Pricing Authority to the Sales Force”, Journal of Marketing, 65(Jan.), 62-70.
Lafontaine, Francine and Sugato Bhattacharyya (1995), “The Role of Risk in
Franchising,” Journal of Corporate Finance, 2, 39-74. Lal, Rajiv (1986), “Delegating Pricing Responsibility to the Sales force”, Marketing
Science, 5(2), 159-168. Lazear, Edward P. (2000), “Performance Pay and Productivity,” American Economic
Review, 90(5), 1346-1361. Lerner, Josh, and Robert Merges. (1998) “The Control of Technology Alliances: An
Empirical Analysis of the Biotechnology Industry,” Journal of Industrial Economics, 46: 125-156.
Lo, Desmond, Mrinal Ghosh, and Francine Lafontaine (2011), “The Incentive and Selection
Roles of Sales Force Compensation Contracts,” forthcoming, Journal of Marketing Research.
McElheran, Kristina S. (2010) “Delegation in Multi-Establishment Firms: The
Organizational Structure of I.T. Purchasing Authority,” Working paper # CES 10-35, Center for Economic Studies.
Mishra, Birendra and Harikesh Nair (2009), “The Dynamic Consequences of Incentive
Schemes: Evidence from Sales force Compensation,” mimeo. Nagar, Venky (2002), “Delegation and Incentive Compensation,” The Accounting Review,
77(2), 379-395. Prendergast, Canice (2002), “The Tenuous Trade-Off between Risk and Incentives,”
Journal of Political Economy, 110(5), 1071-1102. Rantakari, Heikki (2008), “Governing Adaptation,” Review of Economic Studies, 75(4),
1257-1285. Ryall, Michael D., and Rachelle C. Sampson (2009) “Formal Contracts in the Presence of
Relational Enforcement Mechanisms: Evidence from Technology Development Projects,” Management Science, 55: 906-925.
Stata (2009), Stata Base Reference Manual, Release 11, Vol 1, College Station, TX: Stata
Press. Stephenson, P. Ronald, William Cron, and Gary Frazier (1979), “Delegating Pricing
Authority to the Sales Force: The Effect on Sales and Profit Performance”, Journal of Marketing, 43(2), 21-28.
Stoke, James H., Jonathan H. Wright, and Motohiro Yogo (2002), “A Survey of Weak
Instruments and Weak Identification in Generalized Method of Moments,” Journal of Business and Economic Statistics, 20(4), 518-529.
19

Preliminary and Incomplete. Please Do Not Cite Without Author Permission
20
Williamson, Oliver (1985), The Economic Institutions of Capitalism, New York, NY: Free
Press. Wulf, Julie (2007), “Authority, Risk, and Performance Incentives: Evidence from Division
Manager Positions Inside Firms,” Journal of Industrial Economics, 55(1), 169-196. Zoltners, Andris A., Prabhakant Sinha, and Sally E. Lorimer (2006), The Complete Guide
to Sales Force Incentive Compensation: How to Design and Implement Plans that Work, New York, NY: AMACOM
Preliminary and Incomplete. Please Do Not Cite Without Author Permission
TABLE 1: DESCRIPTION OF VARIABLES Variables Used in Main Regressions
Price Delegation This sales person has authority to offer customers price discounts of up to ___ % off the list price without conferring with his/her supervisors.
Monitoring Difficulty†
It is not possible to supervise the sales person’s activities closely.
Customer Heterogeneity†
Our product can be used in manufacturing / administrative / operational activities that vary widely from customer to customer.
Competition What is the number of competitors for this product-line/equipment? Firm Size Total firm or SBU revenues for the year (sales revenue in US dollar millions) Technological Innovation†
The machine/equipment in this product category becomes obsolete very fast.
Product Demand Uncertainty†
The total demand in this product category is very predictable (reverse coded).
Sales Person’s Experience
Number of years this sales person has been working in your company.
Sales Person’s Ability†
This sales person has a high degree of competence in tailoring his/her sales approach to the specific situation on hand.
Sales Person’s Risk Aversion†
In my opinion, this sales person would be willing to sacrifice some “top-end” variable pay to assure himself/herself of a steady compensation (i.e. base salary).
Base Salary What was the total fixed compensation (i.e. base salary) that was received by this sales person in the last fiscal year?
Total Compensation What was the total compensation (base salary plus performance based compensation - commissions, quotas etc.- that is based on a fixed formulae) received by this sales person in the last fiscal year?
Sales Generated by Sales Person
What was the total revenue, in US dollars, generated by this sales person in the last fiscal year?
Excluded Instrumental Variables Engineering Degree Does this sales person have a degree in engineering or technical sciences (e.g., B.
Engg?) (Yes/No) Product-line Margin What is the operating margin as % of sales that your company earns for this product
line? †Measured using 7-point Likert scales (1= totally disagree; 7= totally agree)
21
Preliminary and Incomplete. Please Do Not Cite Without Author Permission
TABLE 2: DESCRIPTIVE STATISTICS
Variables Mean St. Deviation Minimum Maximum Price Delegation# 13.98 6.04 5 30 Monitoring Difficulty 3.74 1.24 1 6 Customer Heterogeneity 3.67 1.54 1 7 Competition# 8.96 4.84 2 40 Firm Size# 1627.66 5915.46 102 83000 Technological Innovation 3.64 1.57 1 7 Product Demand Uncertainty 3.36 1.45 1 7 Sales Person’s Experience# 4.07 2.66 1 15 Sales Person’s Ability 4.70 1.32 2 7 Sales Person’s Risk Aversion 3.36 1.28 1 7 Base Salary 82.60 15.62 52.5 118.5 Total Compensation 117.00 21.72 73 170
Sales Generated by Sales Person 1707.20 1848.32 580 24000 Commission Rate 2.39 0.97 0 5.16 Engineering Degree 0.54 0.50 0 1 Product-line Margin 13.97 8.75 -15 45
# Summary statistics are for the raw data. In our econometric models, these variables are transformed by natural logarithm. Number of observations = 261.
22
Preliminary and Incomplete. Please Do Not Cite Without Author Permission
TABLE 3: DETERMINANTS OF PRICE DELEGATION Dependent Variable: Log(Price Delegation)
Models on Task Characteristics only Full Models
OLS OLS IVi OLS OLS IVi
Independent Variables (1) (2) (3) (4) (5) (6)
Commission Rate
0.144*** (0.03)
0.217** (0.08)
0.125*** (0.03)
0.2224* (0.09)
Task/Firm Characteristics
Monitoring Difficulty 0.104*** (0.02)
0.089*** (0.02)
0.081*** (0.02)
0.098*** (0.02)
0.090*** (0.02)
0.084*** (0.02)
Customer Heterogeneity 0.031 (0.02)
0.024 (0.02)
0.021 (0.02)
0.017 (0.02)
0.013 (0.02)
0.010 (0.01)
Log (Competition) 0.215*** (0.05)
0.189*** (0.05)
0.176*** (0.05)
0.224*** (0.06)
0.193*** (0.05)
0.169** (0.06)
Log (Firm Size) 0.072* (0.03)
0.051 (0.03)
0.040 (0.03)
0.055* (0.03)
0.042 (0.02)
0.032 (0.02)
Technological Innovation -0.066*** (0.02)
-0.060*** (0.02)
-0.058*** (0.02)
-0.079*** (0.02)
-0.077*** (0.02)
-0.075*** (0.02)
Product Demand Uncertainty
-0.036* (0.02)
-0.034* (0.01)
-0.033** (0.01)
-0.025 (0.02)
-0.028 (0.02)
-0.029* (0.02)
Agent Characteristics
Log (Sales Person’s Experience)
0.160*** (0.05)
0.159*** (0.04)
0.159*** (0.04)
Sales Person’s Ability
0.047* (0.02)
0.027 (0.02)
0.013 (0.03)
Sales Person’s Risk Aversion
-0.053** (0.02)
-0.031 (0.02)
-0.013 (0.02)
Constant 0.387 (0.57)
0.598 (0.51)
0.704 (0.50)
0.539 (0.53)
0.628 (0.50)
0.699 (0.49)
R2 0.25 0.33 0.31 0.32 0.38 0.41
F-statistic 11.70*** (p=0.00)
18.37*** (p=0.00)
15.41*** (p=0.00)
18.56*** (p=0.00)
Chi2-statistic 156.21*** (p=0.00)
249.02*** (p=0.00)
Endogeneity Test (Hausman Test) for Commission Rate
Not endog. (p=0.31)
Not endog. (p=0.24)
Relevance Test (Partial First-stage F-statistic)ii
14.86*** (p=0.00)
14.25*** (p=0.00)
Overidentication Test (Hansen J-statistic)iii
0.021 (p=0.88)
0.076 (p=0.78)
Number of observations = 261. All models include industry fixed effects. * significant at 10%; ** significant at 5%; *** significant at 1%. Robust standard errors of coefficient estimates in parentheses; for test statistics, p-values in parentheses. i Excluded instruments: Engineering Degree and Product-line Margin. ii Partial F-statistic ≥10 indicates that the instruments are valid (Stock et al. 2002) in the sense that they are highly correlated with Commission Rate. iii To test the null hypothesis that the excluded instruments are uncorrelated with the error term.
23
Preliminary and Incomplete. Please Do Not Cite Without Author Permission
TABLE 4: FIRST-STAGE RESULTS FOR IV REGRESSIONS
Dependent Variable: Commission Rate
Model 3 in Table 3 Model 6 in Table 3
Monitoring Difficulty 0.087* (0.05)
0.059 (0.05)
Customer Heterogeneity 0.031 (0.03)
0.021 (0.03)
Log (Competition) 0.253** (0.11)
0.278** (0.11)
Log (Firm Size) 0.123** (0.06)
0.082 (0.05)
Technological Innovation -0.062 (0.04)
-0.039 (0.04)
Product Demand Uncertainty -0.045 (0.04)
-0.012 (0.04)
Log (Sales Person’s Experience) 0.034 (0.08)
Sales Person’s Ability
0.114*** (0.04)
Sales Person’s Risk Aversion -0.173*** (0.03)
Excluded Instruments
Engineering Degree 0.597*** (0.12)
0.525*** (0.11)
Product Margin 0.024*** (0.01)
0.022*** (0.01)
Constant -1.514 (1.19)
-0.752 (1.14)
R2 0.21 0.28
F-statistic 6.21*** (p=0.00)
8.84*** (p=0.00)
Partial F-statistics 14.86*** (p=0.00)
14.25*** (p=0.00)
Number of observation = 261. All models include industry fixed effects. * significant at 10%; ** significant at 5%; *** significant at 1%. Robust standard errors of coefficient estimates in parentheses; for test statistics, p-values in parentheses.
24
Preliminary and Incomplete. Please Do Not Cite Without Author Permission
25
FIGURE 1: THE EXTENT OF PRICING DELEGATION
0.0
5.1
.15
.2D
ensi
ty
5 10 15 20 25 30Percentage of Price Discount from List Price