Embed Size (px)
Citation preview

Delft University of Technology
Simulating co-diffusion of innovationsFeedback technology & behavioral changeJensen, Thorben
DOI10.4233/uuid:29a2b04a-a38f-4919-bf58-50d40b4ebaedPublication date2017Document VersionFinal published versionCitation (APA)Jensen, T. (2017). Simulating co-diffusion of innovations: Feedback technology & behavioral change.https://doi.org/10.4233/uuid:29a2b04a-a38f-4919-bf58-50d40b4ebaed
Important noteTo cite this publication, please use the final published version (if applicable).Please check the document version above.
CopyrightOther than for strictly personal use, it is not permitted to download, forward or distribute the text or part of it, without the consentof the author(s) and/or copyright holder(s), unless the work is under an open content license such as Creative Commons.
Takedown policyPlease contact us and provide details if you believe this document breaches copyrights.We will remove access to the work immediately and investigate your claim.
This work is downloaded from Delft University of Technology.For technical reasons the number of authors shown on this cover page is limited to a maximum of 10.

SIMULATING CO-DIFFUSION OF INNOVATIONS:FEEDBACK TECHNOLOGY & BEHAVIORAL CHANGE
Proefschrift
ter verkrijging van de graad van doctoraan de Technische Universiteit Delft,
op gezag van de Rector Magnificus prof. ir. K.Ch.A.M. Luyben,voorzitter van het College voor Promoties,
in het openbaar te verdedigen op donderdag 23 maart 2017 om 15:00 uur
door
Thorben JENSEN
Master of Science in Environmental Systems and Resource Management,Universiteit Osnabrück, Duitsland,
geboren te Langenhagen, Duitsland.

This dissertation has been approved by the
promotor: Prof. dr. ir. P. M. Herdercopromotor: Dr. ir. É. J. L. Chappin
Composition of the doctoral committee:
Rector Magnificus chairmanProf. dr. ir. P. M. Herder Faculty of Technology, Policy & Management, TU DelftDr. ir. É. J. L. Chappin Faculty of Technology, Policy & Management, TU Delft
Independent members:Prof. dr. C. P. van Beers Faculty of Technology, Policy & Management, TU DelftProf. dr. B. Edmonds Manchester Metropolitan UniversityProf. dr. V. Grimm Helmholtz Centre for Environmental Research - UFZProf. dr. C. Pahl-Wostl University of OsnabrückProf. dr. J. P. L. Schoormans Faculty of Industrial Design Engineering, TU Delft
Keywords innovation diffusion, feedback devices, behavioralchange, energy efficiency, agent-based modeling,automated model generation
This research was funded by the German Federal Ministry of Education and Research(BMBF), and indirectly by the German Research Foundation (DFG) and the foundationsRobert Bosch and Mercator.
Copyright © 2017 Thorben JensenFront & Back Cover art by Jorinde Voigt,
‘Konstellation Algorithmus Adlerflug 100, Adler,Strom, Himmelsrichtung, Windrichtung, Windstärke,’© Bild-Kunst, Bonn 2017
ISBN 978-94-6186-785-8Printed by Gildeprint Drukkerijen, EnschedeDownload this dissertation http://repository.tudelft.nl/

There is nothing noble in being superior to your fellow man;true nobility is being superior to your former self.
Ernest Hemingway


ACKNOWLEDGEMENTS
I would like to share the intriguing feeling that my colleagues, friends, and family mighthave contributed more to this thesis than I did. For some reason, an academic title isoften attributed to one individual. Paradoxically, this individual’s success is a collectiveachievement. This is why I would like to express my gratitude to all those who supportedthis work.
Finishing this thesis might not even have been possible without my great supervisors.The most important support came from Émile Chappin. Without any exaggeration,I regard him to be the best daily supervisor a PhD Candidate could wish to have.Likewise, I believe that Paulien Herder has been a great promotor. Her combination ofdedicatedness with just the right dose of pragmatism created a very enjoyable workingatmosphere.
Having had the opportunity to be a PhD Candidate at TU Delft has for me been likethe icing on the cake.1 I continue to be impressed by the unique atmosphere at our TPMfaculty. Given my obligations outside the Netherlands, I was happy for every opportunityto spend time in Delft. For the good excuses to do so, I would particularly like to thankFifje.
What I perhaps enjoyed the most about TU Delft was its virtually countless numberof great minds. I particularly enjoy having been inspired by Chris Davis, AminehGhorbani, and Igor Nikolic. And of course, being a PhD Candidate would not have mademuch sense without my fellow PhDs, either. I will miss this global and openmindedcommunity. Among them, of greatest significance to me have been my office matesJochem ‘JD’ Douw, Ying ‘Bóshì’ Li, and Ben ‘Ben Ben’ Zhu. My joyful memories startat the PhD Startup workshop, followed by the PhD Days in The Hague and Noordwijk,and tend to end at Locus Publicus or Kobus Kuch.
I would like to thank my colleagues from the Wuppertal Institute for the freedomI had at taking out my project. It was great having been trusted with self-responsibleproject management within a large and diverse project team. Among it, I owe a lot tomy direct team mates. Georg Holtz is one of the key persons without whom it wouldhave been difficult to properly think through my simulations. Peter Viebahn has beena helpful and trustworthy ally in our joint struggle with bureaucracy. Jonas Friege hasbeen a source of great motivation and simply the best person to share an office with.
I am grateful for my seemingly inexhaustible traveling budget and the countlessinspiring modelers this allowed me to meet. Staying in touch with my former colleaguesfrom the Helmholtz Centre for Environmental Research helped me a lot. I also enjoyedthe discussions at George Washington University and meeting the modelers fromTsinghua University. Each year of my project, I also had the opportunity to take home
1This is not a lie.
v

vi
plenty of feedback from one of the ‘ESSA @ work’ workshops. I appreciate the valuablediscussions with the hosts Klaus Troitzsch and Iris Lorscheid.
Finally, all this would not have happened without the persons who encouraged meto first get into science and then to endure it. I would like to thank my parents forhaving fueled my interest in science and computers. My mother, who provided countlessopportunities for me to play with science kits, in the neurology and genetics labs, andwith Visual Basic in the university basement. My father, who gave me my first 56kmodem after I asked if I could have an acoustic coupler. My mother showed me thevalue of being persistent with deliberate choices. My father taught me that these choicesallow me to become the person that I want to be. From Inka, I got the unconditionalsupport for any new direction that I wanted to give to my travels and to my life. Thankyou for having joined me on this journey. You convinced me of what that African proverbsays: if you want to go far, go together.

CONTENTS
Summary 1
Samenvatting 5
1 Introduction 9
1.1 Motivation . . . . . . . . . . . . . . . . . . . . . . . . . . . . . . . . . 91.2 Research questions . . . . . . . . . . . . . . . . . . . . . . . . . . . . . 141.3 Research approach . . . . . . . . . . . . . . . . . . . . . . . . . . . . . 14
1.3.1 Mechanisms of impact from feedback devices . . . . . . . . . . . . 151.3.2 Empirically-grounded simulation of impact . . . . . . . . . . . . . 151.3.3 Assessment of policy interventions . . . . . . . . . . . . . . . . . 161.3.4 Automating agent-based modeling of innovation diffusion . . . . . 16
1.4 Outline . . . . . . . . . . . . . . . . . . . . . . . . . . . . . . . . . . . 17
2 Co-Diffusion framework 19
2.1 Introduction . . . . . . . . . . . . . . . . . . . . . . . . . . . . . . . . 192.2 Behavior-changing feedback technology . . . . . . . . . . . . . . . . . . 212.3 Conceptual framework for technology assessment . . . . . . . . . . . . . 232.4 Model development. . . . . . . . . . . . . . . . . . . . . . . . . . . . . 24
2.4.1 Agent-based modeling . . . . . . . . . . . . . . . . . . . . . . . . 242.4.2 Existing technology and behavior diffusion models . . . . . . . . . 252.4.3 Integrating two existing models into a combined model . . . . . . . 26
2.5 Simulation experiments. . . . . . . . . . . . . . . . . . . . . . . . . . . 292.5.1 Reference scenario of technology diffusion . . . . . . . . . . . . . 302.5.2 Adding feedback effect and behavior diffusion. . . . . . . . . . . . 322.5.3 Variation in feedback effect and behavior diffusion . . . . . . . . . 34
2.6 Discussion and conclusions. . . . . . . . . . . . . . . . . . . . . . . . . 362.6.1 Implications and recommendations . . . . . . . . . . . . . . . . . 372.6.2 Limitations and future research . . . . . . . . . . . . . . . . . . . 382.6.3 Conclusion. . . . . . . . . . . . . . . . . . . . . . . . . . . . . . 39
3 Energy-efficiency impacts of an air-quality feedback device 41
3.1 Introduction . . . . . . . . . . . . . . . . . . . . . . . . . . . . . . . . 413.2 Background . . . . . . . . . . . . . . . . . . . . . . . . . . . . . . . . . 43
3.2.1 Feedback effect of device to its users . . . . . . . . . . . . . . . . . 433.2.2 Overall effect of feedback device . . . . . . . . . . . . . . . . . . . 44
3.3 Methodology . . . . . . . . . . . . . . . . . . . . . . . . . . . . . . . . 453.3.1 Agent-based modeling . . . . . . . . . . . . . . . . . . . . . . . . 453.3.2 Model description . . . . . . . . . . . . . . . . . . . . . . . . . . 46
vii

viii CONTENTS
3.4 Results and discussion . . . . . . . . . . . . . . . . . . . . . . . . . . . 523.4.1 Experiment 1: Behavior diffusion . . . . . . . . . . . . . . . . . . 533.4.2 Experiment 2: ‘CO2 meter’ diffusion . . . . . . . . . . . . . . . . . 533.4.3 Experiment 3: Co-diffusion of technology and behavior . . . . . . . 543.4.4 Experiment 4: Quantifying sub-processes . . . . . . . . . . . . . . 563.4.5 Validity and limitations . . . . . . . . . . . . . . . . . . . . . . . 59
3.5 Conclusion . . . . . . . . . . . . . . . . . . . . . . . . . . . . . . . . . 61
4 Simulating marketing strategies for feedback devices 63
4.1 Introduction . . . . . . . . . . . . . . . . . . . . . . . . . . . . . . . . 634.2 The CO2 meter case study. . . . . . . . . . . . . . . . . . . . . . . . . . 654.3 Methods . . . . . . . . . . . . . . . . . . . . . . . . . . . . . . . . . . 65
4.3.1 Analysis: marketing options . . . . . . . . . . . . . . . . . . . . . 654.3.2 Synthesis: proposed marketing strategies . . . . . . . . . . . . . . 674.3.3 Simulating heating behavior and feedback devices . . . . . . . . . 684.3.4 Implementation of marketing strategies . . . . . . . . . . . . . . . 70
4.4 Results and discussion . . . . . . . . . . . . . . . . . . . . . . . . . . . 724.4.1 Experiment 1: Reference scenario of behavior diffusion . . . . . . . 724.4.2 Experiment 2: Simulating marketing strategies . . . . . . . . . . . 734.4.3 Experiment 3: Generalizability according to neighborhood . . . . . 804.4.4 Experiment 4: Generalizability from the case city . . . . . . . . . . 814.4.5 Validation and limitations . . . . . . . . . . . . . . . . . . . . . . 84
4.5 Conclusion . . . . . . . . . . . . . . . . . . . . . . . . . . . . . . . . . 854.6 Future research . . . . . . . . . . . . . . . . . . . . . . . . . . . . . . . 89
5 Automating model development and application 91
5.1 Introduction . . . . . . . . . . . . . . . . . . . . . . . . . . . . . . . . 915.2 Agent-based modeling of innovation diffusion . . . . . . . . . . . . . . . 925.3 Methods . . . . . . . . . . . . . . . . . . . . . . . . . . . . . . . . . . 94
5.3.1 Automation procedure concept . . . . . . . . . . . . . . . . . . . 945.3.2 Application case: diffusion of water-saving appliances. . . . . . . . 97
5.4 Results and discussion . . . . . . . . . . . . . . . . . . . . . . . . . . . 995.4.1 Experiment 1: Inverse modeling . . . . . . . . . . . . . . . . . . . 1005.4.2 Experiment 2: Policy simulation . . . . . . . . . . . . . . . . . . . 1015.4.3 Limitations. . . . . . . . . . . . . . . . . . . . . . . . . . . . . . 102
5.5 Conclusion . . . . . . . . . . . . . . . . . . . . . . . . . . . . . . . . . 1035.5.1 Future research . . . . . . . . . . . . . . . . . . . . . . . . . . . 105
6 Conclusions and recommendations 107
6.1 Conclusion . . . . . . . . . . . . . . . . . . . . . . . . . . . . . . . . . 1076.1.1 Conclusion 1: Mechanisms of impact of feedback devices . . . . . . 1086.1.2 Conclusion 2: Projected impact of a feedback device . . . . . . . . 1096.1.3 Conclusion 3: Policy recommendations . . . . . . . . . . . . . . . 1106.1.4 Conclusion 4: Automating innovation diffusion modeling . . . . . . 1116.1.5 Overall conclusion . . . . . . . . . . . . . . . . . . . . . . . . . . 112

CONTENTS ix
6.2 Limitations and future research . . . . . . . . . . . . . . . . . . . . . . . 1136.2.1 Model uncertainty . . . . . . . . . . . . . . . . . . . . . . . . . . 1136.2.2 Limitations of model application . . . . . . . . . . . . . . . . . . 1156.2.3 Limitations of the automation approach . . . . . . . . . . . . . . . 116
6.3 Reflection . . . . . . . . . . . . . . . . . . . . . . . . . . . . . . . . . . 1186.3.1 Complexity of agent-based innovation-diffusion models . . . . . . 1186.3.2 Future models in forecasting. . . . . . . . . . . . . . . . . . . . . 1186.3.3 Democratizing predictive modeling . . . . . . . . . . . . . . . . . 119
A Model description 121
B Input data 127
C Google Trends 129
D Survey evaluation 131
Bibliography 133
Curriculum Vitæ 147
List of publications 149


SUMMARY
This thesis explores how behavior-changing feedback devices can reduce energydemand of heating residential buildings.
Greenhouse gas emissions of residential buildings need to be reduced as soonas possible, which can be achieved by changing heating behavior. Because heatingresidential building consumes a large share of energy in the EU, their energy-efficiencyneeds to be increased. Due to the long service time of buildings, the pressingreduction of emissions also needs to include existing buildings. Large-scale adoptionof conservation behavior is a promising approach towards this aim. Behavior changecould save about 20% percent of domestically consumed energy. Additionally, change inbehavior is widely applicable in the built environment, resource- and cost-efficient, andof low capital intensity.
Behavior-changing feedback devices are a useful approach to changeenergy-consumption behavior. They monitor and present (e.g. on in-home displays)how residents are consuming energy. Such feedback showed to nudge householders tosave an average of 7%–15% of energy.
The future impact of these devices on a societal scale is of great interest. Commonly,feedback devices are assessed by observing their impact within individual households.Whereas this direct impact is important, the overall impact of devices at wider adoptionis highly relevant, too. It is worthwhile to know how quickly different social groupswould adopt feedback devices, and how this could support societal trends towardsconservation behavior. Because this impact has not been realized yet, this thesis assessesthis potential looking forward.
This thesis assumes a perspective of innovation diffusion. Due to their novelty,behavior-changing feedback devices can be framed as innovations. It is of interest toanalyze the spreading of these devices from their first adopters to a potential larger userbase. In addition to this technology diffusion, the conservation behavior incentivized byfeedback devices can also diffuse. According to Social Learning Theory, social contactsoften imitate each others’ behavior, which makes behavior spread. This behaviordiffusion has repeatedly been observed empirically. For the case of behavior-changingfeedback devices, these two diffusions of technology and behavior are interlinked viathe behavior change that feedback devices exceed on their users. As feedback devicesdiffuse, behavior change of their users may thus positively affect the diffusion ofconservation behavior.
Agent-based modeling is suited for simulating this co-diffusion of technology andbehavior. Simulation can directly incorporate existing knowledge of the impact offeedback devices in field tests. This knowledge on this impact can then be scaled up bysimulation. Doing so can further make use of theoretical knowledge on the mechanismsof the diffusions of household devices and conservation behavior. However, thefuture diffusion of feedback devices is not a given, but subject to inherent uncertainty.
1

2 SUMMARY
Therefore, simulation shows the consequences of what happens if a feedback device willdiffuse successfully. The potential impact of this technology can thus be analyzed in‘what-if’ scenarios. Agent-based modeling is particularly useful for all these tasks. It hasthe combined advantages of an actor-based perspective, its capability to infer emergentsystem behavior from these micro-level definitions, and disaggregated modeling ofconsumer decisions.
Unfortunately, this disaggregation also makes agent-based modeling somewhatcumbersome, which is what that thesis aims to improve. Despite its usefulness,agent-based modeling is presently relatively demanding in labor and programmingskills. To reduce these costs, this thesis applies agent-based modeling with the aim toalso make it quicker and more accessible. This is done by automation, which makesmodeling more systematic than what is common practice for innovation diffusionmodels.
Motivated by this, this thesis addresses the following central research question:
How can the impact of behavior-changing feedback devices on energy-consumptionbehavior be systematically simulated?
First, a framework of co-diffusion of technology and behavior was developed andimplemented in an abstract agent-based model. This served to explore via whichmechanisms feedback devices create an impact in a large-scale social system. Torealize the applied model, two previously published models on behavior diffusion andtechnology diffusion were linked by the effect of an abstract feedback device. Thisassumed the diffusion of a feedback device that nudges its adopters to lower theirheating temperature. Additionally, this created conservation behavior then diffuses viabehavior diffusion.
Simulation revealed two mechanisms via which behavior-changing feedbackdevices create an impact. First, behavior diffusion distributed the behavior changeincentivized by feedback devices from adopters to non-adopters of devices. Second, thissimilarity increased the speed of overall behavior change. Due to these mechanisms,feedback effect and behavior diffusion interacted positively. The indicated relevance ofthe combined co-diffusion of technology and behavior confirmed the value of the usedframework.
Next, analysis was made empirical. This made use of rich empirical data in the casecity Bottrop (Germany) and of a case technology that nudges its users to ventilatetheir homes energy efficiently. The feedback effect component of the co-diffusionframework was modeled based on data from field tests of this feedback device. Likewise,also modeling the diffusion of energy-efficient ventilation behavior was calibrated withempirical data.
This empirically-grounded model allowed measuring the relative importance ofthe simulated processes. Results suggested that up to 46% of the overall impact fromthe case technology was caused by behavior diffusion. This confirmed the previouslyindicated relevance of including behavior diffusion in assessing the impact of feedback

SUMMARY 3
devices.
Based on the previously developed empirically-based model, impacts of policies wereanalyzed. This includes measures of supporting device adoption that the literaturesuggested to be successful. Selected policies included raising awareness, giving awayfree devices, and lending them out. Each of these marketing strategies was simulated atthe same strength (i.e. number of used devices) and scale (i.e. same spatial area and timehorizon). These policies were tested by simulating scenarios of their implementation.Their impact was then compared regarding effectiveness and cost-efficiency.
Results showed that lending out devices was particularly effective, whereas creatingsole awareness of them was most cost-efficient. Overall, the impact of feedback deviceswas sensitive to policy choices. This highlighted the need to select the right diffusionstrategy when aiming to maximize the impact of feedback devices.
Finally, the methods that were developed during this thesis were standardized andunified in an automation approach. This led to a software prototype that standardizesthese methods via automation. This increased automation in the generation ofagent-based innovation diffusion models and the assessment of policies. Candidatesof innovation diffusion models were thereby varied in structure and parameters to testtheir plausibility for a given real-world case.
Based on (potentially multiple) plausible models, diffusion policies were assessedfor their potential to support device diffusion. Thus, standardizing the modelingprocess sped it up and made the use of empirical data more systematic. Further, thisapproach was capable of improving existing models, as well as generating models thatwere validated by design. Combined, this showed the developed automation approachsuccessfully contributes to the method of innovation diffusion modeling.
It can be concluded that impact of feedback devices can successfully be assessed bysystematically simulating the co-diffusion of these devices and the behavioral changethey create. This relied on four pillars. First, assessment of impact based on developingand simulating the framework of co-diffusion of technology and behavior. Thisgeneralized the understanding of the potential impact of feedback devices. Second,the initially abstract analysis was refined by empirical data. Third, this developedempirical-based model allowed to assess the potential for policies to influence theimpact of feedback devices. Fourth, automation made assessment of this impact moreperformant and accessible. Overall, this systematization improves the way agent-basedmodels of innovation diffusion are developed and applied.

SAMENVATTING
Dit proefschrift beschrijft hoe apparaten die feedback geven om gedrag te veranderen deenergievraag ter verwarming van huizen kunnen verlagen.
Broeikasgasemissies van woonhuizen moeten zo snel mogelijk worden gereduceerd.Deze reductie kan worden bereikt door het gedrag omtrent het verwarmen teveranderen. Omdat het verwarmen van woonhuizen een groot aandeel heeft in hetenergieverbruik in de EU moet de energie-efficiëntie worden verhoogd. Vanwege delange levensduur van gebouwen vereist de urgente behoefte aan emissiereductie ook hetbeschouwen van bestaande gebouwen. Het op grote schaal adopteren van besparendgedrag is een kansrijke aanpak om dit doel te bereiken. Gedragsverandering kanongeveer 20% van de door huishoudens geconsumeerde energie besparen. Daarnaastis gedragsverandering breed toepasbaar in de gebouwde omgeving, is het grondstoffen-en kostenefficiënt en het brengt weinig kapitaalkosten met zich mee.
Het gebruik van apparaten die feedback geven om gedrag te veranderen vormteen bruikbare aanpak voor het veranderen van gedrag rondom energieconsumptie.Ze monitoren en brengen de mate van energieconsumptie in beeld (bijvoorbeeld opschermen in huizen). Het is bekend dat feedback op die manier bewoners aanzet totenergiebesparing van 7%–15%.
De toekomstige impact op maatschappelijke schaal is interessant. Het is gebruikelijkom apparaten die feedback geven om gedrag te veranderen te beoordelen door naarhet effect te kijken op individuele huishoudens. Ondanks dat deze directe impactbelangrijk is, moet voor het bepalen van de totale impact ook worden gekeken naarde impact van deze apparaten bij verdergaande adoptie. Het is nuttig om te wetenhoe snel verschillende sociale groepen deze apparaten willen adopteren en hoe dit demaatschappelijke trends in grootschalige energiebesparing kan ondersteunen. In ditproefschrift wordt dat potentieel verkend, omdat deze impact tot op heden nog niet isgerealiseerd.
Dit proefschrift gaat uit van een innovatie-diffusieperspectief. Omdat apparatendie feedback geven om gedrag te veranderen nieuw zijn, worden ze gezien als eeninnovatie. Het is interessant om de verspreiding van deze apparaten te analyseren,van de eerste adopters naar een mogelijk grotere gebruikersgroep. Naast de diffusievan de technologie, kan ook het besparende gedrag, dat wordt gestimuleerd alsgevolg hiervan, verspreiden. Volgens de sociale leertheorie komt het regelmatigvoor dat sociale contacten elkaars gedrag imiteren. Dit maakt het mogelijk datbepaald gedrag zelf verspreidt. Deze zogenaamde diffusie van gedrag is herhaaldelijkempirisch geobserveerd. Voor apparaten die feedback geven om gedrag te veranderenworden de diffusieprocessen van technologie en gedrag gekoppeld door middel van degedragsverandering die de apparaten aanmoedigen. Daarnaast kan, bij de verspreidingvan apparaten die feedback geven om gedrag te veranderen, de gedragsverandering vanhun gebruikers een positief effect hebben op de diffusie van energiebesparend gedrag.
5

6 SAMENVATTING
Agentgebaseerd modelleren is geschikt voor de simulatie van deze processen:de co-diffusie van technologie en gedrag. Simulatie kan daarbij bestaande kennisuit praktijktests integreren met die over impact van apparaten die feedback gevenom gedrag te veranderen. Deze kennis over hun impact kan in simulaties wordenopgeschaald. Tevens kan gebruik gemaakt worden van de theoretische kennis overde mechanismes die een rol spelen bij de diffusie van huishoudelijke apparaten engedrag rondom besparing. Desalniettemin spelen inherente onzekerheden een rolin de toekomstige diffusie van deze apparaten. Dat betekent dat simulatie in staatis om de gevolgen te laten zien van apparaten die feedback geven om gedrag teveranderen onder de aanname van een succesvolle diffusie. De potentiele impact vandeze technologie wordt dan bestudeerd onder ‘wat als’ scenario’s. Agentgebaseerdmodelleren is bij uitstek geschikt voor deze taken, omdat het de voordelen van eenactorperspectief combineert met het vermogen systeemgedrag af te leiden uit hetmodelleren van individuele consumentenbeslissingen die worden gedefinieerd opmicroschaal. Bij agentgebaseerd modelleren kan het modelleren van individuelebeslissingen omslachtig zijn. Dit proefschrift heeft als doel daar verbetering in aante brengen. Agentgebaseerd modelleren is, ondanks haar nut, tot nu toe relatiefbewerkelijk en vereist veel programmeervaardigheden. Om de hieruit volgende kostente verlagen, wordt in dit proefschrift agentgebaseerd modelleren toegepast met als doelhet sneller en meer toegankelijk te maken. Daartoe wordt automatisering toegepast: ditmaakt het modelleren voor innovatie-diffusiemodellen meer systematisch dan tot opheden gebruikelijk is.
Dit was de aanleiding voor de volgende hoofdonderzoeksvraag:
Hoe kan de impact van apparaten die feedback geven om gedrag omtrentenergieconsumptie te veranderen systematisch worden gesimuleerd?
Allereerst is een raamwerk van de co-diffusie van technologie en gedrag ontwikkeld.Dat raamwerk werd geïmplementeerd in een theoretisch agentgebaseerd model. Dithad als doel om de mechanismes te verkennen waarmee feedbackapparaten impactbewerkstellingen in een grootschalig sociaal systeem. Om het model te ontwikkelen zijntwee eerder gepubliceerde modellen over diffusie van gedrag en technologie aan elkaargekoppeld; het effect van een theoretisch feedbackapparaat werd daarin gemodelleerd.De diffusie van een feedbackapparaat werd aangenomen die gebruikers aanzet tothet verlagen van de temperatuur van hun verwarming. Dit besparende gedrag konverspreiden via het proces van gedragsdiffusie.
Simulaties hebben twee mechanismes in beeld gebracht waarmee dezefeedbackapparaten invloed uitoefenen. Het eerste mechanisme brengt degedragsdiffusie van feedbackapparaten van adopters naar niet-adopters. Het tweedemechanisme was een positief effect op de snelheid van de gedragsdiffusie als geheel.Het gevolg van deze mechanismes is een positieve interactie van het effect van feedbacken gedragsdiffusie. De bepaalde relevantie van het gecombineerd bestuderen van dediffusie van technologie en gedrag bevestigt de waarde van het ontwikkelde raamwerk.

SAMENVATTING 7
De tweede stap was een empirische analyse met rijke data afkomstig uit de stadBottrop (Duitsland) en een technologiecasus die gebruikers aanmoedigt tot hetenergie-efficiënt ventileren van huizen. Het feedbackeffect uit het co-diffusieraamwerkwerd gemodelleerd op basis van data van praktijktests van dit feedbackapparaat. Ookde diffusie van energie-efficiënt ventilatiegedrag werd gekalibreerd met empirischegegevens.
Het empirisch gefundeerde model maakt het mogelijk de relatieve bijdrage vande gesimuleerde processen te bepalen. De resultaten laten zien dat maximaal 46%van de totale impact van de technologie werd veroorzaakt door gedragsdiffusie. Ditresultaat bevestigt het eerder vastgestelde belang om gedragsdiffusie mee te nemen bijhet beoordelen van feedbackapparaten.
Op basis van eerder ontwikkelde modellen, gefundeerd met empirische gegevens, zijnbeleidseffecten bestudeerd. Maatregelen die, zoals uit de literatuur blijkt, de adoptievan apparaten succesvol ondersteunen, zijn opgenomen in de analyse. De set vanbestudeerde beleidsinstrumenten zijn het verhogen van de bekendheid, het gratisverschaffen en het uitlenen van feedbackapparaten. Deze marketingstrategieën werdengesimuleerd met vergelijkbare sterkte (in termen van het aantal gebruikte apparaten)en schaal (in termen van de geografische schaal en tijdshorizon). De instrumenten zijngetoetst door het simuleren van diverse implementatiescenario’s. Op basis daarvan zijnde instrumenten vergelijken qua effectiviteit en kostenefficiëntie.
De resultaten laten zien dat het uitlenen van de apparaten bijzonder effectief is,terwijl het vergroten van hun bekendheid het meest kostenefficiënt lijkt. In het algemeenhebben de beleidsinstrumenten veel effect of de impact van feedbackapparaten. Ditlaat duidelijk de noodzaak zien om een gewenste diffusiestrategie te selecteren om deimpact van feedbackapparaten te maximaliseren.
Ten slotte is de voor dit proefschrift ontwikkelde methode gestandaardiseerd enverenigd in een aanpak voor automatisering. Deze aanpak heeft geresulteerd inprototype automatische software. Dit maakt het mogelijk automatisch agentgebaseerdeinnovatie-diffusiemodellen te genereren en daarmee beleidsinstrumenten te evalueren.Kandidaten voor innovatie-diffusiemodellen werden gevarieerd in structuur enparameters om de aannemelijkheid van elk van die mogelijke modellen voor een casuste kunnen bepalen.
De potentie van beleidsinstrumenten om diffusie te bevorderen wordt geëvalueerdop basis van (mogelijk meerdere) aannemelijke modellen. Het standaardiseren van hetmodelleerproces versnelt datzelfde proces en maakt het mogelijk om empirische datameer systematisch in te zetten. Daarnaast stelt deze aanpak ons in staat om bestaandemodellen te verbeteren en leidt het tot het ontwikkelen van modellen die valide zijn doorhun ontwerp. Samen laat dit zien dat de aanpak voor automatisering een succesvollebijdrage levert aan de methode waarmee innovatie-diffusie wordt gemodelleerd.
Het kan worden geconcludeerd dat de impact van feedbackapparaten succesvol kanworden vastgesteld door de co-diffusie van de apparaten en de gedragsverandering dieze veroorzaken systematisch te simuleren. Deze conclusie is gebaseerd op vier pijlers.

8 SAMENVATTING
Ten eerste is dat de bepaling van de impact, welke is gebaseerd op de ontwikkelingen simulering van het raamwerk van co-diffusie van technologie en gedrag. Ditheeft geleid tot een algemeen begrip van de mogelijke impact van feedbackapparaten.Ten tweede is dat de theoretische analyse die werd verfijnd met empirische data.Ten derde is dat het empirische model dat is ontwikkeld voor het bepalen van hetpotentieel van beleidsinstrumenten in termen van het beïnvloeden van het effect vanfeedbackapparaten. Ten vierde is dat de automatisering die de analyse van deze impactkrachtiger en meer toegankelijk maakt. Uiteindelijk verbetert deze systematiseringsslagde manier waarop agentgebaseerde innovatie-diffusiemodellen worden ontwikkeld entoegepast.
1INTRODUCTION
Motivation is what gets you started;Habit is what keeps you going.
Jim Ryun
1.1. MOTIVATION
To tackle climate change and to deal with the depletion of fossil resources, a decreasein greenhouse gas emissions is urgently needed (Edenhofer et al., 2014). Residentialheating represents a significant share of overall greenhouse gas emissions in the EU.“Buildings represent 40% of the (European) Union’s final energy consumption” (EuropeanParliament, Council of the European Union, 2012). For residential buildings, ca. 57% ofthis final energy is used for space heating (Itard and Meijer, 2008), the majority of whichis generated from non-renewable energy (Olivier et al., 2015). The resulting contributionto overall greenhouse gas emissions in the EU is significant and therefore needs to beaddressed as urgently as overall emissions.
A particularly cost-effective way to mitigate these emissions from space heating is viaenergy efficiency (Birol, 2008). Additionally, the EU committed to 20% increased energyefficiency in 2020, compared to the energy consumption that was projected in 2007(European Parliament, Council of the European Union, 2012). However, final energyconsumption of households in the EU failed to reduce significantly over the last 20years (Eurostat, 2016). The building stock thus continues to bear significant potentialto meet this energy-efficiency target. Everything else being equal, this potential shouldbe addressed as soon as possible, because earlier mitigation allows for lower averageatmospheric temperatures (IPCC, 2007). Therefore, mitigation solutions are needed thatare not only effective, but also quick. With residential building envelopes in Europehaving an average service life of ca. 60 years (Balaras et al., 2005b, Table 2), the largestnear-term potential for reduction in energy demand of the building stock lies in existingbuildings (Balaras et al., 2007).
9
1
10 1. INTRODUCTION
Consumer behavior When increasing energy efficiency of existing buildings, potentialfrom behavior change can have a valuable contribution, First and foremost, behaviorchange has the advantage to be of significant magnitude. Only due to differentbehavior, heating energy consumed in similar buildings can vary threefold (Gill et al.,2011). On average, significant savings of ca. 20% can be achieved from conservationbehavior (Lopes et al., 2012). Additionally, behavior change has strategic benefitsregarding implementation. Interventions to change energy-consumption behavior canbe quickly implemented, are of low cost and scalable (i.e. widely applicable in the builtenvironment) (Loock et al., 2013). Further, they require fewer physical resources thanother energy-efficiency measures, e.g. renovation of buildings (Balaras et al., 2005a).Given the combination of these benefits, saving energy via behavior change appears tobe the low hanging fruits to energy-efficiency in buildings.
Feedback interventions To achieve behavior change in domestic heating, users ofbuildings should receive feedback on their energy consumption. According to a recentmeta-study by Karlin et al. (2015), feedback interventions to user behavior showedto reduce energy consumption by an average of ca. 7%. Long-term interventions (ofat least 12 months) even achieved average savings of ca. 15%. Behavioral feedbackwas more successful if provided immediately, over longer periods of time, and via adigital medium. Therefore, electronic feedback devices that can be permanently placedin the household (e.g. in-home monitors or smartphone applications) appear bestsuited. Such devices rely on retrieving behavioral data from sensors or other ‘SmartHome’ appliances. Improvements of sensing technology and digitization of energyinfrastructure are currently expanding the options for behavioral “information to becollected, processed, and sent back (as feedback) to consumers quickly, cheaply, and oftenin real time” (Karlin et al., 2015). Beyond its present capabilities, this technologicalpotential can be expected to grow significantly with the future improvement of sensorsand the market penetration of the ‘Smart Home’ and ‘Internet of Things’.
Feedback devices The feedback devices that this thesis focuses on are designed topersuade their users to practice energy conservation. For persuasion, they use so-called‘nudging’ (Thaler and Sunstein, 2009), which suggests users to change their behaviorwithout forcing them to do so.
Changing behavior via feedback is challenging, because it has to ‘break’ existinghabits, which are difficult to change (Jackson, 2005). Energy consumption behaviorat home is particularly routinized: we may stand up in the morning, turn on thethermostat, and we go to sleep after turning it off again. Such habits circumventthorough cognitive processing, at which conscious intentions influence actions andcould make a difference (Jager, 2003). Therefore, interventions that only provideinformation to address intentions of energy consumers might fail. Instead, interventionsshould interrupt habits during their execution (Gärling and Axhausen, 2003) andinstantly nudge users to practice another behavior. Over time, this approach has shownto be successful at replacing a habit with a new one (Piacentini et al., 2010). For a detailedpresentation of the interaction of feedback devices with their users, see Chapter 2.2.

1.1. MOTIVATION
1
11
In the following, two examples of feedback devices are presented. Both of theseincentivize conservation behavior. First, so-called ‘Transformational Products’ aredevices that become a material part of the routines they are designed to change. Theyare described in detail by Laschke et al. (2011) and Jensen and Chappin (2014). Whenan undesired habit is executed, the feedback can create ‘friction’ to interrupt habitualbehavior Laschke et al. (2011). At this window of conscious awareness, users are thenable to consciously align action with their goals and values. Ideally, a TransformationalProduct now adds persuasion to ‘nudge’ users towards another habit (Thaler andSunstein, 2009). An example of a Transformational Product is the so-called ‘never hungrycaterpillar’, which is “a caterpillar-like device that is supposed to be placed next to aTV. If the TV is switched to stand-by, it twists and thus symbolizes discomfort, whichcreates awareness (of) the waste of energy. Thus, awareness is created just in time andcan immediately be translated into action” (Jensen and Chappin, 2014). Second, thefeedback device ‘CO2 meter’ is designed to create healthier room ventilation behavior,but also showed to lead to energy savings. The device gives feedback on air-quality bypresenting the measured indoor CO2 levels in the intuitive colors of a traffic light. Thisinformation motivates households to ventilate rooms at higher air-exchange rates, butto stop ventilating when air-quality levels are sufficiently good. Indirectly, these twochanges in behavior conserve heating energy (see Chapter 3). At field tests, this showedto create energy savings of ca. 8%.
Diffusion of feedback devices The impact of feedback devices (i.e. their overall effecton energy-conservation behavior) can consistently be framed as an innovation diffusion.The Theory of Diffusion of Innovations by Rogers (2003) describes an innovation asany idea that is “new to an individual.” To this, Watts and Gilbert (2014) add that theinnovation needs to be an improvement and of value to this individual. The diffusion ofan innovation is “the process by which an innovation is communicated through certainchannels over time among the members of a social system” (Rogers, 2003). Successfulinnovation diffusion can thus be seen equivalent to an innovation having great reach.This is what makes understanding the diffusion of innovations powerful. For thisreason, Delre et al. (2010) stress the practical relevance of understanding the innovationdiffusion of any new product.
In the following, the framing of feedback devices as diffusing innovations will beintroduced in detail. The same will be done for the energy conservation that thesedevices incentivize. Previous to this thesis, these two diffusions had been researchedindividually, but apparently not in their interaction (Jensen and Chappin, 2014). Fillingthis research gap, this thesis integrates these two diffusions of technology and behavior,which are linked by the feedback effect of devices on behavior. Due to their linkage, thesetwo diffusions are researched within a single framework. I coin this the co-diffusion oftechnology and behavior framework.
Technology diffusion will in this thesis describe the process of feedback devicesspreading among consumers. When consumers decide on whether to adopt aninnovation, they are “motivated to reduce uncertainty about the advantages anddisadvantages of the innovation” (Rogers, 2003). This motivation results in exchangeof information among consumers—e.g. via the mechanisms of word-of-mouth, which
1
12 1. INTRODUCTION
can self-reinforce diffusion and can lead to a take-off of adoption (Rogers, 2003).Word-of-mouth has previously helped explain the successful take-off of the diffusionof many products (Delre et al., 2010, 2007). The importance of this mechanism isunderlined by the Theory of Planned Behavior (Ajzen, 1991), which attributes humandecisions (among other factors) to subjective (social) norms. Understanding thetechnology diffusion of feedback devices is able to draw on this theoretical foundation.Eventually, a take-off of diffusion to wide adoption would be helpful for feedback devicesto have significant impact: the more adopters there are, the more persons will beexposed to behavior-changing feedback.
Behavior diffusion is the spreading of energy-efficient heating behavior amongconsumers. This concept bases on the Social Learning Theory (Ajzen, 1991).Accordingly, observation of other persons’ behavior is an important source of anindividual’s learning. In an extensive review, Jackson (2005) concludes that thismechanism bears significant potential for sustainable behavior to spread. Likewise,numerous studies have concluded that diffusions of sustainable behaviors can beexplained by social learning (Azar and Menassa, 2015; Mohammadi et al., 2014;Peschiera et al., 2010; Burchell et al., 2014). To describe this mechanism in the context ofenergy conservation, Azar and Menassa (2014) coined the process of ‘diffusion of energyefficient behavior.’
In the context of this thesis, behavior diffusion has the potential to reinforce theoverall effect of feedback devices. For instance, assume that an intervention addressesconsumer A, who then starts using a feedback device and adopts energy-efficientheating behavior. Now, consumer B, a close peer of A, might observe and imitate thisnew behavior and thus would also save heating energy. Consequently, such behaviordiffusion could increase the overall impact of feedback devices beyond the impact forthose households who are directly using feedback devices.
Effect of feedback from devices on heating behavior naturally links these twodiffusions. Feedback devices have the potential to change energy consumption behaviorof at least some of their users. If the diffusion of feedback devices takes-off, this couldtrigger adoption of conservation behavior on a large scale. This in turn would supportbehavior diffusion by exposing more parts of society to social learning of conservationbehavior. In the physics community, this coupling of diffusions is actively researchedas the ‘diffusion in multiplex networks’ (Granell et al., 2013; Funk and Jansen, 2010;Cozzo et al., 2013; Bagnoli et al., 2007). In essence, this field of research has shownthat the interaction between two linked diffusions creates unique dynamics that cannot be directly explained by any of its constituting individual diffusions. Consequently,exploring the co-diffusion of technology and behavior appears fruitful.
Simulating innovation diffusion Simulation modeling is promising at inferring thefuture impact of feedback devices. The benefit of simulating “real-world systems is to giveus something useful that we could not—for a variety of reasons—obtain from the systemitself” (Ahrweiler and Gilbert, 2005). Watts and Gilbert (2014) emphasize that simulationis useful to answer ‘what-if’ questions and to test policy actions. To understand ex-antethe future potential of feedback devices, simulating ‘what-if’ scenarios and policies ishighly useful. At the time of writing, many feedback devices are still in the design

1.1. MOTIVATION
1
13
phase or their market diffusion has recently started. This is why forecasting theirpotential future impact is of particular interest. Thereby, it is important to rememberthat predicting socio-technical systems faces high uncertainty (van Dam et al., 2012).Fortunately, ex-ante insights do not strictly require precise prediction. Instead, Epstein(2008) stresses that “bound(ing) (...) outcomes to plausible ranges” can also be valuable.A confirmation of this forecasting capability of simulation is the model by Bass (1969). Ithas shown to successfully capture the macro-level dynamics of innovation diffusion.
A particularly suited approach for simulating the co-diffusion of technology andbehavior is agent-based modeling. In practice, this is shown by numerous examplesof successful simulation of innovation diffusions (see Watts and Gilbert, 2014; Kieslinget al., 2009)1. This success relies on three factors: its actor-based perspective,its capability to infer emergent system behavior from this micro-level perspective,and the disaggregated modeling of actor decisions (Chappin and Dijkema, 2015).First, households are the key actors of the research perspective that this thesisassumes. Agent-based modeling allows capturing their heterogeneity and socio-spatialstructure, which are important factors for energy and sustainability related decisionsof households (Grossmann et al., 2014). Second, simulating decisions and interactionsof these micro-level agents generates an emergent system behavior on the macrolevel. This helps explain the dynamic inter-dependency of observations on both themicro- and macro-level of a system, which assists at making sense of both. Third,agent-based models capture in a disaggregated way the decisions of actors. Adoptiondecisions of technology and heating practices can successfully be captured, e.g. byusing the Theory of Planned Behavior (Sopha et al., 2013; Schwarz and Ernst, 2009).This disaggregation has the advantage of giving valuable mechanistic insight instead ofremaining a black-box that merely connects cause and effect.
However, disaggregation also makes agent-based modeling cumbersome, whichcalls for rethinking current modeling practice. Developing disaggregated models isrelatively costly in time and labor (see Chapter 5). This has created two problems. First,this constraint often leads to ‘ad hoc’ decisions on model design (Grimm et al., 2005).In combination with many model design options, this has further led to a great varietyof agent-based models of innovation diffusion (see Kiesling et al., 2012). Unfortunately,such high diversity is “a major obstacle to distilling general insights” (Thiele and Grimm,2015). Second, high effort of model development has further contributed to the deficitthat “a versatile method of easily testing managerial strategies that influence the degreeand speed of diffusion processes is not currently available” (Garcia and Jager, 2011).Consequently, a systematic modeling approach that increases efficiency in developingagent-based innovation diffusion models and thus overcomes these downsides has yetto be designed.
Overall, the perspective of innovation diffusion and agent-based modeling are theright vehicles to increase understanding on the potential of feedback devices to reduceheating demand. First, diffusion view from the Theory of Diffusion of Innovations andSocial Learning Theory, as well as theories of decision making like the Theory of PlannedBehavior, are rich sources from which theoretical knowledge can be drawn. Second,agent-based modeling and simulation is suited as a methodological paradigm. This
1For a review of agent-based models of the diffusion of technology or behavior, see Chapter 2.4.2.

1
14 1. INTRODUCTION
combination of theory and methods is useful to systematically simulate the potentialimpact of behavior-changing feedback devices. Such an approach could also beempirically grounded in order to complement the common approach of empirical fieldtesting of devices. A model based on the empirical data from such field tests couldfurther assist policy decisions on how to effectively support the impact of feedbackdevices. Ideally, all this should be taken out in a systematic modeling procedure thatovercomes the current challenge of agent-based modeling of innovation diffusion beingcostly in time and labor.
1.2. RESEARCH QUESTIONS
The aim of this thesis is to give model-based insights into the potential of feedbackdevices to impact heating energy demand. This will be done from a perspective ofinnovation diffusion. Therefore, the central research question addressed by this thesisis as follows:
How can the impact of behavior-changing feedback devices on energy-consumptionbehavior be systematically simulated?
In the following are four sub-questions to this central question:
1. What are the mechanisms via which feedback devices can change heatingbehavior?
2. What is the impact of the diffusion of feedback devices and of the diffusion of thebehavior that they incentivize?
3. How can the projected impact of feedback devices be affected by policies?
4. How can innovation diffusion models be developed and applied moresystematically?
1.3. RESEARCH APPROACH
The stated research questions express the need to conduct a model-based study. Theoverarching method chosen is agent-based modeling of innovation diffusion. In thefollowing, the research approach taken out in this thesis is presented in detail.
Simulating the impact of feedback devices is a valuable alternative to prevailingempirical research. So far, studies of empirical observation represent the bulk of researchon feedback devices. We aim to complement this body of knowledge with a model-basedstudy. Empirical observations have already created rich yet fragmented knowledge thatmodeling can take up and combine. Simulation modeling can be based on this existingempirical knowledge. The future of the simulated processes is of particular interest inthis thesis. Therefore, simulation would be useful to explore possible future trajectoriesof impact from feedback devices.
The chosen research approach requires a stepwise proceeding. Its principal aim isto assess the impact of behavior-changing feedback devices by ‘systematic simulation’.

1.3. RESEARCH APPROACH
1
15
Therefore, the research approach of this thesis works towards tackling this task via anautomated software procedure. This approach promises a high degree of systemizationand standardization. It builds on three preparatory steps. First, the mechanisms viawhich feedback devices create an impact are identified via simulation. Second, becausethe real-world impact of feedback devices is of interest, simulation are empirical-based.Third, the sensitivity of the impact to policies is explored systematically via scenarioanalysis. Finally, this groundwork is combined into an automated software procedurethat makes the modeling process systematic. In the following, the succession of thisresearch approach is presented in detail.
1.3.1. MECHANISMS OF IMPACT FROM FEEDBACK DEVICES
The first step of this thesis is to understand the mechanisms via which feedback devicescreate an impact on heating energy demand. This is done by developing an agent-basedmodel that implements the framework of co-diffusion of technology and behavior. As anabstract technology case is chosen a feedback device that incentivizes heating at lowertemperatures. Hence, modeled behavior is the thermostat setting by users—a centralelement to heating behavior.
Model building for this task combined existing models, which is not only efficient,but also transfers their previous validation. Two diffusion models—one of technologydiffusion, one of behavior diffusion—are reproduced and integrated.
Simulation experiments are then used to identify the mechanisms and drivingfactors of co-diffusion. This helps highlighting the data needed for increasing modelrealism in the following research steps.
1.3.2. EMPIRICALLY-GROUNDED SIMULATION OF IMPACT
The simulation model from the previous step has to be refined to tackle empirical-basedquestions. The second sub research question is therefore answered by a simulationmodel that draws on data from field tests of feedback devices.
Commonly, the effect of interventions to energy consumption of households isanalyzed with households, who test feedback devices, as final units of assessment(Darby, 2006; Grinewitschus et al., 2013; Karlin et al., 2014). In so-called ‘Living Labs’(Liedtke et al., 2015), interventions are tested right in the location for which they weredesigned. To quantify the induced change of behavior and energy consumption, testingis commonly accompanied by sensors that log behavioral data.
Instead of only in selected households, the initial motivation of this thesis demandsthat conservation of heating energy arises at larger geographical scales. This wouldcontribute significantly to the reduction of energy demand in heating. Simulationmodeling can help closing this gap across scales. With agent-based modeling andadequate socio-spatial data, it is possible to extrapolate findings from households tolarger areas (Ernst, 2014). In this thesis, upscaling is conducted up to the city scale.A suited link for this upscaling is commercial marketing data that maps individualhouseholds and their sociodemographic properties.
When scaling up energy conservation, there are not only more households andmore opportunities to save energy. Also, due to interactions between households,more processes take place that have to be captured. As described above, the diffusion
1
16 1. INTRODUCTION
of feedback devices and the diffusion of conservation behavior become relevant in asystem of multiple households. Capturing this co-diffusion in an empirically-based waytherefore is a means to gain understanding of the impact of feedback devices on largerspatial scales.
This step of the research approach makes use of data from Living Lab experiments.Chosen case technology was the CO2 meter, because close connection to empiricalresearchers has given access to sensor logging data from corresponding field tests. Thechosen case area is the city of Bottrop (Germany), because rich marketing and buildingdata is available from project partners and stakeholders.
Developing and validating an empirical-based model requires empirical data. Twopatterns from empirical data are available for this: a historical trend of adoptionof conservation behavior and data on the importance of social contacts at creatingbehavior change. These data were used to indirectly parameterize the simulationmodel. In line with the concept of ‘pattern-oriented modeling’ (Grimm et al., 2005), thiscoherence of the model with empirical data also assures its validity.
1.3.3. ASSESSMENT OF POLICY INTERVENTIONS
The third step of the research approach deepens the knowledge on the potential impactof feedback devices. In the previous steps, the impact of devices has been assessed whileneglecting policies influencing the impact of devices. Nevertheless, the empirical-basedmodel from this previous step provides the foundation for doing so. The means toanswer the third sub research question therefore is to simulate policy scenarios.
The practical questions of how to influence the diffusion of feedback devices withmarketing is tackled. A literature review guides selection of strategies (see Chapter 4.3.1).These then test with the simulation model from the previous research step. Addressedby this advice are policy makers, stakeholders, and marketers. This research step thusinforms about what actions most effectively maximize the impact of feedback devicesand which ones are most cost-efficient at doing so. Further, it creates a blueprint forassessing the role of policies towards the impact of feedback devices.
1.3.4. AUTOMATING AGENT-BASED MODELING OF INNOVATION DIFFUSION
The final research step combines the work from the previous three steps. The initialstep contributes the framework via which diffusion of feedback devices is modeled.The second one contributed a method of building an empirical-based diffusion modelbased on empirical data. The third step contributes the structured testing of policyinterventions.
In the final step, a procedure for generating and applying agent-based innovationdiffusion models is presented. This addresses the fourth sub research question. Theprocedure is implemented as a software prototype of automated model generation.Automating the process of agent-based modeling in this thesis further includes theautomated assessment of policies. Testing these with predictive models usually is ahighly repetitive and time-consuming task. Automation is introduced to make this onlyrepetitive and work-intensive for the used computing infrastructure, but not for usersthemselves.

1.4. OUTLINE
1
17
1.4. OUTLINE
The structure of this thesis is shown in Figure 1.1. Each of the four sub research questionsand steps of the research approach is covered by one thesis chapter.
!"#$%&'()((
!"#$%&'($)*
+#,-.$(/0/*(
!"#$%"&'()*+,+
!"#$%&'(*((
102(3(,.456./#"*
+7"#4($)*(
!"#$%"&'()*+-+
!"#$%&'(+((
874(,'**
9//#//0#$:*(
!"#$%"&'()*+.+
((
!"#$%&'(,(*
!$:37";,%7$*(
(
!"#$%&'(-((
9;:70.:#"*
+7"#4($)*(
!"#$%"&'()*+/+
!"#$%&'(.((
<7$,4;/(7$/*(
0&*1234+%"&'()*+
Figure 1.1: Structure of this thesis.
Chapters 2–4 successively expand modeling methods to generate knowledge on theco-diffusion of technology and behavior, as well as policy options. They take out the firstthree steps of the research approach. Based on this groundwork, Chapter 5 presents amethod to automate the generation of agent-based innovation diffusion models and theassessment of policies. This chapter takes out the fourth step of the research approach.In the final thesis chapter, overall conclusions are drawn.


2CO-DIFFUSION FRAMEWORK
First, earth had no roadsbut as people walked on it
they thus made the roads
Lu Xun
2.1. INTRODUCTION
Reducing heating energy households consume is needed to mitigate climate change andthe depletion of energy resources and, more specifically, to reach the EU target of a 20%gain in energy efficiency until 2020 (McDonnell, 2010). This is particularly important,because approximately 30% of energy in the EU is used in residential buildings and thebulk of this (ca. 57%) is used for heating (Itard and Meijer, 2008).
Changing the energy consumption behavior in households, e.g. setting lowerspace heating temperatures and heating fewer rooms, can significantly reduce heatingdemand at low investment costs and with few physical resources (Guerra-Santin andItard, 2010). This is illustrated by the fact that different heating behavior in similarbuildings can induce a three-fold difference between maximum and minimum energyconsumption (Gill et al., 2011).
In this study, we focus on technical devices that provide feedback to households ontheir heating behavior and offer promise for supporting them to reduce their heatingdemand, i.e. to practice energy conservation. It has been shown that such devicescan lead to typical energy savings of 10%, varying between an increase in energyconsumption and savings of up to 30% (Darby, 2006; Karlin et al., 2014). Their successis based on the high frequency and the long duration of their feedback. First, frequent(e.g. daily) feedback supports habituation of changed behavior (Jager, 2003). Second,
This chapter has been published as Jensen, T., Holtz, G. and Chappin, E.J.L., 2015. Agent-based assessmentframework for behavior-changing feedback devices: spreading of devices and heating behavior. TechnologicalForecasting and Social Change 98.
19

2
20 2. CO-DIFFUSION FRAMEWORK
providing feedback over a relatively long time-span prevents behavioral relapse andpreserves the adopted energy conservation behavior (see Peschiera et al., 2010; Hanet al., 2013; Burchell et al., 2014).
Ex-ante assessment of novel behavior-changing feedback devices is needed becausedifferent types of feedback vary significantly in their acceptance (Han et al., 2013) andhow they reduce energy consumption (Karlin et al., 2014). Ex-ante assessments canreduce this uncertainty by eliminating the need to wait for data generated from actualmarket trials on a technology’s effect. Failed market trials rooted in promoting andlaunching the ‘wrong’ types of products waste resources and time that could otherwisebe directed to reducing energy consumption in households. Instead, distinguishingbetween more and less promising devices upfront helps support the diffusion of thosedevices that promise the greatest impact on energy conservation.
Existing methods for ex-ante assessment, e.g. trial testing (see Burchell et al.,2014; Grønhøj and Thøgersen, 2011; Darby, 2006), are useful for describing directwithin-household effects of feedback devices. This approach estimates the direct impactof a device by comparing behavioral changes between a treatment and control group(Padonou et al., 2013).
However, we hypothesize that assessing only effects within households that usefeedback devices underestimates the overall impact of feedback technology on energyconsumption in a society. Instead, we argue that effects between householdsplay an important role, as was shown for technology diffusion in assessments ofenvironmental-friendly household technology (Schwarz and Ernst, 2009; Sopha et al.,2013; Afman et al., 2010; Delre et al., 2010). Additionally, we propose that diffusion of(changed) behavior needs to be included in assessments of behavior-changing feedbackdevices, too.
We argue that, in addition to within-household effects, assessing the overall impactof behavior-changing feedback devices on energy consumption needs to considerboth the diffusion of behavior-changing feedback devices and the spread of behavior.The latter processes are both driven by the interactions between households. Directcommunication, the so called ‘word of mouth’ interaction, strongly influences thenumber of households that adopt a new technology (Rogers, 2003), often reinforcing theextent new products are adopted and spread (Janssen and Jager, 2002; Schwarz, 2007;Rogers, 2003). Additionally, household interactions can spread the behavior induced byfeedback devices beyond households adopting the devices (Nolan et al., 2008; Göckeritzet al., 2010). In particular, communicating energy consumption behavior betweenhouseholds is common (Baedeker, 2014) and comparing individual to peer behavior cantrigger shifts in energy consumption behavior (Peschiera et al., 2010; Chen et al., 2012;Azar and Menassa, 2014).
In this study, we combine the aforementioned concepts to create a single technologyassessment framework that covers (1) the direct impact that a feedback device unfoldswithin a household, (2) diffusion of the feedback devices among households, and (3)diffusion of (changed) energy consumption behavior. We furthermore implement anagent-based model based on this framework. We use simulation experiments to explorethe relevance of the added behavior diffusion and to identify the relevant mechanisms.
2.2. BEHAVIOR-CHANGING FEEDBACK TECHNOLOGY
2
21
The remainder of this chapter is structured as follows. First, we describe thefunctions of behavior-changing feedback technology (section 2.2). Second, we describethe framework capturing the three relevant processes mentioned above (section 2.3).Third, two existing agent-based models are combined into a model that implementsthe presented framework (section 2.4). Finally, we use simulations from the combinedmodel to identify and demonstrate the relevant interactions between the spreading ofboth feedback devices and energy consumption behavior.
2.2. BEHAVIOR-CHANGING FEEDBACK TECHNOLOGY
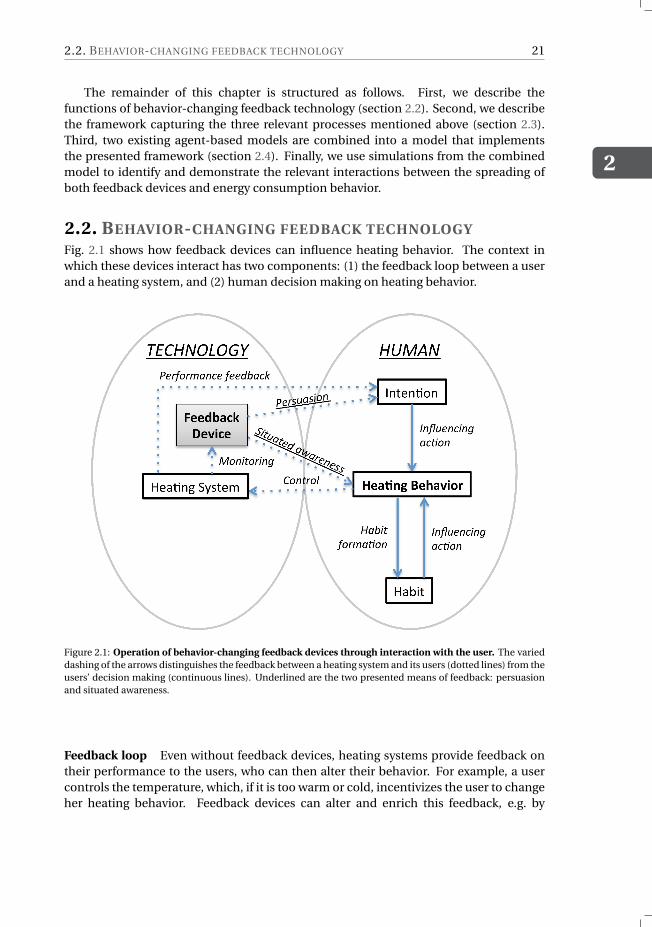
Fig. 2.1 shows how feedback devices can influence heating behavior. The context inwhich these devices interact has two components: (1) the feedback loop between a userand a heating system, and (2) human decision making on heating behavior.
Figure 2.1: Operation of behavior-changing feedback devices through interaction with the user. The varieddashing of the arrows distinguishes the feedback between a heating system and its users (dotted lines) from theusers’ decision making (continuous lines). Underlined are the two presented means of feedback: persuasionand situated awareness.
Feedback loop Even without feedback devices, heating systems provide feedback ontheir performance to the users, who can then alter their behavior. For example, a usercontrols the temperature, which, if it is too warm or cold, incentivizes the user to changeher heating behavior. Feedback devices can alter and enrich this feedback, e.g. by
2
22 2. CO-DIFFUSION FRAMEWORK
associating higher energy costs with high temperatures, thereby motivating the user tochange her heating behavior (Wood and Newborough, 2003).
The most common mechanism of feedback devices is using information to persuadeusers to change their behavioral intentions, i.e. “the motivation required to performa particular behavior, reflecting an individual’s decision to follow a course of action"(Armitage and Christian, 2003, p. 190). Feedback devices that rely on persuasion byinformation to address the user on a conscious level, e.g. by monitoring the user’sbehavior, visualizing it to the user, and thus creating awareness (Laschke et al., 2011),make energy consumption transparent and understandable (Wood and Newborough,2003) and advocate a change in behavior. Smart Meters are a prime example for this(see Wood and Newborough, 2003). Another example is feedback devices that makeenergy consumption levels mutually transparent between friends so that behavior isinfluenced by peer pressure (Peschiera et al., 2010). Related to heating, an example isthe E-quarium, which uses sensors distributed in the household to evaluate the users’energy consumption behavior (see Delft University of Technology, 2014). By scoringbehavior, it involves the user in an incentive game that encourages use of lower heatingtemperatures. The scores are continuously shown by the ‘happiness’ of a virtual fish.
Feedback can also be given immediately at specific instances of behavior to createsituated awareness. This can lead to users correcting performance. For example, Laschkeet al. (2011) present the ‘never hungry caterpillar’, a so-called Transformational Productthat is a caterpillar-like device placed next to a TV. If the TV is switched to stand-by,the device twists, symbolizing discomfort. This creates situated awareness of wastedenergy and reminds the user that the TV can be switched off completely. AnotherTransformational Product could be a household item located close to a window thatstarts shivering if the window is open for too long during winter, emulating being coldand remind the user to conserve heating energy by closing windows.
Decision making Heating behavior follows intentions, but it is constrained by habits.Habits are action sequences that are performed without significant deliberation (Jager,2003). They are triggered by so-called environmental cues. Repetition and positiveoutcomes of actions increase the strength of associated between cues and behavior(Jager, 2003). For example, saving energy costs by repeatedly turning down radiatorthermostats, before leaving the home, supports habit formation. With frequentrepetition in a stable environment, habits become reinforced, which makes themincreasingly dominant over intentional behavior (Jager, 2003).
The feedback mechanism that uses situated awareness has the potential to changeheating habits by interrupting them. This is because habits can effectively “be changedthrough interventions that disrupt the environmental cues that trigger habit performanceautomatically" (Verplanken and Wood, 2006, p. 90). Transformational Products,implementing situated awareness, thus seem particularly suited for changing heatinghabits.

2.3. CONCEPTUAL FRAMEWORK FOR TECHNOLOGY ASSESSMENT
2
23
2.3. CONCEPTUAL FRAMEWORK FOR TECHNOLOGY
ASSESSMENT
In this section, we propose a framework for assessing the effect of behavior-changingfeedback devices. In this framework, we combine the direct effect of heating feedbackdevices with first, the diffusion of this technology, second, the effect of feedback withina household, and third, the diffusion of the changed behavior. This framework is shownin Fig. 2.2 and defines the direction and interplay of these three processes from theperspective of one household as a model.
Figure 2.2: Conceptual framework for assessing behavior-changing feedback technology. A household’stechnology adoption decision (partially) depends on the adoption state of its N neighbors and in turninfluences these peers’ adoption decisions. Likewise, a household and its peers are mutually influencing theirenergy consumption behavior. If a household adopts feedback technology, then the feedback effect can alsochange its energy consumption behavior.
Technology diffusion is the process in which households adopt technology, i.e.choose to take up a specific feedback device. A well-known general characteristic ofsuch processes is that the initial adoption by a few ‘innovators’ self-reinforces via wordof mouth until a saturation level is reached (Rogers, 2003). As more people adopta technology, the adoption choice persuades non-adopters to adopt. For example,empirical research shows that adopting water-saving shower heads by households canbe positively influenced by the number of that household’s peers who have alreadyadopted such shower heads (Schwarz and Ernst, 2009).
The feedback effect is the direct effect of feedback devices on their users’ heatingbehavior. It links the processes of technology diffusion and behavior diffusion.
We coin behavior diffusion as the spreading of energy consumption behavior (seeAzar and Menassa, 2014), i.e. the phenomenon that “behavior can be spread from oneperson to another via peer networks” (Chen et al., 2012, p. 517). A key driver for behaviorto spread is that of subjective norms, i.e. “the perceived social pressure to perform ornot to perform (a) behavior” (Ajzen, 1991, p. 188). The social pressure is formed by

2
24 2. CO-DIFFUSION FRAMEWORK
what a person perceives to be common and approved behavior. Subjective norms ofconservation, which influence behavior of households, can explain why conservationlevels between peers are highly correlated (Nolan et al., 2008; Göckeritz et al., 2010).Because people with strong social ties mutually influence their behavior (Bandura andMcClelland, 1977), this influence is potentially transitive. This effect can thus spreadfurther than one link in a social network. Consequently, heating habits are relativelysimilar within social groups (see Wilhite et al., 1996).
Behavior diffusion can act in any direction and may cause a so-called boomerangeffect. This effect occurs when a person who uses less energy than her peers adopts aless stringent energy conserving strategy due to social influence (see Goldenberg et al.,2010). If this ‘negative’ social influence is strong, households could be resistant againstthe effects of behavior-changing feedback devices.
2.4. MODEL DEVELOPMENT
In this section, we develop a simulation model based on the presented framework. Wefirst argue that agent-based modeling is a well-suited approach for this. We then presenttwo existing agent-based models that each capture a substantial part of the framework,i.e. technology diffusion and behavior diffusion, respectively. Finally, we integrate thesetwo models into a combined model.
2.4.1. AGENT-BASED MODELING
An agent-based model (ABM) captures real-world entities as autonomous computeragents, which “have behaviors, often described by simple rules, and interactions withother agents, which in turn influence their behaviors" (Macal and North, 2010, p. 151).
Agent-based modeling is a suitable tool for the given application for threereasons. First, ABMs are able to capture socio-technical systems that ‘generate’emergent phenomena in a bottom-up manner (van Dam et al., 2012; Chappin, 2011;Epstein, 1996). Simulation results are thereby directly based on the micro-levelunits of assessment—in this case the household agents—and their behavioral rulesand interactions. For example, the spreading of feedback technology and specificenergy-consumption behaviors emerges from household interactions that can bemodeled explicitly by an ABM.
Second, agent-based models are highly flexible in design because specifying rulesis only limited by the programming language. This flexibility allows ABM to assimilatevirtually all kinds of existing models, be they analytical or rule based, thus allowing us tointegrate different existing models.
Finally, ABM is advantageous over many other modeling approaches when modelentities are adaptive, heterogeneous and interact locally (Railsback and Grimm,2011), all of which meet our modeling criteria. Households adapt their energyconsumption behavior and adopt feedback devices depending on their peers. Theyare naturally heterogeneous in their product adoption preferences (Schwarz and Ernst,2009). Further, interaction between households is more likely at smaller spatial scales(Baedeker, 2014; Holzhauer et al., 2013).
2.4. MODEL DEVELOPMENT
2
25
2.4.2. EXISTING TECHNOLOGY AND BEHAVIOR DIFFUSION MODELS
Various ABMs have been developed for diffusion of sustainable household technology(Schwarz and Ernst, 2009; Sopha et al., 2013; Kroh et al., 2012; Zhang and Nuttall, 2011)and energy consumption behavior (Azar and Menassa, 2014; Chen et al., 2012; Andersonet al., 2014; Zhang et al., 2011). A previous review by Jensen and Chappin (2014) foundnone of these models capture the proposed framework by connecting the two diffusionsof technology and behavior. However, the two models by Schwarz and Ernst (2009) andby Anderson et al. (2014) were identified as particularly useful to model one of these twodiffusion processes, respectively. In the following, we present these models and theirpotential to contribute to the proposed framework.
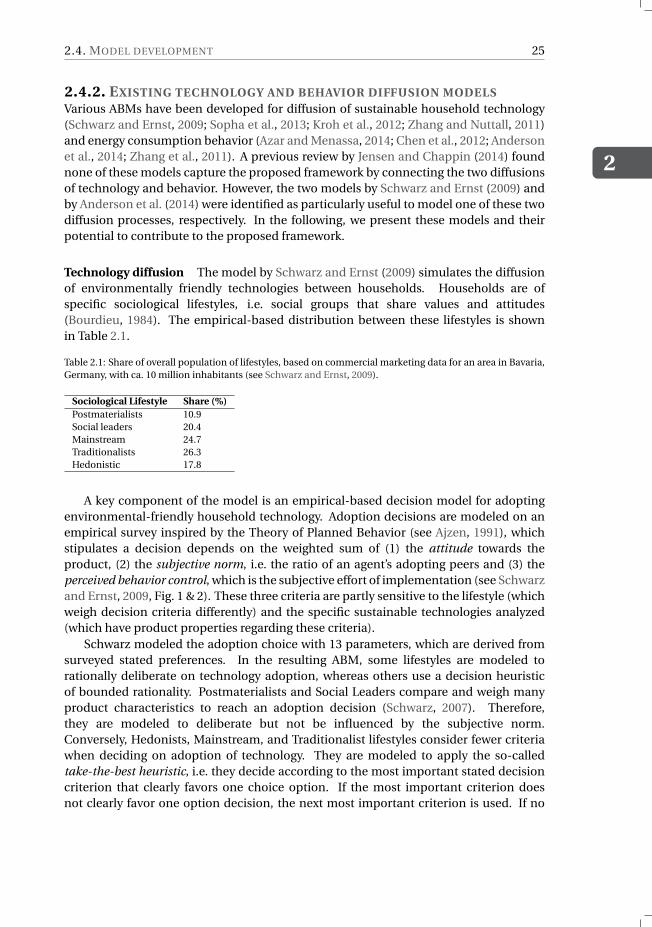
Technology diffusion The model by Schwarz and Ernst (2009) simulates the diffusionof environmentally friendly technologies between households. Households are ofspecific sociological lifestyles, i.e. social groups that share values and attitudes(Bourdieu, 1984). The empirical-based distribution between these lifestyles is shownin Table 2.1.
Table 2.1: Share of overall population of lifestyles, based on commercial marketing data for an area in Bavaria,Germany, with ca. 10 million inhabitants (see Schwarz and Ernst, 2009).
Sociological Lifestyle Share (%)
Postmaterialists 10.9Social leaders 20.4Mainstream 24.7Traditionalists 26.3Hedonistic 17.8
A key component of the model is an empirical-based decision model for adoptingenvironmental-friendly household technology. Adoption decisions are modeled on anempirical survey inspired by the Theory of Planned Behavior (see Ajzen, 1991), whichstipulates a decision depends on the weighted sum of (1) the attitude towards theproduct, (2) the subjective norm, i.e. the ratio of an agent’s adopting peers and (3) theperceived behavior control, which is the subjective effort of implementation (see Schwarzand Ernst, 2009, Fig. 1 & 2). These three criteria are partly sensitive to the lifestyle (whichweigh decision criteria differently) and the specific sustainable technologies analyzed(which have product properties regarding these criteria).
Schwarz modeled the adoption choice with 13 parameters, which are derived fromsurveyed stated preferences. In the resulting ABM, some lifestyles are modeled torationally deliberate on technology adoption, whereas others use a decision heuristicof bounded rationality. Postmaterialists and Social Leaders compare and weigh manyproduct characteristics to reach an adoption decision (Schwarz, 2007). Therefore,they are modeled to deliberate but not be influenced by the subjective norm.Conversely, Hedonists, Mainstream, and Traditionalist lifestyles consider fewer criteriawhen deciding on adoption of technology. They are modeled to apply the so-calledtake-the-best heuristic, i.e. they decide according to the most important stated decisioncriterion that clearly favors one choice option. If the most important criterion doesnot clearly favor one option decision, the next most important criterion is used. If no

2
26 2. CO-DIFFUSION FRAMEWORK
clear decision can be reached, agents imitate the majority of their peers. Note that thesubjective norm may be one decision criterion, and that the social environment hencemay have an effect on these lifestyles.
For the scenario of diffusing water-saving shower heads for which Schwarz and Ernsthave implemented the ABM, this detailed empirical decision model is mathematicallyequivalent to simpler decision rules: If deciding, each lifestyle—according toa specific probability—either adopts the technology or decides according to themajority of its peers. Lifestyles that deliberate are always deciding in favor of theenvironmental-friendly option. The Mainstream and Traditionalist lifestyles adoptwater-saving shower heads with a probability of 0.5 and imitate the majority of theirpeers otherwise. Households of the Hedonistic lifestyle always imitate the majority oftheir peers. Because only three different decision rules exist for five lifestyles, we aregrouping the lifestyles according to their decision-making rules.
Behavior diffusion The model by Anderson et al. (2014) captures how energyconsumption behavior spreads in social networks and describes how households changethe energy they consume by social influence. Thereby, the greater the difference inbehavior between a household and its social environment, the greater is the household’smotivation to change behavior towards its peers (Festinger, 1962).
Behavior diffusion is described by a general social influence model, see Eq. 2.1.
βi ,t =βi ,t−1 + si ·
(
N∑
j=1wi j ·β j ,t−1
N∑
j=1wi j
−βi ,t−1
)
(2.1)
The energy consumption behavior (βi ,t ) of an individual (i ) at a certain time (t )depends first on her previous energy consumption (βi ,t−1) and second on how much theprevious energy consumption of her N−1 peers (β j ,t−1) differs from the individual’s ownenergy consumption, weighted by the strength of social ties (wi j ). Behavioral changeaccording to the second factor is scaled by the individual’s susceptibility to subjectivenorms (si ).
This model captures empirical phenomena of behavior diffusion that other modelsdo not (see Chen et al., 2012; Zhang and Nuttall, 2012; Azar and Menassa, 2014). First,in addition to spreading more stringent energy conservation, more stringent energyconservation can diffuse. The model thus captures the boomerang effect (see section2.3). Second, individual susceptibility to behavior diffusion (si ) provides one way tocapture habits. According to the model, if an agent’s behavior were habitual, si wouldbe lower and behavior would thus change (significantly) slower. This model, however,does not capture the processes of habit formation and reinforcement.
2.4.3. INTEGRATING TWO EXISTING MODELS INTO A COMBINED MODEL
Rather than developing a model from scratch, we emphasize the importanceof integrating these two selected existing models into one combined model toimplement the proposed framework. Continuing to develop existing models promotes
2.4. MODEL DEVELOPMENT
2
27
good scientific discourse because existing models strengthen the empirical andmethodological basis of a new model directly and transparently (Windrum et al., 2007).It thus roots the model developed in this study directly in existing knowledge. It alsofurthers knowledge on the existing model. This transfer of model validity is also calledTAPAS validation, which is abbreviated from Take A Previous model and Add Something(Frenken, 2004).
In the following, we present the integration of the two existing models in four steps:First, we discuss their theoretical alignment, given their theoretical differences. Second,model adaptions were made to them to make them compatible and to transfer themto the case of heating feedback devices. Third, we re-implemented them according tothese adaptions. Finally, these two models were linked via the effect of adopted feedbackdevices on heating behavior and a social network based on empirical data.
Theoretical alignment Despite their strong similarities, the two combined modelshave theoretical differences. Both model how innovations diffuse and emphasize socialnetwork interactions as their driver. However, two differences remain.
First, the behavior diffusion sub-model emphasizes imitation between agents,whereas the technology diffusion sub-model assumes mixed deliberation and imitation.This disparity is justified by varying levels of uncertainty in both decisions (Festinger,1954) and has been successfully applied in previous ABMs (e.g. Janssen and Jager,1999). On the one hand, adoption of a household device involves a one-time decision,based upon the perceived device properties. For example, a feedback device needsto be purchased and installed only once and thereafter remains active. Because thisis a one-time action, it involves a delimited process of deliberation, which is drivenby intentions. Conversely, behavior change “must be repeated or continual to achievemaximum energy-savings: they rarely cost money, but they do ask change in habit andlifestyle adjustment...” (Han et al., 2013, p. 707). Repetitive actions, which lack adelimited deliberation process, are thus less rational and, importantly, are commonlyhighly uncertain in their energy related effects (see Costanza et al., 2012).
Second, due to different qualities of available empirical knowledge, the modelsdiffer in household heterogeneity. The model of Schwarz and Ernst differentiatesbetween lifestyle groups, while the model of Anderson does not. However, we arguethis difference in detail does not compromise the theoretical compatibility of the twomodels.
Model adaptions The technology diffusion model by Schwarz and Ernst (2009) hadto be reinterpreted as a model of individual households, which involved changes tothe social network. Originally, the model uses spatially aggregated household agents(i.e. each represents all households of one lifestyle within one square kilometer) whichare connected in a small-world network. When diffusing novel technologies, the initialphase of diffusion is relevant, where only a few adopters exist. Therefore, a higherresolution is more appropriate for representing these few first adopters. We thus assumethe agents represent individual households in a social network.
Because detailed adoption decision models for heating feedback devices are notavailable yet, we use water saving shower heads, which are better researched by Schwarz
2
28 2. CO-DIFFUSION FRAMEWORK
and Ernst (2009), as a proxy technology. In this conceptual study, a proxy technologyneeds to meet the requirement of being qualitatively similar regarding its diffusion (e.g.the device should be preferred by the same lifestyle groups). We argue our model meetsthis requirement, because they generally serve the same function in households: theysave energy related resources (i.e. hot water and space heating energy, respectively) indaily household routines. Further, both technologies are similar according to at leastthree of Rogers’ (2003) innovation characteristics: Compatibility (i.e. which socioculturalvalues and beliefs are affected by the innovation) is similar, as the technologies bothconserve thermal energy linked to daily consumption behavior and are both installedinside the household. Complexity (i.e. perceived difficulty of use) is low for bothtechnologies. Water saving shower heads are quickly installed. Likewise, messages fromfeedback devices should be self-explanatory. Trialability (i.e. “the degree to which aninnovation may be experimented with on a limited basis”, (Rogers, 2003, p. 16)) is alsosimilar, because both devices are low-cost and easy to start and discontinue within thehousehold.
The behavior diffusion model by Anderson et al. (2014) need not be adapted tobe integrated into the combined model. The behavior state variable was altered torepresent heating behavior, defining the modeled heating behavior as average spaceheating temperature. This function was chosen because heating temperature significantaffects energy consumption in buildings (Guerra Santin et al., 2009).
Reimplementation The existing models were re-implemented in the NetLogoframework (Tisue and Wilensky, 2004). Previously, the model by Schwarz and Ernst(2009) had been implemented in Java. Because the initial model implementationwas not completely available, re-implementation was based on a PhD thesis (seeSchwarz, 2007). The model by Anderson et al. (2014) had been implemented in theRepast J 3.0 framework (North et al., 2013). Being structurally simple, this model wasre-implemented based on Eq. 2.1.
Linking existing models to implement the framework To implement the framework,we considered how feedback technology affected heating behavior for adoptinghouseholds. Modeled by Eq. 2.2, we assume that feedback devices alter behavior towardsan incentivized level (β∗
∞) and that this behavioral change proceeds asymptotically (withthe rate of ∆β).
βt =βt−1 + (β∗∞−βt−1) ·∆β (2.2)
The principle of an incentivized target behavior is demonstrated, for example, by theE-quarium, which offers its most positive heating feedback only if the room temperatureis at the normative goal of 18◦C. An asymptotic learning curve is appropriate becauseit simulates two important aspects regarding behavioral change. First, a steadilydecreasing behavioral change effect of feedback technology. At later stages, userengagement in feedback can decrease, suggesting the early phase of feedback isthe most important for behavioral change (see Peschiera et al., 2010). Second, theasymptotic learning curve suggests feedback has a higher potential to alter behavior ifthe normative goal of feedback is significantly different from the user behavior. This is
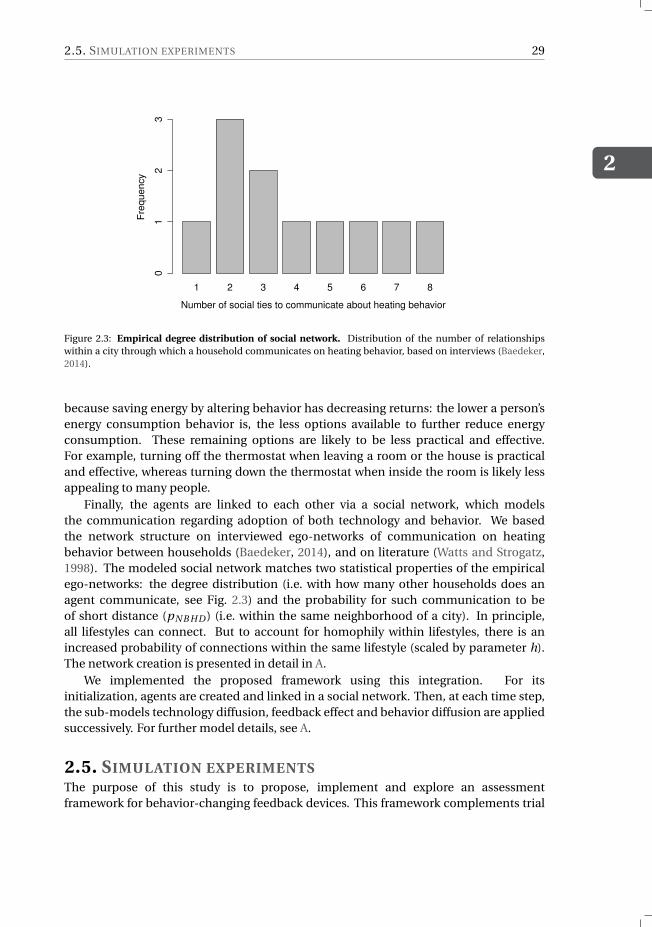
2.5. SIMULATION EXPERIMENTS
2
29
1 2 3 4 5 6 7 8
Number of social ties to communicate about heating behavior
Fre
quency
01
23
Figure 2.3: Empirical degree distribution of social network. Distribution of the number of relationshipswithin a city through which a household communicates on heating behavior, based on interviews (Baedeker,2014).
because saving energy by altering behavior has decreasing returns: the lower a person’senergy consumption behavior is, the less options available to further reduce energyconsumption. These remaining options are likely to be less practical and effective.For example, turning off the thermostat when leaving a room or the house is practicaland effective, whereas turning down the thermostat when inside the room is likely lessappealing to many people.
Finally, the agents are linked to each other via a social network, which modelsthe communication regarding adoption of both technology and behavior. We basedthe network structure on interviewed ego-networks of communication on heatingbehavior between households (Baedeker, 2014), and on literature (Watts and Strogatz,1998). The modeled social network matches two statistical properties of the empiricalego-networks: the degree distribution (i.e. with how many other households does anagent communicate, see Fig. 2.3) and the probability for such communication to beof short distance (pN B HD ) (i.e. within the same neighborhood of a city). In principle,all lifestyles can connect. But to account for homophily within lifestyles, there is anincreased probability of connections within the same lifestyle (scaled by parameter h).The network creation is presented in detail in A.
We implemented the proposed framework using this integration. For itsinitialization, agents are created and linked in a social network. Then, at each time step,the sub-models technology diffusion, feedback effect and behavior diffusion are appliedsuccessively. For further model details, see A.
2.5. SIMULATION EXPERIMENTS
The purpose of this study is to propose, implement and explore an assessmentframework for behavior-changing feedback devices. This framework complements trial
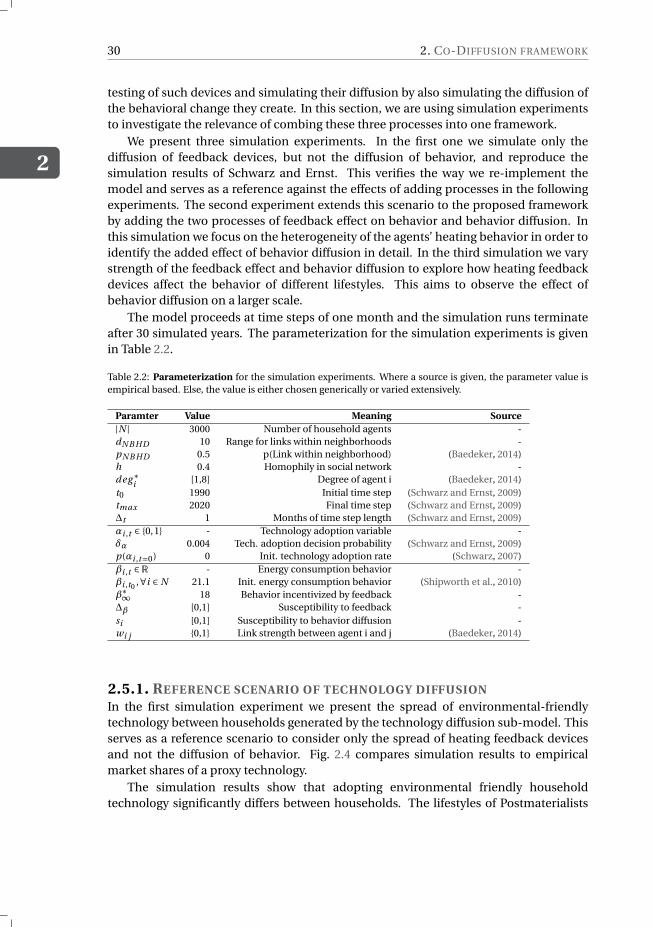
2
30 2. CO-DIFFUSION FRAMEWORK
testing of such devices and simulating their diffusion by also simulating the diffusion ofthe behavioral change they create. In this section, we are using simulation experimentsto investigate the relevance of combing these three processes into one framework.
We present three simulation experiments. In the first one we simulate only thediffusion of feedback devices, but not the diffusion of behavior, and reproduce thesimulation results of Schwarz and Ernst. This verifies the way we re-implement themodel and serves as a reference against the effects of adding processes in the followingexperiments. The second experiment extends this scenario to the proposed frameworkby adding the two processes of feedback effect on behavior and behavior diffusion. Inthis simulation we focus on the heterogeneity of the agents’ heating behavior in order toidentify the added effect of behavior diffusion in detail. In the third simulation we varystrength of the feedback effect and behavior diffusion to explore how heating feedbackdevices affect the behavior of different lifestyles. This aims to observe the effect ofbehavior diffusion on a larger scale.
The model proceeds at time steps of one month and the simulation runs terminateafter 30 simulated years. The parameterization for the simulation experiments is givenin Table 2.2.
Table 2.2: Parameterization for the simulation experiments. Where a source is given, the parameter value isempirical based. Else, the value is either chosen generically or varied extensively.
Paramter Value Meaning Source
|N | 3000 Number of household agents -dN B HD 10 Range for links within neighborhoods -pN B HD 0.5 p(Link within neighborhood) (Baedeker, 2014)h 0.4 Homophily in social network -deg∗
i [1,8] Degree of agent i (Baedeker, 2014)t0 1990 Initial time step (Schwarz and Ernst, 2009)tmax 2020 Final time step (Schwarz and Ernst, 2009)∆t 1 Months of time step length (Schwarz and Ernst, 2009)αi ,t ∈ {0,1} - Technology adoption variable -δα 0.004 Tech. adoption decision probability (Schwarz and Ernst, 2009)p(αi ,t=0) 0 Init. technology adoption rate (Schwarz, 2007)βi ,t ∈R - Energy consumption behavior -βi ,t0 ,∀i ∈ N 21.1 Init. energy consumption behavior (Shipworth et al., 2010)β∗∞ 18 Behavior incentivized by feedback -∆β [0,1] Susceptibility to feedback -si [0,1] Susceptibility to behavior diffusion -wi j {0,1} Link strength between agent i and j (Baedeker, 2014)
2.5.1. REFERENCE SCENARIO OF TECHNOLOGY DIFFUSION
In the first simulation experiment we present the spread of environmental-friendlytechnology between households generated by the technology diffusion sub-model. Thisserves as a reference scenario to consider only the spread of heating feedback devicesand not the diffusion of behavior. Fig. 2.4 compares simulation results to empiricalmarket shares of a proxy technology.
The simulation results show that adopting environmental friendly householdtechnology significantly differs between households. The lifestyles of Postmaterialists
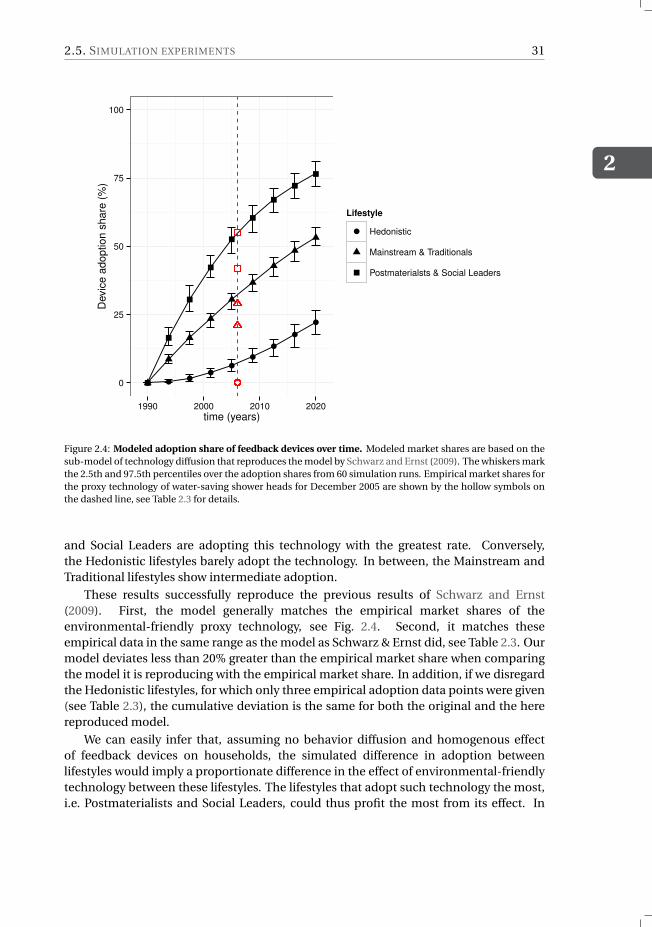
2.5. SIMULATION EXPERIMENTS
2
31
0
25
50
75
100
1990 2000 2010 2020
time (years)
Devic
e a
do
ptio
n s
ha
re (
%)
Lifestyle
Hedonistic
Mainstream & Traditionals
Postmaterialsts & Social Leaders
Figure 2.4: Modeled adoption share of feedback devices over time. Modeled market shares are based on thesub-model of technology diffusion that reproduces the model by Schwarz and Ernst (2009). The whiskers markthe 2.5th and 97.5th percentiles over the adoption shares from 60 simulation runs. Empirical market shares forthe proxy technology of water-saving shower heads for December 2005 are shown by the hollow symbols onthe dashed line, see Table 2.3 for details.
and Social Leaders are adopting this technology with the greatest rate. Conversely,the Hedonistic lifestyles barely adopt the technology. In between, the Mainstream andTraditional lifestyles show intermediate adoption.
These results successfully reproduce the previous results of Schwarz and Ernst(2009). First, the model generally matches the empirical market shares of theenvironmental-friendly proxy technology, see Fig. 2.4. Second, it matches theseempirical data in the same range as the model as Schwarz & Ernst did, see Table 2.3. Ourmodel deviates less than 20% greater than the empirical market share when comparingthe model it is reproducing with the empirical market share. In addition, if we disregardthe Hedonistic lifestyles, for which only three empirical adoption data points were given(see Table 2.3), the cumulative deviation is the same for both the original and the herereproduced model.
We can easily infer that, assuming no behavior diffusion and homogenous effectof feedback devices on households, the simulated difference in adoption betweenlifestyles would imply a proportionate difference in the effect of environmental-friendlytechnology between these lifestyles. The lifestyles that adopt such technology the most,i.e. Postmaterialists and Social Leaders, could thus profit the most from its effect. In

2
32 2. CO-DIFFUSION FRAMEWORK
Table 2.3: Comparison of model reproduction with results of Schwarz and Ernst (2009) and empirical marketshares.
Lifestyle Model result a Original model b Market share c
Postmaterialists 51 53 55 (n=35)Social leaders 51 53 42 (n=24)Mainstream 32 18 29 (n=28)Traditionalists 32 18 21 (n=21)Hedonistic 5 0 0 (n=3)
a Mean adoption share (%) at simulation time December 2005.b Adoption share (%) postdicted by Schwarz and Ernst (2009) at simulation time December 2005.c Empirical market share (%) provided by Schwarz and Ernst (2009) for December 2005 (n ≡ sample size).
contrast, the Hedonistic lifestyles could not profit from the energy-saving effects of thistechnology.
2.5.2. ADDING FEEDBACK EFFECT AND BEHAVIOR DIFFUSION
In the second simulation experiment, we added to the above reference scenario theeffect that feedback devices have on households’ heating behavior as well as behaviordiffusion. We assumed a fixed feedback effect strength which is identical for all lifestyles(∆β = 0.1) and varied the level of behavior diffusion (si ), the latter one being theinnovative component we have added to previous studies and thus of specific interestto us.
In this scenario, we are interested in the change of agent heating behavior. We focuson heterogeneity of the agents’ behavior because there are two contradictory processesat work: adopting feedback devices lead to behavioral change of (only) those householdsthat have adopted and thus tend to increase heterogeneity of behavior; and behaviordiffusion tends to smoothen the differences and make households more homogeneous.The interaction effects of these processes are not obvious but determine how behaviordiffusion affects overall energy consumption.
The results of typical single simulation runs are shown in Fig. 2.5. For each levelof behavior diffusion strength, a separate plot is shown. For each time step, wevisualized the distribution of agents’ heating behavior, i.e. their individual room heatingtemperature. Additionally, the aggregated average space heating temperature of allagents is plotted for each time step. We limited the observation to agents of the lifestylesof Social Leaders, the lifestyle group that most rapidly adopted feedback devices. Thislifestyle group was thus expected to show a clear contrast in heating behavior betweenadopters and non-adopters.
The Figure shows that feedback devices have a different overall effect at differentlevels of behavior diffusion, regarding heterogeneity of agents’ behavior and changeof average behavior. For all behavior diffusion levels, the agents’ heating behaviorshifts from the initial temperature of 21.1◦C towards 18.0◦C, the temperature beingincentivized by feedback devices. The distinction between the levels of behaviordiffusion appears to be especially clear because the process of behavior change inducedby the feedback devices operates on time-scales that are much shorter than theprocess of the diffusion of the devices. Yet, greater behavior diffusion causes (1), less
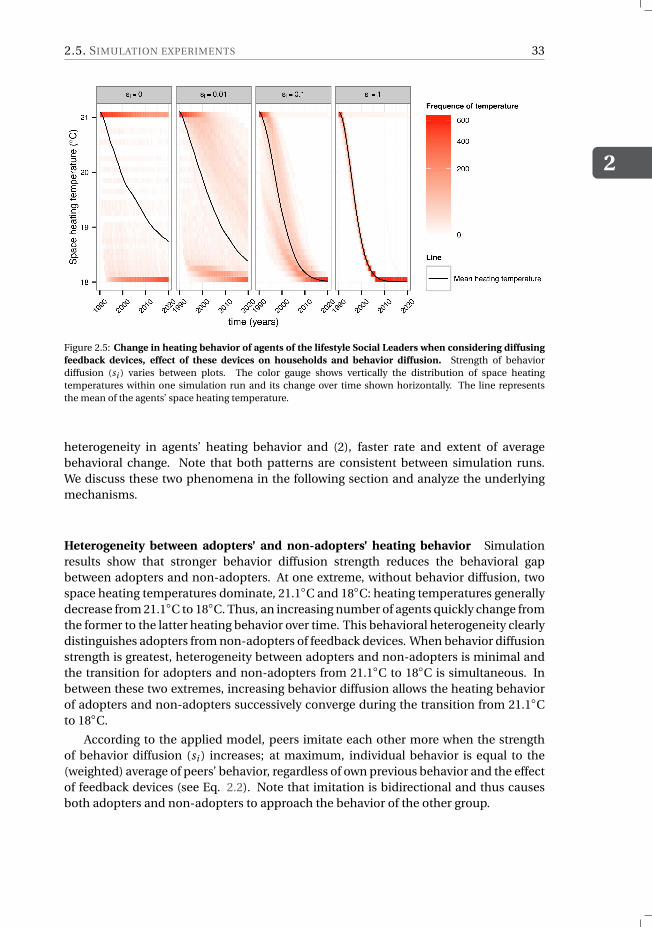
2.5. SIMULATION EXPERIMENTS
2
33
Figure 2.5: Change in heating behavior of agents of the lifestyle Social Leaders when considering diffusing
feedback devices, effect of these devices on households and behavior diffusion. Strength of behaviordiffusion (si ) varies between plots. The color gauge shows vertically the distribution of space heatingtemperatures within one simulation run and its change over time shown horizontally. The line representsthe mean of the agents’ space heating temperature.
heterogeneity in agents’ heating behavior and (2), faster rate and extent of averagebehavioral change. Note that both patterns are consistent between simulation runs.We discuss these two phenomena in the following section and analyze the underlyingmechanisms.
Heterogeneity between adopters’ and non-adopters’ heating behavior Simulationresults show that stronger behavior diffusion strength reduces the behavioral gapbetween adopters and non-adopters. At one extreme, without behavior diffusion, twospace heating temperatures dominate, 21.1◦C and 18◦C: heating temperatures generallydecrease from 21.1◦C to 18◦C. Thus, an increasing number of agents quickly change fromthe former to the latter heating behavior over time. This behavioral heterogeneity clearlydistinguishes adopters from non-adopters of feedback devices. When behavior diffusionstrength is greatest, heterogeneity between adopters and non-adopters is minimal andthe transition for adopters and non-adopters from 21.1◦C to 18◦C is simultaneous. Inbetween these two extremes, increasing behavior diffusion allows the heating behaviorof adopters and non-adopters successively converge during the transition from 21.1◦Cto 18◦C.
According to the applied model, peers imitate each other more when the strengthof behavior diffusion (si ) increases; at maximum, individual behavior is equal to the(weighted) average of peers’ behavior, regardless of own previous behavior and the effectof feedback devices (see Eq. 2.2). Note that imitation is bidirectional and thus causesboth adopters and non-adopters to approach the behavior of the other group.
2
34 2. CO-DIFFUSION FRAMEWORK
Speed of change in average behavior At higher levels of behavior diffusion, the meanagent heating temperature decreases faster. Without behavior diffusion, a decreasingaverage heating behavior mirrors the increasing adoption of feedback devices. Forinstance, at the simulation year 2005, ca. 50% of Social Leaders adopt feedback devices(see 2.5.1). At the same time step, mean heating behavior has reached approximatelyhalf way from 21.1◦C to 18◦C. At increasing levels of behavior diffusion, the transitionfrom 21.1◦C to 18◦C speeds up.
We argue that bidirectional imitation between agents alone fails to explain theincreasing speed of change in average behavior. This is because even though adoptersinfluence non-adopters towards lower heating temperatures, non-adopters similarlyinfluence adopters to a similar extent. Behavior diffusion simply distributes thebehavioral change from feedback devices between adopters and non-adopters. Becausebehavior diffusion is bidirectional, it can only result in a zero-sum game.
Instead, we argue that this phenomenon is caused by an interaction betweenthe feedback effect and behavior diffusion. The feedback effect varies dependingon the adopters’ level of heating temperatures. As soon as adopters approachheating temperatures of 18◦C, no further behavioral change occurs, which couldbe ‘redistributed’. In contrast, at greater behavior diffusion, behavior heterogeneitybetween adopters and non-adopters decreases and adopters thus heat at highertemperatures. These higher heating temperatures increase the effect of feedbackdevices due to the modeled asymptotic feedback effect function. Additionally, behaviordiffusion more efficiently distributes this effect.
In summary, stronger behavior diffusion leads to two phenomena. First, decreasedheterogeneity of heating temperatures between adopters and non-adopters of feedbackdevices. Second, feedback devices motivate a faster transition to this behavior. The firstphenomenon is influenced by agents imitating each other. The second by a combinationof three factors: (1) greater behavior diffusion causes adopters and non-adopters toconverge in their behavior, (2) which causes higher heating temperatures for adopterswhose behavior is consequently more effected by feedback devices, and (3) at high levelsof behavior diffusion, this greater effect can be efficiently distributed between adoptersand non-adopters.
2.5.3. VARIATION IN FEEDBACK EFFECT AND BEHAVIOR DIFFUSION
With the following simulation experiment, we examine the effect of added behaviordiffusion when different lifestyles are considered simultaneously: Which social groupsare most affected by this effect? How does this effect differ between social groups?
As indicators we use the mean space heating temperatures of the households of eachlifestyle. Detailed simulation settings are given in Table 2.2.
We both varied the strength of behavior diffusion (si ) and the feedback effect onbehavior (∆β), to systematically observe their added effect. This variation is motivatedby uncertainty about de facto speeds of these sub-processes (see Anderson et al., 2014).We vary the parameters as follows to compare four scenarios:
• Scenario 1: Feedback does not change behavior (∆β = 0),

2.5. SIMULATION EXPERIMENTS
2
35
• Scenario 2: Feedback changes behavior, but behavior diffusion is not present (0 <
∆β < 1∧ si = 0)
• Scenario 3: Feedback and behavior diffusion act at intermediate strengths (0 <
∆β <= 1∧0 < si <= 1)
• Scenario 4: Both feedback and behavior diffusion act at maximum strengths (∆β =
1∧ si = 1)
Figure 2.6: Median of average space heating temperature of lifestyles over time. Varying strength of feedbackeffect (∆β) and behavior diffusion (si ). The multivariate timelines were clustered statistically to highlightmodel sensitivity. Line dashing represents the clustering result for each parameter combination (see legend).Whiskers show the empirical 2.5th and 97.5th percentiles of the lifestyles’ average heating temperature of 25simulation runs each.
The simulation results for these scenarios are shown in Fig. 2.6. Between thescenarios, mean heating behavior of the respective lifestyles differs significantly. This isconfirmed by statistical clustering of the simulation results separating these scenarios.1
1Each simulation run resulted in one multivariate timeline of average space heating temperatures over time,distinguished by the different lifestyles. The pairwise distance between these multivariate timelines was
2
36 2. CO-DIFFUSION FRAMEWORK
In scenario 1, in which technology does not change behavior (∆β = 0), overall energyconsumption behavior remains unchanged for all lifestyles. Thus, as can be expected,with no behavioral change, behavior diffusion simply has no added effect.
In scenario 2 (with feedback effect but without behavior diffusion), the pattern ofbehavioral change is similar to that when feedback devices are adopted. Feedbacktechnology changes energy consumption behavior of adopters, but this behavior doesnot diffuse. Thus, behavioral change is directly determined by technology adoption (seeTable 2.3). As with the first simulation experiment, Postmaterialists and Social Leaderswere similarly affected first and to the highest degree. Mainstream and traditionallifestyles were affected shortly after. The Hedonistic lifestyle was affected last and tothe lowest degree. The behavioral change over time was not sensitive to the strength offeedback effect on behavior (∆β). We assume this to be caused by households adoptingtechnology relatively slowly compared to the time-scales on which the feedback effectoperates.
In scenario 3 (with both feedback effect and behavior diffusion at intermediatelevels), stronger behavior diffusion caused smaller differences in behavior betweenlifestyles, and absolute levels of energy consumption of all lifestyles decreased. Atmaximal behavior diffusion within this scenario, the differences in behavior seeminglydisappeared, similar to those observed in section 5.2. For agents of the Hedonisticlifestyle, stronger behavior diffusion led to significantly lower room temperaturecompared to without behavior diffusion. A similar effect occured for the other lifestyles,but to a lesser extent. Thus, the less a lifestyle adopted technology the higher the addedeffects of behavior diffusion to its heating behavior. Of note, even the leading lifestyles(Postmaterialists and Social Leaders) reduce room temperature quicker if behaviordiffusion is assumed, i.e. the additional ‘redistribution’ of changed behavior to otherlifestyles does not (over-)compensate the effect discussed in section 5.2.
In scenario 4 (both feedback effect and behavior diffusion at maximum level),heating behavioral changed the quickest for all lifestyles, implying a synergistic effectof technology and behavior diffusion on energy consumption behavior.
2.6. DISCUSSION AND CONCLUSIONS
In this study, we have proposed, implemented and simulated an assessment frameworkfor the overall effect of heating feedback devices on energy consumption. Thisframework includes the process of behavior diffusion for assessing heating feedbackdevices, which commonly considers their direct effect on adopters and, to a lesser extent,how devices diffuse between (potential) adopters.
This study confirms our initial proposition: the relevance of incorporating behaviordiffusion into the assessment of such devices. Simulations revealed two mechanismsbehind behavior diffusion driving the overall effect of heating feedback devices.First, behavior diffusion spreads the effect of feedback devices between adopters andnon-adopters. It thus not only decreases heterogeneity of these two groups’ behavior butalso introduces a qualitative difference compared to technology diffusion by reaching
defined by their Manhattan distance. Hierarchical clustering into 4 groups was conducted applying Ward’sminimum variance method.

2.6. DISCUSSION AND CONCLUSIONS
2
37
non-adopters of devices. Second, simulations show behavior diffusion can considerablyspeed up the overall behavioral change caused by feedback devices. The convergenceof energy-consumption behavior between adopters and non-adopters slows downadopters reaching the energy conservation level incentivized by feedback devices. Thisprolongs the effect of feedback devices on adopters, which is further propagated tonon-adopting households through behavior diffusion.
In summary, we observe that behavior diffusion contributes significantly to theoverall effect of feedback devices on energy consumption. Without behavior diffusion,lifestyles are only affected according to their share in adopting technology. Behaviordiffusion reduces the differences in behavior between adopters and non-adopters and,when interacting with the feedback effect, synergistically increases the speed and degreeof behavioral change for all lifestyle groups so the overall effect of feedback devices isstronger.
This finding supports previous research highlighting the potential for behaviordiffusion to reinforce interventions for changing energy consumption behavior (seePeschiera et al., 2010; Chen et al., 2012; Anderson et al., 2014). In this chapter, weconfirmed such an added effect of behavior diffusion with heating feedback devicesexists, particularly when their simultaneous diffusion interacts.
2.6.1. IMPLICATIONS AND RECOMMENDATIONS
We focus on three aspects highlighting the implications of our study: (1) lessons on thedifference between behavior-changing feedback devices and automation technology,(2) the fruitful interaction of two existing fields of diffusion research and (3) futureapplications of the proposed framework.
First, we stress feedback devices that support energy conservation can spreadchanged behavior beyond households adopting these devices, thus creating the positiveexternality of benefiting more households. We assume that this kind of externality isnot specific to feedback devices, but to varying degrees inherent to any interventionthat changes energy consumption behavior. In contrast, energy efficiency devices thatdo not change behavior, such as domestic energy efficiency automation technology,do not provide this externality. For example, heating automation devices, e.g. GoogleNest, can potentially increase heating energy efficiency, but do not incentivize behaviorchange capable of spreading via behavior diffusion. These considerations underlinethe relevance of (also) analyzing behavior diffusion when assessing energy-efficiencydevices.
Second, we highlight the added value of integrating technology diffusion andbehavior diffusion models. In this study, integrating both types of diffusion modelsidentified indirect effects from feedback devices that normally would not emerge witheither diffusion model. We also assume interactions between these types of diffusionsmight be relevant in contexts where the effect of technology is behavior change.
Third, the synergy between diffusion of feedback devices and energy conservationencourages further research with this framework. This includes refining the simulationmodel to empirical scenarios.

2
38 2. CO-DIFFUSION FRAMEWORK
2.6.2. LIMITATIONS AND FUTURE RESEARCH
Findings from the proposed technology assessment framework were based on asimulation model that integrates two existing models. The tight coupling between theconceptual framework and its implementation in this simulation model allowed us toanalyze its concepts and integrate the framework more generally. However, as the mainlimitation of this study, the findings lack empirical support. Improving the model withempirical data thus constitutes a major route for future work.
We outline below methods for developing the presented framework into a moreempirical-based model. Such a model would allow estimating more precisely theoverall effect of feedback devices on heating energy consumption. Conversely,behavior-changing feedback devices could be compared ex-ante in how they conserveenergy. Encompassing the mechanisms, speed and intensity of technology diffusion,feedback effect, and behavior diffusion for both applications should be based onempirical data. We present three practical steps for strengthening the empiricalfoundations required by both applications.
First, empirical data can make the model more realistic, e.g. by using patternoriented modeling (see Grimm et al., 2005). Collecting data on how society influencesenergy consumption behavior is particularly challenging. Yet, research on howhouseholds interact regarding energy conservation levels identifies patterns useful fordeveloping future model (see Baedeker, 2014; Nolan et al., 2008). In addition, fieldresearch in the realm on Living Labs and Smart Cities provides opportunities to gatherempirical data on influence between households (e.g. respective to their belonging tolifestyle groups) (see Pentland, 2014).
Second, another route forward is making the decision-making more specific toheating behavior than in the existing models. One possibility is using empirically-basedchoice modeling (see Araghi et al., 2014). This allows considering other effects onheating behavior, e.g. fuel price.
Third, current field tests of novel feedback devices, e.g. Transformational Products,can better estimate the direct effect of feedback on behavior (see Liedtke et al., 2015).Focus groups of field testing participants can further knowledge on accepting over longertimes periods, an important factor contributing to diffusion success (Rogers, 2003). Thisallows further investigation of the role habits play in the repeatedly observed relapse ofbehavior during long-term behavioral change interventions (see Peschiera et al., 2010;Chen et al., 2012).
Additionally, we can use the presented model to investigate heating feedbackdevices combined with energy-efficient retrofits of buildings, an important energyefficiency approach for the built environment (Guerra Santin et al., 2009). In thisstudy, we model the overall effect of ‘stand-alone’ feedback devices on heatingtemperatures. Alternatively, one could model the application of feedback devices whereboth approaches, i.e. renovation and behavioral change, interact. Investigating howinteraction of feedback devices and renovation interact is interesting as it has been foundthat retrofitting saves less energy (and heating costs) than expected due to the reboundeffect (Friege and Chappin, 2014), i.e. users commonly increase heating temperaturesafter energy-efficient renovations and hence decrease the energy efficiency gain from therenovation. The assessment framework we developed could help investigating the effect

2.6. DISCUSSION AND CONCLUSIONS
2
39
of feedback devices if they are available to households after energy-efficient renovations,e.g. through craft businesses.
2.6.3. CONCLUSION
Considering behavior diffusion when assessing behavior-changing feedback devices isimportant because it can significantly influence their overall effect. We identified twomechanisms through which behavior diffusion increases both the reach and speed ofbehavioral change induced by such devices.
We suggest that interventions that aim at changing behavior should exploitthis synergy for increasing their effects. The proposed framework is useful forbetter capturing and eventually assessing the effect of such interventions on energyconsumption behavior ex-ante.

3ENERGY-EFFICIENCY IMPACTS OF
AN AIR-QUALITY FEEDBACK DEVICE
“It’s a dangerous business, Frodo, going out your door.You step onto the road, and if you don’t keep your feet,
there’s no knowing where you might be swept off to.”
J.R.R. Tolkien
3.1. INTRODUCTION
The main factors that determine energy demand of houses are (1) the climate, (2)building properties, e.g. heat permeability of building envelope, (3) efficiency of installedheating technology, and (4) the heating behavior of households, e.g. how to heat andhow to ventilate rooms (Pérez-Lombard et al., 2008; Gill et al., 2011). In this paper, thefocus lies on household behavior, which is an important pillar for reduction of energyconsumption (Tukker et al., 2010). For instance, identical buildings can vary by a factorof over 3 between minimum and maximum energy consumption, only due to differentusers (Gill et al., 2011).
Interventions that persuade households to practice energy-efficient heatingbehavior are an attractive approach to reduce heating energy consumption with lowoverall effort. Two important advantages of focusing on household behavior are that (1)it is a low-cost option to mitigate CO2 emissions (Birol, 2008), as no significant financialinvestment is required (Dahlstrom et al., 2012) and (2) behavior interventions are lessprone (in comparison to building insulation) to trigger rebound effects in domesticheating (see Friege and Chappin, 2014). One example of efficient heating behavioris ‘shock-ventilation’ (SV) (i.e. completely opening windows for 5 minutes two to four
This chapter has been published as Jensen, T., Holtz, G., Baedeker C., Chappin, E.J.L., 2016. Energy-efficiencyimpacts of an air-quality feedback device in residential buildings: an agent-based modeling assessment.Energy and Buildings 116.
41
3
42 3. ENERGY-EFFICIENCY IMPACTS OF AN AIR-QUALITY FEEDBACK DEVICE
times per day), which saves up to ca. 25% of heating energy—with an average of ca.8%—compared to commonly practiced trickle ventilation (i.e. ventilating at low flowof air, e.g. by opening windows only slightly)1 (Grinewitschus et al., 2013; Lovric, 2015).Previous studies showed that these savings rely on both the quicker ventilation rate andon preventing the too long ventilation times of trickle-ventilation (Galvin, 2013).
Devices that provide feedback to households on their heating behavior appearpromising as a means to change these routines. Their installation in households leadsto a relatively high frequency of interaction with their users, supporting habituation ofnew behavior (Jager, 2003). One such device is the ‘CO2 meter’, which visualizes indoorair-quality (measured by CO2 level) in the colors of a traffic light. This feedback provedsuccessful at persuading its users to practice SV behavior and to save heating energy(see 3.3.2). Such behavior change of device users is commonly identified by combinedmonitoring of behavior and energy consumption (Guerra Santin et al., 2009) (e.g. in‘Living Labs’ in which interventions are tested in the users’ real life surroundings (Liedtkeet al., 2015)). The direct stimulation of behavior change within adopting households—inthe following referred to as ‘feedback effect’—, is the keystone of the impact of a feedbackdevice.
However, the effect of the ‘CO2 meter’ in a multi-household setting on a larger scale,such as a city, depends on additional processes (Jensen et al., 2015): (1) The technologydiffusion of the feedback device among households, by which more households areexposed to feedback. Market research methods can give insights into future marketdiffusion of household devices. This ranges from qualitative field experimenting (Rogers,2003, pp. 71) to quantitative simulation models that project future diffusion (Schwarzand Ernst, 2009; Sopha et al., 2013; Kiesling et al., 2012). (2) The diffusion of changedbehavior via social influence that adopters exceed on non-adopters in their socialenvironment. Social influence is a strong motivation for behavior change (Nolan et al.,2008; Liedtke et al., 2013) and thus has the potential to influence the overall effect offeedback devices (Jensen et al., 2015). The effect of feedback devices within households,the diffusion of devices, and diffusion of (changed) behavior have commonly beenresearched separately (Chen et al., 2012; Jain et al., 2013; Ekpenyong et al., 2014; Azar andMenassa, 2015). However, Jensen and Chappin (2014) have shown that interactions ofdevice diffusion and behavior diffusion, coined co-diffusion of technology and behaviorcan induce effects that become only visible from the holistic perspective.
Assessing the overall effect of feedback devices beyond single households can beachieved by simulation modeling. This can be done by integrating the above outlinedprocesses into one model. Agent-based modeling has been used successfully for thisintegration (Jensen et al., 2015), because it allows direct modeling on existing empiricaland theoretical knowledge (van Dam et al., 2012). This previous modeling approachshould be refined into a more empirical-based model, in order to allow a realisticassessment of the magnitude of the impact of feedback devices.
In this paper, we therefore assess the impact from the ‘CO2 meter’ via anempirically-based agent-based model (ABM) that integrates feedback effect and thediffusions of technology and behavior. To support practical applications with moreinsight, also the contributions of sub-processes to this impact are quantified. This
1Practicing SV can also consume more energy, e.g. compared to not ventilating rooms at all.

3.2. BACKGROUND
3
43
aims to answer the following question: what is the overall effect of the ‘CO2 meter’ onenergy-efficient heating behavior, as emerging from its sub-processes of feedback effect,technology diffusion and behavior diffusion? The remainder of this paper is structuredas follows. First, the functioning of behavior-changing feedback devices is explained,using the example of the ‘CO2 meter’. Second, the framework used to analyze the effectof this device in a multi-household setting is described. Third, a novel simulation modelis introduced that projects the potential future impact of the ‘CO2 meter’ on heatingbehavior within the city of Bottrop, Germany. This model is developed and calibratedbased on empirical research conducted by some of the authors. 2 Finally, simulationexperiments are analyzed in order to answer the stated research question.
3.2. BACKGROUND
In this section is presented how the ‘CO2 meter’ affects behavior of its users. Further, itshows how it unfolds its overall effect in a multi-household setting.
3.2.1. FEEDBACK EFFECT OF DEVICE TO ITS USERS
The success of the ‘CO2 meter’ in reducing heating demand bases on its relativeadvantage3, perceived by its users, and on its conscious and its pre-conscious influenceon them.
Use of the ‘CO2 meter’ is motivated by its assistance to improve indoor air quality asa means to health and air quality comfort, which has a relative advantage over manualventilation without knowing CO2 levels. Previous research showed that a ‘CO2 meter’ canchange behavior and improve indoor air-quality significantly (Geelen et al., 2008). As thefocus of ventilation during the heating period lies mainly on thermal comfort (Griffithsand Eftekhari, 2008; Santamouris et al., 2008), feedback can shift this focus towardsair-quality. Energy savings from incentivized SV behavior are a positive side-effect tothis, which can additionally motivate use of the device.
A feedback device, such as ‘CO2 meter’, can influence the heating behavior of itsusers (Jensen et al., 2015) via two routes: (1) via information it persuades users to startand to stop ventilation. Even though households can be aware of air quality, additionalinformation can lead to reinterpretation and thus to conscious and intentional behaviorchange. (2) via supporting habituation of changed ventilation behavior. Habits areaction sequences triggered by environmental cues and performed without significantdeliberation. Repeatedly practicing a habit with positive outcome increases its strength,making it self-reinforcing and relatively stable (Jager, 2003). Combining the two routes ofinformation provision and support of habituation, new habits would form starting frominitially conscious interactions with the feedback device which are then more and moreenacted without extensive deliberation. For example, keeping track of exact CO2 levelswould convert into the habit of ventilating for a certain amount of time at certain timesof the day, e.g. after getting up in the morning. Thus, habit formation could stabilize thebehavior induced by the ‘CO2 meter’.
2This refers to the authors of the published journal paper. Model development and calibration was taken outexclusively by the author of this thesis.
3Relative advantage is “the degree to which an innovation is perceived as better than the idea it supersedes."(Rogers, 2003, p. 15).

3
44 3. ENERGY-EFFICIENCY IMPACTS OF AN AIR-QUALITY FEEDBACK DEVICE
However, the empirical evidence about long-term effects of feedback-devices ismixed. Some research suggests that behavior change from feedback devices relapseseventually (Peschiera et al., 2010). Conversely, others suggest conditions under whichbehavior relapse does not take place, e.g. if reoccurring feedback is intuitive (Jain, 2013),or if coming from a permanently installed device (Burchell et al., 2014). Also, ongoingbehavior change has been observed at particularly long-term exposure to feedbackdevices (Stromback et al., 2011). Due to these contradicting findings, the long-termeffect of the ‘CO2 meter’ on users can not be clearly deduced from experience with otherfeedback devices. Therefore, feedback effect was modeled to be neither relapsing, norincreasing, but to be constant over time.
3.2.2. OVERALL EFFECT OF FEEDBACK DEVICE
Figure 3.1 shows how the overall effect of a feedback device emerges from interactionsbetween individual households, based on an assessment framework by Jensen et al.(Jensen et al., 2015). Besides behavior change from feedback devices, central entitiesof this framework are households who make two decisions: whether to adopt a feedbackdevice and whether to practice SV behavior.
!"#$%&"'()*))
)
)
)
)
)
)
)
)
)
)
!%+,-.)
/%&+01"2)
3%014%)
*("5,"-)
!""#$%&'(
)*&+%,(+-./"-&"(
)*&+%,(+-./"-&"(
0-!*12%3*-(
42"#+%5(
0-!*12%3*-(
42"#+%5(
3%41$1"-)
60%-7)
3%41$1"-)
60%-7))))))
))!"#$%&"'()8)
)))))))))))))))))))))))!"#$%&"'()/)
Figure 3.1: Conceptual framework on the effect of behavior-changing feedback devices. Each of the threeshown households (A, B and C) has two roles: to decide on device adoption (bottom level) and on heatingbehavior (top level). These decisions are influenced by media information and social influence. Thosehouseholds that adopt a feedback device are also affected in their heating behavior by feedback from thedevice.
At ‘decision events’, households decide on the adoption of feedback devices andon which heating behavior to practice—but they do not decide on it continuously.For device adoption, there are certain windows of opportunity, e.g. when the devicebecomes available or when previous technology is replaced. Similarly, householdsdo not continuously deliberate on heating behavior. Daily repeated behavior iscommonly habitual, which limits its re-evaluation—and thus potential intrinsicbehavior change—to sporadic events. Due to the relative stability of habits (Jager,

3.3. METHODOLOGY
3
45
2003), external events are ideal to trigger the breaking of a habit. In the context ofventilation behavior, such triggering events can be changes of heating costs, householddemographics, the place of living, or the appearance of mold within the home. Suchevents can ‘unfreeze’ a habit environment, create a window of opportunity for consciousdeliberation and behavior change, and—via anew habit formation—‘refreeze’ into a(potentially changed) habit (Lewin, 1947).
Once a decision event occurs, the actual decisions on adoption of devices andSV behavior depend on both intrinsic factors of households and their environment.According to the Theory of Planned Behavior4 (Ajzen, 1991), adoption depends on theintention to do so, and intentions depend on the households’ attitudes towards theadoption choice, their perceived behavioral control over adoption and the subjectivenorm, i.e. the perceived adoption prevalence within their social environment. Wepropose information to have the potential to change attitude (i.e. persuading to adopt)and therefore to have an influence on adoption decisions. The importance of subjectivenorms (Nolan et al., 2008) motivates considering interactions in social networks and theeffect that adoption behavior of peers has on a particular household. The perceivedbehavioral control of households is assumed to be high, as ventilation behavior caneasily be changed.
The two diffusions of technology and behavior are connected by the effect that afeedback device has on heating behavior of a household. The diffusion of a feedbackdevice can change the behavior of device adopters. This changed behavior can theninfluence social norms in the social network of the adopting household. Through thischange in norms, the energy-efficient behavior can further diffuse among households,including to households that are either not using the feedback device or that are notinfluenced by it (Jensen et al., 2015).
3.3. METHODOLOGY
In this section, first, the use of agent-based modeling for our study is motivated.Thereafter, the simulation model developed to answer the research question ispresented.
3.3.1. AGENT-BASED MODELING
Agent-based modeling is a bottom-up simulation method. Agents are computer-objectsthat can correspond one-to-one to real-world entities (van Dam et al., 2012). Thus,an ABM can represent households with “agents [that] are programmed to interact inthe same ways as the real actors do and to experience the same constraints and haveaccess to the same knowledge” (van Dam et al., 2012, p. vi). Consequently, relevantempirical data (e.g. on households’ locations and their decision preferences concerninginnovations) can be incorporated into models without the need for further simplificationor abstraction. This has the added advantages of making behavior of agents relativelyeasy to understand and to communicate.
Agent-based modeling is suited to model the diffusion of innovations. According toRogers, “diffusion is the process by which an innovation is communicated through certain
4This theory is widely applied for decision modeling (Schwarz and Ernst, 2009; Sopha et al., 2013).
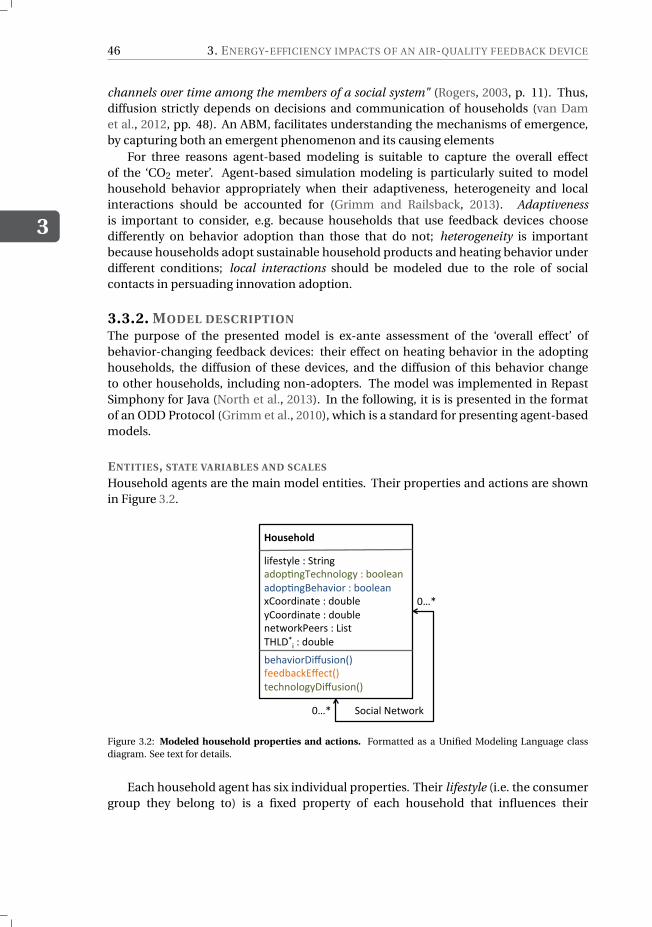
3
46 3. ENERGY-EFFICIENCY IMPACTS OF AN AIR-QUALITY FEEDBACK DEVICE
channels over time among the members of a social system" (Rogers, 2003, p. 11). Thus,diffusion strictly depends on decisions and communication of households (van Damet al., 2012, pp. 48). An ABM, facilitates understanding the mechanisms of emergence,by capturing both an emergent phenomenon and its causing elements
For three reasons agent-based modeling is suitable to capture the overall effectof the ‘CO2 meter’. Agent-based simulation modeling is particularly suited to modelhousehold behavior appropriately when their adaptiveness, heterogeneity and localinteractions should be accounted for (Grimm and Railsback, 2013). Adaptivenessis important to consider, e.g. because households that use feedback devices choosedifferently on behavior adoption than those that do not; heterogeneity is importantbecause households adopt sustainable household products and heating behavior underdifferent conditions; local interactions should be modeled due to the role of socialcontacts in persuading innovation adoption.
3.3.2. MODEL DESCRIPTION
The purpose of the presented model is ex-ante assessment of the ‘overall effect’ ofbehavior-changing feedback devices: their effect on heating behavior in the adoptinghouseholds, the diffusion of these devices, and the diffusion of this behavior changeto other households, including non-adopters. The model was implemented in RepastSimphony for Java (North et al., 2013). In the following, it is is presented in the formatof an ODD Protocol (Grimm et al., 2010), which is a standard for presenting agent-basedmodels.
ENTITIES, STATE VARIABLES AND SCALES
Household agents are the main model entities. Their properties and actions are shownin Figure 3.2.
!"#$%&"'()
)
!
!
!
!
!
!
!
!
!
!
"#$%&'("%!)!*'+#,-!
./012,-3%45,0"0-(!)!600"%.,!
./012,-7%5.8#0+!)!600"%.,!
9:00+/#,.'%!)!/0;6"%!
(:00+/#,.'%!)!/0;6"%!
,%'<0+=>%%+&!)!?#&'!
3@?AB#!)!/0;6"%!
!6%5.8#0+A#C;�,DE!
$%%/6.4=FC%4'DE!
'%45,0"0-(A#C;�,DE!
*04#."!G%'<0+=!
HIB!
HIB!
Figure 3.2: Modeled household properties and actions. Formatted as a Unified Modeling Language classdiagram. See text for details.
Each household agent has six individual properties. Their lifestyle (i.e. the consumergroup they belong to) is a fixed property of each household that influences their

3.3. METHODOLOGY
3
47
inclination to adopt sustainable household devices (Schwarz and Ernst, 2009). Whetherthey adopt a feedback device or SV behavior, respectively, are binary states of each agent(‘adoptingTechnology’ and ‘adoptingBehavior’). They further possess a geographicallocation (‘xCoordinate’ and ‘yCoordinate’). They are also located in a social network,being influenced by a fixed set of peers (‘networkPeers’). Each agent has a thresholdabove which it intends to adopt SV behavior. The threshold is modeled as the minimumfraction of peers that adopted SV behavior (THLD∗
i , see 3.3.2).Agents perform actions (i.e. ‘behaviorDiffusion()’, ‘technologyDiffusion()’, and
‘feedbackEffect()’) that correspond to the submodels described in sections 3.3.2–3.3.2.Each simulation step corresponds to one month. The point in time of initialization
(t0) represents January 2006. Feedback devices are introduced in January 2016 (ti nt )and simulations terminate with the year 2030 (tend ). This describes a situation wherefeedback devices are not known or not available until beginning of 2016. From thatmoment on, the devices are available on the market.
PROCESS OVERVIEW AND SCHEDULING
An overview of the simulation phases and their scheduling is given in Figure 3.3.Simulation is subdivided into three phases: (1) during the Setup phase, model runs areinitialized (see 3.3.2), household agents are added to the model and connected via asocial network (see B). (2) In the Pre-introduction phase, feedback-devices are not yetintroduced into the system. Thus, the simulation is running but only the process ofbehavior diffusion takes place (see 3.3.2). This serves for the replay of historic behaviordiffusion patterns (see 3.3.2). (3) The Post-introduction phase starts at the introductionof feedback devices into the system. From there on, also the processes technologydiffusion and feedback effect occur (see 3.3.2 and 3.3.2).
INPUT DATA
Fundamental empirical input data of the model describe households and their socialnetwork. 31.839 household agents were generated from municipal geo-data withinthe spatial extent of the central neighborhoods of the city of Bottrop, Germany.To reconstruct the socio-spatial structure of households in this area (Ernst, 2014),marketing data on the spatial distribution of lifestyles was used to assign each householdto a Sinus® lifestyle group (Sinus Sociovision, 2015)). This typology clusters householdsin lifestyles (the so-called milieu) which are differentiated along two dimensions: socialstatus and openness of basic values.
The social network between agents was generated based on a mixed-methodssocial network analysis (Prell, 2011; Holstein and Straus, 2006) conducted in Bottrop.Interviews were conducted in which social network graphs were generated that mappedby which organizations and individuals the interviewees were influenced in their heatingbehavior, e.g. how to set up their heating system and advice on saving energy. Thisidentified social influence from peers (i.e. friends, neighbors and relatives) as importantfactors to explain heating behavior. The modeled social network was tailored tofeature the same degree-distribution5 of ego-networks as these empirical networks.
5The degree distribution in a graph is the probability distribution of the number of connections that its nodeshave.

3.3. METHODOLOGY
3
49
Decision event Events triggering behavioral change are highly specific to personallives and no empirical data on statistical distribution of such events was available tous. We therefore used Google search frequency on SV behavior as a proxy. Searchfor information is an integral step of innovation adoption (Rogers, 2003). Monthlyfrequencies of search engine queries about SV were used as a proxy for events ofdeliberation on whether to adopt SV behavior. These data were used to parameterizea time-dependent rate δβ(t ), which represents the rate of deliberation on SV adoption inour model (see C).
Adoption decision model The development of the decision model was guided by aqualitative survey, distributed to households in the Ruhr Area in winter 2014/2015.Householders were asked which sources (1) they had received information on SV fromand, (2) provided they practiced SV behavior, which sources had motivated adoption.7
Responses were quantified by counting the occurrence of answer options for the twoquestions. Survey results underlined the importance of modeling both media and socialcontacts to influence behavior adoption. According to our analysis (see D), reportedadoptions were motivated for up to 23.1% by social influence and for at least 76.9% byinformation (from media and social contacts).
This contribution of information and social influence to SV adoption led us to applythe Theory of Planned Behavior for a decision model on the intention to adopt SVbehavior. This theory is useful here, because it distinguishes between changes to attitude(e.g. due to information), as well as to subjective norms (e.g. due to social influence).The structure of the applied decision model based on the Theory of Planned Behavioris shown in Eq. 3.1: when deliberating, agent i adopts technology if attitude (ATTi ),perceived behavior control (PBCi ) and subjective norm (SNi ) outweigh an intentionthreshold (THLDi ). This threshold represents alternative behaviors that have to beexceeded in utility, as well as potential inertia, e.g. caused by the effort of changingbehavior.
adopti on =
{
1 ATTi +PBCi +SNi ≥ THLDi
0 else(3.1)
For parameter reduction, we simplified the adoption condition to make it dependonly on SNi (see Eq. 3.2). Thus, subjective norm remains the only dynamic parameter:its exceedance over a threshold (THLD∗
i ) expresses intention to adopt SV.
ATTi +PBCi +SNi ≥ THLDi ⇔
SNi ≥ THLDi −ATTi −PBCi ⇔
SNi ≥ THLD∗i
(3.2)
To capture the role of information in motivating adoption, each agent’s attitudetowards SV (ATTi ) is incremented each simulation step by ∆β,AT T . This representspersuasion from government and media campaigns that provide positive information onSV behavior (Galvin, 2013). Thus increased attitude equals decrementing the threshold
7Answer options included mass media, social media, colleagues and classmates, family and householdmembers, friends and acquaintances, and a blank text field for other sources.

3
50 3. ENERGY-EFFICIENCY IMPACTS OF AN AIR-QUALITY FEEDBACK DEVICE
THLD∗i that the subjective norm has to exceed for the decision model to favor SV
adoption.
SUBMODEL TECHNOLOGY DIFFUSION
Because the ‘CO2 meter’ is relatively novel, no historical adoption shares are available.For estimating diffusion in such cases, Rogers (2003) recommends: (1) transferringknowledge on adoption (e.g. adoption rates) from a similar innovation and (2) surveyingperceived attributes of the novel innovation. We combined these approaches by usingan existing simulation model on the diffusion of similar technology and by integratingsurveyed perceived attributes of the ‘CO2 meter’ into this model.
The existing model that was used for this purpose is the technology diffusionmodel presented by Schwarz and Ernst (2009). It was built to model the diffusion ofwater-saving shower heads. This device is similar to the ‘CO2 meter’, regarding Rogers’generalized innovation characteristics: (1) compatibility: just like heating feedbackdevices, they are integrated in daily household routines to conserve thermal energy (e.g.hot water); (2) complexity: installation of both technologies is simple and can be done bythe lay person; (3) triability: given their similar costs at mass production and their similarcomplexity of installation, both innovations can be experimented with on a limited basis.
The Schwarz & Ernst model captures households in their heterogeneity in lifestyles.Households—depending on their lifestyle—have different empirical-based decisionmodels on feedback device adoption, each inspired by the Theory of Planned Behavior.Households with lifestyles of higher social status are modeled to deliberate rationally,weighing all adoption decision factors. Conversely, other households decide by boundedrationality, based on the subjectively most important decision factor that clearly favorsacceptance or rejection of adoption.
After empirical parameterization, the decision model by Schwarz & Ernst isequivalent to the following simple decision rules. At the monthly probability (δα) of0.4%, agents decide on device adoption—this probability was taken over and thus thetemporal pattern of how the proxy technology diffuses. At deliberation, the householdsof higher social status (grouped hereupon as Social Leaders) always adopt the diffusingdevice—not being influenced by social status. Households of the societal mainstreamand conservative lifestyles (grouped hereupon as Mainstream agents) adopt devices at50% probability, imitating the adoption choice of the majority of their social networkpeers otherwise. Households of the hedonistic lifestyle (defined as the social groupof relatively high openness of basic values and lower social status (Sinus Sociovision,2015), labeled hereupon Hedonists) exclusively imitate the majority of their peers.Consequently, the latter two lifestyle groups are modeled to be able to discontinue theuse of the ‘CO2 meter’.
For adaptation of the model to our case, we surveyed the perception of householdersin Germany towards the ‘CO2 meter’. Resulting values of perception substitutedthe device-specific parameters in the decision model of Schwarz & Ernst. However,the resulting simple adoption heuristics (and consequently the adoption rates andtimelines) did not change with these changed parameters. This supports the proposedsimilarity between the water-saving proxy technology and the ‘CO2 meter’, but alsoreflects the low parameter sensitivity of the applied decision model.

3.3. METHODOLOGY
3
51
SUBMODEL FEEDBACK EFFECT
We based modeling of how feedback technology affects ventilation behavior directly onobservations from living lab experiments in 12 households. These were equipped with a‘CO2 meter’ and their indoor air-quality, heating temperature and energy consumptionwere monitored. Adopters of the ‘CO2-Meter’ were observed to be persuaded to adoptSV behavior at a probability of 0.83 (p(α∗)). This probability was used to model therate by which households adopt their behavior after having adopted a feedback device.As was the case in the field tests, this effect is modeled to take place within onemonth after adoption (i.e. one time step after device adoption, cf. Fig. 3.3). As a resultfrom the air-quality feedback, individual households saved more than 10% (supposedlybecause they were ventilating rooms permanently before) or even increased their energyconsumption more than 10% (supposedly because they barely ventilated rooms beforegiven the feedback). Energy savings however concentrated in the interval between 5% to10%. Given this range of the dominant group, the households with a change in energyconsumption of less than 5% were assumed to not having responded to feedback devicessignificantly, and model them to have not changed behavior.
MODEL VERIFICATION
The model implementation was verified to assure it corresponded to the here presentedconceptual model. Verification focused on the two submodels behavior diffusionand technology diffusion, being the most complex model components. The behaviordiffusion submodel was verified by unit testing of its implementation. The technologydiffusion model was verified by reproduction: given the same parameterization, butdifferent households and social network, technology diffusion was highly similar toresults of the technology diffusion model by Schwarz and Ernst (2009), as shown byJensen et al. (2015).
PARAMETERIZATION
Table 3.1 shows the model parameters set during initialization. Four parameters werevaried in 5 steps each, equally spaced within the given intervals. Each of the resulting625 parameter combination was simulated twice—once with and once without the ‘CO2
meter’ being introduced.
Indirect calibration Whereas the feedback effect and technology diffusion processeswere modeled on living lab experiments and an existing model, we indirectly calibratedthe behavior diffusion process with three empirical patterns. This procedure ofparameter uncertainty reduction is also referred to as ‘pattern-oriented modeling’ or‘inverse modeling’ (Grimm et al., 2005; Wiegand et al., 2003). In a first step, thoseparameter combinations that reproduce the empirical patterns are identified, and onlythese combinations are subsequently used for evaluating the effect of feedback devices.This assures that results accord to the available empirical data.
First, the conducted survey revealed a pattern on the respondents’ perceived ratio ofpeers who adopted SV behavior. At the beginning of 2015, its value is 38.3%, which wasextended by an uncertainty range to the interval 32.3–44.3% .
Second, the surveyed ratio between information and social influence in motivatingSV adoption (see Table C.1) was applied. Modeled SV adoptions (up to the time of the

3
52 3. ENERGY-EFFICIENCY IMPACTS OF AN AIR-QUALITY FEEDBACK DEVICE
Table 3.1: Parameterization for the simulation experiments. See text for references to parameterizationsources.
Parameter Value Meaning
p(βi ,t0 = 1) [0.27, 0.39] Initial SV behavior adoption shareT HLD∗
mean [0, 1] Mean of behavior adoption thresholdT HLD∗
std0.3 Std. of behavior adoption threshold
δβ,event ]0, 0.04] Rate of behavior delib. trigger events∆β,AT T ]0, 0.006] Monthly increment to attitude towards SV
p(αi ,t0 = 1) 0 Initial feedback device adoption shareδα 0.004 Technology adoption deliberation ratep(α∗) 0.833 Success rate of feedback devicest0 0 Time step (month) of initializationti nt 120 Time step (month) of device introductiontend 300 Time step (month) of end of simulationdN B HD 200 Max. length (m) of neighborhood edgespN B HD 0.5 Ratio of edges within neighborhood
survey, i.e. 2015) was traced back by whether they were caused rather by change ofattitude or subjective norm. If a household agent (until first SV adoption) underwentmore change in attitude than in subjective norm, then this agent was assumed to be‘motivated’ by information. Conversely, if change in subjective norm exceeded that ofattitude, the behavior change was assumed to be ‘motivated’ by social influence. Thus,those parameterizations were selected that generated the surveyed shares of adoptionmotivation (i.e. ca. 8–23% from social influence and ca. 77-92% from information, untilthe beginning of 2015; see D).
Third, those initializations where less than half of initial SV adopters adopt thisbehavior intentionally were discarded. This represents a tendency towards initialadopters to intend SV adoption, without enforcing full intentionality.
3.4. RESULTS AND DISCUSSION
To address the research question on the overall effect of feedback devices on ventilationbehavior, we conducted the following four model experiments. (1) A reference scenarioof behavior diffusion, where feedback technology is not introduced. Thereby, modelparameterizations that reproduced empirical patterns of SV behavior diffusion (see3.4.5) were selected and only those were included for the following scenarios. (2) Thediffusion of the ‘CO2 meter’ only was simulated. (3) The co-diffusion of technologyand behavior was simulated, in which diffusing feedback devices add to and reinforcethe diffusion of SV behavior. (4) In concert with the baseline behavior diffusionfrom experiment 1, diffusion of devices among households where they can changebehavior was simulated. But this behavior change from devices was assumed not todiffuse beyond adopting households. Results from this experiment were comparedto experiment 3 to quantify relative strengths of technology diffusion and behaviordiffusion from feedback devices.

3.4. RESULTS AND DISCUSSION
3
53
3.4.1. EXPERIMENT 1: BEHAVIOR DIFFUSION
To calibrate the diffusion of SV behavior at absence of feedback devices, thoseparameterizations were selected that met the given empirical patterns.
Parameter selection This section shows how application of empirical data frominterviews decreased parameter uncertainty about the varied parameters THLD∗
mean ,∆β,AT T , δβ,event , and p(βi ,t0 =1). These have the following effects in the model: (1)THLD∗
mean influences whether, during the course of the simulation, SV adoption hadthe tendency to diffuse successfully or is successively rejected; (2) ∆β,AT T influencedthe same feature, but could only add positively to SV behavior diffusion. Thus, it canreverse a negative trend caused by a high THLD∗
mean . (3) δβ,event controls the speed ofbehavior diffusion, e.g. a higher rate increased (negative or positive) rates of diffusionin magnitude. (4) p(βi ,t0 =1), i.e. initial SV adoption share, influences which parametercombination could meet the surveyed adoption share pattern in 2015. At lowest SVinitialization, exponentially increasing runs were selected. Conversely, at highest SVinitialization, runs with a quasi-linear decline in SV adoption were selected.
Fig. 3.4 contrasts the state space of behavior adoption over time between allsimulated parameterizations and the 7% of parameterization sets that were selected viathe empirical patterns. Behavior diffusion trajectories of all model parameterizationswere diverse, with SV adoption exceeding 95% and dropping below 5% over the courseof simulation. Conversely, the state space of the selected parameterizations narroweddown significantly. Variation is particularly low until 2016, which is up to when empiricaldata was available.
Hence, the empirical patterns reduced uncertainty the most at the time period theyapply to, but still reduced uncertainty considerably for the simulation time from 2016on. The gain of SV adoption over the course of the simulation had a strong positivetendency, ranging from ca. -15% to ca. +60% over the same time period. Thus, the rangebetween moderate decrease to drastic increase projects a positive expectation for futureSV adoption.
Distribution under selected parameterizations SV behavior in selected modelvariants is shown in Fig. 3.5. Despite their variation of up to 60%, half the selectedmodel variants, as well as the average adoption per time step, lay within a relativelynarrow band of c. 20% difference in SV adoption share. Distribution of projected SVadoptions was skewed: outliers towards lower SV adoption were stronger than towardsgreater ones.
3.4.2. EXPERIMENT 2: ‘CO2 METER’ DIFFUSION
Fig. 3.6 shows simulated adoption of feedback devices among different lifestyle groupsover time. Device adoption rates differed between lifestyle groups: agents of the LeadingLifestyles showed highest, the Mainstream group intermediate, and Hedonists lowestadoption rates. This was directly caused by different adoption decision models (see3.3.2).
Due to this difference in decision models, SV adoption curves differed betweenlifestyles: Leading Lifestyles showed an asymptotic, Mainstream agents a quasi-linear,
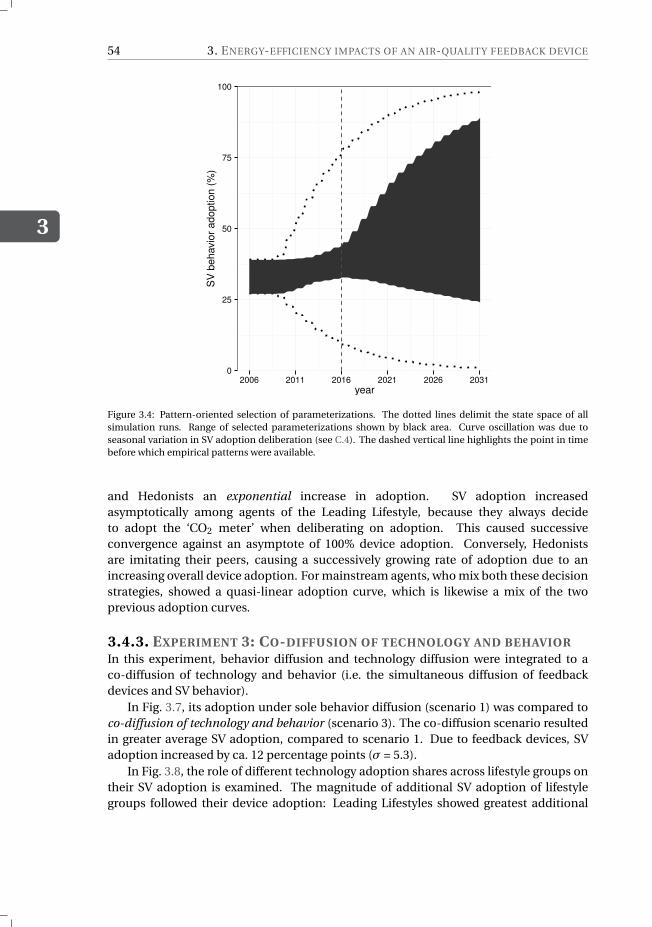
3
54 3. ENERGY-EFFICIENCY IMPACTS OF AN AIR-QUALITY FEEDBACK DEVICE
0
25
50
75
100
2006 2011 2016 2021 2026 2031
year
SV
be
havio
r a
do
ptio
n (
%)
Figure 3.4: Pattern-oriented selection of parameterizations. The dotted lines delimit the state space of allsimulation runs. Range of selected parameterizations shown by black area. Curve oscillation was due toseasonal variation in SV adoption deliberation (see C.4). The dashed vertical line highlights the point in timebefore which empirical patterns were available.
and Hedonists an exponential increase in adoption. SV adoption increasedasymptotically among agents of the Leading Lifestyle, because they always decideto adopt the ‘CO2 meter’ when deliberating on adoption. This caused successiveconvergence against an asymptote of 100% device adoption. Conversely, Hedonistsare imitating their peers, causing a successively growing rate of adoption due to anincreasing overall device adoption. For mainstream agents, who mix both these decisionstrategies, showed a quasi-linear adoption curve, which is likewise a mix of the twoprevious adoption curves.
3.4.3. EXPERIMENT 3: CO-DIFFUSION OF TECHNOLOGY AND BEHAVIOR
In this experiment, behavior diffusion and technology diffusion were integrated to aco-diffusion of technology and behavior (i.e. the simultaneous diffusion of feedbackdevices and SV behavior).
In Fig. 3.7, its adoption under sole behavior diffusion (scenario 1) was compared toco-diffusion of technology and behavior (scenario 3). The co-diffusion scenario resultedin greater average SV adoption, compared to scenario 1. Due to feedback devices, SVadoption increased by ca. 12 percentage points (σ = 5.3).
In Fig. 3.8, the role of different technology adoption shares across lifestyle groups ontheir SV adoption is examined. The magnitude of additional SV adoption of lifestylegroups followed their device adoption: Leading Lifestyles showed greatest additional

3.4. RESULTS AND DISCUSSION
3
55
!
"#
#!
$#
%!!
"!!& "!%% "!%& "!"% "!"& "!'%
()*+
,-./)0*123+.*4356237.89:
;27).6(5)
<=6+)>).1*?@)A
B)*7
C@*+62?)A
Figure 3.5: Distribution of model runs with selected parametrization. The dotted lines delimit the state space ofall selected parameterizations. The dashed lines delimit the state space between the 25th and 75th percentileat each time step. The continuous line represents the expected value (mean) of SV adoption per time step.Curve oscillation was due to seasonal variation in SV adoption deliberation (see C.4).
adoption, Mainstream agents intermediate, and Hedonists lowest deviation. Thus,affinity of a lifestyle to adopt the ‘CO2 meter’ considerably influenced the overall relativeeffect that the device had on the lifestyle’s SV adoption.
Energy-efficiency impact To illustrate the energy-related impact of the ‘CO2 meter’,these results on additional SV adoption were transformed into change of heating energydemand. As the living lab experiments showed, those device adopters who changedtheir energy consumption after adoption significantly (see 3.3.2) decreased their energyconsumption by an average of 8%. The empirical reduction in energy demand from SVbehavior was therefore approximated as these 8%, which lies within the range of energysavings previously theorized (Galvin, 2013).
On this basis, the difference between experiments 1 and 3 of up to 18% additionalSV adopters of the Leading Lifestyles 15 years after device introduction translate into ca.1.5% additional heating energy savings in this group. Analogously, Mainstream Lifestyleswould decrease energy demand by ca. 1%, and Hedonists by ca. 0.5%. Hence, thefacts that the ‘CO2 meter’ is only adopted partially and that SV diffusion would spreadindependently from feedback devices anyway considerably lower the overall effect ofthe CO2 meter on the multihousehold level, compared to the 8% of potential energysavings of a single household. This lower effect, however, still appears attractive given

3
56 3. ENERGY-EFFICIENCY IMPACTS OF AN AIR-QUALITY FEEDBACK DEVICE
0
10
20
30
40
50
60
70
80
90
100
2006 2011 2016 2021 2026 2031
year
Te
ch
no
log
y a
do
ptio
n (
%)
Lifestyle
Hedonists
Leading Lifestyles
Mainstream
Figure 3.6: Simulated technology adoption over time, differentiated by lifestyle groups (i.e. Social Leaders,Mainstream and Hedonistic Lifestyles in top-down order). The dashed vertical line highlights the momentwhen feedback devices are first introduced.
the relatively low costs for the ‘CO2 meter’ in comparison to its alternatives, e.g. energyefficiency renovation.
3.4.4. EXPERIMENT 4: QUANTIFYING SUB-PROCESSES
The fourth model experiment aimed to quantify the relative contributions of technologydiffusion and behavior diffusion to the overall effect of the ‘CO2 meter’. While it isobvious that the devices themselves need to diffuse in order to unfold an effect onthe multi-household scale, it seems less obvious that diffusion of behavior inducedby the devices will make a significant difference. The potential for such a significantcontribution of behavior diffusion to the overall effect of feedback devices was shown byprevious research (Jensen et al., 2015), but it was not yet quantified. It appears usefulfor practical applications to know whether to concentrate efforts rather on achievingsuccessful technology diffusion or on supporting behavior diffusion, and hence use ourempirically-based model to investigate the issue further.
A fourth experiment was thus conducted, in which technology adoption staticallyincreases SV adoption: it may lead to SV adoption as in the previous experiments, butthis change in behavior is considered to remain restricted to the adopting householdand not to add to behavior diffusion. Therefore, behavior diffusion unfolds as simulatedin experiment 1, unaffected by the diffusion and effect of feedback devices.
To quantify the relative contributions of technology diffusion and behavior diffusionon SV adoption, experiments 3 and 4 were compared in their additional SV adoption

3.4. RESULTS AND DISCUSSION
3
57
0
10
20
30
40
50
60
70
80
90
100
2006 2016 2021 2026 20312011
year
SV
behavio
r adoption (
%)
Lifestyle
All (SV adoption)
Experiment
Experiment 3
Experiment 1
Figure 3.7: Comparing SV adoption shares for all agents between co-diffusion of technology and behavior(solid line) and experiment 1 (dashed line). The dotted vertical line highlights the moment of feedback devicesintroduction. Whiskers indicate the minima and maxima.
0
25
50
75
100
2006 2016 2021 2026 20312011
year
SV
be
havio
r a
do
ptio
n (
%)
Lifestyle
Leading Lifestyles
0
25
50
75
100
2006 2016 2021 2026 20312011
year
SV
be
havio
r a
do
ptio
n (
%)
Lifestyle
Mainstream
0
25
50
75
100
2006 2016 2021 2026 20312011
year
SV
be
havio
r a
do
ptio
n (
%)
Lifestyle
Hedonists
Figure 3.8: Comparing SV adoption shares for lifestyle groups between scenario 1 (dashed line) andco-diffusion of technology and behavior (solid line). The dotted vertical line highlights the moment whenfeedback devices are first introduced. The whiskers indicate the 25th and 75th percentile.
over the reference scenario from experiment 1. Experiments 3 and 4 thereby only differin the diffusion of behavior induced by adopted devices.
Shown in Fig. 3.9, experiments are compared between pairs of the sameparameterization. It shows the additional effect to non-adopters of feedback devices

3
58 3. ENERGY-EFFICIENCY IMPACTS OF AN AIR-QUALITY FEEDBACK DEVICE
0
10
20
30
40
2011 2016 2021 2026 2031
year
Ad
de
d S
V a
do
ptio
n (
%)
Leading Lifestyles
All households (scenario 4)
All households (scenario 3)
Non−adopters of devices (scenario 3)
0
10
20
30
40
2011 2016 2021 2026 2031
year
Ad
de
d S
V a
do
ptio
n (
%)
Mainstream
All households (scenario 4)
All households (scenario 3)
Non−adopters of devices (scenario 3)
0
10
20
30
40
2011 2016 2021 2026 2031
year
Ad
de
d S
V a
do
ptio
n (
%)
Hedonists
All households (scenario 4)
All households (scenario 3)
Non−adopters of devices (scenario 3)
Figure 3.9: Additional percentage points of SV behavior adoption due to feedback devices. Calculation basedon comparing SV adoption share between simulation runs at same parameterizations with and withoutfeedback devices. Added adoption is shown for all agents under the scenarios of static technology diffusionand co-diffusion of technology and behavior and for those agents who do not adopt feedback devices at theco-diffusion scenario. Whiskers indicate 25th and 75th percentiles.

3.4. RESULTS AND DISCUSSION
3
59
in the co-diffusion scenario8. For both experiments—similar to Fig. 3.8—differences forall agents in Fig. 3.9 were greatest for Leading Lifestyles, intermediate for Mainstreamagents, and lowest for Hedonists. This underlines the importance of different affinitiesof lifestyles to adopt feedback devices. Added SV adoption steadily increased over timefor all lifestyle groups and is always positive after 10 years of device diffusion. As shownin Table 3.2, the overall effect of the ‘CO2 meter’ on additional SV adoption by LeadingLifestyles consisted to ca. 12 percentage points of behavior diffusion, for Mainstreamagents to ca. 24 pp. and for Hedonists to ca. 46 pp.
Table 3.2: Summary on the overall effect of the ‘CO2 meter’ in percentage points. Standard deviation shownin parentheses. Further is presented how generation of this effect is composed of technology diffusion andbehavior diffusion.
All households Leading
Lifestyles
Mainstream & Traditional
Lifestyles
Hedonists
Lifestyles
Added SV adoption (pp) 12 (5.3) 18 (8) 13 (6) 6 (3)Technology Diffusion (%) 78 82 76 54Behavior Diffusion (%) 22 12 24 46
This finding is underlined by the additional effect to non-adopters of devices in theco-diffusion scenario. For each lifestyle group, difference in SV adoption in this groupincreased steadily. Over time, this impact on SV adoption is highly similar betweennon-adopters of different lifestyle groups, because they were modeled to decide on SVadoption in the same way. This effect to non-adopters (of devices) further adds weight ofevidence to the relevance of behavior diffusion in the co-diffusion of the ‘CO2 meter’ andSV behavior, e.g. almost half additional SV adoption by all Hedonists is as well achievedfor Hedonists that are non-adopters of devices. The mechanism by which non-adoptersof devices are reached is further discussed by Jensen et al. (2015).
3.4.5. VALIDITY AND LIMITATIONS
In order to achieve a valid assessment of the ‘CO2 meter’ from model experiments, themodel used for this should adequately reflect relevant aspects of reality. These aspectswere selected according to a previously published assessment framework (Jensen et al.,2015). Realism of modeling these was assured by carefully designing the modelcomponents technology diffusion, behavior diffusion and feedback effect based onempirical data and widely accepted theory.
To guarantee sufficient realism of the behavior diffusion submodel, indirectparameterization (inspired by pattern-oriented modeling (Grimm et al., 2005)) wasused to select those parameterizations that successfully reproduce empirical patterns.Patterns regarding (1) SV adoption shares in 2015, (2) motivations to adopt SV, and (3)intentionality of SV adoption at initialization were applied. Selected parameterizationsmatched all of these three patterns, thus adding weight of evidence to realism of thissubmodel.
Validation of the technology diffusion submodel bases on the TAPAS approach,standing for “Take A Previous model and Add Something” (Frenken, 2006). Instead of
8Note that for experiment 2, no such additional effect to non-adopters on devices exists.

3
60 3. ENERGY-EFFICIENCY IMPACTS OF AN AIR-QUALITY FEEDBACK DEVICE
building a new technology diffusion submodel from scratch, an existing model was‘taken’ and other processes were ‘added’. This has a key advantage: “one can takeadvantage of existing core models to formulate a new robust model in a relatively shortamount of time and with a larger degree of understanding” (Frenken, 2006, p. 152). Thisalso contributes to model validation, particularly if the previous model was successfullyvalidated. The previous model here is the technology diffusion model by Schwarz andErnst (2009), which was validated by being based on survey data and being testedagainst empirical diffusion data of household products. To assure its correct use in thisstudy, its transferability to the ‘CO2 meter’ was justified (see 3.3.2) and its successfulre-implementation verified (see 3.4.2).
Realism of the feedback effect process directly stems from modeling it on results fromliving lab experiment. Measurements on the percentage of households who changebehavior when using the ‘CO2 meter’ and resulting energy savings were integrated intothe model.
Limitations We expect the following limitations to have potentially affected ourfindings: the fundamental uncertainty regarding future innovation diffusion, smallsample sizes of empirical data, behavior diffusion modeling decisions, and howtechnology introduction is modeled.
Results strictly depend on whether the ‘CO2 meter’ and SV behavior will diffusesuccessfully in the future. Due to contingency of the future, perfectly predictinginnovation diffusion does not appear to be possible. Instead, modeling what happensif both diffusions will take place is possible and useful. The uncertainty of this projectionwas reduced with empirical data from multiple sources. Additionally, a simulationapproach was chosen that can cope with parameter uncertainty, basing findings on theensemble of all parameterizations that were validated.
Limited empirical data from multiple sources might have affected representativenessof results, e.g. the limited period of time over which the ‘CO2 meter’ has been observedin a small number of households. Therefore, the estimated energy savings from SVbehavior of 8% could be either under- or overestimated. It should be considered thatestimated energy savings (linearly) inherit this added component of uncertainty.
SV behavior choice was modeled to be equal across lifestyle groups. But this mightnot be the case in reality. Heterogeneity would in principle be possible. Some lifestylescould have an inclination towards certain behaviors, e.g. some could be more motivatedto practice energy-efficient behavior; or behavior change might be more inconvenientfor others. These options were not considered here here, because no suiting empiricaldata regarding heterogeneity in behavior adoption was available. Instead the model wasbuilt directly on the limited available data.
Further, SV behavior was modeled as binary: households do thus either adopt shockventilation or not. It would be desirable to model ventilation behavior in more detail,in order to better represent the energy-efficiency related impact of a feedback device.For instance, duration of ventilation could be an important additional factor to consider(Galvin, 2013), including if households do not ventilate at all. Given that our empiricalbasis did not allow further differentiation, we chose to limit degrees of freedom in the
3.5. CONCLUSION
3
61
model to those of available data. Hence, the effect attributed to SV adoption in this paperrepresents an empirical average difference to other ventilation practices.
Finally, the specific way in which device introduction was modeled to can beexpected to impact the results. Technology becomes available quickly and to all agentsat the same time. This implies feedback devices to be marketed intensively andsuccessfully. This implication was accepted, because it is the simplest assumption anddetailed comparison between marketing strategies is beyond the scope of this paper.
3.5. CONCLUSION
Purpose of this study is to answer the following question: what is the overall effect ofthe ‘CO2 meter’ on energy-efficient heating behavior, as emerging from the processesof feedback effect, technology diffusion and behavior diffusion? This effect was foundto be significant, accounting for an average 12% (δ = 5.3) added percentage points ofadditional SV adoption for the modeled case city Bottrop. For this case area, the ‘CO2
meter’ was estimated to be able to decrease residential heating energy demand by c. 1%at 15 years after its introduction.
Overall effect of feedback devices Our simulation results indicate that introductionof the ‘CO2 meter’ in the city of Bottrop would significantly increase energy-efficientheating behavior. Results showed the average overall effect of this device for differentsocial groups to range from ca. 6 to ca. 18 percentage points of additional SV adoptionat 15 years after device introduction. This magnitude adds weight of evidence tothe relevance of the driving key mechanism: the direct effect of feedback to deviceusers was identified as the initial keystone to the effect of devices to SV diffusion.Technology diffusion spreads devices among households (where feedback can thenchange behavior) and behavior diffusion adds to this by spreading behavior change fromadopters to non-adopters of devices.
Neglecting the impact of the ‘CO2 meter’ via behavior diffusion would underestimateits overall effect significantly. To indicate which processes would be most relevant ininterventions that use the ‘CO2 meter’, relative contributions of technology diffusionwere compared to behavior diffusion on SV adoption. The share of the overall impactthat the ‘CO2 meter’ caused via behavior diffusion ranged from 12% for LeadingLifestyles, over 24% for Mainstream and Traditional lifestyles, to 46% for the lifestylegroup Hedonists (see Table 3.2). Thus, this underestimation would be the least forhouseholds of highest social status, for those of intermediate to low social status andhighest openness of basic values.
Effects on heating energy consumption Based on the simulation results, averageheating energy savings of ca. 1% could be expected within 15 years from the introductionof the ‘CO2 meter’ in the City of Bottrop. This ranges from 1.5% for Leading Lifestyles,over c. 1% for Mainstream Lifestyles and to 0.5% for the Hedonist lifestyle. 1% ofenergy savings appears rather low compared to the ca. 8% savings potential of the ‘CO2
meter’ for individual households. This difference in our assessment was due to thefollowing reasons: (1) ca. 40% of households in the case area are already adopting SV

3
62 3. ENERGY-EFFICIENCY IMPACTS OF AN AIR-QUALITY FEEDBACK DEVICE
behavior, (2) SV behavior has—according to our results—the tendency to increase inadoption, independently from feedback devices, and (3) diffusion of the ‘CO2 meter’will likely not reach full penetration in a reasonable time frame. Therefore, describinga feedback device’s energy savings potential by its potential for individual householdscan be misleading. Instead, it appears preferable to use a potential that is scaled by theexpected spreading of this device and by the spreading of its induces behavioral change.
Merits of the ‘CO2 meter’ in interventions The ‘CO2 meter’ will likely differ inacceptance and adoption between social groups; assumed it spreads similarly asother sustainable household products. This difference influences how much thesegroups would undergo change in heating behavior due to the ‘CO2 meter’ and wouldpredominantly affect households of higher social status (i.e. Leading Lifestyles). Hence,the authors recommend this to be considered at interventions that use the ‘CO2 meter’:targeting households of higher social status with such interventions could have a greaterimpact.
The spreading of the ‘CO2 meter’ has been identified as the main factor determiningits overall impact. Thus, practitioners who want to create impact with this deviceshould primarily support its spreading between households. However, supporting thespreading of behavior change from device adopters is worthwhile, too—particularlywhen aiming to spread energy-efficient heating behavior to social groups that are lessinclined to use the ‘CO2 meter’.
Overall,—considering the uncertainty of technology projections—the ‘CO2 meter’promises significant energy savings at low cost. In comparison to other strategies, it canbe distributed cost-effectively and is widely applicable. Thus, this device can be regardedas fit to efficiently tackle ‘low hanging fruits’ of energy-efficiency in residential heating.
Future research We propose to assess further feedback devices using the integratedmodeling approach that is presented here. Additionally, we expect co-diffusion oftechnology and behavior to have a fruitful role in future behavior change interventions,e.g. to increase overall behavior change.
Further, elements of the model that remained uncertain due to lacking empiricaldata should be refined based on further empirical research. For instance, furtherdifferentiating the exact ventilation behavior that modeled households can practicecould be a useful direction of research. Also valuable would be those research designswhich observe interactions between technology diffusion, feedback effect and behaviordiffusion. Further, linking of separately gathered data sets on the respective processescould improve understanding these interactions.
Regarding technology introduction, policy options regarding the here modeledintervention should be explored, e.g. device marketing strategies. We recommendapplying the here presented model to achieve this. This would both deepen insight intothe future prospects of feedback devices, as well as support policy decisions in how toapply them effectively.

4SIMULATING MARKETING
STRATEGIES FOR FEEDBACK
DEVICES
“...before any new product can be developed it has to be properly researched.We’ve got to find out what people want from fire,
how they relate to it, what sort of image it has for them.”
Douglas Adams
4.1. INTRODUCTION
To quickly reduce CO2 emissions, one way that seems promising is to change heatingbehavior. In the EU, residential buildings account for ca. 30% of final energyconsumption; about 60% of this is taken up by space heating (Itard and Meijer, 2008).The potential for the reduction of this share via behavioral changes is 20-30% (Woodand Newborough, 2003), e.g. by practicing energy-efficient ventilation behavior (Galvin,2013) and setting lower thermostat temperatures (Guerra Santin et al., 2009).
Providing feedback to energy consumers about their energy consumption behaviorcan help them tap into this savings potential. Feedback about behavior was found todecrease energy consumption up to 20%, with an average of 10% (Karlin et al., 2014;Wood and Newborough, 2003). Numerous approaches exist to give feedback to energyconsumers, e.g. email, online platforms, or installed feedback devices (Karlin et al.,2014; Laschke et al., 2011; Darby, 2006). One example of a feedback device is a so-called‘CO2 meter’, which shows the indoor air quality–measured by CO2 level–in the form ofa traffic light. This was shown to be effective in convincing households to practice theenergy-efficient ‘shock ventilation’ (‘Stoßlüften’) of rooms (see Section 4.2).
This chapter has been submitted to the Journal of Environmental Management.
63

4
64 4. SIMULATING MARKETING STRATEGIES FOR FEEDBACK DEVICES
This study focuses on feedback devices installed in the home, due to their potentialto create greater effects in the long term. One challenge to feedback interventionsis behavioral relapse (Verplanken and Wood, 2006), i.e. energy consumption levelsreturning to the levels before intervention occurred. However, feedback fromdevices appears to be less prone to behavioral relapse or decreasing attention forfeedback—particularly when installed quasi-permanently and made directly accessibleto users (Burchell et al., 2014).
To reduce heating energy demand significantly, market introduction of feedbackdevices should be managed effectively—and ineffective management should be avoidedearly on. Especially in the earliest phase of product diffusion, good marketing cansignificantly support the adoption of that product (Delre et al., 2007). There are variousestablished marketing strategies, such as advertising devices to the general public orgiving the first devices away as free promotional gifts. It is critical to identify the bestoptions among such strategies given the requirement of maximum behavior change. Weargue the respective merits of each strategy should be well estimated ex-ante—beforeany real-world implementation. This is crucial to avoid actions that have low orcounterproductive effects and would delay achievement of desired results.
Simulation modeling is useful for identifying effects of actions on product diffusionbefore their implementation (van Dam et al., 2012; Schwarz and Ernst, 2009; Rixenand Weigand, 2014). Simulation, being quicker than real-time, can thus help avoidineffective action in the real world. Simulation modeling is capable of estimatingthe potential future effects of marketing strategies towards sustainable householdproducts and the resulting impacts (Schwarz and Ernst, 2009; Delre et al., 2010). Yet,such undertaking has to acknowledge the uncertainties of forecasting social systemsand the energy sector (van Dam et al., 2012). Therefore, goal of this study is notpredicting the exact impact of marketing strategies of great detail. Instead, high-levelmarketing strategies are merely to be compared in a relative way, regarding their generaleffectiveness and cost-efficiency.
This study therefore aims to use simulation modeling to compare and proposemarketing strategies for feedback devices ex-ante. This assessment will adopt and refinea simulation model on the diffusion and effect of a CO2 meter (Jensen et al., 2016). Fromthis, we aim to identify the management strategies for rolling out feedback devices thatshow the best impact over a range of future scenarios. To facilitate practical results, wealso suggest stakeholders that would be well suited to putting these devices into action.Altogether, this study addresses the following research question: Which innovationmanagement is most effective at creating additional energy-efficient heating behavior viathe marketing of behavior-changing feedback devices?
The rest of this paper is organized as follows. First, we present previous findings onthe device used in this case study. Second, we present the state of literature on modelingmarketing strategies, the specific simulation model adopted for this case study, andthe strategies we assess with this model. Third, we answer the research question bysimulating and analyzing these strategies.
4.2. THE CO2 METER CASE STUDY
4
65
4.2. THE CO2 METER CASE STUDY
In this section, we present the CO2 meter as a case study of a device and previous findingson its effects. This device gives feedback to its users about indoor air quality and givesthem an incentive to ventilate energy-efficiently. The device shows its feedback in theintuitive colors of a traffic light: good air quality is shown by green, intermediate byyellow, and unhealthy air by red.
Field tests have shown that the use of a CO2 meter has the potential to changethe ventilation behavior of householders, which consequently supports a reduction inheating demand. For ventilation, most households in Germany have windows that havetwo sets of hinges that allow the option of opening windows completely (i.e. practicingso-called ‘Stoßlüften’ or ‘shock ventilation’) using one set of hinges, or only partially, bytilting them open on the second set of hinges (Galvin, 2013). The CO2 meter increases theattractiveness of shock ventilation, because this behavior increases the ventilation rateand thus the speed at which improved air quality is shown by the feedback. Increasedventilation rate and avoidance of overly long ventilation times, in turn, reduce heatingenergy demand (Galvin, 2013). The savings from adopting shock ventilation have beenshown to amount to an average of approximately 8% (Lovric, 2015; Jensen et al., 2016).
Previous research assessed not only the effect of the CO2 meter for its direct users, butfor an entire city–comprised of adopters and non-adopters of feedback devices. Impactfrom the CO2 meter relied on three processes: (1) its diffusion among households, thusincreasing the number of users, (2) the feedback effect for its users, and (3) consequentspread of this induced behavior change, e.g. to households that do not use the device.
4.3. METHODS
This study aims at designing marketing strategies for feedback devices, and then identifywhich would be most effective. We adopted the four-step method by Roozenburg &Eekels (1995) for this task: (1) analysis of the problem and gathering of existing optionsto solve it; (2) synthesis of the analyzed options to tentative solutions; (3) simulationof these solutions to forecast “the behavior and properties of the designed product byreasoning and/or testing models” (Roozenburg and Eekels, 1995, p. 91); and (4) empiricalevaluation of the most promising solutions.
In this study, we focus on the first three of these steps—analysis, synthesis andsimulation. Feedback devices for behavior change in heating are still in the early phasesof market entry. This study will prepare and support the future real-world evaluationand implementation of marketing strategies of these devices.
4.3.1. ANALYSIS: MARKETING OPTIONS
We analyzed various possible marketing strategies for feedback devices by drawing onthe wide base of literature on managing the diffusion of innovations with marketing.
CLASSIFYING MARKETING OPTIONS IN THE LITERATURE
The challenge of getting more households to adopt a product is a problem tackledby the field of marketing. We thus reviewed multiple promising marketing strategies.These strategies were classified in a widely used array of marketing options: E.

4
66 4. SIMULATING MARKETING STRATEGIES FOR FEEDBACK DEVICES
Jerome McCarthy’s ‘marketing mix’ (1996). In addition to the product itself and itscharacteristics—we assume a situation where an already designed device needs to bemarketed—the marketing mix classifies actions into three additional categories: (1) Theprice of the product, on which the willingness of adoption may depend; (2) Promotionactivities that communicate the product to potential adopters; and (3) the place, i.e.the distribution channels via which a product is marketed. Motivated by our intentionto simulate selected marketing strategies with agent-based modeling, we focused ourliterature search on this field. Thus, the Scopus database Elsevier (2015) was queriedwith the search term ‘simulation AND agent-based AND diffusion AND innovation* AND(promotion* OR policy).’ The selection criterion for strategies was their reported success.In addition, we included sources in the review article by Kiesling et al. (2012) on thisquestion.
Price The most frequently modeled marketing strategy in the reviewed studies werediscounts on products. Successful incentives were found in the form of discounts (orsubsidies) (Ferro et al., 2010; Cantono and Silverberg, 2009; Zhang et al., 2015) andpurchase bonuses (Rixen and Weigand, 2014); the changing of economic interactionsin a system has also been found to be indirectly successful (de Holanda et al., 2008). Theoverall economic effect of giving away a limited number of products for free may alsobe greater than if discounts or rebates are offered. This approach has shown particularlypromising when compared to discounts (Zhang et al., 2015).
Promotion Regarding product promotion, advertising and social marketing haverepeatedly been found to be successful at supporting product diffusion:
(1) Awareness of a product is a crucial precondition to its adoption (Rogers, 2010).Delre et al. (2007) showed that spreading information about a new product–early in itsmarketing phase–can increase the diffusion success. This is supported by other studies(Rixen and Weigand, 2014; de Holanda et al., 2008; Schreinemachers et al., 2007).
(2) Social marketing is a more focused approach to promotion, in which targetedindividuals market to their peers. A particularly positive role in spreading innovationsappears to be played by ‘Opinion Leaders’ (Rogers, 2010). These are people who areconsidered to be relatively highly innovative (i.e. they adopt innovations earlier) (Rogers,2010) and who also can influence a large number of other people (Kiesling et al., 2012).Reviews by Kiesling et al. (2012) and Nisbet & Kitcher (2009) and a study by Eck et al.(2011) highlight the merits of leveraging this group in social marketing to managing thediffusion of innovations.
In practice, a marketing strategy that uses Opinion Leaders should include twosteps, recruitment followed by training (Nisbet and Kotcher, 2009). Recruitment couldrely on the high social connectedness of potential Opinion Leaders. In the context ofenergy conservation, candidates would, for instance, be active in or known by localenvironmental groups. Training would feature involving selected Opinion Leaders inworkshops to prepare them to have the greatest possible effect. We would expect theirrecruitment to require local knowledge.

4.3. METHODS
4
67
Place A product can be made accessible at different places and in different ways, whichcan significantly influence which consumer group is exposed to it the most. Severalsimulation studies have shown this to be a way to support product diffusion. Variationof placement is commonly operationalized as varying the social group targeted by amarketing campaign (Zhang et al., 2015; Ferro et al., 2010), which we will do in thefollowing as well.
4.3.2. SYNTHESIS: PROPOSED MARKETING STRATEGIES
In this section, we present the marketing strategies that were selected for the simulation4.1. The respective designs are built on the literature review; this is then followed byusing the simulation to assess them.
Table 4.1: Scenarios of marketing strategies to support the diffusion of feedback devices.
Scenario Targeting Marketing strategy
GIVEal l Any households Give away free devicesGIVELL Leading Lifestyles Give away free devicesGIVEMS Mainstream Give away free devicesGIVEHD Hedonist Give away free devicesLEND Any households Lending out devicesAWAREal l Any households Raise awareness of deviceAWARELL Leading lifestyles Raise awareness of deviceAWAREMD Mainstream Raise awareness of deviceAWAREHD Hedonists Raise awareness of deviceOLconnect Opinion leaders Connect all peersOLaw ar e Opinion leaders Spread awareness to peers of peersOLben Opinion leaders Adopt behaviorOLdev Opinion leaders Adopt devices
Price We chose the two strategies—giving away and lending out of devices—whichreduce the cost of adoption to zero. (1) Giving away a limited number of free devicesis a direct way to encourage households to adopt feedback devices. Its rationale is tomake the peers of first adopters aware of feedback devices through word of mouth. Thishas the potential to leverage social influence, which successively entices more peers toadopt devices. (2) Lending out devices enables households to monitor their behavioralperformance for a while and potentially change it. After a certain period, the device isreturned and lent to another household. The short timeframe of this intervention mightincrease behavioral relapse, but could–in return–reduce the cost and resource impact ofdisseminating devices. We considered this strategy, which did not appear in the review,because we took note that a public-private partnership organization1 has the plan tolend out feedback devices in the future.
Promotion Regarding promotional strategies, we modeled raising awareness of thedevices in households to leverage marketing with Opinion Leaders. (1) Raisingawareness consists of informing households of the availability of feedback devices.
1This is the ‘Innovation City Management GmbH’, which coordinates the roll-out of energy-efficient technologyin the city of Bottrop.

4
68 4. SIMULATING MARKETING STRATEGIES FOR FEEDBACK DEVICES
Households that have become aware of these devices can from then on choose toadopt them. The resulting adoption of devices can then further spread awareness ofdevices to the peers of adopters. (2) Opinion Leaders were found in our literaturereview to have a special role in the diffusion of innovation. We differentiate theassumed training of Opinion Leaders in four ways, which relies on their characteristicsof relatively high social participation and levels of innovativeness (Rogers, 2010). (a)Being active communicators, they could mutually connect their respective peers on thetopic of feedback devices and heating behavior. Thus, all peers that an Opinion Leaderinfluences would influence each other on this topic. (b) As they communicate actively,they could be encouraged to spread awareness deeper into their social environment.Thus, not just the peers they influence, but also those influenced by these peers couldbe made aware of a feedback device. (c) Due to their innovativeness, Opinion Leaderscould be convinced to adopt shock ventilation, regardless of whether feedback devicescontinue to be used. In this case, they would exceed social influence on their peersregarding behavior. (d) In the same way, they could be convinced to adopt feedbackdevices. This could influence their peers towards device adoption.
Place Finally, the two marketing strategies of giving away free devices and raisingawareness were cross-combined with variation of place, i.e. the targeting of differentconsumer groups.
4.3.3. SIMULATING HEATING BEHAVIOR AND FEEDBACK DEVICES
In this section, we will motivate our application of the approach of agent-basedmodeling and provide the model specifications. This is followed by a description of howa previously published simulation model was adapted and made to capture the selectedmarketing strategies.
AGENT-BASED MODELING
We used agent-based modeling in order to represent real-world households withcomputer objects, so-called ‘agents.’ The relevant decisions and actions of real-worldhouseholds are captured by decision models and implemented as software algorithms.Relationships between real-world households, e.g. social influence, become links ofinformation flow between these computer objects. Thus, the real-world process ofinterest is modeled by object-oriented software and can be experimented with in avirtual environment (Sonnessa, 2004).
Agent-based modeling is suited for this study for two reasons. First, the one-to-onerelationship (van Dam et al., 2012) between real-world actors and agents makesmodeling results, e.g. impacts of modeled policies, more intuitive and therefore moreeasily understood. Second, agent-based modeling is uniquely able to capture humandecision-making (see Briegel et al., 2012; Jager and Janssen, 2012; Sopha et al., 2011),e.g. of innovation adoption and energy consumption behavior (Azar and Menassa, 2015;Chen et al., 2012).
SIMULATION MODEL
In this section are presented the specifications on the used simulation model. A baseversion of this model was previously presented by Jensen et al. (2016). The model

4.3. METHODS
4
69
purpose is to capture the effect of feedback devices on the adoption of energy-efficientheating behavior. For this study, we increased realism of this model by addinga word-of-mouth mechanism (see below). The main model elements and theirinteractions are described in the following.
Household agents Household agents make two relevant decisions: they decide aboutadoption of feedback devices and of energy-efficient heating behavior. The keyprocesses which the agents undergo include the diffusion of the CO2 meter; the feedbackeffect on its adopters, which may create changes in behavior, and the spreading ofthis behavior change via behavior diffusion. Households within a case area of the‘Innovation City Bottrop’2 are represented by household agents. They amount toa total of 31,840 agents. These agents are in one of three lifestyle groups, basedon commercial marketing data (Sinus Sociovision, 2015) that maps the distributionof sociological lifestyles within the city of Bottrop. Because these lifestyles showeddifferent affinities of adopting sustainable household products (Schwarz and Ernst,2009), households in the model were accordingly assigned to one of the followinglifestyle groups3: (1) ‘Leading Lifestyles’ of higher social status and more modern values,having the highest affinity for adopting feedback devices; (2) ‘Mainstream’ lifestyles ofintermediate social status—including those groups with more traditional values—whichhave an intermediate affinity for the feedback devices; and (3) ‘Hedonist’ lifestyles,which have a relatively low social status. The social network that connects the agents hasbeen modeled on two empirical data sources. The way in which this data was applied ingenerating a social network is presented by Jensen et al. (2016, appx. A).
Technology diffusion The technology diffusion process was transferred from themodel by Schwarz & Ernst (2009), which models diffusion of water-saving shower heads.This appliance was used as a proxy technology for feedback devices for the followingreasons: (1) both technologies have the purpose of saving thermal energy demand inthe household; (2) both technologies can be installed and used virtually without effort;(3) both technologies are cheap, meaning that their purchase does not represent asignificant barrier to their adoption or testing.
Following the empirical-based adoption decision model presented by Schwarz &Ernst, agents do not deliberate continuously on adoption, but at a monthly probability(δα) of 0.4%. At the point of deliberation, Leading Lifestyles always adopt devices.Mainstream agents adopt devices with a 50% probability and imitate their peers’majority otherwise. Hedonist agents always imitate the majority of their peers.
We extended the previously published version of this model by a word-of-mouthmechanism, to increase model realism. The previous model assumed all householdsto be be instantly able to adopt feedback devices. Instead, this study assumes thatconsumers can only adopt devices when aware of these devices. They become awareif at least one of their peers has previously been using the device.
2www.icruhr.de3Names of lifestyles are used as in the cited sources. Use of this naming in this study is intended as a value-free
reference to the Sinus marketing typology.

4
70 4. SIMULATING MARKETING STRATEGIES FOR FEEDBACK DEVICES
Feedback effect The way feedback devices affect behavior is modeled based on fieldtests of the CO2 meter (Jensen et al., 2016): households that use the CO2 meter adoptedshock ventilation with a probability of ca. 83.3%; this behavior change further savedaround 8% of a household’s heating energy.
Behavior diffusion Agents were modeled to deliberate on whether or not to adoptshock ventilation at random events. The assumed likelihood of these events over timewas based on the search frequency on Google for the German term for shock ventilation(i.e. ‘Stoßlüften’). We modeled the likelihood of deliberation on behavior adoption as asinus curve that was scaled linearly as in Eq. 4.1–4.2 and that peaks during winter.
δβ,annual (t ) =
0 before JUN 2008
0.235 after JUN 2009, before JUN 2010
1 after JUN 2010
(4.1)
adopti on =
1 if SNi ≥ THLD∗i
0 else
(4.2)
At deliberation, the behavioral intention of individual household agents isdetermined by a decision model that is based on the Theory of Planned Behavior (Ajzen,1991). Only if the ratio of influencing peers who adopt the behavior exceeds a threshold,adoption of the behavior take place. Over time, this threshold decreases for all agents,as they are assumed to receive positive information about shock ventilation from themedia.
PARAMETERIZATION
The model parameters and their range Table are shown in 4.2. All the simulation resultspresented here rely on a combination of model parameterizations. These parameterswere selected for their ability to present behavior diffusion patterns that representempirical patterns. For this parameter search, which was based on Pattern-OrientedModeling (40), we applied three empirical patterns (Jensen et al., 2016): (1) adoptionof shock ventilation in the study area would lie in the range of 32.3% to 44.3%; (2)8% to 23% of adoptions of shock ventilation results result from social influence viapersonal contact; the rest would come from information from media; (3) the majorityof agents who adopt shock ventilation at the beginning of a simulation run would adoptit intentionally.
4.3.4. IMPLEMENTATION OF MARKETING STRATEGIES
The following section discusses how the selected marketing strategies wereimplemented in the simulation model.
All strategies are comparable in scale of implementation and timeframe. Regardingscale, 1,000 household agents of the virtual city were sampled, representing about 3.1%of the overall population. The only exception to this is the strategy of lending out devices;in this simulation, 1,000 devices were lent out. Implementation of each strategy starts in
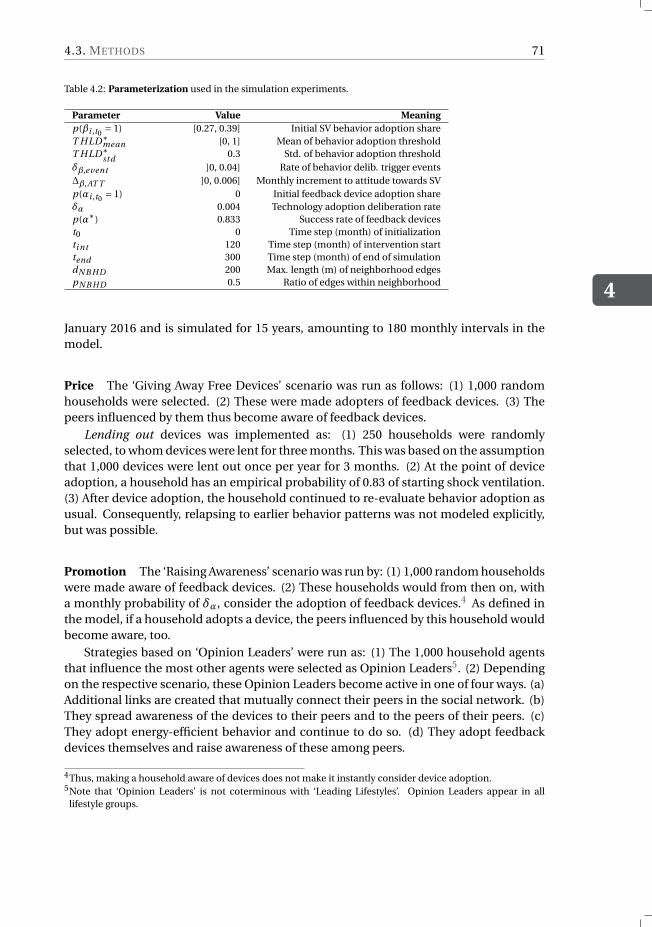
4.3. METHODS
4
71
Table 4.2: Parameterization used in the simulation experiments.
Parameter Value Meaning
p(βi ,t0 = 1) [0.27, 0.39] Initial SV behavior adoption shareT HLD∗
mean [0, 1] Mean of behavior adoption thresholdT HLD∗
std0.3 Std. of behavior adoption threshold
δβ,event ]0, 0.04] Rate of behavior delib. trigger events∆β,AT T ]0, 0.006] Monthly increment to attitude towards SVp(αi ,t0 = 1) 0 Initial feedback device adoption shareδα 0.004 Technology adoption deliberation ratep(α∗) 0.833 Success rate of feedback devicest0 0 Time step (month) of initializationti nt 120 Time step (month) of intervention starttend 300 Time step (month) of end of simulationdN B HD 200 Max. length (m) of neighborhood edgespN B HD 0.5 Ratio of edges within neighborhood
January 2016 and is simulated for 15 years, amounting to 180 monthly intervals in themodel.
Price The ‘Giving Away Free Devices’ scenario was run as follows: (1) 1,000 randomhouseholds were selected. (2) These were made adopters of feedback devices. (3) Thepeers influenced by them thus become aware of feedback devices.
Lending out devices was implemented as: (1) 250 households were randomlyselected, to whom devices were lent for three months. This was based on the assumptionthat 1,000 devices were lent out once per year for 3 months. (2) At the point of deviceadoption, a household has an empirical probability of 0.83 of starting shock ventilation.(3) After device adoption, the household continued to re-evaluate behavior adoption asusual. Consequently, relapsing to earlier behavior patterns was not modeled explicitly,but was possible.
Promotion The ‘Raising Awareness’ scenario was run by: (1) 1,000 random householdswere made aware of feedback devices. (2) These households would from then on, witha monthly probability of δα, consider the adoption of feedback devices.4 As defined inthe model, if a household adopts a device, the peers influenced by this household wouldbecome aware, too.
Strategies based on ‘Opinion Leaders’ were run as: (1) The 1,000 household agentsthat influence the most other agents were selected as Opinion Leaders5. (2) Dependingon the respective scenario, these Opinion Leaders become active in one of four ways. (a)Additional links are created that mutually connect their peers in the social network. (b)They spread awareness of the devices to their peers and to the peers of their peers. (c)They adopt energy-efficient behavior and continue to do so. (d) They adopt feedbackdevices themselves and raise awareness of these among peers.
4Thus, making a household aware of devices does not make it instantly consider device adoption.5Note that ‘Opinion Leaders’ is not coterminous with ‘Leading Lifestyles’. Opinion Leaders appear in all
lifestyle groups.

4
72 4. SIMULATING MARKETING STRATEGIES FOR FEEDBACK DEVICES
Place Product placement was implemented by differentiating the strategies of ‘GivingAway Devices’ and ‘Raising Awareness’: the randomly selected households were drawnfrom the respective target lifestyle group; see Table 4.1.
4.4. RESULTS AND DISCUSSION
To answer the stated research question, we conduced four simulation experiments. Thefirst two establish a connection between marketing strategies and their effects, both forthe case study of the device under review and for the ‘virtual city’ that was modeled.Experiments 3 and 4 test the generalizability of the findings for this case.
(1) Reference scenario. We first simulated ventilation behavior as would be expectedwithout any effect by feedback devices. This serves as a reference scenario from whichthe effects of marketing can be derived.
(2) Effects of marketing strategies. In this experiment, the effects of marketingstrategies are analyzed and compared. These effects are separated into device adoptionand the behavior change induced by marketing. As a result, it is possible to identify themost effective and cost-efficient marketing strategies and assist in the identification ofstakeholders capable of implementing such strategies.
(3) Sensitivity to policy location. A central aspect of flexibility in large-scalemarketing measures is location, e.g. measures carried out in different locations of acity. We thus compare the effects of the same interventions, but carried out in differentneighborhoods of the same city. This experiment thus tests to what degree effects aregeneralizable regarding the location of implementation in a city.
(4) Sensitivity to urban structure. Given that the previous experiments simulate thecity of Bottrop as a case study, we test generalizability to other cities. Therefore, wecompared the experimental results of the case study of our model city with four othervirtual cities with systematically varied socio-spatial structures.
4.4.1. EXPERIMENT 1: REFERENCE SCENARIO OF BEHAVIOR DIFFUSION
In this experiment, we generated a reference scenario of this behavior in the absenceof any measures. The simulated marketing strategies will later be compared to thisreference scenario in order to identify their impact.
Figure 4.1 presents the reference scenario of behavior diffusion for Bottrop.Over time, the share of people who adopt shock ventilation practices generally
increases, both according to the mean and within the 25th and 75th percentiles. Oneof the main factors for this trend is the effect of positive information from media inthe model. The stepwise increase in the adoption of shock ventilation occurs becauseenergy-efficient ventilation is more relevant to households during winter (Jensen et al.,2016).
Despite this positive trend, future behavior becomes increasingly uncertain overtime. Fig. 4.1 shows that over time the gap between the 25th and 75th percentiles,as well as between minimum and maximum, of adopting shock ventilation increases.Nevertheless, the trend towards more adoption of shock ventilation remains. Moreover,most simulation runs lie within a relatively narrow range between the 25th and 75th
percentiles.

4.4. RESULTS AND DISCUSSION
4
73
0
25
50
75
100
2006 2011 2016 2021 2026 2031
year
SV
ad
op
tio
n (
%)
250
500
750
1000
1250
Frequency
Figure 4.1: Behavior diffusion in the absence of feedback devices. The mean share of behavior adoption overall simulation runs is shown by the black line. The 25th and 75th percentiles are shown by the whiskers. In thebackground, the frequency of projected data points (from 280 simulation runs) is shown by the shading of thegray tiles.
4.4.2. EXPERIMENT 2: SIMULATING MARKETING STRATEGIES
We further compared marketing strategies based on their effect on the level of devicediffusion and on the adoption of shock ventilation practices, which is the main endpointof interest in this study.
MARKETING EFFECTS ON TECHNOLOGY DIFFUSION
We analyzed the effects of marketing strategies on device adoption in two steps: (1) foreach strategy we assessed the level of adoption of feedback devices over time; (2) weanalyzed in more detail the strategies of greatest impact.
Table 4.3 shows the effects of all simulations of marketing strategies on technologyadoption. Adoption rates are shown for 5, 10 and 15 years after policy implementation.In addition, conversion rates express the number of adopting households after 15 yearsrelative to the scale of the marketing strategies.
Simulation results show that marketing strategies varied significantly with regard toimpact. Some strategies caused over 10% of households to adopt a feedback device.Conversely, other strategies had no effect at all. Thus, conversion rates ranged from6.43 to 0; i.e. for each household targeted by a marketing campaign (or device lent out,respectively), up to ca. 6 adopters were gained in 15 years.
Targeted marketing was most effective when addressing the Leading Lifestyles group.This increased effect is based on two facts. (1) Leading Lifestyles were modeled to bemost inclined to adopt feedback devices. (2) Leading Lifestyles have more influenceon other households than other lifestyle groups do (Jensen et al., 2016, Table A.3).

4
74 4. SIMULATING MARKETING STRATEGIES FOR FEEDBACK DEVICES
Table 4.3: Effect of marketing strategies on technology adoption. ∆FD describes the effect on the share ofadoption after 5, 10 and 15 years. Standard deviations in parentheses. The conversion rate describes howmany households adopt the feedback device after 15 years relative to those who were targeted by the respectivemarketing strategy.
ID ∆FD after 5 yrs (%) ∆FD after 10 yrs (%) ∆FD after 15 yrs (%) Conversion rate after 15 years
GIVEal l 4.5 (0.1) 6.5 (0.2) 9.2 (0.4) 2.93 (0.13)GIVELL 5.4 (0.1) 8.2 (0.2) 11.7 (0.3) 3.73 (0.1)GIVEMS 4.6 (0.1) 6.7 (0.2) 9.4 (0.3) 2.99 (0.1)GIVEHD 3.5 (0.1) 4.4 (0.2) 5.7 (0.3) 1.81 (0.1)LEND 0.8 (0) 0.8 (0) 0.8 (0) 0.25 (0)AWAREal l 0.4 (0) 1.1 (0.1) 2 (0.1) 0.64 (0.03)AWARELL 0.9 (0.1) 2.3 (0.2) 4.2 (0.2) 1.34 (0.06)AWAREMS 0.4 (0) 1.1 (0.1) 1.9 (0.2) 0.6 (0.06)AWAREHD 0 (0) 0 (0) 0 (0) 0 (0)OLconnect 0 (0) 0 (0) 0 (0) 0 (0)OLaw ar e 4.5 (0.2) 9.5 (0.2) 14.9 (0.3) 4.74 (0.1)OLbeh 0 (0) 0 (0) 0 (0) 0 (0)OLdev 8.3 (0.2) 14 (0.2) 20.2 (0.3) 6.43 (0.1)
Combined, these two factors create a ‘trickle-down’ effect in the diffusion of feedbackdevices: an effective spreading from households of higher social status to those of lowerstatus.
The impact of marketing strategies generally increased over time. This is drivenby word-of-mouth processes reinforcing the marketing. After device adoption of anagent, its non-adopting peers become aware of the device and thus become capable ofadopting devices in the future. The only exception to this mechanism is the marketingstrategy of lending out devices to households, for which the word-of-mouth mechanismis not modeled.
Further, marketing strategies that address Opinion Leaders have the greatestconversion rates. This is directly based on their high degree of social engagement. Thisresults in an ability to influence more households than average (Rogers, 2010). Due tothe higher likelihood of households of higher social status influencing other households(Jensen et al., 2016), high social engagement is often disproportionally found in thegroup of Leading Lifestyles.
Following this aggregated comparison, we analyzed the most promising strategiesin detail. This aimed to analyze the effect over time as well as in ways that differentiatedamong lifestyle groups; it also facilitates a more detailed discussion on the most effectivemarketing strategies. These were the strategies GIVELL , OLdev , and OLaw ar e . Figure 4.2shows the diffusion of feedback devices by the lifestyle groups over time.
Among the marketing strategies that were most effective, differentiation amonglifestyle groups is consistent. In all cases, device adoption was greatest for LeadingLifestyles, lower for Mainstream, and lowest for Hedonists.
Marketing strategies also show variance in the degree to which they reach thethree lifestyle groups. When targeting Leading Lifestyles, the difference in adoptionbetween this group and the other ones increased. The relatively effective strategyof targeting exclusively the Leading Lifestyles group (in scenario GIVELL) leads toincreased disparities in the use of shock ventilation. This suggests a tradeoff betweenthe effectiveness of a strategy and the penetration levels required to reach other lifestyle
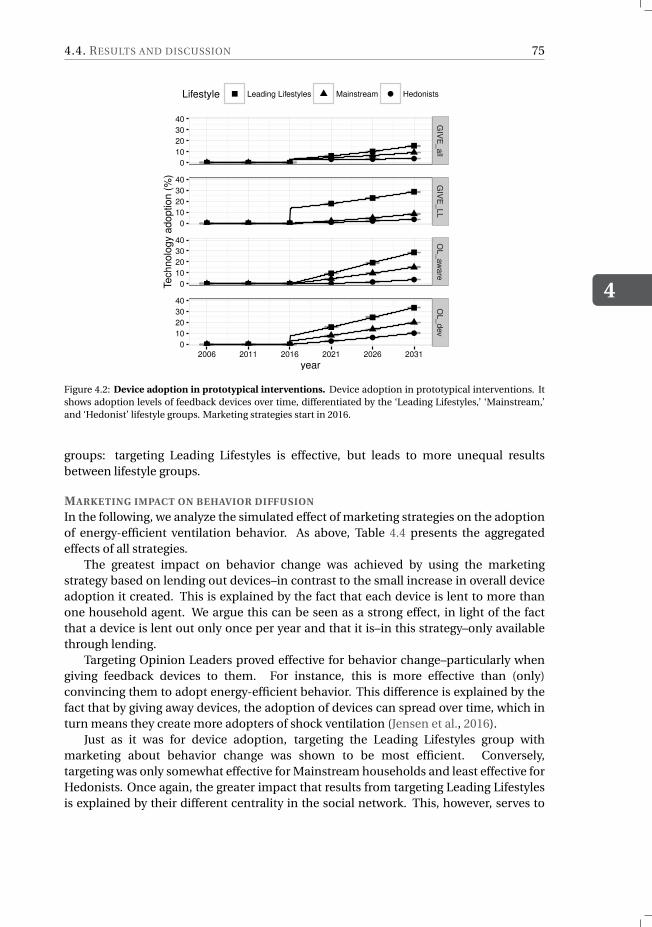
4.4. RESULTS AND DISCUSSION
4
75
● ●● ● ●
●
● ● ● ● ●●
● ● ● ● ●●
● ●●
●●
●
0
10
20
30
40
0
10
20
30
40
0
10
20
30
40
0
10
20
30
40
GIV
E_all
GIV
E_LL
OL_aw
are
OL_dev
2006 2011 2016 2021 2026 2031
year
Technolo
gy a
doption (
%)
Lifestyle ●Leading Lifestyles Mainstream Hedonists
Figure 4.2: Device adoption in prototypical interventions. Device adoption in prototypical interventions. Itshows adoption levels of feedback devices over time, differentiated by the ‘Leading Lifestyles,’ ‘Mainstream,’and ‘Hedonist’ lifestyle groups. Marketing strategies start in 2016.
groups: targeting Leading Lifestyles is effective, but leads to more unequal resultsbetween lifestyle groups.
MARKETING IMPACT ON BEHAVIOR DIFFUSION
In the following, we analyze the simulated effect of marketing strategies on the adoptionof energy-efficient ventilation behavior. As above, Table 4.4 presents the aggregatedeffects of all strategies.
The greatest impact on behavior change was achieved by using the marketingstrategy based on lending out devices–in contrast to the small increase in overall deviceadoption it created. This is explained by the fact that each device is lent to more thanone household agent. We argue this can be seen as a strong effect, in light of the factthat a device is lent out only once per year and that it is–in this strategy–only availablethrough lending.
Targeting Opinion Leaders proved effective for behavior change–particularly whengiving feedback devices to them. For instance, this is more effective than (only)convincing them to adopt energy-efficient behavior. This difference is explained by thefact that by giving away devices, the adoption of devices can spread over time, which inturn means they create more adopters of shock ventilation (Jensen et al., 2016).
Just as it was for device adoption, targeting the Leading Lifestyles group withmarketing about behavior change was shown to be most efficient. Conversely,targeting was only somewhat effective for Mainstream households and least effective forHedonists. Once again, the greater impact that results from targeting Leading Lifestylesis explained by their different centrality in the social network. This, however, serves to

4
76 4. SIMULATING MARKETING STRATEGIES FOR FEEDBACK DEVICES
Table 4.4: The effect of marketing strategies on the adoption of shock ventilation practice. ∆SV describesthe effect on the share of those who adopt after 5, 10 and 15 years (the significance of difference to baselinescenario is shown; *: p <0.1; **: p <0.01). The conversion rate describes how many households adopt thefeedback device after 15 years relative to how many were targeted by marketing.
ID ∆SV after 5 yrs (%) ∆SV after 10 yrs (%) ∆SV after 15 yrs (%) Conversion rate after 15 yrs
GIVEal l 2.9 (9.5) 4.2 (12.9) 5.2 (15.8) 1.66 (5.03)GIVELL 3.3 (9.3) 5.2 (12.7) * 6.5 (15.5) * 2.07 (4.94)GIVEMS 2.8 (9.5) 4.1 (12.9) 5.2 (15.7) 1.66 (5.00)GIVEHD 2.4 (9.4) 3.2 (13) 3.7 (16.1) 1.18 (5.13)LEND 7.9 (9.2) ** 14.5 (11.9) ** 18.9 (13.9) ** 6.02 (4.43)AWAREal l 0.3 (9.8) 0.6 (13.5) 0.9 (16.5) 0.29 (5.25)AWARELL 0.3 (9.7) 1.1 (13.2) 1.8 (16.2) 0.57 (5.16)AWAREMS 0.4 (9.8) 0.8 (13.6) 1.2 (16.6) 0.38 (5.29)AWAREHD -0.1 (9.9) -0.1 (13.6) -0.1 (16.7) -0.03 (5.32)OLconnect 0.4 (10) 0.8 (13.8) 1.2 (17) 0.38 (5.41)OLaw ar e 2.6 (9.5) 5.5 (12.7) * 7.8 (15.3) * 2.48 (4.87)OLbeh 3.3 (9.3) 4.1 (12.9) 4.3 (16.2) 1.37 (5.16)OLdev 5.8 (9.2) * 9.2 (12.4) ** 11.5 (15) ** 3.66 (4.78)
5 (years) 10 (years) 15 (years)
n.s
.n.s
.n.s
.n.s
.n.s
.n.s
.n.s
.n.s
.n.s
.n.s
.n.s
.n.s
.n.s
.n.s
.n.s
.n.s
.n.s
.n.s
.n.s
.n.s
.
n.s
.n.s
.n.s
.n.s
.n.s
.n.s
.n.s
.n.s
.n.s
.n.s
.n.s
.n.s
.n.s
.n.s
.n.s
.n.s
.n.s
.n.s
.n.s
.n.s
.
**************************************** n.s
.n.s
.n.s
.n.s
.n.s
.n.s
.n.s
.n.s
.n.s
.n.s
.n.s
.n.s
.n.s
.n.s
.n.s
.n.s
.n.s
.n.s
.n.s
.n.s
.
********************
n.s
.n.s
.n.s
.n.s
.n.s
.n.s
.n.s
.n.s
.n.s
.n.s
.n.s
.n.s
.n.s
.n.s
.n.s
.n.s
.n.s
.n.s
.n.s
.n.s
.
**************************************** n.s
.n.s
.n.s
.n.s
.n.s
.n.s
.n.s
.n.s
.n.s
.n.s
.n.s
.n.s
.n.s
.n.s
.n.s
.n.s
.n.s
.n.s
.n.s
.n.s
.
********************
n.s
.n.s
.n.s
.n.s
.n.s
.n.s
.n.s
.n.s
.n.s
.n.s
.n.s
.n.s
.n.s
.n.s
.n.s
.n.s
.n.s
.n.s
.n.s
.n.s
.
**************************************** n.s
.n.s
.n.s
.n.s
.n.s
.n.s
.n.s
.n.s
.n.s
.n.s
.n.s
.n.s
.n.s
.n.s
.n.s
.n.s
.n.s
.n.s
.n.s
.n.s
.
0
25
50
75
100
Reference Marketing Reference Marketing Reference MarketingStr
ate
gy G
IVE
_LL:
SV
adoption (
%)
5 (years) 10 (years) 15 (years)
**************************************** ******************************************************************************** **************************************** **************************************** ******************************************************************************** **************************************** **************************************** ******************************************************************************** ****************************************0
25
50
75
100
Reference Marketing Reference Marketing Reference Marketing
Str
ate
gy L
EN
D:
SV
adoption (
%)
5 (years) 10 (years) 15 (years)
**************************************** ************************************************************ **************************************** **************************************** ************************************************************ **************************************** **************************************** ************************************************************ ****************************************
0
25
50
75
100
Reference Marketing Reference Marketing Reference Marketing
Str
ate
gy O
L_dev:
SV
adoption (
%)
5 (years) 10 (years) 15 (years)
n.s
.n.s
.n.s
.n.s
.n.s
.n.s
.n.s
.n.s
.n.s
.n.s
.n.s
.n.s
.n.s
.n.s
.n.s
.n.s
.n.s
.n.s
.n.s
.n.s
.
n.s
.n.s
.n.s
.n.s
.n.s
.n.s
.n.s
.n.s
.n.s
.n.s
.n.s
.n.s
.n.s
.n.s
.n.s
.n.s
.n.s
.n.s
.n.s
.n.s
.
********************n.s
.n.s
.n.s
.n.s
.n.s
.n.s
.n.s
.n.s
.n.s
.n.s
.n.s
.n.s
.n.s
.n.s
.n.s
.n.s
.n.s
.n.s
.n.s
.n.s
.
********************
n.s
.n.s
.n.s
.n.s
.n.s
.n.s
.n.s
.n.s
.n.s
.n.s
.n.s
.n.s
.n.s
.n.s
.n.s
.n.s
.n.s
.n.s
.n.s
.n.s
.
**************************************** ******************** ********************
n.s
.n.s
.n.s
.n.s
.n.s
.n.s
.n.s
.n.s
.n.s
.n.s
.n.s
.n.s
.n.s
.n.s
.n.s
.n.s
.n.s
.n.s
.n.s
.n.s
.
**************************************** ********************
0
25
50
75
100
Reference Marketing Reference Marketing Reference MarketingStr
ate
gy O
L_aw
are
: S
V a
doption (
%)
Lifestyle
All
Leading Lifestyles
Mainstream
Hedonists
year
Mark
eting s
trate
gie
s
Figure 4.3: Adoption of shock ventilation in the most effective marketing strategies. Adoption by marketingis compared to the reference scenario in the absence of feedback devices. Comparison is shown separately forall agents and the three lifestyle groups, respectively.
reinforce marketing campaigns. When raising awareness of devices is the issue, oneadditional factor is the different level of interest in adoption. After being made awareof such devices, Leading Lifestyles adopt devices eventually, and Mainstream agentsto an intermediate degree, but Hedonists only do if the majority of their peers already

4.4. RESULTS AND DISCUSSION
4
77
do. Thus, the awareness campaigns prompt word-of-mouth effects of different strengthsamong the different demographic groups.
Marketing strategies that are based on creating awareness of the availability ofdevices appears to have the lowest rate of effectiveness. In fact, making Hedonist agents‘aware’ had no effect at all. This is because even if agents of this group become aware ofdevices, they would only adopt them if the majority of their peers have already done so.
We analyzed scenarios with the highest effects (i.e. GIVELL , LEND, OLdev , andOLaw ar e ) in detail, see Figure 4.3. Of these strategies, LEND is the only strategy thataffected all lifestyles equally. This is because agents are selected randomly for devicesbeing lent to them. Diffusion of technology does not take place. Consequently, thedifferent levels of interest in feedback devices among lifestyle groups do not affect theoverall impact of their use.
The other strategies exert the greatest effect on households in the Leading Lifestylesgroup. Even strategies OLbeh and OLdev , which only target Opinion Leaders, had thehighest impact on this group. This is highlighted by the significance levels in Fig. 4.3.This difference results because households in this lifestyle group are well-connectedsocially and relatively interested in the adoption of feedback devices.
Cost efficiency of marketing In this section, after having analyzed the effectiveness ofmarketing strategies, we discuss cost efficiency. We first estimated the cost of the maincomponents of marketing feedback devices. From this, it is possible to determine thecost efficiency of the modeled marketing strategies in inducing behavior changes.
We argue that the cost of marketing depends on three general components:awareness, devices and training, as indicated in Table 4.5. Awareness represents eithermaking a household aware of feedback devices or facilitating their engagement in othermarketing strategies. Its cost is estimated to be e5–20 per household, assuming anonline marketing campaign that is geographically confined to one city. On average, itcosts less than e2 to create awareness in a customer (i.e. ‘cost per click’) (HochmanConsultants LLC, 2016). Additionally, designing an awareness campaign would result inestimated costs of e5–20 per household. Device costs would be e50–75, representingthe costs of parts and assembly of a CO2 meter. Training of Opinion Leaders wouldamount toe20–100 per Opinion Leader, ranging from simply providing catering for twoworkshops, up to the potential cost of a location and staff for training.
Table 4.5: Cost components of marketing strategies for feedback devices.
Cost component Represents Min. cost (e) Max. cost (e)
awareness Making one household aware 5 10device Giving away one device 50 75training Training an Opinion Leader 20 100
Table 4.6 compares marketing strategies in their costs and cost efficiencies. The costof the different marketing strategies are calculated as follows. The GIVE strategies requiremaking households aware of the availability of devices and then providing them withsuch devices. For the LEND strategy, the cost of awareness is inversely correlated withthe number of times a device is lent out (i.e. once per year over 15 years). The AWARE

4
78 4. SIMULATING MARKETING STRATEGIES FOR FEEDBACK DEVICES
strategies naturally only include the costs of making households aware. LeveragingOpinion Leaders (OL strategies) requires raising the awareness of potential OpinionLeaders, and then providing them with training. All strategies are related to either thenumber of households that are targeted or the number of devices that are lent out, whichis the same for all strategies.
We will first identify the most cost-efficient ones within the four groups of marketingstrategies, before proceeding to compare these four groups. Within the two categoriesof ‘Raising Awareness about Devices’ and ‘Giving Away Free Devices,’ all strategies areassumed to have similar costs. Thus, the most effective strategies from these categorieswithin each group are also the most cost-efficient ones (i.e. GIVELL and AWARELL).For both categories, these are the ones that target Leading Lifestyles. In the group of‘Leveraging Opinion Leaders,’ the most cost-efficient strategy is to use Opinion Leadersto spread awareness about feedback devices (OLaw ar e ). Giving feedback devices toOpinion Leaders (OLdev )–the most effective strategy in this group–would neverthelessalso result in higher costs and is therefore less cost-efficient.
Among these best strategies from these four groups, raising awareness aboutfeedback devices among the Leading Lifestyles group was the most cost-efficient.Lending out feedback devices (LEND) and raising awareness of them through OpinionLeaders (OLaw ar e ) had a similar level of cost efficiency. However, the cost efficiencyrange of the lending strategy is less uncertain and slightly better. Giving out feedbackdevices to the Leading Lifestyles (GIVELL) was the least cost-efficient approach.
Stakeholders available for implementation The availability of stakeholders toimplement the marketing strategies simulated here is a critical question. Availablestakeholder types would first need an interest in households using a feedback deviceor in heating their homes efficiently. Second, they should be capable of implementingsuch strategies. The following section discusses what types of agents would be suitablestakeholders; these are presented along the three highlighted marketing strategiesregarding price, promotion and place.
(1) Giving discounts on feedback devices or giving them away for free requiressignificant financial resources. This in turn requires stakeholders to be sufficientlymotivated. This seems to be the case for at least two stakeholder types. First, ahousing rental company would have substantial advantages in convincing its tenantsto practice shock ventilation, which would reduce indoor humidity and mold damage tobuildings (Galvin, 2013). Energy utilities—through the energy context of their customerrelationships—could market the CO2 meters to their customers as a tool to save energyas well. These utilities, in many EU countries, are also the main providers of Smart Homedevices; feedback devices for heating behavior can be integrated into these systemsas well. By giving out devices at lower prices, the utility could benefit from improvedcustomer relations.
Regarding the lending out of feedback devices, public-private partnershiporganizations, such as the aforementioned Innovation City Management GmbH couldbe a suitable stakeholder to lend out feedback devices. In the past, this company haseven declared an interest in doing so.

4.4. RESULTS AND DISCUSSION
4
79
Table 4.6: Cost-efficiency of scenarios
Mar
keti
ng
stra
tegy
Co
stco
mp
osi
tio
nM
arke
tin
gco
stp
erH
H/d
evic
e(e
)C
on
vers
ion
rate
Beh
avio
rco
nve
rsio
nco
stp
erH
H(e
)G
IVE
all
(aw
are
nes
s+
dev
ice)
·n
r_h
ouse
hol
ds
55–8
51.
6633
–51
GIV
EL
L(a
wa
ren
ess
+d
evic
e)·
nr_
hou
seh
old
s55
–85
2.07
27
–4
1
GIV
EM
S(a
wa
ren
ess
+d
evic
e)·
nr_
hou
seh
old
s55
–85
1.65
33–5
2G
IVE
HD
(aw
are
nes
s+
dev
ice)
·n
r_h
ouse
hol
ds
55–8
51.
1747
–73
LE
ND
(aw
are
nes
s·
yea
rs+
dev
ice)
·n
r_d
evic
es13
0–15
56.
012
2–
25
AW
AR
Ea
lla
wa
ren
ess·
nr_
hou
seh
old
s5–
100.
2917
–34
AW
AR
EL
La
wa
ren
ess·
nr_
hou
seh
old
s5–
100.
598
–1
7
AW
AR
EM
Sa
wa
ren
ess·
nr_
hou
seh
old
s5–
100.
3813
–26
AW
AR
EH
Da
wa
ren
ess·
nr_
hou
seh
old
s5–
100
∞
OL
con
nec
t(a
wa
ren
ess
+tr
ain
ing
)·
nr_
hou
seh
old
s25
–110
0.39
64–2
82O
La
wa
re(a
wa
ren
ess
+tr
ain
ing
)·
nr_
hou
seh
old
s25
–110
2.48
10
–4
4
OL
beh
(aw
are
nes
s+
tra
inin
g)·
nr_
hou
seh
old
s25
–110
1.37
18–8
0O
Ld
ev
(aw
are
nes
s+
tra
inin
g+
dev
ice)
·n
r_h
ouse
hol
ds
75–1
853.
6620
–51

4
80 4. SIMULATING MARKETING STRATEGIES FOR FEEDBACK DEVICES
(2) Stakeholders can inform consumers about the availability of feedback devices viaadvertisement campaigns. For instance, consumer advisory organizations can providesuch information to households. Due to the relatively low costs of advertising, allinterested stakeholders would in principle be able to provide such information.
We argue that leveraging Opinion Leaders should preferably be carried out by astakeholder that has high potential of reaching them. We expect Opinion Leaders tobe found if they are active in civil society, e.g. in environmental conservation groups.Ideally, such Opinion Leaders would be stakeholders from a cross-section of societyrather than a homogeneous connection, e.g. of a housing company or a retail store.Instead, a consumer advisory organization could be better suited to identify OpinionLeaders, due to its local knowledge.
(3) We stress that stakeholders differ significantly in their capabilities to target socialgroups. Housing companies and energy utilities have direct connections to manyhouseholds. In the past, charity organizations have also given away energy-savingappliances to these households (Caritas, 2016). This could also be done with feedbackdevices. In principle, public welfare systems could implement energy savings and splitthe savings between the beneficiaries and the taxpayers. However, this was found tobe unfeasible in Germany for legal reasons (Institut für Energie-und UmweltforschungHeidelberg GmbH, 2009). Retail shops, however, are also interested in the spread ofnovel technology. They would have the option to advertise and supply novel devices.
Combining this availability of stakeholders to implement marketing strategies withthe simulated impacts of these strategies revealed two insights regarding stakeholdersthat appear relevant for marketing feedback devices.
First, stakeholders whose interest focuses on lower-income groups appear less suitedto support the marketing of feedback devices. This is due to the finding that targetinghouseholds of high social status makes marketing more effective in general than thetargeting of households of lower social status. Consequently, stakeholders focusing onwelfare services to low-income households would only be suitable to market feedbackdevices to a limited degree.
Second, the contrasting impacts of the lending strategy in the adoption of technologyand behavior suggest that this strategy is best implemented by stakeholders with aninterest in maximizing behavior change, instead of device adoption. Some stakeholders(e.g. retailers) could be more interested in maximizing device adoption rather than anybehavioral changes on the part of their customers. Others (e.g. consumer advisoryorganizations) could be more interested in creating behavior change. For the strategyof lending out devices, the number of adopted devices is low, whereas the impact onbehavior change is relatively high. With the relatively low number of devices neededfor the lending strategy, this in particular would dovetail with the interests of the latterstakeholder group.
4.4.3. EXPERIMENT 3: GENERALIZABILITY ACCORDING TO
NEIGHBORHOOD
Besides knowing which marketing strategies are effective, it would be useful to knowwhere their implementation would be most effective. Likewise, if marketing is carried

4.4. RESULTS AND DISCUSSION
4
81
out at one area, it is of practical interest how other areas are affected by this. Therefore,we compared the impact of marketing between different parts of the city of Bottrop.
As a first step of this comparison, we chose a simulated implementation of onerelatively effective marketing strategy, GIVELL , in the case study city in general, as wellas in three of its neighborhoods. For all of these three areas, sufficient households ofeach lifestyle group were available. We chose this strategy because it is the most effectivestrategy that (unlike the LEND strategy) can facilitate the process of device diffusion–andthus would in principle be most prone to spatially differentiated impacts.
Figure 4.4 shows the location of these three neighborhoods in which the policy isimplemented, and adoption of shock ventilation 15 years after strategy implementationfor each neighborhood. The results suggest that marketing has the highest impactat its location of implementation. This is shown by the consistent pattern that theneighborhood in which the policy was implemented is also subject to the greatestimpact.
The results further indicate that the neighborhood in which the policy wasimplemented is the only one which diverges significantly in impact from the city ingeneral. Targeting an individual neighborhood with a given policy implementationleads to a different effect from this intervention only in this neighborhood. Thus, theplace of policy implementation influences the place of greatest effect. Conversely,neighborhoods adjacent to the neighborhood of implementation did not experience anygreater impact than those that were at a greater distance.
To test whether varying the specific location of policy implementation matters forthe whole city, we compare impacts from these three scenarios on the city level. Fig.4.5 shows the adoption of shock ventilation practices for the overall city and for allmarketing strategies 15 years after implementation.
This comparison indicates that the location of marketing does not significantly affectthe impact on a city scale—with the exception of targeting of Opinion Leaders. Theimpact caused by the same marketing strategies did not change significantly whenimplemented at different locations. The only exception to this appeared to be thetargeting of Opinion Leaders. This was shown to be more successful at the level of thecity as a whole. We traced this back to the fact that Opinion Leaders are ‘hubs’ in a socialnetwork. The larger these hubs—ceteris paribus—the more effective their leverage. Notconstraining the marketing campaign spatially (e.g. to a neighborhood) would allow thecampaign to reach larger hubs. Consequently, greater impacts could be achieved.
Thus, varying the location of policy implementation has two—seeminglycontrasting—effects: concentrating policy implementation in a neighborhood increasedits effect locally. Conversely, such concentration of implementation did not significantlychange impact on the city scale.
4.4.4. EXPERIMENT 4: GENERALIZABILITY FROM THE CASE CITY
In addition to the sensitivity to the place of marketing, it is also important to knowwhether findings also hold for cities other than the modeled city in the case study.Testing previous findings from this study would allow a determination of generalizabilityto other cities. This knowledge is important for any actions derived from this study thatwill be outside the case of Bottrop.
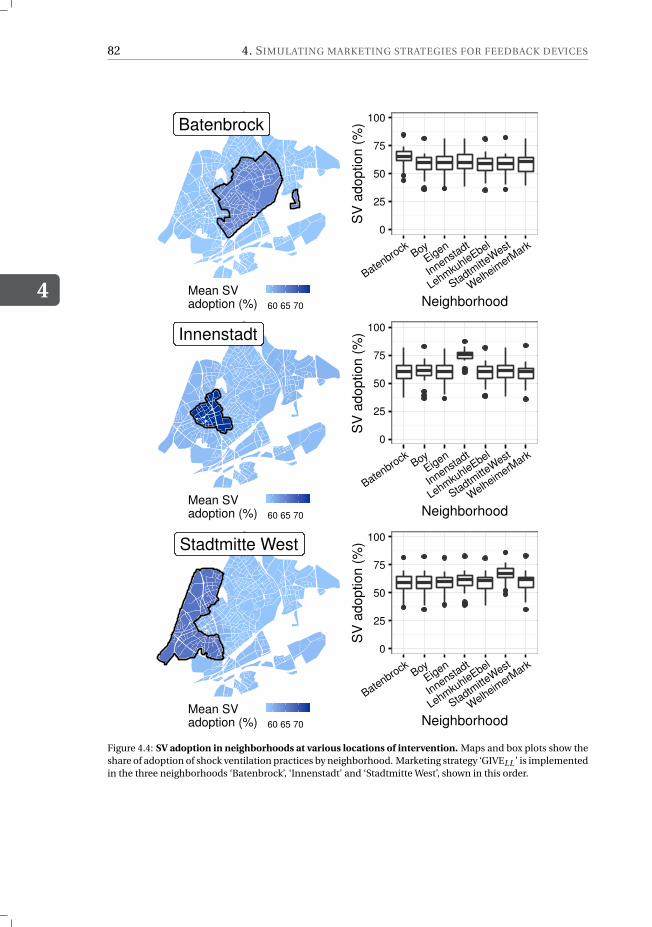
4
82 4. SIMULATING MARKETING STRATEGIES FOR FEEDBACK DEVICES
Batenbrock
60 65 70
Mean SV adoption (%)
0
25
50
75
100
Batenbrock Boy
Eigen
Innenstadt
LehmkuhleEbel
Stadtmitte
West
Welheim
erMark
Neighborhood
SV
ad
op
tio
n (
%)
Innenstadt
60 65 70
Mean SV adoption (%)
0
25
50
75
100
Batenbrock Boy
Eigen
Innenstadt
LehmkuhleEbel
Stadtmitte
West
Welheim
erMark
Neighborhood
SV
ad
op
tio
n (
%)
Stadtmitte West
60 65 70
Mean SV adoption (%)
0
25
50
75
100
Batenbrock Boy
Eigen
Innenstadt
LehmkuhleEbel
Stadtmitte
West
Welheim
erMark
Neighborhood
SV
ad
op
tio
n (
%)
Figure 4.4: SV adoption in neighborhoods at various locations of intervention. Maps and box plots show theshare of adoption of shock ventilation practices by neighborhood. Marketing strategy ‘GIVELL ’ is implementedin the three neighborhoods ‘Batenbrock’, ‘Innenstadt’ and ‘Stadtmitte West’, shown in this order.

4.4. RESULTS AND DISCUSSION
4
83
0
25
50
75
100
GIV
E all
GIV
E LL
GIV
E MS
GIV
E HD
LEND
AWAR
E all
AWAR
E LL
AWAR
E MS
AWAR
E HD
OL co
nnec
t
OL aw
are
OL de
v
OL be
h
Marketing strategy
Sh
ock−
ven
tila
tio
n a
do
ptio
n in
city (
%)
Neighborhood of implementation
City Bottrop
Neighborhood Batenbrock
Neighborhood Innenstadt
Neighborhood Stadtmitte West
Figure 4.5: Overall adoption of shock ventilation at various places of marketing. For each marketing strategy,adoption throughout the entire city was compared 15 years after initial marketing in the whole city or in oneof three neighborhoods.
To test this sensitivity, we compare marketing effects among the following five cities:(1) The model city of Bottrop serves as a reference.(2) Two cities were generated that, respectively, decrease and increase local
clustering of lifestyles. This was implemented by either completely clustering or mixinglifestyles at the street level. As a result, however, the difference in social structurebetween neighborhoods was only minimally affected. This variable is likely to differamong cities, as other cities would be less or more homogeneous socially.
(3) Two random cities were used to test for extreme variation in urban structure.They were generated by moving the modeled households from the virtual case city toa random location in a spatial bounding box the size of Bottrop. These householdswere then connected by a newly generated social network that, like for the modeled city,corresponds to the empirical data on social structure. We thus randomized the spatialstructure of the virtual city case, without compromising the realism of the social network.This measure did not change the relative composition of lifestyles between the threecities either.
Fig. 4.6 compares adoption of shock ventilation between these five virtual cities forall marketing strategies, 15 years after implementation. These strategies are simulatedover all empirically calibrated parameter combinations.
Results show that the difference in impact among cities of an intervention appearsinsignificant. The differences in implementation strategies is a stronger factor than the

4
84 4. SIMULATING MARKETING STRATEGIES FOR FEEDBACK DEVICES
0
25
50
75
100
GIV
E all
GIV
E LL
GIV
E MS
GIV
E HD
LEND
AWAR
E all
AWAR
E LL
AWAR
E MS
AWAR
E HD
OL co
nnec
t
OL aw
are
OL de
v
OL be
h
Marketing strategy
Sh
ock−
ven
tila
tio
n a
do
ptio
n in
city (
%)
City
City Bottop
Higher clustering
Lower clustering
Random city A
Random city B
Figure 4.6: Adoption of shock ventilation practice at various virtual cities. For each marketing strategy,adoption throughout an entire city was compared 15 years after carrying out marketing strategies in one offive virtual cities.
differences among cities. The degree of local clustering of lifestyles and socio-spatialstructure do not appear to influence the success of a marketing strategy. This could bedue to the high ratio of social connections between neighborhoods (50%, see Table 4.2).
However, from the second experiment (see 4.4.2) the conclusion can be drawn thatthe lifestyle composition in a city would influence the impact of marketing. A city witha higher ratio of households of the Leading Lifestyles group (i.e. of highest social status)would also likely experience greater effects.
Overall, the generalizability of marketing strategies between different cities andurban structures was found to be high. This indicates that policy assessment in thisstudy can be transferred from the model city case to others with a similar compositionof lifestyle demographics.
4.4.5. VALIDATION AND LIMITATIONS
For the applied model needed to be assured that simulation results capture the realworld, thus ecological validity needed to be shown. This was taken out in three ways:(1) Empirical data was directly integrated into the model. This was done for modelingthe effect of the CO2 meter in households, as well as for the probability of feedbackactually changing household behavior. (2) We further used ‘Pattern-Oriented Modeling,’a validation method that ensures that simulation results coincide with empiricallyobserved patterns (Grimm et al., 2005). In particular, the behavior diffusion process

4.5. CONCLUSION
4
85
was validated with this technique. To do this, we used patterns of adoption levels ofenergy-efficient ventilation behavior, the role of social influence in causing its adoption,and the degree to which this adoption conforms to intentions (see Section 4.3.3). (3) Tovalidate the technology diffusion process, the so-called ‘TAPAS validation’ method wasapplied (Frenken, 2006, p. 151).We used an existing model on the diffusion of a relativelysimilar, environmentally friendly household product class: water-saving appliances(Schwarz and Ernst, 2009). This model was validated with historical diffusion data forthis proxy technology. We thus based the diffusion of feedback devices by the diffusionof this proxy, in order to reduce uncertainty about the diffusion of behavior-changingfeedback devices.
Limitations We expect the results of this study to be affected by the selected marketingstrategies, limitations regarding estimates of marketing costs, and the uncertain natureof forecasting itself.
Some marketing strategies were not possible to be modeled due to the modelstructure. Moreover, charting the changing preferences of consumers was not possible,because these are not part of the model used. However, we regard the selection ofthe modeled marketing strategies as appropriate and meaningful. This is because thisselection spans a wide range of marketing options and covers its relevant categoriesof price, promotion, and place. Furthermore, within this selection, we particularlycompared strategies that showed as promising in the literature.
Even though we could estimate the cost efficiency of multiple marketing strategiesassessed in this study, cost efficiency remained uncertain. Therefore, we limitedourselves to giving cost ranges for the marketing strategies. Consequently, ranges ofestimated cost efficiency overlap, making it uncertain which strategies are most costefficient. However, we regard this uncertainty as inherent, as different stakeholdersmight have different costs for respective types of marketing. We further dealt with thisuncertainty by examining it in the discussion.
Overall, residual uncertainty of the model results has to be considered as high, whichnaturally calls for a careful interpretation of simulation results. The main reason for thisis the discussed high uncertainty of the future of complex socio-technical systems (vanDam et al., 2012). Another reasons is the simplification from reality, which is necessaryto any model-based analysis. Finally, also the possibility of partial imprecision of thesimulation model could only be excluded to the degree this was done in the validationprocedure (see Section 4.4.5). Due to thus residual uncertainty, we consider the mostvaluable results generated by this simulation study the relatively robust comparisonbetween marketing strategies—not necessarily the simulated absolute levels of impacts.
4.5. CONCLUSION
In this study we aimed to answer the following research question: Which innovationmanagement is most effective at creating additional energy-efficient heating behaviorvia the marketing of behavior-changing feedback devices? Marketing strategies forfeedback devices successfully resulted in additional adoption of energy-efficientventilation behavior, particularly when: (1) the use of feedback devices was incentivized

4
86 4. SIMULATING MARKETING STRATEGIES FOR FEEDBACK DEVICES
economically by giving away or lending out some devices for free; (2) the social influenceof well-connected Opinion Leaders (i.e. households that are particularly influential forothers) was leveraged to promote the devices; and (3) households of higher social statuswere targeted primarily by marketing.
The core mechanism creating this effect is the result of two processes: the directimpact of a given marketing strategy and its amplification through the distribution offeedback devices on the one hand, and on the other hand an increase in energy-efficientbehavior via social connections. Marketing strategies (e.g. giving away free devicesor raising awareness about them among households) can have an effect on their own.These interventions may persuade more households to adopt these devices, which willin turn cause a majority of these device adopters to adopt energy-efficient behavior.This added energy-efficient behavior (being the direct result of the marketing strategyor of device adoption) then amplifies the spread of energy-efficient behavior. Marketingstrategies assessed in this study varied significantly in effectiveness and cost efficiency.These differences are summarized in Table 4.7.
Table 4.7: Results on marketing strategies, indicating effectiveness and cost efficiency in creating adoption ofenergy-efficient heating behavior.
Scenario Effectiveness Cost efficiency
GIVEal l + +GIVELL ++ ++
GIVEMS + +GIVEHD + +LEND +++ ++
AWAREal l +/- ++AWARELL +/- +++
AWAREMD +/- ++AWAREHD +/- -OLconnect +/- -OLaw ar e ++ ++
OLben ++ +OLdev ++ ++
Effectiveness of innovation management via marketing This simulation studyallowed us to compare the effectiveness of marketing strategies that used economicincentives, promotion, and placement to different degrees.
The economic incentive of lending out feedback devices was the most effectivestrategy. This approach resulted in the highest ratio of additional adopters ofenergy-efficient behavior relative to the number of devices that were lent out. Thealternative economic incentive of giving away devices for free was successful to a lesserdegree. We thus stress the practical potential of lending out individual feedback devicesto households.
The promotional approach of raising awareness about the availability of feedbackdevices was the least effective marketing strategy. The only exception to this was thepotential to use Opinion Leaders to raise awareness about the devices not just amongtheir peers, but also among the peers of these peers. In contrast, marketing strategiesthat caused the greatest impact were those that either gave away devices to households

4.5. CONCLUSION
4
87
or targeted Opinion Leaders. In particular, giving devices away to households of theLeading Lifestyles group was effective in convincing more households to start using thedevices.
Targeting different social groups with marketing campaigns changed theireffectiveness significantly. Targeting Opinion Leaders and members of the LeadingLifestyle group appeared most effective. The effect was greatest for Leading Lifestyles,lower for Mainstream, and lowest for Hedonists. Findings regarding this order ofeffect were robust in all variants of marketing strategies.6 Therefore, we suggestprimarily targeting Opinion Leaders or households of the Leading Lifestyles. In practice,identification of households to be targeted can be done by using commercial marketing,such as the here applied Sinus marketing typology.
Adjusting the targeting of marketing spatially—within an entire city or itsneighborhoods—generally determined the main area of impact, but not the overallimpact. Thus, when it is of interest to maximize impact in a local area, then this areashould be the focus of marketing activities. For maximizing the impact on a city scale,however, it did not matter which of its parts were targeted. The only exception tothe latter finding is the targeting of Opinion Leaders. When targeting these, resultsindicated the desirability of utilizing the most influential Opinion Leaders from an entirecity–instead of being spatially restricted to a single neighborhood.
Overall, we found lending out devices to be the most effective marketing strategyto promote feedback devices. Giving away devices and targeting Opinion Leaders were,regarding device adoption, among the most effective strategies. Raising awareness aboutfeedback devices appeared to be least effective.
Cost-efficiency of innovation management The estimated cost efficiency ofmarketing strategies has a somewhat different order than their effectiveness. (1)The most cost-effective measure is raising awareness among agents. This strategy, whentargeting households of higher social status, is among the least effective, but it is costeffective due to its low price. (2) Lending out feedback devices was the second-beststrategy. Even though feedback devices need to be provided for this intervention, theircost is low because a device can be lent out multiple times. (3) Leveraging OpinionLeaders was shown to be slightly less cost-effective than lending out devices, due tothe costly training that would have to be given to Opinion Leaders. Nevertheless, thebest marketing strategy leveraging the high social engagement and influence of OpinionLeaders was that of raising awareness about feedback devices within their social circle.This strategy combined high effectiveness with a relatively low cost, because no devicesneed to be subsidized. (4) Finally, the relatively effective marketing strategy of givingaway some free devices was found to be least cost efficient, because they requiresponsorship of free feedback devices. Of this subset of strategies, targeting householdsof higher social status still has the best cost efficiency.
We stress that the cost efficiency of these strategies can vary depending on whichstakeholder implements them. For instance, if a sponsorship of free feedback devicescannot be done cost efficiently, the marketing strategies of giving away or lending
6The only exception is the—relatively successful—strategy of lending out devices, which did not create aneffect that varied between lifestyles.

4
88 4. SIMULATING MARKETING STRATEGIES FOR FEEDBACK DEVICES
out devices would in turn result in higher costs. Conversely, the cost efficiency ofmarketing that leverages Opinion Leaders depends significantly on whether training canbe supported by available resources or needs to be outsourced (e.g. workshop rooms ortraining staff).
Role of stakeholders in rolling out feedback devices Stakeholders who might supportfeedback devices might nevertheless also have very different interests: maximizingdevice adoption does not necessarily imply the adoption of energy-efficient heatingbehavior, or vice versa. We have identified some relevant types of stakeholders who likelywould be more interested in maximizing device utilization to be, for instance, energyutilities and retailers. Conversely, organizations that might prioritize the end of behaviorchange could be consumer advisory organizations and public-private partnerships withsustainability goals.
Both these groups could reach their goals with a set of overlapping strategies–withthe lending out of devices being the only exception. Both the adoption of feedbackdevices and of energy-efficient behavior can be supported effectively by leveragingOpinion Leaders and by giving away free devices to initial adopters–preferably those ofrelatively high social status (i.e. Leading Lifestyles). The only exception is the marketingstrategy of lending out, which increased energy-efficient behavior most effectively in ourassessment.
Generalizability We tested the generalizability of these findings, comparing the effectsfrom marketing campaigns in a virtual version of Bottrop (as our case-study city) withtwo other, randomly generated, virtual cities. We determine that the results of thisstudy seem to be generalizable to other cities, including those with very differentsocio-spatial structures. This has two major implications for our study: (1) marketingstrategies that were shown to be successful in the ‘virtual Bottrop’ would likely also besuccessful in another city with a similar composition of lifestyle groups; (2) commercialhigh-resolution marketing data on the locations of consumer lifestyles in a city mightnot be needed for studies like this. The overall population share of lifestyle groups wouldsuffice instead.
Impact on heating energy demand Campaigns simulated in this study increased theadoption of shock ventilation by up to ca. 18% (σ = 13.9%) after 15 years. This impactwas found statistically significant. Given the empirically estimated 8% of energy savingsfrom this ventilation behavior, this would translate into a decrease in energy demand byca. 1.5% (σ = 1.1%). Similarly to additional shock ventilation, these energy savings wouldbe distributed heterogeneously. Households of higher social status would likely decreasetheir energy demand more, whereas households of lower social status would less so.
This reveals that, given the low costs of feedback devices, their impact can be relevanton a city scale, but is also limited. Particularly, the overall impact on a broader scalestays below its impacts on individual adopters. Therefore, we suggest that interventionsthat use the CO2 meter should be combined with energy-related renovation measures,e.g. replacing building insulation. This is particularly useful as insulating buildings

4.6. FUTURE RESEARCH
4
89
increases the relative share of ventilation in heating demand; this makes the CO2 meterparticularly useful for well-insulated buildings.
4.6. FUTURE RESEARCH
We see the following opportunities on how future research can add to the contributionsof this study.
We suggest to increase robustness of forecasting by refining the applied simulationmodel in two aspects. First, modeling the decision of adopting feedback devices couldbe done in more detail. More detailed insight into the process of decision-making wouldfor instance allow the assessment of marketing strategies in more detail, e.g. regardingdetailed communication with consumers. Such increased detail would require extensiveempirical data on past device diffusion, as well as more specific assumptions on futuredevelopments in the energy sector (e.g. regarding energy prices). Second, the herepresented method of assessing marketing strategies should be transferred to more casesof feedback devices. This would be advantageous, because it would differentiate theundertaken comparison between marketing strategies.
This study analyzed how feedback devices can be used to conserve heatingenergy. However, this approach could be compared more closely in its combinationwith alternative approaches. In particular, the aforementioned alternative of energyrenovation could be included, motivated by the interactions between refurbishment anduser behavior (Berkhout et al., 2000). From this, we would expect an assessment thatincluded and compared both energy-related renovation efforts and feedback devices tobe fruitful and informing for policymakers and stakeholders alike.
We regard the assessment approach of this study to be well-suited for futureapplications on the diffusion of technology and behavior. We expect to see more casesof simulation assisting the support of behavior changing technology, in order to triggerbehavior change towards sustainability on a larger societal scale.


5AUTOMATING MODEL
DEVELOPMENT AND APPLICATION
The best work is not what is most difficult for you; it is what you do best.
Jean-Paul Sartre
5.1. INTRODUCTION
Understanding the prospects of innovations and how they spread is powerful.Mechanistic understanding of the diffusion of an innovation can help explaining theirsuccess. For instance, the Theory of Diffusion of Innovations by Rogers (2003) allowsunderstanding diffusions based on general mechanisms of interpersonal interactions.From these, it is possible to infer general patterns and key actors of innovation diffusion.Further, the explanatory power of the general mechanisms of innovation diffusion hasbeen confirmed in empirical cases of diffusing innovations (Schwarz and Ernst, 2009;Sopha et al., 2013; Jensen et al., 2016).
Beyond understanding, found mechanisms can be used for guiding practical actions.Persons and organizations often want to know “how to speed up the rate of diffusion ofan innovation” (Rogers, 2003). Actions that achieve this can directly be derived fromcausal mechanisms of the spreading of an innovation. Further, simulation can be used toproject and estimate the impact of practical actions. This allows forecasting the impactof these actions from the underlying mechanisms. This study will focus in particularon simulating innovation diffusion with agent-based modeling (ABM). This approachrepresents real-world actors with computer agents, whose actions towards innovationsare modeled by explicit decision models (Delre et al., 2007; Jensen and Chappin, 2016).
However, mechanistic understanding is particularly challenging to gain. It is harderto achieve than statistical inference, which reveals co-occurrence of events in a set ofobservations. Requirements for gaining it also exceed sole causal understanding, which
At the time of writing, this chapter is in press at the Journal of Environmental Modeling and Software.
91

5
92 5. AUTOMATING MODEL DEVELOPMENT AND APPLICATION
‘only’ requires knowing that one event generally causes another one (Aalen and Frigessi,2007). Instead, mechanistic understanding implies to know if one event (likely) “leads toa specific, deterministic behavior in another” (Leek and Peng, 2015).
ABM can illuminate mechanisms of the diffusion of innovations, but is challengedby time and labor intensive model building (van Dam et al., 2012). Via simulation,ABM links micro-level actions of actors to ‘emergent dynamics’, e.g. innovation diffusion(Chappin and Dijkema, 2015). Thereby, macro-dynamics of innovation diffusion are‘decoded’ by being explained by micro behavior of agents (Grimm et al., 2005; Stern,2016). Unfortunately, ABM is commonly more time-intensive than its alternatives (e.g.system dynamics (Watts and Gilbert, 2014) and statistical analysis). This limits itspractical applicability. In line with these challenges, Garcia and Jager (2011) emphasizethe current “challenge is designing (agent-based models) that are useful (to) managerswithout programming skills.”
We propose to enable agent-based modeling to overcome these limitations byautomated model generation. Several approaches to automation exist, which wepropose to combine: (1) Translating simple specifications into executable models.Examples are http://m.modelling4all.org and the MAIA framework by Ghorbaniet al. (2013), which automatically generate simulation models from specifications bydomain-experts. (2) Model building from existing components. A method to thisidea is ‘TAPAS’1, via which previously validated models are reused at new applications(Frenken, 2006). (3) Using data for model-building in a structured way. Grimmet al. (2005) proposed ‘Pattern-oriented Modeling’ to falsify model variants that fail toreproduce a set of patterns from empirical data. This replaces ad-hoc decisions andinformed guesses about adequate model structures and parameters with rigid testingagainst empirical data.
Therefore, the target of this study is to present a process that systematically buildsABMs via the following steps: (1) extracting driving mechanisms from empiricalobservations on innovation diffusion; (2) projecting diffusions into the future; and (3)assessing the effects of real-world actions and policies ex-ante, via simulation. Thisstudy aims to answer the following question: “Can automated generation of agent-basedmodels on the diffusion of innovation be achieved, and how could this be useful?” Thisquestion will be addressed by specifying an automated software procedure for this task.To further provide proof of concept, application of an implementation of this procedureto the diffusion of sustainable products among households will be presented.
The remainder of this study is structured as follows. First, we provide backgroundon agent-based modeling of the diffusion of innovations. Second, the procedure thatautomates the building of such models is presented. Finally, this procedure is applied toa case of innovation diffusion.
5.2. AGENT-BASED MODELING OF INNOVATION DIFFUSION
This section will provide details on agent-based modeling of innovation diffusion,which is the application domain of the proposed automation procedure. We will show
1‘TAPAS’ abbreviates “Take A Previous model and Add Something”.
5.2. AGENT-BASED MODELING OF INNOVATION DIFFUSION
5
93
that there exists a high degree of standardization of existing diffusion models. Thisstandardization helps automated modeling.
According to Geels and Johnson (2015), there exist four general types of dynamicinnovation diffusion models. We hereby focus on innovation models that are dynamic,because innovation itself is a process of change (Kiesling et al., 2012). (1) Adoptionmodels capture spreading of an innovation among potential adopters, e.g. how the userbase of a new product increases via word-of-mouth. (2) Models of up-scaling and systembuilding describe a small system expanding to a larger one, e.g. an electricity systemexpanding from a decentralized ones to a single centralized system. (3) Replicationand circulation models emphasize the replication of an adoption during its circulationto other location. Considering replication emphasizes adapting an innovation toother local conditions. (4) Societal embedding models consider the embedding of aninnovation in business, societal, policy, and user environments.
‘Adoption’ type models are of special interest to this study. This is because theirmodeling of “independent adopters making (adoption) decisions” (Geels and Johnson,2015, p. 12) fits well with the actor-centric perspective of agent-based modeling.Adoption type models are represented by ‘aggregated’ and ‘individual level’ models(Kiesling et al., 2012). Aggregated models directly model the overall adoption dynamicsof an entire population. This approach is represented by the ‘Bass model’ and commonlymodeled with system dynamics (Kiesling et al., 2012). Conversely, ‘individual level’models capture the adoption decisions of individuals in a population, from which overalladoption dynamics ‘emerge’.
In this study, we will focus on the individual level models, because of theircapability to incorporate more aspects of reality. According to Kiesling et al. (2012),‘individual level’ models are superior to ‘aggregated’ ones (such as system dynamics).(1) Explanatory power is greater for ‘individual level’ models, because they explicitlyconnect behavior and decisions of agents with aggregated diffusion dynamics. (2)Population heterogeneity can be captured more detailed in ‘individual level’ models.(3) Social processes (e.g. interactions between consumers) are modeled explicitly. Thisprocess can have great impact on diffusion success (Delre et al., 2007). Agent-based‘individual level’ models are particularly suited to model social interactions. In contrastto discrete-event simulation, they are capable of modeling detailed social interactiontopologies in a computationally efficient way (Watts and Gilbert, 2014). Consequently,this study will focus on innovation diffusion models that are agent-based.
Automating the building of agent-based innovation diffusion models is facilitated bytheir similar structure. A review by Kiesling et al. (2012) finds that most ‘individual level’diffusion models have such a common structure. Accordingly, virtually all agent-basedinnovation diffusion models are variations of one meta-model, shown in Fig. 5.1. Thismeta-model comprises the following elements: (1) Consumer agents represent theentities than can adopt an innovation. These can be individual persons, households, orgroups of households. (2) Social structure is the heterogeneity of consumer agents, e.g.dividing them in different consumer groups. (3) Decision making processes (formalizedas decision models) are the key actions of consumer agents to model the adoption ofan innovation. (4) Social influence between agents (from peers, social groups or overallpopulation) can affect decision making of consumers and is commonly modeled as a
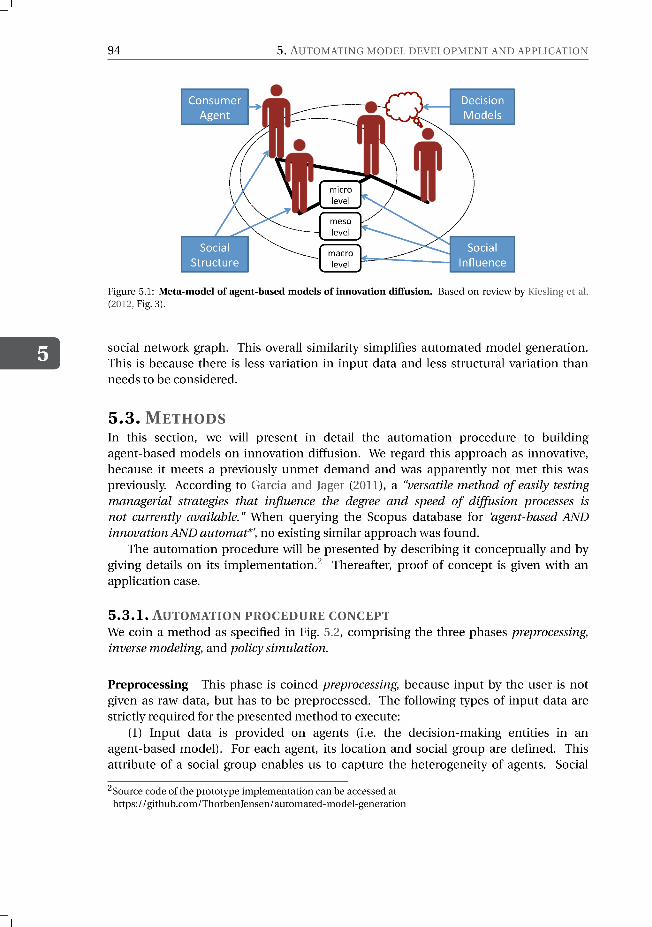

5.3. METHODS
5
95
!"#$"%&#''()*+
,)-#"'#+.%/#0()*+
!%0(&1+2(34056%)+
5*#)7'+
8&'-+
)#79%":+
8&'-+
;4)&6%)+
87<7+
!5=#")+
/575+
.57&>()*+
;4)&6%)+
?*#)7'+
/575+
,/#)6;1+
357&>()*+
3%/#0'+
@#$%"7+$054A+
'(B0#+3%/#0'+
@#$%"7+
(3$5&7'+
2#0#&7+$%0(&(#'+
7%+7#'7+
2(34057#+$%0(&(#'+
())%-56%)+
CDE)F8)0'+
,))%-56%)+
$"%$#"6#'+
G#&('(%)+
3%/#0+
0(B"5"1++
3%/#0'+
8<30++
!%0(&1+
0(B"5"1++
$5=#")+
CDE)F8)0'++
H$63(I#+
$5"53#7#"'+
2#0#&7+3%/#0+
-5"(5)7'+7%+7#'7+
Figure 5.2: Overview of phases of automation procedure. The procedure is sub-divided into the subsequentphases preprocessing of input data, inverse modeling of potentially explaining models, and policy modeling ofmodels that were accepted based on the previous phase.
influence is defined by a social network graph. For generating a social network graph,we used the algorithm described by Jensen et al. (Jensen et al., 2016, Appendix A.2).
Agents have to be defined by a CSV file with the columns ID, X and Y coordinates, andname of the social group they may belong to. The network graph is provided as a CSV filewith the columns FROM and TO, defining directed links between two agents identifiedby their IDs. For instance, bidirectional influence between two agents would require twolines in this file.
(2) Innovation properties are provided that represent how an innovation is perceivedby households. This idea follows Rogers (2003), according to whom diffusion success ofinnovations depends on generalizable properties. Examples of the innovation propertiesare relative compatibility, complexity, and trialability.
Innovation properties each have to be provided as NetLogo source files. Each filecontains a NetLogo method that sets innovation properties of an innovation as globalvariables.

5
96 5. AUTOMATING MODEL DEVELOPMENT AND APPLICATION
(3) Patterns are provided that characterize the dynamics of the real-world processthat shall be modeled. These patterns are “indicators of essential underlying processesand structures” (Grimm et al., 2005). Each additional pattern reduces uncertaintyabout which mechanisms could explain the diffusion of an innovation. An examplefor a relevant pattern is the exponentially increasing adoption share of a successfulinnovation during its initial diffusion (Rogers, 2003).
Patterns are formalized by provided as NetLogo functions that calculate how wella simulation run matches each pattern. The values returned from these functionsrepresent how well a simulation run suffices a pattern. A returned value of 0 signals aperfect fit with a pattern. With greater divergence from the pattern, this returned valueincreases. At simulation runtime, these functions query simulation runs and returnfitness values for the following matching function.
(4) A ‘matching function’ describes the desired behavior of an accepted simulationmodel in terms of the provided patterns. This function weights and combines patternsto describe model output that would be considered realistic. This function assists infinding simulation runs that represent the empirical patterns best.
The matching function has to be defined by a character string. Variables of thisfunction are the names of the provided empirical patterns (and the functions thatcalculate matching with these patterns). For an example, see Eq. 5.2 at the applicationcase below.
Inverse modeling The inverse modeling phase identifies models that satisfy theprovided matching function.
Within a range of plausibility, pre-defined models are varied in their structure andparameter values. For this, the NetLogo tool BehaviorSearch was used (Stonedahl andWilensky, 2016). It repeatedly runs each potential model, thereby varying its structureand parameters, searching for an optimal fit with the pattern. The optimum thatthis search converges to is defined by the user-provided matching function. For theapplication case, we executed BehaviorSearch with a simulated annealing optimization(see Table 5.1 for search settings).
At the end of this phase, the user has to choose which tested models from themodel library with which structural variation shall be accepted. Accepted model variantsshould be those that generate realistic results. This decision can be based on the bestfitness values and respective parameters, which are reported for each structural variationof each tested model. If a model reproduced all provided empirical patterns, then itcan be considered a potential explanation of these input data. Because the user haspre-defined this ideal behavior via the matching function, the fitness value is a strongindicator for this judgement. If model variants of multiple complexity levels match thepatterns well, the simplest ones of these variants should be preferred. This serves tomanage the risk of ‘overfitting’ at high structural complexity (Provost and Fawcett, 2013).If required, the reported parameters settings for the best fit of each model variation allowthe user to simulate and assess these model settings more closely in NetLogo.
Policy simulation The proposed automation procedure provides the useful functionof semi-automatically assessing policies. Here, policies are those actions that aim at
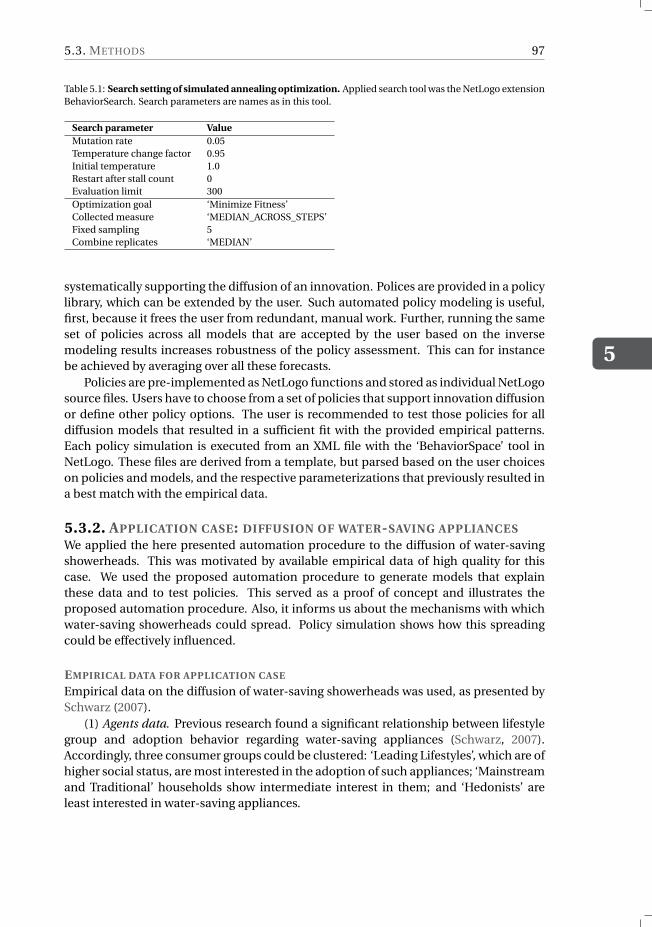
5.3. METHODS
5
97
Table 5.1: Search setting of simulated annealing optimization. Applied search tool was the NetLogo extensionBehaviorSearch. Search parameters are names as in this tool.
Search parameter Value
Mutation rate 0.05Temperature change factor 0.95Initial temperature 1.0Restart after stall count 0Evaluation limit 300Optimization goal ‘Minimize Fitness’Collected measure ‘MEDIAN_ACROSS_STEPS’Fixed sampling 5Combine replicates ‘MEDIAN’
systematically supporting the diffusion of an innovation. Polices are provided in a policylibrary, which can be extended by the user. Such automated policy modeling is useful,first, because it frees the user from redundant, manual work. Further, running the sameset of policies across all models that are accepted by the user based on the inversemodeling results increases robustness of the policy assessment. This can for instancebe achieved by averaging over all these forecasts.
Policies are pre-implemented as NetLogo functions and stored as individual NetLogosource files. Users have to choose from a set of policies that support innovation diffusionor define other policy options. The user is recommended to test those policies for alldiffusion models that resulted in a sufficient fit with the provided empirical patterns.Each policy simulation is executed from an XML file with the ‘BehaviorSpace’ tool inNetLogo. These files are derived from a template, but parsed based on the user choiceson policies and models, and the respective parameterizations that previously resulted ina best match with the empirical data.
5.3.2. APPLICATION CASE: DIFFUSION OF WATER-SAVING APPLIANCES
We applied the here presented automation procedure to the diffusion of water-savingshowerheads. This was motivated by available empirical data of high quality for thiscase. We used the proposed automation procedure to generate models that explainthese data and to test policies. This served as a proof of concept and illustrates theproposed automation procedure. Also, it informs us about the mechanisms with whichwater-saving showerheads could spread. Policy simulation shows how this spreadingcould be effectively influenced.
EMPIRICAL DATA FOR APPLICATION CASE
Empirical data on the diffusion of water-saving showerheads was used, as presented bySchwarz (2007).
(1) Agents data. Previous research found a significant relationship between lifestylegroup and adoption behavior regarding water-saving appliances (Schwarz, 2007).Accordingly, three consumer groups could be clustered: ‘Leading Lifestyles’, which are ofhigher social status, are most interested in the adoption of such appliances; ‘Mainstreamand Traditional’ households show intermediate interest in them; and ‘Hedonists’ areleast interested in water-saving appliances.

5
98 5. AUTOMATING MODEL DEVELOPMENT AND APPLICATION
(2) Innovation properties. Properties of water-saving showerheads and conventionalshowerheads were surveyed. For each lifestyle group, the relative importance of theseproperties was also surveyed. This allows modeling the choice of consumers regardingthe adoption of water-saving showerheads.
(3) Diffusion patterns. Two empirical patterns on the diffusion of water-savingshowerheads emerged. First, marketing shares in Germany after 15 years of productdiffusion show difference in adoption between these consumer groups. Second, theadoption diffusion curve during the first 15 years of innovation diffusion has anexponential shape.
EXISTING MODEL ON SHOWERHEADS DIFFUSION
An agent-based simulation model was previously built based on some of this empiricaldata (Schwarz, 2007). We will here coin it the ‘Schwarz’ model. This model describes thedecision making of agents regarding the adoption of feedback devices. According to themodel, initially no household uses water-saving shower heads. At a monthly deliberationprobability of 0.004, each household decides whether to adopt the water-saving option.There is a probability at which agents adopt the technology option that is adopted bythe majority of their peers. This probability is differentiated by the three lifestyle groups(Jensen et al., 2015): (1) Leading Lifestyles always adopt the device, regardless of theirpeers; (2) Mainstream agents adopt devices in 50% of the cases, and imitate their peersotherwise; and (3) Hedonists always imitate the majority of their peers.
EVALUATED AGENT-BASED MODELS
We created a generic model library of two further models. We coined these models‘Schwarz flexible’ and ‘TPB’, which abbreviates Theory of Planned Behavior.
‘Schwarz flexible’ model This model is structurally similar to the ‘Schwarz’ model, butits parameterization was made ‘flexible’ in two ways. First, the monthly deliberationprobability became a flexible parameter between 0.004 and 0.04. Second, the probabilityof agents to adopt according to the majority of their peers also became a flexibleparameter (between 0 and 1) for each social group.
‘Theory of Planned Behavior’ model The second decision model is based on theTheory of Planned Behavior (TPB) by Ajzen (1991). Modeled adoption is based onthree factors: the attitude towards an innovation (ATT), the perceived behavioral control(PBC) over adopting it, and the subjective norm (SN) towards adoption from the socialenvironment. For water-saving showerheads, this means that adoption is more likely iffirst, attitude towards this product is more positive, second, if the adoption is perceivedas easy and feasible, and third, if adoption is more common among peers. We used theformalization shown in Eq. 5.1 (Schwarz, 2007).
adoption_intentioni = (1− s) · (ATTi +PBCi )+ s ·SNi (5.1)
According to this model, an agent calculates utility for each option i and adoptsthe one with the highest adoption intention, based on the following factors. ‘ATTi ’ isthe product of two vectors: properties of innovation i and weights (i.e. importance)
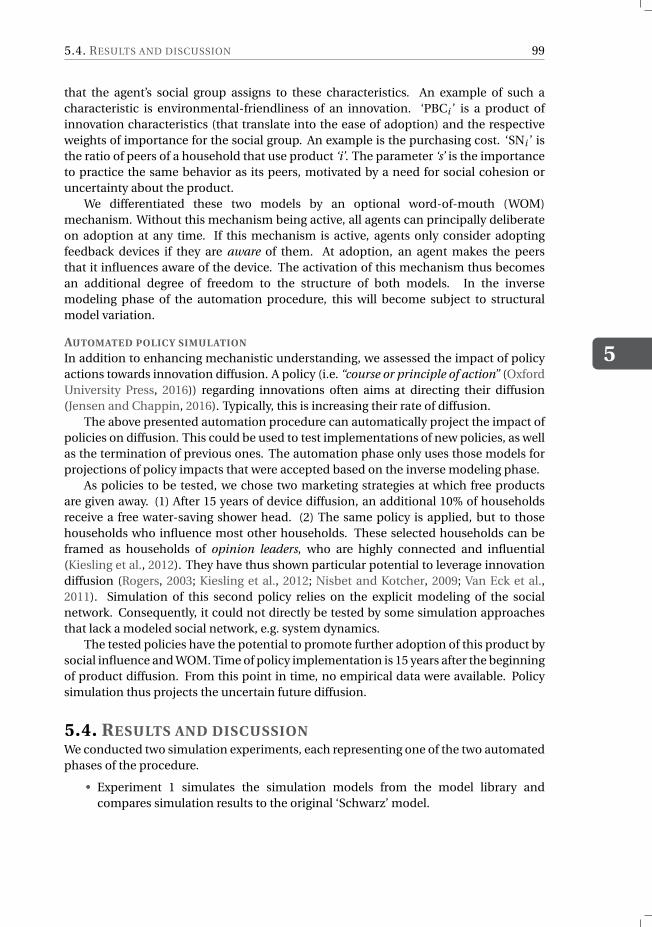
5.4. RESULTS AND DISCUSSION
5
99
that the agent’s social group assigns to these characteristics. An example of such acharacteristic is environmental-friendliness of an innovation. ‘PBCi ’ is a product ofinnovation characteristics (that translate into the ease of adoption) and the respectiveweights of importance for the social group. An example is the purchasing cost. ‘SNi ’ isthe ratio of peers of a household that use product ‘i’. The parameter ‘s’ is the importanceto practice the same behavior as its peers, motivated by a need for social cohesion oruncertainty about the product.
We differentiated these two models by an optional word-of-mouth (WOM)mechanism. Without this mechanism being active, all agents can principally deliberateon adoption at any time. If this mechanism is active, agents only consider adoptingfeedback devices if they are aware of them. At adoption, an agent makes the peersthat it influences aware of the device. The activation of this mechanism thus becomesan additional degree of freedom to the structure of both models. In the inversemodeling phase of the automation procedure, this will become subject to structuralmodel variation.
AUTOMATED POLICY SIMULATION
In addition to enhancing mechanistic understanding, we assessed the impact of policyactions towards innovation diffusion. A policy (i.e. “course or principle of action” (OxfordUniversity Press, 2016)) regarding innovations often aims at directing their diffusion(Jensen and Chappin, 2016). Typically, this is increasing their rate of diffusion.
The above presented automation procedure can automatically project the impact ofpolicies on diffusion. This could be used to test implementations of new policies, as wellas the termination of previous ones. The automation phase only uses those models forprojections of policy impacts that were accepted based on the inverse modeling phase.
As policies to be tested, we chose two marketing strategies at which free productsare given away. (1) After 15 years of device diffusion, an additional 10% of householdsreceive a free water-saving shower head. (2) The same policy is applied, but to thosehouseholds who influence most other households. These selected households can beframed as households of opinion leaders, who are highly connected and influential(Kiesling et al., 2012). They have thus shown particular potential to leverage innovationdiffusion (Rogers, 2003; Kiesling et al., 2012; Nisbet and Kotcher, 2009; Van Eck et al.,2011). Simulation of this second policy relies on the explicit modeling of the socialnetwork. Consequently, it could not directly be tested by some simulation approachesthat lack a modeled social network, e.g. system dynamics.
The tested policies have the potential to promote further adoption of this product bysocial influence and WOM. Time of policy implementation is 15 years after the beginningof product diffusion. From this point in time, no empirical data were available. Policysimulation thus projects the uncertain future diffusion.
5.4. RESULTS AND DISCUSSION
We conducted two simulation experiments, each representing one of the two automatedphases of the procedure.
• Experiment 1 simulates the simulation models from the model library andcompares simulation results to the original ‘Schwarz’ model.

5
100 5. AUTOMATING MODEL DEVELOPMENT AND APPLICATION
• Experiment 2 demonstrates automated policy simulation with the models thatwere accepted as sufficiently realistic in the first experiment.
5.4.1. EXPERIMENT 1: INVERSE MODELING
In this experiment, two diffusion models (‘Schwarz flexible’ and ‘Schwarz TPB’) weretested for their ability to explain the historical diffusion of water-saving showerheads.This testing is taken out by the inverse modeling phase of the proposed automationprocedure. Each of these two models was simulated at two structural variations (withand without the WOM mechanism) and at varied parameters. Simulation results weretested against two empirical patterns: the exponential takeoff of adoption and theempirical market shares of the three consumer groups after 15 years.
The provided matching function that was minimized in order to search for realisticmodels is shown in Eq. 5.2. Mainly, the simulated adoption shares are comparedto the provided empirical ones. In the inverse modeling phase, mismatching withempirical market shares is minimized. Further, if the shape of the adoption curve isnot exponential, then a significant penalty is added to the matching function. Basis forthis is the overall adoption share over all agents and the length of a simulation run of 15years. Matching results (i.e. best fitness and according parameters) are shown in Table5.2.
minimize {‘adoption shares’+1000 · ‘exponential’} (5.2)
Table 5.2: Results of inverse modeling phase: best fit and parameterizations. Optimized fitness forthe models ‘Schwarz flexible’ and ‘TPB’ with and without word-of-mouth (WOM) is shown. Parametercombinations (except those that resulted in no adoption at all) with best fit are shown: the monthlydeliberation probability and social influence (δα) in adoption are given for the consumer group ‘LeadingLifestyles’, ‘Mainstream and Traditionals’, and ‘Hedonists’ (sLL , sMS , sHD ).
Model WOM fitness δα sLL sMS sHD‘Schwarz’ no - 0.004 0 0.5 1‘Schwarz flex.’ no 19.12 0.029 0.723 1 0.996‘Schwarz flex.’ yes 5.91 0.013 0 0.679 0.928‘TPB’ no 26.61 0.013 0.288 0.428 0‘TPB’ yes 5.72 0.016 0 0.456 0.200
Results of best matches, shown in Fig. 5.3, revealed that model versions withoutWOM were less able to match the patterns: the ‘Schwarz flexible’ model, was not ableto generate an exponential pattern, while the ‘TPB’ model could generate exponentialincrease in adoption, but was not able to match the adoption data at the same time.With the WOM mechanism being active, both models were able to match both patterns.The only limitation to this matching is a relatively bad reproduction of the empiricalmarket share of the ‘Hedonists’ group. Based on these results, we regard both simulatedmodels generally suited to explain the diffusion of water-saving showerheads, but onlyif the WOM mechanism is included.
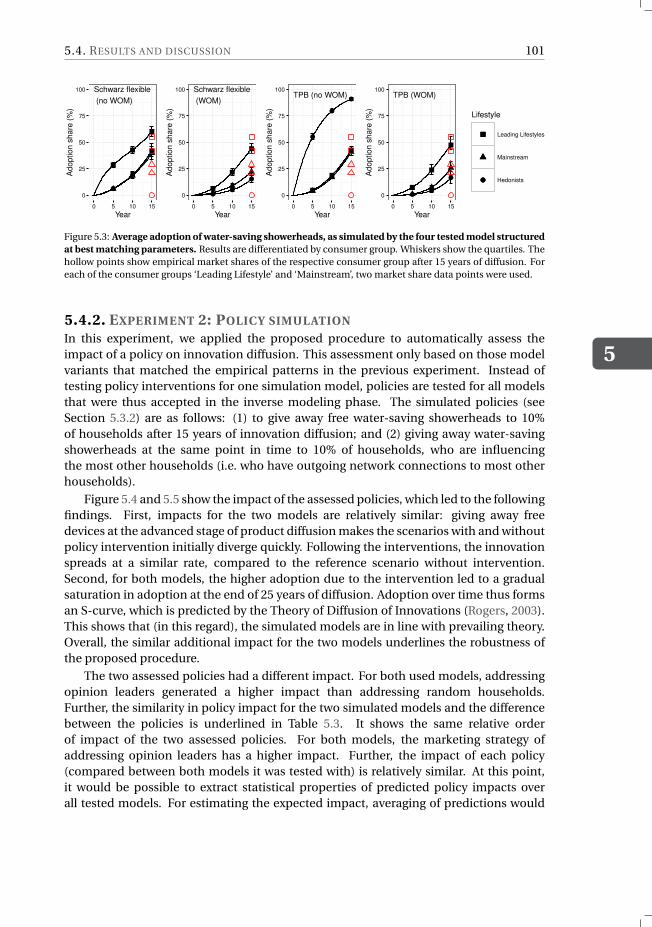
5.4. RESULTS AND DISCUSSION
5
101
●
●
●
Schwarz flexible
(no WOM)
0
25
50
75
100
0 5 10 15
Year
Adoption s
hare
(%
)
●
●
●
Schwarz flexible
(WOM)
0
25
50
75
100
0 5 10 15
Year
Adoption s
hare
(%
) ●
●
●
TPB (no WOM)
0
25
50
75
100
0 5 10 15
Year
Adoption s
hare
(%
)
●
●
●
TPB (WOM)
0
25
50
75
100
0 5 10 15
Year
Adoption s
hare
(%
)
Lifestyle
●●●
Leading Lifestyles
Mainstream
Hedonists
Figure 5.3: Average adoption of water-saving showerheads, as simulated by the four tested model structured
at best matching parameters. Results are differentiated by consumer group. Whiskers show the quartiles. Thehollow points show empirical market shares of the respective consumer group after 15 years of diffusion. Foreach of the consumer groups ‘Leading Lifestyle’ and ‘Mainstream’, two market share data points were used.
5.4.2. EXPERIMENT 2: POLICY SIMULATION
In this experiment, we applied the proposed procedure to automatically assess theimpact of a policy on innovation diffusion. This assessment only based on those modelvariants that matched the empirical patterns in the previous experiment. Instead oftesting policy interventions for one simulation model, policies are tested for all modelsthat were thus accepted in the inverse modeling phase. The simulated policies (seeSection 5.3.2) are as follows: (1) to give away free water-saving showerheads to 10%of households after 15 years of innovation diffusion; and (2) giving away water-savingshowerheads at the same point in time to 10% of households, who are influencingthe most other households (i.e. who have outgoing network connections to most otherhouseholds).
Figure 5.4 and 5.5 show the impact of the assessed policies, which led to the followingfindings. First, impacts for the two models are relatively similar: giving away freedevices at the advanced stage of product diffusion makes the scenarios with and withoutpolicy intervention initially diverge quickly. Following the interventions, the innovationspreads at a similar rate, compared to the reference scenario without intervention.Second, for both models, the higher adoption due to the intervention led to a gradualsaturation in adoption at the end of 25 years of diffusion. Adoption over time thus formsan S-curve, which is predicted by the Theory of Diffusion of Innovations (Rogers, 2003).This shows that (in this regard), the simulated models are in line with prevailing theory.Overall, the similar additional impact for the two models underlines the robustness ofthe proposed procedure.
The two assessed policies had a different impact. For both used models, addressingopinion leaders generated a higher impact than addressing random households.Further, the similarity in policy impact for the two simulated models and the differencebetween the policies is underlined in Table 5.3. It shows the same relative orderof impact of the two assessed policies. For both models, the marketing strategy ofaddressing opinion leaders has a higher impact. Further, the impact of each policy(compared between both models it was tested with) is relatively similar. At this point,it would be possible to extract statistical properties of predicted policy impacts overall tested models. For estimating the expected impact, averaging of predictions would

5
102 5. AUTOMATING MODEL DEVELOPMENT AND APPLICATION
●
●
●
●
●
●●
●
●
●
●
●0
25
50
75
100
0 5 10 15 20 25
Year
Ad
op
tio
n s
ha
re (
%)
Schwarz flexible (WOM)
Policy Scenario'give to 10% (all households)'
Reference Scenario
●
●
●
●
●
●●
●
●
●
●
●0
25
50
75
100
0 5 10 15 20 25
Year
Ad
op
tio
n s
ha
re (
%)
TPB (WOM)
Policy Scenario'give to 10% (all households)'
Reference Scenario
Figure 5.4: Impacts of policy that addresses all households (continuous line) compared to baseline scenario(dashed line). Whiskers show the quartiles. Results rely the two most realistic model structures withparameterizations that matched empirical patterns best.
be advisable. Alternatively, minimum and maximum of such an ensemble would giveinsights into degree of uncertainty. Overall, this indicates that the policy assessmentbased on multiple models increased the robustness of the proposed procedure.
5.4.3. LIMITATIONS
Discussion of limitations will focus on two aspects of the proposed automationprocedure rather than the application case. This is because this procedure is the keycontribution of this study.
(1) The proposed automation procedure might not be applicable to very uncertainprocesses or models. It appears limited to cases where potential explanations arerestricted to a bounded space of options. This is the case for e.g. innovation diffusion.Nevertheless, the proposed procedure has been able to handle structural uncertainty.However, up to which limit such uncertainty can be managed is not known at this point.
(2) The proposed procedure is not easily applicable by everyone. It requires dataprocessing skills in the preprocessing phase. This might limit the circle of potential
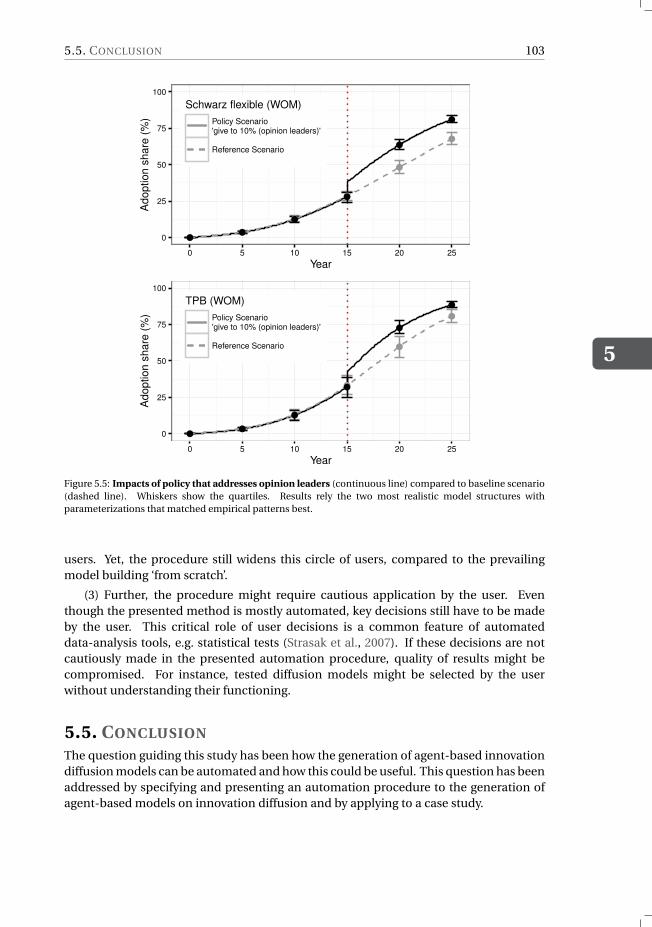
5.5. CONCLUSION
5
103
●
●
●
●
●
●●
●
●
●
●
●0
25
50
75
100
0 5 10 15 20 25
Year
Ad
op
tio
n s
ha
re (
%)
Schwarz flexible (WOM)
Policy Scenario'give to 10% (opinion leaders)'
Reference Scenario
●
●
●
●
●
●●
●
●
●
●
●0
25
50
75
100
0 5 10 15 20 25
Year
Ad
op
tio
n s
ha
re (
%)
TPB (WOM)
Policy Scenario'give to 10% (opinion leaders)'
Reference Scenario
Figure 5.5: Impacts of policy that addresses opinion leaders (continuous line) compared to baseline scenario(dashed line). Whiskers show the quartiles. Results rely the two most realistic model structures withparameterizations that matched empirical patterns best.
users. Yet, the procedure still widens this circle of users, compared to the prevailingmodel building ‘from scratch’.
(3) Further, the procedure might require cautious application by the user. Eventhough the presented method is mostly automated, key decisions still have to be madeby the user. This critical role of user decisions is a common feature of automateddata-analysis tools, e.g. statistical tests (Strasak et al., 2007). If these decisions are notcautiously made in the presented automation procedure, quality of results might becompromised. For instance, tested diffusion models might be selected by the userwithout understanding their functioning.
5.5. CONCLUSION
The question guiding this study has been how the generation of agent-based innovationdiffusion models can be automated and how this could be useful. This question has beenaddressed by specifying and presenting an automation procedure to the generation ofagent-based models on innovation diffusion and by applying to a case study.

5
104 5. AUTOMATING MODEL DEVELOPMENT AND APPLICATION
Table 5.3: Results of policy simulations based on selected, sufficiently realistic models (with
word-of-mouth). Impact is shown as additional percentage of product adoption 15 years after policyimplementation.
Model WOM Policy Additional adoption (10 yrs)
‘Schwarz flex.’ yes ‘give away to 10%’ 10.5%
‘Schwarz flex.’ yes‘give away to 10%(opinion leaders)’
13.3%
‘TPB’ yes ‘give away to 10%’ 6.0%
‘TPB’ yes‘give away to 10%(opinion leaders)’
7.7%
Implementation and application of the proposed design showed that the automationprocedure is applicable to the diffusion of water-saving showerheads. It further enabledhigh efficiency of time and labor for this case. This serves as a proof of concept and addsweight of evidence to its suitability to automate the generation of agent-based models ofinnovation diffusion.
This application further revealed several advantages of the proposed automationprocedure. Present practices of building agent-based models on innovation diffusion arehighly diverse. Therefore, it does not seem informative to compare the here proposedprocedure against any specific existing practice. Instead, we will conclude on thepresented method by re-iterating its advantages. We stress that, in combination, thesebenefits validate the proposed design.
At application, the procedure proved helpful for improving existing diffusion modelsfrom empirical data. The previously empirically validated ‘Schwarz model’ on thediffusion of water-saving showerheads could be refined to increase its realism. Forthis refinement, word-of-mouth mechanism of communication between consumerswas found plausible—both theoretically and data-wise. This role of word-of-mouthadds weight of evidence to the importance of future marketing efforts that leverage thismechanism.
The rigid use of data in the proposed procedure creates model validation by design.The procedure is driven by comparing model output to empirical data, which is centralto validation (Rand and Rust, 2011). Further, systematically comparing multiple models(and mechanisms) enables the good scientific practice of being able to falsify thosethat can not explain empirical observations. Overall, this has the potential to makeagent-based modeling more rigorous than in common practice (Grimm et al., 2005).
The presented approach allows using relatively complex simulation modeling at lowcomplicatedness for the user. Provided a library of potential mechanisms has previouslybeen implemented, a user would only need to provide key data on a dynamic, potentiallycomplex system. The automated procedure then simulates bottom-up models andthen tests their matching with the provided data. This procedure selects potentiallyexplaining mechanisms and thus supporting gaining mechanistic understanding.
Due to this relative ease of use, the presented automation approach helps increasingthe circle of persons that could independently build agent-based simulation models oninnovation diffusion. We see the classical role of the modeler extended by the role of theuser (also referred to as ‘thematician’ (Drogoul et al., 2002; Galán et al., 2009)). Such auser can build and apply diffusion models without requiring programming or simulation

5.5. CONCLUSION
5
105
skills. Except for extending a library of model components, the commonly requiredimplementation by modelers and computer scientists (Drogoul et al., 2002; Galán et al.,2009) is not required. A user only has to process and provide the required input data, aswell as interpret the generated model results. From a perspective of innovation diffusion,we regard this widening of the circle of adopters a crucial service to the spreading ofagent-based modeling as an innovative forecasting method.
5.5.1. FUTURE RESEARCH
We suggest to progress this study in three directions.First, the central phase of inverse modeling is crucial to the proposed automation
procedure and could be improved. We propose to support anticipated users of thisautomation procedure to make good choices on matching functions. For this, differentdesigns of the inverse modeling phase should be compared. Those that are robust inproviding good results over several applications cases should be preferred. One suchvariation would be to withhold for validation some of the data that is now used for modelcalibration. For choosing between alternating model hypothesis, various statisticalapproaches should be tested. Candidate methodologies for this are, for instance, AkaikeInformation Criterion and Bayes factors.
Second, user-friendliness of the procedure can be increased by acceptingunstructured input data. The presented application case used structured empiricaldata. Approaches from data science could allow us to execute the procedure withun-structured data. Overall, increased user-friendliness further increases the circle ofpotential users.
Finally, we suggest to expand the application of the proposed automation procedureto more cases. This could be facilitated by finding a way for the automation procedureto be as generally applicable as possible. For instance, this could even includegenerating models from far smaller components than are currently in the modelinglibrary. Application to more cases would eventually help establish reference modelson the diffusion of innovations, which can further support the development of soundinnovation diffusion models.
Overall, we believe these future development and applications will encourage userswho are not model builders to apply the proposed automation approach. The herepresented design is meant to assist them in exploiting the merits of agent-basedmodeling of innovation diffusion.


6CONCLUSIONS AND
RECOMMENDATIONS
I love all who are like heavy drops,falling one by one out of the dark cloud that lowereth over man:
they herald the coming of the lightning,and succumb as heralds.
Friedrich Nietzsche
6.1. CONCLUSION
Reducing domestic heating demand is an attractive contribution to the reductionof greenhouse gas emissions. Feedback devices, if diffusing successfully amongconsumers, could trigger the behavior change in heating that would significantlycontribute to this. This thesis used simulation modeling to estimate the potentialdiffusion of such devices. It also estimated the behavior change of device users and thediffusion of the behavior change that this creates. Based on capturing these diffusions,the potential impact of devices, i.e. their overall effect on energy-conservation behavior,could be simulated and analyzed.
With these simulations, it is possible to inform policy makers and stakeholderson how to support the impact of feedback devices. Their actions could potentiallyamplify or diminish the realization of the potential that is inherent to behavior-changingfeedback devices.
This thesis set out to develop a simulation study design for agent-based modelingto tackle these tasks. Ideally, this design would overcome the current limitationsof agent-based modeling, which often requires cumbersome and somewhat arbitrarydecisions on model design. From this motivation emerged the central research questionof this thesis:
How can the impact of behavior-changing feedback devices on energy-consumption
107

6
108 6. CONCLUSIONS AND RECOMMENDATIONS
behavior be systematically simulated?
This section gives an answer to this question. This includes providingmethodological recommendations to modelers, as well as practical recommendationsto policy makers. Eventually, this chapter will reflect on limitations of this thesis, andwill highlight emerging future challenges.
The central research question of this thesis has been addressed in detail infour sub-questions. Their succession inspired a stepwise research approach, whichdedicated to each sub-question one step. The first three of these developed methodssimulated the impact of behavior-changing feedback devices. They started at identifyingthe mechanisms of co-diffusion, modeled empirically-grounded impact of devices,and eventually assessed policy strategies systematically. In the fourth step, thesemethods could eventually be standardized as a procedure of automatically generatingagent-based diffusion models and assessing the impact of policies on diffusions. In thefollowing, the lessons learnt during these four research steps will be presented. Based onthese insights, an overall conclusion on the central research question will then be drawn.
6.1.1. CONCLUSION 1: MECHANISMS OF IMPACT OF FEEDBACK DEVICES
As a first step of this thesis, the general dynamics of interaction between the diffusions offeedback devices and energy-efficient heating behavior were analyzed. This addressedthe following question: What are the mechanisms via which feedback devices can changeheating behavior?
Conclusion 1 – In addition to the diffusion of feedback devices, the diffusion ofenergy-efficient behavior enhances the overall impact of feedback devices on heatingbehavior. Consequently, behavior diffusion is confirmed as an important component tothis co-diffusion of technology and behavior. This is in line with previous research on thepotential of behavior diffusion to spread energy-efficient behaviors (see Peschiera et al.,2010; Chen et al., 2012; Anderson et al., 2014). This motivates behavior diffusion to beconsidered at future assessments of feedback devices.
Two mechanisms were identified via which behavior diffusion increases the overall effectof feedback devices. First, behavior diffusion was found to spread energy-efficientbehavior from households, who changed their behavior due to feedback, to others.By thus reaching non-adopters of devices, behavior diffusion decreases difference inbehavior between adopters and non-adopters of feedback devices. Second, behaviordiffusion was found to speed up the overall behavior change from feedback devices. Dueto behavior diffusion, one feedback device reached more households (e.g. the peers ofdevice users). This makes the impact of each device stronger and thus overall behaviorchange faster.
Behavior diffusion can be regarded to thus create a positive externality to thediffusion of feedback devices. As changed behavior can spread from households thatuse feedback devices, more households can indirectly benefit from this feedback. Thiscan be attributed to behavior change and will not be found at energy-efficiency devicesthat do not create behavior change. For instance, home automation (e.g. ‘smart’ adaptive
6.1. CONCLUSION
6
109
thermostats) can save energy, but would not incentivize behavior change that could beleveraged by behavior diffusion.
Consequently, behavior diffusion should be included in the assessment ofbehavior-changing feedback devices. This is because it has the potential to reinforce theimpact of feedback devices significantly. This further motivated measuring the relativeimportance of this process in the following steps of the research approach.
6.1.2. CONCLUSION 2: PROJECTED IMPACT OF A FEEDBACK DEVICE
The second step of the research approach quantified the relative importance of themodeled processes. The abstract modeling approach from the previous research stepcould not measure this with reasonable certainty. For doing so, an empirically-groundedmodeling approach was needed. The co-diffusion framework of this thesis was thereforeapplied to an empirical case. This aimed at answering the following sub researchquestion: What is the impact of the diffusion of feedback devices and the diffusion of thebehavior that they incentivize?
Conclusion 2 – The overall effect of a case feedback device—scaled up by device diffusionand the diffusion of energy-efficient behavior—was found to be of significant importance.Its projected effect was predominantly caused by the diffusion of feedback devices and lessso by behavior diffusion.
Overall, the diffusions of a feedback device and that of the behavior it creates was foundto cause a significant impact. These diffusions were further estimated to successfullyscale up the effect of the case technology ‘CO2 meter’ in the case city Bottrop (Germany).Accordingly, 15 years after the start of successful device diffusion, energy-efficientventilation would have increased by an additional 12 (6–18) percentage points. Basedon experience with proxy innovations, this impact is expected to differ between socialgroups. The early adopters of feedback devices can be expected to be of higher socialstatus.
Diffusion of a device, including the direct feedback to its users, was found to be themain component of its impact. Contribution of this process showed to be the larger thanthat of behavior diffusion. This emphasizes the key role of device diffusion: this diffusionis not just necessary for feedback devices to have an impact at all—it also appears to bethe most important effect component.
Conversely, diffusion of energy-efficient behavior was also found to have animportant contribution, but of second rank. The relative contribution of behaviordiffusion to the overall effect of the assessed feedback device ranged from 12% to 46%,depending on the social group. The lower the social status of a household, the higherthe relative importance of behavior diffusion. Consequently, neglecting the impact ofbehavior diffusion would underestimate the impact of feedback devices significantly.
To practitioners, this suggests that efforts of increasing the impact from feedbackdevices should focus on supporting device diffusion over behavior diffusion. Theseefforts could be most effective when focusing on households of higher social status, whoare most interested in using feedback devices. From these early adopters, devices andenergy-efficient behavior could then ‘trickle down’ to other social groups.
6
110 6. CONCLUSIONS AND RECOMMENDATIONS
6.1.3. CONCLUSION 3: POLICY RECOMMENDATIONS
The previous research step analyzed the diffusion of feedback devices, but did not factorin the effect of policies that may support feedback devices. The following step thereforeexplored ways in which the diffusion and impact of feedback devices could actively besupported. Based on the previously developed empirically-based simulation model,policies towards this end were assessed in simulation experiments. By assessing thesemarketing strategies, this study addressed the following question: How can the projectedimpact of feedback devices be affected by policies?
Conclusion 3 – Marketing of feedback devices was estimated to have a significant impacton their projected impact. Marketing strategies of lending out or giving away feedbackdevices for free, and of targeting households who are of high social status or OpinionLeaders, were found particularly effective and cost-efficient. Marketing campaignsshowed to increase projected adoption of energy-efficient ventilation by an additional ca.21% of households over 15 years. However, changing the location of their implementationdid not significantly affect the impact of marketing campaigns.
In this thesis, marketing strategies have been found as attractive options to support theoverall impact of behavior-changing feedback devices. When addressing the previoussub-questions, the diffusion of feedback devices showed to be of particular importancefor the eventual decrease in heating demand. If marketing is able to persuade aninitial set of households to adopt devices, word-of-mouth can drive more householdsto adopt the same devices. This can then trigger the other processes discussed in thisthesis: i.e. households undergoing behavior change due to feedback and the diffusion ofenergy-efficient behavior.
Comparison of marketing strategies showed that lending out devices, giving awayfree devices and targeting socially well connected households are particularly effectiveat triggering the largest effects. Simulation was used to systematically compare theeffectiveness of marketing strategies from the general categories economic incentives,promotion, and placement. Lending out feedback devices for three months each wasfound the most effective strategy. This strategy also appears to be highly practicalbecause only a limited number of devices needs to rotate among households. Likewise,initially giving away a limited number of free devices to households was also effective.Further, targeting different social groups was relevant for the effectiveness of marketing.The higher the social status of a household, the more effective targeting it via marketingappeared. Moreover, targeting households that are socially well connected (so-called‘Opinion Leaders’) appears particularly effective. Conversely, raising awareness aboutthe availability of feedback devices was generally found the least effective. The onlyexception to the low effectiveness of raising awareness was when this marketing strategywas targeted to Opinion Leaders and households of high social status.
When comparing the impact of marketing strategies regarding their cost-efficiency,they rank differently. Due to its low cost, raising awareness of the availability of feedbackdevices is of highest cost-efficiency—particularly when targeting households of highersocial status. Lending out feedback devices was second best regarding cost-efficiencybecause one device can be lent out to multiple households. Leveraging Opinion

6.1. CONCLUSION
6
111
Leaders was estimated to be less cost-efficient because their training is expected to beexpensive. Finally, giving away a limited number of free devices was found the leastcost-efficiency—with the only exception of when households of higher social status weretargeted.
These results were found to be generalizable between neighborhoods and cities ofimplementation. Regarding neighborhood of policy implementation, spatially focusedmarketing did only lead to a local increase in impact from feedback devices. Butchanging the place of marketing did not alter the overall behavior change from feedbackdevices on a larger spatial scale. Likewise, simulation results were also not sensitiveregarding spatial structure of a modeled city. This lack of sensitivity to spatial variationsuggests that the essential dynamics of co-diffusion of technology and behavior donot heavily rely on detailed spatial structures. Consequently, the use of commercialsocio-demographic data of high resolution will not always be needed for future,comparable simulation studies.
6.1.4. CONCLUSION 4: AUTOMATING INNOVATION DIFFUSION MODELING
The final step of the research approach aimed at making agent-based modeling lesscostly in time and labor. This made use of the methods from the previous steps. Previousmodel development and application in this thesis was principally taken out manually. Atthe time of writing, this was common practice in the field of agent-based innovationdiffusion modeling. To make these tasks more systematic, automation was applied.Thereby, the following question was addressed: How can innovation diffusion modelsbe developed and applied more systematically?
Conclusion 4 – Innovation diffusion models can be developed and applied moresystematically by the use of automation. This was realized by an automation softwareprototype that uses a standardized procedure to select model components that fit agiven innovation diffusion case. This makes building and using agent-based innovationdiffusion models more systematic and less costly in time and labor.
Realizing the presented automation approach was possible due to three factors: existingmodels candidates, their ontological similarities, and data availability. First, themultitude of available agent-based innovation diffusion models provides a high varietyof potential mechanisms of innovation diffusion (Kiesling et al., 2012). The presentedautomation procedure draws on this diversity. Instead of requiring the generationof entirely new mechanisms, simpler testing of explanations from previous modelsis possible. Second, most existing agent-based models of innovation diffusion areontologically similar (Kiesling et al., 2012): they have a shared understanding of objects,concepts, and other entities that are modeled (van Dam et al., 2012). This makes itpossible to use them as exchangeable modules in a meta-model. Modularization in theautomation software was able to directly map this modularization of models. Finally,the data-driven approach of the automation procedure required historic diffusion data.Because innovation diffusion is a well-established field of research, data on this processwas available.

6
112 6. CONCLUSIONS AND RECOMMENDATIONS
This approach showed to be successful at speeding up model generation andmaking the modeling process more systematic. Gain in speed was one of the designrequirements that motivated automation. Further, automation aimed at making themodeling process more systematic. The presented case application on the diffusion ofwater-saving shower heads showed that both targets could be met. Overall, this proofof concept underlines that the chosen automation approach fulfilled its purpose andsuccess.
6.1.5. OVERALL CONCLUSION
The previous conclusions on the sub research questions provide the foundationto answer the central research question of this thesis: How can the impact ofbehavior-changing feedback devices on energy-consumption behavior be systematicallysimulated?
Overall conclusion – The impact of behavior-changing feedback devices onenergy-consumption behavior can be analyzed systematically by simulating theco-diffusion of these devices and behavioral change. This relied on four pillars. First,assessment of impact based on developing and simulating the framework of co-diffusionof technology and behavior. This generalized the understanding of the potential impactof feedback devices. Second, the initially abstract model analysis was refined by empiricaldata. Third, the thus developed empirical-baed model allowed to assess the potentialof policies to influence the impact of feedback devices. Fourth, automation madeassessment of this impact more performant and accessible. Overall, this improves the wayagent-based models of innovation diffusion models are developed and applied.
Systematically assessing feedback devices via the framework co-diffusion of technologyand behavior proved to be fruitful. Dynamics of the impact of feedback devicesconfirmed that it has been worthwhile to include both these diffusions in theassessment. A further benefit of the co-diffusion framework was the possibility tooperationalize it for agent-based modeling. Doing so allowed to simulate and scale upfindings from field tests of feedback devices.
Scaling up the impact of feedback devices via simulation confirmed them to besuited to tackle low-hanging fruits of energy-efficiency in buildings. For households thatuse feedback devices, these achieve average energy savings of ca. 8% (Karlin et al., 2015).Conversely, upscaling the impact of a device with this impact to the city level projectedoverall savings of 1%–2%. These overall savings are significantly lower, but still have tobe seen as worthwhile because they come at low cost and high scalability.
The need to reduce heating energy consumption by far more than this projected 2%calls for a combination with other approaches. The roll-out of feedback devices needs tobe combined with e.g. upgrading the insulation of existing buildings. Connecting theseapproaches will be useful because the expected future increase in building insulationwill also increase the relative importance of user behavior in energy consumption.
The automation procedure presented in this thesis further improved performance ofdeveloping agent-based innovation diffusion models. Having sped up the developmentof innovation diffusion models via automation frees resources during the model building

6.2. LIMITATIONS AND FUTURE RESEARCH
6
113
process. These can be used by modelers to test a greater variety of model explanationsfor observed phenomena. Additionally, automating model generation reduces the needfor programming skills on the side of the modeler. This, in turn, widens the circle ofpersons that can apply agent-based modeling to better simulate and shape diffusions ofinnovations.
Finally, the presented automation procedure progresses the method of agent-basedinnovation diffusion modeling by making it more rigorous. First, this is done byachieving ‘validation by design’ of the generated diffusion models. This relies onthe strict comparison of the generated models with empirical data, assuring thatthese successfully represent real-world processes. Further, this strictly in-built modelvalidation contributes a systematic method to model comparison and falsification.Given empirical data of an innovation diffusion, the automation procedure guides thecomparison of realism between model candidates. This automated comparison makesit easier to identify plausible models and to take out the good scientific practice offalsifying less plausible ones.
6.2. LIMITATIONS AND FUTURE RESEARCH
Regarding the undertaken research approach, limitations are of three kinds: modeluncertainty, limitations of model application, and limitations of the presentedautomation approach. For each of these limitations, it is further proposed how to tacklethese.
6.2.1. MODEL UNCERTAINTY
Uncertainty is fundamentally inherent to simulation modeling. Modeling is asimplification and an abstraction from reality, due to which realism naturally has tobe reduced. Therefore, it can be regarded impossible to eliminate limitations to modelrealism. If models, which can only be built based on yet existing knowledge, are usedto predict the future, their uncertainty might further increase. Consequently, there arepotentially unlimited facets of model uncertainty and limitations to model realism.
Despite this fundamental uncertainty, when using a model to design solutions thatwould work in reality, it is still possible to make it useful for this task. To Pablo Picassoare attributed the words “Art is a lie that helps us see the truth.” The same has been saidabout simulation modeling. Accordingly, the way models are used can compensate fortheir inherent uncertainty.
In the following will be reflected on the three main model uncertainties in thisthesis—and it will be shown how modeling has still been made useful for these cases.First, limited empirical data from field tests of feedback devices might have affectedthe quality of results. Based on the available data, the energy savings from thecase technology ‘CO2 meter’ were estimated as 8%. This figure lies within a rangeof plausibility, but it might change with future insights. Fortunately, because thisuncertainty propagates linearly, results can readily be adjusted in the future. Second,consumer choice on energy-efficient heating behavior was modeled to happen equallyacross lifestyle groups, which might not be the case in reality. Conversely, choice onfeedback device adoption was modeled heterogeneously, based on experience with

6
114 6. CONCLUSIONS AND RECOMMENDATIONS
proxy innovations. This difference suggests that also heating behavior might diffuseheterogeneously through society. Future field research has the potential to provide theempirical insights into this. At this point in time, social structure of diffusion decisionswas modeled as detailed as available empirical data allowed for. Finally, an importantpart of this thesis is subject to the inherent uncertainty of future projections. Eventhough methods were applied to estimate the future success of feedback devices (e.g.using proxy-innovations and surveying), projecting the future diffusion of a yet to bemarketed innovation is fundamentally uncertain. The way the simulation models wereused had to cope with this uncertainty. For instance, it had to be made clear that theprojected successful diffusion of a device is a mere assumption. Instead of predicting ifa device will diffuse, it is rather suited to show what happens if it does. Additionally,generating findings from a large ensemble of varied simulation runs and potentialfutures helped to cope with this uncertainty.
The realism of the simulation models that were developed in this thesis canbe further increased. This will have the benefit of decreasing model uncertainty.Consequently, transfer of insights from models to reality will be strengthened. Ways howthis could be achieved are presented in the following section.
Empirical analysis of social influence Collecting data on how society influencesenergy consumption of individual persons is challenging, but valuable. In this thesis,qualitative data from interviews and surveys on the level of individual householdswas used to directly model the mechanisms by which social influence takes place.Quantitative observations on the aggregated, societal level were used to inversely modelthe rate of this change. A missing link between these data sources is quantitativebehavioral data of connected groups of individuals that is of high detail. Ideal data tofill this gap would be time line data of behavior of persons that also frequently interactwith each other in person. These data would appear suited to better understand andmodel interpersonal influence on energy consumption behavior.
Capturing behavior with higher temporal resolution Similar to data on socialinfluence of higher quality, it would be valuable to use behavioral data of highertemporal resolution. In this thesis, behavioral data from field research were aggregatedto the mere probability that a feedback device creates some behavior change amongits users. This aggregated figure was then directly integrated in the simulation models.Instead, it would be valuable to gain deeper empirical understanding of the processof behavior change from feedback. This would also include detailed behavioralmechanisms, such as relapse of behavior to the level prior to a feedback intervention.Capturing this phenomenon was not possible in this thesis, just the same as in previousresearch (see Chen et al., 2012). These insights would require behavioral data of highresolution and therefore would become possible if this data were available.
Modeling more kinds of behaviors With additional data on energy consumptionbehavior, behavior could also be modeled with greater detail. In this thesis, roomventilation was modeled as binary: households would either adopt energy-efficient‘shock ventilation’ or not. This was due to the focus on shock ventilation, but also due
6.2. LIMITATIONS AND FUTURE RESEARCH
6
115
to limited empirical data. When increasing resolution of behavioral data, feedback onthe impact of behavior changing feedback could be modeled better. For example, atransition from different ventilation behaviors to ‘shock ventilation’ might be of differentease and therefore different likelihood. Therefore, capturing more ventilation behaviorswith modeling could be worthwhile. It would also be beneficial to model the durationof ventilation, as this is an important factor to effectiveness and energy-efficiency ofventilation.
More detailed decision on device adoption It appears promising to increase the detailwith which decisions on device adoption are modeled. In this thesis, this is done basedon a previously validated, but rather simple decision model. At increased detail ofdecision modeling, it will become possible to model more types of interventions. Forinstance, if numerous relevant consumer preferences regarding the decision makingprocess on adoption are modeled, it could be derived how changes to these preferenceswould affect adoption choice. Via simulation could additionally be projected the overalleffect that such interventions would have on the diffusion of feedback devices and theirscaled-up impact.
6.2.2. LIMITATIONS OF MODEL APPLICATION
The chosen research approach led to further limitations in model application. Thisshowed in the limited number of case studies and restrictions in testing policies.
First, work in this thesis focused on exploring the impact of feedback devices viasimulation, which limited resources for generating empirical insights. This led to thecircumstance that only one case of a feedback device and only one type of energyconservation behavior was examined in depth. Consciously accepting this limitationallowed to instead prioritize the development of multiple simulation models and theprogression of computational methods.
Second, some potential policies could not be assessed, due to the chosen modelstructure. For instance, addressing specific preferences of consumers was not possible.This was because they were not modeled in great enough detail. Instead, the testedmarketing strategies had to address other aspects (i.e. price, promotion, and place).
Model application can be extended, to address these limitations. The followingparagraphs present options for this.
More cases of feedback devices A central future application of the developedsimulation models could be their application to more cases of feedback devices. Moreexperience could be gained on the temporal dimension and on the magnitude of overallimpact from feedback devices. Finally, policy recommendations would become morerobust with more cases and the simulation based assessment of policies would have astronger foundation.
Assisting the design of feedback devices The simulation models presented in thisthesis have the purpose to assess the impact of existing feedback devices. Instead,these models could also be used to assess the impact of hypothetical devices. Theseassessed hypothetical devices could be prototypes or early design drafts. In iterations

6
116 6. CONCLUSIONS AND RECOMMENDATIONS
between drawing board and simulation, ex-ante assessment via simulation would assistthe design of future feedback devices that can more effectively create behavior change.
Exploring synergies with other policies The policies that have been assessed in thisthesis were exclusively dedicated to support the diffusion of feedback devices. Inaddition to such policies, it would be attractive to concurrently test policies regardingother aspects of energy efficiency. For instance, one important set of policies to loweringenergy consumption in buildings is energy renovation. Energy renovation is an overallcrucial contribution to reducing heating demand. But it has repeatedly been observedthat energy-efficiency of heating behavior decreases after such renovations. Therefore,feedback devices could be used to support energy-efficiency of heating behavior after anenergy renovation. A coupling of the simulation models from this thesis with simulationmodels on renovation decisions, for instance, would make it possible to assess suchsynergy between policies.
6.2.3. LIMITATIONS OF THE AUTOMATION APPROACH
Finally, also the presented approach of automated generation of innovation diffusionmodels has its limitations. It faces some limitations regarding the applicability to casesand at extending the circle of users.
The applicability of the presented automation procedure to particularly uncertaincases of real-world processes might be limited. The procedure has shown to work wellfor the diffusion of a novel product in society. The success of this procedure relied on thefollowing factors: the availability of several simulation models, a shared understandingby these models on the modeled system, and the availability of data on the modeledprocess. Consequently, application to further cases of innovation diffusion appearsfeasible, whenever data are available. To cases where these conditions are not met, anautomated modeling approach might not applicable.
Further, even though the intention of enabling automated modeling is to extend thecircle of users, this could only be achieved to a limited degree. The central reason for thislimitation is that taking out the presented procedure requires data processing skills andat least basic understanding of simulation models. Data processing skills are required tocreate the required input. Additionally, even though the model building is automated,the user has to guide the software to create meaningful results. This critical role ofuser decisions is a common feature of automated data-analysis software, e.g. statisticstools. Even though the presented approach widens the circle of potential users, theserequirements for them limit their number.
These limitations can be addressed by future research. Building on the presentedprocedure for the automated generation of agent-based models of innovation diffusionbears significant potential.
Additional cases of feedback devices Having developed a way to automaticallygenerate and apply simulation models on innovation diffusion will facilitate modelingthe diffusion of more feedback devices. With model building being automated, userswill be able to focus on only providing required data on their diffusion or suited proxies.Thus, applying agent-based modeling to the assessment of more feedback devices will

6.2. LIMITATIONS AND FUTURE RESEARCH
6
117
be relatively time-efficient, compared to repeated manual model development ‘fromscratch’.
Identifying reference models on innovation diffusion Being able to automatically testmany diffusion models against the same set of empirical data will make it possible toidentify reference models of innovation diffusion. A current limitation in the field ofinnovation diffusion modeling is the multitude of simulation models. At this point intime, it is not clear which of the theoretical explanations contained in the numerousinnovation diffusion models has the widest applicability. This thesis contributes to thefield of agent-based innovation diffusion modeling by presenting the procedure that iscapable of falsifying models for specific cases of innovation diffusion. Future researchthat applies this procedure to many cases might be able to find out what diffusion modelworks under what system characteristics.
Improving automated inverse modeling Also technical improvements to thepresented automation approach appear to be of significant potential. In thepresented automation procedure, the inverse modeling phase is crucial. Itspotential for improvement should therefore be further evaluated. The now used‘simulated annealing’ optimization technique could for instance be compared to otheroptimization approaches. One criterion of comparison could be how robust resultquality is (e.g. against user decisions in the matching function).
Generating simulation models from atomic components One particularly attractiveimprovement to the automation procedure would be generating innovation diffusionmodels without requiring a library of complete decision model candidates. Thepresented automation prototype requires entire decision models to be stored ascomponents in a pre-defined model library. This has the disadvantage of redundancy:mechanisms such as word-of-mouth have to be implemented for each component in thelibrary. Instead, these models could be broken down to the smallest possible sub-modelsthat could be re-assembled at runtime of the automation procedure. Each mechanism(e.g. word-of-mouth) would become one of these models components. Based on data,components could then automatically be combined to models, similar the way decisiontrees are ‘grown’ and ‘pruned’ in the field of machine learning. Thus, reducing the sizeof the required components in the model library would potentially reduce the effort ofextending the model library.
Increasing user-friendliness Finally, it would be worthwhile to invest time into greateruser-friendliness of the presented automation approach. For now, the automationsoftware is at the stage of a proof of concept. Because it has the potential to beapplied by non-programmers, it could also be made even more accessible to them.First, data analysis tools could be integrated on the input side of the procedure thatmight make it possible to automatically build models directly from unstructured inputdata. Further, to support users at selecting diffusion models and policies to be tested, agraphical user interface could also be beneficial. Finally, more detailed reporting couldmake the approach more transparent to laypersons. Overall, it is to be expected that

6
118 6. CONCLUSIONS AND RECOMMENDATIONS
these improvements have the potential to further support the anticipated adoption ofagent-based modeling by non-modelers in order to allow them to better understand andshape innovation.
6.3. REFLECTION
In the following, this thesis will reflect on lessons on adequate complexity of modelinginnovation diffusion. Thereafter, an outlook is given on future models in forecasting andon the democratization of predictive modeling.
6.3.1. COMPLEXITY OF AGENT-BASED INNOVATION-DIFFUSION MODELS
There exist two schools of thought that each propose use of either simple or complexagent-based models. Both views have valid arguments, making it difficult to sidewith only one of them. On the one hand, it is advocated to use simple models thatavoid overfitting real-world phenomena by capturing only the most important drivingfactors. On the other hand, other modelers propose to use models that are descriptive bycapturing the modeled phenomena more intuitively, but are also more complex.
The automation approach presented in this thesis offers a third way. The presentedapproach informs on adequate model complexity by making rigorous use of empiricaldata. By testing models of varied complexity against data, it informs users which modelcomplexity is adequate to explain a real-world phenomenon. This complements thesomewhat arbitrary intuition of modelers with systematic benchmarking against data.
The presented automation approach assists modelers in choosing between simpleand descriptive models. Furthermore, the automated approach facilitates the paralleldevelopment and application of multiple models. Without significant added effort,modelers can both develop simple and descriptive models in parallel. With thismulti-model approach, modeling can draw on both these worlds to create the bestmodel ensemble. Thereby, it is useful that all of the agent-based models generated bythe presented automation approach are close to theories and are black boxes (as e.g.current deep learning models). Consequently, a multi-model approach has the benefitof providing complementing mechanistic explanations of the modeled innovationdiffusion.
6.3.2. FUTURE MODELS IN FORECASTING
One of the take home messages of this thesis is that there is great potential to improvethe quantitative models used in forecasting. While building these models is up to futureresearch, it is already possible today to describe design targets for them. The followingsection proposes a direction into which to develop these models for forecasting.
Such outlook can directly build on existing modeling paradigms, which each havesome desired traits. A desirable forecasting model would show the following foursigns. It would be highly predictive, quick, user-friendly, and informative. First,being – within the inherent limitations of this undertaking – highly predictive is a keyproperty of a powerful forecasting model. A current modeling paradigm that is strongat this is deep learning. Second, model development and application should also bequick. This is currently achieved by statistical models. But given the emerging cloud
6.3. REFLECTION 119
computing infrastructure, parallel computation is becoming a valid alternative means.Third, a forecasting model should be user-friendly. This trait is commonly found atautomated statistical software packages. Finally, a model should be informative aboutthe mechanisms on which forecasting relies. This is a property at which agent-basedmodels are currently strong.
Future research should aim at combining these advantages. In contrast to biologicalevolution, the evolution of technology is easily capable of recombining technologies,even if they have evolved significant differences (Kelly, 2010). This emphasizes thefeasibility of cross-learning between the different modeling schools in forecasting. Theingredients for the next generation of forecasting models are there. Now, they need to beput together.
6.3.3. DEMOCRATIZING PREDICTIVE MODELING
We are moving towards a digital society that generates and finally can make use of vastamounts of data. These data can be generated on virtually every aspect of our lives. Dueto the mega trends of Internet of Things and Quantified Self, this includes also detaileddata of individual persons. Such fine grained data can be used for generating ‘what-ifscenarios and predictions on these persons. But one of the key questions regarding thisis who should be able to do so.
An important challenge for the future is to democratize this technological potential.Presently, there exists a large divide between leading tech companies and individualpersons. Many state-of-the-art businesses make use of model-based analytics.Conversely, almost no individual person does. Empowering laypersons to analyze theirpersonal ‘data trails’ would help closing this digital divide.
To achieve democratization of predictive modeling, model-based analytics needs tobecome more accessible to these individuals. Models need to become easier to useand their results need to become more intuitive. They also need to be highly flexibleregarding their input data. Achieving this would increase the society-wide use of selfservice analytics. Only then would it be possible to maximize the total value that societygenerates from this technology.


AMODEL DESCRIPTION
In the following, the agent-based model developed in this paper is described using theODD (Overview, Design concepts, Details) protocol (Grimm et al., 2010).
PURPOSE
The purpose of this model is to investigate the effect of behavior-changing feedbackdevices on heating behavior by capturing the diffusion of technology and behavioramong households communicating on technology adoption and energy consumptionbehavior. Both processes are combined in one model to explore their relativeimportance on the overall effect of behavior-changing feedback technology.
ENTITIES, STATE VARIABLES, AND SCALES
Central entities of the model are agents that represent individual households in onecity. Each household agent has three static attributes. First, an agent is of one of fivesociological lifestyles (Postmaterialists, Social Leaders, Traditionalists, Mainstream orHedonistic lifestyle) defining its preferences to adopt environmental-friendly householdtechnology (see Schwarz and Ernst, 2009). Second, agents have a set of social ties to otherhousehold agents, their peers. The number of peers is based on empirical observations(see Fig. 2.3). Third, each household has a static position in the two-dimensionalspace. Location defines the likelihood peers are linked with one another, because spatialproximity makes a link between two households more likely (Holzhauer et al., 2013).
Additionally, each household has two dynamic state variables. First, a household haseither adopted technology or not, represented by a binary variable. Second, a householdhas a specific energy consumption behavior. Here, we defined this as the mean spaceheating temperature, with unit ◦C.
Temporal resolution of the model is monthly time steps from January 1990 toDecember 2019.
Spatial resolution is abstract. Households have a random and fixed position in atwo-dimensional rectangular plane with side length of 100 continuous spatial units. This
121

A
122 A. MODEL DESCRIPTION
plane does neither wrap to a cylinder nor torus, but represents a well-delimited spatialarea, such as a city.
PROCESS OVERVIEW AND SCHEDULING
The model consists of the sub-models ‘technology diffusion’, ‘feedback effect’ and‘behavior diffusion’, which are executed successively at each time step. Within thesesub-models, agents change their state variables concurrently, i.e. their future states arepartly influenced by the state variables of their peers at the previous time step. Modelinitialization, steps, and sub-models for each time step are as follows:
1. Initialization
2. WHILE (t < tmax ):
(a) Technology Diffusion
(b) Feedback Effect
(c) Behavior Diffusion
DESIGN CONCEPTS
Basic principles applied in the model are mainly four scientific theories. First, Diffusionof Innovations Theory (see Rogers, 2003) is applied as a general model guideline. Itcontributes to representing the spread of technology and behavior innovations whenpotential adopters interact. Thereby, Rogers’ distinction between earlier and lateradopters is captured by the different decision making of the five sociological lifestylesfor adopting feedback technology. Second, Social Network Theory is applied byconnecting households in a social network graph. This graph defines social ties betweenhouseholds, among which these communicate. This informs agents of the adoption andenergy consumption behavior of their peers. Consequently, social influence can affectthe households’ decisions in these realms. Third, technology adoption is partly basedon the Theory of Planned Behavior (see Ajzen, 1991). This decision theory underliesagents’ decision to adopt technology. According to this theory, an innovation adoptiondecision depends on both the adopter’s preferences and her peers’ decisions (Rogers,2003). Finally, behavior diffusion is based on Social Learning Theory (see Banduraand McClelland, 1977), which suggests peer behavior influences energy consumptionbehavior of households.
Emergence occurs through the diffusions of technology and behavior. Thesediffusions are macro processes based on adoption decisions at the micro level, i.e. thelevel of agents.
Sensing of household agents occurs through social ties of the social network graph.Agents perceive which of their peers adopt feedback devices and what temperature theyset for heating. This sensing of peer behavior marks the origin of social influence.
Interaction occurs through social influence between household agents sharingrelationship links. For technology diffusion, adopting peers increases the probability(where this equals not already 1) a household adopts feedback technology. Forbehavior diffusion, a household agent gradually adapts its energy consumption behavioraccording to the mean behavior of its peers.

A
123
Objectives of household agents drive their choices on technology adoption or energyconsumption behavior. Agents adopt feedback devices if it incurs a relative advantageover not adopting. Inspired by the Theory of Planned Behavior, this decision can beinfluenced by the number of adopting peers. For behavior diffusion, household agentsfollow objectives: habituality and conformity. With no social influence, householdagents habitually practice their previous behavior. Social influence, however, motivatesbehavioral change towards the mean peer behavior. The strength of this social influenceis defined by si , the households’ susceptibility to behavioral change (see below).
Adaptation appears when agents’ make different decisions at varying levels of socialinfluence. All peers of a household supporting a certain decision can increase thelikelihood this household makes the same decision.
Stochasticity occurs in three aspects. First, location of agents and their social networkare initialized randomly. Second, each time step agents have a random probability toconsider technology adoption. Finally, the lifestyles Mainstream, Traditionalists andHedonists do not decide on technology adoption by deterministic deliberation, but byapplying the so called ‘take-the-best’ heuristic.
Observations lead model design decisions on the social network topology,preferences to adopt technology, and energy consumption behavior. From interviewson ego-networks of communication on energy consumption behavior, provided byBaedeker Baedeker (2014), have been derived the degree distribution in the socialnetwork (see Fig. 2.3) and the probability of a network tie to be of short spatial distance(pN B HD = 0.5). From surveys on the mean space heating temperatures in Britishhouseholds by Shipworth et al. Shipworth et al. (2010), the initial energy consumptionbehavior is set to 21.1◦C. The technology adoption decision of agents is based onextensive surveying conducted by Schwarz Schwarz (2007).
INITIALIZATION
Model initialization follows three successive steps: creating household agents,generating the social network and setting the adoption state variables of the agents.
Initialization creates N household agents. Each agent is assigned a random locationand a random lifestyle, weighted by an empirical distribution (see Table 2.1).
The social network is built on two empirical foundations. First, we extracttwo statistical ego-network properties from interviews with households about energyconsumption behavior (Baedeker, 2014). These properties include the ‘degreedistribution’ of network nodes (see Fig. 2.3) and the probability relevant communicationwithin a city occurs in the same neighborhood (pN B HD = 0.5). The second theoreticalfoundation is members of a certain sociological lifestyle communicate more withmembers of the same lifestyle. We developed an algorithm that was inspired by Wattsand Strogatz Watts and Strogatz (1998) to generate a social network that meets theseempirical characteristics:
1. Assign a degree target deg∗(i ), i.e. the ideal number of peers of each agent, forfitting the overall degree target distribution to the empirical degree distribution.
2. Create a number of links equal to the respective degree target by repeatedlyapplying for the agents with fewer assigned peers than their degree target:

A
124 A. MODEL DESCRIPTION
(a) Randomly choose lifestyle with which to connect (probability to connect toown lifestyle is set by the homophily-probability h, while all other lifestylesshare the residual probability equally).
(b) Connect to a random agent of the chosen lifestyle, who has less peers thanits degree target and who is closer than dN B HD .
3. Remove each relationship link with a probability (1 - pN B HD ).
4. Repeat step 2 with the altered constraint forging connections between agents withdistance greater than dN B HD .
Finally, the adoption state variables are initialized for all agents. Household agentsare assumed not to initially adopt feedback technology. The initial energy consumptionbehavior (yi ,t0 ) is homogeneously set to 21.1◦C for all agents, based on the mean of spaceheating temperatures observed by Shipworth et al. Shipworth et al. (2010).
SUBMODEL: TECHNOLOGY DIFFUSION
This submodel represents the decision framework for agents to adopt technology, whichbased directly on the empirical-based model presented by Schwarz Schwarz (2007).
Agents have a fixed probability at each time step to decide on adoption (δα).When deciding, the adoption decision is modeled to be qualitatively different betweenlifestyles. For some lifestyles, i.e. Postmaterialists and Social Leaders, surveying showsthat they trade-off many criteria when deliberating on adoption Schwarz (2007). Thedecision for these lifestyles is thus modeled on rational deliberation, similar to theTheory of Planned Behavior (see Ajzen, 1991), but without underlying social influence.Conversely, Hedonists, Mainstream, and Traditionalists generally consider fewer criteriawhen deciding on technology adoption. Thus, agents of these lifestyles are notdeliberating rationally on technology adoption, but apply the so-called take-the-bestheuristic (Schwarz, 2007, see). They decide according to the most important stateddecision criteria that clearly favor one choice option. Two decision criteria with the samestated importance are processed in a random order. If this heuristic does not lead to aclear decision, agents imitate the majority of their peers.
We parameterized the decision model for adoption preferences using Schwarz(Schwarz, 2007) surveyed results on water-saving shower heads for energy-savingfeedback technology. This transfer is motivated by the relatively high similarity betweenthese two resource-saving technologies.
These adoption decisions are equivalent to simpler decision rules. First, the lifestylesPostmaterialists and Social Leaders always decide in favor of the environmental-friendlyoption. Second, the Mainstream and Traditionalist lifestyles are, with an equalprobability, randomly choosing between imitating the majority of their peers andadopting the eco-friendly option. Finally, agents of the Hedonistic lifestyle always decideto imitate the majority of their peers.
SUBMODEL: FEEDBACK EFFECT
The sub-model Feedback Effect describes how adopted feedback technology changesthe agent’s heating behavior state variable. We model behavioral change from feedback

A
125
technology over time as an asymptotic learning process, see Eq. A.1. Thereby, energyconsumption behavior (βt ) asymptotically approaches a behavior suggested by thefeedback (β∗
∞) with the rate ∆β.
βt =βt−1 + (β∗∞−βt−1) ·∆β (A.1)
SUBMODEL: BEHAVIOR DIFFUSION
The sub-model Behavior Diffusion describes how peer behavior influences agentheating behavior, see Eq. A.2. The strength of social influence (si ) drives a household toapproach from its own previous behavior (βi ,t−1) toward the behavior of its peers (β j ,t−1)weighted by the strength of their mutual social relationship (wi j ).
βi ,t =βi ,t−1 + si ·
(
N∑
j=1wi j ·β j ,t−1
N∑
j=1wi j
−βi ,t−1
)
(A.2)

BINPUT DATA
In the following, generation of household agents and their social network from empiricaldata is presented.
Households For all residential buildings in the case area, heated floor area andestimated heating demand were available from municipal data. Due to privacyprotection, the number of residents was not available for individual residentialbuildings, but for building blocks (i.e. neighborhoods). From this, the number ofhouseholds per building block was calculated based on the regional average householdsize of c. 2.12 persons Landesbetrieb Information und Technik Nordrhein-Westfalen(IT.NRW) (2014). These household agents were assigned to residential buildings, so that:(1) to each building is assigned at least one household agent, (2) within each buildingblock, the number of assigned household agents per building are ideally proportionalto its heated floor area. Thus, household agents of the same building block had approx.the same heated floor area. Finally, household agents were positioned within the spatialextent of their buildings.
Lifestyles were assigned to household agents based on geo-marketing data.Commercial data by the company Microm® provided the locally dominant lifestyle forall road sections in the case area. Each household agent was assigned a lifestyle by expertjudgement, depending to the lifestyle data-points in its spatial proximity.
Social network Social influence between household agents is modeled via a socialnetwork. This network was empirically based on a mixed-methods social networkanalysis Prell (2011); Holstein and Straus (2006) conducted in the City of Bottrop,Germany. It provided data on communication on heating behavior. Interviewswere conducted with 23 householders; both inhabitants of one-family dwellings andapartment buildings. Personal relations and relations to actors in the value chain ofheating/space heating (i.e. craftspeople, manufacturers) were mapped to social networkgraphs around the interviewed persons Baedeker et al. (2014). According to these
127

B
128 B. INPUT DATA
interviews, family and friends have a high impact on decisions regarding ventilation andheating behavior.
Modeling a social network followed two statistical properties, extracted from theseego-networks: (1) the probability of a social network tie to be within the sameneighborhood (pN B HD ) and (2) the distribution of network degree, i.e. the number ofpeer households by which a household is influenced (Jensen et al., 2015, Fig. 3). Thesedata points were complemented by data from Holtzhauer Holzhauer (2015), describinghow lifestyle groups are mutually connected in social networks of influence (see TableB.1).
Table B.1: Probability of an influencing peer to be of a specific lifestyle, depending on ego’s lifestyle (Holzhauer,2015, Fig. 3.8).Note that in this study Traditional Lifestyles are aggregated with (and as) Mainstream Lifestyles.
Peer lifestyle
(influencing householder)LeadingLifestyles
MainstreamLifestyles
TraditionalLifestyles
HedonistsLifestyles
Ego lifestyle
(influenced householder)Leading Lifestyles 0.59 0.10 0.22 0.09Mainstream Lifestyles 0.50 0.34 0.12 0.04Traditional Lifestyles 0.36 0.25 0.32 0.07Hedonists Lifestyles 0.37 0.15 0.32 0.16
Social network generation, inspired by the Watts & Strogatz Watts and Strogatz (1998)algorithm for creating small-world networks, followed these steps:
1. To each household, assign a degree target (deg∗i ), randomly drawn from an
empirical distribution (Jensen et al., 2015, Fig. 3).
2. For each household i with less influencing peers than deg∗i :
(a) Randomly choose lifestyle of next peer, weighted by probabilities from TableB.1.
(b) Create directed network edge from random other household who (1) has thechosen lifestyle and (2) is within the same neighborhood (i.e. closer thandN B HD ).
3. For each network edge: delete network edge at probability (1 - pN B HD ).
4. Repeat step 2 with the altered constraint that new peers are not in the sameneighborhood (i.e. distance greater than dN B HD ).

CGOOGLE TRENDS
Frequency of Google searches on SV behavior was used as a proxy for frequencyof deliberation on its adoption. Google Trends Google (2015) was inquiredfor the frequency of Google searches for ‘Stoßlüften’ (i.e. the German term forshock-ventilation). Google Trends is “a real-time daily and weekly index of the (relative)volume of queries that users enter into Google” Choi and Varian (2012). Reported sets ofdata are normalized spatially and temporally by being “divided by a common variable,like total searches” Google (2015).
0.0
0.5
1.0
2006−1−1
2007−1−1
2008−1−1
2009−1−1
2010−1−1
2011−1−1
2012−1−1
2013−1−1
2014−1−1
2015−1−1
time
Fre
qu
en
cy
Figure C.1: Google Trends data and simplified sine curve. The solid line shows the normalized Google searchactivity for the German expression for shock-ventilation. The dashed line is fitted to this data (see Eq. C.1) andused in the model.
Search frequency is shown in Fig. C.1. In the Google search frequency twopatterns were observed—a seasonal and an inter-annual one. Seasonally, frequencymirrors the relevance of energy-efficient ventilation during winter. Inter-annually,frequency increased after 2009 and reached a plateau.1 However, the outlying winter of2010/2011—with relatively low search frequency—could neither be explained by wintertemperatures nor press article frequency on SV.
1This inter-annual pattern was verified by analyzing all German press articles in the GENIOS.DE database.Articles containing ‘Stoßlüften’ (normalized by the number of all articles) quickly became more frequent by afactor of c. 2.5 in 2007 and remained at that level.
129

C
130 C. GOOGLE TRENDS
Table C.1: Survey results on the stated information on and motivation to adopt SV behavior. Listed are relativeshares of information/motivation sources. Responses cumulated to n responses, multiple responses beingallowed. The two last rows separate the motivation to adoption SV behavior into motivation from informationand social influence (see text for details).
Response Colleagues
& classmates
Family
& household
Friends
& acquaintances
Mass
media
∑
% n
Information on SV 3.8 % 23.2 % 19.6 % 53.6 % 100 56Motivated SV adoption 5.9 % 35.3 % 17.6 % 41.1 % 100 56Motivation:information
2.7 % 17.8 % 15.1 % 41.2 % 76.9 17
Motivation:social influence
3.1 % 17.5 % 2.5 % 0 % 23.1 17
Google search activities were mathematically generalized with Eq. C.1, whichdistinguishes these two temporal patterns. The function of this equation is shown bythe dashed line in Fig. C.1. It is the product of two mathematical terms, which arefunctions of the time step (i.e. month) of simulation, starting in January 2006: (1) Theseasonal peaking of searches on SV during winter motivated using a sine function asa generalization (see Eq. C.2). Similar to the search data pattern, this function peaksduring winter (i.e. in January) and does not assume negative values. (2) To also capturethe inter-annual pattern, this first term is scaled linearly by Eq. C.3. In the Google Trendsdata, search activity on SV behavior was absent before the winter of 2008/2009, relativelylow during the winter of 2008/2009, and relatively constant thereafter. These threephases are represented by linear factors to the seasonal sine function. Their respectivefactors represent the difference in the integral over the respective winter peaks in searchactivity.
δβ, f i t (t ) = δβ,annual ·δα,season (C.1)
δβ,season(t ) = max
[
0,sin
(
t −2.23
6·π
)
·0.72+ (1−0.72)
]
(C.2)
δβ,annual (t ) =
0 if t ≤ 30
0.235 if 30 < t < 42
1 if t ≥ 42
(C.3)
Assuming that search activity is generally proportional to the occurrence of eventsthat trigger deliberation on SV adoption, both these components were scaled by therate at which such events occur. Both the inter-annual and seasonal patterns ofinformation search activity are thus scaled by the the occurrence rate of events thattrigger deliberation on SV adoption (δβ,event ). Because this rate was not available fromthe literature, it was parameterized indirectly as ranging from 0.01 to 0.03 (see 4.4.5).Thus, average modeled occurrence of events that can trigger adoption deliberation isbetween c. 2.5 to 8 years.
δβ(t ) = δβ,event ·δβ,annual (t ) ·δβ,season(t ) (C.4)

DSURVEY EVALUATION
This section presents how shares of SV adoption motivated by information and socialinfluence were extracted from survey results.
The surveyed relative contribution of sources to information and motivatingadoption is shown in Table C.1. Regarding distributing information on SV, social contactsand media had about the same importance of 46 and 54%, respectively. Conversely,media slightly exceeded social contacts in importance for motivating behavior change,with 59 over 41%, respectively.
Even though this could suggest that SV adoption is mainly motivated by socialinfluence (rather than from an information source as media), the authors argue thatprovision of information from peer has to be considered, too. The importance of media(and thus of information) in motivating SV adoption let us to distinguish motivationfurther between motivation from information and motivation from social influence.
The differentiation between media and social contacts in motivating SV adoptionwas therefore transformed into the differentiation between information and socialinfluence. This was undertaken by combining (1) the assumption that media onlyexceeds information, but not social influence and (2) the relative strength to whichmedia and each peer category provide information (see Table C.1). As a result,76.9% of adoptions are resulting from exposure to information, and 23.1% fromsocial influence. If the category ‘family and household members’ is excluded fromthis calculation—because it partly covers intra-household interactions—, the sharesbetween social influence and information in motivating SV adoption are 8.8 and 92.2%,respectively.
131

BIBLIOGRAPHY
Aalen, O. O. and Frigessi, A. What can statistics contribute to a causal understanding?Scandinavian Journal of Statistics, 34(1):155–168, 2007.
Afman, M. R., Chappin, E. J. L., Jager, W., and Dijkema, G. P. J. Agent-based modelof transitions in consumer lighting. In Proceedings of 3rd World Congress on SocialSimulation, Kassel, Germany, pages 1–2, 2010. URL http://chappin.com/emile/
docs/Afman10a.pdf.
Ahrweiler, P. and Gilbert, N. Caffè nero: the evaluation of social simulation. Journal ofArtificial Societies and Social Simulation, 8(4), 2005.
Ajzen, I. The Theory of Planned Behavior. Organizational Behavior andHuman Decision Processes, 50(2):179–211, 1991. ISSN 0749-5978. doi: 10.1016/0749-5978(91)90020-T. URL http://www.sciencedirect.com/science/
article/pii/074959789190020T.
Anderson, K., Lee, S., and Menassa, C. Impact of social network type and structureon modeling normative energy use behavior interventions. Journal of Computingin Civil Engineering, 28(1):30–39, 2014. ISSN 0887-3801. doi: 10.1061/(ASCE)CP.1943-5487.0000314. URL http://ascelibrary.org/doi/abs/10.1061/%28ASCE%
29CP.1943-5487.0000314.
Araghi, Y., Lee, E. P., and Bollinger, L. A. Informing agent based models with discretechoice analysis: diffusion of solar pv in the netherlands. Proceedings of SocialSimulation Conference 2014, 2014.
Armitage, C. J. and Christian, J. From attitudes to behaviour: Basic and applied researchon the theory of planned behaviour. Current Psychology, 22(3):187–195, September2003. ISSN 0737-8262, 1936-4733. doi: 10.1007/s12144-003-1015-5. URL http://
link.springer.com/article/10.1007/s12144-003-1015-5.
Azar, E. and Menassa, C. C. Framework to evaluate energy-saving potential fromoccupancy interventions in typical commercial buildings in the United States. Journalof Computing in Civil Engineering, 28(1):63–78, 2014. ISSN 0887-3801. doi: 10.1061/(ASCE)CP.1943-5487.0000318. URL http://ascelibrary.org/doi/abs/10.1061/
%28ASCE%29CP.1943-5487.0000318.
Azar, E. and Menassa, C. C. Evaluating the impact of extreme energy use behavior onoccupancy interventions in commercial buildings. Energy and Buildings, 97:205–218,2015.
133

134 BIBLIOGRAPHY
Baedeker, C. E-mail communication on results of SusLab project on social networks ofheating behavior communication., 2014. Date: 2014-5-22.
Baedeker, C., Greiff, K., Grinewitschus, V., Hasselkuß, M., Keyson, D., Knutsson, J.,Liedtke, C., Lockton, D., Lovric, T., Morrison, G., et al. Transition through sustainableproduct and service innovations in sustainable living labs: application of user-centredresearch methodology within four Living Labs in Northern Europe. In IST 2014: 5thInternational conference on Sustainability Transitions, 2014.
Bagnoli, F., Liò, P., and Sguanci, L. Risk perception in epidemic modeling. PhysicalReview E, 76(6):061904, December 2007. doi: 10.1103/PhysRevE.76.061904. URLhttp://link.aps.org/doi/10.1103/PhysRevE.76.061904.
Balaras, C. A., Droutsa, K., Dascalaki, E., and Kontoyiannidis, S. Heating energyconsumption and resulting environmental impact of European apartment buildings.Energy and Buildings, 37(5):429–442, May 2005a. ISSN 0378-7788. doi: 10.1016/j.enbuild.2004.08.003. URL http://www.sciencedirect.com/science/article/
pii/S0378778804002464.
Balaras, C. A., Droutsa, K., Dascalaki, E., and Kontoyiannidis, S. Deterioration ofEuropean apartment buildings. Energy and Buildings, 37(5):515–527, 2005b.
Balaras, C. A., Gaglia, A. G., Georgopoulou, E., Mirasgedis, S., Sarafidis, Y., and Lalas,D. P. European residential buildings and empirical assessment of the Hellenicbuilding stock, energy consumption, emissions and potential energy savings. Buildingand Environment, 42(3):1298–1314, March 2007. ISSN 0360-1323. doi: 10.1016/j.buildenv.2005.11.001. URL http://www.sciencedirect.com/science/article/
pii/S0360132305004671.
Bandura, A. and McClelland, D. C. Social learning theory. Prentice-Hall Englewood Cliffs,NJ, 1977.
Bass, F. M. A new product growth for model consumer durables. Management science,15(5):215–227, 1969.
Berkhout, P. H. G., Muskens, J. C., and Velthuijsen, J. W. Defining the rebound effect.Energy policy, 28(6):425–432, 2000.
Birol, F. World energy outlook. International Energy Agency, 2008.
Bourdieu, P. Distinction: A social critique of the judgement of taste. Harvard UniversityPress, 1984.
Briegel, R., Ernst, A., Holzhauer, S., Klemm, S., Krebs, F., and Piñánez, A. M.Social-ecological modelling with LARA: a psychologically well-founded lightweightagent architecture. In 2012 International Congress on Environmental Modellingand Software Managing Resources of a Limited Planet, Sixth Biennial Meeting,Leipzig, Germany, pages 2513–2520, 2012. URL http://ftp.jaist.ac.jp/pub/
sourceforge/l/la/lara-framework/fullPaperBriegelEtAl_preprint.pdf.

BIBLIOGRAPHY 135
Burchell, K., Rettie, R., and Roberts, T. Working together to save energy?, June 2014.Report of the Smart Communities project.
Cantono, S. and Silverberg, G. A percolation model of eco-innovation diffusion: therelationship between diffusion, learning economies and subsidies. TechnologicalForecasting and Social Change, 76(4):487–496, 2009.
Caritas. Energy-saving-check program for low income households, 2016.URL http://www.stromspar-check.de/english.html. Available at:http://www.stromspar-check.de/english.html.
Chappin, E. J. L. Simulating Energy Transitions. Next Generation InfrastructuresFoundation, 2011. ISBN 9789079787302. PhD thesis, Delft University of Technology.
Chappin, E. J. L. and Dijkema, G. P. J. Modeling for transition management. Available atSSRN 2618413, 2015.
Chen, J., Taylor, J. E., and Wei, H.-H. Modeling building occupant networkenergy consumption decision-making: The interplay between network structure andconservation. Energy and Buildings, 47:515–524, April 2012. ISSN 0378-7788. doi:10.1016/j.enbuild.2011.12.026. URL http://www.sciencedirect.com/science/
article/pii/S0378778811006414.
Choi, H. and Varian, H. Predicting the present with Google Trends. Economic Record, 88(s1):2–9, 2012. doi: 10.1111/j.1475-4932.2012.00809.x.
Costanza, E., Ramchurn, S. D., and Jennings, N. R. Understanding domestic energyconsumption through interactive visualisation: a field study. In Proceedings of the2012 ACM Conference on Ubiquitous Computing, pages 216–225. ACM, 2012.
Cozzo, E., Baños, R. A., Meloni, S., and Moreno, Y. Contact-based social contagionin multiplex networks. Physical Review E, 88(5):050801, November 2013. doi: 10.1103/PhysRevE.88.050801. URL http://link.aps.org/doi/10.1103/PhysRevE.
88.050801.
Dahlstrom, O., Sornes, K., Eriksen, S. T., and Hertwich, E. G. Life cycle assessmentof a single-family residence built to either conventional- or passive house standard.Energy and Buildings, 54:470–479, November 2012. ISSN 0378-7788. doi: 10.1016/j.enbuild.2012.07.029.
Darby, S. The effectiveness of feedback on energy consumption. A Review for DEFRA ofthe Literature on Metering, Billing and direct Displays, 2006, 2006. URL http://www2.
z3controls.com/doc/ECI-Effectiveness-of-Feedback.pdf.
de Holanda, G. M., Ávila, I. M. A., and Martins, R. B. Mapping users’ perspectives andoutlining social impacts from digitalization of terrestrial TV in Brazil. Telematics andInformatics, 25(1):19–35, 2008.
136 BIBLIOGRAPHY
Delft University of Technology. E-quarium - an energy visualization and advicesystem. http://www.io.tudelft.nl/actueel/congressen-en-symposia/
design-for-our-future-13-september-2013/delft-design-labs/
applied-labs/e-quarium/, 2014. Accessed: 2014-07-28.
Delre, S. A., Jager, W., Bijmolt, T. H. A., and Janssen, M. A. Targeting and timingpromotional activities: An agent-based model for the takeoff of new products. Journalof Business Research, 60(8):826–835, August 2007. ISSN 0148-2963. doi: 10.1016/j.jbusres.2007.02.002. URL http://www.sciencedirect.com/science/article/
pii/S0148296307000392.
Delre, S. A., Jager, W., Bijmolt, T. H. A., and Janssen, M. A. Will it spread or not? theeffects of social influences and network topology on innovation diffusion. Journal ofProduct Innovation Management, 27(2):267–282, 2010. ISSN 07376782. doi: 10.1111/j.1540-5885.2010.00714.x.
Drogoul, A., Vanbergue, D., and Meurisse, T. Multi-agent based simulation: Where arethe agents? In Multi-agent-based simulation II, pages 1–15. Springer, 2002.
Edenhofer, O., Pichs-Madruga, R., Sokona, Y., Farahani, E., Kadner, S., Seyboth, K., Adler,A., Baum, I., Brunner, S., Eickemeier, P., Kriemann, B., Savolainen, J., Schlömer, S.,von Stechow, C., Zwickel, T., and Minx, J., editors. Climate Change 2014: Mitigationof Climate Change. Contribution of Working Group III to the Fifth Assessment Reportof the Intergovernmental Panel on Climate Change. Cambridge University Press,Cambridge, United Kingdom and New York, NY, USA, 2014.
Ekpenyong, U. E., Zhang, J., and Xia, X. Mathematical modelling for the social impact toenergy efficiency savings. Energy and Buildings, 84:344–351, 2014. URL http://www.
sciencedirect.com/science/article/pii/S0378778814006616.
Elsevier. Scopus, 2015. URL http://www.scopus.com. Retrieved 2015-11-27.
Epstein, J. M. Growing artificial societies: social science from the bottom up. BrookingsInstitution Press, 1996.
Epstein, J. M. Why model? Journal of Artificial Societies and Social Simulation, 11(4):12,2008. URL http://jasss.soc.surrey.ac.uk/11/4/12.html.
Ernst, A. Using spatially explicit marketing data to build social simulations.In Smajgl, A. and Barreteau, O., editors, Empirical Agent-Based Modelling -Challenges and Solutions, pages 85–103. Springer New York, January 2014.ISBN 978-1-4614-6133-3, 978-1-4614-6134-0. URL http://link.springer.com/
chapter/10.1007/978-1-4614-6134-0_5.
European Parliament, Council of the European Union. Directive 2012/27/EU ofthe European Parliament and of the Council of 25 October 2012 on energyefficiency, amending Directives 2009/125/EC and 2010/30/EU and repealingDirectives 2004/8/ec and 2006/32. Official Journal of the European Union, 315:1–56,2012. URL http://eur-lex.europa.eu/LexUriServ/LexUriServ.do?uri=OJ:
L:2012:315:0001:0056:EN:PDF.

BIBLIOGRAPHY 137
Eurostat. Final energy consumption in households - data sheet code: t2020_rk200.online, 2016. Accessed: 2016-04-28.
Ferro, E., Caroleo, B., Cantamessa, M., and Leo, M. Policy incentives for innovationdiffusion: an agent-based simulation. In Electronic Government and the InformationSystems Perspective, pages 166–173. Springer, 2010.
Festinger, L. A theory of cognitive dissonance, volume 2. Stanford University Press, 1962.
Festinger, L. A theory of social comparison processes. Human relations, 7(2):117–140,1954.
Frenken, K. History, state and prospects of evolutionary models of technical change:a review with special emphasis on complexity theory. The Netherlands: UtrechtUniversity., 2004. URL http://www.narcis.nl/publication/RecordID/oai:
library.tue.nl:656114.
Frenken, K. Technological innovation and complexity theory. Economics of Innovationand New Technology, 15(2):137–155, 2006.
Friege, J. and Chappin, E. J. L. Modelling decisions on energy-efficient renovations: Areview. Renewable and Sustainable Energy Reviews, 39:196–208, 2014.
Funk, S. and Jansen, V. A. A. Interacting epidemics on overlay networks. Physical ReviewE, 81(3):036118, March 2010. doi: 10.1103/PhysRevE.81.036118. URL http://link.
aps.org/doi/10.1103/PhysRevE.81.036118.
Galán, J. M., Izquierdo, L. R., Izquierdo, S. S., Santos, J. I., Del Olmo, R., López-Paredes, A.,and Edmonds, B. Errors and artefacts in agent-based modelling. Journal of ArtificialSocieties and Social Simulation, 12(1):1, 2009.
Galvin, R. Impediments to energy-efficient ventilation of German dwellings: a case studyin Aachen. Energy and Buildings, 56:32–40, 2013.
Garcia, R. and Jager, W. From the special issue editors: Agent-based modeling ofinnovation diffusion. Journal of Product Innovation Management, 28(2):148–151,2011.
Gärling, T. and Axhausen, K. W. Introduction: Habitual travel choice. Transportation, 30(1):1–11, 2003.
Geelen, L. M. J., Huijbregts, M. A. J., Ragas, A. M. J., Bretveld, R. W., Jans, H. W. A.,van Doorn, W. J., Evertz, S., and van der Zijden, A. Comparing the effectiveness ofinterventions to improve ventilation behavior in primary schools. Indoor Air, 18(5):416–424, 2008.
Geels, F. W. and Johnson, V. Adoption, upscaling, replication/circulation, and societalembedding: Four theoretical models of technology diffusion applied to biomassdistrict heating systems in Austria (1979-2013). In Proc. International SustainabilityConference (IST, Helsinki, Finland, 2015), 2015.

138 BIBLIOGRAPHY
Ghorbani, A., Bots, P., Dignum, V., and Dijkema, G. Maia: a framework for developingagent-based social simulations. Journal of Artificial Societies and Social Simulation,16(2):9, 2013. URL http://jasss.soc.surrey.ac.uk/16/2/9.html.
Gill, Z. M., Tierney, M. J., Pegg, I. M., and Allan, N. Measured energy and waterperformance of an aspiring low energy/carbon affordable housing site in the UK.Energy and Buildings, 43(1):117–125, 2011.
Göckeritz, S., Schultz, P. W., Rendón, T., Cialdini, R. B., Goldstein, N. J., and Griskevicius,V. Descriptive normative beliefs and conservation behavior: The moderating roles ofpersonal involvement and injunctive normative beliefs. European Journal of SocialPsychology, 40(3):514–523, April 2010. ISSN 1099-0992. doi: 10.1002/ejsp.643. URLhttp://onlinelibrary.wiley.com/doi/10.1002/ejsp.643/abstract.
Goldenberg, J., Libai, B., and Muller, E. The chilling effects of network externalities.International Journal of Research in Marketing, 27(1):4–15, 2010. ISSN 01678116. doi:10.1016/j.ijresmar.2009.06.006.
Google. Google trends help center, 2015. URL https://support.google.com/trends.accessed: 2015-4-15.
Granell, C., Gómez, S., and Arenas, A. Dynamical interplay between awareness andepidemic spreading in multiplex networks. Physical Review Letters, 111(12):128701,September 2013. doi: 10.1103/PhysRevLett.111.128701. URL http://link.aps.
org/doi/10.1103/PhysRevLett.111.128701.
Griffiths, M. and Eftekhari, M. Control of CO2 in a naturally ventilated classroom. Energyand Buildings, 40(4):556–560, 2008.
Grimm, V., Berger, U., DeAngelis, D. L., Polhill, J. G., Giske, J., and Railsback, S. F. TheODD protocol: A review and first update. Ecological Modelling, 221(23):2760–2768,2010. ISSN 03043800 (ISSN). doi: 10.1016/j.ecolmodel.2010.08.019.
Grimm, V. and Railsback, S. F. Individual-based modeling and ecology. PrincetonUniversity Press, 2013.
Grimm, V., Revilla, E., Berger, U., Jeltsch, F., Mooij, W. M., Railsback, S. F., Thulke, H.-H.,Weiner, J., Wiegand, T., and DeAngelis, D. L. Pattern-oriented modeling of agent-basedcomplex systems: lessons from ecology. Science, 310(5750):987–991, 2005.
Grinewitschus, V., Lovric, T., and Rumler, N. Influence of user behavior and homeautomation on energy consumption. In Proceedings of the 7th InternationalConference on Energy Efficiency in Domestic Appliances and Lighting (EEDAL13),Coimbra, Portugal, pages 11–13, 2013.
Grønhøj, A. and Thøgersen, J. Feedback on household electricity consumption: learningand social influence processes. International Journal of Consumer Studies, 35(2):138–145, 2011.

BIBLIOGRAPHY 139
Grossmann, K., Bierwirth, A., Bartke, S., Jensen, T., Kabisch, S., von Malottki, C., Mayer,I., and Rugamer, J. Energetic retrofit: considering socio-spatial structures of cities.GAIA-Ecological Perspectives for Science and Society, 23(4):309–313, 2014.
Guerra-Santin, O. and Itard, L. Occupants’ behaviour: determinants andeffects on residential heating consumption. Building Research & Information,38(3):318–338, 2010. URL http://www.tandfonline.com/doi/abs/10.1080/
09613211003661074.
Guerra Santin, O., Itard, L., and Visscher, H. The effect of occupancy and buildingcharacteristics on energy use for space and water heating in Dutch residential stock.Energy and Buildings, 41(11):1223–1232, 2009.
Han, Q., Nieuwenhijsen, I., de Vries, B., Blokhuis, E., and Schaefer, W. Interventionstrategy to stimulate energy-saving behavior of local residents. Energy Policy, 52:706–715, 2013.
Hansmeier, N. and Matthies, E. Energiebewusste RUB – Richtig Heizen undLüften. Ergebnisse einer umweltpsychologischen Intervention zur Förderungenergieeffizienten Verhaltens an der Ruhr-Universität Bochum. URL http:
//www.change-energie.de/projekt/download/EnergiebewussteRUB%20_
Projektbericht.pdf. Project Report, Ruhr-University Bochum, Faculty forPsychology., 2007.
Hochman Consultants LLC. The cost of pay-per-click (PPC) advertising –trends and analysis, 2016. URL https://www.hochmanconsultants.com/
cost-of-ppc-advertising/. Accessed: 2016-09-13.
Holstein, B. and Straus, F. Qualitative Netzwerkanalyse. Konzepte, Methoden,Anwendungen. Wiesbaden: Verlag für Sozialwissenschaften, 2006.
Holzhauer, S. Dynamic Social Networks in Agent-based Modelling - Increasingly DetailedApproaches of Network Initialisation and Network Dynamics. PhD thesis, UniversityKassel, 2015. Unpublished.
Holzhauer, S., Krebs, F., and Ernst, A. Considering baseline homophily when generatingspatial social networks for agent-based modelling. Computational and MathematicalOrganization Theory, 19(2):128–150, June 2013. ISSN 1381-298X, 1572-9346. doi: 10.1007/s10588-012-9145-7. URL http://link.springer.com/article/10.1007/
s10588-012-9145-7.
Institut für Energie-und Umweltforschung Heidelberg GmbH. Gutachten zurÜbertragung des Hamburger Fifty-Fifty-Modells auf ALG II- und Sozialhilfe-Bezieher,2009.
IPCC. Climate change 2007: synthesis report. Adopted by Session at IPCC Plenary XXVII,2007.
Itard, L. and Meijer, F. Towards a Sustainable Northern European Housing Stock: Figures,Facts, and Future, volume 22. Ios Press, 2008.
140 BIBLIOGRAPHY
Jackson, T. Motivating sustainable consumption: a review of evidence on consumerbehaviour and behavioural change: a report to the Sustainable Development ResearchNetwork. Centre for Environmental Strategy, University of Surrey, 2005.
Jager, W. Breaking ‘bad habits’: a dynamical perspective on habit formation andchange. In Hendrickx, L., Jager, W., and Steg, L., editors, Human Decision Making andEnvironmental Perception. Understanding and Assisting Human Decision Making inReal-life Settings. University of Groningen, 2003. URL http://www.rug.nl/staff/
w.jager/jager_habits_chapter_2003.pdf.
Jager, W. and Janssen, M. An updated conceptual framework for integrated modeling ofhuman decision making: The Consumat II. In Paper for Workshop Complexity in theReal World@ ECCS, pages 1–18, 2012. URL http://www.rug.nl/staff/w.jager/
jager_janssen_eccs_2012.pdf.
Jain, R. K., Gulbinas, R., Taylor, J. E., and Culligan, P. J. Can social influence drive energysavings? Detecting the impact of social influence on the energy consumption behaviorof networked users exposed to normative eco-feedback. Energy and Buildings, 66:119–127, November 2013. ISSN 0378-7788. doi: 10.1016/j.enbuild.2013.06.029. URLhttp://www.sciencedirect.com/science/article/pii/S0378778813003782.
Jain, R. K. Building Eco-Informatics: Examining the Dynamics of Eco-Feedback Designand Peer Networks to Achieve Sustainable Reductions in Energy Consumption. PhDthesis, Columbia University, 2013. URL http://academiccommons.columbia.edu/
catalog/ac:165189.
Janssen, M. and Jager, W. An integrated approach to simulating behavioural processes:A case study of the lock-in of consumption patterns. Journal of Artificial Societies andSocial Simulation, 2(2):21–35, 1999. URL http://jasss.soc.surrey.ac.uk/2/2/
2.html.
Janssen, M. A. and Jager, W. Stimulating diffusion of green products. Journal ofEvolutionary Economics, 12(3):283–306, 2002. URL http://link.springer.com/
article/10.1007/s00191-002-0120-1.
Jensen, T. and Chappin, E. J. L. Reducing domestic heating demand: managingthe impact of behavior-changing feedback devices via marketing. EnvironmentalManagement, 2016. Under review.
Jensen, T., Holtz, G., Baedeker, C., and Chappin, E. Energy-efficiency impacts ofan air-quality feedback device in residential buildings: an agent-based modelingassessment. Energy and Buildings, 116:105–119, 2016.
Jensen, T. and Chappin, E. J. L. Towards an agent-based model on co-diffusion oftechnology and behavior: a review. In 28th European Conference on Modeling andSimulation 2014, Brescia, pages 782–788, May 2014.
Jensen, T., Holtz, G., and Chappin, E. J. L. Agent-based assessment framework forbehavior-changing feedback devices: spreading of devices and heating behavior.

BIBLIOGRAPHY 141
Technological Forecasting and Social Change, 98:105–119, September 2015. doi:10.1016/j.techfore.2015.06.006.
Karlin, B., Ford, R., and Squiers, C. Energy feedback technology: a review and taxonomyof products and platforms. Energy Efficiency, 7(3):377–399, June 2014. ISSN 1570-646X,1570-6478. doi: 10.1007/s12053-013-9227-5. URL http://rd.springer.com/
article/10.1007/s12053-013-9227-5?no-access=true.
Karlin, B., Zinger, J. F., and Ford, R. The effects of feedback on energy conservation: Ameta-analysis. Psychological bulletin, 141(6):1205, 2015.
Kelly, K. What technology wants. Penguin, 2010.
Kiesling, E., Günther, M., Stummer, C., and Wakolbinger, L. An agent-based simulationmodel for the market diffusion of a second generation biofuel. In Proceedings - WinterSimulation Conference, pages 1474–1481, 2009. ISBN 978-142445770-0. doi: 10.1109/WSC.2009.5429299.
Kiesling, E., Günther, M., Stummer, C., and Wakolbinger, L. M. Agent-based simulationof innovation diffusion: a review. Central European Journal of Operations Research, 20(2):183–230, 2012.
Kroh, J., Ernst, A., Welzer, H., Briegel, R., David, M., Kuhn, S., Piñánez, A. M., Schönborn,S., and Gellrich, A. Überregionale Potentiale lokaler Innovationsimpulse. ZurDiffusion sozio-technischer Innovationen im Bereich Erneuerbare Energien, volume 6.Kassel University Press GmbH, 2012. URL http://books.google.de/books?
hl=en&lr=&id=CXO_liUYZT0C&oi=fnd&pg=PP1&dq=Potentiale+lokaler+
innovationsimpulse&ots=ioxzgroTcv&sig=ZrEiDuY1SKi4sMZWUCfLwyU_ehw.
Landesbetrieb Information und Technik Nordrhein-Westfalen (IT.NRW). Datasheet’Privathaushalte nach Haushaltsgrößen - Muenster, Regierungsbezirk’, 2014.Accessed: 2014-11-07.
Laschke, M., Hassenzahl, M., and Diefenbach, S. Things with attitude:Transformational Products. In Create11 Conference, page 1–2, 2011. URLhttp://create10.squarespace.com/storage/create11papersposters/
Things%20with%20attitude.pdf.
Leek, J. T. and Peng, R. D. What is the question? Science, 347(6228):1314–1315, 2015.
Lewin, K. Group decision and social change. Readings in Social Psychology, 3:197–211,1947.
Liedtke, C., Hasselkuß, M., Welfens, M. J., Nordmann, J., and Baedeker, C.Transformation towards sustainable consumption: Changing consumption patternsthrough meaning in social practices. In 4th International Conference on SustainabilityTransitions, pages 702–729, ETH Zurich, Switzerland, June 2013.

142 BIBLIOGRAPHY
Liedtke, C., Baedeker, C., Hasselkuß, M., Rohn, H., and Grinewitschus, V. User-integratedinnovation in Sustainable LivingLabs: an experimental infrastructure for researchingand developing sustainable product service systems. Journal of Cleaner Production,97:106–116, 2015. ISSN 0959-6526. doi: 10.1016/j.jclepro.2014.04.070. URL http:
//www.sciencedirect.com/science/article/pii/S0959652614004338.
Loock, C.-M., Staake, T., and Thiesse, F. Motivating energy-efficient behavior with greenis: An investigation of goal setting and the role of defaults. Mis Quarterly, 37(4):1313–1332, 2013.
Lopes, M., Antunes, C., and Martins, N. Energy behaviours as promoters of energyefficiency: A 21st century review. Renewable and Sustainable Energy Reviews, 16(6):4095–4104, 2012.
Lovric, T. Unpublished results from living lab experiments in the SusLab project(www.suslab.eu), conducted by the ‘University of Applied Sciences Ruhr West’, April2015.
Macal, C. M. and North, M. J. Tutorial on agent-based modelling and simulation. Journalof Simulation, 4(3):151–162, 2010.
McCarthy, E. J. Basic Marketing, volume 8. McGraw-Hill Education, 1996.
McDonnell, A. Barriers and Enablers to Energy Efficient Retrofitting of Dwellings inIreland Masters thesis. PhD thesis, Waterford Institute of Technology, January 2010.
Mohammadi, N., Wang, Q., and Taylo, J. E. Exploring the potential influence of OpinionLeaders in diffusion of energy conservation practices. In Tolk, A., Diallo, S. Y., Ryzhov,I. O., Yilmaz, L., Buckley, S., and Miller, J. A., editors, Proceedings of the 2014 WinterSimulation Conference, 2014.
Nisbet, M. C. and Kotcher, J. E. A two-step flow of influence? Opinion-leader campaignson climate change. Science Communication, 2009.
Nolan, J. M., Schultz, P. W., Cialdini, R. B., Goldstein, N. J., and Griskevicius, V. Normativesocial influence is underdetected. Personality and Social Psychology Bulletin, 34(7):913–923, January 2008. ISSN 0146-1672, 1552-7433. doi: 10.1177/0146167208316691.URL http://psp.sagepub.com/content/34/7/913.
North, M. J., Collier, N. T., Ozik, J., Tatara, E. R., Macal, C. M., Bragen, M., and Sydelko,P. Complex adaptive systems modeling with Repast Simphony. Complex adaptivesystems modeling, 1(1):1–26, 2013.
Olivier, J. G., Janssens-Maenhout, G., Marilena, M., and Peters, J. A. Trends in global CO2
emissions: 2015 report, 2015. URL http://edgar.jrc.ec.europa.eu/news_docs/
jrc-2015-trends-in-global-co2-emissions-2015-report-98184.pdf.
Oxford University Press. Policy, 2016. URL http://www.oxforddictionaries.com/
definition/english/policy. Accessed: 2016-04-22.

BIBLIOGRAPHY 143
Padonou, E., Villot, J., et al. Estimation of energy savings through a kriging metamodel.ENBIS-13 Summary Session Reports, 2013., 2013.
Pentland, A. Social physics. How good ideas spread - the lessons from a new science.Penguin Books Ltd, 2014.
Pérez-Lombard, L., Ortiz, J., and Pout, C. A review on buildings energy consumptioninformation. Energy and buildings, 40(3):394–398, 2008.
Peschiera, G., Taylor, J. E., and Siegel, J. A. Response-relapse patterns of buildingoccupant electricity consumption following exposure to personal, contextualized andoccupant peer network utilization data. Energy and Buildings, 42(8):1329–1336,August 2010. ISSN 0378-7788. doi: 10.1016/j.enbuild.2010.03.001. URL http://www.
sciencedirect.com/science/article/pii/S0378778810000691.
Piacentini, J., Woods, D. W., Scahill, L., Wilhelm, S., Peterson, A. L., Chang, S., Ginsburg,G. S., Deckersbach, T., Dziura, J., and Levi-Pearl, S. Behavior therapy for children withtourette disorder: a randomized controlled trial. Jama, 303(19):1929–1937, 2010. URLhttp://archinte.jamanetwork.com/article.aspx?articleid=185896.
Prell, C. Social network analysis: History, theory and methodology. Sage, 2011.
Provost, F. and Fawcett, T. Data Science for Business: What you need to know about datamining and data-analytic thinking. " O’Reilly Media, Inc.", 2013.
Railsback, S. F. and Grimm, V. Agent-Based and Individual-Based Modeling: A PracticalIntroduction. Princeton University Press, October 2011. ISBN 1400840651.
Rand, W. and Rust, R. Agent-based modeling in marketing: Guidelines for rigor.International Journal of Research in Marketing, 28(3):181–193, 2011. ISSN 01678116.doi: 10.1016/j.ijresmar.2011.04.002.
Rixen, M. and Weigand, J. Agent-based simulation of policy induced diffusion of smartmeters. Technological Forecasting and Social Change, 85:153–167, 2014.
Rogers, E. M. Diffusion of Innovations. Simon and Schuster, 2010.
Rogers, E. M. Diffusion of Innovation. Free Press, New York, 5 edition, 2003.
Roozenburg, N. F. M. and Eekels, J. Product Design: Fundamentals and Methods. JohnWiles & Sons, 1995.
Santamouris, M., Synnefa, A., Asssimakopoulos, M., Livada, I., Pavlou, K., Papaglastra,M., Gaitani, N., Kolokotsa, D., and Assimakopoulos, V. Experimental investigation ofthe air flow and indoor carbon dioxide concentration in classrooms with intermittentnatural ventilation. Energy and Buildings, 40(10):1833–1843, 2008.
Schreinemachers, P., Berger, T., and Aune, J. B. Simulating soil fertility and povertydynamics in Uganda: A bio-economic multi-agent systems approach. EcologicalEconomics, 64(2):387–401, 2007.

144 BIBLIOGRAPHY
Schwarz, N. and Ernst, A. Agent-based modeling of the diffusion of environmentalinnovations - an empirical approach. Technological Forecasting and Social Change,76(4):497–511, 2009. ISSN 00401625. doi: 10.1016/j.techfore.2008.03.024.
Schwarz, N. Umweltinnovationen und Lebensstile: eine raumbezogene, empirischfundierte Multi-Agenten-Simulation. PhD thesis, Metropolis-Verl., Marburg, 2007.
Shipworth, M., Firth, S. K., Gentry, M. I., Wright, A. J., Shipworth, D. T., and Lomas,K. J. Central heating thermostat settings and timing: building demographics. BuildingResearch & Information, 38(1):50–69, 2010.
Sinus Sociovision. Sinus-Milieus, 2015. URL http://www.sinus-sociovision.de/
en/.
Sonnessa, M. Modelling and simulation of complex systems. PhD thesis, University ofTorino, Italy, 2004.
Sopha, B. M., Klöckner, C. A., and Hertwich, E. G. Exploring policy options for a transitionto sustainable heating system diffusion using an agent-based simulation. EnergyPolicy, 39(5):2722–2729, May 2011. ISSN 03014215. doi: 10.1016/j.enpol.2011.02.041.URL http://linkinghub.elsevier.com/retrieve/pii/S0301421511001315.
Sopha, B. M., Klöckner, C. A., and Hertwich, E. G. Adoption and diffusion ofheating systems in Norway: Coupling agent-based modeling with empirical research.Environmental Innovation and Societal Transitions, 8:42–61, September 2013. ISSN2210-4224. doi: 10.1016/j.eist.2013.06.001. URL http://www.sciencedirect.com/
science/article/pii/S2210422413000427.
Stern, N. Economics: Current climate models are grossly misleading. Nature, 530(7591):407, 2016.
Stonedahl, F. and Wilensky, U. BehaviorSearch, 2016. URL http://behaviorsearch.
org. Accessed: 2016-04-21.
Strasak, A. M., Zaman, Q., Pfeiffer, K. P., Gobel, G., and Ulmer, H. Statistical errors inmedical research-a review of common pitfalls. Swiss medical weekly, 137(3/4):44,2007.
Stromback, J., Dromacque, C., and Yassin, M. H. The potential of smart meterenabled programs to increase energy and systems efficiency: a mass pilot comparison,2011. URL http://esmig.eu/sites/default/files/2011.10.12_empower_
demand_report_final.pdf.
Thaler, R. H. and Sunstein, C. R. Nudge: Improving decisions about health, wealth andhappiness. Penguin Books Ltd, 2009.
Thiele, J. C. and Grimm, V. Replicating and breaking models: good for you and good forecology. Oikos, 2015.

BIBLIOGRAPHY 145
Tisue, S. and Wilensky, U. Netlogo: A simple environment for modeling complexity. InInternational Conference on Complex Systems, pages 16–21, 2004.
Tukker, A., Cohen, M. J., Hubacek, K., and Mont, O. The impacts of householdconsumption and options for change. Journal of Industrial Ecology, 14(1):13–30, 2010.
van Dam, K. H., Nikolic, I., and Lukszo, Z. Agent-Based Modelling of Socio-TechnicalSystems. Springer, Guildford and UK, 2012.
Van Eck, P., Jager, W., and Leeflang, P. Opinion Leaders’ role in innovation diffusion: Asimulation study. Journal of Product Innovation Management, 28(2):187–203, 2011.ISSN 07376782. doi: 10.1111/j.1540-5885.2011.00791.x.
Verplanken, B. and Wood, W. Interventions to break and create consumer habits. Journalof Public Policy & Marketing, 25(1):90–103, 2006. URL http://journals.ama.org/
doi/abs/10.1509/jppm.25.1.90.
Watts, C. and Gilbert, N. Simulating Innovation: Computer-based Tools for RethinkingInnovation. Edward Elgar Publishing, 2014.
Watts, D. J. and Strogatz, S. H. Collective dynamics of ‘small-world’ networks. Nature,393(6684):440–442, 1998.
Wiegand, T., Jeltsch, F., Hanski, I., and Grimm, V. Using pattern-oriented modeling forrevealing hidden information: a key for reconciling ecological theory and application.Oikos, 100(2):209–222, 2003.
Wilhite, H., Nakagami, H., Masuda, T., Yamaga, Y., and Haneda, H. A cross-culturalanalysis of household energy use behaviour in Japan and Norway. Energy Policy, 24(9):795–803, 1996.
Windrum, P., Moneta, A., and Fagiolo, G. Empirical validation of agent-based models:Alternatives and prospects, March 2007. URL http://jasss.soc.surrey.ac.uk/
10/2/8.html.
Wood, G. and Newborough, M. Dynamic energy-consumption indicators for domesticappliances: environment, behaviour and design. Energy and Buildings, 35(8):821–841,September 2003. ISSN 03787788. doi: 10.1016/S0378-7788(02)00241-4. URL http:
//linkinghub.elsevier.com/retrieve/pii/S0378778802002414.
Zhang, H., Vorobeychik, Y., Letchford, J., and Lakkaraju, K. Data-driven agent-basedmodeling, with application to rooftop solar adoption. In Proceedings of the 2015International Conference on Autonomous Agents and Multiagent Systems, pages513–521. International Foundation for Autonomous Agents and Multiagent Systems,2015.
Zhang, T., Siebers, P.-O., and Aickelin, U. Modelling electricity consumption in officebuildings: An agent based approach. Energy and Buildings, 43(10):2882–2892, 2011.ISSN 03787788. doi: 10.1016/j.enbuild.2011.07.007.

146 BIBLIOGRAPHY
Zhang, T. and Nuttall, W. J. Evaluating government’s policies on promoting smartmetering diffusion in retail electricity markets via agent-based simulation. Journalof Product Innovation Management, 28(2):169–186, 2011. ISSN 1540-5885. doi:10.1111/j.1540-5885.2011.00790.x.
Zhang, T. and Nuttall, W. J. An agent-based simulation of Smart Metering technologyadoption. International Journal of Agent Technologies and Systems, 4(1):17–38, 2012.ISSN 1943-0744, 1943-0752. doi: 10.4018/jats.2012010102. URL http://www.
igi-global.com/article/content/66067.

CURRICULUM VITÆ
Thorben Jensen was born on September 1, 1987 in Langenhagen, Germany. Aftercompleting high school education at Gymnasium Langenhagen in 2007, he enrolledat Osnabrück University (Germany) for the Bachelor of Science program AppliedSystems Science, with the minor subjects of computer science, mathematics, geography,and geomatics. During his studies, he spent a semester studying mathematics atthe University of Granada (Spain). He graduated from his B.Sc. program in 2011.His Bachelor’s thesis focused on simulating the transport and fate of medicinalcompounds in the environment. He continued his studies with the Master of Scienceprogram Environmental Systems and Resource Management, with the minor subjectsof computer science and geomatics. During the M.Sc. program he took part in courseson simulation modeling and resource management at the ‘Institute for life, food andhorticultural sciences and landscaping’ in Angers (France) and at the University Centerin Svalbard (Spitsbergen). Additionally, he assisted at teaching several classes atOsnabrück University and became a research assistant at the Helmholtz Centers forEnvironmental Research and for Polar and Marine research. In 2013, he graduated fromhis M.Sc. program. In his graduation project, he simulated the storage of CO2 in theArctic Ocean under a changing climate.
In the year 2013, he became a PhD candidate in the section Energy and Industry atthe Faculty of Technology, Policy and Management, at Delft University of Technology.In the same year, he took up a position as a Research Fellow at Wuppertal Institutefor Climate, Environment, and Energy (Germany) and was a guest lecturer on dataanalysis at University of Angers (France). In his PhD project, he drew on his interestin computer science. In his daily work, he enjoyed automating routine tasks, whicheventually led him to his contribution of automating major parts of model generationand policy assessment for innovation diffusion models.
During his PhD he made use of many traveling opportunities. In 2015, a scholarshipsponsored by the foundations Robert Bosch and Mercator allowed him to be a visitingresearcher at the Chinese ‘Green Development Low-carbon Think Tank Partnership’. Hepresented at several conferences—in China, the US, and Europe. In France, his workon automated model generation was awarded with the ‘Best Student Paper Prize’ by theInternational Environmental Modeling and Software Society.
At the time of writing, he continues to explore data driven modeling as a DataScientist at EY (Ernst & Young).
This CV was last updated on February 22, 2017.
147


PUBLICATIONS BY AUTHOR
1. Jensen, T. and Chappin, E. J. L. Towards an agent-based model on co-diffusion of technologyand behavior: a review, proceedings of the 28th European Conference on Modelling andSimulation, Brescia, Italy, 782–788, 2014.
2. Großmann, K., Bierwirth, A., Bartke, S., Jensen, T., Kabisch, S., Malottki, C. v., Mayer, I., andRügamer, J., Energetic retrofit: considering socio-spatial structures of cities, GAIA-EcologicalPerspectives for Science and Society 23 (4), 309-312 (2014).
3. Jensen, T., Holtz, G., and Chappin E. J. L. Agent-based assessment frameworkfor behavior-changing feedback devices: Spreading of devices and heating behavior,Technological Forecasting and Social Change 98, 105–119, 2015.
4. Holtz, G., Jensen, T., and Chappin, E. J. L. Modelling the diffusion and effect of behaviorchanging feedback devices, proceedings of the 2015 Annual Conference of the EU-SPRIForum, 2015.
5. Jensen, T., Holtz, G., Baedeker, C., and Chappin, E. J. L. Energy-efficiency impacts of anair-quality feedback device in residential buildings: an agent-based modeling assessment,Energy and Buildings 116, 151–163, 2016.1
6. Jensen, T. and Chappin, E. J. L. Agent-based modeling automated: data-driven generationof innovation diffusion models, proceedings of the 8th International Congress onEnvironmental Modelling and Software, Toulouse, France, 2016.2
7. Jensen, T. Agent-based modeling 2.0: automated generation of innovation diffusion models,poster presented at the 5th International Engineering Systems Symposium, Washington,D.C., USA, 2016.
8. Jensen, T. Reducing domestic heating demand: managing the impact of behavior-changingfeedback devices via marketing, Environmental Management, under review, 2016.
9. Jensen, T., Holtz, G., and Chappin, E. J. L. Automated model structure variation and policyrobustness testing: a procedure for innovation diffusion models, proceedings of the SocialSimulation Conference, Rome, Italy, 2016.
10. Jensen, T. and Chappin, E. J. L. Automating agent-based modeling: data-driven generationand application of innovation diffusion models, Environmental Modeling and Software, inpress, 2017.
1This contribution has been selected as one of the ten most important scientific publications of the WuppertalInstitute in 2016.
2This contribution has been awarded with the ‘Best Student Paper Prize’ by the International EnvironmentalModeling and Software Society.
149