Embed Size (px)
Citation preview

1
Deliberative Polling® for Summit Public Schools
Voting Rights and Being Informed
REPORT1
1 This report was prepared by the students of COMM138/CSRE38 held Winter 2016. The class and the Deliberative Polling event was a collaborative effort between the Haas Center for Public Service and the Center for Deliberative Democracy at Stanford University. The students of COMM138/CSRE38 include (in alphabetical order) Daniel Allen, Ali Baqeri, Michael Ramadan, Gina Wei and Brandon Williams.

2
Table of Contents
Executive Summary ............................................................................................................................... 3 What is a Deliberative Poll? ............................................................................................................................ 3 Why a Deliberative Poll? ................................................................................................................................. 3 The Participants ................................................................................................................................................ 4 Methodology ....................................................................................................................................................... 4 Opinion Changes ............................................................................................................................................... 4 Qualitative Analysis .......................................................................................................................................... 4
Changes in Opinions: Voting ............................................................................................................... 5 Overall Results ................................................................................................................................................... 5 By School (in alphabetical order) .................................................................................................................. 7
Everest Public High School ........................................................................................................................................... 7 Summit High School ........................................................................................................................................................ 8 Tahoma High School ........................................................................................................................................................ 9 Rainier High School ...................................................................................................................................................... 10
Changes in Opinion: Being Informed .............................................................................................. 27 Overall Results ................................................................................................................................................ 27 By School (in alphabetical order) ............................................................................................................... 27
Summit High School ..................................................................................................................................................... 27 Everest High School ...................................................................................................................................................... 28 Tahoma High School ..................................................................................................................................................... 28 Rainier High School ...................................................................................................................................................... 29
Changes in Knowledge ........................................................................................................................ 38
Representativeness ............................................................................................................................... 44 Qualitative Transcript Analysis ........................................................................................................ 47
Appendix ................................................................................................................................................ 54 A: Voting .......................................................................................................................................................... 54

3
Executive Summary For the first time, over 200 California public high school seniors from the Bay Area participated in a Deliberative Poll on the issues of voting rights and the value of being informed about politics and public policy. Over the course of one school day, students deliberated with one another on the Stanford University campus and had the opportunity to hear from leading experts in the field.
This Deliberative Polling event was prepared, conducted, and results were analyzed by Stanford undergraduates enrolled in Communication 138: Applying Deliberative Democracy, which was a course sponsored by the HAAS Center for Public Service and Center of Deliberative Democracy. This course aims not only to serve as a learning experience for the Stanford undergraduate students, but also to test the feasibility of high school students participating in a Deliberative Poll and to assess the results of the event. In this report, we draw on the quantitative data from questionnaire results before and after deliberation. We also make use of qualitative data from the recordings of the small group and plenary sessions. This report serves to summarize the results of the event as a whole.
What is a Deliberative Poll? Deliberative Polling is an attempt to use public opinion research in a new and constructive way. A random, representative sample is first polled on the targeted issues. In this poll, our participants are high school seniors from four Summit Public High Schools in the Bay Area. A baseline poll is given to the participants, after which they are invited to gather at the same place to deliberate for typically a weekend, but in this case one school day. Carefully balanced briefing materials are sent to the participants and are also made publicly available. During the event, the participants engage in small group deliberations with trained moderators. After small group deliberations, the participants engage in dialogue with competing experts and political leaders based on questions participants developed in small group discussions. After the deliberations, the participants complete a post deliberation questionnaire. The resulting changes in opinion represent the conclusions the public would reach, if people had the opportunity to become more informed and more engaged by the issues.
Why a Deliberative Poll? Ordinary polls provide a snapshot of the public’s impressions of sound bites and headlines. Most citizens most of the time are not well informed about complex public issues. Deliberative Polling addresses the question: what would a scientific sample of the public think about policy issues if it could be engaged in good conditions to think about them? Those good conditions include balanced briefing materials, small group discussions with trained moderators, questions proposed by in small groups to panels of competing experts in plenary sessions and an opportunity to register individual opinions in confidential questionnaires both before and after this process of deliberation. As this report will detail, there were some substantial changes in opinions after deliberation in this project.

4
The Participants High school seniors from four Summit Public Schools in Redwood City and San Jose participated in the Deliberative Poll – Everest and Summit from Redwood City and Rainer and Tahoma from San Jose. All the high school seniors were invited to take part in this event, therefore no method of sampling was employed. The high school students were all enrolled in a government/civics course during the time of the event, and participation in the Deliberative Poll complemented the curriculum of the students. The Summit Public School system is a charter school system where students enter into a lottery to attend the school. Although the student or student’s family must enter the lottery (which is free), students are chosen solely through a lottery system and not by merit, socio-economic status, or any other metric. Consequently, we are confident that the sample of students is a fairly accurate representation of youth from Redwood City and San Jose.
Methodology Typically, Deliberative Polls are conducted over an entire weekend; however, due to logistical concerns associated with high school students, this Deliberative Poll was completed in a single school day. To account for this condensed process, students were given a presentation about the method and the discussion topics prior to the day of the event. This presentation was presented after the administering of the pre-deliberation survey. The presentation was approximately 30 minutes and introduced the concepts present in the briefing materials and the practice of Deliberative Polling. A copy of the presentation is available upon request.
Opinion Changes Participants in this Deliberative Poll experienced substantial opinion changes. On both topics, voting rights and being informed, there were significant changes in opinions and substantial knowledge gained by the high school students. In particular, students’ opinions on online voting changed the most. Prior to deliberation, 76% of people agreed that online voting should be implemented. After deliberation, this number dropped to 52%. Further, there was a large amount of no opinion reported on the pre-survey for the following proposals: Election Day Registration, DACA, and Voter ID laws. It also appears that the high school students did not know as much about these particular proposals. That is, when asked whether the government should allow individuals who receive Deferred Action for Childhood Arrivals (DACA), 12.4% of students responded with no opinion; however, after deliberation, only 1.96% of students responded that way.
Qualitative Analysis With permission from the high school students, the event’s small group discussion and plenary sessions were recorded. Transcripts from the event are not yet available, however, the research team listened to recordings for qualitative analysis. These recordings have assisted with determining and pinpointing the influence of the Summit Deliberative Poll on students’ opinions. There were three main findings from the small group discussions: 1. Students considered opposing viewpoints and used these viewpoints to complicate their current stances on policy proposals.

5
2. Students drew from their personal experiences to envision the possible impacts of policy proposals. 3. Students grappled with questions separate from the policy proposals that helped them better understand the underlying problems that proposals aimed to solve.
Changes in Opinions: Voting2
Overall Results In relation to voting, the participants in the Deliberative Poll answered three questions on what was important or not important for being a good citizen. Of these questions, two questions had strong support pre and post deliberation voting in elections and being informed about politics and political issues. Both questions remained at an average of about 8 on a 0-to-10 point scale, where 0 is completely unimportant and 10 is completely important. The question with statistically significant change was regarding discussing politics and political issues with others. Participants increased their support for this question from 6.7 to 7.3. In reviewing the percentage breakdown pre and post deliberation, the results show a slight decrease on the 0 to 4 end of the scale from 14.7 to 13.8 percent, but the most movement was from the middle category, 5, where participants decreased from 19.3 to 11.2 percent. It appears that more participants moved from the middle category to the 6 to 10 end of the scale to show more support for this question. During the event, the students discussed several proposals regarding voting. Overall, participants favored the majority of the proposals both before and after deliberation. But, one proposal dropped dramatically post deliberation – allowing individuals to vote online. Before deliberation, this proposal had an average mean of 3.2 out of a 5-point scale. After deliberation, the proposal dropped to 2.6 and the decrease was statistically significant at 0.000 level. In examining the percentage breakdown, the results show that 45.3 percent of participants favored the proposal before deliberation and after, 47.4 percent opposed the proposal. In addition, before deliberation 18.9 percent were in the middle category of neither favor nor oppose and after deliberation, 29.6 percent were in the middle category. It appears that not only did more participants come to oppose this proposal after deliberation, but also more participants took the position of neither favor or oppose this proposal. Aside from the proposal regarding online voting, three other proposals changed statistically significantly. The first question is allowing felons to vote after they have served their sentences. Support for this proposal increased support from 3.56 to 4.11, significant change at 0.000 level. The second proposal is fining people who don’t vote. Participants seemed to strongly oppose this proposal before deliberation at 1.83 and after deliberation, participants still opposed the proposal, but were less in opposition, at 2.31, significant at 0.000 level. The third proposal is bringing voting stations to workplaces. This proposal received support from participants, but there was less support after deliberation, from 3.83 to 3.47, significant at 0.000 level. The fourth proposal is allowing individuals who receive Deferred Action for Childhood Arrivals (DACA) to vote. This proposal received strong support after deliberation, from 3.92 to 4.29, significant at 0.008 level.
2 Full results table available in appendix A.

6
Four proposals maintained about the same support from participants before and after deliberation were making election day a national holiday (before 4.06 and after 4.03), allowing election day registration (4.03 and 4.12), allowing legal residents who are not citizen to vote national elections (3.84 and 4.07), and abolishing voter ID laws (3.26 and 3.69). In examining the post deliberation mean for these nine proposals, the top three proposals post deliberation were allowing individuals who receive Deferred Action for Childhood Arrivals (DACA) to vote (4.29), allowing Election Day registration (4.12) and allowing felons to vote after they have served their sentences (4.11). Before the deliberation, the top 3 proposals were making Election Day a national holiday (4.06), allowing Election Day registration (4.03) and allowing individuals who receive Deferred Action for Childhood Arrivals (DACA) to vote (4.29). It appears that allowing Election Day registration and Deferred Action for Childhood Arrivals (DACA) to vote remained strongly supported before and after deliberation. Prior to deliberation, allowing felons to vote after they have served their sentences was ranked sixth out of the nine proposals. After indicating support or opposition for the proposals, participants were asked how effective each of these proposals would be for increasing voter participation. Out of the nine proposals, seven proposals had statistically significant changes. The majority of the changes were in the direction of more effective after deliberation, however, three proposals showed opposite results. The first proposal is allowing individuals to vote online. Since opposition for this proposal increased dramatically after deliberation, it make sense for participants to also feel that this proposal would not be effective in increasing voter participation. Support for this proposal decreased from 76 to 52 percent. The other proposals that experienced decreases were fining people who don’t vote and bringing voting stations to workplaces. Both proposals decreased significantly at the 0.000 level. The average mean post deliberation for fining people who don’t vote was 5.55 and for bringing voting stations to workplaces was 6.47. The four proposals participants felt would be most effective in increasing voter participation were: allowing felons to vote after they have served their sentences, allowing legal residents who are not citizens to vote in national elections, allowing individuals who receive Deferred Action for Childhood Arrivals (DACA) to vote, and abolishing voter ID laws. The participants were also asked several empirical premise questions relating to the proposals. Empirical premise questions are generally statements that make claim to something that is true or false. Some people based on their own experiences or previous knowledge they are aware of come to agree with certain claims, while others having different experiences may read the same statement and come to disagree with the same claims. There were six statements and participants were asked, on a 1 to 5 scale, whether they agreed or disagreed with the statements: The U.S. celebrates too many national holidays, Felons have shown they are incapable of being responsible citizens, Electronically recorded votes would not be as reliable as paper ballots, Only individuals with U.S. citizenship should be allowed to vote, Voter ID laws are necessary to address widespread voter fraud and Forcing people to vote is contradictory to personal liberty. Two of the six statements changed statistically significantly at 0.000 level; the statements were: Only individuals with U.S. citizenship should be allowed to vote and Forcing people to vote is contradictory to personal liberty. For both statements, participants increased their disagreement

7
to the statements. Prior to deliberation, participants disagreed with the statement only individuals with U.S. citizenship should be allowed to vote, mean 2.50. And, after deliberation, participants increased their disagreement and moved to 2.21. Before deliberation, participants agreed with the statement that forcing people to vote is contradictory to personal liberty, mean of 3.94. However, after deliberation, the mean decreased to 3.59. Participants had mixed feelings about the statements that did not show much movement. On whether the US has too many national holidays, participants disagreed with this statement before and after deliberation. On the statement regarding felons, participants also disagreed that felons were incapable of being responsible citizens. Participants increased their agreement slightly in regards to whether electronically recorded votes would be as reliable as paper ballots. And, participants disagreed that Voter ID laws are necessary to address widespread voter fraud. These empirical premise statements can be used as explanatory variables for further quantitative data analyses to explore whether peoples’ beliefs in certain claims impact peoples’ opinions towards the proposals discussed.
By School (in alphabetical order)
Everest Public High School Like the overall sample, the biggest changes in opinion were among two proposals: allowing individuals to vote online and bringing voting stations to workplaces. Prior to deliberation, 28 percent of participants from Everest opposed the proposal for online voting and 50 percent supported the proposal. After deliberations, 44 percent of participants opposed the proposal, and support for the proposal dropped by half, to 25 percent. Interestingly, the middle category of neither support or oppose, increased from 19 percent to 31 percent. The don’t know category for this proposal also dropped from 2.8 percent to 0 percent. From this proposal, it appears that many participants changed their view from support to oppose, but, at the same, a substantial number also came to the middle category. That is, after learning more about the proposal, they decided to either support or oppose the proposal. The second proposal regarding voting stations at workplaces, experienced similar change for the middle category. Prior to deliberations, 56 percent of participants supported the proposal and 22 percent were in the middle category. After deliberations, the percentage for the middle category increased to 42 percent and whereas, support for the proposal dropped to 39 percent. The don’t know category also dropped from 8.3 percent to 0 percent. The percentage opposing this proposal had a slight increase from 14 percent to 19 percent. The changes in this proposal illustrated that participants learned more about the proposal, but were neither in support nor opposition for the proposal. Looking specifically at the don’t know category, there are a number of questions that had substantial changes before and after deliberations. Of the twelve proposals, five proposals had double digit changes in the don’t know category, with the range being 3 percent to 31 percent. The proposal with the largest change was for abolishing voter ID laws. Prior to deliberations, the don’t know percent was at 36.1 and after deliberations the percent dropped to 5.6. This is over a thirty percent change for just a one-day deliberation. Participants showed more to support for the

8
proposal more after deliberations; support increased from 22 to 50 percent. The middle category also decreased from 39 percent to 28 percent. Note that the percent opposing the proposal also increased from 2.8 to 14 percent. It does appear that participants, after deliberation, came to form their opinions on this proposal. The questionnaire also asked a few statements relating to people’s perception of voting. The statements included for example, whether the US celebrates too many national holidays, Felons have shown that they are incapable of being responsible citizens and only individuals with US citizenships should be allowed to vote. Two statements experienced the most movement. One, Felons have shown that they are incapable of being responsible citizens and two, Voter ID laws are necessary to address widespread voter fraud. On the first statement regarding felons, 17 percent of participants agreed with the statement, while 28 percent disagreed. After deliberations, 19 percent agreed and 44 percent disagreed. The percentage of participants selecting don’t know also decreased from 16.7 to 2.8 percent after deliberations. On the second statement, 33.3 percent of participants indicated don’t know prior to deliberations. This percentage dropped to 5.6 percent after deliberations. The percentage agreeing with this statement also increased from 25 to 31 percent and at the same time, the percentage disagreeing with this statement also increased from 14 percent to 28 percent. It appears that participants who originally indicated don’t know formed their opinion after deliberations and some agreed, while others disagreed.
Summit High School Participants from Summit High School had similar opinion changes to the overall sample. The proposal with the highest amount of opinion change was allowing individuals to vote online. Before deliberations, half of the participants from Summit supported this proposal, after deliberations, support for this proposal dropped to 16 percent. The change in opposition for this proposal was not as large as the increase in opposition which was from 34 to 41 percent. The middle category experienced a substantial increase from 14 to 41 percent. That is, after deliberations, the same percentage of participants opposed and also neither supported nor opposed this proposal. The don’t know option remained the same at 2.3 percent before and after deliberations. The proposal with the lowest support prior to deliberations was fining people who don’t vote, only 9 percent of participants supported this proposal. After deliberations, support for this proposal increased to 21 percent. But, the opposition for this proposal dropped from 70 percent to 45 percent. The middle category also increased from 16 to 32 percent. The don’t know category dropped slightly from 4.5 to 2.3 percent. The proposal with the highest support prior to deliberations was bringing voting stations to workplaces, at 75 percent. After deliberations, support for this proposal fell below the fifty percent mark to 45 percent. The opposition and middle category for this proposal both increased from 11 to 18 percent and from 11 to 30 percent, respectively. The don’t know category increased slightly from 2.3 to 4.5 percent. Of the twelve proposals, only two proposals had double-digit changes in the don’t know category: allowing individuals who receive Deferred Action for Childhood Arrivals (DACA) to vote and abolishing Voter ID laws. For the proposal on DACA, 41 percent of participants

9
indicated don’t know prior to deliberations. This percent dropped to 14 percent after deliberations. The support for this proposal increased to 62 percent after deliberations and it was at 41 percent prior to deliberations. The proposal on Voter ID laws experienced a 25 percent decrease in the don’t know category, from 41 to 16 percent. Support for this proposal increase after deliberations, but did not cross the fifty percent mark; the increase was from 23 to 41 percent. On questions relating to the perceptions of voting, there were a couple questions that crossed the midpoint and changed from agree to disagree after deliberations. Before deliberations, 77 percent of participants from Summit agreed with the statement forcing people to vote is contradictory to personal liberty. After deliberations, this percent dropped to 45 percent. Participants moved to the middle category (27 percent) and disagreement (16 percent) after deliberations. The statement, electronically recorded votes would not be as reliable as paper ballots, moved from 39 percent (before deliberations) to 54 percent (after deliberations). The percent in disagreement and the middle category both decreased as well after deliberations.
Tahoma High School Participants from Tahoma experienced the most significant opinion changes in four of the twelve proposals. The first proposal was regarding felons voting rights. Prior to deliberations, 48 percent of participants felt that felons should be allowed to vote after serving their sentences. After deliberations, this number increased to 85 percent. Furthermore, after deliberations, 0 percent of participants opposed this proposal, 0 percent selected the don’t know category, and the remaining 15 percent were in the middle category. The second question with substantial changes was allowing legal residents who are not citizens to vote in national elections. This proposal was supported by 55 percent of participants prior to deliberations and this number increased to 80 percent after deliberations. The oppose category increased slightly from 5 to 7.5 percent, but the middle category decreased from 22.5 to 12.5 percent. The proposal regarding abolishing voter ID laws increased from 25 percent to 50 percent. For this proposal, there was also a lot of movement in the don't know category from 42.5 to 12.5 percent. It appears that more participants had an opinion on this proposal after deliberations. Finally, like the other schools, the proposals on online voting saw opposition grow from 35 percent to 50 percent. Though the opposition was not as high as the other schools, it is clear that many participants changed their minds after this deliberations. In examining the movement from the don’t know category, there are a few proposals that saw substantial movement. The proposal on allowing individuals who receive DACA to vote started at 60 percent don’t know and after deliberations, the number decreased to 10 percent. After deliberations, participants’ opinion spread between the opinion category, with 55 percent of participants supporting this proposal. The proposal on allowing Election Day registration saw a dramatic drop from 27.5 percent to 0 percent. Overall, after deliberations, half of the proposals had 0 percent in the don’t know category. On the questions regarding the perceptions of voting, a large majority (73 percent) of participants agreed that any form of compulsory voting would be against personal liberty. But, after deliberations, this number dropped to 50 percent. While the middle category increased from 7.4 to 22.5 percent. For the statement, only individuals with US citizenship should be allowed to

10
vote, 55 percent disagreed prior to deliberations, this number increased to 78 percent after deliberations. The middle category and agreement category also both decreased to 7.5 percent. The remaining statement with over 50 percent disagreement was felons have shown that they are incapable of being responsible citizens. Disagreement for this statement increased from 50 to 62.5 percent after deliberations. The don’t know category also decreased from 12.5 to 2.5 percent. The other categories remained relatively similar after deliberations.
Rainier High School Participants from Rainier had similar changes for the proposals on online voting and voter ID laws, but also had significant changes on whether Election Day should be a national holiday and on voting stations at workplaces. In regards to online voting, allowing individuals to vote online, Opposition increased from 42 to 55 percent, with the support percentage dropping from 30 to 18 percent. The middle category remained similar before and after deliberations. For voter ID laws, abolishing voter ID laws, the participants do not clearly support or oppose this proposal. Before deliberations, 30 percent opposed and 24 percent supported and after deliberations, 24 percent opposed and 36 percent supported. The middle category remained the same, but the don’t know category dropped from 27 to 15 percent. As for making Election Day a national holiday, 73 percent of participants supported this proposal before deliberations, but this support dropped to 58 percent after deliberations. And, on the proposal regarding bringing voting stations to workplaces, 58 percent of participants supported this proposal before deliberations, whereas 39 percent supported this proposal after deliberations. The opposition and middle category increased from 9 to 21 percent and 21 to 33 percent, respectively. The don’t know category among the proposals experienced substantial decreases across the board. After deliberations, only one question had double-digit percentages, whereas before deliberations five questions had double-digit percentages, with one question at 58 percent. The proposal with 58 percent in the don’t know category prior to deliberations was allowing individuals who receive DACA to vote. The percentage dropped to 9 percent after deliberations. 67 percent of participants also came to support this proposal, an increase from 18 percent. On the questions relating to participants’ perception of voting, two of the six statements had disagreement over fifty percent: US celebrates too many national holidays and only individuals with US citizenship should be allowed to vote. The statement on national holidays had 51 percent disagreement after deliberations (a decreased from 58 percent prior) and the statement on non citizens’ voting had disagreement of 58 percent (an increase from 27 percent). The middle categories for these statements had an increase from 12 to 27 percent and decrease from 42 to 18 percent, respectively. The percentage in agreement with these statements remained relatively similar post deliberations.

11
Voting: Results for Summit Prep N=44 Pre Post Post-Pre p-value 1. On a scale from 0 to 10, where 0 is completely unimportant, 10 is extremely important, and 5 is exactly in between, how important do you think each of the following is to being a good citizen? a. Voting in elections
8.295 8.386 0.091 0.750
0-4 2.27% 6.82% 5 9.09% 4.55%
6-10 88.64% 88.64% # of "no opinion" answers 0.00% 0.00%
b. Discussing politics and political issues with others 6.614 7.500 0.886 0.032
0-4 13.64% 15.91% 5 18.18% 0.00%
6-10 68.18% 84.09% # of "no opinion" answers 0.00% 0.00%
c. Being informed about politics and political issues 8.186 8.136 -0.050 0.892
0-4 2.27% 9.09% 5 4.55% 2.27%
6-10 90.91% 88.64% # of "no opinion" answers 2.27% 0.00%
2. How strongly would you oppose or favor each of the following? a. Making election day a national holiday
4.195 4.167 -0.028 1.000
0-2 2.27% 2.27% 3 18.18% 20.45%
4-5 72.73% 72.73% # of "no opinion" answers 6.82% 4.55%
b. Allowing Election Day registration 3.923 4.075 0.152 0.482 0-2 6.82% 4.55%
3 20.45% 15.91% 4-5 61.36% 70.45%
# of "no opinion" answers 11.36% 9.09% c. Allowing felons to vote after they have served their sentences 3.643 4.000 0.357 0.018
0-2 9.09% 4.55% 3 38.64% 22.73%
4-5 47.73% 68.18% # of "no opinion" answers 4.55% 4.55%
d. Allowing individuals to vote online 3.349 2.558 -0.791 0.004

12
0-2 34.09% 40.91% 3 13.64% 40.91%
4-5 50.00% 15.91% # of "no opinion" answers 2.27% 2.27%
e. Fining people who don't vote 1.905 2.488 0.584 0.007 0-2 70.45% 45.45%
3 15.91% 31.82% 4-5 9.09% 20.45%
# of "no opinion" answers 4.55% 2.27% f. Bringing voting stations to workplaces 3.907 3.415 -0.492 0.045
0-2 11.36% 18.18% 3 11.36% 29.55%
4-5 75.00% 45.45% # of "no opinion" answers 2.27% 6.82%
g. Allowing legal residents who are not citizens to vote in national elections 3.821 3.951 0.131 0.377
0-2 11.36% 6.82% 3 22.73% 20.45%
4-5 54.55% 65.91% # of "no opinion" answers 11.36% 6.82%
h. Allowing individuals who receive Deferred Action for Childhood Arrivals (DACA) to vote
4.115 4.111 -0.004 0.665
0-2 4.55% 4.55% 3 13.64% 15.91%
4-5 40.91% 61.36% # of "no opinion" answers 40.91% 13.64%
i. Abolishing voter ID laws 3.385 3.595 0.210 0.083 0-2 11.36% 9.09%
3 25.00% 34.09% 4-5 22.73% 40.91%
# of "no opinion" answers 40.91% 15.91% 3. And on a scale from 0 to 10, where 0 is completely ineffective, 10 is completely effective, and 5 is exactly in-between, how effective do you think each of the following measures would be in increasing voter participation? a. Making election day a national holiday
7.214 7.233 0.018 0.838
0-4 6.82% 15.91% 5 18.18% 11.36%
6-10 70.45% 70.45% # of "no opinion" answers 4.55% 9.09%
b. Allowing Election Day registration 7.350 7.700 0.350 0.306

13
0-4 4.55% 6.82% 5 13.64% 9.09%
6-10 72.73% 75.00% # of "no opinion" answers 9.09% 9.09%
c. Allowing felons to vote after they have served their sentences 6.091 6.535 0.444 0.234
0-4 18.18% 13.64% 5 15.91% 13.64%
6-10 65.91% 70.45% # of "no opinion" answers 0.00% 2.27%
d. Allowing individuals to vote online 7.636 5.930 -1.706 0.006 0-4 15.91% 34.09%
5 4.55% 6.82% 6-10 79.55% 56.82%
# of "no opinion" answers 0.00% 2.27% e. Fining people who don't vote 6.286 6.000 -0.286 0.772
0-4 22.73% 29.55% 5 11.36% 6.82%
6-10 61.36% 61.36% # of "no opinion" answers 4.55% 2.27%
f. Bringing voting stations to workplaces 7.523 6.744 -0.779 0.204 0-4 9.09% 18.18%
5 6.82% 13.64% 6-10 84.09% 65.91%
# of "no opinion" answers 0.00% 2.27% g. Allowing legal residents who are not citizens to vote in national elections 7.452 7.488 0.036 0.900
0-4 6.82% 9.09% 5 9.09% 11.36%
6-10 79.55% 77.27% # of "no opinion" answers 4.55% 2.27%
h. Allowing individuals who receive Deferred Action for Childhood Arrivals (DACA) to vote
7.154 7.436 0.282 0.537
0-4 4.55% 6.82% 5 15.91% 11.36%
6-10 38.64% 70.45% # of "no opinion" answers 40.91% 11.36%
i. Abolishing voter ID laws 6.455 6.342 -0.112 0.901 0-4 15.91% 18.18%
5 18.18% 13.64% 6-10 40.91% 54.55%
# of "no opinion" answers 25.00% 13.64% 4. Please indicate how strongly you disagree or agree with each of the 1.971 2.075 0.104 0.861

14
following statements. a. The U.S. celebrates too many national holidays
0-2 59.09% 65.91% 3 18.18% 22.73%
4-5 2.27% 2.27% # of "no opinion" answers 20.45% 9.09%
b. Felons have shown that they are incapable of being responsible citizens 2.442 2.372 -0.070 0.575
0-2 54.55% 56.82% 3 25.00% 25.00%
4-5 18.18% 15.91% # of "no opinion" answers 2.27% 2.27%
c. Electronically recorded votes would not be as reliable as paper ballots. 2.929 3.500 0.571 0.024
0-2 31.82% 22.73% 3 25.00% 18.18%
4-5 38.64% 54.55% # of "no opinion" answers 4.55% 4.55%
d. Only individuals with U.S. citizenship should be allowed to vote 2.548 2.122 -0.426 0.141
0-2 50.00% 56.82% 3 18.18% 25.00%
4-5 27.27% 11.36% # of "no opinion" answers 4.55% 6.82%
e. Voter ID laws are necessary to address widespread voter fraud 3.067 2.263 -0.804 0.002
0-2 20.45% 52.27% 3 13.64% 20.45%
4-5 34.09% 13.64% # of "no opinion" answers 31.82% 13.64%
f. Forcing people to vote is contradictory to personal liberty 4.214 3.641 -0.573 0.004
0-2 0.00% 15.91% 3 18.18% 27.27%
4-5 77.27% 45.45% # of "no opinion" answers 4.55% 11.36%

15
Voting: Results for Everest N=36 Pre Post Post-Pre p-value 1. On a scale from 0 to 10, where 0 is completely unimportant, 10 is extremely important, and 5 is exactly in between, how important do you think each of the following is to being a good citizen? a. Voting in elections
7.600 6.889 -0.711 0.103
0-4 5.56% 16.67% 5 16.67% 19.44%
6-10 75.00% 63.89% # of "no opinion" answers 2.78% 0.00%
b. Discussing politics and political issues with others 6.618 6.389 -0.229 0.409
0-4 13.89% 16.67% 5 27.78% 22.22%
6-10 52.78% 61.11% # of "no opinion" answers 5.56% 0.00%
c. Being informed about politics and political issues 7.971 7.278 -0.694 0.082
0-4 5.56% 13.89% 5 8.33% 13.89%
6-10 83.33% 72.22% # of "no opinion" answers 2.78% 0.00%
2. How strongly would you oppose or favor each of the following? a. Making election day a national holiday
3.900 3.750 -0.150 0.758
0-2 13.89% 11.11% 3 8.33% 30.56%
4-5 61.11% 58.33% # of "no opinion" answers 16.67% 0.00%
b. Allowing Election Day registration 4.000 3.657 -0.343 0.095 0-2 0.00% 16.67%
3 19.44% 27.78% 4-5 58.33% 52.78%
# of "no opinion" answers 22.22% 2.78% c. Allowing felons to vote after they have served their sentences 3.548 4.000 0.452 0.056
0-2 8.33% 8.33% 3 33.33% 22.22%
4-5 44.44% 69.44% # of "no opinion" answers 13.89% 0.00%
d. Allowing individuals to vote online 3.457 2.722 -0.735 0.010

16
0-2 27.78% 44.44% 3 19.44% 30.56%
4-5 50.00% 25.00% # of "no opinion" answers 2.78% 0.00%
e. Fining people who don't vote 1.771 2.028 0.256 0.209 0-2 75.00% 66.67%
3 13.89% 25.00% 4-5 8.33% 8.33%
# of "no opinion" answers 2.78% 0.00% f. Bringing voting stations to workplaces 3.606 3.250 -0.356 0.117
0-2 13.89% 19.44% 3 22.22% 41.67%
4-5 55.56% 38.89% # of "no opinion" answers 8.33% 0.00%
g. Allowing legal residents who are not citizens to vote in national elections 3.714 4.056 0.341 0.103
0-2 11.11% 0.00% 3 33.33% 27.78%
4-5 52.78% 72.22% # of "no opinion" answers 2.78% 0.00%
h. Allowing individuals who receive Deferred Action for Childhood Arrivals (DACA) to vote
4.034 4.000 -0.034 0.559
0-2 2.78% 2.78% 3 22.22% 30.56%
4-5 55.56% 58.33% # of "no opinion" answers 19.44% 8.33%
i. Abolishing voter ID laws 3.478 3.485 0.007 1.000 0-2 2.78% 13.89%
3 38.89% 27.78% 4-5 22.22% 50.00%
# of "no opinion" answers 36.11% 5.56% 3. And on a scale from 0 to 10, where 0 is completely ineffective, 10 is completely effective, and 5 is exactly in-between, how effective do you think each of the following measures would be in increasing voter participation? a. Making election day a national holiday
7.063 6.639 -0.424 0.510
0-4 5.56% 8.33% 5 19.44% 30.56%
6-10 63.89% 61.11% # of "no opinion" answers 11.11% 0.00%
b. Allowing Election Day registration 7.207 6.647 -0.560 0.111

17
0-4 0.00% 5.56% 5 19.44% 33.33%
6-10 61.11% 55.56% # of "no opinion" answers 19.44% 5.56%
c. Allowing felons to vote after they have served their sentences 6.469 6.417 -0.052 0.878
0-4 8.33% 16.67% 5 27.78% 22.22%
6-10 52.78% 61.11% # of "no opinion" answers 11.11% 0.00%
d. Allowing individuals to vote online 7.629 5.771 -1.857 0.001 0-4 5.56% 27.78%
5 13.89% 25.00% 6-10 77.78% 44.44%
# of "no opinion" answers 2.78% 2.78% e. Fining people who don't vote 4.618 5.029 0.411 0.564
0-4 38.89% 36.11% 5 19.44% 19.44%
6-10 36.11% 41.67% # of "no opinion" answers 5.56% 2.78%
f. Bringing voting stations to workplaces 7.219 6.194 -1.024 0.027 0-4 0.00% 13.89%
5 19.44% 22.22% 6-10 69.44% 63.89%
# of "no opinion" answers 11.11% 0.00% g. Allowing legal residents who are not citizens to vote in national elections 7.278 7.056 -0.222 0.519
0-4 5.56% 8.33% 5 11.11% 13.89%
6-10 83.33% 77.78% # of "no opinion" answers 0.00% 0.00%
h. Allowing individuals who receive Deferred Action for Childhood Arrivals (DACA) to vote
7.724 7.143 -0.581 0.295
0-4 2.78% 8.33% 5 11.11% 19.44%
6-10 66.67% 69.44% # of "no opinion" answers 19.44% 2.78%
i. Abolishing voter ID laws 6.273 6.353 0.080 0.871 0-4 5.56% 16.67%
5 25.00% 22.22% 6-10 30.56% 55.56%
# of "no opinion" answers 38.89% 5.56% 4. Please indicate how strongly you disagree or agree with each of the 2.480 2.750 0.270 0.058

18
following statements. a. The U.S. celebrates too many national holidays
0-2 38.89% 33.33% 3 25.00% 27.78%
4-5 5.56% 16.67% # of "no opinion" answers 30.56% 22.22%
b. Felons have shown that they are incapable of being responsible citizens 2.867 2.735 -0.131 0.778
0-2 27.78% 44.44% 3 38.89% 30.56%
4-5 16.67% 19.44% # of "no opinion" answers 16.67% 5.56%
c. Electronically recorded votes would not be as reliable as paper ballots. 2.967 3.114 0.148 0.544
0-2 27.78% 22.22% 3 27.78% 41.67%
4-5 27.78% 33.33% # of "no opinion" answers 16.67% 2.78%
d. Only individuals with U.S. citizenship should be allowed to vote 2.344 2.543 0.199 0.169
0-2 50.00% 41.67% 3 22.22% 41.67%
4-5 16.67% 13.89% # of "no opinion" answers 11.11% 2.78%
e. Voter ID laws are necessary to address widespread voter fraud 3.167 2.970 -0.197 0.553
0-2 13.89% 27.78% 3 27.78% 33.33%
4-5 25.00% 30.56% # of "no opinion" answers 33.33% 8.33%
f. Forcing people to vote is contradictory to personal liberty 3.656 3.829 0.172 0.386
0-2 11.11% 13.89% 3 27.78% 19.44%
4-5 50.00% 63.89% # of "no opinion" answers 11.11% 2.78%

19
Voting: Results for Tahoma N=40 Pre Post Post-Pre p-value 1. On a scale from 0 to 10, where 0 is completely unimportant, 10 is extremely important, and 5 is exactly in between, how important do you think each of the following is to being a good citizen? a. Voting in elections
8.579 8.625 0.046 0.820
0-4 0.00% 5.00% 5 10.00% 2.50%
6-10 85.00% 92.50% # of "no opinion" answers 5.00% 0.00%
b. Discussing politics and political issues with others 6.846 7.667 0.821 0.018
0-4 20.00% 10.00% 5 12.50% 12.50%
6-10 65.00% 75.00% # of "no opinion" answers 2.50% 2.50%
c. Being informed about politics and political issues 8.525 8.487 -0.038 0.943
0-4 2.50% 5.00% 5 7.50% 5.00%
6-10 90.00% 87.50% # of "no opinion" answers 0.00% 2.50%
2. How strongly would you oppose or favor each of the following? a. Making election day a national holiday
4.000 4.026 0.026 1.000
0-2 12.50% 10.00% 3 10.00% 17.50%
4-5 67.50% 67.50% # of "no opinion" answers 10.00% 5.00%
b. Allowing Election Day registration 4.172 4.105 -0.067 0.861 0-2 2.50% 2.50%
3 12.50% 27.50% 4-5 57.50% 65.00%
# of "no opinion" answers 27.50% 5.00% c. Allowing felons to vote after they have served their sentences 3.487 4.375 0.888 0.000
0-2 15.00% 0.00% 3 35.00% 15.00%
4-5 47.50% 85.00% # of "no opinion" answers 2.50% 0.00%
d. Allowing individuals to vote online 3.184 2.575 -0.609 0.039

20
0-2 35.00% 50.00% 3 17.50% 17.50%
4-5 42.50% 32.50% # of "no opinion" answers 5.00% 0.00%
e. Fining people who don't vote 1.568 2.308 0.740 0.003 0-2 80.00% 57.50%
3 5.00% 22.50% 4-5 7.50% 17.50%
# of "no opinion" answers 7.50% 2.50% f. Bringing voting stations to workplaces 3.973 3.650 -0.323 0.038
0-2 7.50% 15.00% 3 12.50% 30.00%
4-5 72.50% 55.00% # of "no opinion" answers 7.50% 0.00%
g. Allowing legal residents who are not citizens to vote in national elections 4.061 4.275 0.214 0.439
0-2 5.00% 7.50% 3 22.50% 12.50%
4-5 55.00% 80.00% # of "no opinion" answers 17.50% 0.00%
h. Allowing individuals who receive Deferred Action for Childhood Arrivals (DACA) to vote
3.938 4.000 0.063 0.384
0-2 0.00% 5.00% 3 10.00% 20.00%
4-5 30.00% 55.00% # of "no opinion" answers 60.00% 10.00%
i. Abolishing voter ID laws 3.217 3.647 0.430 0.030 0-2 17.50% 12.50%
3 15.00% 22.50% 4-5 25.00% 50.00%
# of "no opinion" answers 42.50% 12.50% 3. And on a scale from 0 to 10, where 0 is completely ineffective, 10 is completely effective, and 5 is exactly in-between, how effective do you think each of the following measures would be in increasing voter participation? a. Making election day a national holiday
7.450 7.641 0.191 0.622
0-4 7.50% 10.00% 5 12.50% 10.00%
6-10 80.00% 77.50% # of "no opinion" answers 0.00% 2.50%
b. Allowing Election Day registration 7.412 7.711 0.299 0.362

21
0-4 2.50% 5.00% 5 15.00% 12.50%
6-10 67.50% 77.50% # of "no opinion" answers 15.00% 5.00%
c. Allowing felons to vote after they have served their sentences 6.241 7.600 1.359 0.002
0-4 5.00% 2.50% 5 25.00% 17.50%
6-10 42.50% 80.00% # of "no opinion" answers 27.50% 0.00%
d. Allowing individuals to vote online 7.447 5.925 -1.522 0.007 0-4 5.00% 25.00%
5 17.50% 17.50% 6-10 72.50% 57.50%
# of "no opinion" answers 5.00% 0.00% e. Fining people who don't vote 5.946 5.763 -0.183 0.798
0-4 30.00% 32.50% 5 10.00% 5.00%
6-10 52.50% 57.50% # of "no opinion" answers 7.50% 5.00%
f. Bringing voting stations to workplaces 7.821 7.158 -0.663 0.145 0-4 5.00% 7.50%
5 7.50% 17.50% 6-10 85.00% 70.00%
# of "no opinion" answers 2.50% 5.00% g. Allowing legal residents who are not citizens to vote in national elections 7.294 7.800 0.506 0.235
0-4 5.00% 5.00% 5 12.50% 10.00%
6-10 67.50% 85.00% # of "no opinion" answers 15.00% 0.00%
h. Allowing individuals who receive Deferred Action for Childhood Arrivals (DACA) to vote
6.813 7.667 0.854 0.247
0-4 0.00% 5.00% 5 15.00% 15.00%
6-10 25.00% 62.50% # of "no opinion" answers 60.00% 17.50%
i. Abolishing voter ID laws 6.760 7.286 0.526 0.306 0-4 7.50% 12.50%
5 17.50% 15.00% 6-10 37.50% 60.00%
# of "no opinion" answers 37.50% 12.50% 4. Please indicate how strongly you disagree or agree with each of the 2.167 2.865 0.698 0.010

22
following statements. a. The U.S. celebrates too many national holidays
0-2 60.00% 30.00% 3 20.00% 32.50%
4-5 10.00% 30.00% # of "no opinion" answers 10.00% 7.50%
b. Felons have shown that they are incapable of being responsible citizens 2.457 2.154 -0.303 0.176
0-2 50.00% 65.00% 3 22.50% 17.50%
4-5 15.00% 15.00% # of "no opinion" answers 12.50% 2.50%
c. Electronically recorded votes would not be as reliable as paper ballots. 3.294 3.351 0.057 0.893
0-2 25.00% 32.50% 3 20.00% 12.50%
4-5 40.00% 47.50% # of "no opinion" answers 15.00% 7.50%
d. Only individuals with U.S. citizenship should be allowed to vote 2.250 1.757 -0.493 0.007
0-2 55.00% 77.50% 3 22.50% 7.50%
4-5 12.50% 7.50% # of "no opinion" answers 10.00% 7.50%
e. Voter ID laws are necessary to address widespread voter fraud 3.371 2.457 -0.914 0.000
0-2 25.00% 37.50% 3 20.00% 32.50%
4-5 42.50% 17.50% # of "no opinion" answers 12.50% 12.50%
f. Forcing people to vote is contradictory to personal liberty 4.054 3.556 -0.498 0.085
0-2 12.50% 17.50% 3 7.50% 22.50%
4-5 72.50% 50.00% # of "no opinion" answers 7.50% 10.00%
23
Voting: Results for Rainier N=33 Pre Post Post-Pre p-value
1. On a scale from 0 to 10, where 0 is completely unimportant, 10 is extremely important, and 5 is exactly in between, how important do you think each of the following is to being a good citizen? a. Voting in elections
7.750 7.697 -0.053 0.948
0-4 3.03% 12.12% 5 18.18% 12.12%
6-10 75.76% 75.76% # of "no opinion" answers 3.03% 0.00%
b. Discussing politics and political issues with others 6.909 7.424 0.515 0.321
0-4 9.09% 12.12% 5 18.18% 12.12%
6-10 72.73% 75.76% # of "no opinion" answers 0.00% 0.00%
c. Being informed about politics and political issues 8.212 8.000 -0.212 0.738
0-4 3.03% 12.12% 5 12.12% 3.03%
6-10 84.85% 81.82% # of "no opinion" answers 0.00% 3.03%
2. How strongly would you oppose or favor each of the following? a. Making election day a national holiday
4.097 3.688 -0.409 0.123
0-2 3.03% 21.21% 3 18.18% 18.18%
4-5 72.73% 57.58% # of "no opinion" answers 6.06% 3.03%
b. Allowing Election Day registration 4.080 4.267 0.187 0.162 0-2 3.03% 0.00%
3 18.18% 21.21% 4-5 54.55% 69.70%
# of "no opinion" answers 24.24% 9.09% c. Allowing felons to vote after they have served their sentences 3.567 3.906 0.340 0.060
0-2 15.15% 12.12% 3 24.24% 21.21%
4-5 51.52% 63.64% # of "no opinion" answers 9.09% 3.03%

24
d. Allowing individuals to vote online 2.906 2.424 -0.482 0.030 0-2 42.42% 54.55%
3 24.24% 27.27% 4-5 30.30% 18.18%
# of "no opinion" answers 3.03% 0.00% e. Fining people who don't vote 2.100 2.375 0.275 0.223
0-2 54.55% 54.55% 3 24.24% 24.24%
4-5 12.12% 18.18% # of "no opinion" answers 9.09% 3.03%
f. Bringing voting stations to workplaces 3.793 3.226 -0.567 0.053 0-2 9.09% 21.21%
3 21.21% 33.33% 4-5 57.58% 39.39%
# of "no opinion" answers 12.12% 6.06% g. Allowing legal residents who are not citizens to vote in national elections 3.778 3.844 0.066 0.581
0-2 12.12% 12.12% 3 15.15% 27.27%
4-5 54.55% 57.58% # of "no opinion" answers 18.18% 3.03%
h. Allowing individuals who receive Deferred Action for Childhood Arrivals (DACA) to vote
3.286 4.000 0.714 0.106
0-2 9.09% 9.09% 3 15.15% 12.12%
4-5 18.18% 66.67% # of "no opinion" answers 57.58% 12.12%
i. Abolishing voter ID laws 2.958 3.346 0.388 0.096 0-2 30.30% 24.24%
3 18.18% 18.18% 4-5 24.24% 36.36%
# of "no opinion" answers 27.27% 21.21% 3. And on a scale from 0 to 10, where 0 is completely ineffective, 10 is completely effective, and 5 is exactly in-between, how effective do you think each of the following measures would be in increasing voter participation? a. Making election day a national holiday
7.424 6.375 -1.049 0.099
0-4 6.06% 27.27% 5 15.15% 9.09%
6-10 78.79% 60.61% # of "no opinion" answers 0.00% 3.03%

25
b. Allowing Election Day registration 7.296 7.241 -0.055 0.572 0-4 6.06% 15.15%
5 6.06% 6.06% 6-10 69.70% 66.67%
# of "no opinion" answers 18.18% 12.12% c. Allowing felons to vote after they have served their sentences 6.333 5.813 -0.521 0.733
0-4 21.21% 21.21% 5 15.15% 21.21%
6-10 54.55% 54.55% # of "no opinion" answers 9.09% 3.03%
d. Allowing individuals to vote online 6.909 5.219 -1.690 0.013 0-4 18.18% 36.36%
5 15.15% 18.18% 6-10 66.67% 42.42%
# of "no opinion" answers 0.00% 3.03% e. Fining people who don't vote 5.633 5.250 -0.383 0.522
0-4 27.27% 36.36% 5 15.15% 12.12%
6-10 48.48% 48.48% # of "no opinion" answers 9.09% 3.03%
f. Bringing voting stations to workplaces 7.900 5.594 -2.306 0.004 0-4 6.06% 33.33%
5 0.00% 6.06% 6-10 84.85% 57.58%
# of "no opinion" answers 9.09% 3.03% g. Allowing legal residents who are not citizens to vote in national elections 6.346 6.258 -0.088 0.723
0-4 12.12% 18.18% 5 12.12% 21.21%
6-10 54.55% 54.55% # of "no opinion" answers 21.21% 6.06%
h. Allowing individuals who receive Deferred Action for Childhood Arrivals (DACA) to vote
6.333 6.259 -0.074 0.353
0-4 6.06% 18.18% 5 9.09% 15.15%
6-10 30.30% 48.48% # of "no opinion" answers 54.55% 18.18%
i. Abolishing voter ID laws 5.750 6.645 0.895 0.213 0-4 24.24% 21.21%
5 3.03% 15.15% 6-10 45.45% 57.58%
# of "no opinion" answers 27.27% 6.06% 4. Please indicate how strongly you 2.120 2.143 0.023 1.000

26
disagree or agree with each of the following statements. a. The U.S. celebrates too many national holidays
0-2 57.58% 51.52% 3 12.12% 27.27%
4-5 6.06% 6.06% # of "no opinion" answers 24.24% 15.15%
b. Felons have shown that they are incapable of being responsible citizens 2.419 2.548 0.129 0.565
0-2 57.58% 48.48% 3 21.21% 24.24%
4-5 15.15% 21.21% # of "no opinion" answers 6.06% 3.03%
c. Electronically recorded votes would not be as reliable as paper ballots. 3.276 3.387 0.111 0.892
0-2 12.12% 24.24% 3 39.39% 21.21%
4-5 36.36% 48.48% # of "no opinion" answers 12.12% 6.06%
d. Only individuals with U.S. citizenship should be allowed to vote 2.900 2.267 -0.633 0.012
0-2 27.27% 57.58% 3 42.42% 18.18%
4-5 21.21% 15.15% # of "no opinion" answers 9.09% 9.09%
e. Voter ID laws are necessary to address widespread voter fraud 3.214 2.310 -0.904 0.000
0-2 18.18% 45.45% 3 27.27% 27.27%
4-5 39.39% 15.15% # of "no opinion" answers 15.15% 12.12%
f. Forcing people to vote is contradictory to personal liberty 3.733 3.156 -0.577 0.021
0-2 15.15% 27.27% 3 15.15% 24.24%
4-5 60.61% 45.45% # of "no opinion" answers 9.09% 3.03%

27
Changes in Opinion: Being Informed
Overall Results Participants in the Deliberative Poll became more supportive of the three proposals regarding being informed. The three proposals were: providing free TV airtime to candidates, providing public funding for non-partisan civic education groups that gather relevant political information and make it available to the citizens who need it, and using public funds to provide and require action-oriented civics education in high schools. On a scale from 1 to 5, where 1 is strongly oppose and 5 is strongly favor, participants favored all three proposals prior to deliberations and their support increased after deliberations. None of the increased support had statistically significant change. The last proposal regarding action-oriented civics education had marginal significance at 0.1116; participants increased their support from 3.955 to 4.229. To further probe participants’ attitude towards these proposals, the survey asked about the effectiveness of these three proposals on increasing political awareness. All three proposals experienced decreases; two of the questions had statistically significant decreases. Participants were asked to rate on a 0-to-10 scale, where 0 was completely ineffective and 10 was completely effective. For the first proposal on free airtime for candidates, participants felt this proposal would be the least effective of them all. Prior to deliberation, the mean was at 6.101 and after deliberations, the mean decreased to 5.317. Participants felt the effectiveness of providing public funding for non-partisan civic education groups that gather relevant political information and make it available to the citizens who need it was slightly more effective, the mean was 7.357 prior to and 6.583 after deliberations. Participants felt the last proposal on action-oriented civics was the most effective, with a mean of 7.553 prior to and 7.298 after deliberations.
By School (in alphabetical order)
Summit High School Like the overall sample, participants from Summit High School also had strong support for the three proposals on being informed. The proposal with the strongest support was regarding action-oriented civics in schools, 80 percent of participants favored this proposal after deliberations. It was a substantial increase from 66 percent prior to deliberations. Participants also strongly favored the proposal on funding for non-partisan civic education groups; support increased from 59 to 77 percent. However, support for providing free TV airtime to candidates was not as clear, only 34 percent favored this proposal, with 36 percent opposing this proposal, both after deliberations. On the questions regarding effectiveness, participants from Summit also felt the proposals would be less effective after deliberations. Not only did participants have less support for the proposal on providing free TV airtime to candidates, but participants also felt this proposal was much less effective, the mean dropped from 5.950 to 4.233. The two other proposals also experienced decreases, but the mean was still relatively high after deliberations.

28
Participants were also asked a few questions regarding their perception of people becoming informed. Participants were asked how strongly they agreed or disagreed with the following statements: political candidates should generally focus more on policy issues in their campaigns, political candidates focus too much on attacking other candidates in their campaigns and, learning facts about government in school isn’t enough to motivate students to be politically engaged. On a scale from 1 to 5, where 1 is strongly disagree and 5 is strongly agree, participants tended to agree strongly with the first two statements regarding political candidates, while participants were more in the middle on the last statement about motivation to be politically engaged. On the first statement, political candidates should generally focus more on policy issues in their campaigns, while a majority of participants agreed with this statement (66 percent), a larger number of participants opted to answer don’t know. In fact, the percentage of participants that indicated don’t know for this question increased from 14 to 32 percent after deliberations. The percentage of participants who agreed with this statement decreased slightly from 70 to 66 percent. On the second statement regarding attacking candidates in campaigns, the majority of participants agreed with this statement after deliberations (74 percent), but the middle category of ‘neither agree nor disagree’ also increased from 4.55 to 13.64 percent. Participants view towards the last statement on motivation to be politically engaged was spread out across the answer options with 34 percent in disagreement, 40 percent in agreement and 20 percent in the middle. A small percentage of participants indicated don’t know.
Everest High School Participants from Everest High School also supported the three proposals on being informed. Looking at the means, participants somewhat favored the proposals as the means ranged from 3.118 to 3.844. Percentage-wise, percentage favored the last proposal on action-oriented civics that most with 50 percent support after deliberations. The proposal on free TV airtime for candidates had 31 percent support, with 44 percent neither favoring nor opposing the proposal after deliberations. And, the proposal on funding non-partisan civic education groups had 39 percent favoring the proposal and 44 percent neither favoring nor opposing after deliberations. In terms of the effectiveness of these proposals, participants from Everest felt these proposals were less effective than the overall sample. The least effective of the proposals was regarding free TV airtime to candidates. Participants’ support decreased from 6.154 to 5.229. The proposal on funding for non-partisan civic education groups was rated 6.125 after deliberations and the proposal on action-oriented civics was rated 6.576 after deliberations. As for the questions relating to participants’ perceptions on being informed, participants from Everest strongly agreed that political candidates should generally focus more on policy issues in their campaigns and political candidates focus too much on attacking other candidates in their campaigns. The means after deliberations were 4.692 and 4.094, respectively. Participants were neither in agreement nor disagreement with the statement regarding motivation to be politically engaged, as the mean was 3.548 and 3.188, before and after deliberations.
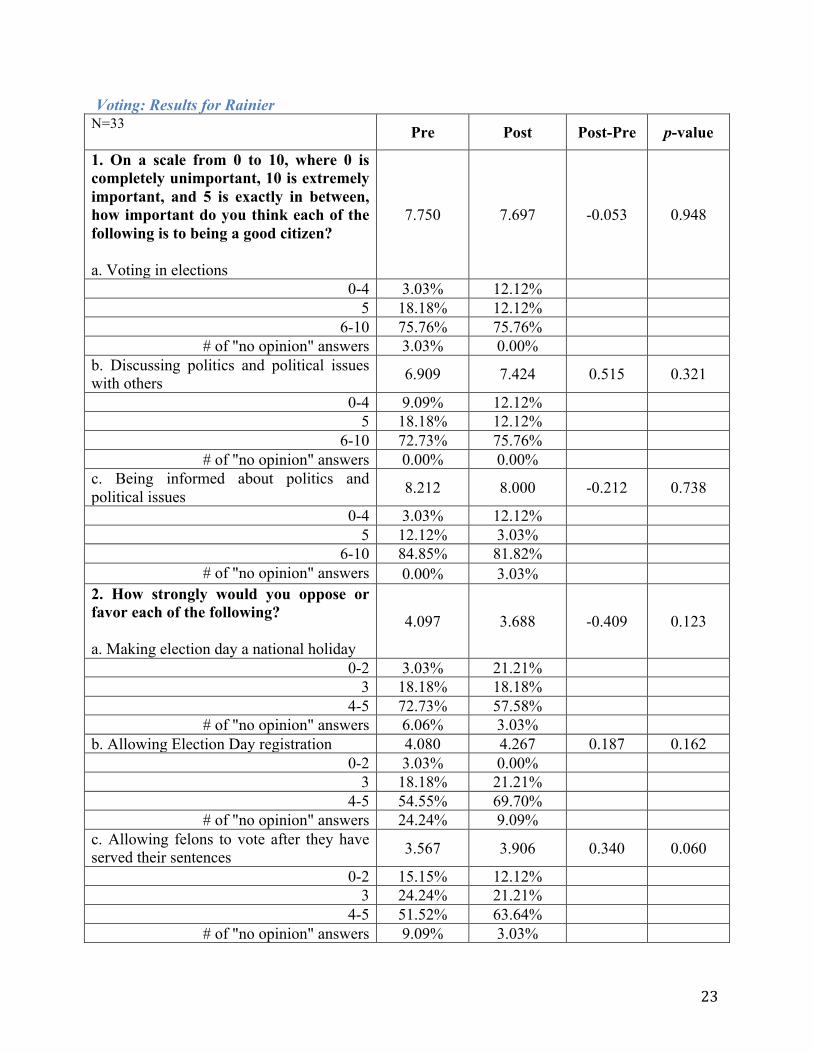
Tahoma High School Participants from Tahoma favored the action-oriented civics proposal the most out of the three proposals. The mean was 4.297 after deliberations. Support for funding non-partisan civic

29
education groups was at 4.108 after deliberations and support for free TV airtime to candidates was 3.275 after deliberations. The latter proposal only had 50 percent support from participants, while the two other proposals had over 70 percent support after deliberations. The percentage of don’t know also decreased substantially for all three proposals. For the proposal on free TV airtime for candidates, the percentage of don’t know dropped from 24 percent to 0 percent. The percentage decrease for funding non-partisan civic education groups was 22 percent, from 32 to 10 percent. And, the proposal on action-oriented civics saw a 27 percent decrease for the don’t know category, from 37 to 10 percent. Participants also felt these proposals were less effective after deliberations. Like the overall sample, participants from Tahoma felt the action-oriented civics proposal would be most effective, with 73 percent of participants supporting the proposal after deliberations. The percentage of don’t know also dropped from 34 to 8 percent. The next highest support was funding non-partisan civic education groups, the mean dropped from 7.481 to 6.658 after deliberations. And, the last proposal on free TV airtime for candidates dropped from 6.029 to 5.744 after deliberations. Only 53 percent of participants felt this proposal would be effective. In terms of the statements relating to people’s perception of being informed, participants tended to agree that the political candidates should focus more on policy issues and not on other candidates. On the statement, political candidates should generally focus more on policy issues in their campaigns, 45 percent of participants agreed with this statement, but 50 percent of participants also indicated don’t know after deliberations. It appears that participants either agreed with this statement or they opted not to answer, as the don’t know category increased from 22 to 50 percent. Support for political candidates focus too much on attacking other candidates in their campaigns also increased to 65 percent, the don’t know category was at 8 percent after deliberations. And, the statement on motivation to be politically engaged was more spread out across the answer options, where 43 percent agreed with the statement, 28 percent disagreed, and 28 percent were in the middle category.
Rainier High School Participants from Tahoma had similar results to the overall sample. Participants favored all three proposals with the action-oriented civics proposal as the top choice, the funding for non-partisan civic education groups as the second choice, and the free TV airtime to candidates as the last proposal. In terms of percentages, 70 percent of participants favored the action-oriented civics proposal, 58 percent favored the funding for non-partisan civic education groups proposal and 45 percent favored the free TV airtime to candidates’ proposal. Percentages for the don’t know for all three proposals decreased after deliberations. In terms of judging the effectiveness of these proposals, 55 percent of participants felt the action-oriented civics proposal and funding for non-partisan civic education groups’ proposal would be effective. Only 42 percent felt the free TV airtime to candidates’ proposal would be effective. Moreover, the percentages for don’t know categories were quite high for the action-oriented civics proposal and funding for non-partisan civic education groups’ proposal. For the action-oriented civics proposal, prior to deliberations, 24 percent indicated don’t know and the percent increased to 24 percent after deliberations. For the funding for non-partisan civic education

30
groups’ proposal, 33 percent indicated don’t know prior to deliberations, but while the percent decreased still 24 percent indicated don’t know after deliberations. As for the questions regarding perceptions of being informed, participants agreed with all three statements: political candidates should generally focus more on policy issues in their campaigns (51 percent), political candidates focus too much on attacking other candidates in their campaigns (67 percent) and, learning facts about government in school isn’t enough to motivate students to be politically engaged (63 percent). The first statement on whether political candidates should focus more on policy issues had a substantial increase for don't know answers, increasing from 6 to 45 percent. It appears that participants either supported this proposal or opted for the don't know category. The latter two statements had much lower percentage of don’t know.
Being Informed: Results for Summit High School N=44 Pre Post Post-Pre p-value 8. How strongly would you oppose or favor each of the following? a. Providing free TV airtime to candidates.
2.946 3.119 0.173 0.353
1-2 29.55% 36.36% 3 27.27% 25.00%
4-5 27.27% 34.09% # of "no opinion" answers 15.91% 4.55%
b. Providing public funding for non-partisan civic education groups that gather relevant political information and make it available to the citizens who need it.
4.056 4.211 0.155 0.361
1-2 2.27% 2.27% 3 20.45% 6.82%
4-5 59.09% 77.27% # of "no opinion" answers 18.18% 13.64%
c. Using public funds to provide and require action-oriented civics education in high schools.
3.923 4.233 0.309 0.014
1-2 4.55% 0.00% 3 18.18% 18.18%
4-5 65.91% 79.55% # of "no opinion" answers 11.36% 2.27%
9. And on a scale from 0 to 10, where 0 is completely ineffective, 10 is completely effective, and 5 is exactly in-between, how effective do you think each of the following measures would
5.950 4.732 -1.218 0.013

31
be in increasing political awareness? a. Providing free TV airtime to candidates.
0-4 20.45% 40.91% 5 15.91% 11.36%
6-10 54.55% 40.91% # of "no opinion" answers 9.09% 6.82%
b. Providing public funding for non-partisan civic education groups that gather relevant political information and make it available to the citizens who need it.
7.158 6.610 -0.548 0.284
0-4 6.82% 13.64% 5 13.64% 11.36%
6-10 65.91% 68.18% # of "no opinion" answers 13.64% 6.82%
c. Using public funds to provide and require action-oriented civics education in high schools.
7.368 7.326 -0.043 0.879
0-4 6.82% 11.36% 5 11.36% 6.82%
6-10 68.18% 79.55% # of "no opinion" answers 13.64% 2.27%
10. And please indicate how strongly you disagree or agree with each of the following. a. Political candidates should generally focus more on policy issues in their campaigns.
4.105 4.800 0.695 0.000
1-2 0.00% 0.00% 3 15.91% 2.27%
4-5 70.45% 65.91% # of "no opinion" answers 13.64% 31.82%
b. Political candidates focus too much on attacking other candidates in their campaigns.
4.300 4.146 -0.154 0.324
1-2 4.55% 6.82% 3 4.55% 13.64%
4-5 81.82% 72.73% # of "no opinion" answers 9.09% 6.82%
c. Learning facts about government in school isn’t enough to motivate students to be politically engaged.
3.372 3.071 -0.301 0.248

32
1-2 20.45% 34.09% 3 34.09% 20.45%
4-5 43.18% 40.91% # of "no opinion" answers 2.27% 4.55%
Being Informed: Results for Everest N=36 Pre Post Post-Pre p-value 8. How strongly would you oppose or favor each of the following? a. Providing free TV airtime to candidates.
3.087 3.118 0.031 0.833
1-2 16.67% 19.44% 3 27.78% 44.44%
4-5 19.44% 30.56% # of "no opinion" answers 36.11% 5.56%
b. Providing public funding for non-partisan civic education groups that gather relevant political information and make it available to the citizens who need it.
3.773 3.531 -0.241 0.577
1-2 0.00% 5.56% 3 25.00% 44.44%
4-5 36.11% 38.89% # of "no opinion" answers 38.89% 11.11%
c. Using public funds to provide and require action-oriented civics education in high schools.
3.762 3.844 0.082 0.630
1-2 5.56% 0.00% 3 16.67% 38.89%
4-5 36.11% 50.00% # of "no opinion" answers 41.67% 11.11%
9. And on a scale from 0 to 10, where 0 is completely ineffective, 10 is completely effective, and 5 is exactly in-between, how effective do you think each of the following measures would be in increasing political awareness? a. Providing free TV airtime to candidates.
6.154 5.229 -0.925 0.007
0-4 11.11% 19.44% 5 16.67% 44.44%

33
6-10 44.44% 33.33% # of "no opinion" answers 27.78% 2.78%
b. Providing public funding for non-partisan civic education groups that gather relevant political information and make it available to the citizens who need it.
7.240 6.125 -1.115 0.015
0-4 2.78% 5.56% 5 16.67% 36.11%
6-10 50.00% 47.22% # of "no opinion" answers 30.56% 11.11%
c. Using public funds to provide and require action-oriented civics education in high schools.
7.560 6.576 -0.984 0.137
0-4 2.78% 2.78% 5 16.67% 30.56%
6-10 50.00% 58.33% # of "no opinion" answers 30.56% 8.33%
10. And please indicate how strongly you disagree or agree with each of the following. a. Political candidates should generally focus more on policy issues in their campaigns.
3.778 4.692 0.915 0.043
1-2 2.78% 0.00% 3 27.78% 2.78%
4-5 44.44% 33.33% # of "no opinion" answers 25.00% 63.89%
b. Political candidates focus too much on attacking other candidates in their campaigns.
4.034 4.094 0.059 0.713
1-2 0.00% 2.78% 3 22.22% 16.67%
4-5 58.33% 69.44% # of "no opinion" answers 19.44% 11.11%
c. Learning facts about government in school isn’t enough to motivate students to be politically engaged.
3.548 3.188 -0.361 0.016
1-2 11.11% 22.22% 3 27.78% 36.11%
4-5 47.22% 30.56% # of "no opinion" answers 13.89% 11.11%
34
Being Informed: Results for Tahoma N=40 Pre Post Post-Pre p-value 8. How strongly would you oppose or favor each of the following? a. Providing free TV airtime to candidates.
3.200 3.275 0.075 0.902
1-2 17.07% 22.50% 3 31.71% 27.50%
4-5 26.83% 50.00% # of "no opinion" answers 24.39% 0.00%
b. Providing public funding for non-partisan civic education groups that gather relevant political information and make it available to the citizens who need it.
4.00 4.108 0.108 0.170
1-2 2.44% 10.00% 3 7.32% 10.00%
4-5 58.54% 70.00% # of "no opinion" answers 31.71% 10.00%
c. Using public funds to provide and require action-oriented civics education in high schools.
4.040 4.297 0.257 0.170
1-2 0.00% 7.50% 3 14.63% 10.00%
4-5 48.78% 72.50% # of "no opinion" answers 36.59% 10.00%
9. And on a scale from 0 to 10, where 0 is completely ineffective, 10 is completely effective, and 5 is exactly in-between, how effective do you think each of the following measures would be in increasing political awareness? a. Providing free TV airtime to candidates.
6.029 5.744 -0.286 0.857
0-4 14.63% 20.00% 5 19.51% 25.00%
6-10 51.22% 52.50% # of "no opinion" answers 14.63% 2.50%
b. Providing public funding for non-partisan civic education groups that gather relevant political information and make it available to the citizens who need it.
7.481 6.658 -0.824 0.104

35
0-4 4.88% 7.50% 5 7.32% 25.00%
6-10 56.10% 62.50% # of "no opinion" answers 31.71% 5.00%
c. Using public funds to provide and require action-oriented civics education in high schools.
7.500 7.486 -0.014 0.846
0-4 0.00% 7.50% 5 12.20% 12.50%
6-10 53.66% 72.50% # of "no opinion" answers 34.15% 7.50%
10. And please indicate how strongly you disagree or agree with each of the following. a. Political candidates should generally focus more on policy issues in their campaigns.
3.806 4.450 0.644 0.4332
1-2 2.44% 0.00% 3 24.39% 0.00%
4-5 51.22% 45.00% # of "no opinion" answers 21.95% 50.00%
b. Political candidates focus too much on attacking other candidates in their campaigns.
3.829 4.027 0.198 0.3947
1-2 17.07% 7.50% 3 7.32% 20.00%
4-5 63.41% 65.00% # of "no opinion" answers 12.20% 7.50%
c. Learning facts about government in school isn’t enough to motivate students to be politically engaged.
3.658 3.333 -0.325 0.2084
1-2 9.76% 27.50% 3 29.27% 27.50%
4-5 53.66% 42.50% # of "no opinion" answers 7.32% 2.50%
Being Informed: Results for Rainier N=33 Pre Post Post-Pre p-value 8. How strongly would you oppose or favor each of the following? a. Providing free TV airtime to candidates.
3.704 3.414 -0.290 0.377
1-2 9.09% 9.09%

36
3 21.21% 33.33% 4-5 51.52% 45.45%
# of "no opinion" answers 18.18% 12.12% b. Providing public funding for non-partisan civic education groups that gather relevant political information and make it available to the citizens who need it.
4.083 3.828 -0.256 0.382
1-2 0.00% 6.06% 3 18.18% 24.24%
4-5 54.55% 57.58% # of "no opinion" answers 27.27% 12.12%
c. Using public funds to provide and require action-oriented civics education in high schools.
4.080 4.233 0.153 0.248
1-2 0.00% 3.03% 3 18.18% 18.18%
4-5 57.58% 69.70% # of "no opinion" answers 24.24% 9.09%
9. And on a scale from 0 to 10, where 0 is completely ineffective, 10 is completely effective, and 5 is exactly in-between, how effective do you think each of the following measures would be in increasing political awareness? a. Providing free TV airtime to candidates.
6.345 5.667 -0.678 0.315
1-4 12.12% 18.18% 5 21.21% 30.30%
6-10 54.55% 42.42% # of "no opinion" answers 12.12% 9.09%
b. Providing public funding for non-partisan civic education groups that gather relevant political information and make it available to the citizens who need it.
7.682 6.720 -0.962 0.346
0-4 3.03% 9.09% 5 0.00% 12.12%
6-10 63.64% 54.55% # of "no opinion" answers 33.33% 24.24%
c. Using public funds to provide and require action-oriented civics education in high schools.
7.880 7.667 -0.213 0.614
0-4 3.03% 6.06%

37
5 3.03% 12.12% 6-10 69.70% 54.55%
# of "no opinion" answers 24.24% 27.27% 10. And please indicate how strongly you disagree or agree with each of the following. a. Political candidates should generally focus more on policy issues in their campaigns.
4.129 4.833 0.704 0.015
1-2 3.03% 0.00% 3 21.21% 3.03%
4-5 69.70% 51.52% # of "no opinion" answers 6.06% 45.45%
b. Political candidates focus too much on attacking other candidates in their campaigns.
3.767 4.000 0.233 0.340
1-2 6.06% 12.12% 3 27.27% 12.12%
4-5 57.58% 66.67% # of "no opinion" answers 9.09% 9.09%
c. Learning facts about government in school isn’t enough to motivate students to be politically engaged.
3.719 3.871 0.152 0.688
1-2 15.15% 15.15% 3 18.18% 15.15%
4-5 63.64% 63.64% # of "no opinion" answers 3.03% 6.06%

38
Changes in Knowledge Participants from all four high school gained substantial knowledge from participating in the deliberative event. The following reports the changes in knowledge for each high school.
Changes in Knowledge: Results for Summit Prep For all questions, fewer participants indicated “don’t know” after deliberations and the percentage of participants selecting the correct answer also increased for all five questions. The question receiving the highest percentage for a correct answer was “which of the following countries has a system of “compulsory voting”?” Prior to deliberations 11.4 percent selected Australia as the correct answer and after deliberations, 79.6 percent selected the correct answer. About 41 percent of participants selected the correct answer for both “…how many Americans are prevented from voting because of criminal convictions” and “…what percentage of eligible American voters actually vote in a given presidential election.” After deliberations, participants remained unclear about “…how many individuals are currently eligible for DACA status”, as only about 9 percent knew the correct answer. And, the question about which state requires an action-based civics course also only had 11 percent of participants who knew the correct answer. N=44 Pre Post Post-Pre p-value 12. About how many Americans are prevented from voting because of criminal convictions?
0.037
50,000 2.27% 2.27% 0.00% 500,000 0.00% 9.09% 9.09%
5,000,000 (Correct) 34.09% 40.91% 6.82% 15,000,000 11.36% 6.82% -4.54%
Don’t know 52.27% 40.91% -11.36% 13. Approximately what percentage of eligible American voters actually vote in a given presidential election?
0.035
10% 0.00% 2.27% 2.27% 30% 34.09% 36.36% 2.27%
50% (Correct) 22.73% 40.91% 18.18% 70% 9.09% 0.00% -9.09%
Don’t know 34.09% 20.45% -13.64% 14. Which of the following countries has a system of "compulsory voting"? 0.000
Ireland 4.55% 4.55% 0.00% United Kingdom 6.82% 2.27% -4.55%
Australia (Correct) 11.36% 79.55% 68.19% South Korea 2.27% 0.00% -2.27% Don’t know 75.00% 13.64% -61.36%
15. About how many individuals are currently eligible to apply for DACA 0.040

39
status? 500,000 2.27% 2.27% 0.00%
1,000,000 (Correct) 4.55% 9.09% 4.54% 2,000,000 11.36% 22.73% 11.37% 5,000,000 6.82% 11.36% 4.54%
Don’t know 75.00% 54.55% -20.45% 16. Which of the following states requires an "action civics" component in high school?
0.046
Hawaii (Correct) 6.82% 13.64% 6.82% California 9.09% 13.64% 4.55%
Massachusetts 9.09% 11.36% 2.27% New York 6.82% 15.91% 9.09%
Don’t know 68.18% 45.45% -22.73%
Changes in Knowledge: Results for Everest Of the five knowledge questions, three questions experienced an increase in the percentage of correct answers, while two questions experienced a decrease. The three questions that increased were regarding “…percentage of eligible American voters actually vote in a given presidential election”, which country has compulsory voting, and which state has an action civics requirement. Prior to deliberations, 14 percent selected ‘50%’ as the correct answer for the percentage of Americans that vote in a given presidential election and after deliberations, 39 percent selected the correct answer. For the question regarding compulsory voting, only 6 percent selected Australia prior to deliberations, but this percentage increased to 61 percent after deliberations. And, of the question on action civic requirement, 0 percent of participants had selected Hawaii as the correct answer prior to deliberations, but this percentage increased to 8 percent after deliberations. The two questions that experienced slight decreases in the correct answers were about voting for those with criminal convictions and about the number of individual eligible for DACA. The decrease was 3 percent and 5 percent, respectively. The “don't know” percentages stayed the same for two questions, decreased for two questions, and increased for one question. N=36 Pre Post Post-Pre p-value
12. About how many Americans are prevented from voting because of criminal convictions?
0.646
50,000 0.00% 0.00% 0.00% 500,000 5.56% 11.11% 5.55%
5,000,000 (Correct) 13.89% 11.11% -2.78% 15,000,000 2.78% 0.00% -2.78%
Don’t know 77.78% 77.78% 0.00% 13. Approximately what percentage 0.412

40
of eligible American voters actually vote in a given presidential election?
10% 0.00% 0.00% 0.00% 30% 22.22% 13.89% -8.33%
50% (Correct) 13.89% 38.89% 25.00% 70% 5.56% 2.78% -2.78%
Don’t know 58.33% 44.44% -13.89% 14. Which of the following countries has a system of "compulsory voting"?
0.000
Ireland 0.00% 0.00% 0.00% United Kingdom 8.33% 5.56% -2.77%
Australia (Correct) 5.56% 61.11% 55.55% South Korea 5.56% 0.00% -5.56% Don’t know 80.56% 33.33% -47.23%
15. About how many individuals are currently eligible to apply for DACA status?
0.492
500,000 0% 2.78% 2.78% 1,000,000 (Correct) 8.33% 2.78% -5.55%
2,000,000 8.33% 5.56% -2.77% 5,000,000 11.11% 8.33% -2.78%
Don’t know 72.22% 80.56% 8.34% 16. Which of the following states requires an "action civics" component in high school?
0.536
Hawaii (Correct) 0% 8.33% 8.33% California 5.56% 5.56% 0.00%
Massachusetts 11.11% 0.00% -11.11% New York 2.78% 5.56% 2.78%
Don’t know 80.56% 80.56% 0.00%
Changes in Knowledge: Results for Tahoma The participants from Tahoma experienced increases in knowledge for all five questions. The question with the highest percentage for a correct answer was regarding compulsory voting. Prior to deliberations, 5 percent of participants selected Australia as the correct answer, but after deliberations 78 percent of participants selected the correct answer. The second highest percentage was for the “…percentage of eligible American voters actually vote in a given presidential election”. Here, 18 percent selected ‘50%’ prior to deliberations and 53 percent selected the correct answer after deliberations. About 33 percent of participants selected the correct answer for the number of Americans that are “prevented from voting because of criminal convictions”. This number increased from 13 percent, prior to deliberations. The percentage selecting the correct answers for number of individuals that qualify under DACA and the state that required an action civics course was lower, 10 percent and 8 percent, respectively. All five

41
questions had a decrease in the percentage of don’t knows after deliberations. The question with the highest number was the question on compulsory voting, decreased 68 percent. N=40 Pre Post Post-Pre p-value
12. About how many Americans are prevented from voting because of criminal convictions?
0.066
50,000 0.00% 0.00% 0.00% 500,000 12.50% 12.50% 0.00%
5,000,000 (Correct) 12.50% 32.50% 20.00% 15,000,000 0.00% 0.00% 0.00%
Don’t know 75.00% 55.00% -20.00% 13. Approximately what percentage of eligible American voters actually vote in a given presidential election?
0.096
10% 2.50% 5.00% 2.50% 30% 30.00% 15.00% -15.00%
50% (Correct) 17.50% 52.50% 35.00% 70% 2.50% 5.00% 2.50%
Don’t know 47.50% 22.50% -25.00% 14. Which of the following countries has a system of "compulsory voting"? 0.000
Ireland 2.50% 0.00% -2.50% United Kingdom 2.50% 2.50% 0.00%
Australia (Correct) 5.00% 77.50% 72.50% South Korea 2.50% 0.00% -2.50% Don’t know 87.50% 20.00% -67.50%
15. About how many individuals are currently eligible to apply for DACA status?
0.002
500,000 2.50% 12.50% 10.00% 1,000,000 (Correct) 5.00% 10.00% 5.00%
2,000,000 2.50% 5.00% 2.50% 5,000,000 0% 5.00% 5.00%
Don’t know 90.00% 67.50% -22.50% 16. Which of the following states requires an "action civics" component in high school?
0.262
Hawaii (Correct) 0% 7.50% 7.50% California 12.50% 7.50% -5.00%
Massachusetts 2.50% 5.00% 2.50% New York 2.50% 5.00% 2.50%
Don’t know 82.50% 75.00% -7.50%

42
Changes in Knowledge: Results for Rainier Participants from Rainier increased their knowledge on all five questions. The question with the highest percentage for a correct answer was regarding compulsory voting, with 76 percent of participants selecting the correct answer. This is a 51 percent increase from 24 percent prior to deliberations. About 30 percent of participants correctly answered the number of Americans that are “prevented from voting because of criminals’ convictions” and “percentage of eligible American voters actually vote in a given presidential election”. The questions regarding DACA and action civics course had the lowest percentage of correct answers, post deliberation, 3 percent and 6 percent, respectively. All five questions had a substantial decrease in the percentage of don’t knows after deliberation, ranging from 18 to 55 percent. The highest percentage decrease was for compulsory voting at 55 percent. N=33 Pre Post Pre-Post p-value
12. About how many Americans are prevented from voting because of criminal convictions?
0.008
50,000 0% 12.12% 12.12% 500,000 9.09% 3.03% -6.06%
5,000,000 (Correct) 15.15% 30.30% 15.15% 15,000,000 9.09% 9.09% 0.00%
Don’t know 66.67% 45.45% -21.22% 13. Approximately what percentage of eligible American voters actually vote in a given presidential election?
0.064
10% 6.06% 6.06% 0.00% 30% 24.24% 27.27% 3.03%
50% (Correct) 12.12% 30.30% 18.18% 70% 3.03% 9.09% 6.06%
Don’t know 54.55% 27.27% -27.28% 14. Which of the following countries has a system of "compulsory voting"? 0.000
Ireland 0% 3.03% 3.03% United Kingdom 6.06% 9.09% 3.03%
Australia (Correct) 24.24% 75.76% 51.52% South Korea 6.06% 3.03% -3.03% Don’t know 63.64% 9.09% -54.55%
15. About how many individuals are currently eligible to apply for DACA status?
0.027
500,000 0% 3.03% 3.03% 1,000,000 (Correct) 3.03% 6.06% 3.03%
2,000,000 6.06% 18.18% 12.12% 5,000,000 3.03% 9.09% 6.06%

43
Don’t know 87.88% 63.64% -24.24% 16. Which of the following states requires an "action civics" component in high school?
0.024
Hawaii (Correct) 0% 6.06% 6.06% California 3.03% 3.03% 0.00%
Massachusetts 6.06% 12.12% 6.06% New York 0% 6.06% 6.06%
Don’t know 90.91% 72.73% -18.18%

44
Representativeness Across all four high schools, 234 students completed the pre-deliberation survey. On the day of the event, 173 students attended the daylong Deliberative Poll. Unfortunately, some surveys were not valid and some students did not complete the survey prior to departure. The final number of pre and post deliberation surveys used for this report was 153. In the below analyses comparing participants and non-participants, the participants are those who attended and completed valid pre and post surveys (153) and the non-participants are those who only completed the pre survey and/or attended the event, but did not complete or had in invalid post survey. Of the 22 demographics questions, only 5 questions had statistically significant differences. A series of questions asked participants how often they engaged in certain activities related to news and politics. Of the six questions in that series, one question about talking with parents about politics or political issues was statistically significant. Participants tended to talk with their parents about politics or political issues 1 more days a week than non-participants. This difference was significant at the 0.008 level. Another series of question asked participants how likely they would engage in activities related to politics. Of the seven questions asked, two of the questions were statistically significant: argue your point of view about a political or social issue and organize a group of students in order to achieve changes at school. In both cases, participants were more likely to engage in these two activities. The fourth question was about general interest in politics in the US. Participants indicated that they were more interested than non-participants. The last question was regarding how many books there are in the participants’ home. Participants reportedly had more books at home than non-participants. All other demographic questions including gender, religious services, ethnicity and political party affiliation had no statistically significant differences. That is, participants and non-participants are generally very similar with the exception of a few questions about interest in politics.
Demographics Participants Non-Participants p-value In the past 7 days, how many of those days did you engage in each of the following activities?
Watching the news on TV 2.088 2.062 0.969 Reading a daily newspaper 0.575 0.315 0.136
Reading news sources on the internet 3.248 2.932 0.294 Talking with parents about politics or political
issues 2.046 1.346 0.008
Talking with friends about politics or political issues 2.092 1.654 0.104
On average, how often do you participate in a conversation about politics or political issues? 0.174
Practically never 13.73% 18.52%

45
About once a month 21.57% 19.75% About once a week 24.84% 29.63%
Several times a week 24.84% 24.69% Almost every day 15.03% 7.41%
How likely or unlikely is it that you would do the following activities some time in the future? (1-very unlikely, 5-very likely)
Discuss a newspaper article about a political issue with others 2.569 2.222 0.360
Argue your point of view about a controversial political or social issue 3.739 3.272 0.039
Stand as a candidate in a school election 1.837 1.580 0.104
Organize a group of students in order to achieve changes at school 2.634 2.111 0.017
Follow a television debate about a controversial issue 2.908 2.802 0.736
Write a letter to a newspaper giving your view on a current issue 1.595 1.617 0.569
Speak in front of your class about a social or political issue 2.712 2.358 0.197
Generally speaking, how interested would you say you are in politics in the US? 0.009
Not at all interested 5.23% 8.64% Not very interested 14.38% 25.93%
Somewhat interested 54.25% 50.62% Very interested 26.14% 14.81%
Where are you on a scale from liberal to conservative, where 0 is extremely liberal and 10 is extremely conservative?
2.542 2.506 0.648
What political party are you? 0.801 Democrat 54.90% 60.49%
Republican 4.58% 4.94% Independent 26.80% 13.58%
Would rather not say 13.73% 20.99% What year were you born? (age) 18.275 18.074 0.762 What gender do you identify as? 0.228
Female 50.33% 43.21% Male 47.71% 54.32%
Would rather not say 1.31% 2.47% Other 0.65% 0%

46
What is your racial/ethnical background? 0.340 Hispanic/Latina 55.56% 72.84%
White 37.91% 22.22% Black/African American 3.27% 8.64%
Asian 16.99% 12.35% Native American 3.27% 3.70%
Pacific Islander 4.58% 4.94% What language do you speak at home most of the time? 0.764
English 64.71% 59.26% Spanish 24.84% 27.16%
Both 3.92% 12.35% Other 6.54% 1.23%
How often do you attend religious services? (1-Every week, 2-Almost every week, 3-once/twice a month, 4-few times a year, 5-never)
3.686 3.420 0.180
How many children under 18, including yourself if you are under 18, live in your home? If there are none, just say 0.
1.680 1.975 0.111
About how many books are there in your home? 0.040
0-10 13.07% 18.52% 11-25 18.30% 22.22%
26-100 32.68% 39.51% 101-200 21.57% 8.64%
More than 200 14.38% 11.11%
47
Qualitative Transcript Analysis The discussions so far have focused on using statistics to analyze general movements (or lack of movement) in opinions and the magnitude of those movements for each survey item. These results have been useful in determining the overall influence of the Summit Deliberative Poll on students’ opinions. But how did these changes in opinions occur? What was the process that caused students to submit post-responses that were different from their pre-responses? In their small group deliberations, how did they navigate dissenting points of view? How did they incorporate their own experiences in the discussion? What were the deeper value questions that they discovered underlay the policy proposals? This section will illustrate three core themes threaded in the small group discussions using specific excerpts from audio recordings of a few selected groups. While the benefit of these excerpts is that they provide insight on the actual back-and-forth exchanges between students rather than simply the numerical output of their surveys, the drawback is that every discussion brought together a different set of diverse and important experiences, so no one excerpt in one discussion can be completely representative of all the discussions. The excerpts that were selected, however, embody the following overall themes that were present in all or almost all discussions:
1.) Students considered opposing viewpoints and used these viewpoints to complicate their current stances on policy proposals. They used others’ perspectives to come up with compromises that addressed problems they didn’t initially anticipate. Dissenting points of view also helped students recognize the trade-offs of proposed solutions. 2.) Students drew from their personal experiences to imagine the possible impacts of policy proposals. Their understanding of the communities who would be most impacted by policies came from personal interactions and the media. 3.) Students grappled with questions separate from the policy proposals that helped them better understand the underlying problems that proposals wished to solve. In some ways, these deeper value questions helped students consider whether the proposal was the best solution to the problem. In other ways, these questions helped illuminate why there was disagreement among students.
Considering the Opposition Whenever a new policy proposal was introduced in the small group discussions, the first responders began the topic with strong opinions. With or without the moderator’s invitation, arguments for the opposing side were explored. These dissenting viewpoints or questions for specificity would complicate and add addendums to participants’ original stances. In the excerpt below, a student explains why they support online voting, and another student responds with their own reservations.

48
Participant A: I mean you can register online to vote so I don’t see why you can’t vote online. Participant B: So like, you know how voting is on one day? For example, when the SAT scores came out, the whole website crashed for everyone, and no one could view their SAT scores, and it was nerve wracking. So I feel like that is a possibility that could happen to – like registering includes the whole year but voting is the same day. But if they could fix that, and make sure that doesn’t happen… Participant A: And I feel like, maybe in the event that, if that did happen, they would extend it or something like that – Participant B: Exactly. Participant A: – or do something to like let people who are trying to vote – Participant B: Make up.
In this excerpt, Participant A brings up a reason why voting online seems feasible – registering to vote can already be done online. Participant B points out a difference between registering and voting that could potentially make implementing online voting more challenging than registering to vote online. Participant A considers B’s point of view by establishing that there may need to be changes to the voting system in order to accommodate the new online platform, such as extending the time frame to vote or offering alternative ways to vote as back-ups. The two participants end up agreeing on new conditions they came up with together. In this exchange, they incorporate the other’s perspective into a new deeper consideration of the potential problems that could arise from online voting, and then they brainstorm ways to prepare for or prevent these problems. Some differences in opinion did not end in agreed solutions. In the following discussion about giving candidates free airtime, two students consider whether it is enough to give lesser known candidates airtime if media outlets are still covering a few candidates much more than others.
Participant C: So if we were to give each of the candidates their own channel, do you think we should still allow for them to make their ways into other mainstream media forms – specifically with television? Like in news sources? For them to have the same kind of coverage? Or should we limit that so we can make it strictly through these channels designed by them, made by them, to inform the public? Participant D: I think you run into a sticky situation where we’re infringing on their freedom to express themselves and whatever they see fit… It’s their right in the Constitution to say what they want, use whatever means necessary so that’s why it’s kinda tricky when you say I’ll give you the free coverage but you can only use that coverage… I don’t think limiting them is the best way to do that. Participant C: I think that’s a fair point. But I feel like if you were to look at it… For example, C-SPAN. Very few people are actually going to spend their time watching that and like and see what Congress and what stuff happens there… If we were just to give these extra channels... For example, like Trump. Like there’s so much money that can move his political machine that it’s not going to matter if you’re going to give other candidates channels or not, because you’re not leveling the playing field.
Later in the discussion, the students come back to the discussion of limiting dominant candidates’ presence in the media. One solution someone offers is using public funds to finance

49
campaigns. Again, the same issue comes up again of whether limiting a candidates’ means to express their platform is an infringement of free speech under the First Amendment. In both instances that this disagreement arises, students recognize the merits of both sides of the issue and are unsure of how to ensure fairness for lesser known candidates with less campaign money and better known candidates with more campaign money. Exploring the drawbacks of limiting candidates’ airtime helped students understand the trade-offs of each side of the situation. The concerns of the opposing viewpoint helped students to clarify potential problems that could arise in the planning or implementation of the proposed policy. In some cases, students were able to immediately come up with solutions, but in other cases, it was clear to students that some sacrifices would have to be made, whether the policy was passed or not. Drawing from personal experiences Students readily drew from their personal experiences in order to imagine the effects of each policy proposal. For example, in an earlier excerpt, a student used his or her experience using the SAT website to imagine the potential traffic that could happen for online voting. Students also drew from their personal knowledge to imagine the impact on communities who would be most affected most by certain policy proposals. In the following excerpt, a student offers their thoughts about allowing green card holders to vote, which are influenced but not completely dictated by their family.
Participant E: I kinda feel that like even if we allowed them to vote, like, I feel like some people still wouldn’t – it still wouldn’t be enough to make a lot of people vote. I’m totally for allowing this, because my parents – it would give my parents the opportunity to vote. But I also feel like some people wouldn’t be as motivated to vote.
In this excerpt, the student creates a distinction between whether to support the proposal and the effectiveness of the proposal. On one hand, the student recognizes how allowing green card holders to vote would directly benefit their family, but when assessing the possible effectiveness of the proposal, the student is able to consider beyond their own family’s experience in order to recognize that while some people impacted by the proposal would exercise their right to vote, others would abstain. It is unclear what other experiences are working in tandem that tip the student to question the effectiveness of this proposal, but it is clear that this student is drawing upon experiences beyond the briefing materials that were provided in order to come to simultaneous beliefs on supporting the proposal but also questioning its effectiveness. In the next excerpt, a student explains how their views on felons has shaped their beliefs about allowing felons to vote after they have completed their sentences.
Participant F: Do you guys follow Humans of New York? Oh they did that whole jail thing. And that – I really enjoyed that. It totally changed my perspective on felons and their stories. And I think they should have the right to vote because I think that so many people are like wrongly accused or get mixed up in bad things or do it because it’s the only way to make money or something.

50
This student shares a piece of media that has allowed the student to learn more about the lives of felons. This example shows how one student uses information from the media to allow them to extrapolate beyond their direct experiences with the relevant community. These excerpts show that students brought into the discussions stories and experiences that were individual to them and beyond the common pool of knowledge provided in the briefing materials. The Deliberative Poll gave students the opportunity to listen to others’ experiences and use others’ stories in conjunction with the briefing materials and plenary sessions to arrive at more informed opinions. Exploring deeper questions Beyond talking about supporting or opposing policy proposals or the effectiveness of the proposals, the students also questioned the actual problem that each proposal wished to address and assessed how effective the proposal would be in targeting the problem. For example, in the case of compulsory voting, students had to consider why many voters weren’t turning out for elections in the first place, and whether penalties for not voting would be a system that they would agree with or think would be effective.
Participant G: I don’t agree with it kind of, because it’s kind of taking away people’s rights if they don’t want – if someone doesn’t want to vote, they don’t want to vote, and I don’t think the government should force them to. … Participant H: In this country, the people who aren’t going in the first place can’t afford to pay a fine if they don’t vote. The reason why they’re not voting is because they don’t have the legal aid and the extra pocket money to actually stick out on a day of work. So I feel it would be kind of ridiculous to implement it in this specific way. Participant I: I think if you’re going to force people to vote, you need to make it really easy for them to vote. Participant H: Yeah. Participant I: Like you can’t be like, oh you have to vote, and then they have to drive 30 miles or whatever.
In this conversation, students explore reasons why some people don’t vote. Participant I mentions that some people simply don’t want to vote, so part of the problem is lack of personal motivation. Participant J believes there are structural barriers that make voting for some groups of people less accessible. Realizing that there are these existing barriers prompted some participants to believe that increasing access to voting is a prerequisite to compulsory voting. When discussing ways to achieve a more informed electorate, many students kept coming back to the point that finding equal information on candidates can be extremely difficult when relying on the media for information. When discussing what they wanted to know about candidates, however, students differed in what was important to them.
Participant J: Look, we’re still being fed by the current media completely irrelevant information. I want to know about your policies for things like healthcare and foreign relations. Those are the things I want to know about. And I feel like it would be better if we put more focus and emphasis on that. For example, in the Democratic debate, there

51
were a lot of question about Hillary and her emails. That has no relations to any sort of actual policies or any sort of actions she might actually take if she was elected into office… Participant K: My only concern with that is that she did do something that was somewhat secretive. I believe when they asked her about it, she didn’t directly come out and say it. So it’s good that it is released to the public because then that kind of gives us an idea, this is who that person is.
In this conversation, two students talk about how they differ in what information on candidates they deem valuable. Their differences in opinion pose a problem when trying to consider the kind of information that a non-partisan civic group should collect to educate the public. It also complicates how candidates should be allowed to use free airtime – while Participant J may want candidates to strictly focus on policies, Participant K may prefer less strict requirements on airtime, since coverage on “scandals” may give the public information on the characters of the candidates they are considering. In general, discussing the nature of the current problems in the nation’s democracy – whether it be small voter turnout or frustrations with current media coverage of candidates and elections – helped students assess whether the suggested proposals would be able to adequately address these problems. It helped clarify additional measures that would need to supplement the proposals and the potential challenges that could arise from implementing them. Students had to decide for themselves whether these complications would be worth working through or whether they preferred an alternative course of action or the status quo. The role of deliberating and being informed The survey results show compelling evidence that the Summit Deliberative Poll successfully systematically influenced students’ opinions on a number of beliefs and policy proposals. This section has helped show some ways that the small group deliberations in particular helped participants come to more informed opinions. Because students were faced with opposing viewpoints, personal experiences that differed from their own, and considerations of the root problems that the proposals sought to address, students were able to encounter information and perspectives they may not have otherwise heard. In the discussions, students brought up their qualms about certain proposals and problems that could arise from implementing them. At times they were able to collectively find solutions on the spot; in other instances, they realized that the public’s wants could not all be satisfied, and there would have to be sacrifices. When explaining what they believed, students frequently brought up personal experiences outside of the briefing material. By sharing stories, students were able to learn from others and see past their own experiences. Students also explored the underlying problems that the proposals attempted to address. They realized that addressing problems like low participation and lack of informed opinions in the nation’s democracy require action beyond passing a few policies. The reason students were able to face opposing viewpoints and personal experiences that differed from their own was due to the randomization of the groups. Randomized small group deliberations are a key component of deliberative polling and deliberative democracy. Students were able to engage with a group that consisted of a representative sample of all perspectives at Summit. They discussed issues with people who were not necessarily like themselves. And by

52
being given the time and opportunity to discuss policy proposals, the students were able to explore values and problems that underlay the actual proposals themselves. In this way, the Summit Deliberative Poll was able to expose students to new information and perspectives and provide the space and time for them to develop more informed opinions on the discussed topics.

53
Note to Summit Public Schools We sincerely thank you all for your cooperation and help with the successful coordination of this
event! There was a lot of back and forth communication, logistical planning, and many other issues that we all had to figure out before the event, but it couldn't have been done with you all.
We hope that this experience was as valuable for you as it was for us and hope that we can cooperate in the future for similar events.

54
Appendix
A: Voting Pre Post Post-Pre Sig. 1. On a scale from 0 to 10, where 0 is completely unimportant, 10 is extremely important, and 5 is exactly in between, how important do you think each of the following is to being a good citizen? a. Voting in elections 8.087 7.948 -0.140 0.246
0-4 2.7% 9.8% 5 13.4% 9.2%
6-10 83.9% 81.1% # of "no opinion" answers 4 0
b. Discussing politics and political issues with others 6.740 7.263 0.523 0.008 0-4 14.7% 13.8%
5 19.3% 11.2% 6-10 66.0% 75.0%
# of "no opinion" answers 3 1 c. Being informed about politics and political issues 8.232 7.993 -0.238 0.124
0-4 3.3% 9.9% 5 8.0% 6.0%
6-10 88.7% 84.1% # of "no opinion" answers 2 2
2. How strongly would you oppose or favor each of the following? Oppose strongly is 1, Favor strongly is 5 a. Making election day a national holiday 4.058 4.026 -0.31 0.451
1-2 8.7% 10.6% 3 15.2% 21.9%
4-5 76.1% 65.6% # of "no opinion" answers 15 2
b. Allowing Election Day registration 4.033 4.123 0.090 0.465 1-2 4.1% 6.2%
3 22.3% 24.0% 4-5 73.6% 67.8%
# of "no opinion" answers 32 7 c. Allowing felons to vote after they have served their sentences 3.563 4.113 0.549 0.000
1-2 12.7% 6.0% 3 35.9% 20.5%
4-5 51.4% 72.9% # of "no opinion" answers 11 2
d. Allowing individuals to vote online 3.236 2.572 -0.664 0.000

55
1-2 35.8% 47.4% 3 18.9% 29.6%
4-5 45.3% 23.0% # of "no opinion" answers 5 1
e. Fining people who don't vote 1.826 2.307 0.480 0.000 1-2 75.0% 56.7%
3 15.3% 26.7% 4-5 9.7% 16.7%
# of "no opinion" answers 9 3 f. Bringing voting stations to workplaces 3.831 3.473 -0.358 0.000
1-2 11.3% 18.7% 3 17.6% 34.0%
4-5 71.1% 46.0% # of "no opinion" answers 11 3
g. Allowing legal residents who are not citizens to vote in national elections 3.843 4.073 0.230 0.225
1-2 11.2% 6.7% 3 26.9% 22.0%
4-5 61.9% 70.7% # of "no opinion" answers 19 3
h. Allowing individuals who receive Deferred Action for Childhood Arrivals (DACA) to vote 3.918 4.285 0.367 0.008
1-2 7.1% 5.8% 3 27.1% 21.9%
4-5 65.9% 67.2% # of "no opinion" answers 68 16
i. Abolishing voter ID laws 3.260 3.694 0.434 0.117 1-2 24.0% 16.4%
3 38.5% 29.9% 4-5 37.5% 50.8%
# of "no opinion" answers 57 19 3. And on a scale from 0 to 10, where 0 is completely ineffective, 10 is completely effective, and 5 is exactly in-between, how effective do you think each of the following measures would be in increasing voter participation? a. Making election day a national holiday
7.293
7.013
-0.279 0.451 0-4 6.8% 15.3%
5 17.0% 15.3% 6-10 76.2% 69.3%
# of "no opinion" answers 6 3 b. Allowing Election Day registration 7.323 7.355 0.032 0.500
0-4 3.9% 8.5% 5 16.2% 16.3%

56
6-10 80.0% 75.2% # of "no opinion" answers 23 12
c. Allowing felons to vote after they have served their sentences 6.267 6.636 0.369 0.000
0-4 14.8% 13.3% 5 23.7% 18.5%
6-10 61.5% 68.2% # of "no opinion" answers 18 2
d. Allowing individuals to vote online 7.427 5.740 -1.144 0.000 0-4 11.3% 31.3%
5 12.7% 16.7% 6-10 76.0% 52.0%
# of "no opinion" answers 3 3 e. Fining people who don't vote 5.664 5.547 -0.117 0.000
0-4 31.5% 34.5% 5 14.7% 10.8%
6-10 53.9% 54.7% # of "no opinion" answers 10 5
f. Bringing voting stations to workplaces 7.614 6.470 -1.144 0.000 0-4 5.5% 18.1%
5 9.0% 15.4% 6-10 85.5% 66.4%
# of "no opinion" answers 8 4 g. Allowing legal residents who are not citizens to vote in national elections 7.159 7.213 0.054 0.020
0-4 8.0% 10.0% 5 12.3% 14.0%
6-10 79.7% 76.0% # of "no opinion" answers 15 3
h. Allowing individuals who receive Deferred Action for Childhood Arrivals (DACA) to vote 7.140 7.179 0.040 0.009
0-4 5.8% 10.5% 5 23.3% 17.2%
6-10 70.9% 72.4% # of "no opinion" answers 67 19
i. Abolishing voter ID laws 6.327 6.652 0.325 0.000 0-4 19.2% 18.8%
5 24.0% 18.1% 6-10 56.7% 63.0%
# of "no opinion" answers 49 15 4. Please indicate how strongly you disagree or agree with each of the following statements. Strongly disagree is 1, Strongly agree is 5 a. The U.S. celebrates too many national holidays 2.165 2.642 0.477 0.202

57
1-2 68.6% 51.1% 3 24.0% 30.7%
4-5 7.4% 15.3% # of "no opinion" answers 32 16
b. Felons have shown that they are incapable of being responsible citizens 2.532 2.523 -0.090 0.500
1-2 52.5% 55.7% 3 29.5% 24.8%
4-5 18.0% 18.1% # of "no opinion" answers 14 4
c. Electronically recorded votes would not be as reliable as paper ballots. 3.104 3.459 0.356 0.084
1-2 28.2% 26.4% 3 31.1% 23.7%
4-5 40.7% 48.0% # of "no opinion" answers 18 5
d. Only individuals with U.S. citizenship should be allowed to vote 2.500 2.208 -0.292 0.000
1-2 50.7% 62.5% 3 27.9% 24.3%
4-5 21.4% 12.5% # of "no opinion" answers 13 9
e. Voter ID laws are necessary to address widespread voter fraud 3.214 2.683 -0.530 0.280
1-2 25.6% 45.3% 3 28.2% 30.9%
4-5 46.2% 20.9% # of "no opinion" answers 36 14
f. Forcing people to vote is contradictory to personal liberty 3.943 3.594 -0.349 0.000
1-2 9.9% 19.6% 3 18.4% 25.2%
4-5 71.6% 54.6% # of "no opinion" answers 12 10