Embed Size (px)
Citation preview
HOP! research project
Macro-economic impact of high oil price in Europe
Deliverable 2
High Oil Prices: Scenarios assumptions and
models interface
Seville, November 2007
Project co-funded by the European Commission – DG Research 6th Research Framework Programme
HOP! research project Macro-economic impact of high oil price in Europe
HOP! Macro-economic impact of high oil price in Europe
Contract n.: SSP-CT-2006-044164
Duration: 01.01.2007 – 30.06.2008
European Commission – DG Research – 6th Research Framework Programme
Partners: TRT - Trasporti e Territorio SRL, Milan, Italy (coordinator)
ISI - Fraunhofer Institute Systems and Innovation Research, Karlsruhe, Germany
IPTS - Institute for Prospective Technological Studies, DG-JRC, Seville, Spain
Website: www.hop-project.eu
Deliverable n.: 1
Title: Scenarios assumptions and models interface
Authors: Burkhard Schade JRC IPTS, Giuseppe Casamassima TRT, Davide Fiorello TRT, Angelo Martino TRT, Wolfgang Schade ISI, Rainer Walz ISI
Version: 1.0
Date: November 2007
This document should be referenced as:
Schade B.; Casamassima, G.; Fiorello, D.; Martino, A.; Schade W.; Walz, R. (2007): High Oil Prices: Scenarios assumptions and model interfaces. Deliverable 2 of HOP! (Macro-economic impact of high oil price in Europe). Funded by European Commission 6th RTD Programme. Seville, Spain.
Status: Restricted
Distribution: HOP! partners, European Commission
Availability: Public (only once status above is accepted)
Filename: D2 HOP!_finaltext-v12.doc
Quality control: Tobias Wiesenthal

HOP! research project Macro-economic impact of high oil price in Europe
HOP! research project Macro-economic impact of high oil price in Europe
D2 High Oil Prices: Scenarios assumptions and model interfaces I
Executive Summary
The HOP! project aims at evaluating the "Macro-economic impact of high oil price in Europe", . It is co-funded by the European Commission DG Research and is undertaken by three partners, with TRT Trasporti e Territorio (TRT) taking the lead and collaborating with Fraunhofer Institute Systems and Innovation Research (ISI) and the Institute for Prospective Technological Studies (IPTS) of the European Commission DG JRC.
The project will provide quantitative estimates of impacts of high oil prices on the EU-27 economy. This analysis is based on an integrated modelling approach that combines the POLES model for the assessment of trends in worldwide energy supply and demand under various assumptions on oil prices, and the ASTRA model, which will be used to estimate the reactions of all economic sectors to high oil prices in the EU-27. The time horizon of the assessment is 2050.
The objective of WP2 is to define the type of scenarios that will then be assessed by the models, and to develop the model interfaces. The set of scenarios shall be designed in a way that allows investigating the relationships between high-energy prices and consequences on the macroeconomic variables such as GDP and employment. Those HOP! scenarios (scenarios with high oil prices) will be compared to the baseline scenario. These are described in more detail in the following.
The Project Baseline
The baseline scenario serves as projection with a moderate oil price which will later-on be used as a reference to which the scenarios with high oil prices are compared to.
The baseline of the HOP! project refers mainly to the baseline scenario developed within TRIAS project (Krail et al., 2007). The baseline is not necessarily the most likely or the most probable development, but rather serves as a projection with more optimistic assumptions on oil resources which lead to a moderate increase of oil prices. Such slow increase allows a gradual adaptation of actors in economy and industry.
Energy Supply in the baseline
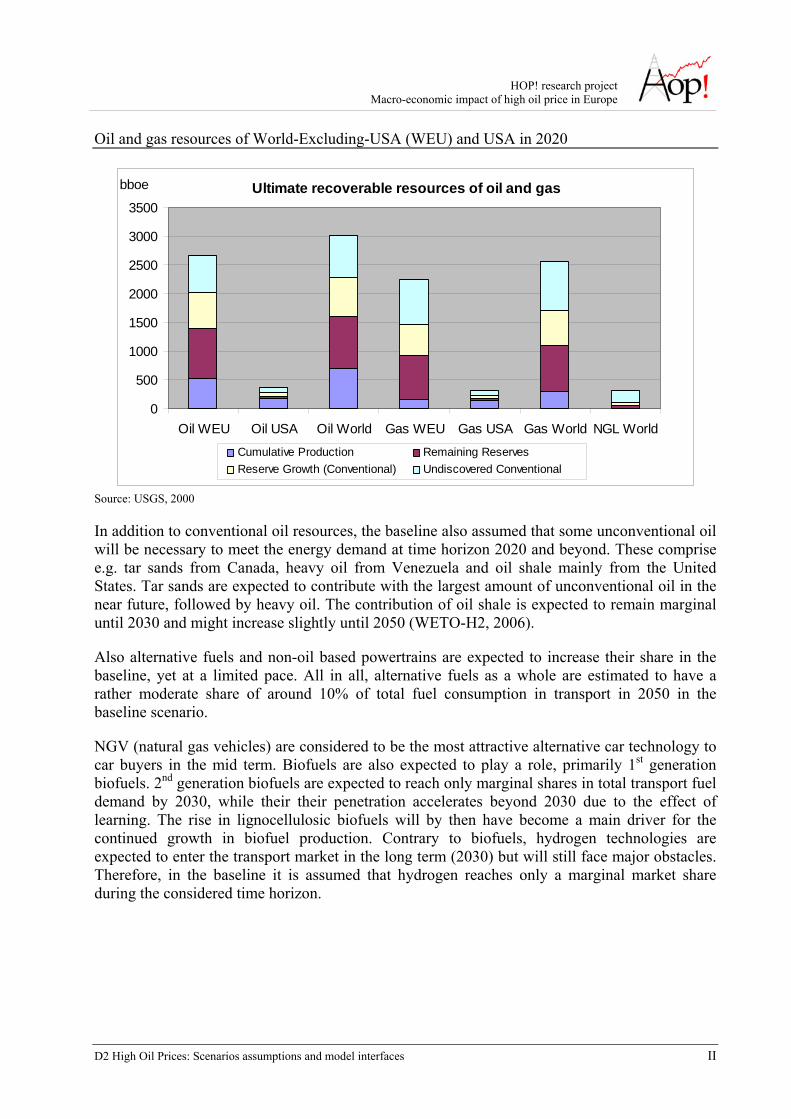
In the baseline, the level of conventional oil resources is based on the estimation of USGS 2000 (USGS, 2000), which estimates an amount of ultimate recoverable resources of oil, gas and natural gas liquefied (NGL) amounting to about 3000, 2500 and respectively 300 bboe in the year 2020. Nearly half of such recoverable resources consists of reserve growth and undiscovered resources.
HOP! research project Macro-economic impact of high oil price in Europe
D2 High Oil Prices: Scenarios assumptions and model interfaces II
Oil and gas resources of World-Excluding-USA (WEU) and USA in 2020
Ultimate recoverable resources of oil and gas
0
500
1000
1500
2000
2500
3000
3500
Oil WEU Oil USA Oil World Gas WEU Gas USA Gas World NGL World
bboe
Cumulative Production Remaining ReservesReserve Growth (Conventional) Undiscovered Conventional
Source: USGS, 2000
In addition to conventional oil resources, the baseline also assumed that some unconventional oil will be necessary to meet the energy demand at time horizon 2020 and beyond. These comprise e.g. tar sands from Canada, heavy oil from Venezuela and oil shale mainly from the United States. Tar sands are expected to contribute with the largest amount of unconventional oil in the near future, followed by heavy oil. The contribution of oil shale is expected to remain marginal until 2030 and might increase slightly until 2050 (WETO-H2, 2006).
Also alternative fuels and non-oil based powertrains are expected to increase their share in the baseline, yet at a limited pace. All in all, alternative fuels as a whole are estimated to have a rather moderate share of around 10% of total fuel consumption in transport in 2050 in the baseline scenario.
NGV (natural gas vehicles) are considered to be the most attractive alternative car technology to car buyers in the mid term. Biofuels are also expected to play a role, primarily 1st generation biofuels. 2nd generation biofuels are expected to reach only marginal shares in total transport fuel demand by 2030, while their their penetration accelerates beyond 2030 due to the effect of learning. The rise in lignocellulosic biofuels will by then have become a main driver for the continued growth in biofuel production. Contrary to biofuels, hydrogen technologies are expected to enter the transport market in the long term (2030) but will still face major obstacles. Therefore, in the baseline it is assumed that hydrogen reaches only a marginal market share during the considered time horizon.
HOP! research project Macro-economic impact of high oil price in Europe
D2 High Oil Prices: Scenarios assumptions and model interfaces III
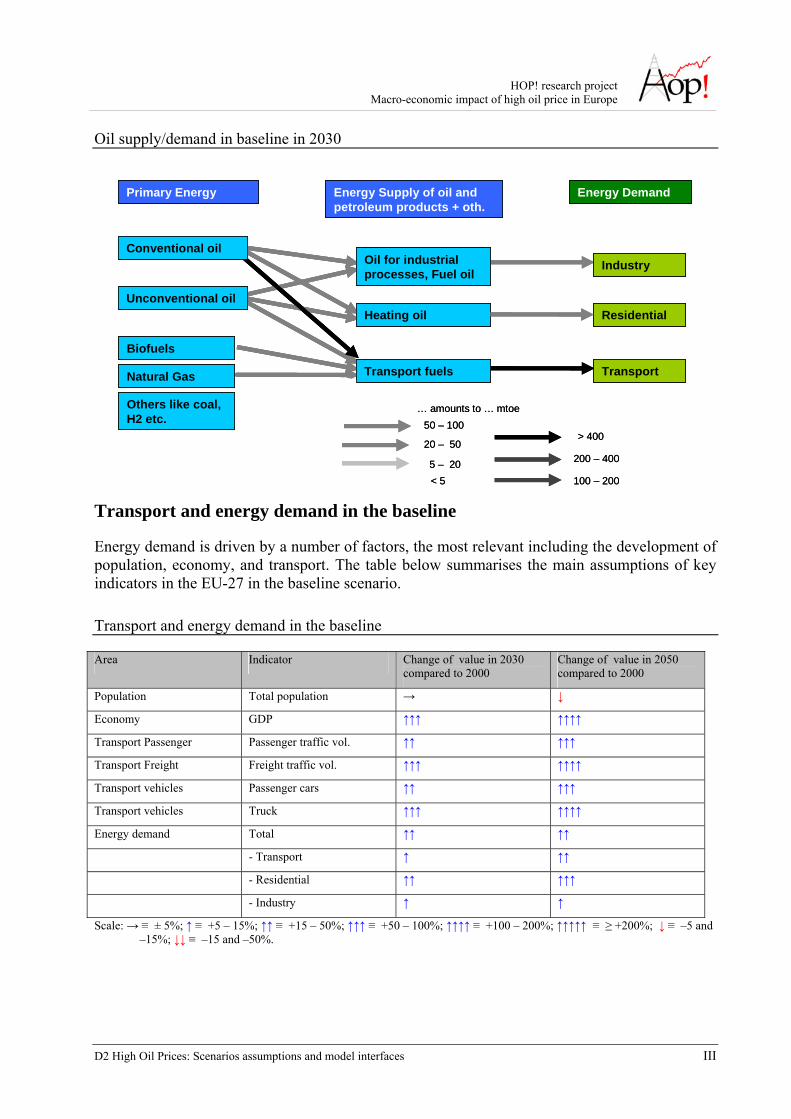
Oil supply/demand in baseline in 2030
20 – 50
5 – 20< 5
50 – 100
100 – 200
200 – 400
> 400
… amounts to … mtoe
20 – 50
5 – 20< 5
50 – 100
100 – 200
200 – 400
> 400
… amounts to … mtoe
Transport fuels
Heating oil
Oil for industrial processes, Fuel oil
Transport
Residential
Industry
Primary Energy Energy Supply of oil and petroleum products + oth.
Energy Demand
Biofuels
Natural Gas
Others like coal, H2 etc.
Conventional oil
Unconventional oil
Transport fuels
Heating oil
Oil for industrial processes, Fuel oil
Transport
Residential
Industry
Primary Energy Energy Supply of oil and petroleum products + oth.
Energy Demand
Biofuels
Natural Gas
Others like coal, H2 etc.
Conventional oil
Unconventional oil
Transport and energy demand in the baseline
Energy demand is driven by a number of factors, the most relevant including the development of population, economy, and transport. The table below summarises the main assumptions of key indicators in the EU-27 in the baseline scenario.
Transport and energy demand in the baseline
Area Indicator Change of value in 2030 compared to 2000
Change of value in 2050 compared to 2000
Population Total population → ↓
Economy GDP ↑↑↑ ↑↑↑↑
Transport Passenger Passenger traffic vol. ↑↑ ↑↑↑
Transport Freight Freight traffic vol. ↑↑↑ ↑↑↑↑
Transport vehicles Passenger cars ↑↑ ↑↑↑
Transport vehicles Truck ↑↑↑ ↑↑↑↑
Energy demand Total ↑↑ ↑↑
- Transport ↑ ↑↑
- Residential ↑↑ ↑↑↑
- Industry ↑ ↑
Scale: → ≡ ± 5%; ↑ ≡ +5 – 15%; ↑↑ ≡ +15 – 50%; ↑↑↑ ≡ +50 – 100%; ↑↑↑↑ ≡ +100 – 200%; ↑↑↑↑↑ ≡ ≥ +200%; ↓ ≡ –5 and –15%; ↓↓ ≡ –15 and –50%.
HOP! research project Macro-economic impact of high oil price in Europe
D2 High Oil Prices: Scenarios assumptions and model interfaces IV
The development of population in EU Member States is expected to remain stable until 2030 and to decline afterwards. World population is expected to grow at a decreasing rate to 8.9 billions in 2050. After 2030, the population in several regions of the world is decreasing – including China.
The assumed development of GDP in the EU is taken from the European project ADAM (ADAM, 2007). GDP in Europe would nearly triple between 2000 and 2050, which is equivalent to an annual growth rate just above 2 %. GDP outside the EUis based on the projections of WETO-H2 (WETO-H2, 2006): the rate of economic growth in industrialised regions converges to less than 2% per year in the very long-run with growth in Asian emerging economies significantly falling after 2010 and significant acceleration in Africa and the Middle East. Exports and investments are expected to increase significantly stronger than GDP in Europe, reaching a quadrupling.
On the transport side, an increment of personal mobility is assumed throughout the EU. Air is expected to grow more than any other mode, doubling the total number of passengers-km at horizon of the year 2050. A high growth rate is also expected for private cars, while for rail a moderate growth is assumed. Still for Europe the baseline projects that in the year 2050 the amount of tonnes-km will be tripled with respect to the year 2000, with road transport growing faster than any other mode.
Despite stabilisation of the population, the car fleet continues to grow significantly. One major reason is the catching- up of the new EU member states joining the EU in the years 2004 and 2007 in terms of car-ownership. Innovative new diesel technologies led to an improved efficiency of diesel cars and are making them more and more attractive in the context of rising fuel prices. The number of diesel cars is assumed to reach the level of gasoline cars. Biofuel driven vehicles and natural gas vehicles would reach a market share between 5 and 15% around 2030.
Given these trends, primary energy consumption in Europe is expected to increase by around 40% between 2000 and 2050 (WETO-H2, 2006). It is assumed that oil and gas demand will increase until 2020 and will then decrease due to higher prices. Coal use and energy consumption that stem from renewables and nuclear energy are expected to rise instead. Also, the composition of final energy demand by sector is assumed to change: while for the residential sector (including service and agriculture sectors) a growth above 50% is expected between 2000 and 2050 (mainly driven by the growing need of electricity in houses), the increase in the transport and the industrial sector might be much smaller as the impact of increasing transport performance is limited by improvements in fuel efficiency.
HOP! Scenarios
The HOP! scenarios are used to the explore the impact of high oil price. However, the oil price is not directly an exogenous assumption, but it is obtained as a result of other hypotheses concerning energy supply, technologies etc. Tests with the parameters of the model will be carried out in order to ensure that adequately high oil prices are simulated in each scenario.
HOP! research project Macro-economic impact of high oil price in Europe
D2 High Oil Prices: Scenarios assumptions and model interfaces V
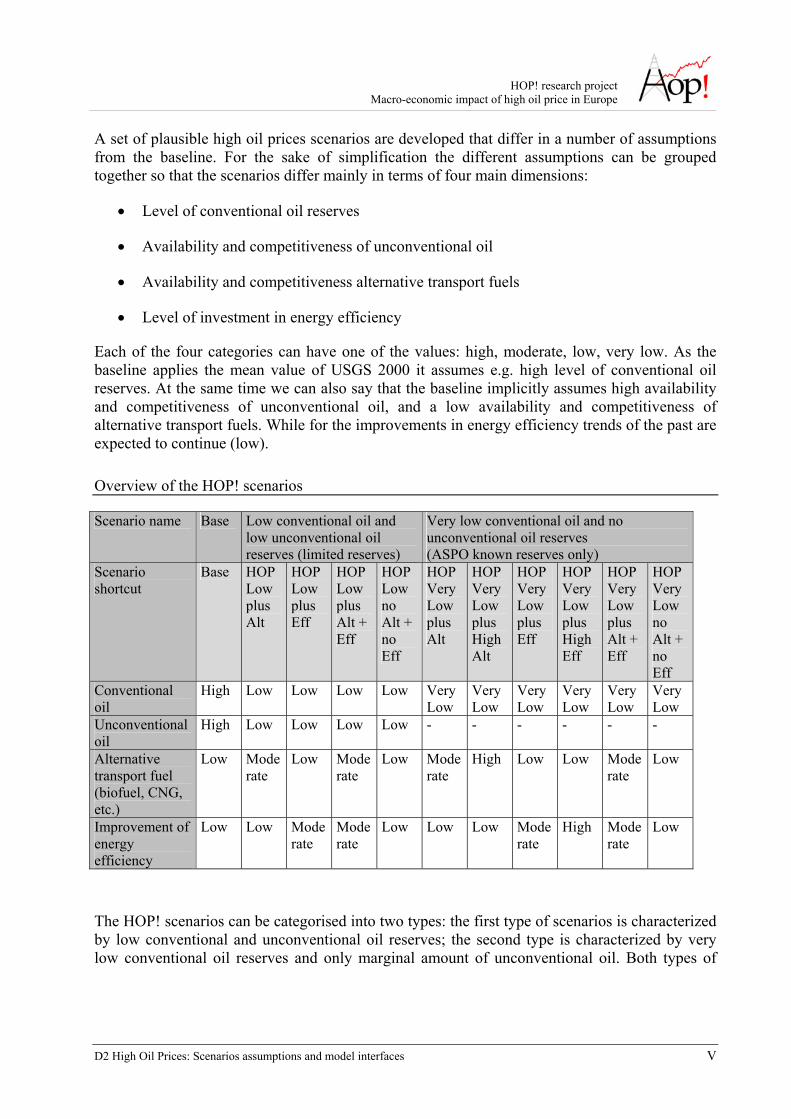
A set of plausible high oil prices scenarios are developed that differ in a number of assumptions from the baseline. For the sake of simplification the different assumptions can be grouped together so that the scenarios differ mainly in terms of four main dimensions:
• Level of conventional oil reserves
• Availability and competitiveness of unconventional oil
• Availability and competitiveness alternative transport fuels
• Level of investment in energy efficiency
Each of the four categories can have one of the values: high, moderate, low, very low. As the baseline applies the mean value of USGS 2000 it assumes e.g. high level of conventional oil reserves. At the same time we can also say that the baseline implicitly assumes high availability and competitiveness of unconventional oil, and a low availability and competitiveness of alternative transport fuels. While for the improvements in energy efficiency trends of the past are expected to continue (low).
Overview of the HOP! scenarios
Scenario name Base Low conventional oil and low unconventional oil reserves (limited reserves)
Very low conventional oil and no unconventional oil reserves (ASPO known reserves only)
Scenario shortcut
Base HOP Low plus Alt
HOP Low plus Eff
HOP Low plus Alt + Eff
HOP Low no Alt + no Eff
HOP Very Low plus Alt
HOP Very Low plus High Alt
HOP Very Low plus Eff
HOP Very Low plus High Eff
HOP Very Low plus Alt + Eff
HOP Very Low no Alt + no Eff
Conventional oil
High Low Low Low Low Very Low
Very Low
Very Low
Very Low
Very Low
Very Low
Unconventional oil
High Low Low Low
Low
- - - - - -
Alternative transport fuel (biofuel, CNG, etc.)
Low Moderate
Low Moderate
Low Moderate
High Low Low Moderate
Low
Improvement of energy efficiency
Low Low Moderate
Moderate
Low Low Low Moderate
High Moderate
Low
The HOP! scenarios can be categorised into two types: the first type of scenarios is characterized by low conventional and unconventional oil reserves; the second type is characterized by very low conventional oil reserves and only marginal amount of unconventional oil. Both types of
HOP! research project Macro-economic impact of high oil price in Europe
D2 High Oil Prices: Scenarios assumptions and model interfaces VI
scenarios are then further split into alternative assumptions concerning the mechanisms that can balance energy supply and demand, i.e.:
• Investments leading to a higher availability and competitiveness of alternative transport fuels (moderate or high),
• Investments leading to high improvements of energy efficiency (moderate or high),
• Both types of investments or
• No investments.
Scenarios with low conventional and unconventional oil reserves
In the HOP! scenarios with low conventional oil reserves we assume that the level of oil reserves are too low to meet the demand of the baseline. This can be motivated by different reasons, e.g. the improvements in exploiting technology are not sufficient to increase the reserve growth as expected or that the amount of oil reserves which was reported by oil producing countries is overestimated and the real oil reserves are lower or the reserves of unconventional oil are low due to an insufficient decline of production costs. Four scenarios belong to this category:
Low conventional oil reserves plus alternative transport fuels (HOP Low plus Alt): investments will cause a higher competitiveness of alternative transport fuels. The improved market position serves to fulfil the remaining gap between energy demand and energy supply. The amount of biofuels and natural gas to be produced as transport fuels would double compared to the baseline.
Low conventional oil reserves plus improvements in energy efficiency (HOP Low plus Eff): investments will increase the energy efficiency in equipments and machinery. The lowered energy demand offsets the gap between energy demand and energy supply.
Low conventional oil reserves plus alternative transport fuels and improvements in energy efficiency (HOP Low plus Alt + Eff): investments will both: increase of energy efficiency and the availability and competitiveness of alternative transport fuels.
Low conventional oil reserves without alternative transport fuels and without improvements in energy efficiency (HOP Low no Alt + no Eff): neither an increase of energy efficiency nor the availability and competitiveness of alternative transport fuels is assumed.
In all scenarios, the investments spent on alternative transport fuels or energy efficiency will lead in a decrease of investments in other economic sectors. Alternatively it could also lead to an increase of governmental spending and, therefore, in governmental debts.
HOP! research project Macro-economic impact of high oil price in Europe
D2 High Oil Prices: Scenarios assumptions and model interfaces VII
In the HOP! scenarios with very low conventional oil reserves we assume that due to several reasons the level of oil reserves is very low. Basically, oil reserves are expected to be at the level indicated by the Association for the Study of Peak Oil&Gas (ASPO). Six scenarios belong to this category:
Very low conventional oil reserves plus alternative transport fuels (HOP Very Low plus Alt): two variants of this scenario are considered, in one the competitiveness of alternative fuels is very high. In both variants, at different extents, investments will cause a higher competitiveness of alternative transport fuels. With respect to biofuels, this is assumed to be very similar as in previous groups of scenarios, but in the case of natural gas it differs: it is considered that the availability of natural gas is not completely independent from the availability of oil reserves, hence either the availability or the competitiveness of gas will be limited. In the scenario with high investments in alternative transport fuels the amount of biofuels and of other alternative transport fuels would be more than three times as high compared to the baseline.Very low conventional oil reserves plus improvements in energy efficiency (HOP Very Low plus Eff): investments will increase the energy efficiency in equipments and machinery. The lowered energy demand offsets the gap between energy demand and energy supply. Two variants of this scenario are considered, in one the energy efficiency is increased to a very high level.
Very low conventional oil reserves plus alternative transport fuels and improvements in energy efficiency (HOP Very Low plus Alt + Eff): investments will increase both energy efficiency and the availability and competitiveness of alternative transport fuels.
Very low conventional oil reserves, no alternative transport fuels and no improvements in energy efficiency (HOP Very Low no Alt + no Eff): it is the worst case scenario, where it is assumed that there will be neither investments in the increase of energy efficiency nor in the availability and competitiveness of alternative transport fuels. The energy demand of the sectors will therefore remain the same. In this case, assuming that transport fuels will be mainly produced by the remaining conventional oil, supply for heating oil and for oil in industrial processes could not be sufficient to fulfil the needs of the demand so that oil price could be forced to dramatically high prices.
The modelling approach
The scenarios will be simulated using two models: POLES and ASTRA. The POLES model is a partial equilibrium energy model that can be used for the development of long-term (2050) energy supply and demand scenarios for the different regions of the world. The dynamics of the model correspond to a hierarchical system of interconnected modules and articulates three level of analysis:
• international energy markets;
• regional energy balances;
HOP! research project Macro-economic impact of high oil price in Europe
D2 High Oil Prices: Scenarios assumptions and model interfaces VIII
• national energy demand, new technologies, electricity production, primary energy production systems and CO2 sector emissions.
The main exogenous variables are the population and GDP (which are derived iteratively with ASTRA, see below), for each country / region, the price of energy being endogenised in the international energy market modules. The dynamics of the model corresponds to a recursive simulation process, common to most applied models of the international energy markets, in which energy demand and supply in each national / regional module respond with different lag structures to international prices variations in the preceding periods. In each module, behavioural equations take into account the combination of price effects and of techno-economic constraints, time lags or trends.
The ASTRA System Dynamics model has been developed since 1997 with the purpose of strategic assessment of policies in an integrated way i.e. by considering the feedback loops between the transport system and the economic system. The ASTRA model consists of nine modules linked together in manifold ways.
Given the strategic nature of ASTRA, the treatment of the economy is essentially at a macro level. However, some ‘micro-economic’ concepts are detailed with regard to the role of transport in the interaction with the economy. For instance, expenditures for fuel, revenues from fuel taxes and value-added-tax (VAT) on fuel consumption are transferred to the macroeconomics module and provide input to the economic sectors producing fuel products and to the government model. On the transport side, ASTRA provide a description of the ‘supply-side’ in terms of infrastructures and of vehicle technologies, while transport demand is described in terms of aggregated OD-trip matrices and mode split. Additional modules use input from the transport and the economic variables in order to compute environmental effects (emissions from transport, accidents) and other social indicators.
In HOP!, the quantitative analysis of the scenarios requires an integrated use of both POLES and ASTRA. In brief, the two models will be linked as follows:
- ASTRA receives from POLES: fuel prices, the value of investments for developing alternative energy sources and the trade of fossil fuels;
- POLES receives from ASTRA: GDP development, energy demand for the transport sector and the economic activity per sector.
Impact of High Oil Prices on the transport and energy sectors
Given the purpose of HOP! and the features of the modelling tools, impacts of high oil prices can be separated into effects on the energy system, the transport system and the economic system. It is important to take into account that the changes taking place in one system, affects the other system as well. For instance, if alternative transport fuels enter the market to a large extent, the composition of the vehicle fleet and the transport costs of different transport modes are affected too. Then, the increase of transport costs have an impact on the production costs and, hence, on
HOP! research project Macro-economic impact of high oil price in Europe
D2 High Oil Prices: Scenarios assumptions and model interfaces IX
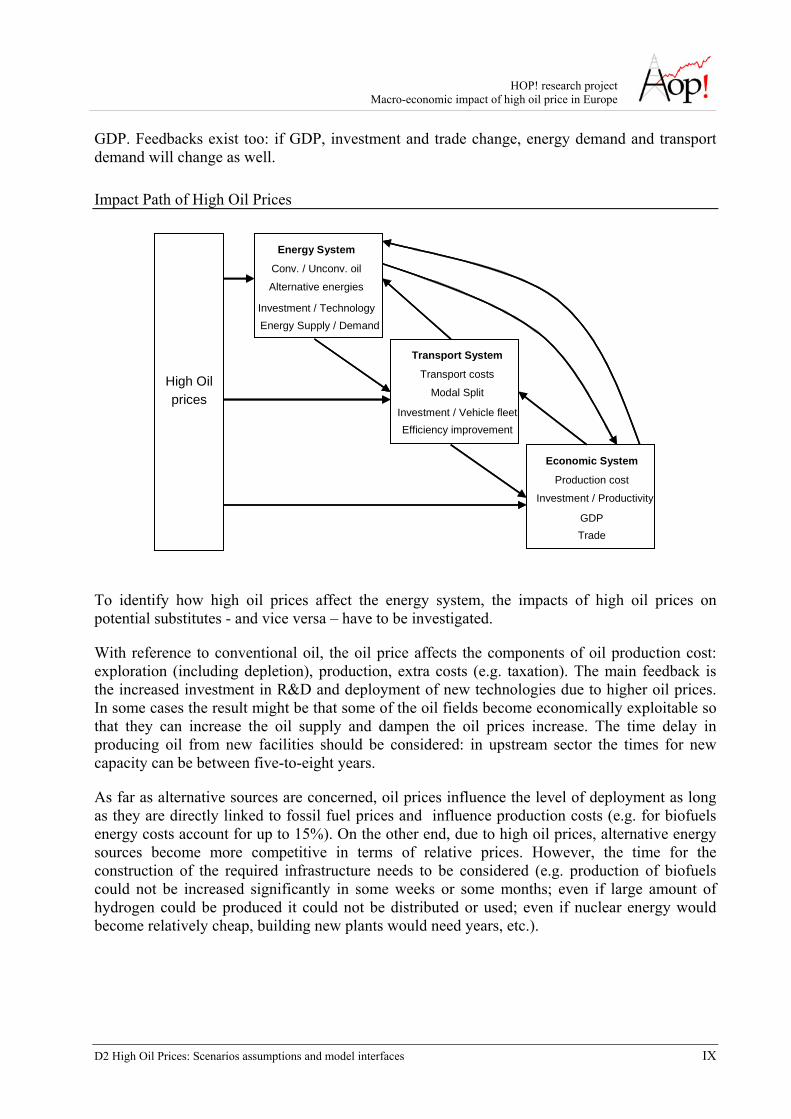
GDP. Feedbacks exist too: if GDP, investment and trade change, energy demand and transport demand will change as well.
Impact Path of High Oil Prices
High Oil prices
Transport System
Transport costs
Modal Split
Efficiency improvementInvestment / Vehicle fleet
Energy System
Conv. / Unconv. oil
Alternative energies
Energy Supply / DemandInvestment / Technology
Economic System
Production cost
Investment / Productivity
TradeGDP
High Oil prices
Transport System
Transport costs
Modal Split
Efficiency improvementInvestment / Vehicle fleet
Energy System
Conv. / Unconv. oil
Alternative energies
Energy Supply / DemandInvestment / Technology
Economic System
Production cost
Investment / Productivity
TradeGDP
To identify how high oil prices affect the energy system, the impacts of high oil prices on potential substitutes - and vice versa – have to be investigated.
With reference to conventional oil, the oil price affects the components of oil production cost: exploration (including depletion), production, extra costs (e.g. taxation). The main feedback is the increased investment in R&D and deployment of new technologies due to higher oil prices. In some cases the result might be that some of the oil fields become economically exploitable so that they can increase the oil supply and dampen the oil prices increase. The time delay in producing oil from new facilities should be considered: in upstream sector the times for new capacity can be between five-to-eight years.
As far as alternative sources are concerned, oil prices influence the level of deployment as long as they are directly linked to fossil fuel prices and influence production costs (e.g. for biofuels energy costs account for up to 15%). On the other end, due to high oil prices, alternative energy sources become more competitive in terms of relative prices. However, the time for the construction of the required infrastructure needs to be considered (e.g. production of biofuels could not be increased significantly in some weeks or some months; even if large amount of hydrogen could be produced it could not be distributed or used; even if nuclear energy would become relatively cheap, building new plants would need years, etc.).
HOP! research project Macro-economic impact of high oil price in Europe
D2 High Oil Prices: Scenarios assumptions and model interfaces X
Summarising the impacts of high oil prices on the energy system, the following effects can be assumed:
• R&D investment in technology to discover and to exploit conventional and unconventional oil fields will rise;
• Energy costs of alternative transport fuels will rise due to their need of energy as input in the production;
• Alternative energy sources can theoretically enter the market as they become increasingly competitive in terms of price;
• Investments and time are needed to actually produce, distribute and use alternative energy;
• The increase of alternative transport fuels might lower oil demand and, therefore, will lower the exploitation of oil reserves.
• The increasing energy price will initiate additional energy efficiency investments, therefore lowering the overall demand.
On the transport side, the primary impact expected from the increment of the oil price is the growth of operating costs of all modes of transport. Consequently, also user costs (fares) are expected to be increased. The impact would be different across the various modes depending on three main elements: the relevance of oil price on the cost of the energy used for the transport mode, the relative weight of the energy cost on total operating cost of the mode and the relevance of the labour cost and the labour market conditions. Summing up, it can be expected that the increment of the transport costs hits the modes in a diverse extent:
• Private cars would probably become quite more expensive. Motorcycles cost would also increase significantly in absolute terms, even though in comparison to private cars they would become more competitive.
• Public road transport should probably adequate tariffs as well to cover the increasing production costs, but the cost of using a bus would probably rise less than car’s cost. The impact should be even lower for tramways, rail, metro, etc. especially in those countries where the production of electric power is not heavily dependent on oil (as it is the case in most EU Member States).
• Air tariffs would be probably affected in some way, even if the user price structure in the air market is complex and often poorly linked to operating costs. However, on average the increment of tariffs would be unavoidable and low cost airline services could have some more problems than conventional ones.
• On the freight modes side, trucks cost would be increased substantially while for other modes the impact would be probably low.
HOP! research project Macro-economic impact of high oil price in Europe
D2 High Oil Prices: Scenarios assumptions and model interfaces XI
In turn, the increment of transport costs should have a number of secondary effects, namely:
a) Reduction of the personal motorized mobility;
b) Pressure for reducing mobility of goods;
c) Mode shift towards less expensive modes;
d) Pressure on organising transport more efficiently;
e) Pressure on developing more efficient transport means;
f) Incentives for urban and regional planning to become less transport-intensive
Impact of High Oil Prices on the economy
Impacts of high oil prices on the economy are also manifold and of different nature. The obvious direct impact of high oil prices is that either energy consumption, consumer goods and services become more expensive as nearly all of them incorporate fossil energy, such that consumers have less money to spent on other consumer goods and services, or that value added of companies is reduced because energy constitutes an intermediate input to them and when they could not pass on price increases of these inputs to their consumers their value-added (the difference between the market price of their goods and their intermediate inputs) is reduced. However, there exist also a number of compensating mechanisms, which could even lead to a better economic performance with higher oil prices then with low oil prices, such that the final impact of high oil prices on the economy could be in a range from negative to positive results and can not be easily foreseen.
The traditional line of arguments about the economic impacts of high oil prices argues that "Higher oil prices lead to inflation, increased input costs, reduced non-oil demand and lower investment in net oil-importing countries" and "Overall, an oil-price increase leads to a transfer of income from [oil] importing to exporting countries through a shift in the terms of trade" as formulated by the IEA (2004) and supported by other analyses (Stewart, 1990, Fenton 2004, Arnold et al. 2007). The definite final outcome should be a reduction of GDP of the net oil importing countries.
The alternative point of view is not as well-elaborated as the traditional point of view. This is natural as to some extent it depends on circumstances that are only prevailing in the most recent years, but not during earlier periods of high oil prices, such that the potential for direct empirical findings is quite limited. The alternative point of view would not neglect the traditional thinking i.e. of course higher oil prices increase prices of goods and services as well as imports from oil exporting countries in the EU. But these influences have been diminished since the oil crises of the 1970ies and 1980ies due to i.e. an overall more stable economy and, on the other hand, compensating mechanisms have becoming stronger. Examples of such compensating mechanisms are investments into new technology (e.g. renewables, biofuels), investments into
HOP! research project Macro-economic impact of high oil price in Europe
D2 High Oil Prices: Scenarios assumptions and model interfaces XII
research and manufacturing of new technologies, first mover advantages if EU would develop new (efficiency) technology fastest (e.g. fuel cells, batteries, hydrogen technologies), if process technologies are made more efficient this could also have positive productivity effects, changes of trade flows (e.g. energy resources, technology), change of private consumption in non-transport and energy sectors (budget constraint).
It should be taken into account that a positive impact of investment is dependent on their timing. Starting too early with the investment in alternatives would become very costly and could favour the use of premature technologies, while mitigating too late, oil prices would become extremely high and have severe consequences for the economy.
The compensating mechanisms will more likely be working provided that a favourable environment exists. Currently the prevailing paradigm consists, as far as EU is concerned, of relative economic growth, technological innovation, as sustainable as possible development and peace. Starting from these relatively positive conditions, alternative developments could become reality, if we foresee changes of the political paradigm of European and Global policy-making.
One possibility is a paradigm that abandons the philosophy of "more is better" i.e. more GDP is better, more monetary income is better, more energy use is better, more tkm or pkm are better. With a stagnating GDP and continuing the improvement of energy intensity we could reduce energy use faster and hence would become faster less dependent from fossil fuel imports, which in turn would lead to less impacts of high oil prices. However, we would expect that this paradigm has some potential to become reality in the very long-term, whereas for the years to come it would be quite unrealistic as, within the dominating economic and politics framework, it does not bear the potential to fund the innovations and investments required to shift the energy and transport system towards a highly efficient non-oil dependent system.
Instead, in an alternative paradigm the choice could be to strengthen the existing egoistic behaviours. Global players would instead of investing in efficiency and alternative energy technologies "invest" more than today in wars or at least in installing governments in oil (and other) resource rich countries to increase their resource base on the expense of other countries. This would for an intermediate period keep their resource base on a level, which might dampen the price increase of oil in their countries, and which reduces the need for innovation and increase of energy efficiency. In the long-term, the outcome of such a policy should be an economy with less innovations and lower productivity growth than for instance compared with the "Growth, Innovation and Peace" paradigm. We would argue that a shift to this paradigm is not very probable because the results would be rather negative on global level, though one has to admit that history shows that this paradigm has been followed in some cases.
HOP! research project Macro-economic impact of high oil price in Europe
D2 High Oil Prices: Scenarios assumptions and model interfaces XIII
Outlook
This overview is made to prepare the ground for the later on model-based analysis of impacts of the high oil prices in HOP! In that sense, these conclusions should be treated as preliminary and besides proving these preliminary conclusions either additional results could emerge from the models or the conclusions might not be confirmed. However, one should take into account that, given the features of the model, not all the impacts introduced can be simulated with the same level of detail and/or in a full endogenous way. Therefore some of the points raised in this overview will also serve to provide a complete discussion of effects of high oil prices accompanying the modelling outcomes.
HOP! research project Macro-economic impact of high oil price in Europe
D2 High Oil Prices: Scenarios assumptions and model interfaces XIV
LIST OF CONTENTS
EXECUTIVE SUMMARY..........................................................................................................................................I HOP! SCENARIOS ...................................................................................................................................................IV THE MODELLING APPROACH...................................................................................................................................VII IMPACT OF HIGH OIL PRICES ON THE TRANSPORT AND ENERGY SECTORS............................................................ VIII IMPACT OF HIGH OIL PRICES ON THE ECONOMY .....................................................................................................XI OUTLOOK............................................................................................................................................................. XIII
1 INTRODUCTION ........................................................................................................................................... 19 1.1 THE HOP! PROJECT.................................................................................................................................. 20 1.2 THE OBJECTIVE OF WP2........................................................................................................................... 20 1.3 THE REPORT STRUCTURE ......................................................................................................................... 21
2 THE PROJECT SCENARIOS....................................................................................................................... 22 2.1 THE BASELINE SCENARIO......................................................................................................................... 22
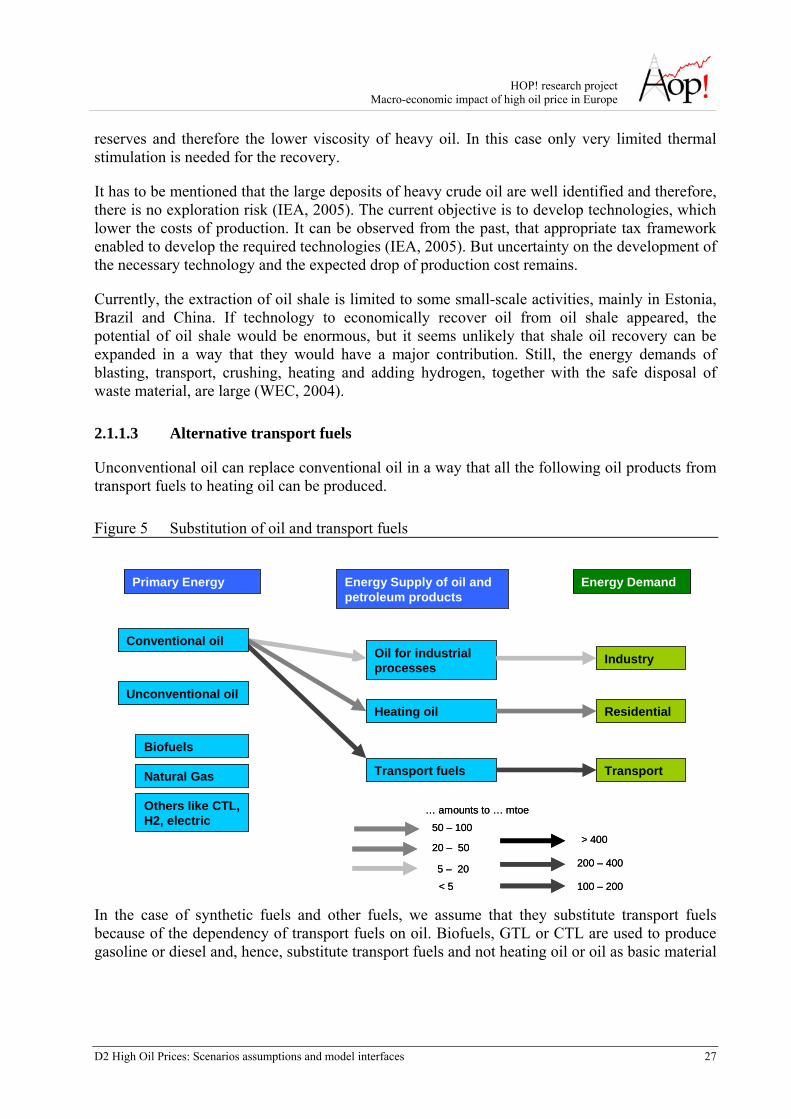
2.1.1 Energy Supply ..................................................................................................................................... 22 2.1.1.1 Conventional Oil ........................................................................................................................................23 2.1.1.2 Unconventional oil .....................................................................................................................................26 2.1.1.3 Alternative transport fuels ..........................................................................................................................27 2.1.1.4 Alternatives to heating oil and oil for industrial processes .........................................................................30
2.1.2 Demographic and economic development, transport system and energy demand.............................. 31 2.1.2.1 Population ..................................................................................................................................................32 2.1.2.2 Economy ....................................................................................................................................................32 2.1.2.3 Transport ....................................................................................................................................................33 2.1.2.4 Energy Demand..........................................................................................................................................34
2.1.3 Development of key variables in the baseline ..................................................................................... 35 2.1.4 Critical assumptions............................................................................................................................ 36
2.1.4.1 Conventional oil .........................................................................................................................................36 2.1.4.2 Unconventional oil .....................................................................................................................................37 2.1.4.3 Alternative transport fuels ..........................................................................................................................37 2.1.4.4 Energy demand...........................................................................................................................................37 2.1.4.5 Other uncertainties .....................................................................................................................................37
2.2 THE HOP! SCENARIOS .............................................................................................................................. 38 2.2.1 Overview on HOP! scenarios.............................................................................................................. 38 2.2.2 HOP! scenarios with low conventional oil reserves ........................................................................... 40
2.2.2.1 HOP! scenarios with low conventional oil reserves plus alternative transport fuels ..................................40 2.2.2.2 HOP! scenarios with low conventional oil reserves plus improvements in energy efficiency....................41 2.2.2.3 HOP! scenarios with low conventional oil reserves plus alternative transport fuels and improvements in
energy efficiency ........................................................................................................................................42 2.2.2.4 HOP! scenarios with low conventional oil reserves without alternative transport fuels and without
improvements in energy efficiency ............................................................................................................42 2.2.2.5 Changes of HOP! scenarios with low conventional oil reserves compared to baseline ..............................42
2.2.3 High Oil Price scenario: very low conventional oil and no unconventional oil reserves ................... 44 2.2.3.1 HOP! scenarios with very low conventional oil reserves plus alternative transport fuels ..........................44 2.2.3.2 HOP! scenarios with very low conventional oil reserves plus improvements in energy efficiency............45 2.2.3.3 HOP! scenarios with very low conventional oil reserves plus alternative transport fuels and improvements
in energy efficiency ....................................................................................................................................46 2.2.3.4 HOP! scenarios with very low conventional oil reserves, no alternative transport fuels and no
improvements in energy efficiency ............................................................................................................46 2.2.3.5 Changes of HOP! scenarios with very low conventional oil reserves compared to baseline ......................47
2.2.4 Sensitivity analysis .............................................................................................................................. 48
HOP! research project Macro-economic impact of high oil price in Europe
D2 High Oil Prices: Scenarios assumptions and model interfaces XV
3 MODELLING APPROACH .......................................................................................................................... 50 3.1 THE POLES MODEL ................................................................................................................................. 50
3.1.1 Zoning system...................................................................................................................................... 51 3.1.2 Vertical integration ............................................................................................................................. 51 3.1.3 Horizontal integration......................................................................................................................... 52 3.1.4 The Oil production in POLES ............................................................................................................. 53 3.1.5 The Gas production in POLES............................................................................................................ 54 3.1.6 The Biofuels Model ............................................................................................................................. 54
3.2 THE ASTRA MODEL................................................................................................................................. 56 3.2.1 Overview on Models of ASTRA ........................................................................................................... 56 3.2.2 Transport............................................................................................................................................. 58
3.2.2.1 Transport Technology and Infrastructure ...................................................................................................58 3.2.2.2 Transport Demand......................................................................................................................................58
3.2.3 Economy.............................................................................................................................................. 59 3.2.3.1 Households .................................................................................................................................................59 3.2.3.2 Macro-economy .........................................................................................................................................59 3.2.3.3 Trade ..........................................................................................................................................................61
3.2.4 Impacts and environment .................................................................................................................... 61 3.3 LINKAGES BETWEEN ASTRA AND POLES .............................................................................................. 62
3.3.1 Exchange of variables ......................................................................................................................... 63 3.3.2 Harmonisation of variables................................................................................................................. 63 3.3.3 Linkage for the sensitivity analysis ..................................................................................................... 65
4 IMPACT PATH OF HIGH OIL PRICES..................................................................................................... 66 4.1 OVERVIEW................................................................................................................................................ 66 4.2 ENERGY .................................................................................................................................................... 68
4.2.1 Conventional and unconventional oil.................................................................................................. 68 4.2.1.1 Cost structure of conventional oil...............................................................................................................68 4.2.1.2 Development of components of production costs.......................................................................................69 4.2.1.3 Feedback and input factors .........................................................................................................................70
4.2.2 Alternative transport fuels................................................................................................................... 71 4.2.3 Effects of high oil prices on potential substitutes ................................................................................ 72
4.3 TRANSPORT .............................................................................................................................................. 74 4.3.1 Primary impacts on the transport sector of an increment of the oil price........................................... 74
4.3.1.1 Variables affecting transport costs elasticity with respect to oil price ........................................................74 4.3.1.2 Expected impacts by mode of transport......................................................................................................76
4.3.2 Secondary impacts on the transport sector of an increment of the oil price ....................................... 77 4.3.2.1 Reduction of personal motorized mobility .................................................................................................77 4.3.2.2 Pressure to reduction in mobility of goods .................................................................................................78 4.3.2.3 Mode shift ..................................................................................................................................................79 4.3.2.4 Development of alternative transport means ..............................................................................................81
4.3.3 The simulation of scenarios to measure the expected impacts on the transport sector....................... 81 4.4 ECONOMY................................................................................................................................................. 84
4.4.1 The economic setting today and during earlier phases of high oil prices ........................................... 86 4.4.2 Direct impacts versus indirect impacts of high oil prices ................................................................... 87 4.4.3 Traditional and alternative views on impacts of high oil prices ......................................................... 89
4.4.3.1 The traditional point of view: inflation, income transfer and terms of trade...............................................89 4.4.3.2 The alternative point of view: induced innovation and investment ............................................................90
4.4.4 The key words: innovations and investments ...................................................................................... 91 4.4.4.1 Competitive position of important players for the reaction to high oil prices.............................................93 4.4.4.2 The unavailability of promising investments in the last decade .................................................................98
4.4.5 The synergy between high oil prices and climate protection policies ................................................. 99 4.4.6 Paradigm changes and the impact of high oil prices ........................................................................ 100
4.4.6.1 The paradigm of "Sufficiency and Fairness" ............................................................................................101 4.4.6.2 The paradigm of "Egoism and Resource Wars" .......................................................................................102 4.4.6.3 Ranking of outcomes of the three paradigms ...........................................................................................103
HOP! research project Macro-economic impact of high oil price in Europe
D2 High Oil Prices: Scenarios assumptions and model interfaces XVI
4.4.7 Potential to model the different impacts in HOP! ............................................................................. 103 4.4.8 Preliminary Conclusions on Economic Impacts of High Oil Prices ................................................. 104
5 CONCLUSIONS............................................................................................................................................ 106
REFERENCES...................................................................................................................................................... 1068
GLOSSARY ............................................................................................................................................................ 114
LIST OF ABBREVIATIONS................................................................................................................................. 106
HOP! research project Macro-economic impact of high oil price in Europe
D2 High Oil Prices: Scenarios assumptions and model interfaces XVII
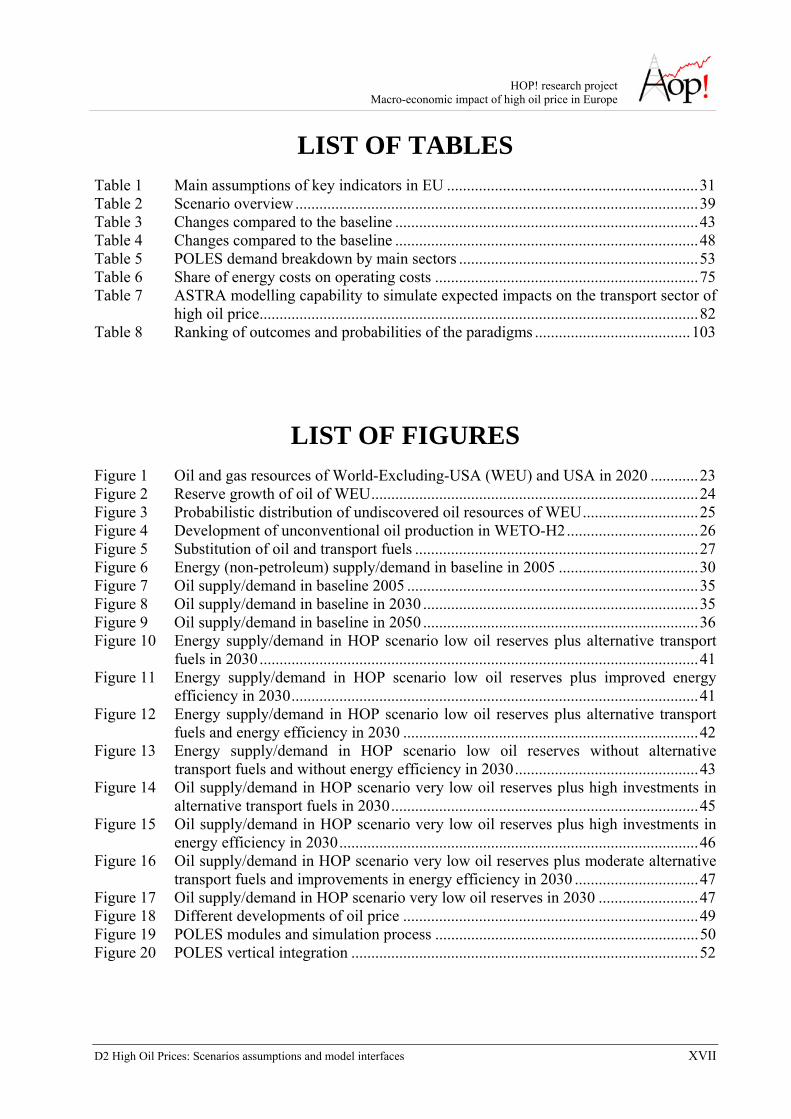
LIST OF TABLES Table 1 Main assumptions of key indicators in EU ...............................................................31 Table 2 Scenario overview.....................................................................................................39 Table 3 Changes compared to the baseline ............................................................................43 Table 4 Changes compared to the baseline ............................................................................48 Table 5 POLES demand breakdown by main sectors ............................................................53 Table 6 Share of energy costs on operating costs ..................................................................75 Table 7 ASTRA modelling capability to simulate expected impacts on the transport sector of
high oil price..............................................................................................................82 Table 8 Ranking of outcomes and probabilities of the paradigms .......................................103
LIST OF FIGURES Figure 1 Oil and gas resources of World-Excluding-USA (WEU) and USA in 2020 ............23 Figure 2 Reserve growth of oil of WEU..................................................................................24 Figure 3 Probabilistic distribution of undiscovered oil resources of WEU.............................25 Figure 4 Development of unconventional oil production in WETO-H2.................................26 Figure 5 Substitution of oil and transport fuels .......................................................................27 Figure 6 Energy (non-petroleum) supply/demand in baseline in 2005 ...................................30 Figure 7 Oil supply/demand in baseline 2005 .........................................................................35 Figure 8 Oil supply/demand in baseline in 2030 .....................................................................35 Figure 9 Oil supply/demand in baseline in 2050 .....................................................................36 Figure 10 Energy supply/demand in HOP scenario low oil reserves plus alternative transport
fuels in 2030..............................................................................................................41 Figure 11 Energy supply/demand in HOP scenario low oil reserves plus improved energy
efficiency in 2030......................................................................................................41 Figure 12 Energy supply/demand in HOP scenario low oil reserves plus alternative transport
fuels and energy efficiency in 2030 ..........................................................................42 Figure 13 Energy supply/demand in HOP scenario low oil reserves without alternative
transport fuels and without energy efficiency in 2030..............................................43 Figure 14 Oil supply/demand in HOP scenario very low oil reserves plus high investments in
alternative transport fuels in 2030.............................................................................45 Figure 15 Oil supply/demand in HOP scenario very low oil reserves plus high investments in
energy efficiency in 2030..........................................................................................46 Figure 16 Oil supply/demand in HOP scenario very low oil reserves plus moderate alternative
transport fuels and improvements in energy efficiency in 2030 ...............................47 Figure 17 Oil supply/demand in HOP scenario very low oil reserves in 2030 .........................47 Figure 18 Different developments of oil price ..........................................................................49 Figure 19 POLES modules and simulation process ..................................................................50 Figure 20 POLES vertical integration .......................................................................................52
HOP! research project Macro-economic impact of high oil price in Europe
D2 High Oil Prices: Scenarios assumptions and model interfaces XVIII
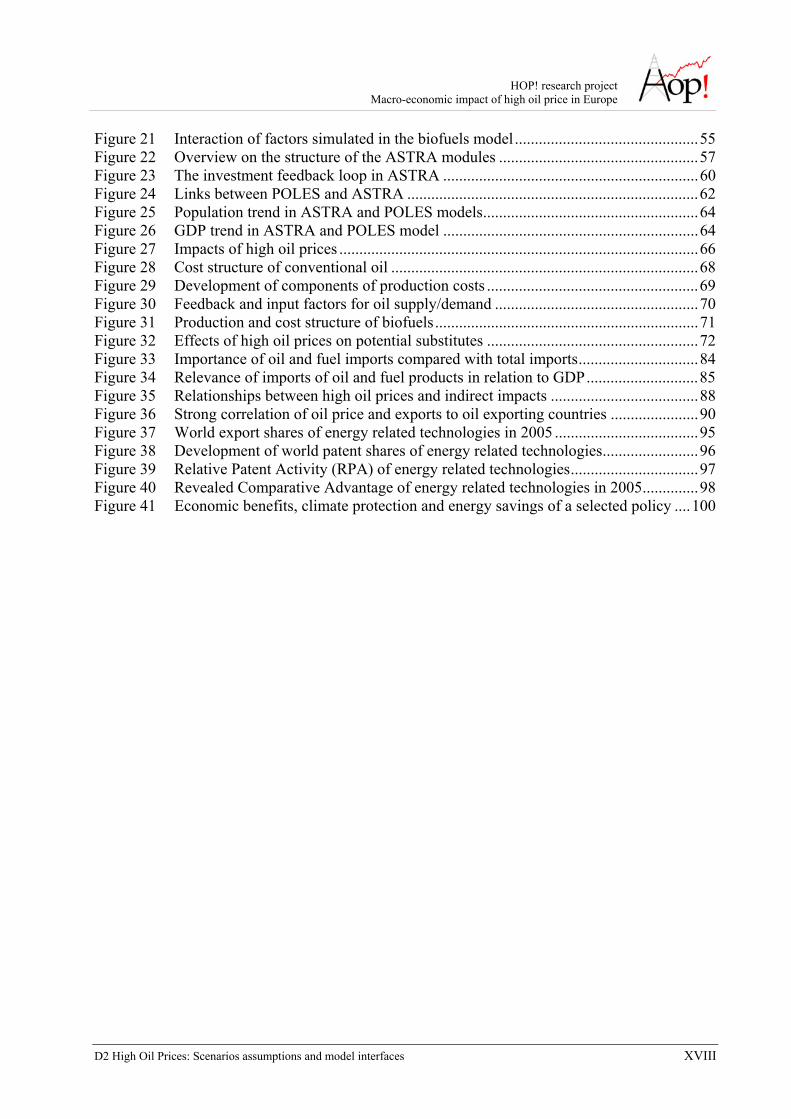
Figure 21 Interaction of factors simulated in the biofuels model..............................................55 Figure 22 Overview on the structure of the ASTRA modules ..................................................57 Figure 23 The investment feedback loop in ASTRA ................................................................60 Figure 24 Links between POLES and ASTRA .........................................................................62 Figure 25 Population trend in ASTRA and POLES models......................................................64 Figure 26 GDP trend in ASTRA and POLES model ................................................................64 Figure 27 Impacts of high oil prices ..........................................................................................66 Figure 28 Cost structure of conventional oil .............................................................................68 Figure 29 Development of components of production costs .....................................................69 Figure 30 Feedback and input factors for oil supply/demand ...................................................70 Figure 31 Production and cost structure of biofuels..................................................................71 Figure 32 Effects of high oil prices on potential substitutes .....................................................72 Figure 33 Importance of oil and fuel imports compared with total imports..............................84 Figure 34 Relevance of imports of oil and fuel products in relation to GDP............................85 Figure 35 Relationships between high oil prices and indirect impacts .....................................88 Figure 36 Strong correlation of oil price and exports to oil exporting countries ......................90 Figure 37 World export shares of energy related technologies in 2005 ....................................95 Figure 38 Development of world patent shares of energy related technologies........................96 Figure 39 Relative Patent Activity (RPA) of energy related technologies................................97 Figure 40 Revealed Comparative Advantage of energy related technologies in 2005..............98 Figure 41 Economic benefits, climate protection and energy savings of a selected policy ....100
HOP! research project Macro-economic impact of high oil price in Europe
D2 High Oil Prices: Scenarios assumptions and model interfaces 19
1 Introduction
Global and EU energy markets have witnessed a number of important changes in the last few years. The prices of primary energy carriers have soared, particularly for oil and gas. After more than a decade of cheap oil around 20 US$/barrel, prices have steeply risen lately. Today's oil prices of about 90 US$/barrel reflect the increasing demand from fast-growing economies like China and India as well as supply shortages originating from geopolitical tensions and short-term market expectations. The reduction of oil production from OECD countries, as well as political instability in the Gulf region, Nigeria, and Venezuela contributed to higher oil prices. The prices for natural gas followed the oil price trends in general. Shortages in the natural gas supply from Russia, which emerged from a dispute between Russia and Ukraine, contributed to this development and have raised major concerns about energy supply security.
The EU and its Member States are reacting to the challenge of securing energy supply security while at the same time reducing greenhouse gas emissions by a number of actions. These include the 2001 milestone Green Paper 'Towards a European strategy for the security of energy supply’ and the recently adopted, comprehensive 'Energy Package'.
In terms of external relations, the EU maintains an active dialogue with major energy producing and transition countries. Energy is part of the EU neighbourhood policy, which aims at reinforcing relations between the EU and partner countries. On top, the EU has signed Partnership and Co-operation Agreements including supply arrangements, energy policy formulation, regulation of the energy sector, promotion of energy saving and energy efficiency with number of EECCA countries. Furthermore, a legal framework for an integrated energy market was created when the Energy Community Treaty between the EU and nine South Eastern European Countries entered into force in 2007.
At the same time, the EU pursues an active policy for accelerating the market entry of alternative energy technologies. The Energy Action Plan from March 2007 includes, for example, a specific target for bringing the share of renewables in total energy supply up to 20% by 2020. Furthermore, biofuels shall reach 10% of all transport fuel consumption, and the active exploitation of energy efficiency potentials shall manage to reduce energy consumption by 20% in 2020 compared to a baseline development.
The latter is supported by fostering R&D and investment in energy technologies for the future. In this respect, the recently proposed 'Strategic Energy Technology Plan' aims at better exploiting synergies among the EU Member States research actions to develop the technologies that are needed for meeting the twin challenge of supply risks and climate change. Furthermore, the EU supports individual research project through its research framework programme and the Intelligent Energy Europe Programme, included for example research projects that investigate the medium and long-term perspectives of energy supply and demand such as Cascade-Mints, WETO-H2, CESSA and HOP!.
HOP! research project Macro-economic impact of high oil price in Europe
D2 High Oil Prices: Scenarios assumptions and model interfaces 20
1.1 The HOP! Project
The HOP! project is aimed at evaluating the direct and indirect impacts of long term increase in oil price on the whole European economy, with special reference to impacts on energy sector, transport sector and employment.
The project is co-funded by the European Commission DG Research and is undertaken by three partners, with TRT Trasporti e Territorio taking the lead and collaborating with Fraunhofer Institute Systems and Innovation research (ISI) and the Institute for Prospective Technological Studies of the European Commission DG JRC (IPTS).
The HOP! approach develops along three activity lines:
Modelling: the quantification of the impacts is performed by coupling two European strategic models, the ASTRA model (designed for the long term assessment of transport policies and investments) focused on transport and macroeconomics and the POLES model (designed for simulating the interaction of energy supply and demand) focused on energy.
Assessment: the project scenarios are designed to allow for identifying a well defined set of impacts; a good deal of competent assessment will be necessary for analysing quantitative indicators produced by running ASTRA and POLES as well as for complementing quantitative evaluations with qualitative ones.
Scientific consensus: the HOP! project organises two scientific workshops in Brussels: the first one devoted to the discussion of the high oil price scenarios and the second one to the discussion of the quantified impacts.
The HOP! project will deliver quantitative results about the energy sector, the transport sector and the economy that could be used in EU policy-making. In terms of final modelling output, i.e. the scenarios results, the attempt will be of producing a set of meaningful indicators presented in a clear and concise way so that main responses can be readily captured and compared.
1.2 The Objective of WP2
In WP1 we reviewed the main national and international studies on the topic and created the basis for designing plausible scenarios. The outcome of this survey can be used as framework of comparison within the project.
In detail the objectives of WP2 are:
to design the models’ baseline and the scenarios to be simulated and identify their main assumptions,
to identify the model variables that will be used as input and output, as well as the variables to be exchanged between the models in each iteration,
HOP! research project Macro-economic impact of high oil price in Europe
D2 High Oil Prices: Scenarios assumptions and model interfaces 21
to develop an interface for the exchange of simulation results between ASTRA and POLES.
Two types of scenarios are defined: the baseline scenario and a set of high oil prices scenarios (HOP! scenarios). The purpose of the baseline scenario is to enable the assessment of high oil prices. The description of the ASTRA and the POLES models enables to identify the input variables that have to be modified in each scenario. The description also indicates the most relevant model variables, which serves for identification of the output variables. Furthermore, the description of the modelling approach also entails a section on the interface of the models. The interface links ASTRA and POLES together and exchanges variables in each iteration.
Additionally, a section on the impact path of high oil prices highlights the causal chain between high oil price and reaction in the energy market, transport and economy. It stresses which changes can be expected and, hence, which output variables will be used for the analysis of the simulation results.
WP3 will run the models and analyse the outcomes in terms of direct impact on the transport system, direct impact on the energy system (stationary applications), impacts on the macroeconomic side, taking into account the different sector analysis.
WP4 will be active for the whole project life and will organise two main workshops in Brussels: the discussion of the scenarios and the discussion of the project results. Each workshop will be introduced by a key speech of a couple external experts.
1.3 The Report Structure
The report is divided into 5 sections, followed by references, a glossary, and a list of abbreviations.
The first section delivers an introduction to the HOP! project and framework, and describes the outline of the report.
Section 2 defines the baseline and describes the basic assumptions of energy supply/demand, transport, economy and the demographic development. Furthermore, it defines the set of HOP! scenarios and explains in which way they differ from each other.
Section 3 presents the modelling approach and explains the basic functionality of the ASTRA model and the POLES model. Additionally, it describes the linkage between the two simulation models.
Section 4 discusses the economic consequences of high oil prices. The impact path from high oil price to the energy market, transport and the whole economy is described.
Lastly, section 5 summarises the scenario descriptions, the explanation of the modelling approach and the discussion on impact paths of high oil prices. It attempts to give inputs to the WP3.
HOP! research project Macro-economic impact of high oil price in Europe
D2 High Oil Prices: Scenarios assumptions and model interfaces 22
2 The Project Scenarios
The main purpose of the HOP! project is to investigate the macro-economic impact of high oil price. To get a comprehensive picture of the impacts two types of scenarios are defined: the baseline scenario and a set of high oil prices scenarios (HOP scenarios).
The baseline scenario serves as projection with a moderate oil price, which can be compared with the high oil prices scenarios. Such a comparison gives then insights on the way energy supply-demand, transport and economy react on high oil prices. The HOP! baseline refers mainly to the baseline scenario developed within the TRIAS project (Krail et al., 2007), with further updates, e.g. in the GDP assumptions, and modifications, e.g. in the degree of integration of the two models, might lead to slight changes in the projections.
The baseline scenario describes a projection with a moderate development of oil prices. This is not necessarily the most likely or the most probable one; it is rather seen as a projection with more optimistic assumptions on oil resources, which leads to a moderate increase of oil prices. The slow increase allows a gradual adaptation of actors in economy and industry. The energy supply also reacts on slightly decreasing the amounts of conventional oil resources. Unconventional oil and alternative transport fuels like biofuels are assumed to substitute conventional oil to a certain extent.
The baseline assumptions on energy demand, transport, economic and demographic development base on most recent or commonly agreed studies in these areas. The intention is to consider the most likely trends in these fields; this holds e.g. for the development of population or for the projected development of GDP.
The high oil price scenarios are designed by varying assumptions for the supply of energy or for the development of energy efficiency. The main objective is to generate a set of plausible scenarios with assumptions leading to a strong increase of oil prices. As there are manifold reasons for the occurrence of high oil price, diverse scenarios have been developed.
2.1 The Baseline Scenario
This section provides the definition of the baseline scenario for the HOP modelling framework. In the first step, the development of the energy supply is discussed focusing on conventional oil and the amount of available reserves. In the following step, the key parameters of economy, population, transport and energy demand are described.
2.1.1 Energy Supply
The level of oil resources in the baseline derives from the estimation of USGS (USGS, 2000) on the worldwide oil and gas fields, which is compared to other studies at the upper range.
HOP! research project Macro-economic impact of high oil price in Europe
D2 High Oil Prices: Scenarios assumptions and model interfaces 23
2.1.1.1 Conventional Oil
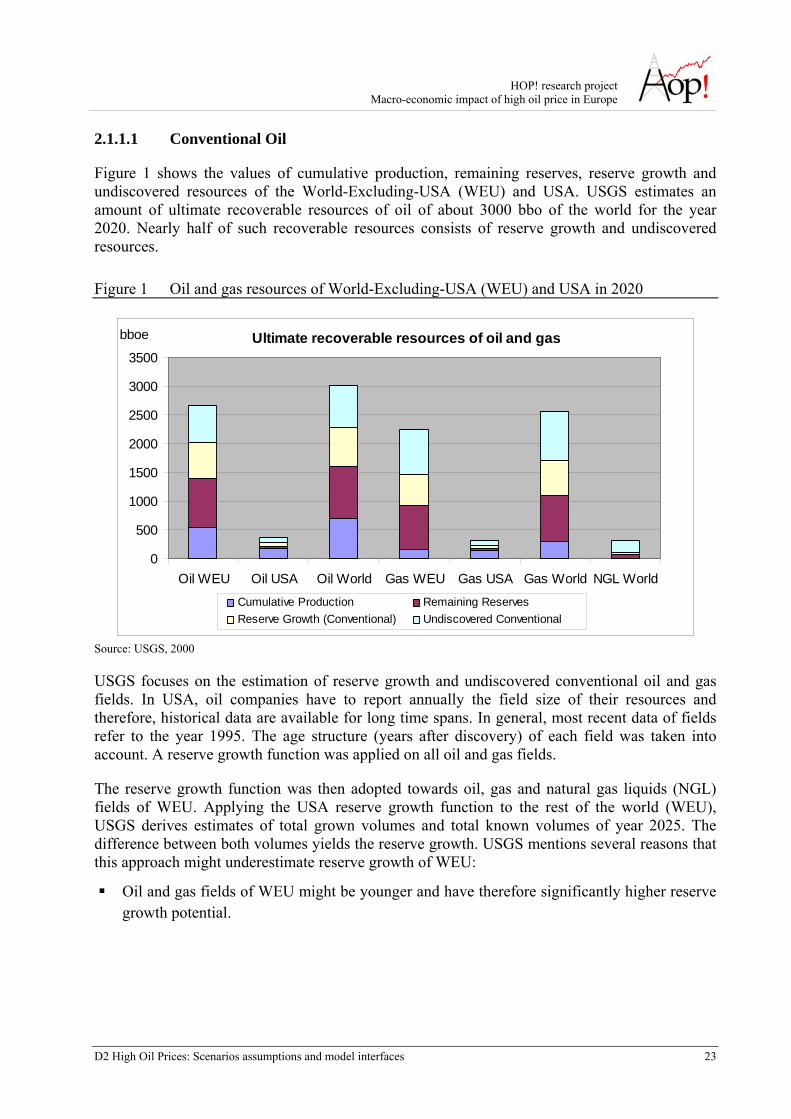
Figure 1 shows the values of cumulative production, remaining reserves, reserve growth and undiscovered resources of the World-Excluding-USA (WEU) and USA. USGS estimates an amount of ultimate recoverable resources of oil of about 3000 bbo of the world for the year 2020. Nearly half of such recoverable resources consists of reserve growth and undiscovered resources.
Figure 1 Oil and gas resources of World-Excluding-USA (WEU) and USA in 2020
Ultimate recoverable resources of oil and gas
0
500
1000
1500
2000
2500
3000
3500
Oil WEU Oil USA Oil World Gas WEU Gas USA Gas World NGL World
bboe
Cumulative Production Remaining ReservesReserve Growth (Conventional) Undiscovered Conventional
Source: USGS, 2000
USGS focuses on the estimation of reserve growth and undiscovered conventional oil and gas fields. In USA, oil companies have to report annually the field size of their resources and therefore, historical data are available for long time spans. In general, most recent data of fields refer to the year 1995. The age structure (years after discovery) of each field was taken into account. A reserve growth function was applied on all oil and gas fields.
The reserve growth function was then adopted towards oil, gas and natural gas liquids (NGL) fields of WEU. Applying the USA reserve growth function to the rest of the world (WEU), USGS derives estimates of total grown volumes and total known volumes of year 2025. The difference between both volumes yields the reserve growth. USGS mentions several reasons that this approach might underestimate reserve growth of WEU:
Oil and gas fields of WEU might be younger and have therefore significantly higher reserve growth potential.
HOP! research project Macro-economic impact of high oil price in Europe
D2 High Oil Prices: Scenarios assumptions and model interfaces 24
Technological developments might increase stronger compared to the technical developments which had an impact on the USA historical reserve growth record.
Shortages might accelerate the activities to expand the exploitation of existing resources.
On the other hand, arguments can be mentioned that this approach overestimates the reserve growth of WEU:
In WEU the criteria for reporting reserves of oil and gas fields might be less restrictive.
Reported reserves might be overestimated which reduces their reserve growth potential.
The initial field-size estimates might be more accurate in recent times which reduce the reserve growth potential of WEU.
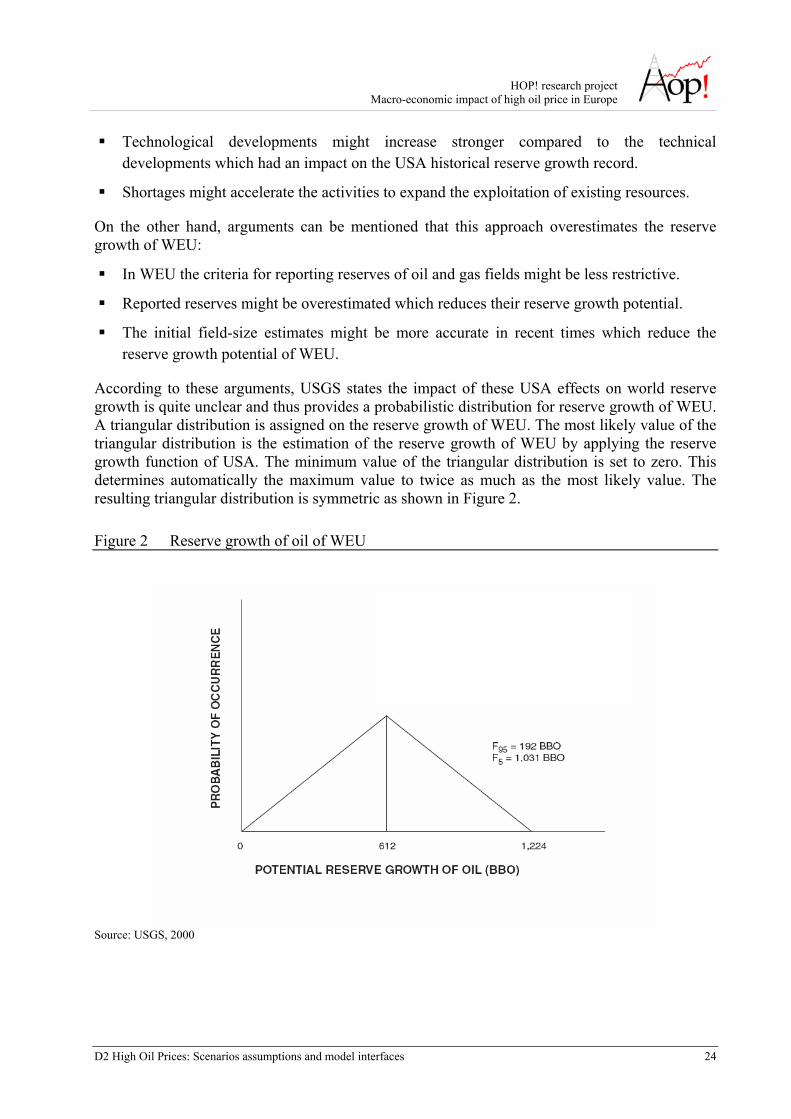
According to these arguments, USGS states the impact of these USA effects on world reserve growth is quite unclear and thus provides a probabilistic distribution for reserve growth of WEU. A triangular distribution is assigned on the reserve growth of WEU. The most likely value of the triangular distribution is the estimation of the reserve growth of WEU by applying the reserve growth function of USA. The minimum value of the triangular distribution is set to zero. This determines automatically the maximum value to twice as much as the most likely value. The resulting triangular distribution is symmetric as shown in Figure 2.
Figure 2 Reserve growth of oil of WEU
Source: USGS, 2000
HOP! research project Macro-economic impact of high oil price in Europe
D2 High Oil Prices: Scenarios assumptions and model interfaces 25
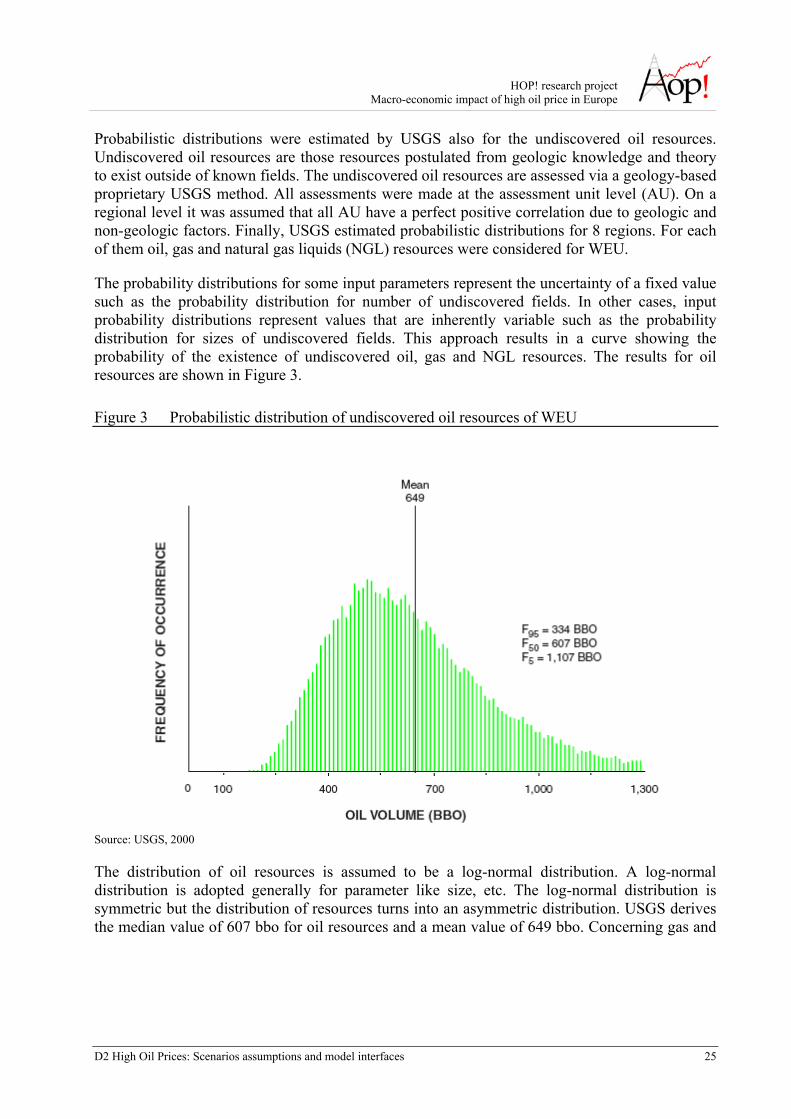
Probabilistic distributions were estimated by USGS also for the undiscovered oil resources. Undiscovered oil resources are those resources postulated from geologic knowledge and theory to exist outside of known fields. The undiscovered oil resources are assessed via a geology-based proprietary USGS method. All assessments were made at the assessment unit level (AU). On a regional level it was assumed that all AU have a perfect positive correlation due to geologic and non-geologic factors. Finally, USGS estimated probabilistic distributions for 8 regions. For each of them oil, gas and natural gas liquids (NGL) resources were considered for WEU.
The probability distributions for some input parameters represent the uncertainty of a fixed value such as the probability distribution for number of undiscovered fields. In other cases, input probability distributions represent values that are inherently variable such as the probability distribution for sizes of undiscovered fields. This approach results in a curve showing the probability of the existence of undiscovered oil, gas and NGL resources. The results for oil resources are shown in Figure 3.
Figure 3 Probabilistic distribution of undiscovered oil resources of WEU
Source: USGS, 2000
The distribution of oil resources is assumed to be a log-normal distribution. A log-normal distribution is adopted generally for parameter like size, etc. The log-normal distribution is symmetric but the distribution of resources turns into an asymmetric distribution. USGS derives the median value of 607 bbo for oil resources and a mean value of 649 bbo. Concerning gas and
HOP! research project Macro-economic impact of high oil price in Europe
D2 High Oil Prices: Scenarios assumptions and model interfaces 26
NGL, the median values are 722 bboe and 189 bboe respectively 778 bboe and 207 bboe for the mean values.
2.1.1.2 Unconventional oil
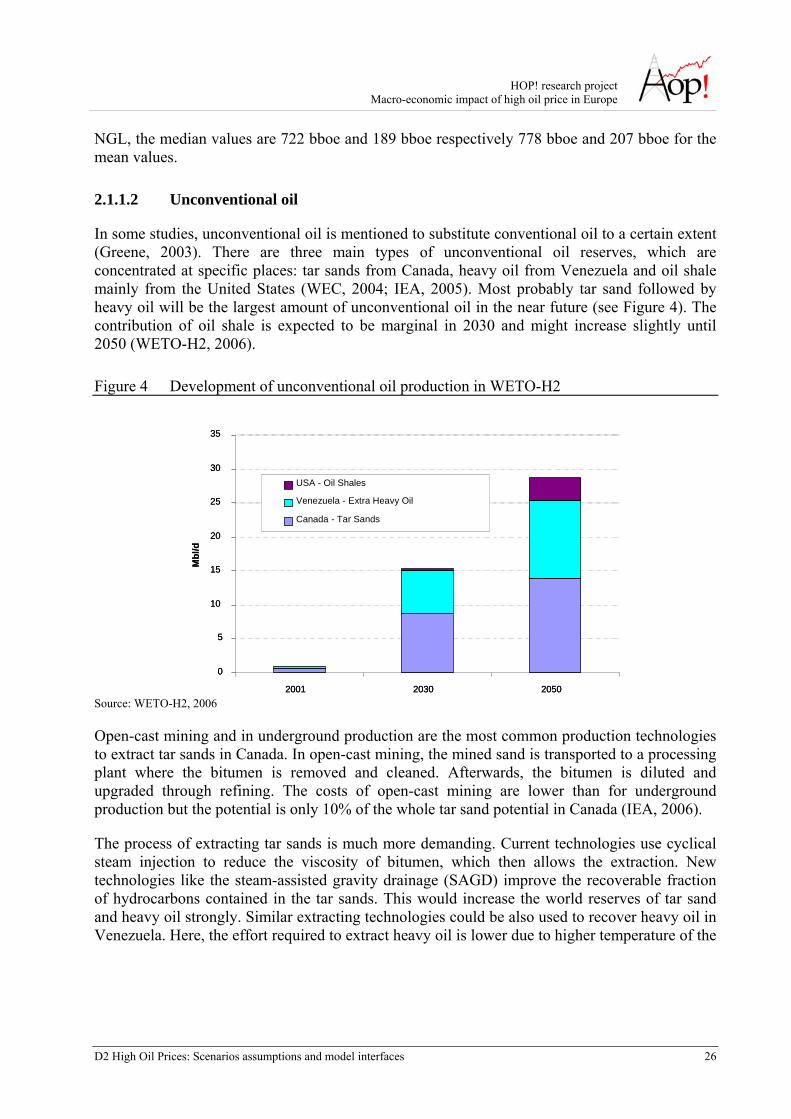
In some studies, unconventional oil is mentioned to substitute conventional oil to a certain extent (Greene, 2003). There are three main types of unconventional oil reserves, which are concentrated at specific places: tar sands from Canada, heavy oil from Venezuela and oil shale mainly from the United States (WEC, 2004; IEA, 2005). Most probably tar sand followed by heavy oil will be the largest amount of unconventional oil in the near future (see Figure 4). The contribution of oil shale is expected to be marginal in 2030 and might increase slightly until 2050 (WETO-H2, 2006).
Figure 4 Development of unconventional oil production in WETO-H2
0
5
10
15
20
25
30
35
2001 2030 2050
Mbl
/d
USA - Oil Shales
Venezuela - Extra Heavy Oil
Canada - Tar Sands
0
5
10
15
20
25
30
35
2001 2030 2050
Mbl
/d
USA - Oil Shales
Venezuela - Extra Heavy Oil
Canada - Tar Sands
Source: WETO-H2, 2006
Open-cast mining and in underground production are the most common production technologies to extract tar sands in Canada. In open-cast mining, the mined sand is transported to a processing plant where the bitumen is removed and cleaned. Afterwards, the bitumen is diluted and upgraded through refining. The costs of open-cast mining are lower than for underground production but the potential is only 10% of the whole tar sand potential in Canada (IEA, 2006).
The process of extracting tar sands is much more demanding. Current technologies use cyclical steam injection to reduce the viscosity of bitumen, which then allows the extraction. New technologies like the steam-assisted gravity drainage (SAGD) improve the recoverable fraction of hydrocarbons contained in the tar sands. This would increase the world reserves of tar sand and heavy oil strongly. Similar extracting technologies could be also used to recover heavy oil in Venezuela. Here, the effort required to extract heavy oil is lower due to higher temperature of the
HOP! research project Macro-economic impact of high oil price in Europe
D2 High Oil Prices: Scenarios assumptions and model interfaces 27
reserves and therefore the lower viscosity of heavy oil. In this case only very limited thermal stimulation is needed for the recovery.
It has to be mentioned that the large deposits of heavy crude oil are well identified and therefore, there is no exploration risk (IEA, 2005). The current objective is to develop technologies, which lower the costs of production. It can be observed from the past, that appropriate tax framework enabled to develop the required technologies (IEA, 2005). But uncertainty on the development of the necessary technology and the expected drop of production cost remains.
Currently, the extraction of oil shale is limited to some small-scale activities, mainly in Estonia, Brazil and China. If technology to economically recover oil from oil shale appeared, the potential of oil shale would be enormous, but it seems unlikely that shale oil recovery can be expanded in a way that they would have a major contribution. Still, the energy demands of blasting, transport, crushing, heating and adding hydrogen, together with the safe disposal of waste material, are large (WEC, 2004).
2.1.1.3 Alternative transport fuels
Unconventional oil can replace conventional oil in a way that all the following oil products from transport fuels to heating oil can be produced.
Figure 5 Substitution of oil and transport fuels
20 – 50
5 – 20
< 5
50 – 100
100 – 200
200 – 400
> 400
… amounts to … mtoe
20 – 50
5 – 20
< 5
50 – 100
100 – 200
200 – 400
> 400
… amounts to … mtoe
Transport fuels
Heating oil
Oil for industrial processes
Transport
Residential
Industry
Primary Energy Energy Supply of oil and petroleum products
Energy Demand
Conventional oil
Unconventional oil
Biofuels
Natural Gas
Others like CTL, H2, electric
In the case of synthetic fuels and other fuels, we assume that they substitute transport fuels because of the dependency of transport fuels on oil. Biofuels, GTL or CTL are used to produce gasoline or diesel and, hence, substitute transport fuels and not heating oil or oil as basic material
HOP! research project Macro-economic impact of high oil price in Europe
D2 High Oil Prices: Scenarios assumptions and model interfaces 28
in the chemical industry (see Figure 5). Other alternative transport fuels are natural gas and hydrogen, etc.
Biofuels 1st generation
With respect to biofuels, energy markets show a rising production and consumption of biofuels of the 1st generation. Up today, biodiesel dominates the EU biofuel market with a share of more than 80% (unlike the US and Brazil where ethanol clearly dominates (Licht, 2006). The baseline scenario projects that the trend of an increase of biodiesel production is likely to not continue in the longer term. Due to lower feedback on feedstock prices, bioethanol production is projected to increase at a much faster rate than biodiesel. The fast uptake of ethanol will slow down once additional distribution and adaptation costs are required, due to problems in blending ethanol above a certain low share, but cannot reverse the trend.
As shown in several projects (Wiesenthal et al., 2007; Toro et al. 2006), production costs of 1st generation are higher than the price of conventional transport fuels. In most parts of the world outside Brazil, biofuels cost significantly more to produce than conventional gasoline or diesel, even with crude oil prices of over $70 per barrel (IEA, 2006).
Biodiesel production is a mature technology and even though bioethanol production in Europe is lagging behind biodiesel in terms of production volumes, the technology can be considered mature as well, especially when taking into account the global deployment of bioethanol. Besides, economies of scale due to larger plant sizes will be counteracted by more complicated logistics and increased transport costs.
Biofuels 2nd generation
Overall 2nd generation of biofuels is expected to reach only marginal shares total transport fuel demand by 2030. Beyond 2030, their penetration accelerates, due to the effect of learning. The rise in lignocellulosic biofuels will by then have become a main driver for the continued growth in biofuel production. The production costs of the 2nd generation of biofuels decrease. For 2nd generation of biofuels, technology learning plays an important role for the market introduction.
Important cost reductions can be expected both in terms of the production process due to economies of scale and more mature technologies and in terms of the feedstock, as current crops are not yet optimised for their energy content. With the above cost reductions, production costs of 2nd generation ethanol reach that of conventional ethanol between 2020 and 2030, while synthetic diesel (BtL) remains more expensive with about 900 €/toe.
2nd generation biofuels are projected to enter the market after 2030 when production costs of ligno-cellulosic ethanol drops below that of bioethanol from the 1st generation. At this time, ligno-cellulosic ethanol is competitive. Synthetic biofuels can be produced by different routes like natural gas (Gas-to-liquids GTL), coal (Coal-to-liquids CTL) and biomass (Biomass to Liquids BTL). To avoid the discussion whether GTL or CTL or BTL will be the forthcoming energy source for the production of suythetic fuels, the baseline focus is simply on BTL. This means that, without policy support, an increase of biofuels production is likely to not continue in
HOP! research project Macro-economic impact of high oil price in Europe
D2 High Oil Prices: Scenarios assumptions and model interfaces 29
the longer term. Based on this, a market share of biofuels on the level of the implemented quota is assumed.
Natural Gas
The baseline scenario assumes NGV (natural gas vehicles) to be the most attractive alternative car technology to car buyers in the mid term. A positive development of LPG car registrations could be observed in Germany and many other countries. This is also an example for old technologies - LPG cars entered the first markets already in the 1970ies – that rebound as alternatives to other conventional car technologies.
But regarding the vehicle fleet, it is expected that the modern CNG technology is substituting the older LPG technology. Countries like Germany, Italy, Sweden, Austria and UK currently support the diffusion of CNG cars into the markets and the improvement of filling station infrastructure via action plans. The efforts might result in a share of around 10% in the year 2030. Due to the competitiveness of biofuels and improved conventional technology, this share might decline towards 5% in 2050 (Krail et al., 2007).
Hydrogen
Hydrogen and fuel cell technologies for transport have been the subject of intensive research efforts during the last years. Today, most hydrogen is produced from fossil fuels especially by means of steam reforming of natural gas which is the cheapest option so far but not the cleanest. In the long term, fossil fuel based H2 production will require CO2 capture and sequestration (CCS) and a large proportion of hydrogen production might be produced by water electrolysis from non-carbon electricity sources i.e. nuclear and renewables. Alternative production routes like biomass gasification or direct production of hydrogen through biological processes might also become very important. Alongside low-carbon H2 production pathways, the main challenges focus on cost reduction of fuel cells in order to compete with other vehicles (e.g. hybrids, biofuels, LPG) and increasing technology maturity (e.g. H2 on-board storage) (Krail et al., 2007).
The hydrogen produced today, take place in central air gas industry plant. The scale of production can be classified in three categories: Central, distributed, and household. If hydrogen is to be used in cars, the central production structure will hardly be competitive with distributed production based on the existing natural gas grid in the initial phases (Hansen, 2007).
The cost of the production and, therefore, the market share depends strongly on economies of scale as well as economies of scope. Contrary to biofuels, hydrogen technologies are expected to enter the transport market in the long term (2030) but will still face major obstacles. A stable policy framework along with strong political will are essential to make the so-called "hydrogen economy" a reality. Therefore, in the baseline it is assumed that hydrogen reaches only a marginal market share during the considered time horizon.
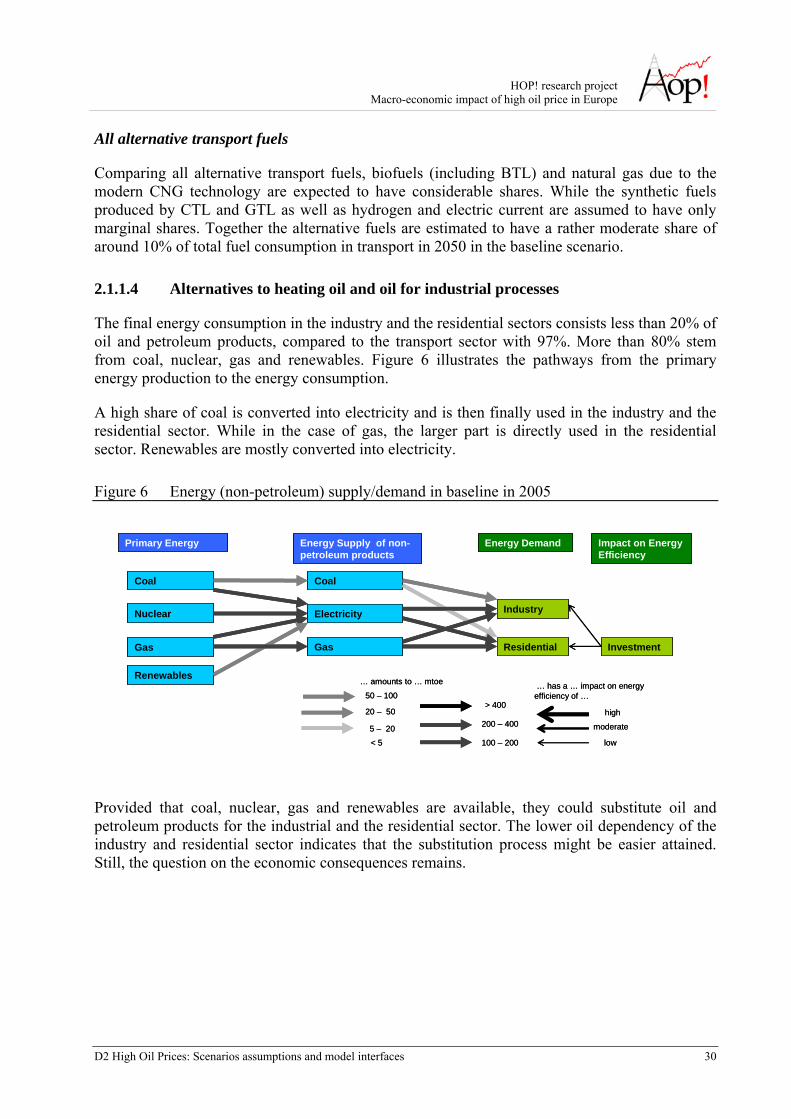
HOP! research project Macro-economic impact of high oil price in Europe
D2 High Oil Prices: Scenarios assumptions and model interfaces 30
All alternative transport fuels
Comparing all alternative transport fuels, biofuels (including BTL) and natural gas due to the modern CNG technology are expected to have considerable shares. While the synthetic fuels produced by CTL and GTL as well as hydrogen and electric current are assumed to have only marginal shares. Together the alternative fuels are estimated to have a rather moderate share of around 10% of total fuel consumption in transport in 2050 in the baseline scenario.
2.1.1.4 Alternatives to heating oil and oil for industrial processes
The final energy consumption in the industry and the residential sectors consists less than 20% of oil and petroleum products, compared to the transport sector with 97%. More than 80% stem from coal, nuclear, gas and renewables. Figure 6 illustrates the pathways from the primary energy production to the energy consumption.
A high share of coal is converted into electricity and is then finally used in the industry and the residential sector. While in the case of gas, the larger part is directly used in the residential sector. Renewables are mostly converted into electricity.
Figure 6 Energy (non-petroleum) supply/demand in baseline in 2005
low
moderate
high
… has a … impact on energy efficiency of …
low
moderate
high
… has a … impact on energy efficiency of …
Renewables
Residential
Industry
Energy Supply of non-petroleum products
Coal
Nuclear
Gas
Electricity
Gas
Coal
Primary Energy Energy Demand
Investment
Impact on Energy Efficiency
Renewables
Residential
Industry
Energy Supply of non-petroleum products
Coal
Nuclear
Gas
Electricity
Gas
Coal
Primary Energy Energy Demand
Investment
Impact on Energy Efficiency
20 – 50
5 – 20
< 5
50 – 100
100 – 200
200 – 400
> 400
… amounts to … mtoe
20 – 50
5 – 20
< 5
50 – 100
100 – 200
200 – 400
> 400
… amounts to … mtoe
Provided that coal, nuclear, gas and renewables are available, they could substitute oil and petroleum products for the industrial and the residential sector. The lower oil dependency of the industry and residential sector indicates that the substitution process might be easier attained. Still, the question on the economic consequences remains.
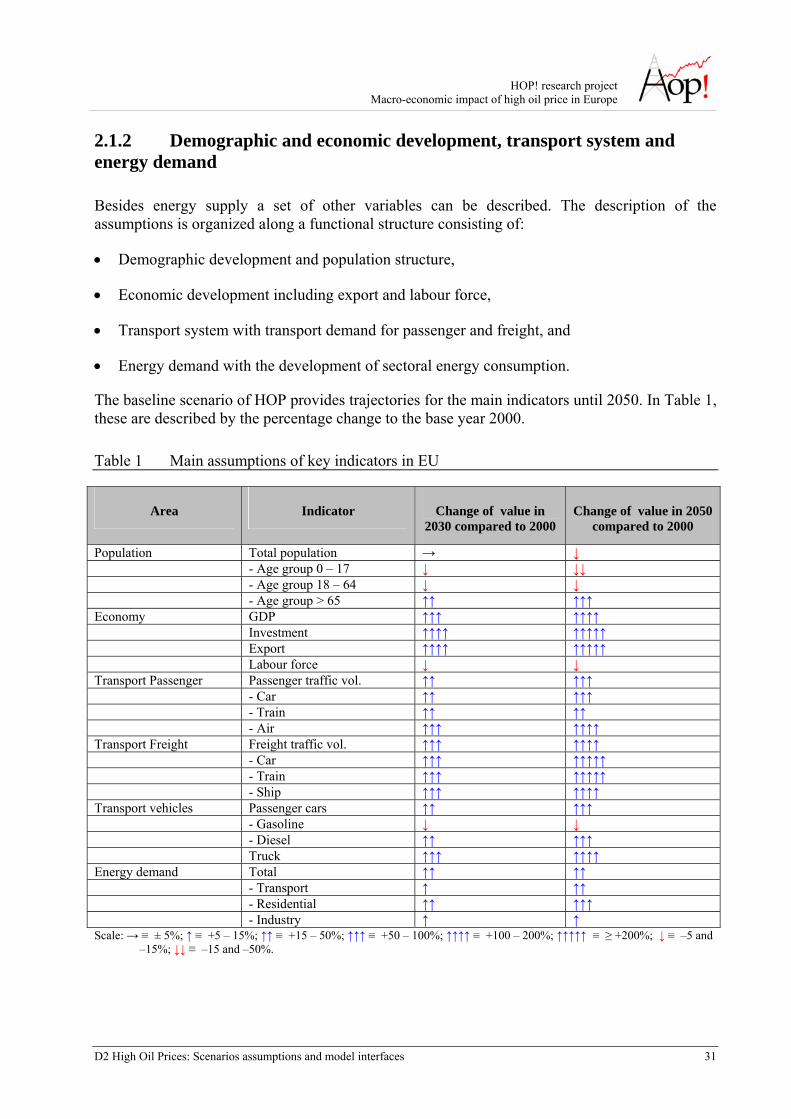
HOP! research project Macro-economic impact of high oil price in Europe
D2 High Oil Prices: Scenarios assumptions and model interfaces 31
2.1.2 Demographic and economic development, transport system and energy demand
Besides energy supply a set of other variables can be described. The description of the assumptions is organized along a functional structure consisting of:
• Demographic development and population structure,
• Economic development including export and labour force,
• Transport system with transport demand for passenger and freight, and
• Energy demand with the development of sectoral energy consumption.
The baseline scenario of HOP provides trajectories for the main indicators until 2050. In Table 1, these are described by the percentage change to the base year 2000.
Table 1 Main assumptions of key indicators in EU
Area Indicator Change of value in 2030 compared to 2000
Change of value in 2050 compared to 2000
Population Total population → ↓ - Age group 0 – 17 ↓ ↓↓ - Age group 18 – 64 ↓ ↓ - Age group > 65 ↑↑ ↑↑↑ Economy GDP ↑↑↑ ↑↑↑↑ Investment ↑↑↑↑ ↑↑↑↑↑ Export ↑↑↑↑ ↑↑↑↑↑ Labour force ↓ ↓ Transport Passenger Passenger traffic vol. ↑↑ ↑↑↑ - Car ↑↑ ↑↑↑ - Train ↑↑ ↑↑ - Air ↑↑↑ ↑↑↑↑ Transport Freight Freight traffic vol. ↑↑↑ ↑↑↑↑ - Car ↑↑↑ ↑↑↑↑↑ - Train ↑↑↑ ↑↑↑↑↑ - Ship ↑↑↑ ↑↑↑↑ Transport vehicles Passenger cars ↑↑ ↑↑↑ - Gasoline ↓ ↓ - Diesel ↑↑ ↑↑↑ Truck ↑↑↑ ↑↑↑↑ Energy demand Total ↑↑ ↑↑ - Transport ↑ ↑↑ - Residential ↑↑ ↑↑↑ - Industry ↑ ↑ Scale: → ≡ ± 5%; ↑ ≡ +5 – 15%; ↑↑ ≡ +15 – 50%; ↑↑↑ ≡ +50 – 100%; ↑↑↑↑ ≡ +100 – 200%; ↑↑↑↑↑ ≡ ≥ +200%; ↓ ≡ –5 and
–15%; ↓↓ ≡ –15 and –50%.
HOP! research project Macro-economic impact of high oil price in Europe
D2 High Oil Prices: Scenarios assumptions and model interfaces 32
To make the assumptions clearer the magnitude of changes is expressed by ↑ and ↓ signs which represent a certain range (e.g. ↑ means increase between +5 and + 15%).
The assumptions for the baseline scenario are based on the results of the TRIAS project (Krail et al., 2007) in which a similar modelling approach was conducted. Due to updates of the applied models the HOP baseline might differ slightly form the TRIAS baseline. Nevertheless, the HOP baseline which will be developed in WP3 should be very close to the TRIAS baseline.
2.1.2.1 Population
The first group of Table 1 includes indicators on population. The development of population is expected to remain stable until 2030 and to decline then. The population structure underlines the problem of ageing society in EU27. It is assumed a population structure with more or less significantly increasing population in retirement and decreasing numbers of children. The total number of persons over 65 is expected to nearly double until 2050 (Krail et al., 2007), while birth rates are slightly decreasing, which leads to decrease in the number of children and also in persons between 18 and 65.
It has to be mentioned that many EU27 countries recognised the negative demographic trend and the arising burden on the national economies. Hence, Politicians attached higher value to family issues in order to stop the negative trend. Therefore some uncertainties about the development of population exist. Nevertheless, it is assumed that attempts of regulating the future demographic structure unfold their impact in a long-term perspective. Increasing birth rates due to family-friendly policy impact the economy only earliest decades later when children enter the labour market. World population is expected to grow at a decreasing rate to 8.9 billions in 2050. After 2030, the population in several regions of the world decreases – including China.
2.1.2.2 Economy
The assumed development of GDP is founded on the baseline of the European ADAM project (Adam, 2007). GDP in EU nearly triples between 2000 and 2050, which is equivalent to an annual growth of slightly more than +2 %.
GDP outside EU is based on the projections of WETO-H2 (WETO-H2, 2006). The rate of economic growth in industrialised regions converges to under 2%/yr in the very long-run. Growth in Asian emerging economies falls significantly after 2010, while conversely it accelerates in Africa and the Middle East.
Exports and investments are expected to increase significantly stronger than GDP in EU reaching a quadrupling. Exports constitute one of the most important drivers of economic growth. The high increase of exports is a prolongation of current trends and reflects the strong market position of EU in the further process of globalisation. In line with exports similar trends are assumed for investments.
The only indicator that remains nearly stable over the whole time horizon is labour force due to the already mentioned development of population structure. On one hand employment in the
HOP! research project Macro-economic impact of high oil price in Europe
D2 High Oil Prices: Scenarios assumptions and model interfaces 33
government sector should decline due to concepts like the lean state and the continued privatisation of former governmental activities like health care (e.g. hospitals) or education. On the other hand, this might be balanced out by developments in service sectors which continue to experience growth.
2.1.2.3 Transport
Passenger
With respect to the trend of personal mobility, an increment of traffic volume is assumed for each mode of passenger transport but at different speed. Air transport is expected to grow more than any other mode doubling the total number of passengers-km at horizon of the year 2050. Also a high growth rate is expected for passenger transport with private cars, while for rail transport we assume a moderate growth.
The different trends of the modes lead to a modification of the modal split. The modal share of car and air is expected to grow. In particular, air becomes the second transport mode in terms of passengers-km, overtaking train. Again these projections are reasonably consistent with observed data.
Freight
For EU the baseline projects that in the year 2050 the amount of tonnes-km will be tripled with respect to the year 2000. Road is expected to grow faster than its competitors – rail and maritime – but rail growth should be faster than maritime’s. In the recent past maritime has actually shown larger growth rates than rail, so from this point of view the baseline introduces a break in the series.
Rail maintains its share even if the road freight grows much faster. As road and maritime usually are not direct competitors (road is used on shorter distances and for smaller loads), the evolution of mode shares suggests a double shift: from rail to road and from ship to rail. At the basis of this mode shift there is the different development of the economic sectors. Coastal ships are mainly used for bulk goods (oil products, irons, cereals, etc.) whose relevance on the intra-EU trade is decreasing over time. Container ships are especially used to and from overseas, while within EU rail is an alternative mode for this share of traffic, which is the fastest developing one. Therefore, the baseline suggests that the future freight demand will be larger and differently composed, higher value goods will be a higher share of total traffic and therefore modes like rail and especially road will be preferred to ship.
Vehicle fleet
Despite stabilisation of the population, the car fleet continues to grow significantly. One major reason is the catching- up of the new EU member states in terms of car-ownership. Further in some countries income continues to grow strongly, which is one of the strongest drivers of car purchase. For the vehicle fleet we assume a strong growth from less than 200 Mio registered cars in 2000 to more than 300 Mio cars until 2030. The most significant trend concerns the rise of
HOP! research project Macro-economic impact of high oil price in Europe
D2 High Oil Prices: Scenarios assumptions and model interfaces 34
diesel cars. Since the beginning of the 1990ies the share of diesel cars on EU27 car fleets grew strongly. Innovative new diesel technologies like common rail or unit injector system improved the efficiency of diesel cars and made them more and more attractive in the context of rising fuel prices. It is assumed that the number of diesel cars reach the level of gasoline cars. Furthermore, it is expected that also bioethanol and natural gas cars enter the market with a share between 5 and 15%.
The assumptions on transport performance presented in the previous chapter show the difference between passenger and freight transport. Therefore, it is assumed that heavy and light duty vehicle fleets to grow significantly. The truck fleet should double until 2030 and even more than triple until 2050.
2.1.2.4 Energy Demand
Primary energy consumption in EU is expected to increase with around 40% between 2000 and 2050 (WETO-H2). The increase of primary energy demand is moderate and slower than elsewhere in the world. We assume that oil and gas demand will increase until 2020 and will then decrease due to higher prices. Coal use and energy consumption that stem from renewables and nuclear energy are expected to rise instead.
The composition of final energy demand by sector is assumed to change. While for the residential and service (including and agriculture) sectors we assume a growth higher than 50% between 2000 and 2050, following the trends observed in the past decades, the increase in the transport and the industrial sector might be much smaller. The growth in the services and residential sector is driven by the growing need of electricity. This new pattern in energy demand might be interpreted as the energy dimension of the “third industrial revolution” characterised by the swift development of electricity intensive ICTs (Information and Communication Technologies). The growth for transport bases on the development of the transport performance. The impact of increasing transport performance is limited by improvements in fuel efficiency.
In conclusion, the section above describes the assumed trends for population, economy, transport and energy demand of the baseline scenario. It provides us with assumptions on trends and developments in order to get a broad picture of the baseline scenario. The scenario describes only one of many possible futures. For some of the assumptions there exist, of course, uncertainty as mentioned e.g. on the assumptions on population.
In the next step, a set of high oil price scenario will be developed starting from the baseline scenario. In those high oil price scenarios, a number of assumptions in the field of energy supply and demand are modified compared to the baseline. In a last step, the high oil price scenarios will be assessed by comparing them with the baseline.
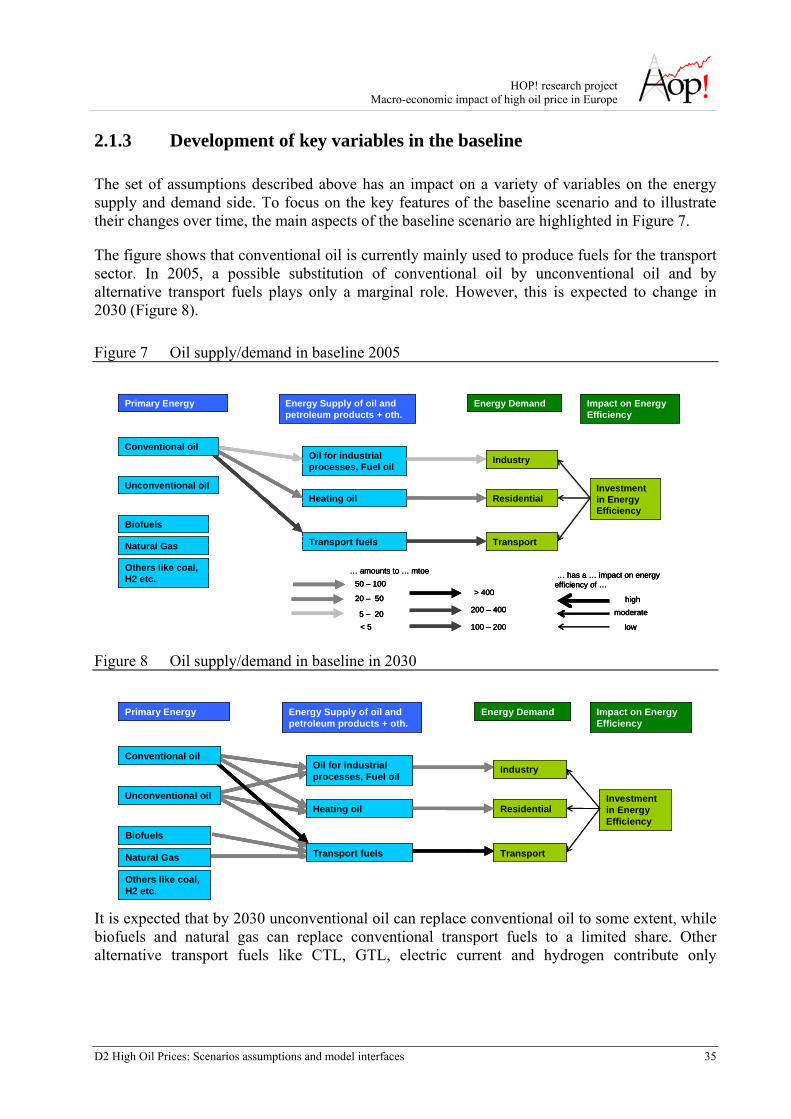
HOP! research project Macro-economic impact of high oil price in Europe
D2 High Oil Prices: Scenarios assumptions and model interfaces 35
2.1.3 Development of key variables in the baseline
The set of assumptions described above has an impact on a variety of variables on the energy supply and demand side. To focus on the key features of the baseline scenario and to illustrate their changes over time, the main aspects of the baseline scenario are highlighted in Figure 7.
The figure shows that conventional oil is currently mainly used to produce fuels for the transport sector. In 2005, a possible substitution of conventional oil by unconventional oil and by alternative transport fuels plays only a marginal role. However, this is expected to change in 2030 (Figure 8).
Figure 7 Oil supply/demand in baseline 2005
low
moderatehigh
… has a … impact on energy efficiency of …
20 – 50
5 – 20< 5
50 – 100
100 – 200
200 – 400
> 400
… amounts to … mtoe
Investment in Energy Efficiency
Impact on Energy Efficiency
Transport fuels
Heating oil
Oil for industrial processes, Fuel oil
Transport
Residential
Industry
Primary Energy Energy Supply of oil and petroleum products + oth.
Energy Demand
Biofuels
Natural Gas
Others like coal, H2 etc.
Conventional oil
Unconventional oil
low
moderatehigh
… has a … impact on energy efficiency of …
low
moderatehigh
… has a … impact on energy efficiency of …
20 – 50
5 – 20< 5
50 – 100
100 – 200
200 – 400
> 400
… amounts to … mtoe
20 – 50
5 – 20< 5
50 – 100
100 – 200
200 – 400
> 400
… amounts to … mtoe
Investment in Energy Efficiency
Impact on Energy Efficiency
Transport fuels
Heating oil
Oil for industrial processes, Fuel oil
Transport
Residential
Industry
Primary Energy Energy Supply of oil and petroleum products + oth.
Energy Demand
Biofuels
Natural Gas
Others like coal, H2 etc.
Conventional oil
Unconventional oil
Figure 8 Oil supply/demand in baseline in 2030
Investment in Energy Efficiency
Impact on Energy Efficiency
Transport fuels
Heating oil
Oil for industrial processes, Fuel oil
Transport
Residential
Industry
Primary Energy Energy Supply of oil and petroleum products + oth.
Energy Demand
Biofuels
Natural Gas
Others like coal, H2 etc.
Conventional oil
Unconventional oil Investment in Energy Efficiency
Impact on Energy Efficiency
Transport fuels
Heating oil
Oil for industrial processes, Fuel oil
Transport
Residential
Industry
Primary Energy Energy Supply of oil and petroleum products + oth.
Energy Demand
Biofuels
Natural Gas
Others like coal, H2 etc.
Conventional oil
Unconventional oil
It is expected that by 2030 unconventional oil can replace conventional oil to some extent, while biofuels and natural gas can replace conventional transport fuels to a limited share. Other alternative transport fuels like CTL, GTL, electric current and hydrogen contribute only
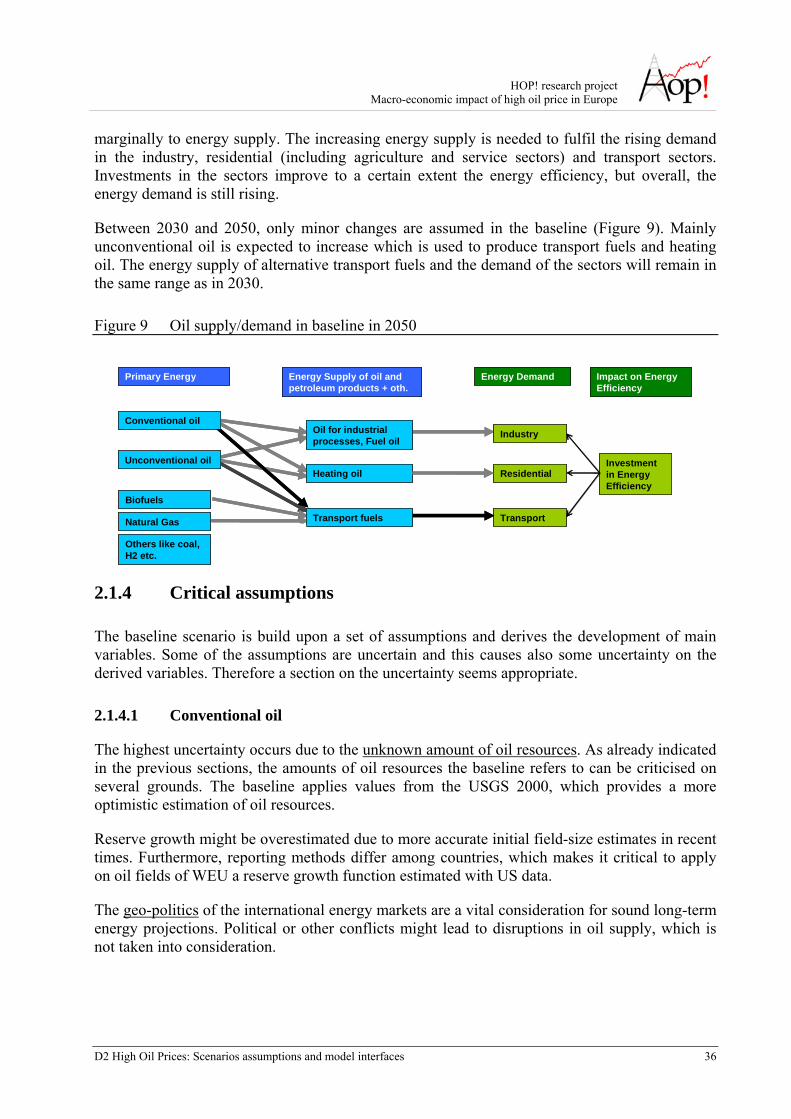
HOP! research project Macro-economic impact of high oil price in Europe
D2 High Oil Prices: Scenarios assumptions and model interfaces 36
marginally to energy supply. The increasing energy supply is needed to fulfil the rising demand in the industry, residential (including agriculture and service sectors) and transport sectors. Investments in the sectors improve to a certain extent the energy efficiency, but overall, the energy demand is still rising.
Between 2030 and 2050, only minor changes are assumed in the baseline (Figure 9). Mainly unconventional oil is expected to increase which is used to produce transport fuels and heating oil. The energy supply of alternative transport fuels and the demand of the sectors will remain in the same range as in 2030.
Figure 9 Oil supply/demand in baseline in 2050
Investment in Energy Efficiency
Impact on Energy Efficiency
Transport fuels
Heating oil
Oil for industrial processes, Fuel oil
Transport
Residential
Industry
Primary Energy Energy Supply of oil and petroleum products + oth.
Energy Demand
Biofuels
Natural Gas
Others like coal, H2 etc.
Conventional oil
Unconventional oil Investment in Energy Efficiency
Impact on Energy Efficiency
Transport fuels
Heating oil
Oil for industrial processes, Fuel oil
Transport
Residential
Industry
Primary Energy Energy Supply of oil and petroleum products + oth.
Energy Demand
Biofuels
Natural Gas
Others like coal, H2 etc.
Conventional oil
Unconventional oil
2.1.4 Critical assumptions
The baseline scenario is build upon a set of assumptions and derives the development of main variables. Some of the assumptions are uncertain and this causes also some uncertainty on the derived variables. Therefore a section on the uncertainty seems appropriate.
2.1.4.1 Conventional oil
The highest uncertainty occurs due to the unknown amount of oil resources. As already indicated in the previous sections, the amounts of oil resources the baseline refers to can be criticised on several grounds. The baseline applies values from the USGS 2000, which provides a more optimistic estimation of oil resources.
Reserve growth might be overestimated due to more accurate initial field-size estimates in recent times. Furthermore, reporting methods differ among countries, which makes it critical to apply on oil fields of WEU a reserve growth function estimated with US data.
The geo-politics of the international energy markets are a vital consideration for sound long-term energy projections. Political or other conflicts might lead to disruptions in oil supply, which is not taken into consideration.
HOP! research project Macro-economic impact of high oil price in Europe
D2 High Oil Prices: Scenarios assumptions and model interfaces 37
2.1.4.2 Unconventional oil
Technology development will be critical in shaping the future energy system. A thorough examination of the technical possibilities for the next 50 years suggests new portfolios of energy technologies will challenge conventional ones. Assumptions on the use of unconventional oil base on a positive technological development to exploit unconventional oil.
Strongly linked with the energy technology is also the question on the development of production cost. The current objective in the exploitation of unconventional oil is to develop technologies, which lower the costs of production (IEA, 2005). But uncertainty on the development of the necessary technology and the expected drop of production cost remains.
2.1.4.3 Alternative transport fuels
Although some of the alternative transport fuels like biofuels are far more advanced the uncertainties are similar to the uncertainties for unconventional oil. The assumed market shares of alternative transport fuels base on positive development of the production technologies and a decline of the production costs. E.g. it is assumed that the of production cost of the 2nd generation of biofuels decline and therefore gain a considerable share already in the baseline.
But alternative transport fuels could enter the market to much larger extent. In the case of hydrogen breakthroughs in the development could lead to a larger deployment. As the cost of production depends strongly on economies of scale as well as economies of scope their market share could strongly increase.
2.1.4.4 Energy demand
There is some uncertainty on the assumed economic development and the expected economic growth rates. The economic development has huge impact on energy demand.
Primary energy consumption in EU is expected to increase strongly between 2000 and 2050, driven by a steep rise of electricity demand in the residential and tertiary sector and of transport fuels. However, the impact of increasing transport performance is limited by improvements in fuel efficiency. In this sense the assumption on improvements on fuel efficiency is quite relevant for the projection of demand for transport fuel. Of course, the role of investment in fuel efficiency and the acceptance of the market participants have to be stressed in this context. So, the amount of investment and other factors create some uncertainty on the projection of energy demand.
2.1.4.5 Other uncertainties
The population of EU is expected to stabilize until 2030 and then to decline until 2050. This could also be uncertain due to political efforts to change the declining trends.
HOP! research project Macro-economic impact of high oil price in Europe
D2 High Oil Prices: Scenarios assumptions and model interfaces 38
2.2 The HOP! scenarios
2.2.1 Overview on HOP! scenarios
The HOP! scenarios are used to the explore the impact of high oil price. Even though the focus of the study lies in the assessment of the impacts of high oil prices, it shall be noted that the oil price development is not directly an exogenous assumption, but it is obtained as a result of other hypotheses concerning energy supply, technologies etc. Tests with the parameters of the model will be carried out in order to ensure that adequately high oil prices are simulated in each scenario.
In this chapter we develop a set of plausible high oil prices scenarios. They differ in a number of assumptions from the baseline. For the sake of simplification the different assumptions can be grouped together. By grouping them we receive that the scenarios differ mainly in four different categories:
• Level of conventional oil reserves
• Availability and competitiveness of unconventional oil
• Availability and competitiveness alternative transport fuels
• Energy efficiency
Each of the four categories can have one of the values: high, moderate, low, very low. As the baseline applies the mean value of USGS 2000, it assumes e.g. high level of conventional oil reserves (see Table 4). At the same time we can also say that the baseline implicitly assumes high availability and competitiveness of unconventional oil, and a low availability and competitiveness of alternative transport fuels. While for the improvements in energy efficiency trends of the past are expected to continue (low).
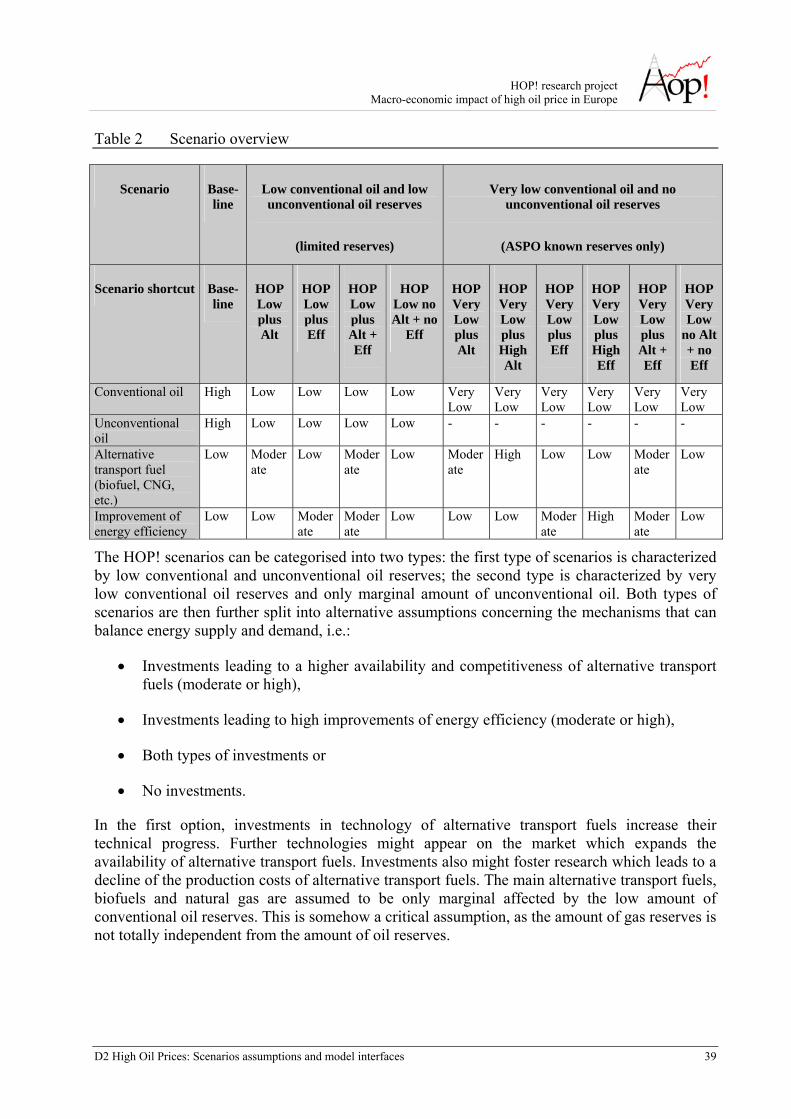
HOP! research project Macro-economic impact of high oil price in Europe
D2 High Oil Prices: Scenarios assumptions and model interfaces 39
Table 2 Scenario overview
Scenario Base-line
Low conventional oil and low unconventional oil reserves
(limited reserves)
Very low conventional oil and no unconventional oil reserves
(ASPO known reserves only)
Scenario shortcut Base-line
HOP Low plus Alt
HOP Low plus Eff
HOP Low plus Alt + Eff
HOP Low no Alt + no
Eff
HOP Very Low plus Alt
HOP Very Low plus High Alt
HOP Very Low plus Eff
HOP Very Low plus High Eff
HOP Very Low plus Alt + Eff
HOP Very Low
no Alt + no Eff
Conventional oil High Low Low Low Low Very Low
Very Low
Very Low
Very Low
Very Low
Very Low
Unconventional oil
High Low Low Low Low - - - - - -
Alternative transport fuel (biofuel, CNG, etc.)
Low Moderate
Low Moderate
Low Moderate
High Low Low Moderate
Low
Improvement of energy efficiency
Low Low Moderate
Moderate
Low Low Low Moderate
High Moderate
Low
The HOP! scenarios can be categorised into two types: the first type of scenarios is characterized by low conventional and unconventional oil reserves; the second type is characterized by very low conventional oil reserves and only marginal amount of unconventional oil. Both types of scenarios are then further split into alternative assumptions concerning the mechanisms that can balance energy supply and demand, i.e.:
• Investments leading to a higher availability and competitiveness of alternative transport fuels (moderate or high),
• Investments leading to high improvements of energy efficiency (moderate or high),
• Both types of investments or
• No investments.
In the first option, investments in technology of alternative transport fuels increase their technical progress. Further technologies might appear on the market which expands the availability of alternative transport fuels. Investments also might foster research which leads to a decline of the production costs of alternative transport fuels. The main alternative transport fuels, biofuels and natural gas are assumed to be only marginal affected by the low amount of conventional oil reserves. This is somehow a critical assumption, as the amount of gas reserves is not totally independent from the amount of oil reserves.
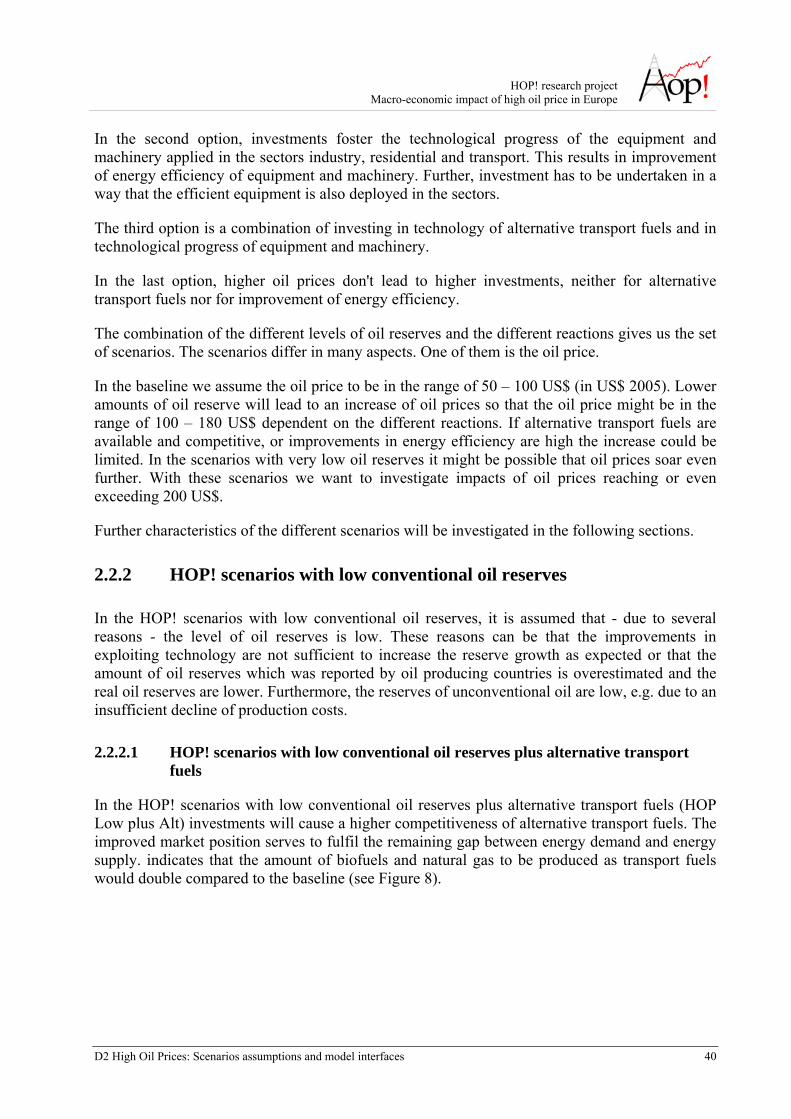
HOP! research project Macro-economic impact of high oil price in Europe
D2 High Oil Prices: Scenarios assumptions and model interfaces 40
In the second option, investments foster the technological progress of the equipment and machinery applied in the sectors industry, residential and transport. This results in improvement of energy efficiency of equipment and machinery. Further, investment has to be undertaken in a way that the efficient equipment is also deployed in the sectors.
The third option is a combination of investing in technology of alternative transport fuels and in technological progress of equipment and machinery.
In the last option, higher oil prices don't lead to higher investments, neither for alternative transport fuels nor for improvement of energy efficiency.
The combination of the different levels of oil reserves and the different reactions gives us the set of scenarios. The scenarios differ in many aspects. One of them is the oil price.
In the baseline we assume the oil price to be in the range of 50 – 100 US$ (in US$ 2005). Lower amounts of oil reserve will lead to an increase of oil prices so that the oil price might be in the range of 100 – 180 US$ dependent on the different reactions. If alternative transport fuels are available and competitive, or improvements in energy efficiency are high the increase could be limited. In the scenarios with very low oil reserves it might be possible that oil prices soar even further. With these scenarios we want to investigate impacts of oil prices reaching or even exceeding 200 US$.
Further characteristics of the different scenarios will be investigated in the following sections.
2.2.2 HOP! scenarios with low conventional oil reserves
In the HOP! scenarios with low conventional oil reserves, it is assumed that - due to several reasons - the level of oil reserves is low. These reasons can be that the improvements in exploiting technology are not sufficient to increase the reserve growth as expected or that the amount of oil reserves which was reported by oil producing countries is overestimated and the real oil reserves are lower. Furthermore, the reserves of unconventional oil are low, e.g. due to an insufficient decline of production costs.
2.2.2.1 HOP! scenarios with low conventional oil reserves plus alternative transport fuels
In the HOP! scenarios with low conventional oil reserves plus alternative transport fuels (HOP Low plus Alt) investments will cause a higher competitiveness of alternative transport fuels. The improved market position serves to fulfil the remaining gap between energy demand and energy supply. indicates that the amount of biofuels and natural gas to be produced as transport fuels would double compared to the baseline (see Figure 8).
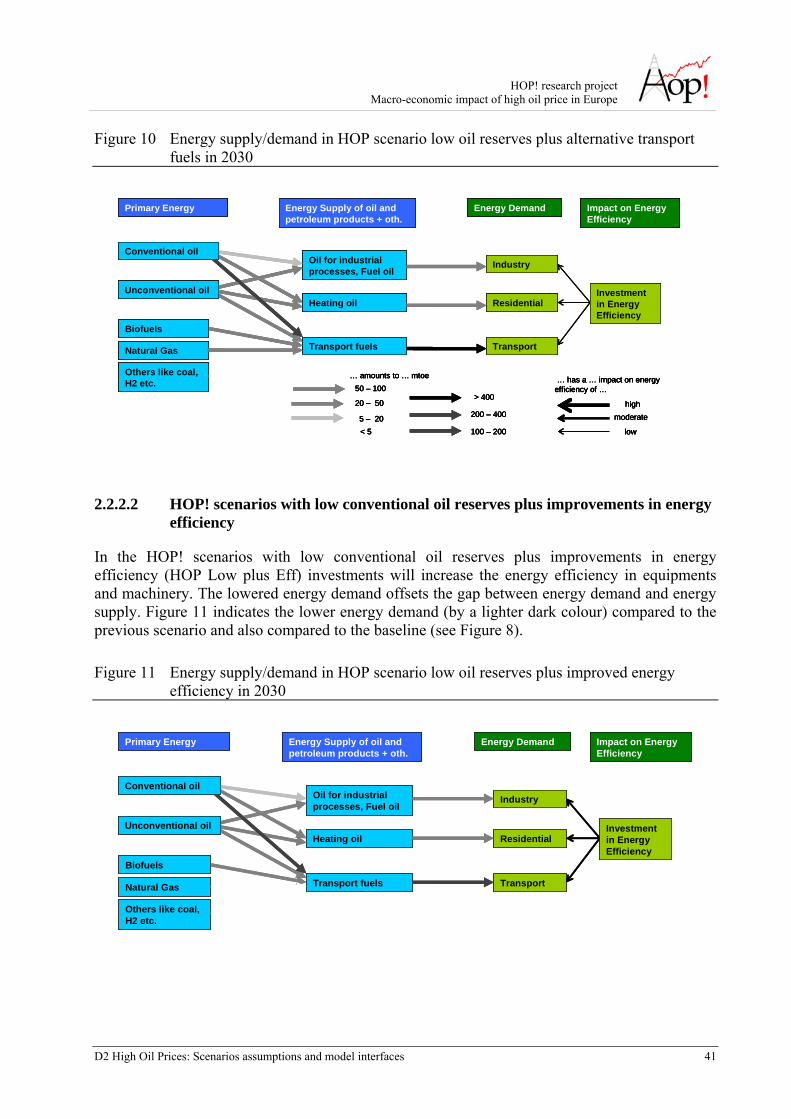
HOP! research project Macro-economic impact of high oil price in Europe
D2 High Oil Prices: Scenarios assumptions and model interfaces 41
Figure 10 Energy supply/demand in HOP scenario low oil reserves plus alternative transport fuels in 2030
low
moderatehigh
… has a … impact on energy efficiency of …
20 – 50
5 – 20< 5
50 – 100
100 – 200
200 – 400
> 400
… amounts to … mtoe
Transport fuels
Heating oil
Oil for industrial processes, Fuel oil
Transport
Residential
Industry
Energy Supply of oil and petroleum products + oth.
Energy Demand Impact on Energy Efficiency
Biofuels
Natural Gas
Others like coal, H2 etc.
Investment in Energy Efficiency
Primary Energy
Conventional oil
Unconventional oil
low
moderatehigh
… has a … impact on energy efficiency of …
20 – 50
5 – 20< 5
50 – 100
100 – 200
200 – 400
> 400
… amounts to … mtoe
low
moderatehigh
… has a … impact on energy efficiency of …
low
moderatehigh
… has a … impact on energy efficiency of …
20 – 50
5 – 20< 5
50 – 100
100 – 200
200 – 400
> 400
… amounts to … mtoe
20 – 50
5 – 20< 5
50 – 100
100 – 200
200 – 400
> 400
… amounts to … mtoe
Transport fuels
Heating oil
Oil for industrial processes, Fuel oil
Transport
Residential
Industry
Energy Supply of oil and petroleum products + oth.
Energy Demand Impact on Energy Efficiency
Biofuels
Natural Gas
Others like coal, H2 etc.
Investment in Energy Efficiency
Primary Energy
Conventional oil
Unconventional oil
2.2.2.2 HOP! scenarios with low conventional oil reserves plus improvements in energy efficiency
In the HOP! scenarios with low conventional oil reserves plus improvements in energy efficiency (HOP Low plus Eff) investments will increase the energy efficiency in equipments and machinery. The lowered energy demand offsets the gap between energy demand and energy supply. Figure 11 indicates the lower energy demand (by a lighter dark colour) compared to the previous scenario and also compared to the baseline (see Figure 8).
Figure 11 Energy supply/demand in HOP scenario low oil reserves plus improved energy efficiency in 2030
Transport fuels
Heating oil
Oil for industrial processes, Fuel oil
Transport
Residential
Industry
Energy Supply of oil and petroleum products + oth.
Energy Demand Impact on Energy Efficiency
Biofuels
Natural Gas
Others like coal, H2 etc.
Investment in Energy Efficiency
Primary Energy
Conventional oil
Unconventional oil
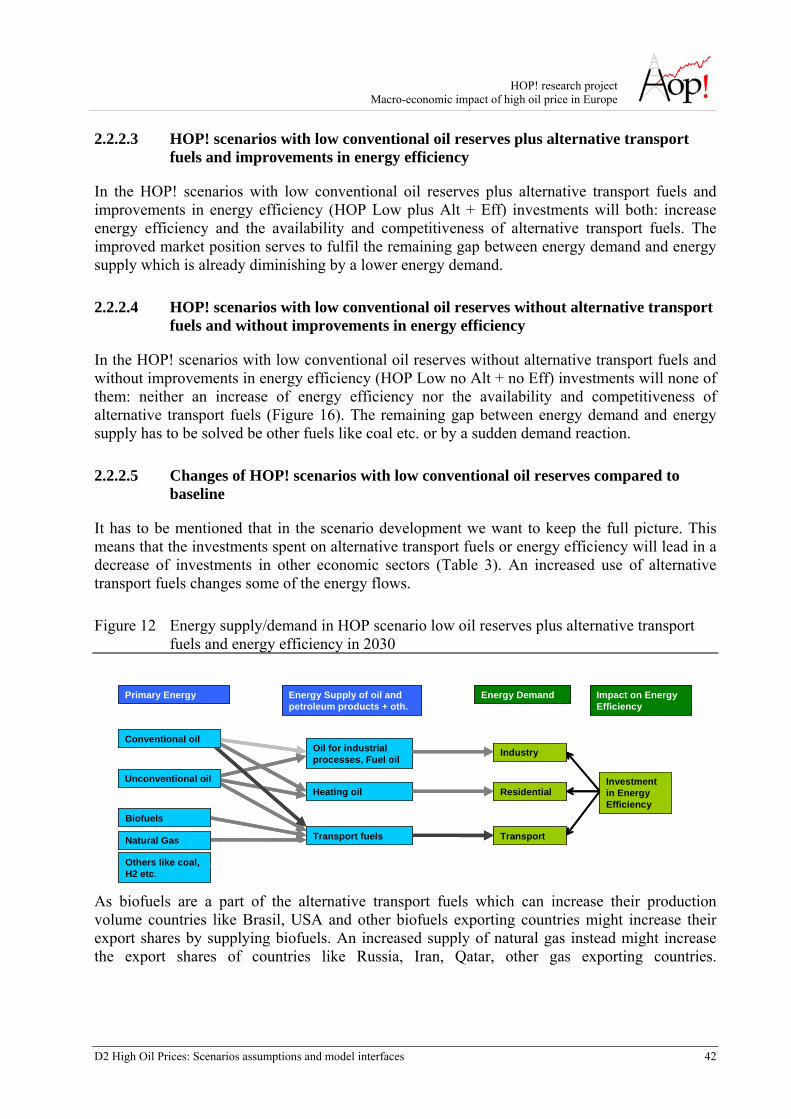
HOP! research project Macro-economic impact of high oil price in Europe
D2 High Oil Prices: Scenarios assumptions and model interfaces 42
2.2.2.3 HOP! scenarios with low conventional oil reserves plus alternative transport fuels and improvements in energy efficiency
In the HOP! scenarios with low conventional oil reserves plus alternative transport fuels and improvements in energy efficiency (HOP Low plus Alt + Eff) investments will both: increase energy efficiency and the availability and competitiveness of alternative transport fuels. The improved market position serves to fulfil the remaining gap between energy demand and energy supply which is already diminishing by a lower energy demand.
2.2.2.4 HOP! scenarios with low conventional oil reserves without alternative transport fuels and without improvements in energy efficiency
In the HOP! scenarios with low conventional oil reserves without alternative transport fuels and without improvements in energy efficiency (HOP Low no Alt + no Eff) investments will none of them: neither an increase of energy efficiency nor the availability and competitiveness of alternative transport fuels (Figure 16). The remaining gap between energy demand and energy supply has to be solved be other fuels like coal etc. or by a sudden demand reaction.
2.2.2.5 Changes of HOP! scenarios with low conventional oil reserves compared to baseline
It has to be mentioned that in the scenario development we want to keep the full picture. This means that the investments spent on alternative transport fuels or energy efficiency will lead in a decrease of investments in other economic sectors (Table 3). An increased use of alternative transport fuels changes some of the energy flows.
Figure 12 Energy supply/demand in HOP scenario low oil reserves plus alternative transport fuels and energy efficiency in 2030
Transport fuels
Heating oil
Oil for industrial processes, Fuel oil
Transport
Residential
Industry
Energy Supply of oil and petroleum products + oth.
Energy Demand Impact on Energy Efficiency
Biofuels
Natural Gas
Others like coal, H2 etc.
Investment in Energy Efficiency
Primary Energy
Conventional oil
Unconventional oil
As biofuels are a part of the alternative transport fuels which can increase their production volume countries like Brasil, USA and other biofuels exporting countries might increase their export shares by supplying biofuels. An increased supply of natural gas instead might increase the export shares of countries like Russia, Iran, Qatar, other gas exporting countries.
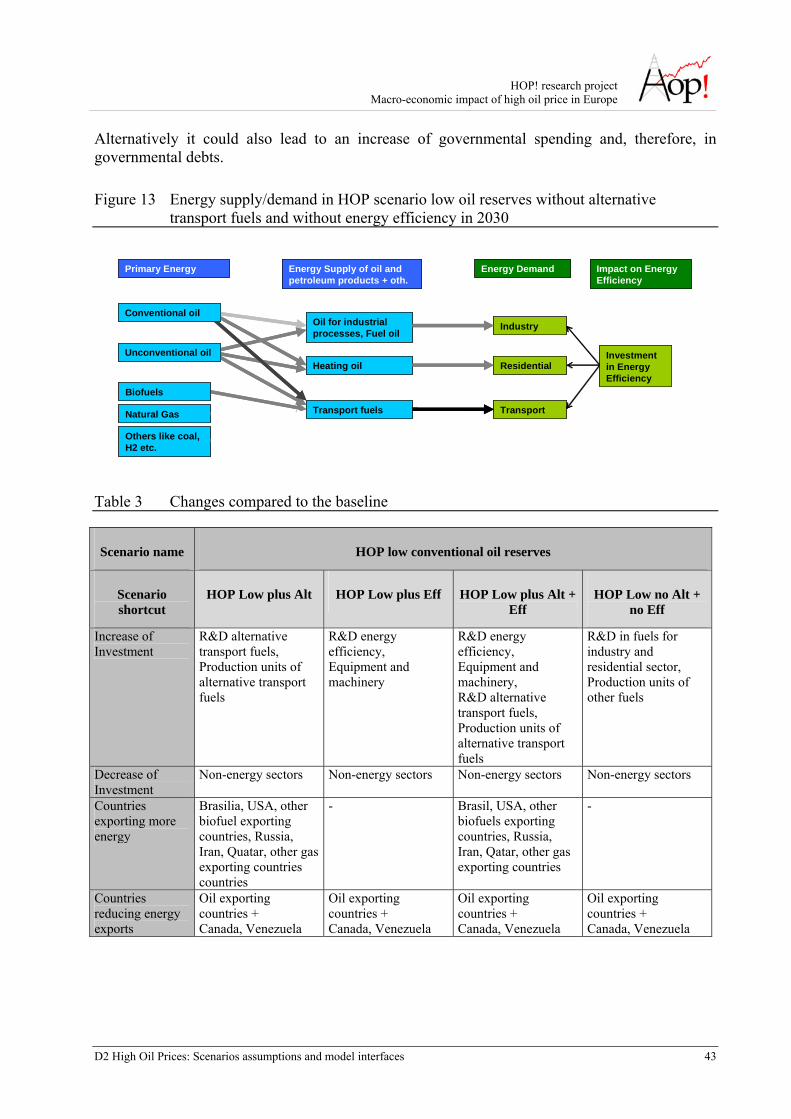
HOP! research project Macro-economic impact of high oil price in Europe
D2 High Oil Prices: Scenarios assumptions and model interfaces 43
Alternatively it could also lead to an increase of governmental spending and, therefore, in governmental debts.
Figure 13 Energy supply/demand in HOP scenario low oil reserves without alternative transport fuels and without energy efficiency in 2030
Transport fuels
Heating oil
Oil for industrial processes, Fuel oil
Transport
Residential
Industry
Energy Supply of oil and petroleum products + oth.
Energy Demand Impact on Energy Efficiency
Biofuels
Natural Gas
Others like coal, H2 etc.
Investment in Energy Efficiency
Primary Energy
Conventional oil
Unconventional oil
Table 3 Changes compared to the baseline
Scenario name HOP low conventional oil reserves
Scenario shortcut
HOP Low plus Alt HOP Low plus Eff HOP Low plus Alt + Eff
HOP Low no Alt + no Eff
Increase of Investment
R&D alternative transport fuels, Production units of alternative transport fuels
R&D energy efficiency, Equipment and machinery
R&D energy efficiency, Equipment and machinery, R&D alternative transport fuels, Production units of alternative transport fuels
R&D in fuels for industry and residential sector, Production units of other fuels
Decrease of Investment
Non-energy sectors Non-energy sectors Non-energy sectors Non-energy sectors
Countries exporting more energy
Brasilia, USA, other biofuel exporting countries, Russia, Iran, Quatar, other gas exporting countries countries
- Brasil, USA, other biofuels exporting countries, Russia, Iran, Qatar, other gas exporting countries
-
Countries reducing energy exports
Oil exporting countries + Canada, Venezuela
Oil exporting countries + Canada, Venezuela
Oil exporting countries + Canada, Venezuela
Oil exporting countries + Canada, Venezuela
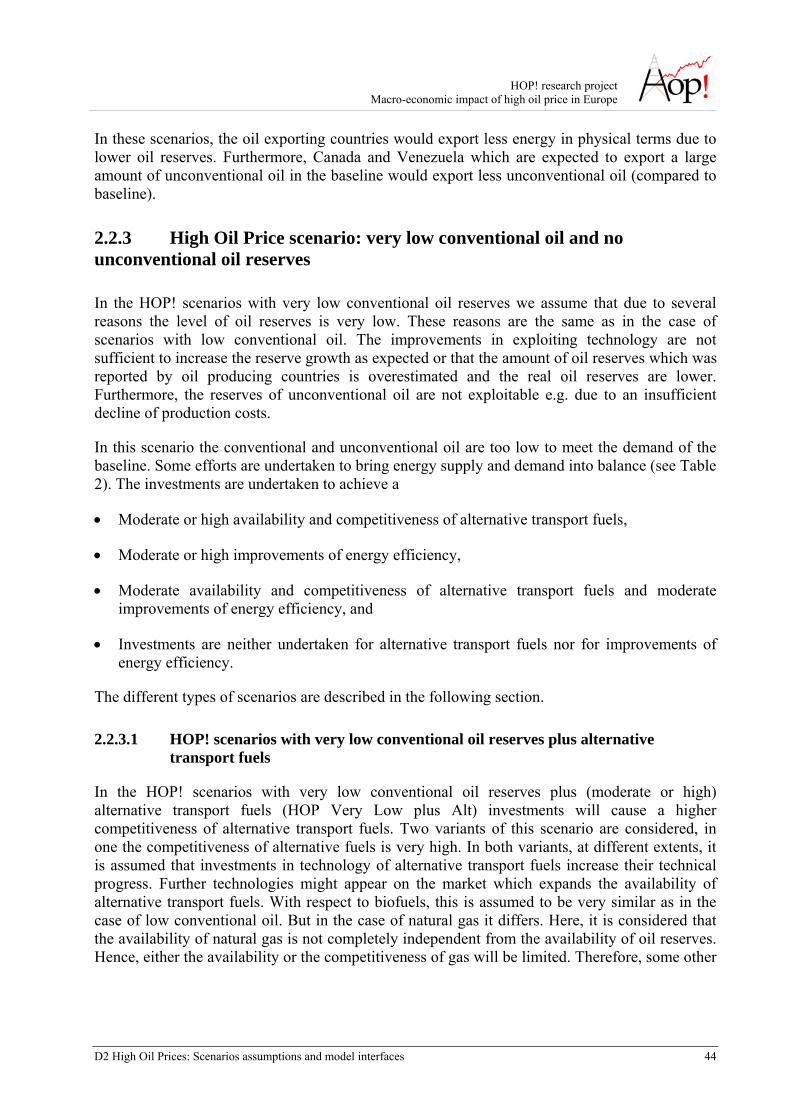
HOP! research project Macro-economic impact of high oil price in Europe
D2 High Oil Prices: Scenarios assumptions and model interfaces 44
In these scenarios, the oil exporting countries would export less energy in physical terms due to lower oil reserves. Furthermore, Canada and Venezuela which are expected to export a large amount of unconventional oil in the baseline would export less unconventional oil (compared to baseline).
2.2.3 High Oil Price scenario: very low conventional oil and no unconventional oil reserves
In the HOP! scenarios with very low conventional oil reserves we assume that due to several reasons the level of oil reserves is very low. These reasons are the same as in the case of scenarios with low conventional oil. The improvements in exploiting technology are not sufficient to increase the reserve growth as expected or that the amount of oil reserves which was reported by oil producing countries is overestimated and the real oil reserves are lower. Furthermore, the reserves of unconventional oil are not exploitable e.g. due to an insufficient decline of production costs.
In this scenario the conventional and unconventional oil are too low to meet the demand of the baseline. Some efforts are undertaken to bring energy supply and demand into balance (see Table 2). The investments are undertaken to achieve a
• Moderate or high availability and competitiveness of alternative transport fuels,
• Moderate or high improvements of energy efficiency,
• Moderate availability and competitiveness of alternative transport fuels and moderate improvements of energy efficiency, and
• Investments are neither undertaken for alternative transport fuels nor for improvements of energy efficiency.
The different types of scenarios are described in the following section.
2.2.3.1 HOP! scenarios with very low conventional oil reserves plus alternative transport fuels
In the HOP! scenarios with very low conventional oil reserves plus (moderate or high) alternative transport fuels (HOP Very Low plus Alt) investments will cause a higher competitiveness of alternative transport fuels. Two variants of this scenario are considered, in one the competitiveness of alternative fuels is very high. In both variants, at different extents, it is assumed that investments in technology of alternative transport fuels increase their technical progress. Further technologies might appear on the market which expands the availability of alternative transport fuels. With respect to biofuels, this is assumed to be very similar as in the case of low conventional oil. But in the case of natural gas it differs. Here, it is considered that the availability of natural gas is not completely independent from the availability of oil reserves. Hence, either the availability or the competitiveness of gas will be limited. Therefore, some other
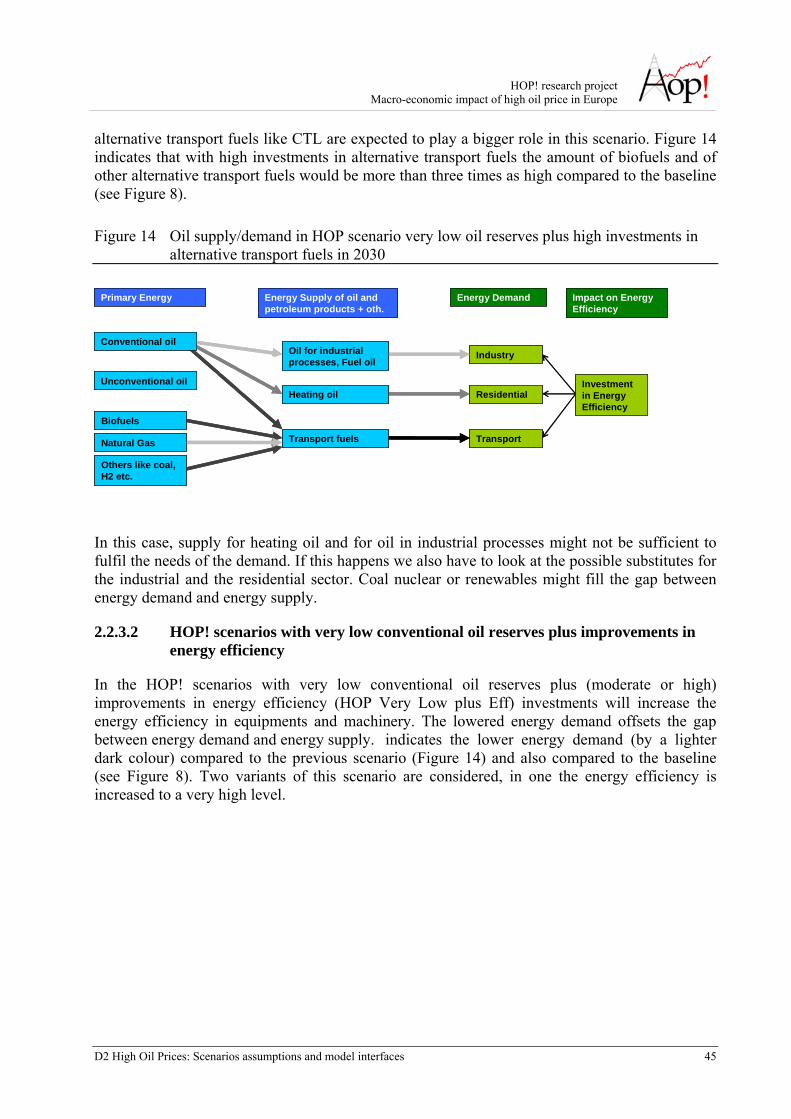
HOP! research project Macro-economic impact of high oil price in Europe
D2 High Oil Prices: Scenarios assumptions and model interfaces 45
alternative transport fuels like CTL are expected to play a bigger role in this scenario. Figure 14 indicates that with high investments in alternative transport fuels the amount of biofuels and of other alternative transport fuels would be more than three times as high compared to the baseline (see Figure 8).
Figure 14 Oil supply/demand in HOP scenario very low oil reserves plus high investments in alternative transport fuels in 2030
Transport
Residential
Industry
Energy Supply of oil and petroleum products + oth.
Energy Demand Impact on Energy Efficiency
Biofuels
Others like coal, H2 etc.
Natural Gas Transport fuels
Heating oil
Oil for industrial processes, Fuel oil
Investment in Energy Efficiency
Primary Energy
Conventional oil
Unconventional oil
In this case, supply for heating oil and for oil in industrial processes might not be sufficient to fulfil the needs of the demand. If this happens we also have to look at the possible substitutes for the industrial and the residential sector. Coal nuclear or renewables might fill the gap between energy demand and energy supply.
2.2.3.2 HOP! scenarios with very low conventional oil reserves plus improvements in energy efficiency
In the HOP! scenarios with very low conventional oil reserves plus (moderate or high) improvements in energy efficiency (HOP Very Low plus Eff) investments will increase the energy efficiency in equipments and machinery. The lowered energy demand offsets the gap between energy demand and energy supply. indicates the lower energy demand (by a lighter dark colour) compared to the previous scenario (Figure 14) and also compared to the baseline (see Figure 8). Two variants of this scenario are considered, in one the energy efficiency is increased to a very high level.
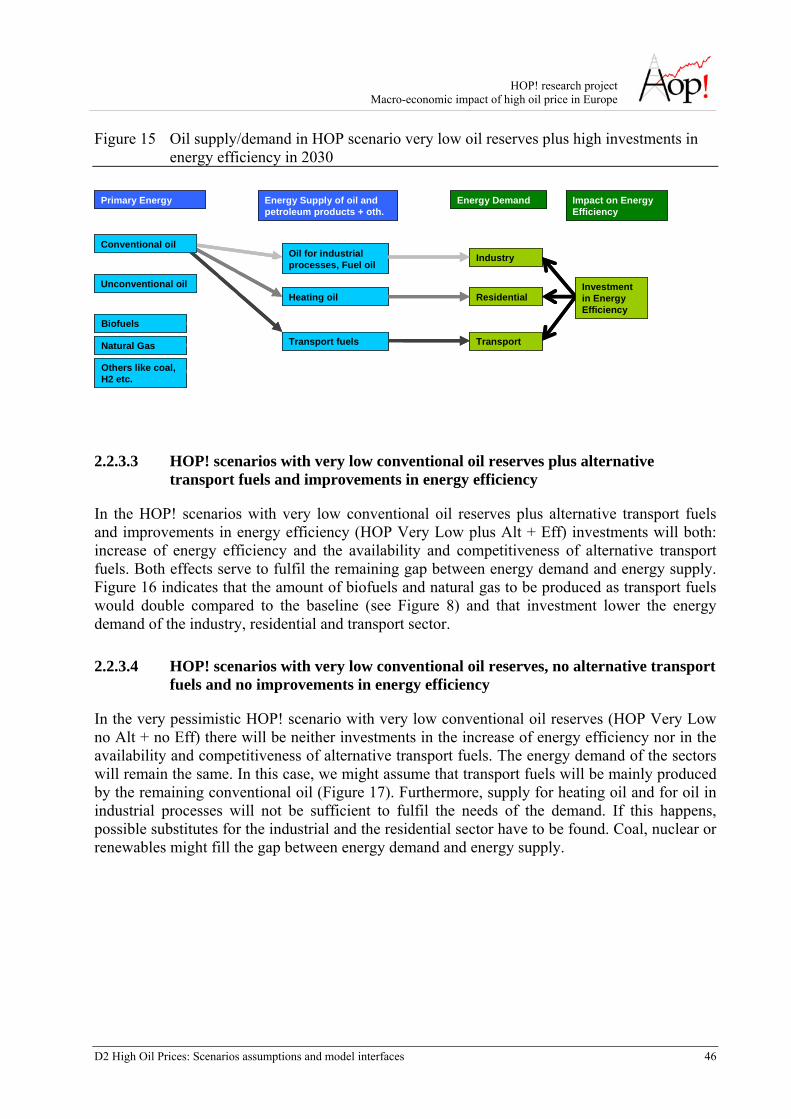
HOP! research project Macro-economic impact of high oil price in Europe
D2 High Oil Prices: Scenarios assumptions and model interfaces 46
Figure 15 Oil supply/demand in HOP scenario very low oil reserves plus high investments in energy efficiency in 2030
Impact on Energy Efficiency
Transport fuels
Heating oil
Oil for industrial processes, Fuel oil
Transport
Residential
Industry
Energy Supply of oil and petroleum products + oth.
Energy Demand
Biofuels
Natural Gas
Others like coal, H2 etc.
Investment in Energy Efficiency
Primary Energy
Conventional oil
Unconventional oil
2.2.3.3 HOP! scenarios with very low conventional oil reserves plus alternative transport fuels and improvements in energy efficiency
In the HOP! scenarios with very low conventional oil reserves plus alternative transport fuels and improvements in energy efficiency (HOP Very Low plus Alt + Eff) investments will both: increase of energy efficiency and the availability and competitiveness of alternative transport fuels. Both effects serve to fulfil the remaining gap between energy demand and energy supply. Figure 16 indicates that the amount of biofuels and natural gas to be produced as transport fuels would double compared to the baseline (see Figure 8) and that investment lower the energy demand of the industry, residential and transport sector.
2.2.3.4 HOP! scenarios with very low conventional oil reserves, no alternative transport fuels and no improvements in energy efficiency
In the very pessimistic HOP! scenario with very low conventional oil reserves (HOP Very Low no Alt + no Eff) there will be neither investments in the increase of energy efficiency nor in the availability and competitiveness of alternative transport fuels. The energy demand of the sectors will remain the same. In this case, we might assume that transport fuels will be mainly produced by the remaining conventional oil (Figure 17). Furthermore, supply for heating oil and for oil in industrial processes will not be sufficient to fulfil the needs of the demand. If this happens, possible substitutes for the industrial and the residential sector have to be found. Coal, nuclear or renewables might fill the gap between energy demand and energy supply.
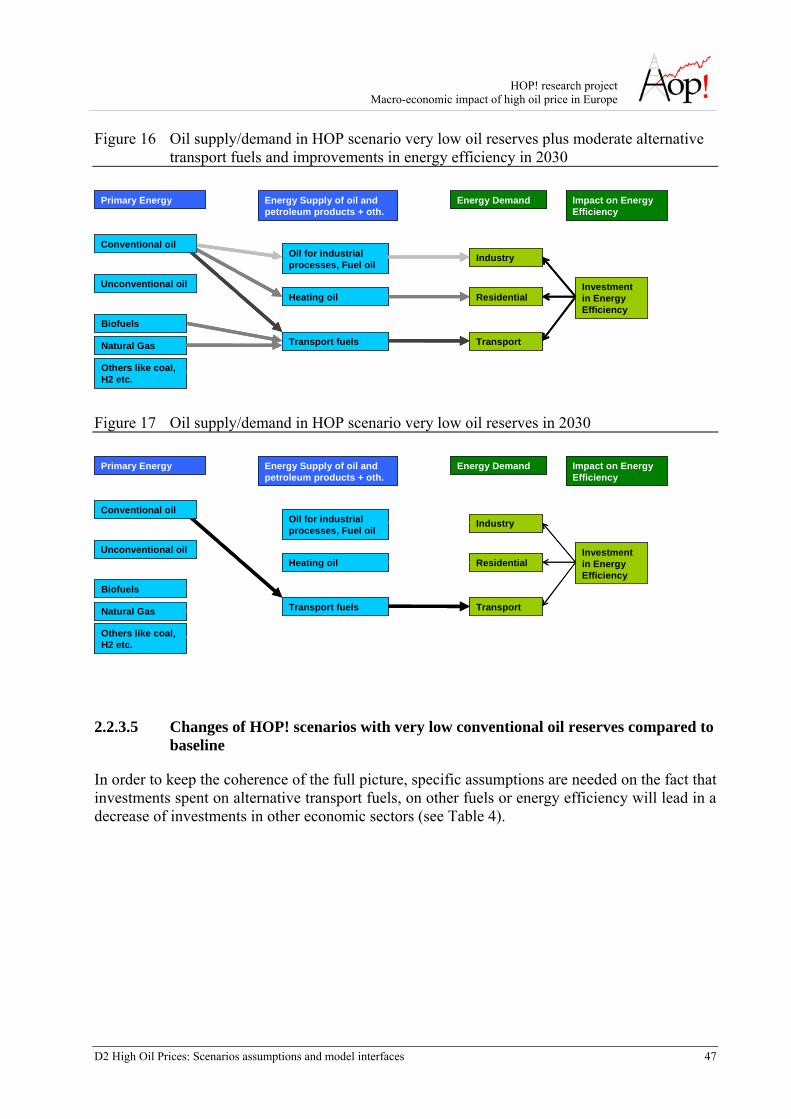
HOP! research project Macro-economic impact of high oil price in Europe
D2 High Oil Prices: Scenarios assumptions and model interfaces 47
Figure 16 Oil supply/demand in HOP scenario very low oil reserves plus moderate alternative transport fuels and improvements in energy efficiency in 2030
Impact on Energy Efficiency
Transport fuels
Heating oil
Oil for industrial processes, Fuel oil
Transport
Residential
Industry
Energy Supply of oil and petroleum products + oth.
Energy Demand
Biofuels
Natural Gas
Others like coal, H2 etc.
Investment in Energy Efficiency
Primary Energy
Conventional oil
Unconventional oil
Figure 17 Oil supply/demand in HOP scenario very low oil reserves in 2030
Transport fuels Transport
Residential
Industry
Energy Supply of oil and petroleum products + oth.
Energy Demand Impact on Energy Efficiency
Biofuels
Natural Gas
Others like coal, H2 etc.
Heating oil
Oil for industrial processes, Fuel oil
Investment in Energy Efficiency
Primary Energy
Conventional oil
Unconventional oil
2.2.3.5 Changes of HOP! scenarios with very low conventional oil reserves compared to baseline
In order to keep the coherence of the full picture, specific assumptions are needed on the fact that investments spent on alternative transport fuels, on other fuels or energy efficiency will lead in a decrease of investments in other economic sectors (see Table 4).
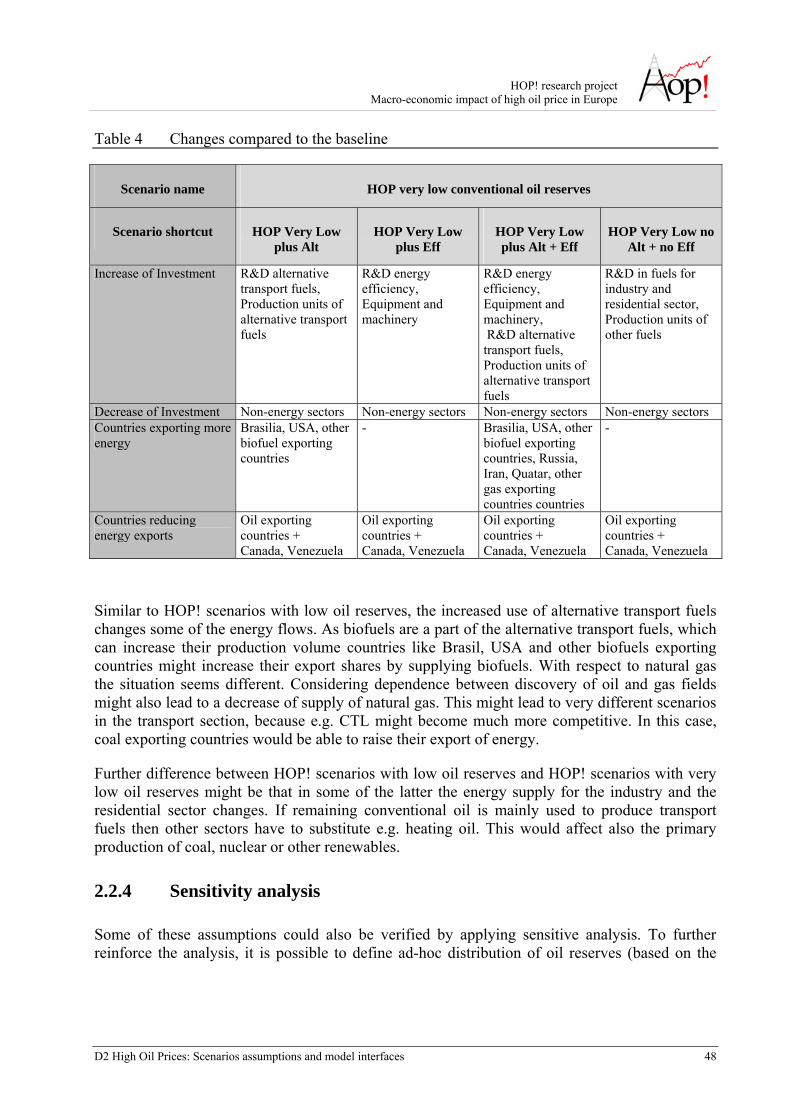
HOP! research project Macro-economic impact of high oil price in Europe
D2 High Oil Prices: Scenarios assumptions and model interfaces 48
Table 4 Changes compared to the baseline
Scenario name HOP very low conventional oil reserves
Scenario shortcut HOP Very Low plus Alt
HOP Very Low plus Eff
HOP Very Low plus Alt + Eff
HOP Very Low no Alt + no Eff
Increase of Investment R&D alternative transport fuels, Production units of alternative transport fuels
R&D energy efficiency, Equipment and machinery
R&D energy efficiency, Equipment and machinery, R&D alternative transport fuels, Production units of alternative transport fuels
R&D in fuels for industry and residential sector, Production units of other fuels
Decrease of Investment Non-energy sectors Non-energy sectors Non-energy sectors Non-energy sectors Countries exporting more energy
Brasilia, USA, other biofuel exporting countries
- Brasilia, USA, other biofuel exporting countries, Russia, Iran, Quatar, other gas exporting countries countries
-
Countries reducing energy exports
Oil exporting countries + Canada, Venezuela
Oil exporting countries + Canada, Venezuela
Oil exporting countries + Canada, Venezuela
Oil exporting countries + Canada, Venezuela
Similar to HOP! scenarios with low oil reserves, the increased use of alternative transport fuels changes some of the energy flows. As biofuels are a part of the alternative transport fuels, which can increase their production volume countries like Brasil, USA and other biofuels exporting countries might increase their export shares by supplying biofuels. With respect to natural gas the situation seems different. Considering dependence between discovery of oil and gas fields might also lead to a decrease of supply of natural gas. This might lead to very different scenarios in the transport section, because e.g. CTL might become much more competitive. In this case, coal exporting countries would be able to raise their export of energy.
Further difference between HOP! scenarios with low oil reserves and HOP! scenarios with very low oil reserves might be that in some of the latter the energy supply for the industry and the residential sector changes. If remaining conventional oil is mainly used to produce transport fuels then other sectors have to substitute e.g. heating oil. This would affect also the primary production of coal, nuclear or other renewables.
2.2.4 Sensitivity analysis
Some of these assumptions could also be verified by applying sensitive analysis. To further reinforce the analysis, it is possible to define ad-hoc distribution of oil reserves (based on the
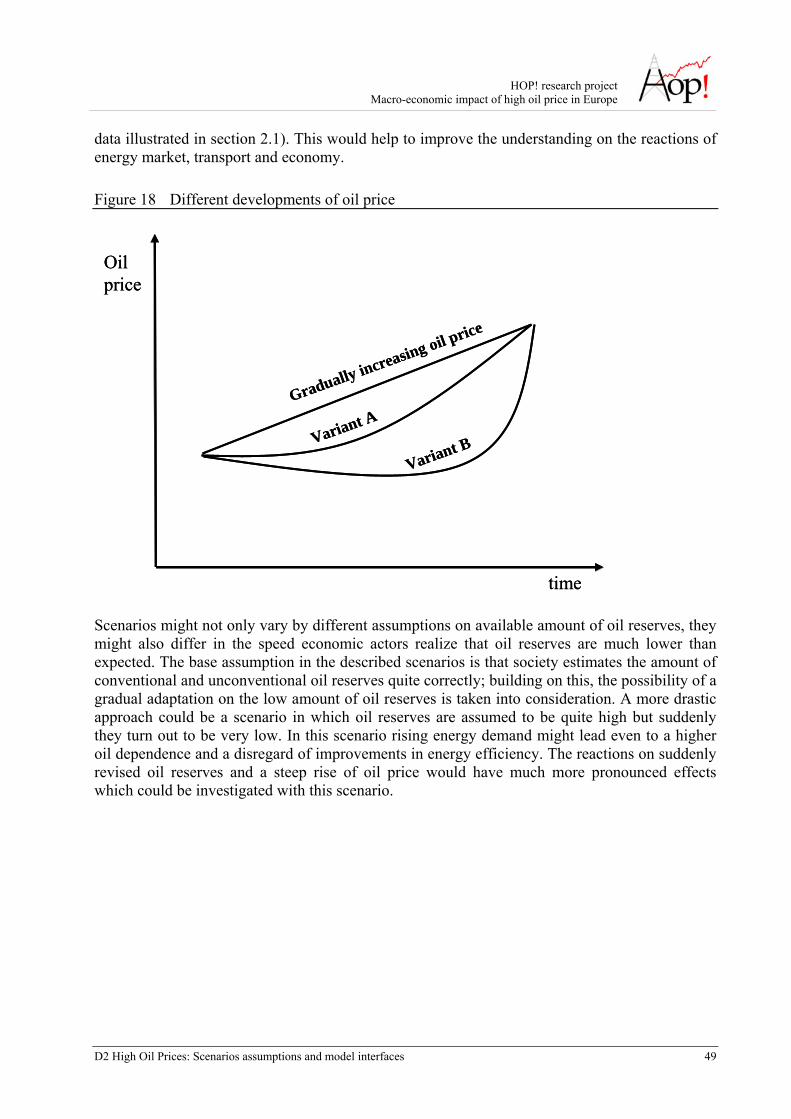
HOP! research project Macro-economic impact of high oil price in Europe
D2 High Oil Prices: Scenarios assumptions and model interfaces 49
data illustrated in section 2.1). This would help to improve the understanding on the reactions of energy market, transport and economy.
Figure 18 Different developments of oil price
time
Oil price
Gradually increasing oil price
Variant A
Variant B
time
Oil price
Gradually increasing oil price
Variant A
Variant B
Scenarios might not only vary by different assumptions on available amount of oil reserves, they might also differ in the speed economic actors realize that oil reserves are much lower than expected. The base assumption in the described scenarios is that society estimates the amount of conventional and unconventional oil reserves quite correctly; building on this, the possibility of a gradual adaptation on the low amount of oil reserves is taken into consideration. A more drastic approach could be a scenario in which oil reserves are assumed to be quite high but suddenly they turn out to be very low. In this scenario rising energy demand might lead even to a higher oil dependence and a disregard of improvements in energy efficiency. The reactions on suddenly revised oil reserves and a steep rise of oil price would have much more pronounced effects which could be investigated with this scenario.
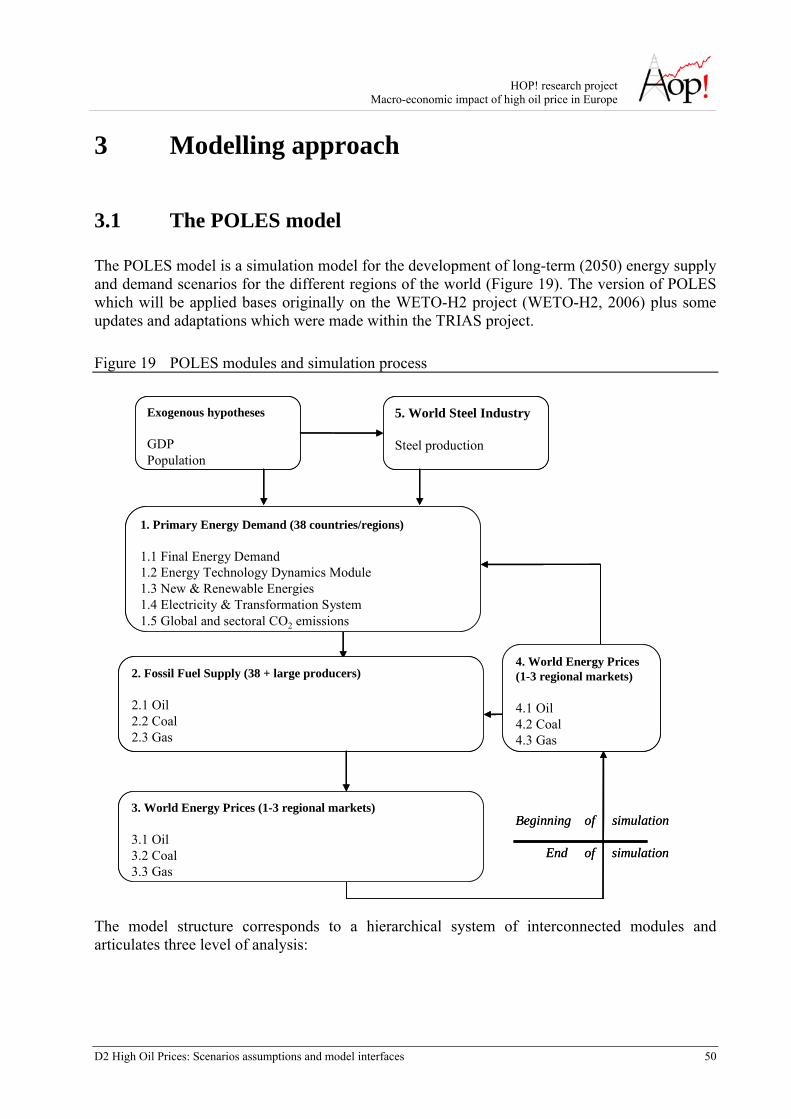
HOP! research project Macro-economic impact of high oil price in Europe
D2 High Oil Prices: Scenarios assumptions and model interfaces 50
3 Modelling approach
3.1 The POLES model
The POLES model is a simulation model for the development of long-term (2050) energy supply and demand scenarios for the different regions of the world (Figure 19). The version of POLES which will be applied bases originally on the WETO-H2 project (WETO-H2, 2006) plus some updates and adaptations which were made within the TRIAS project.
Figure 19 POLES modules and simulation process
Beginning of simulation
End of simulation
Exogenous hypotheses
GDPPopulation
5. World Steel Industry
Steel production
1. Primary Energy Demand (38 countries/regions)
1.1 Final Energy Demand1.2 Energy Technology Dynamics Module1.3 New & Renewable Energies1.4 Electricity & Transformation System1.5 Global and sectoral CO2 emissions
3. World Energy Prices (1-3 regional markets)
3.1 Oil3.2 Coal3.3 Gas
4. World Energy Prices(1-3 regional markets)
4.1 Oil4.2 Coal4.3 Gas
2. Fossil Fuel Supply (38 + large producers)
2.1 Oil2.2 Coal2.3 Gas
The model structure corresponds to a hierarchical system of interconnected modules and articulates three level of analysis:

HOP! research project Macro-economic impact of high oil price in Europe
D2 High Oil Prices: Scenarios assumptions and model interfaces 51
- international energy markets;
- regional energy balances;
- national energy demand, new technologies, electricity production, primary energy production systems and CO2 sector emissions.
The main exogenous variables are the population and GDP (which are derived iteratively with ASTRA, see paragraph 3.3), for each country / region, the price of energy being endogenised in the international energy market modules. The dynamics of the model corresponds to a recursive simulation process, common to most applied models of the international energy markets, in which energy demand and supply in each national / regional module respond with different lag structures to international prices variations in the preceding periods. In each module, behavioural equations take into account the combination of price effects and of techno-economic constraints, time lags or trends.
3.1.1 Zoning system
In POLES, the world is divided into fourteen main regions: North America, Central America, South America, European Community, Rest of Western Europe, Former Soviet Union, Central Europe, North Africa, Middle-East, Africa South of Sahara, South Asia, South East Asia, Continental Asia, Pacific OECD.
In most of these regions the larger countries are identified and treated, as concerns energy demand, with a detailed model. In this version these countries are the G7 countries plus the countries of the rest of the European Union and five key developing countries: Mexico, Brazil, India, South Korea and China. The countries forming the rest of the 14 above-mentioned regions are dealt with more compact but homogeneous models.
3.1.2 Vertical integration
For each region, the model articulates four main modules dealing with:
- Final Energy Demand by main sectors;
- New and Renewable Energy technologies;
- The Electricity and conventional energy and Transformation System;
- The Primary Energy Supply.
As indicated in Figure 20, this structure allows for the simulation of a complete energy balance for each region.
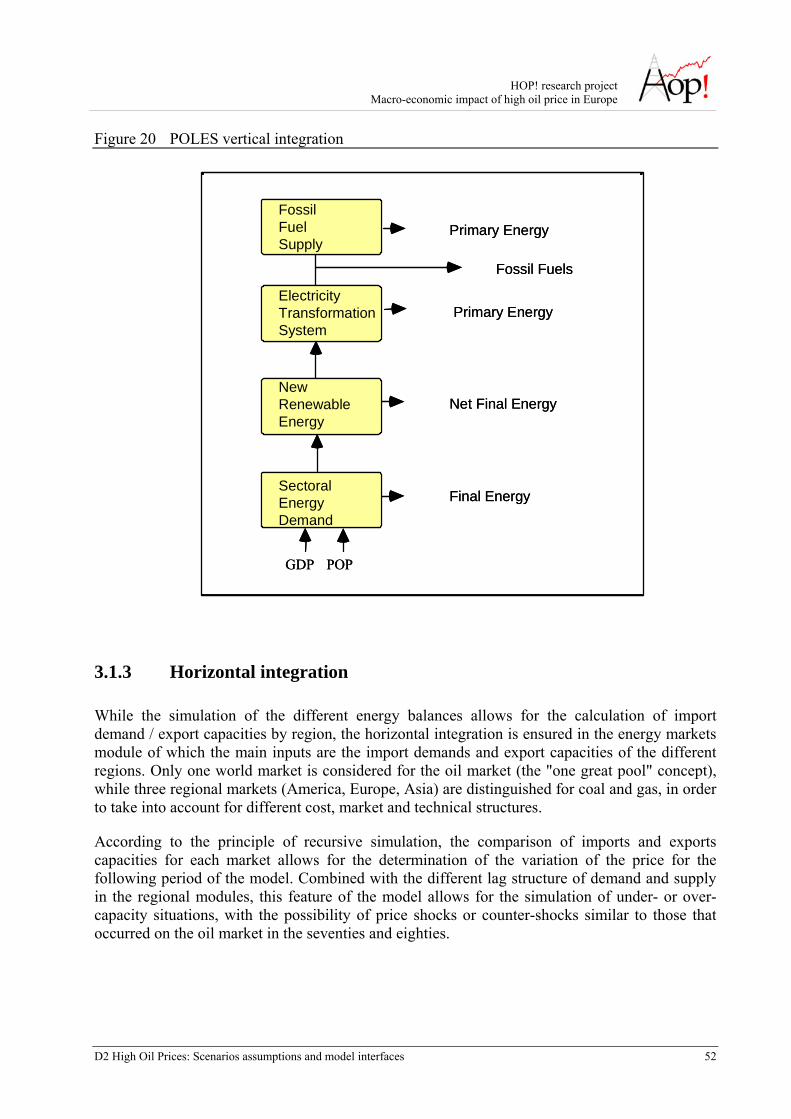
HOP! research project Macro-economic impact of high oil price in Europe
D2 High Oil Prices: Scenarios assumptions and model interfaces 52
Figure 20 POLES vertical integration
FossilFuelSupply
Primary Energy
Fossil Fuels
ElectricityTransformationSystem
Primary Energy
NewRenewableEnergy
Net Final Energy
SectoralEnergyDemand
Final Energy
GDP POP
FossilFuelSupply
Primary Energy
Fossil Fuels
ElectricityTransformationSystem
Primary Energy
NewRenewableEnergy
Net Final Energy
SectoralEnergyDemand
Final Energy
GDP POP
3.1.3 Horizontal integration
While the simulation of the different energy balances allows for the calculation of import demand / export capacities by region, the horizontal integration is ensured in the energy markets module of which the main inputs are the import demands and export capacities of the different regions. Only one world market is considered for the oil market (the "one great pool" concept), while three regional markets (America, Europe, Asia) are distinguished for coal and gas, in order to take into account for different cost, market and technical structures.
According to the principle of recursive simulation, the comparison of imports and exports capacities for each market allows for the determination of the variation of the price for the following period of the model. Combined with the different lag structure of demand and supply in the regional modules, this feature of the model allows for the simulation of under- or over-capacity situations, with the possibility of price shocks or counter-shocks similar to those that occurred on the oil market in the seventies and eighties.
HOP! research project Macro-economic impact of high oil price in Europe
D2 High Oil Prices: Scenarios assumptions and model interfaces 53
In the final energy demand module, the consumption of energy is divided into 11 different sectors, which are homogenous from the point of view of prices, activity variables, consumer behaviour and technological change. This is applied in each main country or region. The Industry, Transport and Residential-Tertiary-Agriculture blocks respectively incorporate 4, 4 and 3 such sectors as reported in Table 5.
In each sector, the energy consumption is calculated separately for substitutable technologies and for electricity, with a taking into account of specific energy consumption (electricity in electrical processes and coke for the other processes in the steel-making, feedstock in the chemical sector, electricity for heat and for specific uses in the residential and service sectors).
Table 5 POLES demand breakdown by main sectors
Industry Steel Industry Chemical industry (+feedstock) Non metallic mineral industry Other industries (+non energy use)
STI CHI (CHF) NMM OIN (ONE)
Transport Road transport Rail transport Air transport Other transports
ROT RAT ART OTT
RAS Residential sector Service sector Agriculture
RES SER AGR
3.1.4 The Oil production in POLES
The POLES model calculates oil production for every key producing country or region, based on oil reserves. This is performed in three steps. Firstly, the model estimates the cumulative amount of oil discovered as a function of the Ultimate Recoverable Resources and the cumulative drilling effort in each region. The amount of URR is not held constant but is calculated by revising the value for the base year, as estimated by the USGS (USGS, 2000), based on a recovery ratio that improves over time and increases with the price of the resource. According to WETO-H2 (WETO-H2, 2006), while the recovery rate is differentiated across regions, the world average accounts for 35% today and, due to the price-driven technology improvements, increases to around 50% in 2050.
Secondly, the model calculates remaining reserves as equal to the difference between the cumulative discoveries and the cumulative production for the previous period. The accounting is described by the formula: Rt+1 = Rt + DISt – Pt (where R = reserves, DIS = discoveries, P = production, subscript t = year of account)
Finally, the model calculates the production, which differs among regions of the world. In the “price-taker” regions (i.e. Non-OPEC) it is resulting from an endogenous Reserves-to-Production ratio that decreases over time and the calculated remaining reserves in the region; the
HOP! research project Macro-economic impact of high oil price in Europe
D2 High Oil Prices: Scenarios assumptions and model interfaces 54
production from “swing-producers”(i.e. OPEC) is assumed to be that amount needed to balance the world oil market (OPEC total oil production= total oil demand – Non-OPEC total oil production). Thus, the model calculates a single world price, which depends in the short-term on variations in the rate of utilisation of capacity in the OPEC Gulf countries and in the medium and long-term on the world R/P ratio (including unconventional oil).
The unconventional oil enters in the composition of the world oil supply when the oil international price makes it competitive against the conventional oil, that is when the world oil price exceeds the cost of an unconventional source of oil (IEA, 2005).
3.1.5 The Gas production in POLES
The gas discoveries and reserves dynamics are modelled in a way that is similar to that used for oil; whereas the gas trade and production are simulated in a more complex process that accounts for the constraints introduced by gas transport routes to the different markets; The production of gas in each key producing country is derived from the combination of the demand forecast and of the projected supply infrastructures in each region (pipelines and LNG facilities).
Three main regional markets are considered for gas price determination, but the gas trade flows are studied with more detail for 14 sub-regional markets, 18 key exporters and a set of smaller gas producers.
The price of gas is calculated for each regional market; the price depends on the demand, domestic production and supply capacity in each market. There is some linkage to oil prices in the short-term, but in the long-term, the main driver of price is the variation in the average Reserve-to-Production ratio of the core suppliers of each main regional market. As this ratio decreases for natural gas as well as for oil, gas prices follow an upward trend that is similar in the long-term to that of oil (WETO-H2, 2006).
3.1.6 The Biofuels Model
The biofuels model has been developed for the PREMIA (Wiesenthal et al., 2007) and the TRIAS project (Krail et al., 2007). It has improved the capability of POLES to deal with a potentially relevant alternative source of energy for the transport sector. The biofuels model is based on recursive year by year simulation of biofuels demand and supply until 2050. For each set of exogenously given parameters an equilibrium point is calculated at which the costs of biofuels equal those of the fossil alternative they substitute, taking into account the feedback loops of the agricultural market and restrictions in the annual growth rates of capacity. This equilibrium point is envisaged by market participants but not necessarily reached in each year. Increasing production of biofuels and a subsequent rise in feedstock demand has an impact on the prices of biofuels feedstock, which in turn affects biofuels production through a feedback loop.
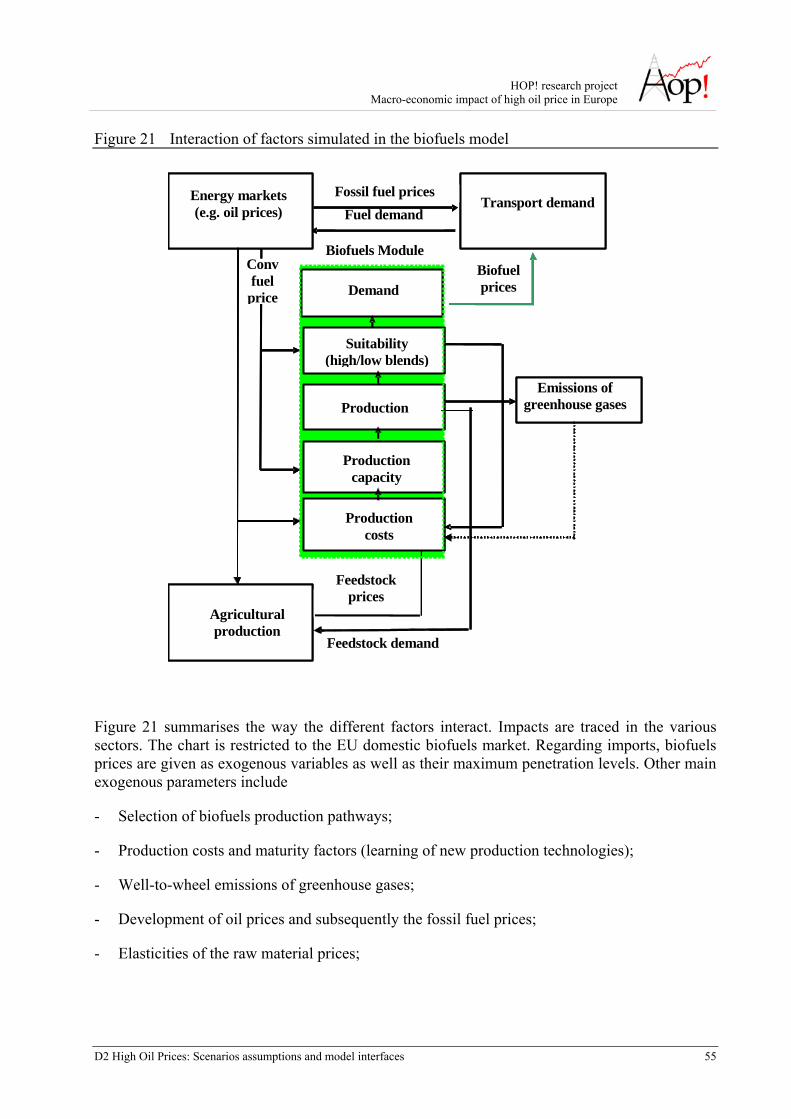
HOP! research project Macro-economic impact of high oil price in Europe
D2 High Oil Prices: Scenarios assumptions and model interfaces 55
Figure 21 Interaction of factors simulated in the biofuels model
Demand
Transport demand Energy markets (e.g. oil prices)
Conv fuel
Feedstock i
Suitability (high/low blends)
Agricultural production
Production
Productioncapacity
Productioncosts
Emissions of greenhouse gases
Demand
Fossil fuel pricesFuel demand
Transport demand Energy markets (e.g. oil prices)
Biofuelprices
Conv fuel
price
Feedstock demand
Feedstock prices
Suitability (high/low blends)
Agricultural production
Production
Production capacity
Production costs
Emissions of greenhouse gases
Biofuels Module
Figure 21 summarises the way the different factors interact. Impacts are traced in the various sectors. The chart is restricted to the EU domestic biofuels market. Regarding imports, biofuels prices are given as exogenous variables as well as their maximum penetration levels. Other main exogenous parameters include
- Selection of biofuels production pathways;
- Production costs and maturity factors (learning of new production technologies);
- Well-to-wheel emissions of greenhouse gases;
- Development of oil prices and subsequently the fossil fuel prices;
- Elasticities of the raw material prices;
HOP! research project Macro-economic impact of high oil price in Europe
D2 High Oil Prices: Scenarios assumptions and model interfaces 56
- Transport fuel demand.
The model determines the penetration of biofuels as a function of final price of biofuels relative to the pump price of fossil fuels. These are affected by the prices of oil and raw materials as well as the production costs that each alternative pathway entails (depending on capital costs, feedstock prices, load factors etc.). The main factors that determine the equilibrium point via influencing the cost ratio of biofuels and fossil fuels are oil prices, distribution costs and feedstock prices.
3.2 The ASTRA model
ASTRA stands for Assessment of Transport Strategies. The model is developed since 1997 with the purpose of strategic assessment of policies in an integrated way i.e. by considering the feedback loops between the transport system and the economic system.
The model is based on the System Dynamics methodology and follows system analytic concepts, which assume that the implemented real systems can be conceived as a number of feedback loops that are interacting with each other. These feedback loops are implemented in ASTRA and the model is calibrated for key variables for the period 1990 until 2003. The spatial coverage extends over the EU25 countries plus Bulgaria, Norway, Romania and Switzerland. Each country is further disaggregated into at maximum four functional zones classified by their settlement characteristics.
3.2.1 Overview on Models of ASTRA
The ASTRA model consists of nine modules that are all implemented within one Vensim system dynamics software file:
- Population module (POP),
- Macro-economic module (MAC),
- Regional economic module (REM),
- Foreign trade module (FOT),
- Infrastructure module (INF),
- Transport module (TRA),
- Environment module (ENV),
- Vehicle fleet module (VFT) and
- Welfare measurement module (WEM).
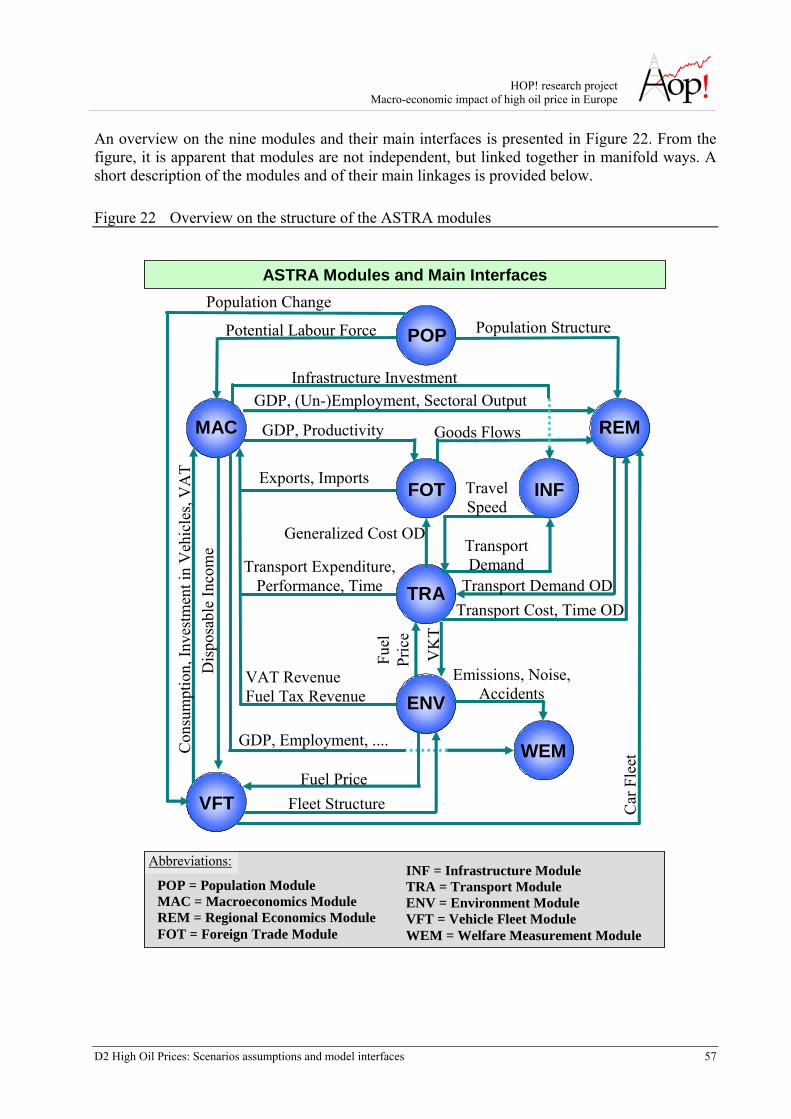
HOP! research project Macro-economic impact of high oil price in Europe
D2 High Oil Prices: Scenarios assumptions and model interfaces 57
An overview on the nine modules and their main interfaces is presented in Figure 22. From the figure, it is apparent that modules are not independent, but linked together in manifold ways. A short description of the modules and of their main linkages is provided below.
Figure 22 Overview on the structure of the ASTRA modules
POP
MAC
FOT
REM
TRA
WEM
ENV
VFT
Potential Labour Force Population Structure
Dis
posa
ble
Inco
me
Con
sum
ptio
n, In
vest
men
t in
Veh
icle
s, V
AT
GDP, (Un-)Employment, Sectoral Output
Population Change
VK
T Goods Flows
Car
Fle
et
Fuel Price
GDP, Productivity
Exports, Imports
Transport Expenditure, Performance, Time
VAT Revenue Fuel Tax Revenue
GDP, Employment, ....
Fuel
Pr
ice
Emissions, Noise, Accidents
Transport Cost, Time OD Transport Demand OD
POP = Population Module MAC = Macroeconomics Module REM = Regional Economics Module FOT = Foreign Trade Module
Abbreviations: INF = Infrastructure Module TRA = Transport Module ENV = Environment Module VFT = Vehicle Fleet Module WEM = Welfare Measurement Module
ASTRA Modules and Main Interfaces
Generalized Cost OD
Fleet Structure
INF
Infrastructure Investment
TransportDemand
Travel Speed
HOP! research project Macro-economic impact of high oil price in Europe
D2 High Oil Prices: Scenarios assumptions and model interfaces 58
3.2.2 Transport
On the transport side, ASTRA provide a description of the ‘supply-side’ in terms of infrastructures and of vehicle technologies, while transport demand is described in terms of aggregated OD-trip matrices and mode split. Four modules are involved as described below.
3.2.2.1 Transport Technology and Infrastructure
The Infrastructure Module (INF) provides the network capacity for the different transport modes. Infrastructure investments derived both from the economic development provided by the MAC and from infrastructure investment policies alter the infrastructure capacity. Using speed flow curves for the different infrastructure types and aggregate transport demand the changes of average travel speeds over time are estimated and transferred to the TRA where they affect the modal choice.
The Vehicle Fleet Module (VFT) describes the vehicle fleet composition for all road modes. Vehicle fleets are differentiated into different age classes based on one-year-age cohorts and into different emission standard categories. The car vehicle fleet is developing according to income changes, development of population, fuel prices, fuel taxes, maintenance and purchase cost of vehicles, mileage and the density of filling stations for the different type of fuels. Vehicle fleet composition of buses, light-duty vehicles and heavy-duty vehicles mainly depends on travelled kilometres and the development of average annual mileages per vehicle of these modes. The purchase of vehicles is translated into value terms and forms an input of the economic sectors in the MAC that cover the vehicle production.
3.2.2.2 Transport Demand
The Regional Economic Module (REM) mainly calculates the generation and spatial distribution of freight transport volume and passenger trips. The number of passenger trips is driven by employment situation, car-ownership development and number of people in different age classes. Trip generation is performed individually for each of the 71 zones of the ASTRA model. Distribution splits trips of each zone into three distance categories of trips within the zone and two distance categories crossing the zone borders and generating OD-trip matrices with 71x71 elements for three trip purposes. Freight transport is driven by two mechanisms: Firstly, national transport depends on sector production value of the 15 goods producing sectors where the monetary output of the input-output table calculations are transferred into volume of tons by means of value-to-volume ratios. For freight distribution and the further calculations in the transport module the 15 goods sectors are aggregated into three goods categories. Secondly, international freight transport i.e. freight transport flows that are crossing national borders are generated from monetary Intra-European trade flows of the 15 goods producing sectors. Again transfer into volume of tons is performed by applying value-to-volume ratios that are different from the ones applied for national transport. In that sense the export model provides generation and distribution of international transport flows within one step on the base of monetary flows.
HOP! research project Macro-economic impact of high oil price in Europe
D2 High Oil Prices: Scenarios assumptions and model interfaces 59
The matrices estimated in the REM module are the major input of the Transport Module (TRA). Using transport cost and transport time matrices the transport module performs the modal-split for five passenger modes and three freight modes. The cost and time matrices depend on influencing factors like infrastructure capacity and travel speeds both coming from the INF module, structure of vehicle fleets, transport charges, fuel price or fuel tax changes. Depending on the modal choices, transport expenditures are calculated and provided to the macroeconomics module. Changes in transport times are also transferred to the macroeconomics module such that they can influence total factor productivity. Considering load factors and occupancy rates respectively, vehicle-km are calculated.
3.2.3 Economy
Given the strategic nature of ASTRA, the treatment of the economy is essentially at a macro level. However, some ‘micro-economic’ concepts are detailed with regard to the role of transport in the interaction with the economy. Three modules are used for simulating the economy.
3.2.3.1 Households
The Population Module (POP) provides the population development for the 29 European countries with one-year age cohorts. The model depends on fertility rates, death rates and immigration of the EU29 countries. Based on the age structure, given by the one-year-age cohorts, important information is provided for other modules like the number of persons in the working age or the number of persons in age classes that permit to acquire a driving licence. POP is calibrated to EUROSTAT population predictions.
3.2.3.2 Macro-economy
The MAC module provides the national macro-economic framework. Six major elements constitute the functionality of the macroeconomics module. The first is the sector inter-change model that reflects the economic interactions between 25 economic sectors of the national economies. Demand-supply interactions are considered by the second and third element. The second element, the demand side model depicts the four major components of final demand: consumption, investments, exports-imports and the government consumption.
The supply side model reflects influences of three production factors: capital stock, labour and natural resources as well as the influence of technological progress that is modelled as total factor productivity. Endogenised Total Factor Productivity (TFP) depends on investments, freight transport times and labour productivity changes. Investments are affected by a major positive loop as investment increase capital stock and total factor productivity (TFP) of an economy leading to growing potential output and GDP that drives income and consumption feeding back to an increase of investments. However, this loop could also be influenced by other interfering loops that would break the growth tendency (Figure 23):
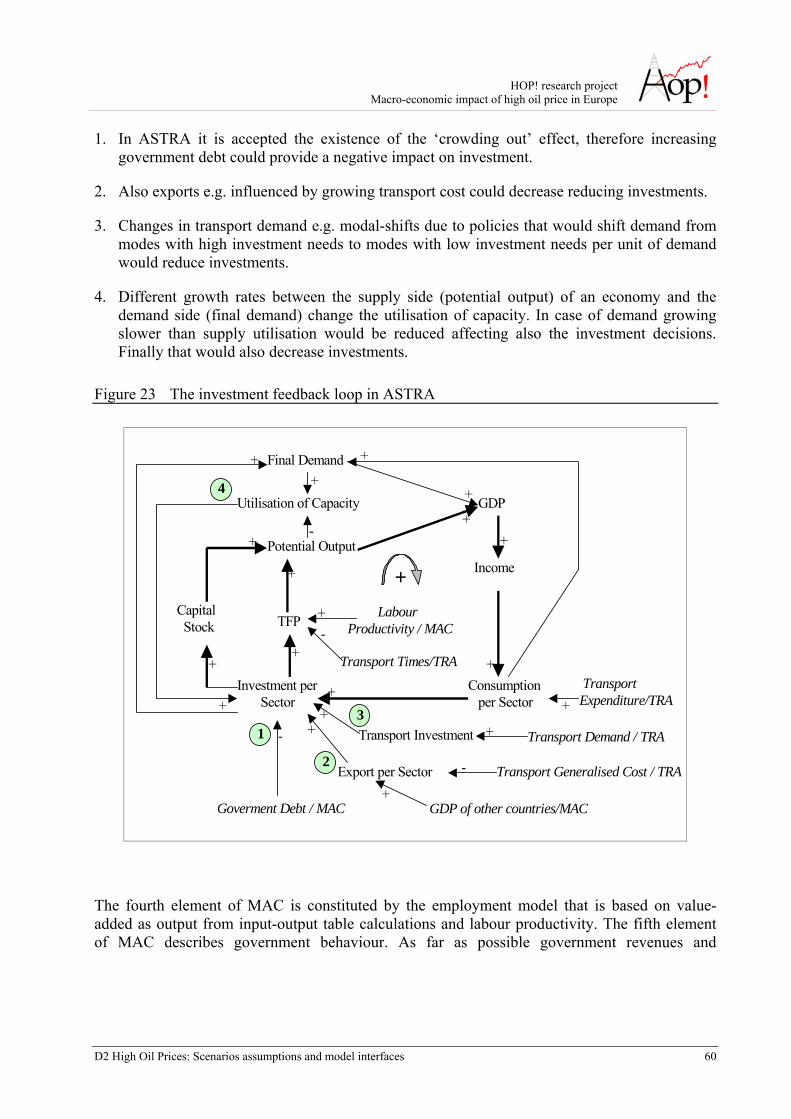
HOP! research project Macro-economic impact of high oil price in Europe
D2 High Oil Prices: Scenarios assumptions and model interfaces 60
1. In ASTRA it is accepted the existence of the ‘crowding out’ effect, therefore increasing government debt could provide a negative impact on investment.
2. Also exports e.g. influenced by growing transport cost could decrease reducing investments.
3. Changes in transport demand e.g. modal-shifts due to policies that would shift demand from modes with high investment needs to modes with low investment needs per unit of demand would reduce investments.
4. Different growth rates between the supply side (potential output) of an economy and the demand side (final demand) change the utilisation of capacity. In case of demand growing slower than supply utilisation would be reduced affecting also the investment decisions. Finally that would also decrease investments.
Figure 23 The investment feedback loop in ASTRA
Final Demand
Utilisation of Capacity
Potential Output
TFP
GDP
Income
Capital Stock
Labour Productivity / MAC
Transport Times/TRA
Consumption per Sector
Transport Expenditure/TRA
Investment per Sector
Export per Sector
Goverment Debt / MAC
Transport Generalised Cost / TRA
+
+
+
+ +
- +
+
+
+
+ +
+ -
+ -
-
+
+
+
GDP of other countries/MAC +
+
1
4
2
Transport Investment Transport Demand / TRA+
+ 3
The fourth element of MAC is constituted by the employment model that is based on value-added as output from input-output table calculations and labour productivity. The fifth element of MAC describes government behaviour. As far as possible government revenues and
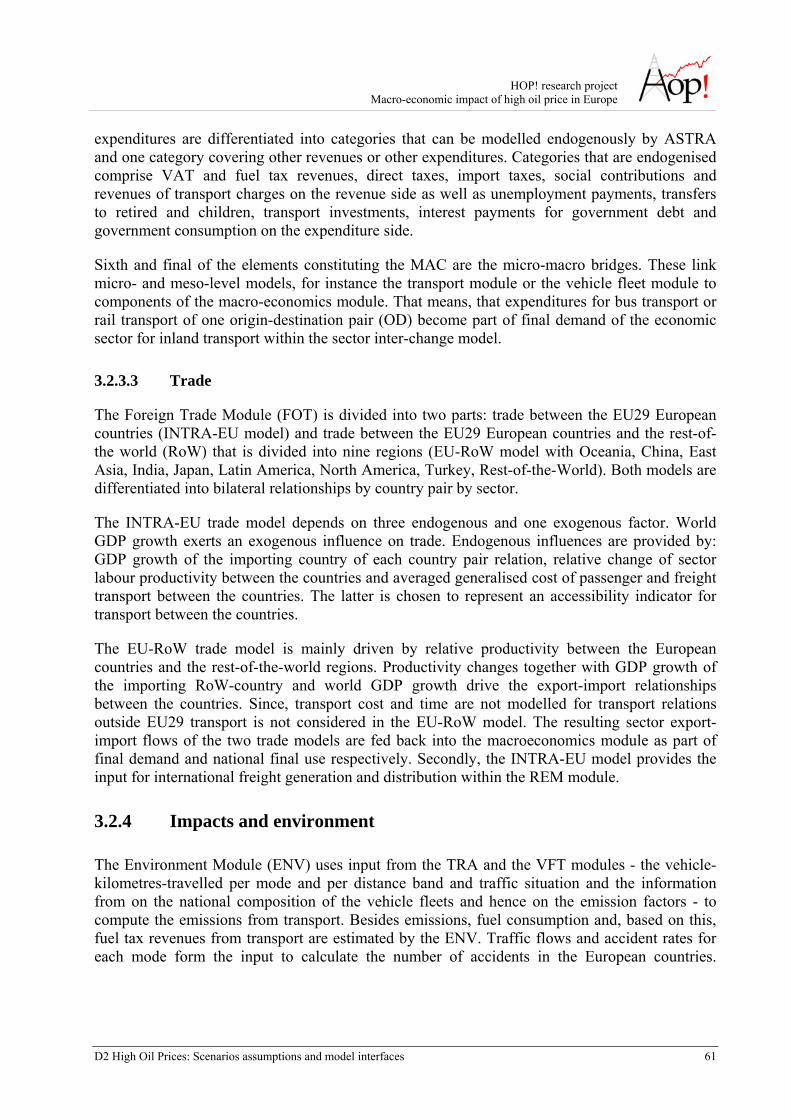
HOP! research project Macro-economic impact of high oil price in Europe
D2 High Oil Prices: Scenarios assumptions and model interfaces 61
expenditures are differentiated into categories that can be modelled endogenously by ASTRA and one category covering other revenues or other expenditures. Categories that are endogenised comprise VAT and fuel tax revenues, direct taxes, import taxes, social contributions and revenues of transport charges on the revenue side as well as unemployment payments, transfers to retired and children, transport investments, interest payments for government debt and government consumption on the expenditure side.
Sixth and final of the elements constituting the MAC are the micro-macro bridges. These link micro- and meso-level models, for instance the transport module or the vehicle fleet module to components of the macro-economics module. That means, that expenditures for bus transport or rail transport of one origin-destination pair (OD) become part of final demand of the economic sector for inland transport within the sector inter-change model.
3.2.3.3 Trade
The Foreign Trade Module (FOT) is divided into two parts: trade between the EU29 European countries (INTRA-EU model) and trade between the EU29 European countries and the rest-of-the world (RoW) that is divided into nine regions (EU-RoW model with Oceania, China, East Asia, India, Japan, Latin America, North America, Turkey, Rest-of-the-World). Both models are differentiated into bilateral relationships by country pair by sector.
The INTRA-EU trade model depends on three endogenous and one exogenous factor. World GDP growth exerts an exogenous influence on trade. Endogenous influences are provided by: GDP growth of the importing country of each country pair relation, relative change of sector labour productivity between the countries and averaged generalised cost of passenger and freight transport between the countries. The latter is chosen to represent an accessibility indicator for transport between the countries.
The EU-RoW trade model is mainly driven by relative productivity between the European countries and the rest-of-the-world regions. Productivity changes together with GDP growth of the importing RoW-country and world GDP growth drive the export-import relationships between the countries. Since, transport cost and time are not modelled for transport relations outside EU29 transport is not considered in the EU-RoW model. The resulting sector export-import flows of the two trade models are fed back into the macroeconomics module as part of final demand and national final use respectively. Secondly, the INTRA-EU model provides the input for international freight generation and distribution within the REM module.
3.2.4 Impacts and environment
The Environment Module (ENV) uses input from the TRA and the VFT modules - the vehicle-kilometres-travelled per mode and per distance band and traffic situation and the information from on the national composition of the vehicle fleets and hence on the emission factors - to compute the emissions from transport. Besides emissions, fuel consumption and, based on this, fuel tax revenues from transport are estimated by the ENV. Traffic flows and accident rates for each mode form the input to calculate the number of accidents in the European countries.
HOP! research project Macro-economic impact of high oil price in Europe
D2 High Oil Prices: Scenarios assumptions and model interfaces 62
Expenditures for fuel, revenues from fuel taxes and value-added-tax (VAT) on fuel consumption are transferred to the macroeconomics module and provide input to the economic sectors producing fuel products and to the government model.
In the Welfare Measurement Module (WEM) major macro-economic, environmental and social indicators can be compared and analysed. Also different assessment schemes that combine indicators into aggregated welfare indicators for instance an investment multiplier are provided in the WEM. In some cases, e.g. to undertake a CBA, the functionality is separated into further tools to avoid excessive growth of the core ASTRA model by including the assessment scheme directly within the model.
3.3 Linkages between ASTRA and POLES
In HOP!, the quantitative analysis of the scenarios requires an integrated use of both POLES and ASTRA. As explained in the previous sections, POLES covers the energy field with supply of energy resources on world level, energy demand and development of energy prices with an exogenously given economic development while ASTRA covers the transport field with infrastructure supply and transport demand as well as an economic model that endogenously forecasts economic development under varying policy conditions.
Figure 24 Links between POLES and ASTRA
ASTRA
POLES
ASTRA
POLES
GDPGDPEnergy PricesEnergy Prices
InvestmentInvestment
Fossil Fuel TradeFossil Fuel TradeEconomic activity
per sectorEconomic activity
per sector
Energy demandEnergy demand
ASTRA
POLES
ASTRA
POLES
GDPGDPGDPGDPEnergy PricesEnergy PricesEnergy PricesEnergy Prices
InvestmentInvestmentInvestmentInvestment
Fossil Fuel TradeFossil Fuel TradeFossil Fuel TradeFossil Fuel TradeEconomic activity
per sectorEconomic activity
per sectorEconomic activity
per sectorEconomic activity
per sector
Energy demandEnergy demandEnergy demandEnergy demand
The two models can be reasonably linked as summarised in Figure 24:
- ASTRA receives from POLES: fuel prices, the value of investments for developing alternative energy sources and the trade of fossil fuels;
HOP! research project Macro-economic impact of high oil price in Europe
D2 High Oil Prices: Scenarios assumptions and model interfaces 63
- POLES receives GDP development, energy demand for the transport sector and the economic activity per sector from ASTRA.
Additionally, ASTRA and POLES endogenously simulate a common set of variables (e.g. population, GDP growth) which need to be comparable across the two models.
3.3.1 Exchange of variables
The exchange of variable between ASTRA and POLES has been already experienced in previous projects (STEPs, TRIAS) even if not in the same form. Its major part is an iterative process involving the evolution of fuel price and transport demand. In HOP!, taking fuel demand from the ASTRA model, POLES will compute the fuels price development. In turn, the fuels (resource) price forecast by POLES will be used in ASTRA to revise the transport demand forecast, which is again fed into POLES and so on until an equilibrium is reached1.
This loop allows taking into account the complex relations between oil price, fuels price and transport demand. Indeed, even if there is a clear correlation between oil price and fuels price, it would not be correct to assume that the hypothesis concerning the former could be applied as such to the latter. Actually, historical trends show that fuel price is generally less volatile than oil price.
Also other variables are exchanged at any iteration and contribute to adapt the model forecasts, even if their impact on the results of the model receiving the inputs is smoother.
3.3.2 Harmonisation of variables
Even if ASTRA and POLES have different features and deal with a different set of variables, they both simulate the demographic and economic trends for the EU countries and such trends play a role in the outcomes of the simulations. Therefore, it is necessary that these trends are similar across the models. This is generally guaranteed by calibrating both models against the same demographic and economic forecasts. In the TRIAS project, this harmonisation has been obtained as shown if Figure 25 and Figure 26 below. The forecasts of the two models are not perfectly matching but are largely comparable, especially for GDP, which is the most influencing variable on the modelling results.
1 There is not a mechanism that guarantees an equilibrium is reached, however the experience in the previous projects has shown that this is the case even if several iterations was requested.
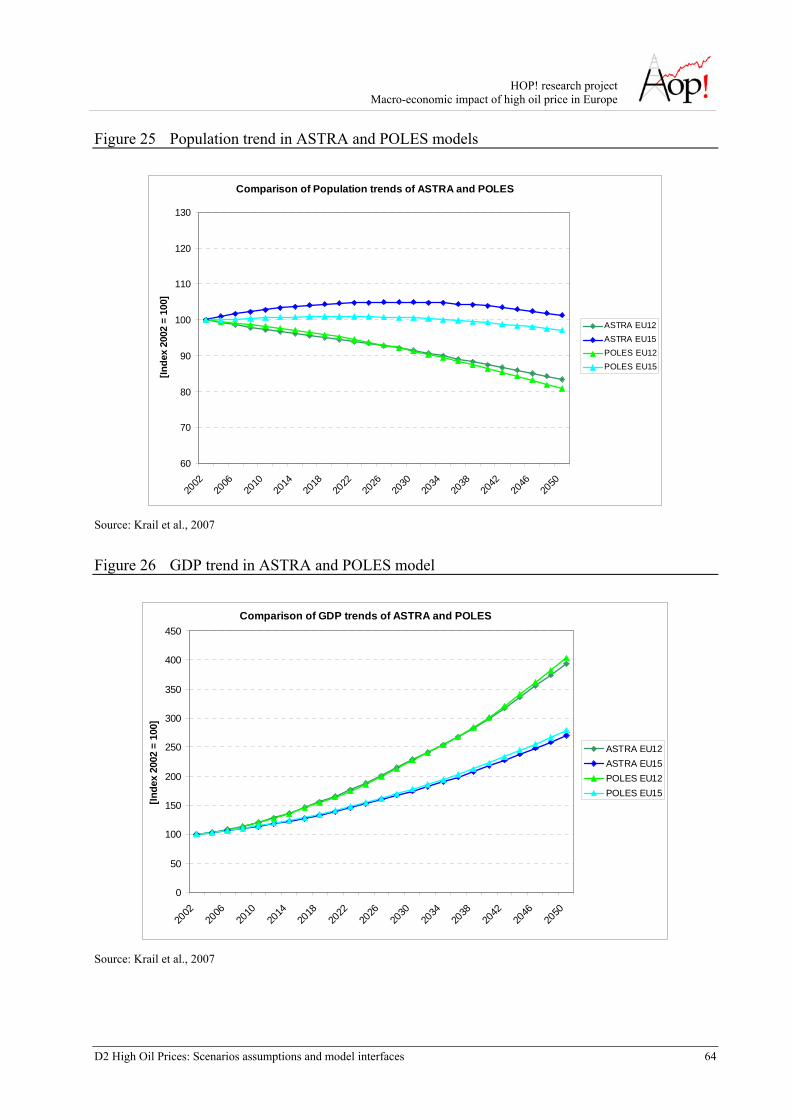
HOP! research project Macro-economic impact of high oil price in Europe
D2 High Oil Prices: Scenarios assumptions and model interfaces 64
Figure 25 Population trend in ASTRA and POLES models
Comparison of Population trends of ASTRA and POLES
60
70
80
90
100
110
120
130
2002
2006
2010
2014
2018
2022
2026
2030
2034
2038
2042
2046
2050
[Ind
ex 2
002
= 10
0]
ASTRA EU12ASTRA EU15POLES EU12POLES EU15
Source: Krail et al., 2007
Figure 26 GDP trend in ASTRA and POLES model
Comparison of GDP trends of ASTRA and POLES
0
50
100
150
200
250
300
350
400
450
2002
2006
2010
2014
2018
2022
2026
2030
2034
2038
2042
2046
2050
[Inde
x 20
02 =
100
]
ASTRA EU12ASTRA EU15POLES EU12POLES EU15
Source: Krail et al., 2007
HOP! research project Macro-economic impact of high oil price in Europe
D2 High Oil Prices: Scenarios assumptions and model interfaces 65
3.3.3 Linkage for the sensitivity analysis
A special kind of linkage between POLES and ASTRA takes place when a sensitivity analysis is carried out. As the modelling results depend on the iteration between the models, as explained above, the sensitivity analysis has to involve both tools. However, it is unfeasible to perform an iterative process by exchanging distributions of values rather then single values. Therefore, the sensitivity analysis consists of a procedure in three steps:
a) An exogenous distribution is applied to the variables chosen for the analysis in the model where the variables are primarily simulated. For instance, in the TRIAS project, POLES varied the assumed resource base of fossil fuels i.e. the known and assumed reserves of oil, gas and coal.
b) From the sensitivity analysis a range of values is obtained for the variables to feed into the other model. For instance, in TRIAS a range for the prices of different types of fuels (fossil fuels, hydrogen and biofuels) and also a range of trade of fossil fuels resulted from the analysis.
c) These results are used as input for the sensitivity analysis in the other model.
In HOP!, it is expected to start the sensitivity analysis from POLES, using as starting variables the range of oil and gas reserves and the GDP growth in e.g. China and India.
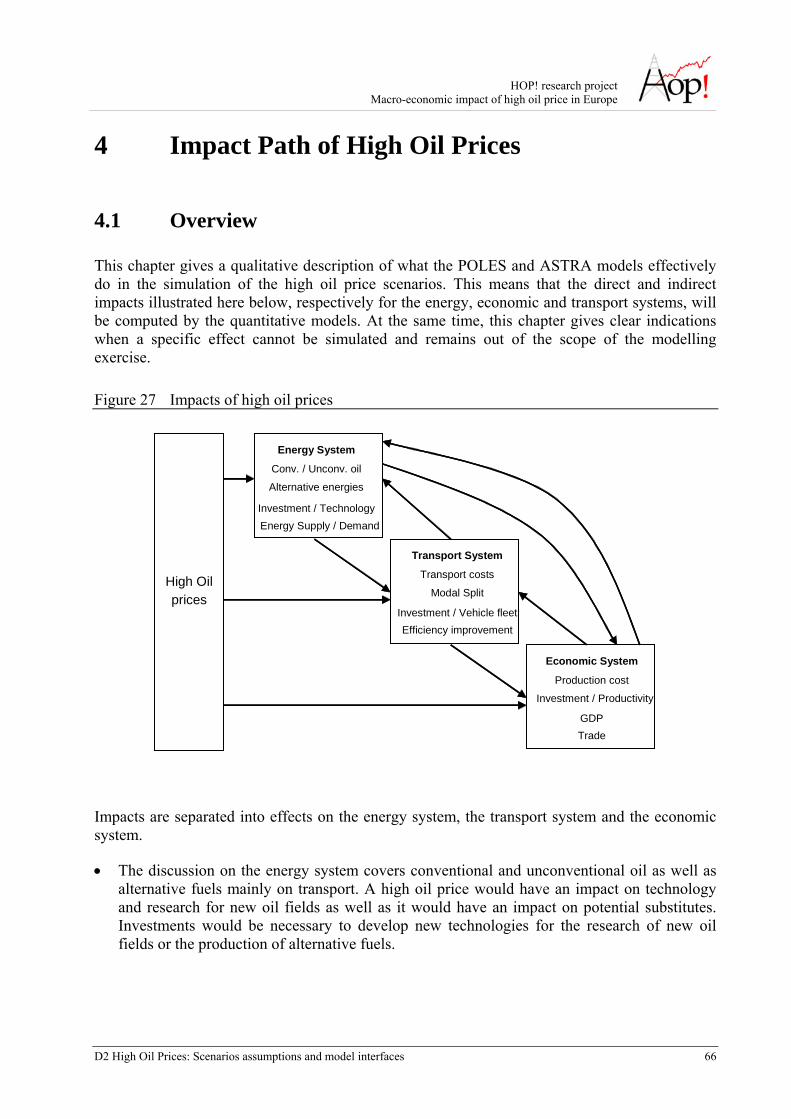
HOP! research project Macro-economic impact of high oil price in Europe
D2 High Oil Prices: Scenarios assumptions and model interfaces 66
4 Impact Path of High Oil Prices
4.1 Overview
This chapter gives a qualitative description of what the POLES and ASTRA models effectively do in the simulation of the high oil price scenarios. This means that the direct and indirect impacts illustrated here below, respectively for the energy, economic and transport systems, will be computed by the quantitative models. At the same time, this chapter gives clear indications when a specific effect cannot be simulated and remains out of the scope of the modelling exercise.
Figure 27 Impacts of high oil prices
High Oil prices
Transport System
Transport costs
Modal Split
Efficiency improvementInvestment / Vehicle fleet
Energy System
Conv. / Unconv. oil
Alternative energies
Energy Supply / DemandInvestment / Technology
Economic System
Production cost
Investment / Productivity
TradeGDP
High Oil prices
Transport System
Transport costs
Modal Split
Efficiency improvementInvestment / Vehicle fleet
Energy System
Conv. / Unconv. oil
Alternative energies
Energy Supply / DemandInvestment / Technology
Economic System
Production cost
Investment / Productivity
TradeGDP
Impacts are separated into effects on the energy system, the transport system and the economic system.
• The discussion on the energy system covers conventional and unconventional oil as well as alternative fuels mainly on transport. A high oil price would have an impact on technology and research for new oil fields as well as it would have an impact on potential substitutes. Investments would be necessary to develop new technologies for the research of new oil fields or the production of alternative fuels.
HOP! research project Macro-economic impact of high oil price in Europe
D2 High Oil Prices: Scenarios assumptions and model interfaces 67
• A direct effect of high oil price on the transport system would be the increase of the transport cost. The increase of transport costs differs among transport modes, which results in a change of the modal spilt. Further changes can be foreseen in the composition of the vehicle fleet and an improvement of energy efficiency and, linked to these, the investment patterns. With reference to transport, the direct impact of the transport costs increase due to high oil price is analysed together with its further consequences (indirect impacts) in terms of reduction of the personal mobility; pressure for reducing mobility of goods, mode shift towards less expensive modes and, eventually, pressure on developing more efficient transport means.
• High oil prices affect also the production costs in an economy as oil is used as input in many industrial processes. This implies changes in productivity and GDP. Furthermore, trade patterns will change according to the availability and the production of oil of the oil supplying countries.
So far the effects of high oil price on each of the three systems have been considered in isolation. However, it must be stressed that the changes taking place in one system, affects the other system as well. If alternative transport fuels enter the market to a large extent the composition of the vehicle fleet and the transport costs of different transport modes are affected too. In the next step the increase of transport costs have an impact on the production costs and, hence, on GDP.
Finally, the issue of feedback has to be mentioned. If GDP, investment and trade change, energy demand and transport demand will change as well. It is relevant to remember that the intrinsic characteristic of the two models is the capability to represent the interaction among the different systems, taking into account feed back effects. This implies that the combined use of POLES and ASTRA models make it possible to analyse how direct and indirect impacts in one system affect also the other systems.
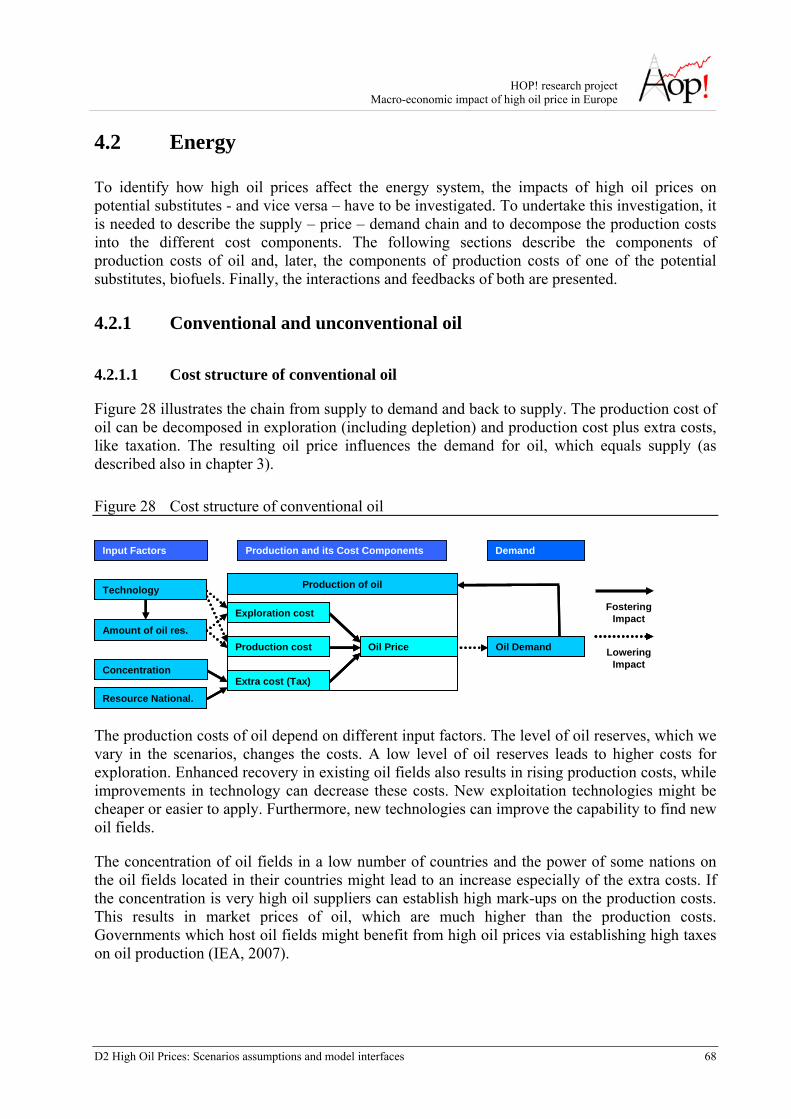
HOP! research project Macro-economic impact of high oil price in Europe
D2 High Oil Prices: Scenarios assumptions and model interfaces 68
4.2 Energy
To identify how high oil prices affect the energy system, the impacts of high oil prices on potential substitutes - and vice versa – have to be investigated. To undertake this investigation, it is needed to describe the supply – price – demand chain and to decompose the production costs into the different cost components. The following sections describe the components of production costs of oil and, later, the components of production costs of one of the potential substitutes, biofuels. Finally, the interactions and feedbacks of both are presented.
4.2.1 Conventional and unconventional oil
4.2.1.1 Cost structure of conventional oil
Figure 28 illustrates the chain from supply to demand and back to supply. The production cost of oil can be decomposed in exploration (including depletion) and production cost plus extra costs, like taxation. The resulting oil price influences the demand for oil, which equals supply (as described also in chapter 3).
Figure 28 Cost structure of conventional oil
Fostering Impact
Lowering Impact
Resource National.
Amount of oil res.
Input Factors Production and its Cost Components Demand
Concentration
Oil Demand
Technology
Exploration cost
Production cost
Extra cost (Tax)
Production of oil
Oil Price
Fostering Impact
Lowering Impact
Fostering Impact
Lowering Impact
Resource National.
Amount of oil res.
Input Factors Production and its Cost Components Demand
Concentration
Oil Demand
Technology
Exploration cost
Production cost
Extra cost (Tax)
Production of oil
Oil Price
Exploration cost
Production cost
Extra cost (Tax)
Production of oil
Oil Price
The production costs of oil depend on different input factors. The level of oil reserves, which we vary in the scenarios, changes the costs. A low level of oil reserves leads to higher costs for exploration. Enhanced recovery in existing oil fields also results in rising production costs, while improvements in technology can decrease these costs. New exploitation technologies might be cheaper or easier to apply. Furthermore, new technologies can improve the capability to find new oil fields.
The concentration of oil fields in a low number of countries and the power of some nations on the oil fields located in their countries might lead to an increase especially of the extra costs. If the concentration is very high oil suppliers can establish high mark-ups on the production costs. This results in market prices of oil, which are much higher than the production costs. Governments which host oil fields might benefit from high oil prices via establishing high taxes on oil production (IEA, 2007).
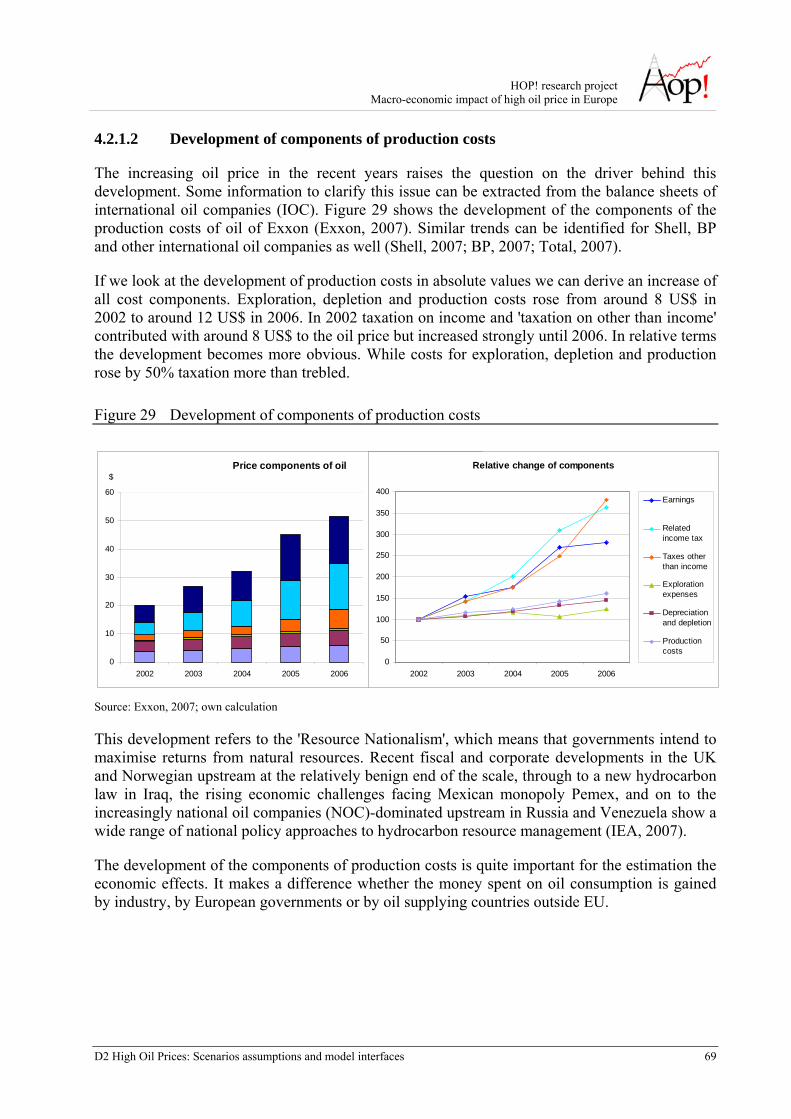
HOP! research project Macro-economic impact of high oil price in Europe
D2 High Oil Prices: Scenarios assumptions and model interfaces 69
4.2.1.2 Development of components of production costs
The increasing oil price in the recent years raises the question on the driver behind this development. Some information to clarify this issue can be extracted from the balance sheets of international oil companies (IOC). Figure 29 shows the development of the components of the production costs of oil of Exxon (Exxon, 2007). Similar trends can be identified for Shell, BP and other international oil companies as well (Shell, 2007; BP, 2007; Total, 2007).
If we look at the development of production costs in absolute values we can derive an increase of all cost components. Exploration, depletion and production costs rose from around 8 US$ in 2002 to around 12 US$ in 2006. In 2002 taxation on income and 'taxation on other than income' contributed with around 8 US$ to the oil price but increased strongly until 2006. In relative terms the development becomes more obvious. While costs for exploration, depletion and production rose by 50% taxation more than trebled.
Figure 29 Development of components of production costs
Price components of oil
0
10
20
30
40
50
60
2002 2003 2004 2005 2006
EarningsRelated income taxTaxes other than incomeExploration expensesDepreciation and depletionProduction costs
$Relative change of components
0
50
100
150
200
250
300
350
400
2002 2003 2004 2005 2006
Earnings
Relatedincome tax
Taxes otherthan income
Explorationexpenses
Depreciationand depletion
Productioncosts
Source: Exxon, 2007; own calculation
This development refers to the 'Resource Nationalism', which means that governments intend to maximise returns from natural resources. Recent fiscal and corporate developments in the UK and Norwegian upstream at the relatively benign end of the scale, through to a new hydrocarbon law in Iraq, the rising economic challenges facing Mexican monopoly Pemex, and on to the increasingly national oil companies (NOC)-dominated upstream in Russia and Venezuela show a wide range of national policy approaches to hydrocarbon resource management (IEA, 2007).
The development of the components of production costs is quite important for the estimation the economic effects. It makes a difference whether the money spent on oil consumption is gained by industry, by European governments or by oil supplying countries outside EU.
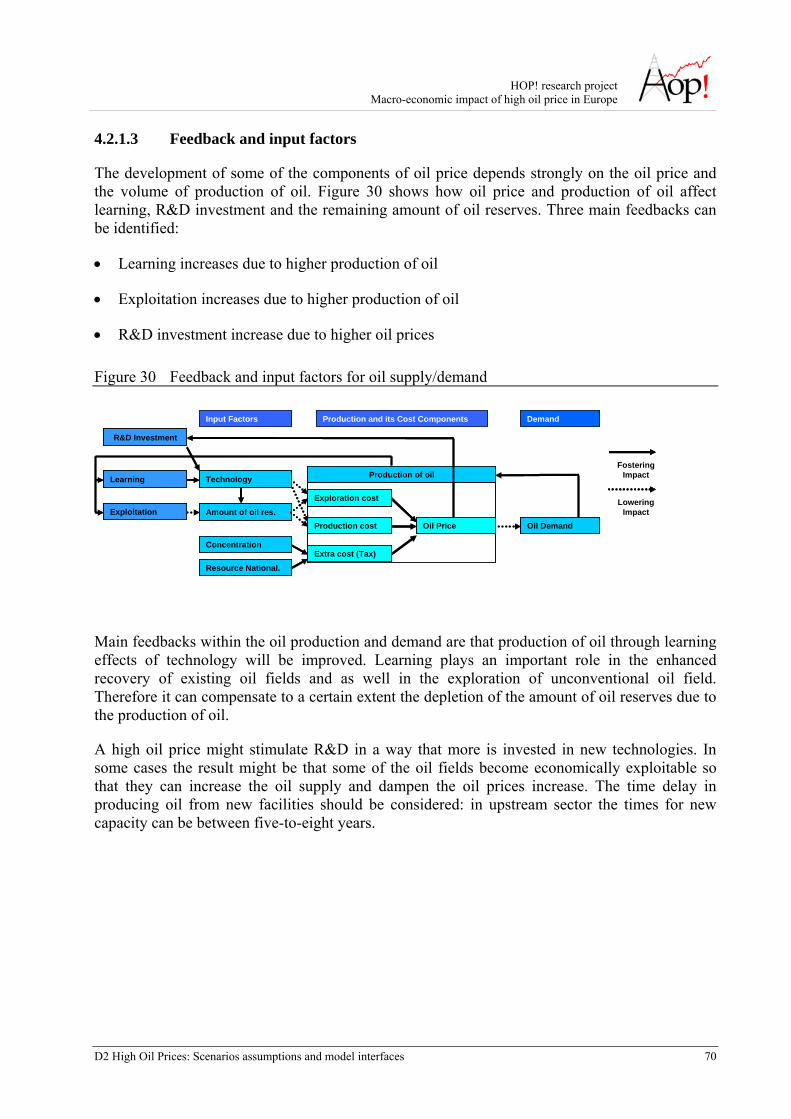
HOP! research project Macro-economic impact of high oil price in Europe
D2 High Oil Prices: Scenarios assumptions and model interfaces 70
4.2.1.3 Feedback and input factors
The development of some of the components of oil price depends strongly on the oil price and the volume of production of oil. Figure 30 shows how oil price and production of oil affect learning, R&D investment and the remaining amount of oil reserves. Three main feedbacks can be identified:
• Learning increases due to higher production of oil
• Exploitation increases due to higher production of oil
• R&D investment increase due to higher oil prices
Figure 30 Feedback and input factors for oil supply/demand
Fostering Impact
Lowering Impact
Resource National.
Amount of oil res.
Input Factors Production and its Cost Components Demand
Concentration
Oil Demand
Learning
R&D Investment
Technology
ExploitationExploration cost
Production cost
Extra cost (Tax)
Production of oil
Oil Price
Fostering Impact
Lowering Impact
Fostering Impact
Lowering Impact
Resource National.
Amount of oil res.
Input Factors Production and its Cost Components Demand
Concentration
Oil Demand
Learning
R&D Investment
Technology
ExploitationExploration cost
Production cost
Extra cost (Tax)
Production of oil
Oil Price
Exploration cost
Production cost
Extra cost (Tax)
Production of oil
Oil Price
Main feedbacks within the oil production and demand are that production of oil through learning effects of technology will be improved. Learning plays an important role in the enhanced recovery of existing oil fields and as well in the exploration of unconventional oil field. Therefore it can compensate to a certain extent the depletion of the amount of oil reserves due to the production of oil.
A high oil price might stimulate R&D in a way that more is invested in new technologies. In some cases the result might be that some of the oil fields become economically exploitable so that they can increase the oil supply and dampen the oil prices increase. The time delay in producing oil from new facilities should be considered: in upstream sector the times for new capacity can be between five-to-eight years.
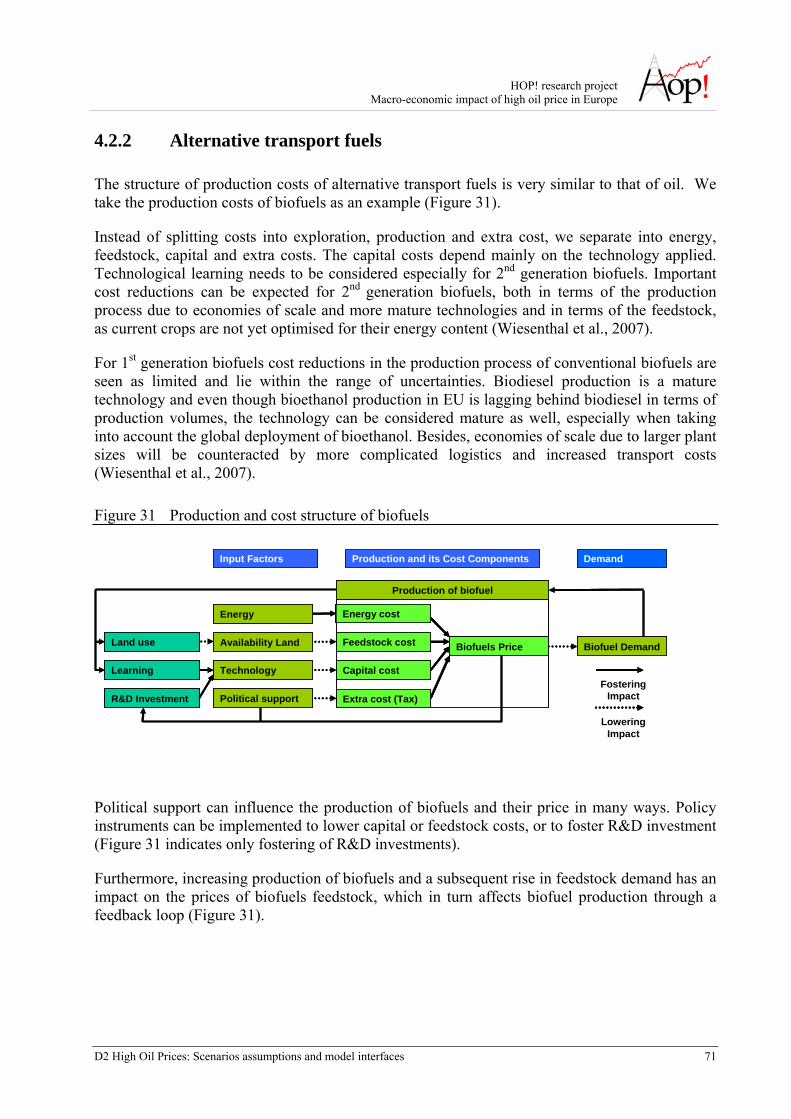
HOP! research project Macro-economic impact of high oil price in Europe
D2 High Oil Prices: Scenarios assumptions and model interfaces 71
4.2.2 Alternative transport fuels
The structure of production costs of alternative transport fuels is very similar to that of oil. We take the production costs of biofuels as an example (Figure 31).
Instead of splitting costs into exploration, production and extra cost, we separate into energy, feedstock, capital and extra costs. The capital costs depend mainly on the technology applied. Technological learning needs to be considered especially for 2nd generation biofuels. Important cost reductions can be expected for 2nd generation biofuels, both in terms of the production process due to economies of scale and more mature technologies and in terms of the feedstock, as current crops are not yet optimised for their energy content (Wiesenthal et al., 2007).
For 1st generation biofuels cost reductions in the production process of conventional biofuels are seen as limited and lie within the range of uncertainties. Biodiesel production is a mature technology and even though bioethanol production in EU is lagging behind biodiesel in terms of production volumes, the technology can be considered mature as well, especially when taking into account the global deployment of bioethanol. Besides, economies of scale due to larger plant sizes will be counteracted by more complicated logistics and increased transport costs (Wiesenthal et al., 2007).
Figure 31 Production and cost structure of biofuels
Biofuel Demand
Learning
Input Factors Production and its Cost Components Demand
Fostering Impact
Lowering Impact
Availability Land
Technology
Energy
Political support
Biofuels PriceFeedstock cost
Capital cost
Extra cost (Tax)
Energy cost
Production of biofuel
R&D Investment
Land use Biofuel Demand
Learning
Input Factors Production and its Cost Components Demand
Fostering Impact
Lowering Impact
Fostering Impact
Lowering Impact
Availability Land
Technology
Energy
Political support
Biofuels PriceFeedstock cost
Capital cost
Extra cost (Tax)
Energy cost
Production of biofuel
Biofuels PriceFeedstock cost
Capital cost
Extra cost (Tax)
Energy cost
Production of biofuel
R&D Investment
Land use
Political support can influence the production of biofuels and their price in many ways. Policy instruments can be implemented to lower capital or feedstock costs, or to foster R&D investment (Figure 31 indicates only fostering of R&D investments).
Furthermore, increasing production of biofuels and a subsequent rise in feedstock demand has an impact on the prices of biofuels feedstock, which in turn affects biofuel production through a feedback loop (Figure 31).
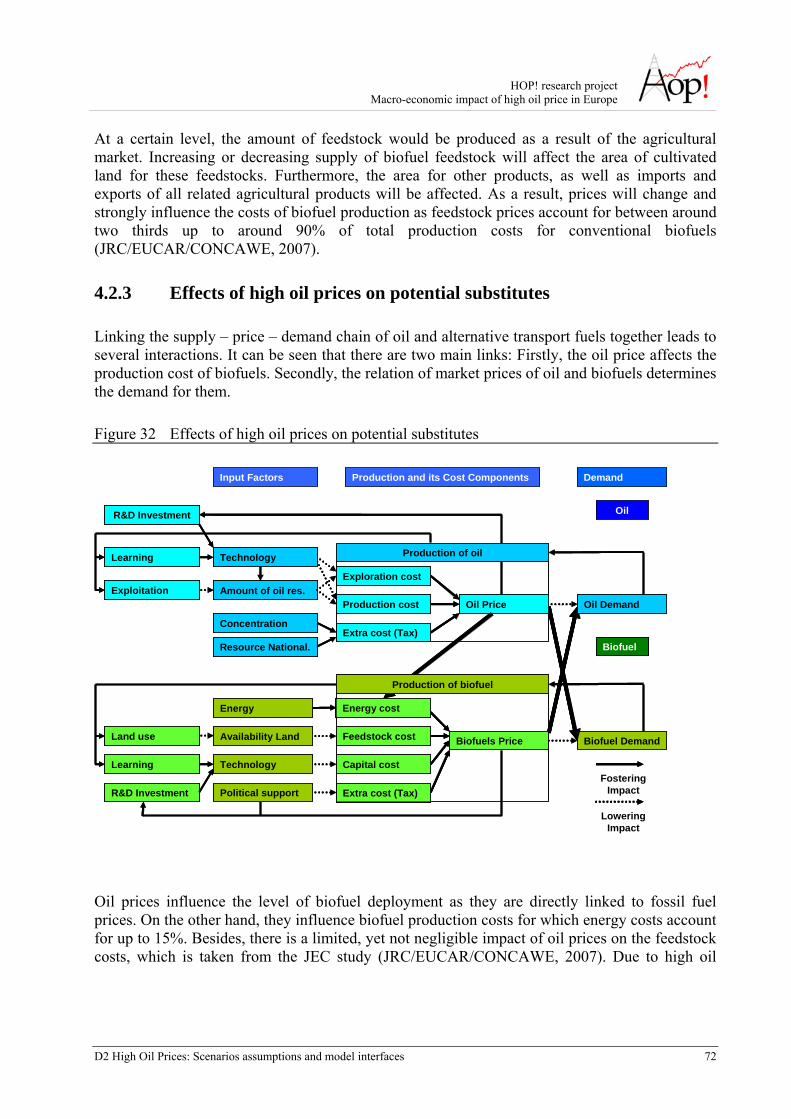
HOP! research project Macro-economic impact of high oil price in Europe
D2 High Oil Prices: Scenarios assumptions and model interfaces 72
At a certain level, the amount of feedstock would be produced as a result of the agricultural market. Increasing or decreasing supply of biofuel feedstock will affect the area of cultivated land for these feedstocks. Furthermore, the area for other products, as well as imports and exports of all related agricultural products will be affected. As a result, prices will change and strongly influence the costs of biofuel production as feedstock prices account for between around two thirds up to around 90% of total production costs for conventional biofuels (JRC/EUCAR/CONCAWE, 2007).
4.2.3 Effects of high oil prices on potential substitutes
Linking the supply – price – demand chain of oil and alternative transport fuels together leads to several interactions. It can be seen that there are two main links: Firstly, the oil price affects the production cost of biofuels. Secondly, the relation of market prices of oil and biofuels determines the demand for them.
Figure 32 Effects of high oil prices on potential substitutes
Biofuel Demand
Biofuel
Learning
Resource National.
Amount of oil res.
Input Factors Production and its Cost Components Demand
Concentration
Oil Demand
Oil
Learning
Fostering Impact
Lowering Impact
R&D Investment
Technology
Exploitation
Availability Land
Technology
Energy
Political support
Exploration cost
Production cost
Extra cost (Tax)
Production of oil
Oil Price
Biofuels PriceFeedstock cost
Capital cost
Extra cost (Tax)
Energy cost
Production of biofuel
R&D Investment
Land use Biofuel Demand
Biofuel
Learning
Resource National.
Amount of oil res.
Input Factors Production and its Cost Components Demand
Concentration
Oil Demand
Oil
Learning
Fostering Impact
Lowering Impact
Fostering Impact
Lowering Impact
R&D Investment
Technology
Exploitation
Availability Land
Technology
Energy
Political support
Exploration cost
Production cost
Extra cost (Tax)
Production of oil
Oil Price
Exploration cost
Production cost
Extra cost (Tax)
Production of oil
Oil Price
Biofuels PriceFeedstock cost
Capital cost
Extra cost (Tax)
Energy cost
Production of biofuel
Biofuels PriceFeedstock cost
Capital cost
Extra cost (Tax)
Energy cost
Production of biofuel
R&D Investment
Land use
Oil prices influence the level of biofuel deployment as they are directly linked to fossil fuel prices. On the other hand, they influence biofuel production costs for which energy costs account for up to 15%. Besides, there is a limited, yet not negligible impact of oil prices on the feedstock costs, which is taken from the JEC study (JRC/EUCAR/CONCAWE, 2007). Due to high oil
HOP! research project Macro-economic impact of high oil price in Europe
D2 High Oil Prices: Scenarios assumptions and model interfaces 73
prices other energy sources become more competitive. The competitiveness of alternative sources would be boosted dramatically in terms of relative prices, however it could be not possible to produce and distribute enough energy from alternative sources in a short time (e.g. production of biofuel could not be increased significantly in some weeks or some months; even if large amount of hydrogen could be produced it could not be distributed or used; even if nuclear energy would become relatively cheap, building new plants would need years etc.).
The supply of alternatives increases and therefore some learning effects occur which lower the production costs of alternatives. Furthermore, development, production and distribution of energy from alternative source, as well as implementing measures to improve energy efficiency, would need significant investments (see economic side) even if economies of scale would contribute to reduces unitary costs. Not only alternative transport fuels, but also other energy sources like coal, gas and electricity by nuclear energy and renewables become more competitive.
It has to be mentioned that not all alternative fuels benefit from soaring oil prices. E.g. the volume of investments in production of biogas developed below the expectations in the last year. In this case lead the high oil prices to an increase of the production costs of biogas. But the market position of biogas remains the same as the feed-in tariffs are fixed. Rising costs and fixed feed-in tariffs lead to decrease of earnings. Therefore, investments in production of biogas declined.
Summarising the impacts of high oil prices on the energy system, the following effects can be assumed:
• R&D investment in technology to discover and to exploit conventional and unconventional oil fields will rise;
• Energy costs of alternative transport fuels will rise due to their need of energy as input in the production;
• Alternative energy sources can theoretically enter the market as they become competitive in terms of price;
• Investments and time are needed to actually produce, distribute and use alternative energy;
• The increase of alternative transport fuels might lower oil demand and, therefore, will lower the exploitation of oil reserves.
HOP! research project Macro-economic impact of high oil price in Europe
D2 High Oil Prices: Scenarios assumptions and model interfaces 74
4.3 Transport
4.3.1 Primary impacts on the transport sector of an increment of the oil price
The primary impact expected from the increment of the oil price is the growth of operating costs of all modes of transport. Consequently, also user costs (fares) are expected to rise.
4.3.1.1 Variables affecting transport costs elasticity with respect to oil price
The impact would be different across the various modes depending on three main elements:
a) The relevance of oil price on the cost of the energy used for the transport mode;
b) The relative weight of the energy cost on total operating cost of the mode;
c) The relevance of the labour cost and the labour market conditions
As far as item a) is concerned, in EU countries oil is largely the basic source of energy used in the transport sector. With the exception of a small share, the whole road vehicles fleets (cars, trucks, buses, coaches, motorcycles) use some petrol derivative as fuel, though it has to be taken into account that this share is strongly growing in some European countries, in particular through the use of biofuels. The situation is more grave to the aircrafts and vessels fleets, for which the development of alternatives is still at a research stage.
The situation is different for railways, tramways and similar. A significant share of diesel locomotives and railcars are still operating in EU (about 44% according UIC data2), but electric traction is predominant and is the only used for urban rails and tramways. Electricity is produced with a different mix of sources in each country. Some countries are more fossil fuels-dependent (e.g. in the Netherlands and in Poland more than 90% of electricity is produced from conventional thermal plants, in Denmark 76%3) and it is therefore expected that the cost of the energy for the rail sector would increase. In other countries, where a larger share of power is produced using alternative sources (e.g. in Spain 50%, in Slovakia 63%, in Austria 66%4), the impact should be lower.
Concerning the weight of the energy cost on the operating costs, there are significant differences across transport modes. An important aspect to be taken into account is the distinction between a short term perspective and a longer term one. In the shorter term, variable costs are the relevant
2 Own calculation on UIC, 2005, International Railway Statistics.
3 Source: own calculation on EU Energy and Transport in Figures 2006.
4 Ibid.
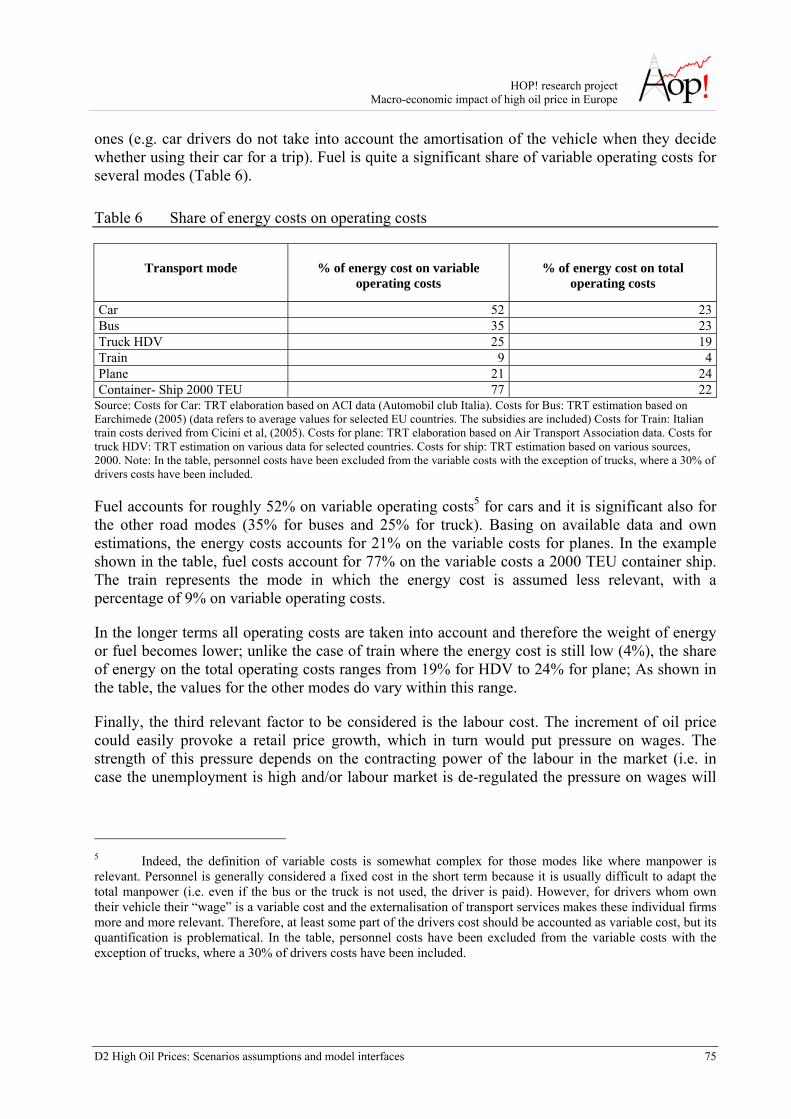
HOP! research project Macro-economic impact of high oil price in Europe
D2 High Oil Prices: Scenarios assumptions and model interfaces 75
ones (e.g. car drivers do not take into account the amortisation of the vehicle when they decide whether using their car for a trip). Fuel is quite a significant share of variable operating costs for several modes (Table 6).
Table 6 Share of energy costs on operating costs
Transport mode % of energy cost on variable operating costs
% of energy cost on total operating costs
Car 52 23Bus 35 23Truck HDV 25 19Train 9 4Plane 21 24Container- Ship 2000 TEU 77 22
Source: Costs for Car: TRT elaboration based on ACI data (Automobil club Italia). Costs for Bus: TRT estimation based on Earchimede (2005) (data refers to average values for selected EU countries. The subsidies are included) Costs for Train: Italian train costs derived from Cicini et al, (2005). Costs for plane: TRT elaboration based on Air Transport Association data. Costs for truck HDV: TRT estimation on various data for selected countries. Costs for ship: TRT estimation based on various sources, 2000. Note: In the table, personnel costs have been excluded from the variable costs with the exception of trucks, where a 30% of drivers costs have been included.
Fuel accounts for roughly 52% on variable operating costs5 for cars and it is significant also for the other road modes (35% for buses and 25% for truck). Basing on available data and own estimations, the energy costs accounts for 21% on the variable costs for planes. In the example shown in the table, fuel costs account for 77% on the variable costs a 2000 TEU container ship. The train represents the mode in which the energy cost is assumed less relevant, with a percentage of 9% on variable operating costs.
In the longer terms all operating costs are taken into account and therefore the weight of energy or fuel becomes lower; unlike the case of train where the energy cost is still low (4%), the share of energy on the total operating costs ranges from 19% for HDV to 24% for plane; As shown in the table, the values for the other modes do vary within this range.
Finally, the third relevant factor to be considered is the labour cost. The increment of oil price could easily provoke a retail price growth, which in turn would put pressure on wages. The strength of this pressure depends on the contracting power of the labour in the market (i.e. in case the unemployment is high and/or labour market is de-regulated the pressure on wages will
5 Indeed, the definition of variable costs is somewhat complex for those modes like where manpower is relevant. Personnel is generally considered a fixed cost in the short term because it is usually difficult to adapt the total manpower (i.e. even if the bus or the truck is not used, the driver is paid). However, for drivers whom own their vehicle their “wage” is a variable cost and the externalisation of transport services makes these individual firms more and more relevant. Therefore, at least some part of the drivers cost should be accounted as variable cost, but its quantification is problematical. In the table, personnel costs have been excluded from the variable costs with the exception of trucks, where a 30% of drivers costs have been included.
HOP! research project Macro-economic impact of high oil price in Europe
D2 High Oil Prices: Scenarios assumptions and model interfaces 76
be lower6). For modes of transport where labour costs is an important share of operating costs, even if the energy price does not directly cause a significant cost growth, such a growth could be caused by the higher wages.
4.3.1.2 Expected impacts by mode of transport
Summing up, it can be expected that the increment of the transport costs hits the modes in a diverse extent:
• Private cars would probably become quite more expensive (unless a compensatory intervention on fuel taxes was put into practice, which is not very likely as the revenue loss would be significant).
• Motorcycles cost would also increase significantly in absolute terms, even though in comparison to private cars they would become more competitive.
• Public road transport should probably adequate tariffs as well to cover the increasing cost of fuel even it is difficult to guess the size of the increment. If average occupancy factors of buses and coaches increased, the higher revenues could cover the higher production costs, at least partially. On the other side, the public authorities could also decide to support personal mobility by increasing subsidies to road public transport to limit tariffs growth. Of course this would mean further public expenditure, which could be not affordable. The effect of labour cost could also be significant however, as manpower cost is generally significant for transport operators. All in all, some growth of tariffs would likely happen, but the cost of using a bus would probably rise less than car’s cost. The impact should be even lower for tramways, rail, metro, etc. especially in those countries where the production of electric power is not heavily dependent on oil.
• Air tariffs would be probably affected in some way, even if the user price structure in the air market is complex and often poorly linked to operating costs. However, on average the increment of tariffs would be unavoidable and low cost airline services could have some more problems than conventional ones.
• On the freight modes side, trucks cost would be increased substantially. As the road haulage market is a very competitive one, profits are very low so there is no room to absorb the increment of fuel cost, which would be probably transferred almost entirely to the user tariffs.
• As for passengers, also for rail freight tariffs the direct impact on tariffs would be probably low, but indirect impacts due to labour cost should be taken into account.
6 This would be positive in terms of production costs, but if prices increase and wages are kept fixed the purchasing power of households will be diminished. Aggregate demand is also negatively affected so that for the economy as a whole, lower wages could easily have a negative impact.
HOP! research project Macro-economic impact of high oil price in Europe
D2 High Oil Prices: Scenarios assumptions and model interfaces 77
• Inland navigation and maritime shipping fares are heavily driven by market conditions but, as for air, an effect of higher fuel cost would become visible on average, even if the impact should be relatively low if compared to the road sector.
4.3.2 Secondary impacts on the transport sector of an increment of the oil price
The primary impact expected is an increment of transport costs, which should hit transport modes in a different way as discussed above. In turn, the increment of transport costs should have a number of secondary effects, namely:
a) Reduction of the personal motorized mobility;
b) Pressure for reducing mobility of goods;
c) Mode shift towards less expensive modes;
d) Pressure on organising transport more efficiently;
e) Pressure on developing more efficient transport means.
4.3.2.1 Reduction of personal motorized mobility
The reduction of personal mobility would be realised both in terms of a lower number of trips per person and of shorter distances per trip. Leisure trips would be at the top of the list of the avoided trips, especially relatively long trips in the week-end. Also trips made for personal business and shopping could be reduced, for instance by concentrating more duties in sequence in the same day. At least in the shorter term, the number of working trips would be much more rigid, in particular for commuters.
Shortening travel distances would also be a reaction to higher transport costs. This could affect for instance shopping mobility, where local shops within the urban area could become more attractive than large shopping malls in the outskirts. Also destinations for leisure trips could be chosen within a more narrow area. Concentrating mobility on unavoidable trips (working, etc.) and reducing travel distances could have a large impact especially on air demand.
The massive rise of air demand that has occurred in the last years is only partially due to a shift from other modes, as there is a very large component of generated traffic, caused by the significant fall of air fares on many routes, which in turn is a consequence of budget airlines competition. When high oil prices made low cost flights commercially unviable, at least part of this new demand might disappear. On the other side, the impact could also shift more demand from conventional companies to low cost ones (e.g. also for business trips) and to force such conventional airlines companies to downsize in order to offset the higher energy costs and keep tariffs competitive.
HOP! research project Macro-economic impact of high oil price in Europe
D2 High Oil Prices: Scenarios assumptions and model interfaces 78
Again, reducing travel distance would be much more complicated, at least in the shorter terms, for working trips. The only way for commuters to shorten their trips would be to move their residence closer to the workplace. However this solution would not be widely feasible for at least two reasons. First, the supply of central residential locations is limited and prices are high. Second, a growing amount of people is facing a more and more flexible labour market and change their job much more frequently than they can afford to move from one house to another.
On the longer terms, there are some strategies that could be put into practice with the aim of reducing the need for travel. The adoption of technologies and organisations that allow individuals to work, shop, manage personal business, etc. from home would be greatly encouraged. This would include teleworking, teleconferences, home banking, home shopping, etc. However, the potential for this kind of strategies is not unlimited and require time as well as accompanying legal frameworks. For instance, the legal validity of electronic documents should be sanctioned, the rights/duties of home workers should be disciplined, etc. Companies should re-organise their procedures to make an efficient use of teleworking, at the same time workers should learn to use the hardware and the software needed to be connected from home. Similar educational needs would exist also for not working individuals in order to learn how to interact with public administration, offices, shops, etc. However, there is a share of jobs that could not be operated at distance (e.g. blue collars, nurses, maids, technical assistance, etc.) and also some personal business (e.g. sport, therapies, parental cares) require to be present. So, there is a limit to the number of trips that can be avoided.
Still on the longer terms, land use planning could help to reduce the commuting trips (at least motorised commuting trips) by e.g. providing public houses to rent closer to workplaces at affordable prices. However, this objective could be quite hard to achieve both economically and politically also because it would contrast the current trend of real estate market.
In summary, higher transport costs would limit personal mobility. This limitation could be partially offset thanks to the technology, but at a certain extent it would affect individual habits. The era of a relatively easy and cheap mobility for everyone is recent (and concerns only the richest part of the world). So there are no reasons to believe that people could not return to live in a world where moving is a less ordinary experience, but for sure this transition would not be effortless from many point of views.
4.3.2.2 Pressure to reduction in mobility of goods
While personal mobility could be at least partially reduced even in the short terms in response to higher transport costs, the impact on mobility of goods is more questionable. The transport of goods is just a segment of a more complex productive and logistics chain, where the relevant variable is total cost. Currently, transport costs often amount to a very low share of total production costs or goods price (see COMPETE, 2006). This is true on the large scale as well as on the medium and short scale:
- At a global level, the costs of transport are low enough to make convenient to move the production where labour cost is low.
HOP! research project Macro-economic impact of high oil price in Europe
D2 High Oil Prices: Scenarios assumptions and model interfaces 79
- At an intermediate level, in many instances large companies have outsourced several parts of the production to small specialised firms in order to outsource also the enterprise risks due to fluctuations of the market (when demand is low, large firms can just avoid to order and pay components instead of underutilizing their own plants). The impact of such a strategy was to increase the need of transporting semi-final products from different locations, but haulage is cheap enough to make outsourcing convenient.
- On the local side, retailers save money by reducing the size of their own warehouses and receiving goods daily from the producer or from big centralised warehouses, because the cost of transport is much lower than floorspace.
Higher transport costs would therefore affect the production and logistics chain. However it is difficult to predict the impact, because a shift towards a less transport-intensive model strictly depends on relative prices of inputs. Currently transport is cheap compared to labour and capital, so that a really high increment of transport costs would be required to induce companies to re-think the current system. A massive growth of energy costs, however, would bear the potential both to create severe problems to the economy, but also to offer new business opportunities developing, marketing exporting more fuel efficient alternatives and fueling alternatives for transport (see dedicated section) so that it is hard to see which level of priority would receive the need of reducing transport. For instance, it is reasonable to assume that large firms would continue to strongly prefer outsourcing in order to deal with a fall of demand, even if transport costs should be much higher.
In any case, restructuring the production system would require years and it would have significant impacts on the global economy in itself. In the shorter terms, there could be some chances of reducing the freight traffic performance by improving the efficiency of the transport industry (e.g. minimising empty trips, merging goods for different clients in the same locations, etc.).
In the end, the higher transport costs would probably impact on freight transport much less than on personal mobility, at least on the shorter terms7.
4.3.2.3 Mode shift
Another predictable reaction to higher transport costs would be modal shift towards less expensive modes of transport. Since higher oil price would impact differently on alternative transport modes, some of them would become more competitive.
In principle, private cars should be much less attractive in comparison to other modes, however it is hard to foresee clearly the size of mode shift and the preferred alternatives. It was argued above that rail could be the mode of transport for which the increment of energy price would
7 If high oil prices gave rise to severe economic crises, the amount of goods transported could fall significantly, but this would be an indirect economic effect rather than a true impact of oil price on the transport sector.
HOP! research project Macro-economic impact of high oil price in Europe
D2 High Oil Prices: Scenarios assumptions and model interfaces 80
have less impact on user cost. However, at the same time railways would be also one of the modes for which expanding capacity would be more complex. In the metropolitan areas and in the peak time regional and urban rails as well as tramways and metro are often already working at the maximum capacity or so. Even if a relatively small share of current car drivers would like to shift to rail, the current capacity could be insufficient.
Investments in rolling stocks and infrastructures (not only new tracks, but also traffic control devices, signalling, etc., which can increase the capacity of existing lines) would need time and money to be accomplished. Furthermore, given the huge size of the investments required, the public sector would be the only subject that could afford to spend. So a (deficit) spending-oriented budget policy would be probably required8 to governments and to the EU, which is the opposite of the current one.
In brief, even if there could be the potential for a significant shift from car to rail, the actual conditions on the supply side could hinder this shift.
Other alternatives to private car could be more attractive in the shorter terms. One alternative is road public transport, whose supply could be enlarged more quickly than rail’s. Even if public transport tariffs would rise, it is likely that a bus ride would become far more convenient than a car trip. Also motorcycles, whose unitary fuel consumption is lower than car’s, would probably be used more intensively. For short trips, bikes could become more popular. The actual shift towards such modes depends also on other circumstances: the quality of service, the availability of facilities (e.g. cycling lanes), the weather conditions, etc. Thus, while it can be expected that car is abandoned for a share of trips, the more attractive alternative depends on several local conditions.
Another alternative that could increase its market share is a different use of private car. Car pooling could become more popular. Even if in comparison to the exclusive use of the own car, it introduces some limitations and rigidities, which could be tolerated more than the limitations of using public modes or a bicycle.
Again, the case for freight transport is at least partially different. A large part of goods are moved on relatively short distances (according to Eurostat Energy and Transport in Figures (2003), 75% of tonnes in the EU15 countries were transported for less than 150 km in the year 2001) where road transport has no real alternatives (still from the same source, 96% of tonnes under 150 km are transported by truck). On medium-long distances, rail freight could become more competitive with respect to trucks, however, the same limitations discussed for passengers would exist: shifting demand from trucks to rail would require a significant increase of capacity of lines and nodes (stations, intermodal centres), which could not be quickly realised. Furthermore, even when more rail freight capacity was available, delivering freight by train would require a more rigid organisation (e.g. a given train should be booked and goods should be ready at the rail
8 Funds could be shifted from other budget items, but it is quite difficult to imagine that social expenditures could be cut especially if high oil price gave rice to an economic fall. And investments for developing alternative technologies could be needed at the same time.
HOP! research project Macro-economic impact of high oil price in Europe
D2 High Oil Prices: Scenarios assumptions and model interfaces 81
terminal at fixed times, hauliers should be available at the destination for the local distribution). So, in the shorter time it might well be that only a small share of goods would be diverted from road transport.
4.3.2.4 Development of alternative transport means
Oil price growth is transferred to transport costs as much as transport modes use, directly or indirectly, oil products. We have discussed so far that a more expensive transport would provoke different reactions, which in general are undesired behaviours. Therefore, it is reasonable to expect that the industry will be strongly motivated to improve the efficiency of transport means and to develop alternative technologies.
The development of innovative cars would be the major target of the industry effort. The most considered alternatives include biofuels, hybrid cars, electric cars, hydrogen fuel cells (see chapter 6 of D1). To the extent that alternative cars are actually developed and enter the market at a competitive price, an indirect impact of high oil price could be to speed up the renewal of the vehicle fleet. Of course, the savings on transport costs that the new cars could guarantee would be a major driver of the fleet development: if energy consumption of innovative vehicles was consistently reduced, car replacement would be strongly encouraged, otherwise only part of the scrapped cars would be replaced.
However, the other economic effects of high oil prices should be considered here. Purchasing a new car is a significant financial effort for several households (either in terms of immediate payment or in terms of instalments). In case of an economic crisis caused by the high cost of energy, many households could not afford to replace their cars even if innovative, more efficient, vehicles were on the market.
Furthermore, once again in the shorter term alternatives to conventional cars could not be available. Whatever technological path is considered, it is currently hardly believed that innovative cars will be available on the market in few years. Here the time path is critical: assuming that oil prices will rise significantly in the future, the impact on the road vehicle fleet will be probably quite different according to how close is this future to the present time.
4.3.3 The simulation of scenarios to measure the expected impacts on the transport sector
The expected impacts on the transport sector discussed above are of different nature. For some of them it is quite easy to identify whether they drive towards e.g. a lower demand or a mode shift, etc. In other case, feed-back effects can invert the direction of the primary impact or more impacts co-exist and it is difficult to identify which one would have the major influence. In brief, it is difficult to make more specific forecasts without the help of some quantitative tool. The ASTRA model (in combination with POLES) is expected to serve as modelling instrument for providing quantitative forecasts about the impacts of high oil price. Given the features of the
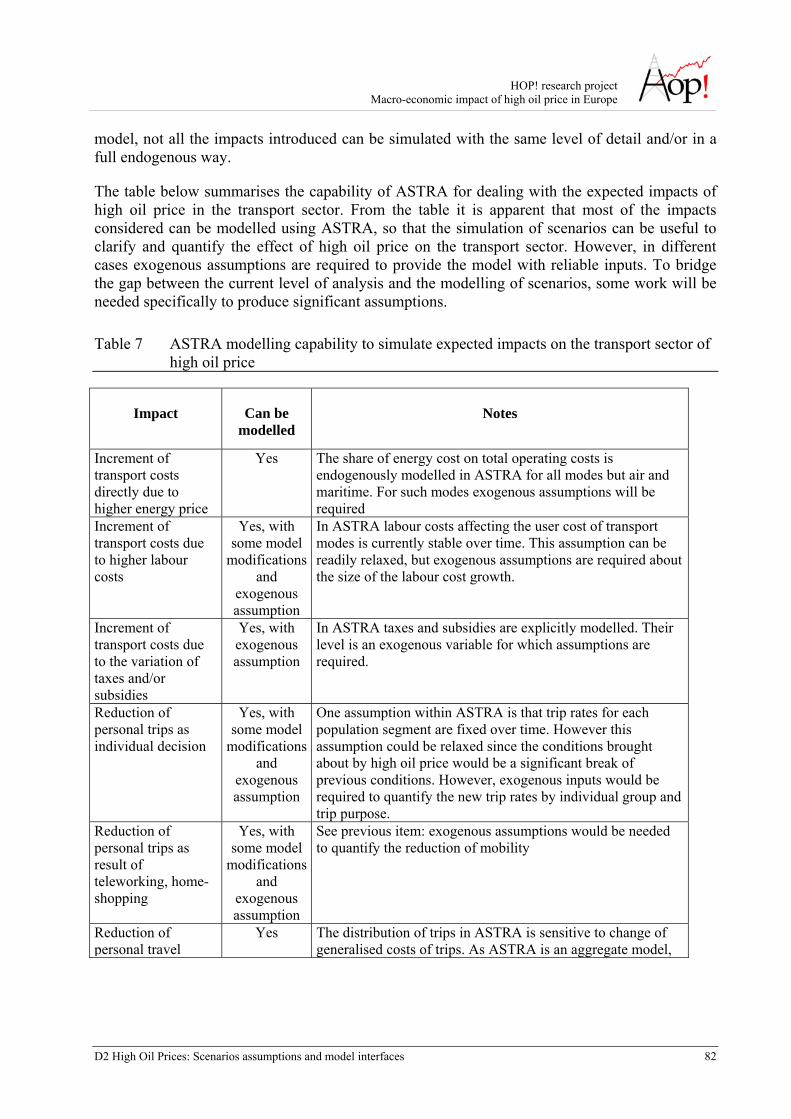
HOP! research project Macro-economic impact of high oil price in Europe
D2 High Oil Prices: Scenarios assumptions and model interfaces 82
model, not all the impacts introduced can be simulated with the same level of detail and/or in a full endogenous way.
The table below summarises the capability of ASTRA for dealing with the expected impacts of high oil price in the transport sector. From the table it is apparent that most of the impacts considered can be modelled using ASTRA, so that the simulation of scenarios can be useful to clarify and quantify the effect of high oil price on the transport sector. However, in different cases exogenous assumptions are required to provide the model with reliable inputs. To bridge the gap between the current level of analysis and the modelling of scenarios, some work will be needed specifically to produce significant assumptions.
Table 7 ASTRA modelling capability to simulate expected impacts on the transport sector of high oil price
Impact Can be modelled
Notes
Increment of transport costs directly due to higher energy price
Yes The share of energy cost on total operating costs is endogenously modelled in ASTRA for all modes but air and maritime. For such modes exogenous assumptions will be required
Increment of transport costs due to higher labour costs
Yes, with some model
modifications and
exogenous assumption
In ASTRA labour costs affecting the user cost of transport modes is currently stable over time. This assumption can be readily relaxed, but exogenous assumptions are required about the size of the labour cost growth.
Increment of transport costs due to the variation of taxes and/or subsidies
Yes, with exogenous assumption
In ASTRA taxes and subsidies are explicitly modelled. Their level is an exogenous variable for which assumptions are required.
Reduction of personal trips as individual decision
Yes, with some model
modifications and
exogenous assumption
One assumption within ASTRA is that trip rates for each population segment are fixed over time. However this assumption could be relaxed since the conditions brought about by high oil price would be a significant break of previous conditions. However, exogenous inputs would be required to quantify the new trip rates by individual group and trip purpose.
Reduction of personal trips as result of teleworking, home-shopping
Yes, with some model
modifications and
exogenous assumption
See previous item: exogenous assumptions would be needed to quantify the reduction of mobility
Reduction of personal travel
Yes The distribution of trips in ASTRA is sensitive to change of generalised costs of trips. As ASTRA is an aggregate model,
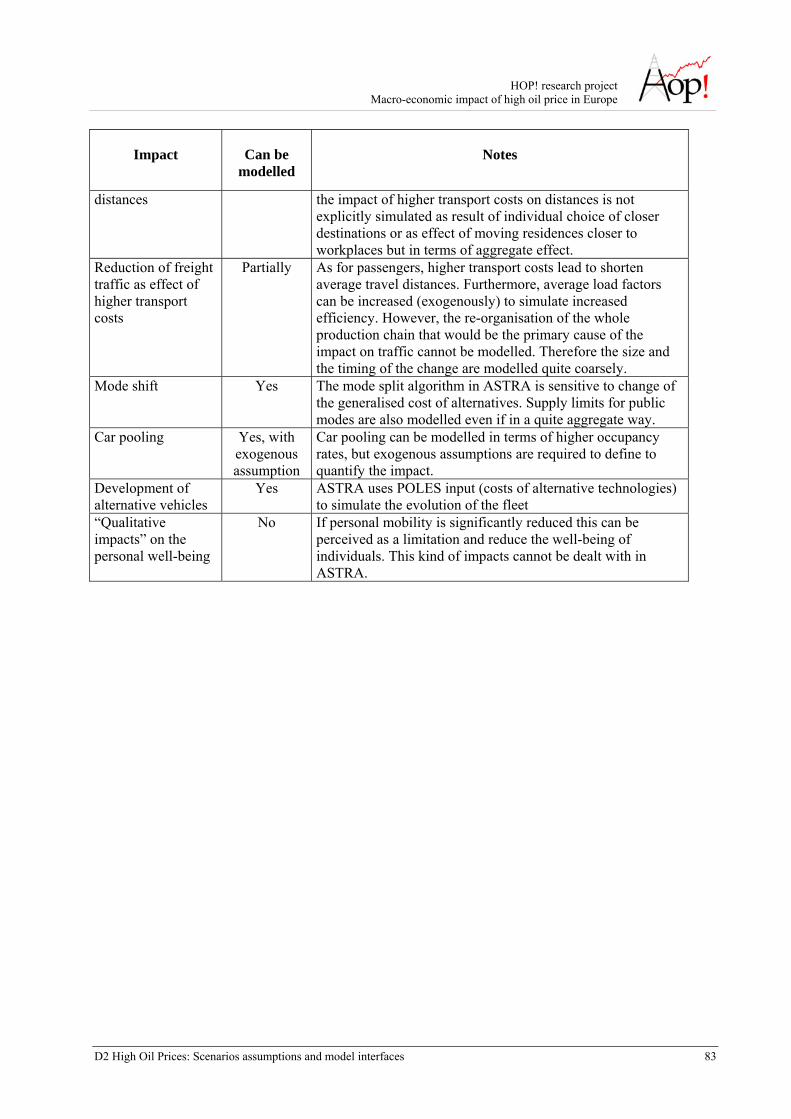
HOP! research project Macro-economic impact of high oil price in Europe
D2 High Oil Prices: Scenarios assumptions and model interfaces 83
Impact Can be modelled
Notes
distances the impact of higher transport costs on distances is not explicitly simulated as result of individual choice of closer destinations or as effect of moving residences closer to workplaces but in terms of aggregate effect.
Reduction of freight traffic as effect of higher transport costs
Partially As for passengers, higher transport costs lead to shorten average travel distances. Furthermore, average load factors can be increased (exogenously) to simulate increased efficiency. However, the re-organisation of the whole production chain that would be the primary cause of the impact on traffic cannot be modelled. Therefore the size and the timing of the change are modelled quite coarsely.
Mode shift Yes The mode split algorithm in ASTRA is sensitive to change of the generalised cost of alternatives. Supply limits for public modes are also modelled even if in a quite aggregate way.
Car pooling Yes, with exogenous assumption
Car pooling can be modelled in terms of higher occupancy rates, but exogenous assumptions are required to define to quantify the impact.
Development of alternative vehicles
Yes ASTRA uses POLES input (costs of alternative technologies) to simulate the evolution of the fleet
“Qualitative impacts” on the personal well-being
No If personal mobility is significantly reduced this can be perceived as a limitation and reduce the well-being of individuals. This kind of impacts cannot be dealt with in ASTRA.

HOP! research project Macro-economic impact of high oil price in Europe
D2 High Oil Prices: Scenarios assumptions and model interfaces 84
4.4 Economy
The most important statement in this section has to be presented first: it is a myth that high fossil fuel prices definitely harm the economy. Of course, the obvious direct impact of high oil prices is that either energy consumption, consumer goods and services become more expensive as nearly all of them incorporate fossil energy, such that consumers have less money to spent on other consumer goods and services, or that value added of companies is reduced because energy constitutes an intermediate input to them and when they could not pass on price increases of these inputs to their consumers their value-added (the difference between the market price of their goods and their intermediate inputs) is reduced.
BUT, there exist also a number of compensating mechanisms, which could even lead to a better economic performance with higher oil prices then with low oil prices, such that the final impact of high oil prices on the economy could be in a range from negative to positive results and can not be easily foreseen. We will elaborate on the different mechanisms in the following sections after the following brief overview on the magnitude of oil imports to other economic variables.
Figure 33 Importance of oil and fuel imports compared with total imports
Share of oil and fuel imports on total imports of EU countries
0%
5%
10%
15%
20%
25%
30%
35%
40%
45%
1963 1966 1969 1972 1975 1978 1981 1984 1987 1990 1993 1996 1999 2002 2005
AustriaBelgiumBulgariaCyprusCzech Rep.DenmarkEstoniaFinlandFranceGermanyGreeceHungaryIrelandItalyLatviaLithuaniaLuxembourgMaltaNetherlandsPolandPortugalRomaniaSlovakiaSloveniaSpainSwedenUnited Kingdom
Source: UN Comtrade Database, Fraunhofer ISI calculations, missing data for a number of countries in first 25 years
In the discussions about the economic impacts of high oil prices the focus is most often on the experiences made during the oil crises during the 1970ies and the 1980ies. Hence, we commence our analysis before these dates in 1963. First, we are interested in the share that oil and fuel
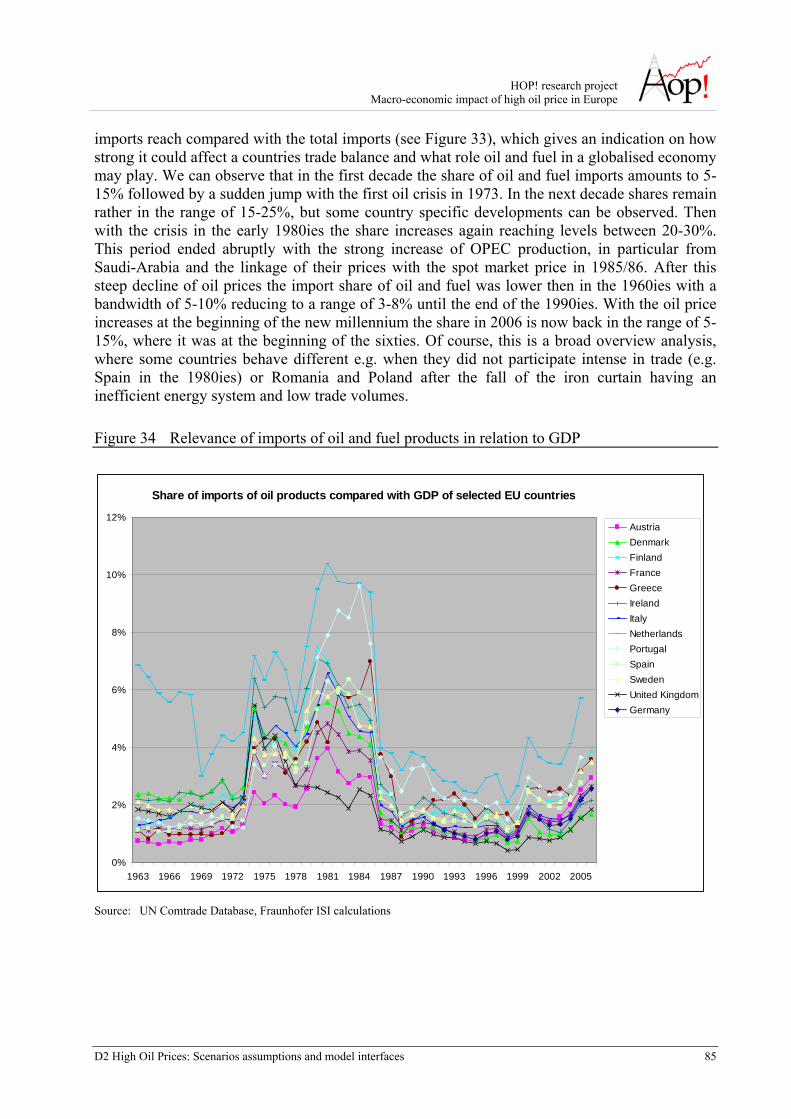
HOP! research project Macro-economic impact of high oil price in Europe
D2 High Oil Prices: Scenarios assumptions and model interfaces 85
imports reach compared with the total imports (see Figure 33), which gives an indication on how strong it could affect a countries trade balance and what role oil and fuel in a globalised economy may play. We can observe that in the first decade the share of oil and fuel imports amounts to 5-15% followed by a sudden jump with the first oil crisis in 1973. In the next decade shares remain rather in the range of 15-25%, but some country specific developments can be observed. Then with the crisis in the early 1980ies the share increases again reaching levels between 20-30%. This period ended abruptly with the strong increase of OPEC production, in particular from Saudi-Arabia and the linkage of their prices with the spot market price in 1985/86. After this steep decline of oil prices the import share of oil and fuel was lower then in the 1960ies with a bandwidth of 5-10% reducing to a range of 3-8% until the end of the 1990ies. With the oil price increases at the beginning of the new millennium the share in 2006 is now back in the range of 5-15%, where it was at the beginning of the sixties. Of course, this is a broad overview analysis, where some countries behave different e.g. when they did not participate intense in trade (e.g. Spain in the 1980ies) or Romania and Poland after the fall of the iron curtain having an inefficient energy system and low trade volumes.
Figure 34 Relevance of imports of oil and fuel products in relation to GDP
Share of imports of oil products compared with GDP of selected EU countries
0%
2%
4%
6%
8%
10%
12%
1963 1966 1969 1972 1975 1978 1981 1984 1987 1990 1993 1996 1999 2002 2005
AustriaDenmarkFinlandFranceGreeceIrelandItalyNetherlandsPortugalSpainSwedenUnited KingdomGermany
Source: UN Comtrade Database, Fraunhofer ISI calculations
HOP! research project Macro-economic impact of high oil price in Europe
D2 High Oil Prices: Scenarios assumptions and model interfaces 86
The second economic variable, which we want to compare with the imports of fossil fuels is gross domestic product (GDP) of a number of selected countries of the EU. Figure 34 presents the share of oil and fuel imports compared with GDP for 12 countries since 1963 and for Germany since 1991. We include Germany since it is one of the countries we focus on in later analyses. The curves in the figure reveal a quite similar shape then for the previous figure, the share of the imports on GDP is lower starting with 1-2% in the 1960ies, reaching 3-5% during the 1970ies, peaking with 4-7% in the first half of the 1980ies and declining then to levels below the early 1960ies until the end of the last century. With the beginning of the new millennium, that share increased reaching in 2006 a range of 2-4% of GDP.
4.4.1 The economic setting today and during earlier phases of high oil prices
We have shown in the previous section that in relation to major economic aggregates like total imports and GDP and despite continuous growth of oil consumption since the 1970ies the imports of oil and fuel reach lower levels of relevance then in the oil price crises in the 1970ies and the 1980ies.
Further the overall economic setting today differs significantly from the past oil price crises. Today the world economy is booming, while it was already weak in many countries in the early 1970ies, after a period of re-establishing the industrial base and clearing the damages of the second world war in Western Europe, which went along with a period of full employment and high economic growth rates. But in the early 1970ies unemployment levels grew strongly and the response to the inflationary pressure coming from the high oil prices was that the unions demanded for higher wages increasing the inflationary pressure, to which then the Central Banks responded with significant increases of interest rates. This even worsened the situation as it reduced investments. Today it can be expected that the institutional structures have been improved such that these reinforcing impacts would be dampened by modulated reactions of the economic and institutional actors.
A significant difference today is the fact that the two largest countries in terms of population, China and India, are experiencing a fast economic development, which brings wealth to a significant number of their population and stimulate the world economic development by both reducing the cost of many goods and services by cheaper production in these two countries and by increasing world demand through their imports, in particular of investment goods.
The last two points can also be summarized by concluding that the past oil price crises were caused by a supply shock i.e. forced/voluntary reduced supply and higher prices, while the situation today is rather characterized by a demand shock i.e. the strong growth of oil demand from the developing countries, in particular China and India.
The political situation differs also significantly. In the 1970ies and 1980ies the Cold War led by the two strongest nations on each side was paralysing joint efforts to resolve the crisis. Today regular meetings between the strongest nations (G8), but also in the frame of the United Nations
HOP! research project Macro-economic impact of high oil price in Europe
D2 High Oil Prices: Scenarios assumptions and model interfaces 87
enable to develop joint strategies against such economic crises, which can be much more effective then single efforts.
Finally, two further issues play an important role to make the outcome of today's high oil prices different from those of the past: first, is the expectation on the duration of the period of high oil prices. In the past it was assumed that within a limited period of time oil prices would reduce to low levels again. This time the majority of economic agents begins to expect a sustained increase of high oil prices (in particular this becomes obvious by the annual IEA forecast, which each time in the last few years significantly increased their baseline forecast). Of course, policies and investment strategies can be designed quite different expecting sustained or only short-period high oil prices. Second, the number of alternative energies and technologies for energy conversion and use is much higher today then at the time of the past crises.
Given these two last differences, we would cautiously point to the possibility that given the framework of expectations of high oil prices and the technical availability of alternative technologies for energy production and use and the observation of continuous booming economies the high oil prices could even constitute a stimulating element of such an economic prosperous situation. For the moment, we would remain with the indication that the same week when the oil price reached the record of 90$/bbl the German high level economic expert group revised their numbers for Germanys economic growth of this year – and they revised them upwards.
4.4.2 Direct impacts versus indirect impacts of high oil prices
The differentiation in direct and indirect impacts of high oil prices is necessary for the analysis. The latter exist only with the former and their presence is required to generate a positive impact on the economy due to high oil prices. Hence, the following paragraphs define and delineate the two groups of impacts and provide examples for them.
Direct impacts:
• Definition: such impacts occur directly in the affected sectors, i.e. within the energy and transport sectors, as a reaction of consumers and producers to higher energy prices and related cost changes.
• Examples: reduction of transport or energy demand, installation of more efficient energy conversion technology, purchase of more efficient household appliances, change of energy usage behaviour (e.g. reduced temperature in buildings), purchase of more efficient vehicles, modal-shift towards more energy efficient and hence in relative terms cheaper modes, change of transport behaviour (e.g. reducing of driving distances).
• Application in models: direct impacts in particular the changes of demand are treated in detail in general equilibrium models that base their whole analysis on price-driven demand-supply curves and in partial market models (e.g. transport network models).
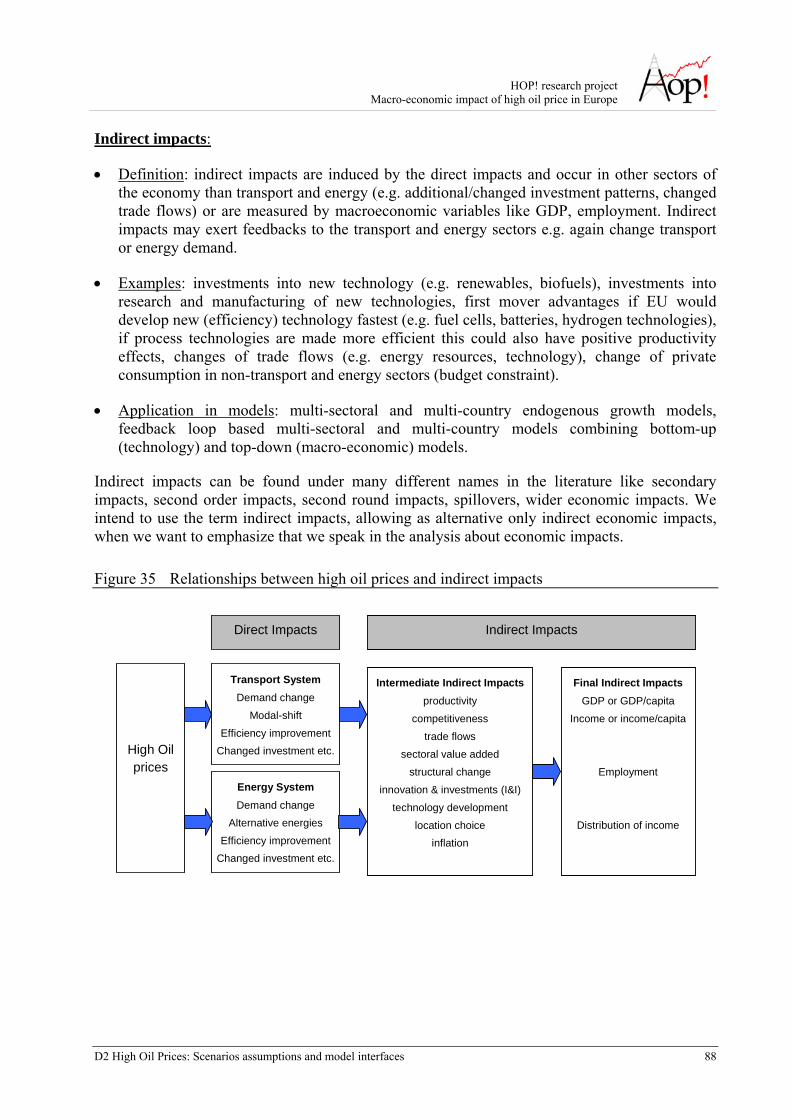
HOP! research project Macro-economic impact of high oil price in Europe
D2 High Oil Prices: Scenarios assumptions and model interfaces 88
Indirect impacts:
• Definition: indirect impacts are induced by the direct impacts and occur in other sectors of the economy than transport and energy (e.g. additional/changed investment patterns, changed trade flows) or are measured by macroeconomic variables like GDP, employment. Indirect impacts may exert feedbacks to the transport and energy sectors e.g. again change transport or energy demand.
• Examples: investments into new technology (e.g. renewables, biofuels), investments into research and manufacturing of new technologies, first mover advantages if EU would develop new (efficiency) technology fastest (e.g. fuel cells, batteries, hydrogen technologies), if process technologies are made more efficient this could also have positive productivity effects, changes of trade flows (e.g. energy resources, technology), change of private consumption in non-transport and energy sectors (budget constraint).
• Application in models: multi-sectoral and multi-country endogenous growth models, feedback loop based multi-sectoral and multi-country models combining bottom-up (technology) and top-down (macro-economic) models.
Indirect impacts can be found under many different names in the literature like secondary impacts, second order impacts, second round impacts, spillovers, wider economic impacts. We intend to use the term indirect impacts, allowing as alternative only indirect economic impacts, when we want to emphasize that we speak in the analysis about economic impacts.
Figure 35 Relationships between high oil prices and indirect impacts
Direct Impacts
High Oil prices
Indirect Impacts
Intermediate Indirect Impacts productivity
competitiveness
trade flows sectoral value added
structural change
innovation & investments (I&I)
technology development
location choice inflation
Final Indirect Impacts GDP or GDP/capita
Income or income/capita
Employment
Distribution of income
Transport System Demand change
Modal-shift
Efficiency improvement Changed investment etc.
Energy System Demand change
Alternative energies
Efficiency improvement Changed investment etc.
HOP! research project Macro-economic impact of high oil price in Europe
D2 High Oil Prices: Scenarios assumptions and model interfaces 89
4.4.3 Traditional and alternative views on impacts of high oil prices
Looking at the literature we mainly find one stream of analysis and conclusions about the economic impact of high oil prices, which we would like to call the traditional view on impacts of high oil prices. However, we believe it is absolutely necessary to develop an alternative point of view since according to this traditional view today the world economy should be in a recession, which we are not.
4.4.3.1 The traditional point of view: inflation, income transfer and terms of trade
The traditional line of arguments about the economic impacts of high oil prices argues that "Higher oil prices lead to inflation, increased input costs, reduced non-oil demand and lower investment in net oil-importing countries" and "Overall, an oil-price increase leads to a transfer of income from [oil] importing to exporting countries through a shift in the terms of trade" as formulated by the IEA (2004) and supported by other analyses (Stewart, 1990, Fenton, 2004, Arnold et al., 2007). The definite final outcome should be a reduction of GDP of the net oil importing countries.
Other authors in this line of thoughts attenuate the strictness with which the economic downturn would have to follow after an oil price increase. In a model based analysis with the IMF model MULTIMOD the conclusion was drawn that the economic downturn could be avoided or at least limited, when the monetary authorities designing the monetary policy react in a well-chosen and forward-looking way, i.e. mainly take action if oil price increase tends to affect the core inflation and the credibility of the monetary policy (Hunt et al., 2001).
We have extended this line of thought, but looked at the changes of the terms of trade from the other end, which is the stimulating and compensating effect on the economy of the rise of exports to oil exporting countries when oil prices increase. As an example, we have analysed the export trends of large industrialised countries to selected Arabian oil exporting countries (Saudi Arabia, Kuwait, United Arab Emirates) since the 1960ies.
Figure 35 presents the analysis. As exports we considered investment goods and other higher value goods classified by SITC categories, of which machinery and transport equipment constitute the largest group (chemicals and related products, n.e.s., manufactured goods classified chiefly by material, machinery and transport equipment, miscellaneous manufactured articles, commodities and transactions not elswhere classified). It becomes obvious that such exports rather directly follow the oil price trend, in this case taken from the OPEC-Oil-Basket. The coefficient of determination lies in the range of 0.7 to 0.8 (besides for the US where it is lower, which is explained by the specifics of US exports after the first Iraq war).
The mechanism is of course that even when oil production and cost remain the same in the oil exporting countries, due to the price increase these countries significantly increase their revenues. In turn they use these additional revenues either to buy machinery to increase their oil production, high value consumer goods or in more recent times equipment to maintain growth in the region independently from oil production like the investments into airports and airlines of the
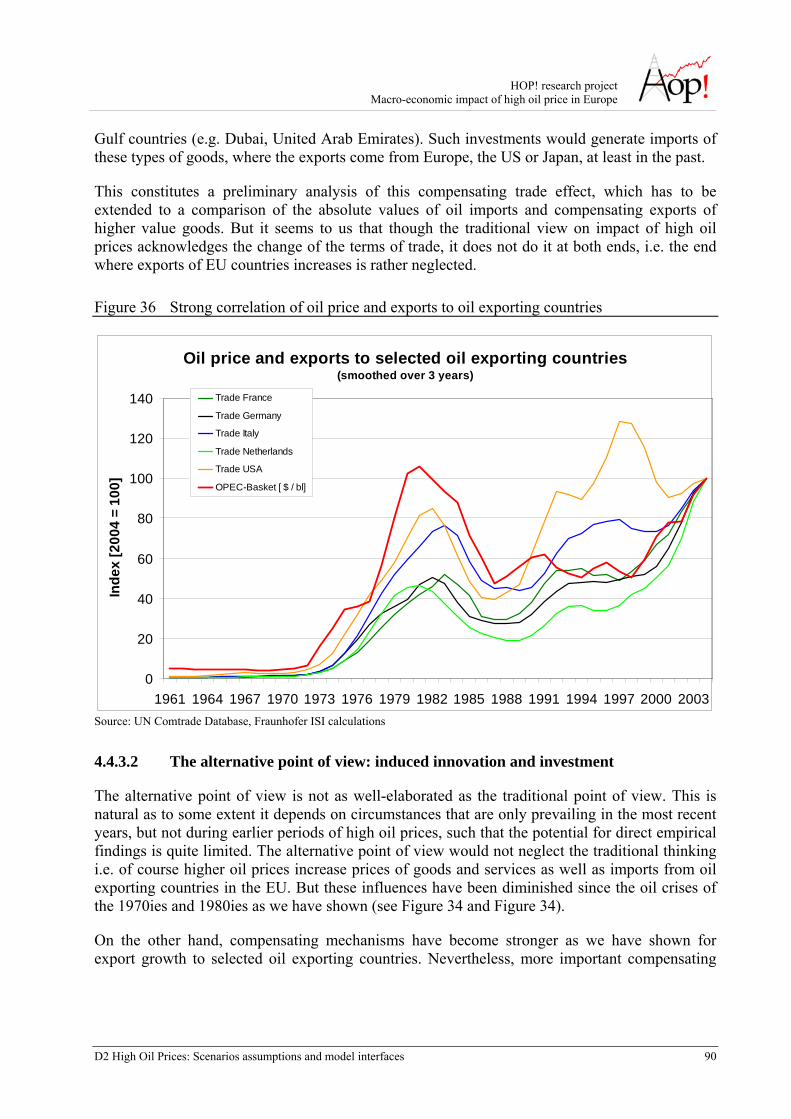
HOP! research project Macro-economic impact of high oil price in Europe
D2 High Oil Prices: Scenarios assumptions and model interfaces 90
Gulf countries (e.g. Dubai, United Arab Emirates). Such investments would generate imports of these types of goods, where the exports come from Europe, the US or Japan, at least in the past.
This constitutes a preliminary analysis of this compensating trade effect, which has to be extended to a comparison of the absolute values of oil imports and compensating exports of higher value goods. But it seems to us that though the traditional view on impact of high oil prices acknowledges the change of the terms of trade, it does not do it at both ends, i.e. the end where exports of EU countries increases is rather neglected.
Figure 36 Strong correlation of oil price and exports to oil exporting countries
Oil price and exports to selected oil exporting countries (smoothed over 3 years)
0
20
40
60
80
100
120
140
1961 1964 1967 1970 1973 1976 1979 1982 1985 1988 1991 1994 1997 2000 2003
Inde
x [2
004
= 10
0]
Trade France
Trade Germany
Trade Italy
Trade Netherlands
Trade USA
OPEC-Basket [ $ / bl]
Source: UN Comtrade Database, Fraunhofer ISI calculations
4.4.3.2 The alternative point of view: induced innovation and investment
The alternative point of view is not as well-elaborated as the traditional point of view. This is natural as to some extent it depends on circumstances that are only prevailing in the most recent years, but not during earlier periods of high oil prices, such that the potential for direct empirical findings is quite limited. The alternative point of view would not neglect the traditional thinking i.e. of course higher oil prices increase prices of goods and services as well as imports from oil exporting countries in the EU. But these influences have been diminished since the oil crises of the 1970ies and 1980ies as we have shown (see Figure 34 and Figure 34).
On the other hand, compensating mechanisms have become stronger as we have shown for export growth to selected oil exporting countries. Nevertheless, more important compensating
HOP! research project Macro-economic impact of high oil price in Europe
D2 High Oil Prices: Scenarios assumptions and model interfaces 91
mechanisms would come from innovations stimulated and induced by the high oil prices, the related investments to bring these innovations into the markets, the related changes of the terms of trade when the EU manages to capture a first mover advantage of these innovations and linked with all this a potential structural economic change. Obvious fields for induced innovation and investment (I&I) as reactions to high oil prices would be energy efficiency technologies as well as oil substituting technologies. We will elaborate on the European competitive position for these technologies in the followings sections.
We could identify a few sources that would support the hypothesis of higher oil prices stimulating investments (e.g. in energy technologies) and in some cases also the hypothesis of being economically beneficial. First, the CASCADE-Mints project using a number of models concluded that high oil prices will stimulate investments in alternative technologies until 2030 (Cascade-Mints, 2007). A US study from Hirsch et al. (2005) discusses the potentials to mitigate the peaking of oil production and the corresponding high oil prices. With mitigation they mean to invest into alternative energy technologies as well as in energy efficiency, which is then pretty close to our line of arguments that this will compensate or even overcompensate the negative side of impacts of high oil prices. Hirsch et al make an additional point that this strategy poses a severe risk assessment component i.e. starting mitigation to early it would become very costly and could favour the use of premature technologies, while mitigating too late oil prices would become extremely high and have severe consequences for the economy.
The strongest parallelism to our alternative point of view comes from an Indian study. PetroFed/NCEAR (2006) based on macroeconomic models argue that the Indian government should not continue to control the price level of oil in India, because in the medium term this would deteriorate the government budget and would reduce investments in alternative technologies, while if the government would let increase oil and fuel prices in India according to the world market, this would make energy use more efficient, would boost investment in alternative energies and would keep the government budget healthy, and all that with a low level of inflation.
Following the presented line of arguments also other conclusions in the traditional point of view would have to change. The IEA (2004) argues that the US would suffer the least of all larger developed countries, because their indigenous production is largest. Arguing in the alternative line of thoughts the US would suffer more than others because fuel prices are kept very low such that the investment into alternative energy technologies and efficiency technologies are not as beneficial as in other countries. Hence, the US would not experience a similar push of I&I in these technologies. The second important issue, more in the traditional line of thinking, would be that because of rather inefficient use of energy in the US, the energy intensity is higher then in other developed countries, such that the increasing impact on prices could be stronger. So, we would just expect the opposite for the US as the IEA.
4.4.4 The key words: innovations and investments
A main trigger of any reaction of the economy to high oil prices will come from investments. It is clear that high oil prices would stimulate investments into efficiency technologies and into
HOP! research project Macro-economic impact of high oil price in Europe
D2 High Oil Prices: Scenarios assumptions and model interfaces 92
alternative energy technologies, if not the oil price increase is that sharp that it would immediately lead to a recession. We would call such investments additional investments. On the other hand it has to be taken into account that due to the shift towards alternative energy technologies investments into conventional technologies would be reduced or avoided. We would call such investments, avoided investments.
To consider the net balance between additional and avoided investment properly is very important for the analysis of the impact of high oil prices. Further, it is not sufficient to consider the total net balance of investments, but the individual sectoral balances, as investment into different technologies would be distributed in a different way on the investment goods producing sectors. In summary, the changed investment patterns foster structural change.
The changes in investments are closely related with the other key word: innovations. The innovation effects of high oil prices are based on the experience that technological change does not occur autonomously. Instead, the theory of induced innovation states that changing relative prices induce innovations, which result in the substitution of the production factor becoming relatively more expensive. Thus, an increased price for energy use not only gives a clear signal for the diffusion of efficient technologies, leading to an upward shift of the traditional diffusion curve. Furthermore, compared to a reference case without an energy price increase, there is an additional incentive for innovation even after the most efficient technology currently available has been installed. Thus, it is assumed that changing costs for energy use also lead to incentives for future inventions and innovations. However, the results from innovation research also point to other determinants of innovation. In the 1990’s, the system of innovation approach has gained wide acceptance. In addition to the demand and technology factors, this approach underlines the manifold aspects of the intra-firm determinants of innovation, the characteristics of innovation as an interactive approach, the role of institutions in shaping activities, the importance of the home (lead) market as a base for competitiveness on the international markets, and the regulatory framework (e.g. Carlsson et al., 2002; Edquist, 2005). The key notion of the systems of innovation approach is that these factors influence each other, highlighting the importance of feedback mechanisms. This results in an expansion of the influencing factors. As well as players estimating the profitability of innovations, increased significance is being attached to soft context factors such as, e. g. communication patterns between the participants, but also the regulatory pattern between policy and those governed (see e.g. Leone/Hemmelskamp, 2000; Kemp et al., 2000; Carlsson et al., 2002; Edquist, 2005). Thus, the extent an increase in oil prices can actually influence the generation of new innovations also depends on favourable system conditions.
In their review of the hypothesis of induced innovations, Thirtle/Rutan (1987) concluded that it can be inferred from existing statistical surveys that changing the relative factor prices does indeed have an impact on the pace of innovation. The more recent studies from Newell et al. (1999), Grupp (1999), Schleich (2001), Popp (2002), Schleich et al. (2003) and Lutz et al. (2005) suggest that increases in the relative energy prices have triggered energy-saving innovations. But the statistical significance of this correlation varies as does the magnitude of the influence of the energy prices. In addition, there is a large body of literature breaking down the changes in aggregate energy intensity into changes in the structure of the economy and changes at the level of sub-sectors (see e. g. Unander et al., 1999, Diekmann et al., 1999, Schipper et al., 2001, Liaskas et al., 2000). However, these studies tend to be purely descriptive, and no attempt is
HOP! research project Macro-economic impact of high oil price in Europe
D2 High Oil Prices: Scenarios assumptions and model interfaces 93
made to explore the determinants of the observed changes, such as price changes. Thus, there is a need for additional research, which combines both approaches, in order to come up with a more sound analysis on the size of influence of energy prices. Nevertheless, it is clear that increasing oil prices clearly have a positive effect on innovations which save energy or make it easier to substitute oil by other energy sources.
4.4.4.1 Competitive position of important players for the reaction to high oil prices
In the light of the above explained uncertainty about the exact magnitude of the innovation stimulus of high oil prices the following paragraphs provide a discussion of indicators that describe the competitive position of important players to generate innovations and provide investment goods that would be demanded in response to high oil prices. Such indicators would comprise a countries position on the world market or the number of patents it owns for e.g. energy saving technologies or non-fossil fuel energy technologies.
Besides price competitiveness, which is influenced by cost effects, foreign trade successes are also determined by quality competitiveness. Above all for technology-intensive goods, which include oil substituting technologies, high market shares depend on the innovation ability of a national economy and its early market presence. If there is a forced national strategy to reduce the use of oil, these countries tend to specialise early in the supply of the necessary goods. If there is a subsequent expansion of the international demand for these goods, these countries are then in a position to dominate international competition due to their early specialisation in this field, which is then called a first mover advantage (Blümle, 1994; Porter/van der Linde, 1995; Taistra, 2001).
Being able to realise these kinds of first mover advantages requires other countries to follow suit. Given the growing demand for energy on the one hand, and the pressure of high oil prices on the other, there is a high probability of this taking place e.g. for energy saving and alternative fuel technologies. For first mover advantages to be realised, however, the domestic suppliers of oil substituting technologies have to be competitive internationally so that they and not foreign suppliers meet the demand induced by the domestic pioneering role and so that they can actually profit from the demand in countries then following suit. Taking the globalisation of markets into account, this requires establishing competence clusters, which are difficult to transfer to other countries with lower production costs. These competence clusters must consist of high technological capabilities linked to a demand which is open to new innovations and horizontally and vertically integrated production structures. The following factors have to be taken into account when assessing the potential of countries to become a lead market in a specific technology (Walz, 2006):
• Lead market capability: It is not possible for every good or technology to establish a lead market position. One prerequisite is that competition is driven not by cost differentials alone, but also by quality aspects. This is especially valid for knowledge-intensive goods. In general, the technology intensity of energy related technologies can be judged as being above average or even (e.g. photovoltaics) high tech. Other important factors are intensive user-producer relationships and a high level of implicit knowledge. These factors are not easily
HOP! research project Macro-economic impact of high oil price in Europe
D2 High Oil Prices: Scenarios assumptions and model interfaces 94
accessible, difficult to transfer to other countries and benefit from local clustering (Kline/Rosenberg, 1986, Lundvall/Johnson, 1994, Asheim/Gertler, 2005). Two other important characteristics are high innovation dynamics and high potential learning effects. They are the key to a country forging ahead technologically also being able to realize solutions which are cost competitive.
• Competitiveness of industry clusters: Learning effects are more easily realized if the flow of (tacit) knowledge is facilitated by proximity and a common knowledge of language and institutions. The results of Fagerberg (1995b) can be explained in this way. He found strong empirical evidence that the international competitiveness of sectors and technologies is greatly influenced by the competitiveness of interlinked sectors. By and large, energy related technologies have very close links to electronics and machinery. Thus, it can be argued that countries with strong production clusters in these two fields have a particularly good starting point for developing a first mover advantage.
There are various market factors which influence the chances of a country developing a lead market position (Beise, 2004). In general, a demand which is oriented towards innovations and readily supports new technological solutions benefits a country in developing a lead market position. Another factor is a market structure which facilitates competition. The price advantage of countries is very important which benefits countries increasing their demand fastest and thus are most able to realize economies of scale and learning.
In addition to technological and market conditions, a lead market situation must also be supported by innovation-friendly regulation. This is especially true for sustainability innovations in infrastructure fields such as energy, water or transportation. In these fields, the innovation friendliness of the general regulatory regime, e.g. with regard to IPR or the supply of venture capital, must be accompanied by innovation-friendly sectoral and environmental regulation resulting in a triple regulatory challenge. There is a lot of additional research necessary to develop a clear methodology on how to analyse the innovation friendliness of regulation. One promising approach is a heterodox one which uses the sectoral systems of innovation approach as guiding heuristics and combines this with the outcome of regulatory and environmental economics and the policy analysis approach of political science (see Walz, 2007 and Walz et al., 2007).
Since the Leontief Paradox and subsequent theories such as the Technology Gap Theory or the Product Cycle Theory, it has become increasingly accepted that international trade performance depends on technological capabilities (Posner, 1961; Vernon, 1966; Fagerberg, 1994; Wakelin, 1997; Archibugi/Michie, 1998). This has been supported by recent empirical research, which underlines the importance of technological capabilities for trade patterns and success (Wakelin, 1997; Fagerberg, 1995a; Fagerberg/Godinho, 2005; Blind/Frietsch, 2005). Thus, the ability of a country to develop a first mover advantage also depends on its comparative technological capability. If one country has performed better in the past with regard to international trade than others, it has obtained key advantages on which it can build future success. Thus, trade indicators such as shares of world trade or the Revealed Comparative Advantage (RCA) are widely used to compare the technological capability of countries. Furthermore, a country has an additional advantage in developing future technologies if it has a comparatively high knowledge base.
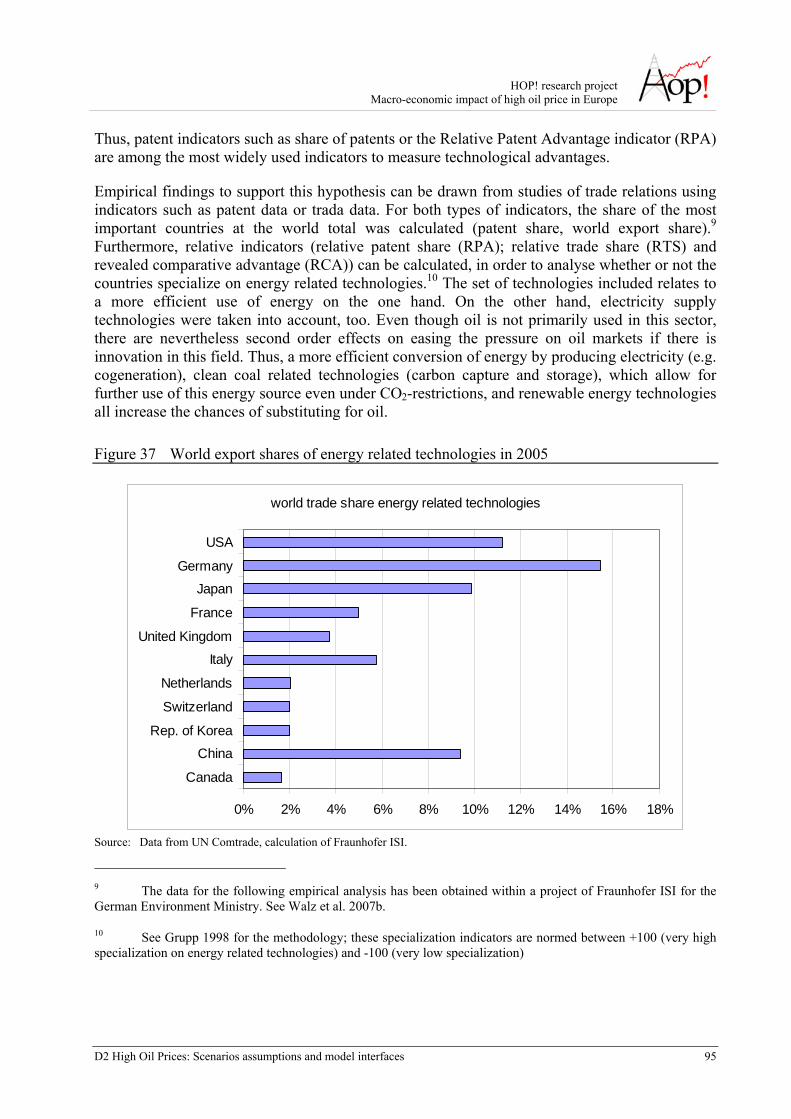
HOP! research project Macro-economic impact of high oil price in Europe
D2 High Oil Prices: Scenarios assumptions and model interfaces 95
Thus, patent indicators such as share of patents or the Relative Patent Advantage indicator (RPA) are among the most widely used indicators to measure technological advantages.
Empirical findings to support this hypothesis can be drawn from studies of trade relations using indicators such as patent data or trada data. For both types of indicators, the share of the most important countries at the world total was calculated (patent share, world export share).9 Furthermore, relative indicators (relative patent share (RPA); relative trade share (RTS) and revealed comparative advantage (RCA)) can be calculated, in order to analyse whether or not the countries specialize on energy related technologies.10 The set of technologies included relates to a more efficient use of energy on the one hand. On the other hand, electricity supply technologies were taken into account, too. Even though oil is not primarily used in this sector, there are nevertheless second order effects on easing the pressure on oil markets if there is innovation in this field. Thus, a more efficient conversion of energy by producing electricity (e.g. cogeneration), clean coal related technologies (carbon capture and storage), which allow for further use of this energy source even under CO2-restrictions, and renewable energy technologies all increase the chances of substituting for oil.
Figure 37 World export shares of energy related technologies in 2005
world trade share energy related technologies
0% 2% 4% 6% 8% 10% 12% 14% 16% 18%
Canada
ChinaRep. of Korea
Switzerland
Netherlands
Italy
United Kingdom
France
JapanGermany
USA
Source: Data from UN Comtrade, calculation of Fraunhofer ISI.
9 The data for the following empirical analysis has been obtained within a project of Fraunhofer ISI for the German Environment Ministry. See Walz et al. 2007b.
10 See Grupp 1998 for the methodology; these specialization indicators are normed between +100 (very high specialization on energy related technologies) and -100 (very low specialization)
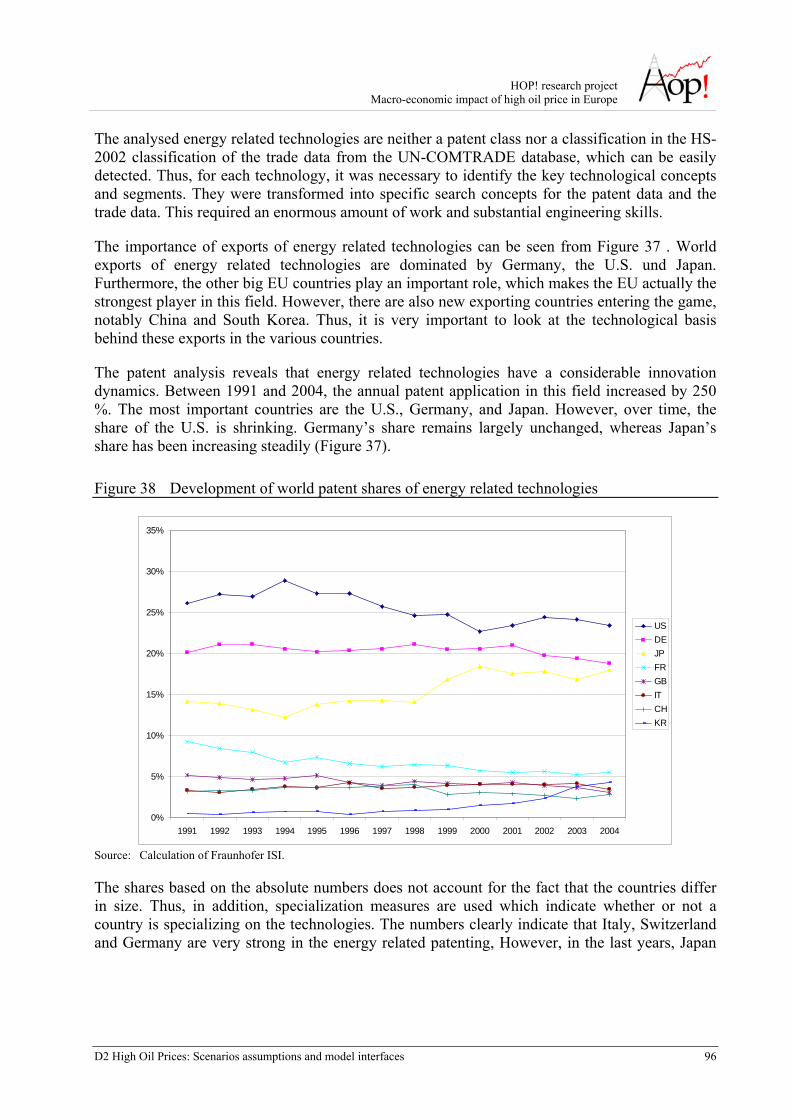
HOP! research project Macro-economic impact of high oil price in Europe
D2 High Oil Prices: Scenarios assumptions and model interfaces 96
The analysed energy related technologies are neither a patent class nor a classification in the HS-2002 classification of the trade data from the UN-COMTRADE database, which can be easily detected. Thus, for each technology, it was necessary to identify the key technological concepts and segments. They were transformed into specific search concepts for the patent data and the trade data. This required an enormous amount of work and substantial engineering skills.
The importance of exports of energy related technologies can be seen from Figure 37 . World exports of energy related technologies are dominated by Germany, the U.S. und Japan. Furthermore, the other big EU countries play an important role, which makes the EU actually the strongest player in this field. However, there are also new exporting countries entering the game, notably China and South Korea. Thus, it is very important to look at the technological basis behind these exports in the various countries.
The patent analysis reveals that energy related technologies have a considerable innovation dynamics. Between 1991 and 2004, the annual patent application in this field increased by 250 %. The most important countries are the U.S., Germany, and Japan. However, over time, the share of the U.S. is shrinking. Germany’s share remains largely unchanged, whereas Japan’s share has been increasing steadily (Figure 37).
Figure 38 Development of world patent shares of energy related technologies
0%
5%
10%
15%
20%
25%
30%
35%
1991 1992 1993 1994 1995 1996 1997 1998 1999 2000 2001 2002 2003 2004
USDEJPFRGBITCHKR
Source: Calculation of Fraunhofer ISI.
The shares based on the absolute numbers does not account for the fact that the countries differ in size. Thus, in addition, specialization measures are used which indicate whether or not a country is specializing on the technologies. The numbers clearly indicate that Italy, Switzerland and Germany are very strong in the energy related patenting, However, in the last years, Japan
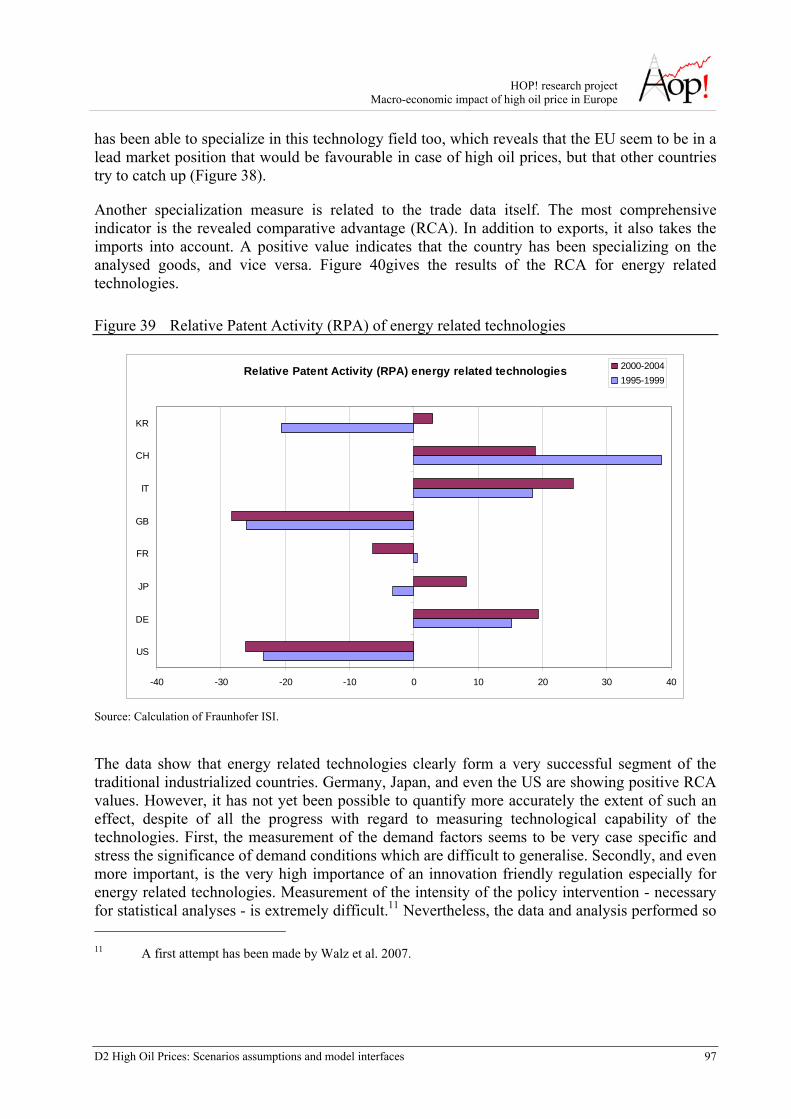
HOP! research project Macro-economic impact of high oil price in Europe
D2 High Oil Prices: Scenarios assumptions and model interfaces 97
has been able to specialize in this technology field too, which reveals that the EU seem to be in a lead market position that would be favourable in case of high oil prices, but that other countries try to catch up (Figure 38).
Another specialization measure is related to the trade data itself. The most comprehensive indicator is the revealed comparative advantage (RCA). In addition to exports, it also takes the imports into account. A positive value indicates that the country has been specializing on the analysed goods, and vice versa. Figure 40gives the results of the RCA for energy related technologies.
Figure 39 Relative Patent Activity (RPA) of energy related technologies
Relative Patent Activity (RPA) energy related technologies
-40 -30 -20 -10 0 10 20 30 40
US
DE
JP
FR
GB
IT
CH
KR
2000-20041995-1999
Source: Calculation of Fraunhofer ISI.
The data show that energy related technologies clearly form a very successful segment of the traditional industrialized countries. Germany, Japan, and even the US are showing positive RCA values. However, it has not yet been possible to quantify more accurately the extent of such an effect, despite of all the progress with regard to measuring technological capability of the technologies. First, the measurement of the demand factors seems to be very case specific and stress the significance of demand conditions which are difficult to generalise. Secondly, and even more important, is the very high importance of an innovation friendly regulation especially for energy related technologies. Measurement of the intensity of the policy intervention - necessary for statistical analyses - is extremely difficult.11 Nevertheless, the data and analysis performed so 11 A first attempt has been made by Walz et al. 2007.
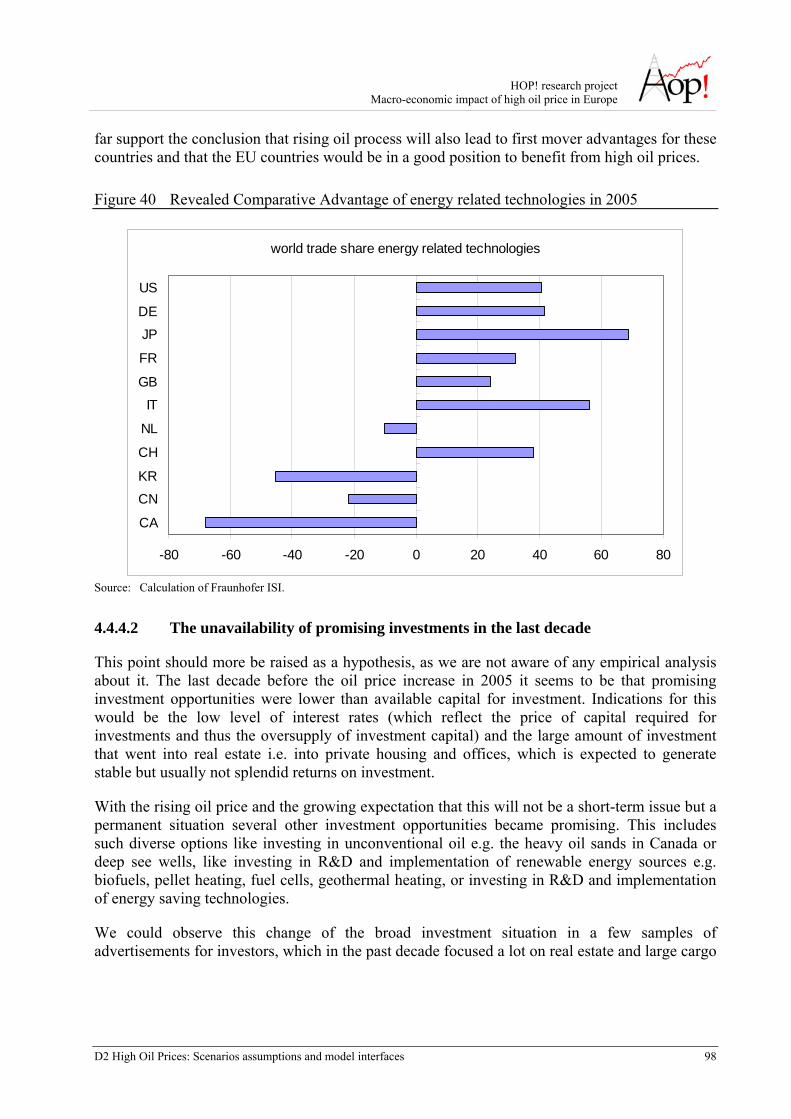
HOP! research project Macro-economic impact of high oil price in Europe
D2 High Oil Prices: Scenarios assumptions and model interfaces 98
far support the conclusion that rising oil process will also lead to first mover advantages for these countries and that the EU countries would be in a good position to benefit from high oil prices.
Figure 40 Revealed Comparative Advantage of energy related technologies in 2005
world trade share energy related technologies
-80 -60 -40 -20 0 20 40 60 80
CA
CNKR
CH
NL
IT
GB
FR
JPDE
US
Source: Calculation of Fraunhofer ISI.
4.4.4.2 The unavailability of promising investments in the last decade
This point should more be raised as a hypothesis, as we are not aware of any empirical analysis about it. The last decade before the oil price increase in 2005 it seems to be that promising investment opportunities were lower than available capital for investment. Indications for this would be the low level of interest rates (which reflect the price of capital required for investments and thus the oversupply of investment capital) and the large amount of investment that went into real estate i.e. into private housing and offices, which is expected to generate stable but usually not splendid returns on investment.
With the rising oil price and the growing expectation that this will not be a short-term issue but a permanent situation several other investment opportunities became promising. This includes such diverse options like investing in unconventional oil e.g. the heavy oil sands in Canada or deep see wells, like investing in R&D and implementation of renewable energy sources e.g. biofuels, pellet heating, fuel cells, geothermal heating, or investing in R&D and implementation of energy saving technologies.
We could observe this change of the broad investment situation in a few samples of advertisements for investors, which in the past decade focused a lot on real estate and large cargo
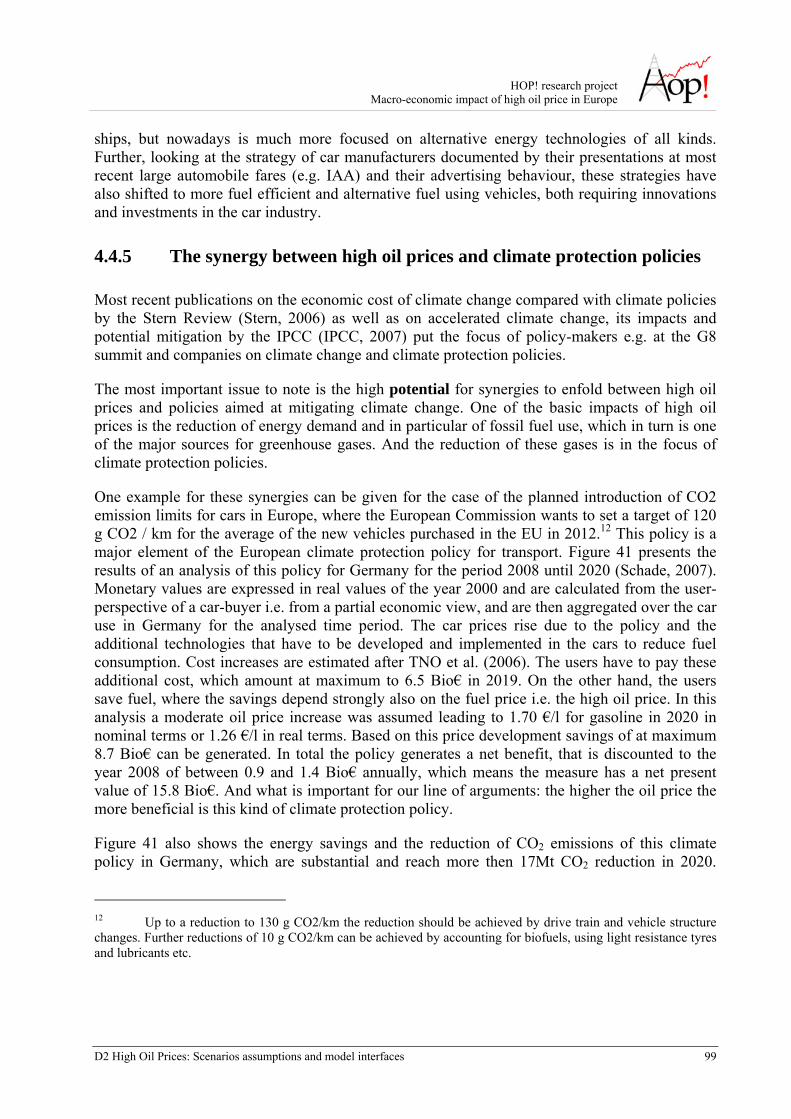
HOP! research project Macro-economic impact of high oil price in Europe
D2 High Oil Prices: Scenarios assumptions and model interfaces 99
ships, but nowadays is much more focused on alternative energy technologies of all kinds. Further, looking at the strategy of car manufacturers documented by their presentations at most recent large automobile fares (e.g. IAA) and their advertising behaviour, these strategies have also shifted to more fuel efficient and alternative fuel using vehicles, both requiring innovations and investments in the car industry.
4.4.5 The synergy between high oil prices and climate protection policies
Most recent publications on the economic cost of climate change compared with climate policies by the Stern Review (Stern, 2006) as well as on accelerated climate change, its impacts and potential mitigation by the IPCC (IPCC, 2007) put the focus of policy-makers e.g. at the G8 summit and companies on climate change and climate protection policies.
The most important issue to note is the high potential for synergies to enfold between high oil prices and policies aimed at mitigating climate change. One of the basic impacts of high oil prices is the reduction of energy demand and in particular of fossil fuel use, which in turn is one of the major sources for greenhouse gases. And the reduction of these gases is in the focus of climate protection policies.
One example for these synergies can be given for the case of the planned introduction of CO2 emission limits for cars in Europe, where the European Commission wants to set a target of 120 g CO2 / km for the average of the new vehicles purchased in the EU in 2012.12 This policy is a major element of the European climate protection policy for transport. Figure 41 presents the results of an analysis of this policy for Germany for the period 2008 until 2020 (Schade, 2007). Monetary values are expressed in real values of the year 2000 and are calculated from the user-perspective of a car-buyer i.e. from a partial economic view, and are then aggregated over the car use in Germany for the analysed time period. The car prices rise due to the policy and the additional technologies that have to be developed and implemented in the cars to reduce fuel consumption. Cost increases are estimated after TNO et al. (2006). The users have to pay these additional cost, which amount at maximum to 6.5 Bio€ in 2019. On the other hand, the users save fuel, where the savings depend strongly also on the fuel price i.e. the high oil price. In this analysis a moderate oil price increase was assumed leading to 1.70 €/l for gasoline in 2020 in nominal terms or 1.26 €/l in real terms. Based on this price development savings of at maximum 8.7 Bio€ can be generated. In total the policy generates a net benefit, that is discounted to the year 2008 of between 0.9 and 1.4 Bio€ annually, which means the measure has a net present value of 15.8 Bio€. And what is important for our line of arguments: the higher the oil price the more beneficial is this kind of climate protection policy.
Figure 41 also shows the energy savings and the reduction of CO2 emissions of this climate policy in Germany, which are substantial and reach more then 17Mt CO2 reduction in 2020.
12 Up to a reduction to 130 g CO2/km the reduction should be achieved by drive train and vehicle structure changes. Further reductions of 10 g CO2/km can be achieved by accounting for biofuels, using light resistance tyres and lubricants etc.
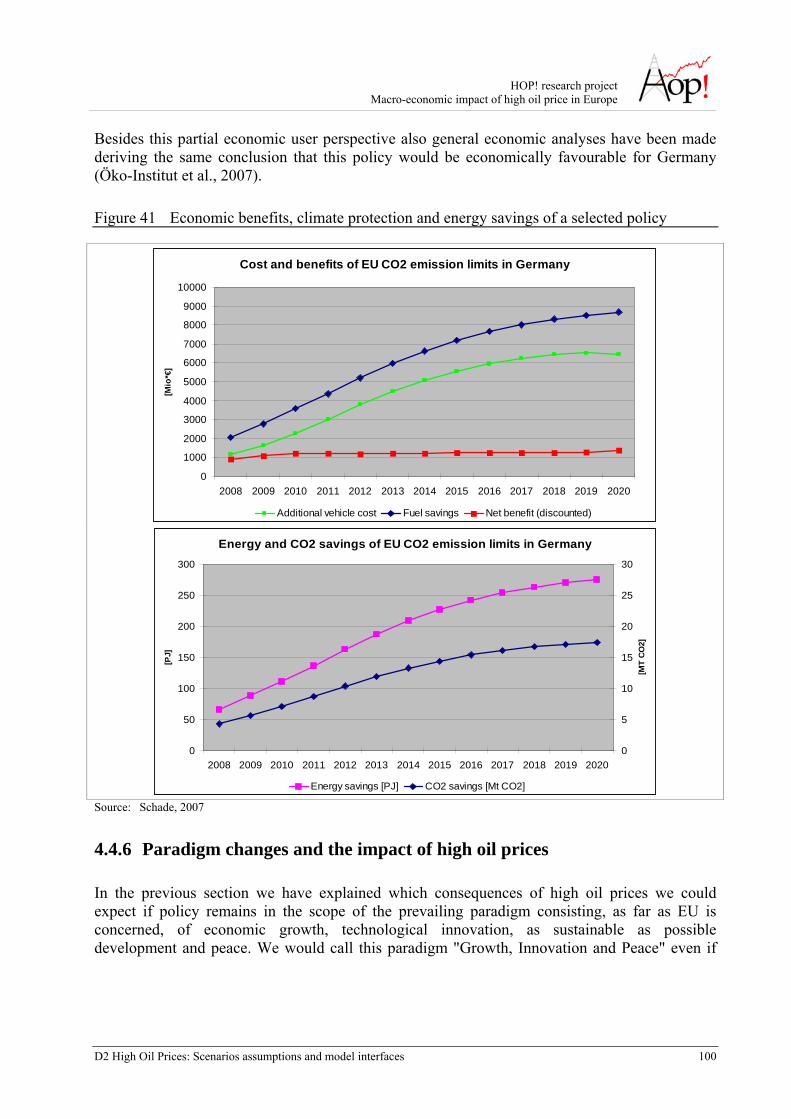
HOP! research project Macro-economic impact of high oil price in Europe
D2 High Oil Prices: Scenarios assumptions and model interfaces 100
Besides this partial economic user perspective also general economic analyses have been made deriving the same conclusion that this policy would be economically favourable for Germany (Öko-Institut et al., 2007).
Figure 41 Economic benefits, climate protection and energy savings of a selected policy
Cost and benefits of EU CO2 emission limits in Germany
0
1000
2000
3000
4000
5000
6000
7000
8000
9000
10000
2008 2009 2010 2011 2012 2013 2014 2015 2016 2017 2018 2019 2020
[Mio
*€]
Additional vehicle cost Fuel savings Net benefit (discounted) Energy and CO2 savings of EU CO2 emission limits in Germany
0
50
100
150
200
250
300
2008 2009 2010 2011 2012 2013 2014 2015 2016 2017 2018 2019 2020
[PJ]
0
5
10
15
20
25
30
[MT
CO2]
Energy savings [PJ] CO2 savings [Mt CO2] Source: Schade, 2007
4.4.6 Paradigm changes and the impact of high oil prices
In the previous section we have explained which consequences of high oil prices we could expect if policy remains in the scope of the prevailing paradigm consisting, as far as EU is concerned, of economic growth, technological innovation, as sustainable as possible development and peace. We would call this paradigm "Growth, Innovation and Peace" even if
HOP! research project Macro-economic impact of high oil price in Europe
D2 High Oil Prices: Scenarios assumptions and model interfaces 101
we are aware that at the world scale the definition is quite optimistic as a worldwide sustainable development (socially end environmentally) is actually not there and several regions experiences wars (most of which are related to control of economic resources). We would like to point out that starting from this relatively positive conditions, alternative developments could become reality, if we foresee changes of the political paradigm of European and Global policy-making. Such paradigms would be "Sufficiency and Fairness" and "Egoism and Resource Wars".
4.4.6.1 The paradigm of "Sufficiency and Fairness"
The difference in this paradigm would be to abandon the philosophy of "more is better" i.e. more GDP is better, more monetary income is better, more energy use is better, more tkm or pkm are better. This paradigm at least partially reflects the idea proposed, among others by Latouche (2006). Of course, if we accept a stagnating GDP and continue the improvement of energy intensity as in the "Growth, Innovation and Peace" paradigm, we could reduce energy use faster and hence would become faster less dependent from fossil fuel imports, which in turn would lead to less impacts of high oil prices.
But with stagnating GDP would we be able to finance the same amount of investments into energy efficiency and alternative energy technologies? This has to be doubted, because without growth we would have to take away national income from other purposes of use and redirect it to investments in these technologies. Within a capitalist market economy this objective is very ambitious and require a strong policy will as well as innovative policy tools. From this point of view this paradigm seems only to be a very long-term option, after we have transformed the energy system into a purely renewable based energy system and converting all energy using facilities (e.g. buildings, machinery) and appliances (e.g. heating, washing machines, cars) into highly energy efficient products.
The second issue behind the plea for economic growth is related to the issue of distribution and fairness. In theory gains from economic growth should be rather distributed to less well-off income groups then to the better off to increase the fairness of national (or world) income distribution and by that reduce the risks of societal conflicts emerging from an uneven income distribution. Such gains are easier to direct to specific person groups, because no income has to be taken away from any other person group as this is newly generated income. However, even if income distribution is often a pre-condition of economic growth, in a society with a stagnating economy it is commonly perceived that imbalanced income distribution could only be adapted by taking income from one person group and giving it to other person groups. Given that income inequality within countries has risen significantly under the dominating economic vision, this new paradigm of fair(er) (not equal) distribution requires a significant change of policy-making and societal objectives.
There are further issues related to this paradigm, some of which are already emerging in the political debate. With stagnating GDP and continued growth of labour productivity, we would reduce employment continuously, such that either work would have to be distributed differently (i.e. average working time of each employee would be reduced) or more people would receive
HOP! research project Macro-economic impact of high oil price in Europe
D2 High Oil Prices: Scenarios assumptions and model interfaces 102
their income from basic public transfers (like suggested in Germany with the Bürgergeld or Grundeinkommen).
Overall, we would expect that this paradigm has some potential to become reality in the very long-term, but that for the years to come it would be quite unrealistic as, within the dominating economic an politics framework, it does not bear the potential to fund the innovations and investments required to shift the energy and transport system towards a highly efficient non-oil dependent system.
4.4.6.2 The paradigm of "Egoism and Resource Wars"
In the "Sufficiency and Fairness" paradigm the world would strongly strengthen the forms of collaboration to solve world level problems like climate change and the mitigation of impacts of high oil prices by concerted actions of the global players. Instead, in an alternative paradigm the choice could be to strengthen the existing egoistic behaviours. Global players like China, Russia or the US instead of investing in efficiency and alternative energy technologies would "invest" more than today in wars or at least in installing governments in oil (and other) resource rich countries to increase their resource base on the expense of other countries. Embittering and extending conflicts would for an intermediate period keep their resource base on a level, which might dampen the price increase of oil in their countries, and which reduces the need for innovation and increase of energy efficiency. In the long-term, the outcome of such a policy should be an economy with less innovations and lower productivity growth than for instance compared with the "Growth, Innovation and Peace" paradigm.
However, the most severe impacts of this policy would, if as we expect the global players would not attack each other, be the attacked countries because of their destroyed countries and society and those countries that would not participate in one of the successful blocks, because for them the oil prices would be even higher then in the other cases, because a larger share of the available oil goes into the successful blocks.
The potential for such resource wars not only about oil, but also about fresh water resources and due to climate change impacts also about mitigation of climate impacts e.g. by migration of population has recently been acknowledged by a number of studies. In particular, the risk of violent conflicts due to climate change has been raised in a number of most recent studies (WBGU, 2007, Campbell et al., 2007, Smith/Vivekananda, 2007). It seems that high oil prices will engrave the risk of conflicts in the instable countries mentioned in the reports as it reduces the options to mitigate climate change (e.g. in the case of water shortages pumping groundwater with diesel generators could become unaffordable for the people) and to develop the countries.
Nevertheless, we would argue that a shift to this paradigm is not very probable because the results would be too disastrous on global level, though one has to admit that first steps in this direction have been made in the last decade. But the unsuccessfulness of these steps suggests that they would not be repeated (despite the growing tensions between the US and the Iran). Of course, it requires that global players decide to improve fairly cooperation in the international fora (G8, UN) and that in particular the EU plays a strong role in mitigating conflicts as it is a
HOP! research project Macro-economic impact of high oil price in Europe
D2 High Oil Prices: Scenarios assumptions and model interfaces 103
body with successful experience of solving conflicts peaceful and with very low military interests.
4.4.6.3 Ranking of outcomes of the three paradigms
The brief analysis of the paradigms should be completed by a ranking of outcomes of the paradigms. For the ranking we distinguish the paradigm of "Growth, Innovation and Peace" into the traditional view, which would be "Slow Growth and Peace", and the alternative view which would be "Growth, Innovation and Peace". For the latter we expect both the best outcome, which is a qualitative judgement (i.e. not based on any modelling) considering economic growth, climate change and the risk of conflicts and also the highest probability. On the other hand, the second highest probability we would assume for "Egoism and War" becoming the new paradigm in the light of oil and energy scarcity, accompanied by high oil prices. However, for this paradigm we would clearly expect the most negative outcome on world level in terms of growth and sustainability as millions of people will suffer from war as well as from climate change, because with a climate of war concerted actions to combat climate change would not be feasible. The probability for this paradigm is expected to be significant, because a pretty one-dimensional view on keeping oil prices low and accepting war as a means of policy-making fosters the shift towards this paradigm.
Table 8 Ranking of outcomes and probabilities of the paradigms
Outcome Probability
EU World
Growth, Innovation and Peace Growth, Innovation and Peace Growth, Innovation and Peace Sufficiency and Fairness Slow Growth and Peace Egoism and War Slow Growth and Peace Sufficiency and Fairness Slow Growth and Peace Egoism and War Egoism and War Sufficiency and Fairness
4.4.7 Potential to model the different impacts in HOP!
This sections intends to given an overview on the potential impacts of high oil prices with a focus on impacts that can actually be modelled and considered by the applied models. The impacts are then differentiated into those that are endogenously implemented in the models, those that are taken exogenously into account and a number of further impacts, of which their relevance is not straightforward and has to be analysed first. If the analysis would reveal their relevance it will be taken into account to include them into the models.
Endogenously modelled impacts:
• Cost effects => direct impacts (see Figure 35).
HOP! research project Macro-economic impact of high oil price in Europe
D2 High Oil Prices: Scenarios assumptions and model interfaces 104
• Demand effects => direct impacts in energy and transport sector.
• Reduced budget for non-energy purposes => indirect impact on other sectors.
• Demand effects on (additional) investments => indirect impacts on other sectors.
• Impacts of investments on total factor productivity => indirect impact on total economy.
• Changes of trade flows of energy sources => indirect impact on trade balance.
• Changes of fuel tax revenues => indirect impact on government budget.
Exogenously considered impacts:
• High oil prices trigger trade with oil exporting countries i.e. exports from the EU to those countries => impact on trade flows.
• Patent analysis as an "early"-indicator of future competitive advantage => impact on trade flows.
• Policy induced investments => impact on final demand of sectors producing investment goods and services (R&D).
Further potential impacts:
• Effect on productivity through process innovation.
• Possibility of radical structural change.
• Competitive advantage of countries in terms of dependency on fossil energy carriers.
• Fossil fuels are traded in $. What is the impact when they would be trade in €.
4.4.8 Preliminary Conclusions on Economic Impacts of High Oil Prices
This overview should prepare the ground for the later on model-based analysis of economic impacts of the high oil prices in HOP! In that sense, these conclusions should be treated as preliminary and besides proving these preliminary conclusions either additional results could emerge from the models or the conclusions might not be confirmed.
Nevertheless, it is relevant to summarize a few major points of the previous analyses:
• The present oil price increase differs significantly from past oil crises of the 1970ies and 1980ies. In the past a supply shock met with a weak economic situation generated the negative outcome. Today we have a demand shock together with an economically prosperous phase.
HOP! research project Macro-economic impact of high oil price in Europe
D2 High Oil Prices: Scenarios assumptions and model interfaces 105
• Hence, analyses of today's situation fall short when they only consider the inflationary pressure and the changed terms of trade to foresee negative economic impacts of the high oil prices.
• The key influence on the economic impacts of high oil prices comes from potential innovations and stimulated investments of the European countries. In particular, in the fields of alternative energies and energy efficiency the EU disposes of a competitive advantage that could make it a lead market for oil substituting technologies stimulating EU investments and EU exports to the world market.
• The strong commitment of the EU to climate protection policies and the high oil prices could enfold substantial synergies stimulating the economic performance of the EU.
• Overall, for Europe as a whole we would rather expect a positive economic stimulus from the high oil prices then a negative one. This does not exclude, that for some countries the impact could be on the negative side.
HOP! research project Macro-economic impact of high oil price in Europe
D2 High Oil Prices: Scenarios assumptions and model interfaces 106
5 Conclusions
This deliverable introduces the outcomes of the WP2 whose objective was to define scenarios, to develop the model interfaces and to investigate the relationships between high-energy prices and consequences on economic variables.
The HOP! project baseline scenario has been defined to serve as a reference for the comparison with scenarios assuming high oil prices. The baseline scenario includes primarily assumptions about the level of conventional oil resources (the USGS 2000 estimates are used) as well as assumptions concerning the availability of unconventional oil and alternative fuels. Additionally, several other assumptions concerning determinants of transport demand (population and economic growth, transport demand etc.) are made, leading to the conclusion that given the foreseen trends, primary energy consumption in Europe is expected to increase with around 40% between 2000 and 2050
Some of the assumptions are uncertain and this causes also some uncertainty on the derived variables. The highest uncertainty occurs due to the unknown amount of oil resources. The geo-politics of the international energy markets are a vital consideration for sound long-term energy projections. Political or other conflicts might lead to disruptions in oil supply, which is not taken into consideration. Also technology development will be critical in shaping the future energy system. The current objective in the exploitation of unconventional oil is to develop technologies, which would reduce the costs of production, but uncertainty on the development of the necessary technology and the expected drop of production cost remains.
The uncertainty about oil reserves and the availability of alternative energy sources and/or of more efficient energy users are the main dimensions on which the alternative HOP! scenarios are built. For different levels of scarcity in conventional and/or unconventional oil resources, scenarios are developed that differ in the extent to which alternative transport fuels and/or energy efficiency measures are implemented. Furthermore, scenarios that do not introduce any dedicated action are analysed. As result we generate a set of HOP! scenarios which differs in energy supply/demand as well as in the oil price. To estimate the economic impacts scenarios with soaring oil prices reaching or even exceeding a level 200 US$ could be produced as an extreme case. Before the HOP! models are applied to simulate the scenarios, a preliminary overview of impacts of the high oil prices can be made based on existing evidence and expected reactions on the demand and supply side.
Within the energy system a high oil price would have an impact on technology and research for new oil fields as well as it would have an impact on potential substitutes. Investments would be necessary to develop new technologies for the research of new oil fields or the production of alternative fuels. A direct effect of high oil price on the transport system would be an increase of the transport cost. The rise in transport costs will differ among transport modes, which results in a change of the modal split. Further changes can be foreseen in the composition of the vehicle fleet and an improvement of energy efficiency and, linked to these, the investment patterns. High oil prices affect also the production costs in an economy as oil is used as input in many industrial
HOP! research project Macro-economic impact of high oil price in Europe
D2 High Oil Prices: Scenarios assumptions and model interfaces 107
processes. This implies changes in productivity and GDP. Trade patterns will change according to the availability and the production of oil of the oil supplying countries.
It should be stressed that the changes taking place in one system affects the other system as well. If alternative transport fuels enter the market to a large extent the composition of the vehicle fleet and the transport costs of different transport modes are affected, too. Then, the increase of transport costs have an impact on the production costs and, hence, on GDP. Finally, if GDP, investment and trade change, energy demand and transport demand will change as well.
The final outcome of high oil prices is therefore not readily foreseeable in advance, as indirect effects and feedbacks can reverse the direction of the primary impacts. In particular, the overall impact of high oil prices in the economy is not necessarily negative as it is generally supposed. Positive impacts can arise from the changes of the terms of trade and from investments (e.g. in energy technologies). Investments into alternative energy technologies as well as in energy efficiency might compensate or even overcompensate the negative side of impacts of high oil prices. Also, climate policy and high oil prices could benefit from synergies as both have the same consequences i.e. to reduce the use of fossil fuels.
Investment in innovative technologies therefore seems a robust way for limiting the impact of high oil prices on society. Some risks would still remain, however. For instance, starting too early with the investment in alternatives would become very costly and could favour the use of premature technologies, while mitigating too late, oil prices would become extremely high and have severe consequences for the economy. From a more general point of view, positive compensating mechanisms could not emerge in case of a shift from the current paradigm towards a paradigm that we would call "Egoism and War" would occur. If leading world powers would decide to increase their resource base in particular of oil, but eventually also of other scarce energy resources and metals, by war instead of by co-operation and technology development, the direct negative impacts of high oil prices could be not overcome and could be even worsened.
In summary, the expected impacts on the energy system, the transport system and the economy are of different nature. For some of them it is quite easy to identify whether they drive towards e.g. a lower demand or a mode shift, etc. In other cases, feed-back effects can invert the direction of the primary impact or more impacts co-exist and it is difficult to identify which one would have the major influence. So, it is difficult to make more specific forecasts without the help of some quantitative tool. The ASTRA model in combination with POLES is expected to serve as modelling instrument. Given the features of the model, not all the impacts introduced can be simulated with the same level of detail and/or in a full endogenous way. However, they provide the capability to compare the designed baseline and the HOP! scenarios in order to perform a quantitative assessment of the impacts of high oil price on the energy system, the transport system and the economy.
HOP! research project Macro-economic impact of high oil price in Europe
D2 High Oil Prices: Scenarios assumptions and model interfaces 108
References ACI – Automobile Club Italia (2006), Costi chilometrici di esercizio di alcuni tipi di autovetture, autofurgoni e motoveicoli, Automobile Club d’Italia, Roma.
ADAM (2007): ADaptation And Mitigation Strategies. http://www.adamproject.eu/, Nov. 2007
Air Transport Association(2006): http://www.airlines.org/.
Archibugi, D.; Michie, J. (1998): Technical Change, Growth, and Trade: New Departes in Institutional Economics, in: Journal of Economic Surveys, Vol. 12, No.3, pp. 313-332.
Arnold, S.; Hunt, A.; Markandya, A. (2007): National and EU level estimates of energy supply externalities. Deliverable D5.1 of CASES project (Cost Assessment of Sustainable Energy Systems) funded by the European Commission.
Asheim, B.; Gertler, M. S. (2005): The Geography of Innovation: Regional Innovation Systems, in: Fagerberg, J. et al (eds.): The Oxford Handbook of Innovation, Oxford University Press, Oxford, pp. 291-317.
Beise, M. (2004): Lead markets: country specific drivers of the global diffusion of innovations, in: Research Policy, Vol. 33, S. 997-1028.
Blind, K.; Frietsch, R. (2005): Integration verschiedener Technologieindikatoren. Studien zum deutschen Innovationssystem Nr. 21-2005, BMBF, Berlin.
Blümle, G. (1994): The Importance of Environmental Policy for International Com¬petitiveness, in: Matsugi, T; Oberhauser, A. (eds.): Interactions between Economy and Ecology, Berlin, 35-57.
BP (2007): Financial and Operating Information 2002-2006. http://www.bp.com/, Oct. 2007.
Campbell, K.; Gulledge, J.; McNeill, J.; Podesta, J.; Ogden, P.; Fuerth, L.; Woolsey, R.; Lennon, A.; Smith, J.; Weitz, R.; Mix, D. (2007): The Age of Consequences: The Foreign Policy and National Security Implications of Global Climate Change.
Carlsson, B.; Jacobsson, S.; Holmen, M.; Rickne, A. (2002): Innovation systems: analytical and methodological issues, Research Policy 31, 233-245.
Cascade Mints (2007): Trade-offs and synergies in a world moving towards a more sustainable energy system. Policy brief in the CASCADE MINTS project funded by the European Commission.
Cicini, P.; Macchia, G.; Giuseppetti, A. (2005), Progetti ferroviari: dall’analisi finanziaria all’analisi economica, Argomenti, Year 3, No. 5, 6-37, RFI, Roma.
HOP! research project Macro-economic impact of high oil price in Europe
D2 High Oil Prices: Scenarios assumptions and model interfaces 109
COMPETE (2006): Analysis of the contribution of transport policies to the competitiveness of the EU economy and comparison with the United States, Final Report. 2006
Diekmann, J.; Eichhammer, W.; Neubert, A., Rieke, H.; Schlomann, B.; Ziesing, H.-J. (1999): Energie-Effizienz-Indikatoren. Statistische Grundlagen, theoretische Fundierung und Orientierungsbasis für die politische Praxis. Physica, Heidelberg (short version available in english: http://www.eu.fhg.de/EEI/index.htm).
Earchimede (2004): Benchmark europeo e linee guida per lo sviluppo del TPL italiano, presented at conference La resa dei conti, Roma (Italy).
Edquist, Ch. (2005): Systems of Innovation: Perspectives and Challenges, in: Fagerberg, J.; Mowery, D. and Nelson, R.R. (eds.): The Oxford Handbook of Innovation, Oxford University Press, Oxford, pp. 181-208.
Eurostat (2003): Energy and Transport in Figures, 2003.
Eurostat (2006): Energy and Transport in Figures, 2006.
Exxon (2007): Financial and operating review. http://ir.exxonmobil.com, Oct. 2007.
Fagerberg, J. (1994); Technology and International Differences in Growth Rates, in: Journal of Economic Literature, Vol. XXXII (Sept. 1994), pp. 1147-1175.
Fagerberg, J. (1995a): Technology and Competitiveness. Oxford Review of Economic Policy 12, No.3, pp. 39-51.
Fagerberg, J. (1995b): User-producer interaction, learning, and competitive advantage. Cambridge Journal of Economics 19, pp. 243-256.
Fagerberg, J.; Godinho, M. M. (2005): Innovation and Catching-up, in: Fagerberg, J. et al (eds.): The Oxford Handbook of Innovation, Oxford University Press, Oxford, pp. 514-542.
Fenton, D., (2004): The Economic Impact of High Oil Prices. RBS Royal Bank of Scotland, Edinburgh.
Grupp, H. (1999): Umweltfreundliche Innovation durch Preissignale oder Regulation? Eine empirische Analyse für Deutschland, Jahrbücher für Nationalökonomie und Statistik 219, 611-631
Grupp. H. (1998): Foundations of the Economics of Innovation: theory, measurement, and practice, Edward Elgar, Cheltenham.
Hansen, A.C. (2007): The international oil price and hydrogen competitiveness. Roskilde University, Roskilde.
HOP! research project Macro-economic impact of high oil price in Europe
D2 High Oil Prices: Scenarios assumptions and model interfaces 110
Hirsch, R.; Bezdek, R.; Wendling, R.; (2005): Peaking of world oil production: impacts, mitigation & risk management. Study on behalf of an US government agency.
Hunt, B.; Hard, P.; Laxton, D. (2001): The Macroeconomic Effects of Higher Oil Prices. IMF Working Paper, International Monetary Fund.
IEA (2004): Analysis of the Impact of High Oil Prices on the Global Economy. International Energy Agency, Paris.
IEA (2005): Resources to Reserves. Oil & Gas Technologies for the Energy Markets of the FutureInternational Energy Agency (IEA), Paris.
IEA (2006): World Energy Outlook (WEO) 2006. International Energy Agency (IEA), Paris.
IEA (2007): Medium-Term. Oil Market Report. International Energy Agency (IEA), Paris.
IPCC - Intergovernmental Panel on Climate Change (2007): Climate Change 2007 – 4th Assessment Report. 3 Volumes and Synthesis Report, http://www.ipcc.ch/.
JRC/EUCAR/CONCAWE (2007): Well-To-Wheels analysis of future automotive fuels and powertrains in the European context. Version 2c. The study was undertaken jointly by the Joint Research Centre of the EU Commission, EUCAR and CONCAWE. Ispra.
Kemp, R. et al. (2000): How should we study the relationship between environmental regulation and innovation? IPTS Report EUR 19827 EN, Sevilla.
Kline, G.J.; Rosenberg, N. (1986): An overview of innovation, in: Landau, R.; Rosenberg, N. (Hrsg.): The Positive Sum Strategy: Harnessing Technology for Economic Growth, Washington, pp. 275-306.
Krail, M.; Schade, W.; Fiorello, D.; Fermi, F.; Martino, A.; Christidis, P.; Schade, B.; Purwanto, J.; Helfrich, N.; Scholz, A.; Kraft, M. (2007): Outlook for Global Transport and Energy Demand. Deliverable 3 of TRIAS (Sustainability Impact Assessment of Strategies Integrating Transport, Technology and Energy Scenarios). Funded by European Commission 6th RTD Programme. Karlsruhe, Germany.
Latouche, S. (2006): Le pari de la décroissance, Paris, Fayard.
Leone, R.; Hemmelskamp, J. (2000): The impact of EU Regulation on Innovation of European Industry, Heidelberg, Physica.
Liaskas, K.; Mavrotas, G.; Mandaraka, M.; Diakoulaki,. D. (2000): Decomposition of Industrial CO2 Emissions: The Case of the European Union, Energy Economics 22, 383-394.
Licht, F.O (2006): World biodiesel production to cross 4 million tonne mark in 2006, World Ethanol & Biofuels Report, edition April 26.
HOP! research project Macro-economic impact of high oil price in Europe
D2 High Oil Prices: Scenarios assumptions and model interfaces 111
Lundvall, B.-A.; Johnson, B. (1994): The Learning Economy, Journal of Industry Studies 1, pp. 23-42.
Lutz, C.; Meyer, B.; Nathani, C.; Schleich, J. (2005): Endogenous technological change and emissions: the case of the German steel industry, Energy Policy, Vol 33, pp. 1143-1154..
Miketa, A. (2001): Analysis of Energy Intensity Developments in Manufacturing Sectors in Industrialized and Developing Countries, Energy Policy 29, 769-775.
Mitchell, C.; Connor, P. (2004): Renewable energy policy in the UK. Energy Policy 32, pp. 1935-1947.
Newell, R.G.; Jaffe, A.B.; Stavins, R.N. (1999): The Induced Innovation Hypothesis and Energy-Saving Technological Change, Quarterly Journal of Economics 114, 941-975.
Öko-Institut, Forschungszentrum Jülich, DIW, Fraunhofer-ISI (2007): Politikszenarien für den Klimaschutz IV - Szenarien bis 2030 für den Projektionsbericht 2007. On behalf of the German Environmental Protection Agency, Berlin.
PETROFED, NCAER (2006): Study of Macroeconomic Impact of High Oil Prices. Petroleum Federation of India and National Council of Applied Economic Research, New Dehli.
Popp, D. (2002): Induced innovation and energy prices, American Economic Review 92, 160-180.
Porter, M.; van der Linde, C. (1995): Toward a New Conception of the Environment-Competitiveness Relationship, Journal of Economic Perspectives 9, 97-118.
Posner, M. V. (1961): International Trade and Technical Change. Oxford Economic Papers, Vol. 13, pp. 323-341.
Schade, W. (2007): Fact Sheet zur Maßnahme M16 CO2-Strategie Pkw. Analysis of the German Integrated Energy and Climate Policy Programme, Karlsruhe.
Schipper, L. et al . (2001): Carbon emissions from manufacturing energy use in 13 IEA countries: long-term trends through 1995, Energy Policy 29, 667-688.
Schleich, J. 2001: The impact of fuel prices on energy intensity in the West German manufactoring sector, refereed paper, International Summer School on Economics, Innovation, Technological Progress, and Environmental Policy, Seeon, 8-12 September 2001
Schleich, J.; Schlomann, B.; Eichhammer, W. (2000): Energy Efficiency and Structural Change in the German Manufacturing Industry, in: European Energy Network: Monitoring Tools for Energy Efficiency in Europe. Paris: ADEME Editions, 156-166.

HOP! research project Macro-economic impact of high oil price in Europe
D2 High Oil Prices: Scenarios assumptions and model interfaces 112
Schleich, J.; Walz, R.; Meyer, B.; Lutz, C. 2003: Policy Impacts on Macroeconomic Sustainability Indicators when Technical Change is Endogenous. In: Horbach, J. (Ed.): Systems of Indicators for Sustainable Development Innovations, Springer, Heidelberg 2005, pp. 95-105.
Shell (2007): Annual reports. http://www.shell.com/, Oct. 2007.
Smith, D.; Vivekananda, J. (2007): A climate of conflict: The links between climate change, peace and war. London.
Stern, N. (2006): The Economics of Climate Change – The Stern Review. Cambridge University Press.
Stewart, M. (1990): The economic impact of higher oil prices. NERA National Economic Research Associates.
Taistra, G. (2001): Die Porter-Hypothese zur Umweltpolitik, Zeitschrift für Umweltplitik und Umweltrecht, 241-262.
Thirtle, C. G.; Rutan, V.W. 1987: The Role of Demand and Supply in the Generation and Diffusion of Technical Change, Fundamentals of Pure and Applied Economics, Harwood Academic Publishers, New York.
TNO, IEEP, LAT (2006): Review and analysis of the reduction potential and costs of technological and other measures to reduce CO2-emissions from passenger cars. Report on behalf of the European Commission, Delft.
Toro, F.; Hasenauer, U.; Wietschel, M.; Schade, W. (2006): Technology trajectories for transport and its energy supply. Deliverable D2 of TRIAS (Sustainability Impact Assessment of Strategies Integrating Transport, Technology and Energy Scenarios) project funded by the European Commission 6th RTD framework. Karlsruhe.
Total (2007): Factbook 1998-2006. http://www.total.com/, Oct. 2007.
UIC (2005), International Railway Statistics.
Unander, F. et al. (1999): Manufacturing Energy Use in OECD Countries: Decomposition of long-term Trends, Energy Policy 27, 769-778.
Vernon, R. (1966): International Investment and International Trade in the Product Cycle. Quarterly Review of Economics Vol. 88, pp. 190-207.
Wakelin, K. (1997): Trade and Innovation, Cheltenham.
Walz, R. et al. (2007b): Zukunftsmärkte Umwelt. Innovative Umweltpolitik in wichtigen Handlungsfeldern, Karlsruhe, forthcoming end of 2007.
HOP! research project Macro-economic impact of high oil price in Europe
D2 High Oil Prices: Scenarios assumptions and model interfaces 113
Walz, R. (2006): Increasing Renewable Energy in Europe – Impacts on Competitiveness and Lead Markets. In Energy & Environment, Vol. 17 , Nr. 6, S. 951-975.
Walz, R. (2007): The role of regulation for sustainable infrastructure innovations: the case of wind energy. In: International Journal of Public Policy, Vol. 2, No. 1/2, pp. 57-88.
Walz, R.; Ragwitz, M.; Schleich, J. (2007a): Regulation and innovation: the case of renewable energy technologies. Accepted paper, 6th Conference on Applied Infrastructure Research (Infraday), Berlin 5./6.10.2007.
WBGU (2007): Sicherheitsrisiko Klimawandel. Scientific Advisory Council on Global Change of the German Government, Berlin.
WEC (2004): Survey of Energy Resources, London.
Welsch, H. (2001): The Determinants of Production-Related Carbon Emissions in West Germany, 1985-1990: Assessing the Role of Technology and Trade, University of Oldenburg, mimeo.
WETO (2003): 2030 - World Energy technology and climate policy outlook. EC DG RTD.
WETO-H2 (2006): World Energy technology outlook 2050. EC DG RTD.
Wiesenthal, T.; Christidis, P.; Schade, B.; Leduc, G. (2007): Alternative motor fuel scenario for the EU. Deliverable D6 of PREMIA (Effectiveness of measures to accelerate market introduction of BIOFUELS and HYDROGEN) project funded by the European Commission 6th RTD framework. Seville.
HOP! research project Macro-economic impact of high oil price in Europe
D2 High Oil Prices: Scenarios assumptions and model interfaces 114
GLOSSARY
Conventional oil is defined as crude oil and natural gas liquids produced from underground reservoirs by means of conventional wells. This category includes oil produced from deep-water fields and natural bitumen. Conventional oil includes liquid hydrocarbons of light and medium gravity and viscosity, occurring in porous and permeable reservoirs. If such hydrocarbons require enhanced recovery techniques, Laherrere (2001) and Rogner (1997) consider them to be unconventional oil.
Crude oil: a mixture of hydrocarbons that exists in a liquid phase in natural underground reservoirs and remains liquid at atmospheric pressure after passing through surface separating facilities. Production volumes reported as crude oil include:
liquids technically defined as crude oil;
small amounts of hydrocarbons that exist in the gaseous phase in natural underground reservoirs, but which are liquid at atmospheric pressure after being recovered from oil well (casing head) gas in lease separators;
small amounts of non-hydrocarbons produced with the oil.
Derived energy sources are produced from the primary energy sources by converting them into other forms of energy for end use consumption. Examples are electricity, petroleum products and heat.
Energy conservation is usually taken to refer just to the energy saving on the demand side.
Energy efficiency is a measure of the overall efficiency of providing energy services, ie, the efficiency with which energy is produced from primary resources, transformed into useful forms, delivered to end users and consumers.
Energy intensity is a statistical measure which relates energy consumption (eg, gross inland consumption) to the level of economic activity (e.g. GDP). Thus trends in energy intensity reflect changes in the amount of energy needed to produce a unit of economic output. This indicator is dependent on the efficiency of using energy for the various energy services required (eg, light, heat, power) and the structure of economic and social activities (eg, a high proportion of heavy industries consuming large amounts of fuel being used at comparably low efficiency, versus a service-oriented society).
Estimated Ultimately Recoverable (EUR) oil. This is oil that is infeasible to recover for reasons that are either economic or technical. This category also includes yet-to-be-found oil.
Final energy consumption is the consumption of primary and derived energy by the end-use sectors: mainly industry, transport, and households and services/commerce. Final energy consumption is always lower than gross inland consumption since it does not include the energy losses in conversion and distribution..
HOP! research project Macro-economic impact of high oil price in Europe
D2 High Oil Prices: Scenarios assumptions and model interfaces 115
Gross energy consumption corresponds to the total primary energy consumed, including quantities delivered to marine bunkers.
Gross inland consumption (or Total Primary Energy Supply (TPES)) is indigenous primary production, plus imports, minus exports and international marine bunkers, and plus/minus stock changes of primary energy.
Gross production: the total flow of natural gas from oil and gas reservoirs of associated-dissolved and non-associated gas.
Marketed production: corresponds to gross production, minus the volumes of gas flared or re-injected into fields, minus the shrinkage.
Natural gas: a mixture of hydrocarbon compounds and small quantities of various non-hydrocarbons existing in the gaseous phase or in solution with oil in natural underground reservoirs at reservoir conditions.
Natural gas liquids (NGLs): those reservoir gases liquefied at the surface in lease separators, field facilities or gas processing plants. NGLs consist of field condensates and natural gas plant products such as ethane, pentane, propane, butane and natural gasoline.
Non-Conventional oil (BP): Oil from coal, oil shale, oil sands, tar sands, bitumen, heavy and extra heavy oil, deep water oil, polar oil and natural gas condensates.
Non-conventional oil: includes oil shales, oil sands-based extra-heavy oil and derivatives such as synthetic crude products.
Primary energy sources include non-renewable fossil fuels (mainly solid fuels, crude oil, natural gas), nuclear power and renewables such as hydropower, geothermal, biomass and solar energy. Combined together, they provide a measure of primary energy production. Primary sources may be divided into two further categories in respect of their impact on global warming: carbon-intensive (solid fuels, oil, gas) and low- or zero-carbon (wind, solar, biomass, hydropower, geothermal and nuclear).
Proven Reserves (BP) defines “the estimated quantities of oil which geological and engineering data demonstrate with reasonable certainty to be recoverable in future years from known reservoirs under current economic and operating conditions”.
HOP! research project Macro-economic impact of high oil price in Europe
D2 High Oil Prices: Scenarios assumptions and model interfaces 116
LIST OF ABBREVIATIONS ADAM = ADaptation And Mitigation Strategies
ASPO = Association for the Study of Peak Oil&Gas
BTL = Biomass-to-Liquid
CA = Carbon Abatement
CDM = Clean Development Mechanisms
CER = Certified Emission Reduction
CHP = Combined heat and power
CIS = Community of Independent States (1)
CNG = Compressed Natural Gas
CTL = Coal-to-Liquid
EIA = Energy Information Administration of the United States Department of Energy
EEA = European Environment Agency
EMF = Energy Modelling Forum
EU = European Union
EU15 = EU member states (15 countries) before May 2004
GDP = Gross Domestic Product
GHG = Greenhouse Gas emission
GTCC = Gas Turbine Combined Cycle
GTL = Gas-to-Liquid
Gtoe = Billion of tons oil equivalent
GWP = Global Warming Potential
HFC= Hydrogen/Fuel Cells
IEA = International Energy Agency
IEPE = Institute of Energy Policy and Economics
IET = International Emission Trading
ICE = Internal Combustion Engine
IGCC = Integrated coal gasification combined cycle
IIASA = International Institute for Applied System Analysis
IMF = International Monetary Fund
IOC = International Oil Companies
HOP! research project Macro-economic impact of high oil price in Europe
D2 High Oil Prices: Scenarios assumptions and model interfaces 117
IPCC = Intergovernmental Panel on Climate Change
LNG = Liquefied Natural Gas
LPG = Liquefied Petroleum Gas
LWR = Light water reactor
MMBD = Million Barrel per day
Mtoe = Million ton oil equivalent
NEMS = National Energy Modelling Systems
NOC = National Oil Companies
NGL = Natural Gas Liquids
OD = Origin – Destination (- matrix)
OECD = Organisation for Economic Cooperation and Development
OPEC = Organisation of Petroleum Exporting Countries
PEM = Proton Exchange Membrane
POLES = Prospective On Long Term Energy Systems
PPP = Purchasing Power Parities
R&D = Research and Development
RSMT = Region Sector Medium Term Scenarios
SAGD + steam-assisted gravity drainage
SFC = Solid oxide Fuel Cell
SRES = Special Report on Emission Scenarios by IPCC
TOE = Ton of oil equivalent
TREN = Transport and Energy Scenarios
TWh = Billion kWh
UAE = United Arab Emirates
UN = United Nations
UNFCCC = United Nations Framework Convention on Climate Change
URR = Ultimate Recoverable Resources
US-DOE = US Department of Energy
VLT = Very Long Term Scenarios
WBCSD = World Business Council for Sustainable Development
WEC = World Energy Council
WETO = World Energy, Technology and Climate Policy Outlook