Embed Size (px)
Citation preview

Deliverable 3.2
Semantic recognition of
sketched objects 1st August 2017
Version 1.0
Abstract:
This report documents its4land tools for semantic recognition of objects in hand-
drawn sketch maps
Project Number: 687828 Work Package: 3
Lead: WWU Münster
Type: DEC Dissemination: Public
Delivery Date: August 01 2017 Actual Delivery Date: August 01 2017

Contributors: Sahib Jan, Cristhian Murcia, Malumbo Chipofya, Angela Schwering, Carl Schultz, Berhanu Kefale Alemie, Robert Wayumba, Christian
Timm
Its 4 Land Hengelosestraat 99 Enschede 7500AE
Netherlands Phone: +31534874532 www.its4land.com

H2020 its4land 687828 D3.2 Object Recognition
3
This communication reflects only the authors’ view and the Commission is not responsible for any use that may be made of the information it contains.
Copyright © 2016 by the its4land consortium
The its4land consortium consists of the following partners:
University of Twente (UT) KU Leuven (KUL) Westfaelische Wilhelms-Universitaet Muenster (WWU) Hansa Luftbild AG (HL) Institut d'Enseignement Superieur de Ruhengeri (INES) Bahir Dar University (BDU) Technical University of Kenya (TUK) esri Rwanda (ESRI).
Its 4 Land Hengelosestraat 99 Enschede 7500AE
Netherlands Phone: +31534874532 www.its4land.com
H2020 its4land 687828 D3.2 Object Recognition
4
Executive Summary This documents reports the outcomes of work leading to deliverable D3.2 which is the
second deliverable for work package WP3, Draw and Make. D3.2 consists of a set of
methods and software implementations for extracting the geometric representations
of conceptual objects drawn in sketch maps. In order to address the overall challenge
of automatic understanding of land tenure sketch maps, we were required to consider
three separate problems: i) understanding the structure of the images to be processed
including the underlying semantics, ii) developing unified methods of sketching
including a visual language and simplified sketching modalities, and iii) developing
the required image processing workflows using existing techniques. During the first
year of WP3 we used two distinct approaches to collect land tenure sketch maps; we
experimented with three different sketching modalities from the participatory
mapping literature; and we explored three different methods from the area of computer
vision to perform symbol detection and object classification in sketch maps. As such
D3.2 represents a multi-disciplinary approach to capturing land tenure related land use
information.
Instructions for installation and use of the software delivered are given in the
README files included in the software submission. An outline of the processes is
given in the appendixes.
Data collection for D3.2 consisted of engaging participants in sketching exercises,
first in an unconstrained setting at their homes and subsequently in a formal workshop
at a meeting facility away from their homes. The initial sketch maps were used to
develop the visual language which was verified in the second, follow up, data
collection phase.
The semantic recognition system consists of set of modules each implemented as a
standalone system for a specific part of the semantic sketch recognition task. The
modules are i) an image pre-processing module which transforms the image into a
format suitable for subsequent processing ii) a module for recognition of symbols
symbols iii) a module for the extraction of contours and regions.
In this report we briefly outline the methods employed towards the realization of D3.2
and give a detailed description of the contents of the deliverable. The report is intended
as a descriptive document of the tools delivered as D3.2 and at the same time as a
preliminary user reference for readers wanting to test any of the tools.
www.its4land.com

H2020 its4land 687828 D3.2 Object Recognition
5
Contents
EXECUTIVE SUMMARY 3
1. INTRODUCTION 6
2. SKETCHING LAND TENURE MAPS: USE CASE SCENARIO 8
3. STUDY AREAS 9
4. DATA COLLECTION 10
5. RESULTS 12
6. METHODOLOGIES FOR OBJECT RECOGNITION 19
7. CONCLUSION 21
BIBLIOGRAPHY 23
APPENDICES 24
www.its4land.com

H2020 its4land 687828 D3.2 Object Recognition
6
1. Introduction
its4land is a European Commission Horizon 2020 project funded under its Industrial
Leadership program, specifically the ‘Leadership in enabling and industrial technologies
– Information and Communication Technologies ICT (H2020-EU.2.1.1.)’, under the call
H2020-ICT-2015 – and the specific topic – ‘International partnership building in low and
middle income countries’ ICT-39-2015.
its4land aims to deliver an innovative suite of land tenure recording tools that respond to
sub Saharan Africa’s immense challenge to rapidly and inexpensively map millions of
unrecognised and/or unrecorded land rights in the region and register them in formal land
administration systems. ICT innovation is intended to play a key role. Many existing ICT-
based approaches to land tenure recording in the region have not been successful: disputes
abound, investment is impeded, and the community’s poorest lose out. its4land seeks to
reinforce strategic collaboration between the EU and East Africa via a scalable and
transferrable ICT solution. Established local, national, and international partnerships seek
to drive the project results beyond R&D into the commercial realm. its4land combines an
innovation process with emerging geospatial technologies, including Smart Sketch Maps,
UAVs, automated feature extraction, and geocloud services, to deliver land recording
services that are end-user responsive, market driven, and fit-for-purpose. The
transdisciplinary work also develops supportive models for governance, capacity
development, and business capitalisation. Gender sensitive analysis and design is also
incorporated. Set in the East African development hotbeds of Rwanda, Kenya, and
Ethiopia, its4land falls within TRL 5-7: 3 major phases host 8 work packages that enable
contextualisation, design, and eventual land sector transformation. In line with Living
Labs thinking, localised pilots and demonstrations are embedded in the design process.
The experienced consortium is multi-sectorial, multi-national, and multidisciplinary. It
includes SMEs and researchers from 3 EU countries and 3 East African countries: the
necessary complementary skills and expertise is delivered. Responses to the range of
barriers are prepared: strong networks across East Africa are key in mitigation. The
tailored project management plan ensures clear milestones and deliverables, and supports
result dissemination and exploitation: specific work packages and roles focus on the
latter.
This document is directly linked to WP3 – “Draw and Make” of the its4land project. The
primary objective of the work package is to develop a software tool (the Smart Sketch
Maps or SSM system) for recording land tenure information within the context of rural
and peri-urban communities based on hand-drawn sketch maps. The tool is composed of
several components including a specialized domain model and a visual language for
sketching, a system for automated recognition and extraction of objects in sketch maps,
qualitative representation, and qualitative alignment of sketched information with
underlying geo-referenced datasets. All these component come together to provide a
single function: integrating the user’s sketch into a base topographic dataset.
Work packages in the its4land project are organized into distinct tasks. D3.2 is one of
three planned outputs of task T3.2 of WP3. This document seeks to represent D3.2: it

H2020 its4land 687828 D3.2 Object Recognition
7
intends to provide the results of the semantic recognition part of the overall Smart Sketch
Maps system.
The “smart” in smart sketch maps is only realizable after explicitly drawn spatial object
are identified and assigned a semantic category. Our system will allow users to submit a
hand drawn sketch map produced during a community mapping exercises and then the
semantic recognition tool will extract the boundaries of drawn objects and classify them
into some semantic categories. For classifying the drawn objects, we have opted for
prescribing a visual language as a set of symbols. The symbols are generated each of
which represents a specific class of features (e.g. tree, dwelling, etc.). The predefined
symbols will help to detect drawn features as well as categorizing them into semantic
categories.
For matching symbols and recognizing contours of each drawn feature, we have explored
three main approaches. We have implemented a prototype symbol recogniser that is
capable of identifying a variety of symbols (trees, houses, water body symbols, grazing
symbols, etc.). Our prototype is implemented on top of OpenCV, using the Histogram of
Oriented Gradients (HOG) approach for image features together with linear Support
Vector Machines (SVMs) [2]. The HOG features together with the SVMs (abbreviated
HOG+SVM) form the model for detecting spatial objects in the input maps while
OpenCV provides a set of tools for manipulating the images throughout the object
detection process. Objects that are not interpreted as symbols arise only as regions. For
recognizing these regions, we have used the sketch segmentation approach developed by
Broelemann and Jiang [3, 4]. The approach extracts regions and classifies them into
polygonal and linear features such as landmarks and line segments.
This report is structured as follows. Section 2 presents the use case scenario against which
we are designing, Section 3 gives an overview of the study areas where data developing
the SSM system were collected, and Section 4 presents the Data collection methodology.
The main outcomes of our research in task T3.2 are discussed in Section 5 results of the
research work, methodologies adopted in recognition spatial objects (Section 6), and
conclusions (Section 7).

H2020 its4land 687828 D3.2 Object Recognition
8
2. Sketching land tenure maps: use case scenario
In the Draw and Make work package (WP3), we aim at providing tools to collect and disseminate land use and land tenure information. The SSM system is being designed
to support a bottom-up approach to land tenure and land use mapping. In particular SSM
is evolving to target non-governmental organizations such as Namati and Water Aid in
the use of sketching as a method for creating land tenure, land use and land resource
maps.
The general use case scenario is one where members of a community are supported to
create land use maps by hand and an organization (which may be private, non-
governmental, or a government department) working with the community operates the
SSM system making it available to the community as a service. Such a model fits well
with some of the existing operational models of organizations involved community based
participatory mapping work1.
In such a model, the organization would engage the community to establish a standard
for creating their maps specifying both the symbols and some rules about how the
symbols are allowed to be composed into a map.
The mapping itself then occurs in several iterations starting with completely free hand
drawn maps and evolving towards a standardized map in each iteration. To make the
mapping more effective a few members of the community could be trained as volunteer
mappers for the community and would be responsible for producing the final standardized
maps.
1 See http://spatialcollective.com/, https://namati.org/ourwork/communityland/, or
http://www.landcoalition.org/ for example approaches.

H2020 its4land 687828 D3.2 Object Recognition
9
3. Study Areas
We focused on two study areas within the context of rural and peri-urban communities in
Kenya and Ethiopia. The Ethiopian cases focus on peri-urban and rural land certification.
Meanwhile, the Kenyan cases address pastoralist land rights registration in the context of
subdividing group ranches into private holdings – and associated land disputes with other
land uses. We have selected one study area in each country based on the relevance of the
tool for end-users. In Kenya, we have selected Kajiado County – Mailua ranch, while in
Ethiopia we focus on Robit Bata kebele, a rural village near Bahir-Dar city.
Kajiado County is located between Nairobi County and the Republic of Tanzania. In
Kajiado, land is mainly used for livestock rearing and crop growing. Nomadic pastoralism
is still predominant throughout this county. Maasai pastoralists mainly occupy the area.
In this specific area, the land tenure system is dominated by group ranches. Mailua ranch
is one of the group ranches located in Kajiado Central. This use case area is selected
because many people have embarked on the subdivision of group ranches without
adequate survey control and without proper land use planning. In Ethiopia, Robit Bata
rural kebele is selected because of the issues related to the high degree of land degradation
and fragmentation. In order to tackle these problems, land tenure information via a
community mapping is vital as input information for land consolidation purposes.

H2020 its4land 687828 D3.2 Object Recognition
10
4. Data Collection
4.1. Field visits to Kajiado, Kenya We have organized different workshops during our field visits to Kenya. In the first visit,
we conducted experiments to collect freehand sketches from two families of Maasai
pastoralists at Mailua ranch. Focusing on land issues, spatial information was collected
via freehand sketches. A total of 20 participants (11 male and 9 female) participated in
the experiments, and 20 sketch maps were collected in total. We also collected data from
a third Maasai family living near Kajiado town (peri-urban), the site was selected because
of their land issues, particularly, conflicts on the parcel boundaries. There were 12
participants (five female and seven male) and we have collected 12 land use sketch maps
with parcel boundaries from this site.
In the second field visit, we organized two different workshops. The first workshop was
organized with male community member of the Maasai tribe. During the workshop we
showed different maps to raise awareness about different types of maps that can be used
to present boundaries of the group ranches and privately owned land bordering the
ranches, social facilities, land uses, and resources including wildlife. Afterwards,
participants were asked to individually draw a large area sketch map including the spatial
features such as mountains near and far, rivers, roads, marsh lands, thick forest and all
man-made resources such as boma, water holes, olopololi, manyata (for young warriors),
schools, hospitals, etc. From this workshop, 13 large-area sketch maps were produced.
The second workshop was conducted with female community members of the Maasai
tribe. Participants were asked to draw a small-area sketch map focusing on drawing
details inside the structure of the boma and mapping other man made resources around
the boma such as water holes, olopololi, the manyata, schools, hospitals, etc. After
mapping spatial features within and outside the boma, participants were asked to explain
their individual sketch maps to other participants. Participants were actively involved in
the group discussion and contributed additional information or missing information in the
presented maps. Finally participants were asked to jointly draw large-area group sketch
maps. We collected 13 individual sketch maps and two group sketch maps (contributed
by all participants).
4.2. Field Visits to Bahir-Dar Ethipoia In the first field trip, we visited different sites in Bahir-Dar city. The main purpose of
these visits was to learn about the study sites and examine the feasibility of each site for
our field work and to meet stakeholders. Following the visit, the Rural Kebele of Robit
Bata was selected as a study area. Robit Bata is a rural area outside Bahir-Dar city
experiencing a high level of land fragmentation. The farms have visible boundaries but
there are also ditches used to create terraces because of the undulating terrain and
sometimes these are not boundaries. There are also a lot of natural features including hills,
rivers and Lake Tana. The morphology also presents good conditions for conducting
UAV flights to collect orthophotos (WP4 and WP5).
In the second field visit, we conducted data collection workshop with the local
community. The workshop was organized with 10 male and three female participants.

H2020 its4land 687828 D3.2 Object Recognition
11
Similar to the Kenyan workshops, we initially introduced different types of maps to raise
awareness about maps in general. Afterwards, participants were divided into groups
according to where they lived so that nearby neighbours worked together. The
participants were asked to draw a large-area group sketch map of their part of the kebele
showing among other things their homes, church, hospital/clinic, schools, farms, and
grazing areas. We collected 13 individual sketch maps and three detailed group sketch
maps (contributed by all participants).

H2020 its4land 687828 D3.2 Object Recognition
12
5. Results During the execution of T3.2 a total of 73 sketch maps were collected across seven
different sketching exercises. These data have informed our approach to sketch
recognition and the design of an initial visual language for sketch maps. Data from the
second round sketching exercises will be used to derive a revised version of the symbols
in the visual language.
In addition to the identification of a suitable symbology, we experimented with different
approaches to sketching, namely, simple pen and paper sketching, using stamps for sketch
annotation, and sketching in the ground. Each of these methods has its own pros and cons,
and the choice of which approach to employ depends on factors which are outside the
scope of this work [8, 9].
At the end, the system for recognition of objects in sketch maps is informed by the
experiences of the research team during the data collection phases of the project. The
resulting system while based in part on the data collected from the field also constrains
the types of sketch maps that can be used mostly for practical reasons. For example,
symbols such as the small ticks representing grass in Figure 1 cannot be recognized and
must therefore be ignored by the system.
In this section we summarize the outcomes of the research in task T3.2 that contributed
to the realization of the deliverable D3.2. First we present an overview of the data
collected during the field visits to Kenya and the innovations derived from that
experience. Then we give a summarized description of the visual language developed
from these data. Finally we describe the sketch recognition system at a high level.
5.1. Collected Sketch Maps From our two different field visits in Kenya and Ethiopia, we have collected a total of 73
sketch maps at two different scales. Out of 73 sketch maps, 44 are large area sketch maps
containing spatial features such as mountains near and far, rivers, roads, marsh lands, and
all man-made resources while the remaining sketch maps contains detail information
about the internal structure of the boma and mapping other man made resources around.
The initial data collection exercises conducted in March 2017 provided insight into the
sketching process and the workflows within which sketching can be suitably applied. All
sketch maps collected were survey sketch maps. In addition, all but four of the sketch
maps focussed on the homestead. Of the four sketch maps that covered a large area
beyond the homestead only two were truly survey type maps showing details of resources
between the different homesteads and other landmarks of interest.
A total of 28 sketch maps were collected during the second field visit to Kajiado, Kenya
in June 2017. Of these 28 sketch maps, 13 sketch maps were drawn by male participants
and were mostly a depiction of the boma locations within the sketcher’s ranch and the
paths connecting the a boma to others. The female participants drew 13 individual sketch
maps of their boma. All of these maps showed the actual dwellings (enkaji in Maasai),
animal pens, and the entrances to the boma as common features.

H2020 its4land 687828 D3.2 Object Recognition
13
Figure 1: Example sketch map from Kajiado, Kenya. This sketch map is included as an example to demonstrate the SSM object recognition tools

H2020 its4land 687828 D3.2 Object Recognition
14
The female participants were also asked to prepare two joint sketch maps. The joint maps
showed the configuration of all bomas in their respective group ranches as well as other
features of interest within the group ranch such as wild life territories, hills or mountains
and man-made water points where either a borehole or dam has been installed. The
submitted software sources contain one of the joint maps (Figure1) as an example.
5.2. Visual language The visual language consists of a set of symbols corresponding to relevant concepts in
the Southern Kenya Maasai Ontology (see D3.1). The set of symbols identified so far is
shown in Figure 2. The symbols were identified by extracting all the objects drawn in the
sketch maps from Mailua and listing those that occurred in more than one sketch map.
We then chose an arbitrary number of those as a way to initially minimize the amount of
data used for subsequent development of the sketch recognition system.
The visual language is a dynamic object and can be modified by assigning new symbols
to concepts or by defining rules that combine existing symbols to define new symbols.
This is part of the work to be performed during task T3.3 as part of deliverable D3.3 of
its4land.
5.3. Sketching modalities During the data collection phase 3 main sketching modalities were explored based, partly,
on ideas found in the literature. The standard sketching approach using pen and paper has
been used by the team at WWU in several previous projects as evidenced in the extensive
sketch map database of the Spatial Intelligence Lab2. This was the primary sketching
approach to which our study participants were exposed.
The first alternative approach we introduced was the use of coloured chalk powder to
draw large sketch maps in the ground (See Figure 3 for an example). This approach was
chosen because we expected that it would be useful to foster interaction between members
of the community during the sketching process. This method had already been
documented in the participatory mapping training program by the EU-ACP Technical
Centre for Agricultural and Rural Cooperation and the International Fund for Agricultural
Development.3 As expected the ground sketching brought the group participants together
to comment on the outcome including a woman who joined in to make her contribution
to the map. One disadvantage of the ground sketches is that they may quickly expand to
cover large areas that are then difficult to capture digitally, e.g. with a handheld camera.
This was the main drawback to using this modality in the context of D3.2.
The final innovation introduced is the use of stamps to annotate sketch maps drawn on a
piece of paper (see Figure 1 for an example of the idea). This addition was a novel
contribution in that we have not seen it used elsewhere in the literature. The advantage it
brings is technical.
2 https://www.uni-muenster.de/Geoinformatics/en/sketchmapia/sketch-map-database.php 3 http://pgis-tk-en.cta.int/info/index.html

H2020 its4land 687828 D3.2 Object Recognition
15
Figure 2: Symbols from the sample visual language developed from sketches and discussions held in Kajiado, Kenya

H2020 its4land 687828 D3.2 Object Recognition
16
Figure 3: Ground sketch map drawn during sketching session at Mailua, Kajiado
Due to the great variations in the choice of symbols used by participants during sketching,
it was necessary to find alternative ways to standardize some of the symbols used. Since
not all symbols may come across as natural to all participants, the research team
introduced the stamps in order to annotate important objects in the sketch maps. The
advantage of using stamps is that stamps are relatively inexpensive to obtain and will
ensure more similarity in symbols corresponding to important concepts across users. This
ensures that the system’s users can produce highly accurate classifiers with relatively
little data.
5.4. Object recognition system The main outputs of task T3.2, to date, are the two image classification tools forming
deliverable D3.2. The first tool is a symbol detection software program that accepts as
input an image and identifies the locations all symbols detected in the image. The second
tool takes the output of the first tool and extracts regions of the sketch map corresponding
to different types of objects.
5.5. Sketch recognition in sketch maps: a workflow Our workflow for object recognition in a sketch map is based on the structure of the sketch
maps that we anticipate. In general, a sketch is considered as a set of strokes configured
in such a way that groups of strokes form an object. The object may be a symbol or it
may represent a region. In both cases, the objects refer to specific concepts in the domain
of application. The concepts may be specific or abstract. For example, a house symbol
may represent a dwelling or in general a building.
In order to successfully detect all the objects in the image our workflow follows the
structure shown in the Figure 4. The image is viewed as an array of pixels. The task is to
identify sets of pixels in the image that form strokes and group the strokes into objects
which can then be interpreted as representing particular concepts.
There are two kinds of objects as identified in the Sketchmapia project [7]. Those that
play the role of containers are akin to Sketchmapia’s city blocks. They form a global
structure within which other objects are organized. The other kind of object of interest in
H2020 its4land 687828 D3.2 Object Recognition
17
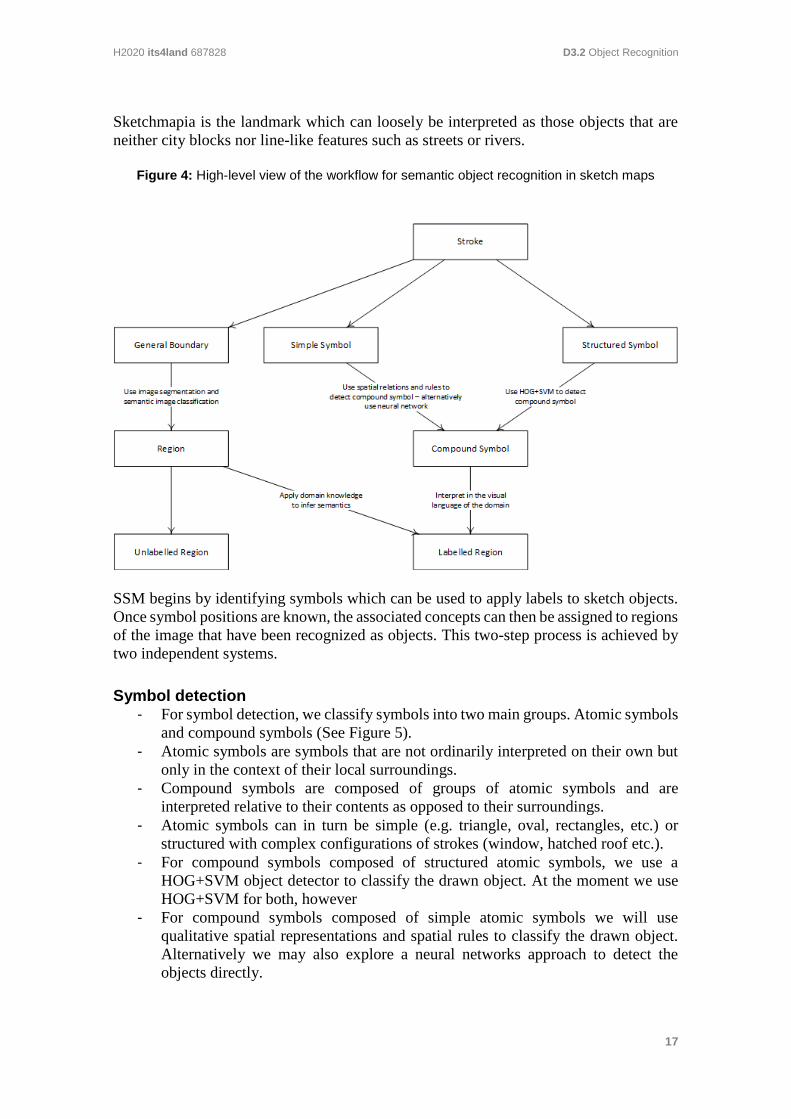
Sketchmapia is the landmark which can loosely be interpreted as those objects that are
neither city blocks nor line-like features such as streets or rivers.
Figure 4: High-level view of the workflow for semantic object recognition in sketch maps
SSM begins by identifying symbols which can be used to apply labels to sketch objects.
Once symbol positions are known, the associated concepts can then be assigned to regions
of the image that have been recognized as objects. This two-step process is achieved by
two independent systems.
Symbol detection - For symbol detection, we classify symbols into two main groups. Atomic symbols
and compound symbols (See Figure 5).
- Atomic symbols are symbols that are not ordinarily interpreted on their own but
only in the context of their local surroundings.
- Compound symbols are composed of groups of atomic symbols and are
interpreted relative to their contents as opposed to their surroundings.
- Atomic symbols can in turn be simple (e.g. triangle, oval, rectangles, etc.) or
structured with complex configurations of strokes (window, hatched roof etc.).
- For compound symbols composed of structured atomic symbols, we use a
HOG+SVM object detector to classify the drawn object. At the moment we use
HOG+SVM for both, however
- For compound symbols composed of simple atomic symbols we will use
qualitative spatial representations and spatial rules to classify the drawn object.
Alternatively we may also explore a neural networks approach to detect the
objects directly.

H2020 its4land 687828 D3.2 Object Recognition
18
Figure 5: (left to right) Examples of simple atomic symbols, compound symbol with a structured atom, and compound symbols with simple atoms.
Region detection - Objects that are not interpreted as symbols arise only as regions. The first step to
the identification of such regions is the identification of their boundary. Here we
employ an image segmentation based on edge detection followed by a
classification that uses knowledge of the domain to obtain regions with particular
semantics.
Assigning semantics - Semantics are applied to a detected object in two ways. First when a symbol is
detected, it can be assigned to its surrounding region provided the shape of the
region satisfies the constraints determined by the symbol (e.g. mountains can be
open on one end and streams must be line-like in that their lengths must be at least
twice as large as their widths).

H2020 its4land 687828 D3.2 Object Recognition
19
6. Methodologies for Object Recognition For matching predefine symbols, we have adopted three well known matching
approaches in the area of computer vision. We have implemented prototypes for each
considered approach using the OpenCV technology. OpenCV4 (Open Source Computer
Vision Library) is released under a BSD license and hence it is free for both academic
and commercial use. During our work a number of approaches to symbol detection were
explored. Initially, a template based matching method was used. The method was then
extended to supervised learning using Haar cascades to generate object classifiers [1].
Because both approaches proved to inefficient and inappropriate for object detection in
hand drawn images, particularly given the variations in drawing symbols, we explored a
the third approach, HOG+SVM.
6.1. Template Matching Template Matching [5] is a high-level machine vision technique that identifies the parts
on an image that match a predefined template. We have implemented a prototype for
template matching using OpenCV (Java version). We created a catalogue of symbols
from hand drawn sample images and expanded the set by rotating, scaling and blurring
the original symbols. The expanded set of images was then used as the templates for our
prototype. The prototype takes one template at a time and tries to match the corresponding
symbols in the sketch map. After matching, the system captures the actual contour of the
drawn object as a boundary. One of the main drawbacks of template matching is that the
approach does not allow finding variations of the templates resulting from such as
rotation, skewing and scaling.
6.2. Supervised Learning using Haar Cascades As an alternative we also considered supervised learning using Haar cascades [1]. Haar
classification is a tree-based technique where in the training phase, a statistically boosted
rejection cascade is created. Boosted means that one strong classifier is created from weak
classifiers, and a weak classifier is one that correctly gets the classification right in at least
above fifty percent of the cases. The cascade itself is a structured set of feature descriptors.
A feature descriptor can be thought of as a summary of some important feature in an
image such as an intersection of two strokes (lines).
Cascades are useful if we want to match different occurrences with variations in factors
like scale, rotation, and/or skewness of objects in the image. However, the approach
requires very large datasets and computational time for training its descriptors, also
known as cascades. For training a particular cascade, we need a huge number (at least
4000) of training samples. So we created a tool to automatically generate large datasets
from a small number of samples and created cascades from our expanded sample sets (i.e.
house, trees, building, etc.) to match different symbols in sketch maps. Despite these
efforts, even with a carefully curated sample set, the approach produced a very large
number of incorrect matches.
4 http://opencv.org/

H2020 its4land 687828 D3.2 Object Recognition
20
6.3. Histogram of Oriented Gradients (HOG) In OpenCV, to detect symbols you will need to spend a lot of time tuning the parameters
particularly in detecting multi-scale symbols and again there is no guarantee that the exact
same parameters will work from image-to-image. In order to detect symbols with
variations in size, orientation, skewness, we have adopted a Histogram of Oriented
Gradients (HOG) descriptor used with linear Support Vector Machines (SVMs) [2]. In
the HOG feature descriptor, the distribution of the magnitudes and orientations of
gradients over differences in pixel intensities are used as features [2]. The HOG
descriptors for object recognition are a relatively new approach, capable of providing
high accuracy of recognition. The dlib library5 provides the function fit which does the
heavy work of fitting the model (i.e. generating the HOG descriptors) to the training data.
Dlib also creates detectors which are objects that implement the scanning of an image
for occurrences of the objects of interest as prescribed by the HOG descriptors.
6.4. Region Detection In order to transform the input sketch map into grayscale image with homogeneous
illumination, we used the standard algorithm [6] and separated the texts from the drawn
symbols. To identify the remaining sketched elements such as linear and polygonal
regions, the image is partitioned into regions (segmentation) and then objects are
classified based on their geometric appearance (semantic recognition) using the algorithm
proposed in [3]. The used algorithm [3],[4] also deal with visual artifacts (e.g., as a result
of noise in the original image) and typical drawing effects found in hand-drawn sketch
maps such as small gaps between lines, and streets with open ends or closed streets where
side streets start. The method recognizes and interprets the depicted objects, and then
transfers them into a digital format, i.e. shape file. In order to access these methods
publicly, we packaged them and developed a Java based plugin for geographic
information systems (GISs), i.e. plugin for the OpenJump software (open source Java
based GIS application). The plugin enables ordinary users to access, process and extract
drawn spatial information in sketch maps.
5 http://dlib.net/imaging.html

H2020 its4land 687828 D3.2 Object Recognition
21
7. Conclusion In this section we make concluding remarks about the work presented in this report. In
task T3.2 we have developed a robust system for object recognition in sketch maps.
During the work of T3.2, however, we encountered several challenges which we outline
below. After the challenges we make recommendations for improvements on our work
and outline the path of our research going forward.
7.1. Challenges One of the greatest challenges faced by WP3 in T3.2 is the shortage of data for designing
the intended system. Although many maps were collected not all maps could be used as
example inputs to an automated image interpretation software tool. This is due to several
related factors which we consider as challenges in their own right:
- Extremely variable symbols used: because some of the participants preferred
different symbols there was not enough data for training a sophisticated
recognition system such as neural networks.
- We also found that many participants did not find the concept of a map
particularly interesting or familiar. It took several visits and discussions with the
community before many were convinced of what a map could be used for.
- Time for community engagement was limited – significantly more time than was
available is required to develop a relationship with the community that is
conducive to sketch mapping research purposes.
- Finally we believe that lack of writing skills among some of our participants
impeded on the drawing abilities of participants which was perhaps a major
cause of extreme variations in the way symbols were drawn.
7.2. Recommendations Our experience over the past year has made it clear that for the project to successful, it
must tap into the experience of the users that we expect will use our system. For smart
sketch maps the majority of users may be non-governmental organisations that conduct
participatory rural mapping using sketch maps. As such we recommend that work during
the system validation phase should involve such partners in order to ensure that the output
of our work is relevant to the problems identified at the beginning of the project. Working
with experts in the area also promises to help us maximize the volume and quality of data
collected.
For organizations that use the SSM system a recommended model is one where selected
members of the community are trained to be the community’s mappers. A mapper in the
community can continuously produce maps which can then be collected periodically to
become part of a rich dataset. The dataset would then be used to generate further samples
for training SSMs object classifiers.
The second recommendation we make for our work is that the system must be deployed
within a custodian organisation which will be responsible for developing the visual
language in conjunction with the community and also training the system to recognize
sketch maps for the particular domain in which they are working.

H2020 its4land 687828 D3.2 Object Recognition
22
7.3. Future directions Going forward we will continue to focus our effort on task T3.2 which includes the work
on sketch map representation. In this phase we will also solve some of the problems faced
during the recognition phase (e.g. recognition of complex symbols as groups of simple
symbols using rules constructed with spatial constraints). In addition it may be useful for
the work coming up in WP6 to provide a simple user interface for introducing new
symbols and training the system with the new symbols.

H2020 its4land 687828 D3.2 Object Recognition
23
Bibliography [1] S. Reinius, “Object recognition using the OpenCV Haar cascade-classifier on the iOS
platform,” in Institutionen för Informationsteknologi, Uppsala Universitet, 2013.
[2] N. Dalal and B. Triggs, “Histograms of oriented gradients for human detection,” in 2005
IEEE Computer Society Conference on Computer Vision and Pattern Recognition
(CVPR’05), 2005, vol. 1, pp. 886–893.
[3] K. Broelemann and X. Jiang, “A region-based method for sketch map segmentation.,” in
Graphics Recognition. New Trends and Challenges. LNCS, Vol. 7423, Berlin Heidelberg:
Springer-Verlag, 2013, pp. 1–14.
[4] K. Broelemann, “A System for Automatic Localization and Recognition of Sketch Map
Objects,” in Workshop of Understanding and Processing Sketch Maps, 2011, pp. 11–20.
[5] N. Perveen, D. Kumar, and I. Bhardwaj, “An overview on template matching
methodologies and its applications,” Int. J. Res. Comput. Commun. Technol., vol. 2, no.
10, pp. 988–995, 2013.
[6] M. Sezgin and B. Sankur, “Survey over image thresholding techniques and quantitative
performance evaluation,” J. Electron. Imaging, vol. 13, no. 1, pp. 146–168, 2004.
[7] Schwering, A., Wang, J., Chipofya, M., Jan, S., Li, R., & Broelemann, K., 2014.
SketchMapia: Qualitative representations for the alignment of sketch and metric maps.
Spatial Cognition & Computation, 14(3), pp. 220-254.
[8] Knight, R., Brinkhurst, M., & Vogelsang, J. (2016) Community land protection facilitators
guide. [Online] Available from: https://namati.org/resources/community-land-protection-
facilitators-guide/ [Accessed 17th July 2016].

H2020 its4land 687828 D3.2 Object Recognition
24
Appendices In these appendices we describe how to install and try the two sketch map processing
tools. The tools require at least Windows 7.
Appendix 1. Installation and workflow for recognition of individual symbols Step 1: To use the symbol recognition software we recommend that you download and
install anaconda2 from the anaconda website (unless you know what you are doing).
We recommend installing anaconda2 as it installs python2.7 together with many of the
dependencies that the libraries we are building on require.
Step 2: copy the entire folder SymbolRecognition (in which this file is located) to your
preferred location. We recommend placing directly on the root of your hard-drive (e.g.
C:\)
Step 3: copy the files inside the folder 'site-packages' to the site-packages folder of your
anaconda installation (by default this will be at C:\ProgramData\Anaconda2\Lib\site-
packages).
Step 4: install dlib
To install dlib you must first give all users read/write rights for the 'site-
packages' folder
In Windows explorer right-click on the folder icon for the 'site-packages' folder
then select properties. This will open the Properties window of the folder.
In the folder Properties select the 'Security' tab and select each user in the
Group or user names list in turn and select 'Full control' in the 'Allow' column
followed by a click on the 'Apply' button at the bottom of the window.
Click OK when done
Open the command line terminal and install dlib with the following command
conda install -c conda-forge dlib=19.0
Step 5: in the command line terminal navigate to the SymbolRecognition folder.
Step 5: at the command prompt now type jupyter notebook and hit Enter. This starts the
jupyter server and opens your browser.

H2020 its4land 687828 D3.2 Object Recognition
25
Step 6: to begin exploring how the tool works click on one of notebooks labelled 1.
through 5. Upon clicking one of the notebooks, e.g. number 1. Annotating Images.ipynb,
a new browser tab will open and load the notebook.

H2020 its4land 687828 D3.2 Object Recognition
26
Step 7: you can run the notebook by clicking in each cell (to make it the window’s focus)
and pressing CTRL+ENTER. An IPython notebook in jupyter is executed cell by cell.
This means that if you change something in any of the cells you have to rerun that cell
(but you do not have to rerun all preceding or subsequent cells unless the changed cell
has side-effects on the other cells)
Note: please read comments in the code shown in the notebook to follow what is going
on.
Note: for the first time please run the notebooks in the order in which they are listed (1 –
6).

H2020 its4land 687828 D3.2 Object Recognition
27
Appendix 2. Workflow for Region Recognition Step 1: Download OpenJump application for Windows-64-bit
Web-link: http://openjump.org/
OR
Download and extract OpenJump_v1.8 application from the given package (.zip)
Step 2. Extract the application on your local derive
C:\\ or D:\\
Step 3. You need to install the Matlab Compiler Runtime 2014a for Windows 64-bit.
http://www.mathworks.com/products/compiler/mcr/
OR
Download and install Matlab Compiler from the given zip package recognition of
individual symbols
Step 4. Extract the recognition system (files) from the package and store on your local
derive
e.g. C:\\sketchClassifer\
Step 5. Download also the plug-in (sketchClassifier.jar) and put the jar file in the folder:
\OpenJump_vx.x\lib\ext
Step 6. Create file "info" on your C: derive
C:\\info
Step 7. Add the following paths in the info file
1. MATLAB compiler
e.g. C:\\Program Files\\MATLAB\\MATLAB Compiler Runtime\\v83
2. UnderstandSketchMap.exe (inside the sketchClassifier folder)
e.g. C:\\sketchClassifer\UnderstandSketchMap.exe
Step 8. Go to the sketchClassifer\SM folder and create one folder
Step 9. Put the sketch map (.png) in the created folder.
NOTE: (the file name must be same as folder name), i.e. SM\SM1\SM1.png
Step 10. Open the OpenJump application by double clicking on OpenJUMP.exe
- you will see sketchClassifier under the "TOOL" menu
- Menu: \Tools\sketchClassifer\Step 1: process Sketch map\

H2020 its4land 687828 D3.2 Object Recognition
28
Step 11. To process, load the sketch map in the OpenJump layer
e.g. file\open and select the SM1.png
Step 12. After loading the sketch map, click
\Tools\sketchClassifer\Step 1: process Sketch map\
Step 13. You will receive message, please click on the massage and wait!

H2020 its4land 687828 D3.2 Object Recognition
29
Step 14. The process will create shape files of the recognized objects in the same folder
where you have saved your sketch map.
Step 15. To see the recognition results, you can load shape files or segmentation and
classification images in the OpenJUMP layers.
Figure 6. shows image segmentation, classification, and vectorization of sketched elements.