Embed Size (px)
Citation preview

INCO-CT-2006-517673 Specific Measures in Support of International Cooperation (INCO)- Mediterranean Partner
Countries (MPC)
INECO Institutional and Economic Instruments for Sustainable
Water Management in the Mediterranean Region Coordination Action
DELIVERABLE 4 ADAPTED INDICATORS FOR INSTITUTIONAL FRAMEWORK
ASSESSMENT IN AN IWRM CONTEXT Due date of deliverable 30/06/2007
Actual submission date 28/09/2007
Start date of project 01/07/2006 Duration 36 months
Organisation name of lead contractor for this deliverable
NTUA – National Technical University of Athens
Author(s) and main contributors Ms. G.Z. Chalvatzi (NTUA) Mr. Aggelos Panagiotakis (NTUA) Prof. Dionysis Assimacopoulos (NTUA) Dr. Ioannis Glekas (Aeoliki Ltd, Cyprus) Mr. Charis Omorphos (WDD, Cyprus) Mr. Ahmed Bouzid (CITET, Tunisia) Mr. Belgacem Hanchi (CITET, Tunisia) Dr. Fathy El Gamal (WMRI, Egypt) Prof. Samy El-Fellaly (MALR, Egypt) Prof. Magdy Abou Rayan (IC, Egypt) Mr. Claude Tabbal (C&D, Lebanon) Ms. Roula Sleiman (C&D, Lebanon) Mr. Malek Haddad (SIC, Syrian Arab Republic) Mr. Khatim Kherraz (ABHCSM, Algeria) Dr. Abderrahmane Affia (ISKANE, Morocco)
Revision FINAL
Project co-funded by the European Commission within the Sixth Framework Programme (2002-2006) Dissemination Level
PU Public X PP Restricted to other programme participants (including the Commission Services) RE Restricted to a group specified by the consortium (including the Commission Services) CO Confidential, only for members of the consortium (including the Commission Services)
Deliverable 4 Date: 25/09/2007 Version: Final, Dissemination Level: PU 2/74
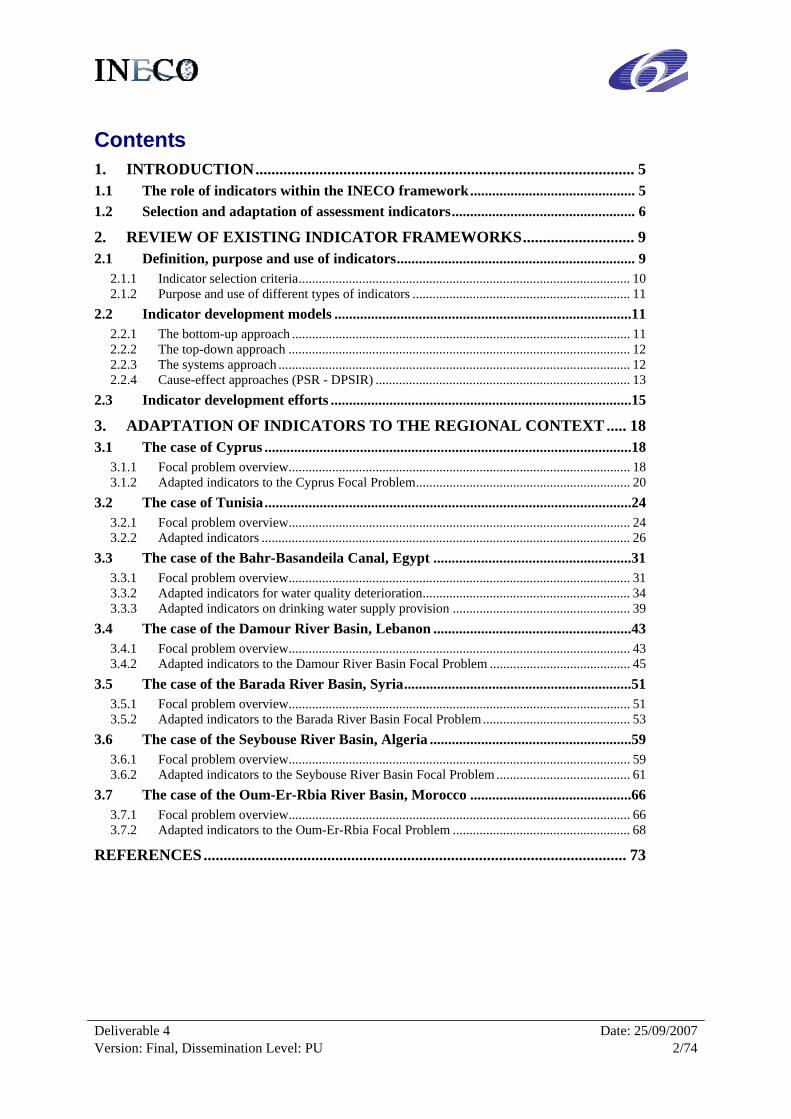
Contents 1. INTRODUCTION ............................................................................................... 5 1.1 The role of indicators within the INECO framework ............................................. 5 1.2 Selection and adaptation of assessment indicators .................................................. 6 2. REVIEW OF EXISTING INDICATOR FRAMEWORKS ............................ 9 2.1 Definition, purpose and use of indicators ................................................................. 9
2.1.1 Indicator selection criteria ................................................................................................... 10 2.1.2 Purpose and use of different types of indicators ................................................................. 11
2.2 Indicator development models .................................................................................11 2.2.1 The bottom-up approach ..................................................................................................... 11 2.2.2 The top-down approach ...................................................................................................... 12 2.2.3 The systems approach ......................................................................................................... 12 2.2.4 Cause-effect approaches (PSR - DPSIR) ............................................................................ 13
2.3 Indicator development efforts ..................................................................................15 3. ADAPTATION OF INDICATORS TO THE REGIONAL CONTEXT ..... 18 3.1 The case of Cyprus ....................................................................................................18
3.1.1 Focal problem overview ...................................................................................................... 18 3.1.2 Adapted indicators to the Cyprus Focal Problem ................................................................ 20
3.2 The case of Tunisia ....................................................................................................24 3.2.1 Focal problem overview ...................................................................................................... 24 3.2.2 Adapted indicators .............................................................................................................. 26
3.3 The case of the Bahr-Basandeila Canal, Egypt ......................................................31 3.3.1 Focal problem overview ...................................................................................................... 31 3.3.2 Adapted indicators for water quality deterioration .............................................................. 34 3.3.3 Adapted indicators on drinking water supply provision ..................................................... 39
3.4 The case of the Damour River Basin, Lebanon ......................................................43 3.4.1 Focal problem overview ...................................................................................................... 43 3.4.2 Adapted indicators to the Damour River Basin Focal Problem .......................................... 45
3.5 The case of the Barada River Basin, Syria ..............................................................51 3.5.1 Focal problem overview ...................................................................................................... 51 3.5.2 Adapted indicators to the Barada River Basin Focal Problem ............................................ 53
3.6 The case of the Seybouse River Basin, Algeria .......................................................59 3.6.1 Focal problem overview ...................................................................................................... 59 3.6.2 Adapted indicators to the Seybouse River Basin Focal Problem ........................................ 61
3.7 The case of the Oum-Er-Rbia River Basin, Morocco ............................................66 3.7.1 Focal problem overview ...................................................................................................... 66 3.7.2 Adapted indicators to the Oum-Er-Rbia Focal Problem ..................................................... 68
REFERENCES .......................................................................................................... 73

Deliverable 4 Date: 25/09/2007 Version: Final, Dissemination Level: PU 3/74
Preface This document is Deliverable 4 of the INECO project (Contract No: INCO-CT-2006-517673), and presents the work undertaken in WP 4 of the project for the adaptation of indicators for institutional assessment. The overall aims of the work package were to: • Review existing indicator frameworks for assessing the effectiveness of institutional frameworks
according to the principles of Integrated Water Resources Management. • Adapt those indicator frameworks to the specific physical, socio-economic and institutional
characteristics of the regions analysed within the project. The deliverable has been compiled by the Environmental and Energy Management Research Unit of the School of Chemical Engineering of the National Technical University of Athens, and is structured in three chapters: • Chapter 1, Introduction, provides an overview of the role for assessment indicators within the
project, emphasizing upon the context of their adaptation to the specific regional case study contexts;
• Chapter 2 provides a review of existing indicator frameworks, based on literature information on:
o Definition, purpose and use of indicators; o Most popular indicator development models, namely the bottom-up, the top-down, the
system, and the cause-effect approaches; o Current indicator development efforts including efforts from international organisations to
specify, select, and categorise indicators so as to enable their use in water related projects. • Chapter 3 focuses on the adaptation of IWRM indicators to the regional context within INECO
project. Each section of the chapter provides an overview of the focal problem in each region followed by a set of indicators, selected to describe the problem causes and effects. Regional information on the focal water management problems has been provided by the corresponding INECO Partners, namely:
o Aeoliki ltd and the Water Development Department of the Ministry of Agriculture, Natural Resources and the Environment, provided background descriptions on the Cyprus Case;
o The Tunis International Center for Environmental Technologies provided the description of the Tunisia Case;
o International Consultants – Egypt, and the Ministry of Agriculture and Land Reclamation provided an overview of the case study for the Bahr Basandeila area, Egypt;
o Conseil et Developpement s.a.l contributed with the description of the water stress issue experienced in the Damour River Basin, Lebanon;
o Studies and Integration Consulting provided an overview of water pollution issues in the Barada River Basin, Syria;
o The Agence de Bassin Hydrographique Constantinois-Seybousse-Mellegue provided an overview of the Algeria Case Study, in the Seybouse River Basin;

Deliverable 4 Date: 25/09/2007 Version: Final, Dissemination Level: PU 4/74
o ISKANE Ingenierie provided background information on wasteful water use in the Oum Er Rbia River Basin, Morocco.

Deliverable 4 Date: 25/09/2007 Version: Final, Dissemination Level: PU 5/74
1. Introduction 1.1 The role of indicators within the INECO framework INECO is a project which aims at building capacity for constructively engaged Integrated Water Resources Management at the regional/local level. This strategic goal will be attained through the development of participatory processes, which target the initiation of discussions on specific focal water management problems, experienced at the national and/or regional level, in Cyprus, Tunisia, Egypt, Lebanon, Syria, Algeria and Morocco. The focal water management problems which have been selected in each country during the first year of the project are: • Cyprus: Aquifer depletion and sea intrusion; • Tunisia: Groundwater Depletion and salinisation; • Egypt: Water quality deterioration in the region of Bahr Basandeila Canal, of the Dakahlia
Governorate; • Lebanon: Decrease in the total amount of surface and groundwater of adequate quality required
for meeting the water needs of domestic, agricultural and industrial users in the Damour River Basin (water stress);
• Syria: Water pollution related-problems in the Barada River Basin (Greater Damascus Area); • Morocco: Inefficient water use in the Oum Er Rbia River Basin; • Algeria: Water pollution in the Seybousse River Basin;
The adaptation of indicators to the particular socio-economic environment of each region and the context of the above cases is a critical step in the overall INECO Methodology, presented in Figure 2. Specific steps in the overall approach include (a) the analysis of causes and effects associated with each focal water management issue; (b) the definition, through a participatory process, of objectives that should be achieved for addressing the focal water management problem; and (c) the identification and evaluation of alternative institutional and economic instruments that can be applied towards problem mitigation, and the elaboration on the resulting trade-offs. During this process, assessment indicators can provide valuable input by: • Showcasing the relative importance of the problem at hand and its effects, and by depicting the
weight and significance of each of the contributing causes, and thereby assisting in defining priority areas for action;
• Providing a framework for measuring the performance of alternative solutions. Furthermore, within the framework of INECO, the adaptation and development of indicators is considered a significant component of the participatory approach, as depicted in Figure 1. In more detail: • Indicators can be used to measure the identified effects of the focal problem, and thus contribute
to justifying its selection and depicting its importance; • By showcasing the relative importance of the focal problem causes, indicators can be used to
justify and prioritize those objectives that are considered feasible and desired. Horizontal and cross-cutting issues that can be further described in a quantifiable or qualitative way through the use of appropriate indicators include (a) equitable and economically sustainable water use; (b) delegation and decentralization of authority; (c) participation of stakeholders; (d) integrated

Deliverable 4 Date: 25/09/2007 Version: Final, Dissemination Level: PU 6/74
planning; (e) private sector participation and involvement and (f) environmental protection and enforcement through laws, regulations and instruments. Relevant information can be useful in describing governance and institutional issues, directly related to IWRM implementation, which in turn impact on both the focal problem and on the application of different instruments.
Figure 1: Indicators and the participatory approach developed within the framework of INECO
1.2 Selection and adaptation of assessment indicators The selection of appropriate assessment indicators, adapted to the specific features of each case is performed according to the overall approach of the project for the analysis of the current situation and the elaboration on the causes and effects of the issues at hand (Situation and Problem Analysis). Problem analysis involves identifying what the main problems are and establishing the cause and effect relationships which result in, and flow from, these problems (AUSAid 2003). The key purpose of this analysis is to try and ensure that ‘root causes’ are identified and subsequently addressed in the activity design, not just the symptoms of the problem(s). A clear and comprehensive problem analysis provides a sound foundation on which to develop a set of relevant and focused activity objectives. In INECO, problem analysis is performed through one of the main tools used for the process, the “problem tree”. There are two main approaches that can be used to help give focus to the problem analysis, namely: (i) the ‘focal problem’ method, whereby development problems (or constraints) are brainstormed by the group, a core or focal problem is identified, and the cause and effect analysis then pivots around the focal problem; or (ii) the ‘objectives oriented’ method, whereby a broad/high level development objective is specified at the start of the analysis, and constraints to achieving this objective are then brainstormed, analysed and sorted in to a cause and effect logic.

Deliverable 4 Date: 25/09/2007 Version: Final, Dissemination Level: PU 7/74
INECO follows the “focal problem method”: Problem trees, analysing causes and effects are developed by Project Partners, and are subsequently discussed evaluated during individual workshops and meetings, involving local stakeholders, actors, decision-makers and end-users. As the framework of the project evolves around three major water management challenges, (“Sharing”, “Valuing” and “Governing” water), causes to problems are classified into these three broad categories. In more detail: • The “Sharing” dimension of each focal problem is related to issues linked to water allocation,
upstream pollution impacting on downstream users, transboundary water management or inter-basin transfer, competition/conflict among different water user(r)s.
• The “Valuing” dimension is related to issues dealing with recovery of water service costs, environmental taxation, absence of economic incentives etc.
• The “Governing” dimension is linked to overall governance, management and administrative issues, including deficient centralized/decentralized structures, resource stewardship, legislation enforcement, lack of human and/or technical capacity etc.
On the other hand, problem effects (symptoms) are classified into: • Primarily environmental/ecosystemic effects (e.g. increased emissions, loss of biodiversity), • Effects which are primarily socio-economic (e.g. reduced income for specific sectors/users,
increased costs for water supply/treatment, increased health risks, etc.). With the aim of facilitating the comprehensive analysis of water management issues and establish shared terms of reference and understanding of problems, the elaborated problem-tree analysis is complemented with the development of relevant assessment indicators, which describe each cause and effect. Further on, in the forthcoming stages of project development, but most importantly after its conclusion, assessment indicators can also be used for defining objectively verifiable information, used to measure the achievement of objectives through specific actions and strategies adopted for problem mitigation. Towards this end, the following section presents the adaptation of indicators to the regional case study context. Information on the architecture of each focal water management problem was obtained by the corresponding Regional partners. Relevant indicators were selected from different literature sources (e.g. OECD, UNCSD, WWAP). Their selection was based on the following (and at times contradicting) criteria:
• Relevance to the focal problem and the associated issues • Comprehensiveness, ease-of-use and estimation. • Need to address cross-cutting issues, relevant to all cases (i.e. deficiency in the institutional
and economic framework and in legislation enforcement, competition among water use(r)s and water stress).

Deliverable 4 Date: 25/09/2007 Version: Final, Dissemination Level: PU 8/74
Figure 2: From problems to objectives and to the preliminary identification of means for problem mitigation- The case of Cyprus

Deliverable 4 Date: 25/09/2007 Version: Final, Dissemination Level: PU 9/74
2. Review of Existing Indicator Frameworks 2.1 Definition, purpose and use of indicators Within the framework of IWRM indicators are used as tools for gathering, simplifying, quantifying, communicating and creating order within complex data (UNESCO-WWAP, 2003). An indicator is a variable that quantifies a matter of importance for the environmental stability of a region or makes perceptible a trend or phenomenon that is not immediately detectable (Hammond et al, 1995). The growing interest in the use of indicators is closely connected to the increasing complexity of policy problems and the large amount of available data. Indicators are used as the means for monitoring the progress towards sustainable development over time and space and are important in assisting decision-makers and policy-makers at all levels (World Bank, 1997). Similarly, they can be used in comparing results in different areas or countries and examining potential links between changing conditions, human behaviour and policy choices.
‘Indicators for monitoring progress towards sustainable development are needed in order to assist decision-makers and policy-makers at all levels and to increase focus on sustainable development’
(UN Sustainable Development web site). On top of quantitative also qualitative indicators are widely used in order not only to visualise and quantify phenomena of interest, properties and priorities in decision making, but also to provide indication of phenomena not easily quantified. The indicators as the means of quantitatively or qualitatively assessing the importance or/and the impact of several parameters and interventions on environmental stability, include the functions of: • Assessing conditions and trends (often in relation to goals and targets); • Providing information for spatial comparisons; • Providing early warning information; • Prolonging future conditions and trends (Gallopin, 1997).
They are commonly classified as input, output, outcome, and impact indicators. Input indicators refer to monitoring the project-specific resources, while output indicators measure goods and services provided by the project. Both types are often used in planning and monitoring when: • There is an inability, given current knowledge, costs or technologies, to model or monitor
outcomes; • The input indicator (e.g, amount of oil spilled) serves as an early warning indicator whereas
monitoring the associated outcome may be too late; or • The relationship between inputs/outputs (e.g., roads) and outcomes (e.g., wildlife mortality) is
well documented, and it is more efficient to model and monitor the input or output. Outcome indicators refer to the resulting state of the system regardless of the cause and are often used to measure the short-term results of the project as well as its progress toward sustainability (Beasley, 2001), while the impact indicators are used to monitor the longer-term or more pervasive results of the project (UNESCO-WWAP, 2003). Developing ‘good’ indicators, however, is not an easy task; it involves collection, collation and systematization of data. The need for clarity and ease in understanding means that indicators often condense large volumes of data and reduce the complexities of water related issues into simple and

Deliverable 4 Date: 25/09/2007 Version: Final, Dissemination Level: PU 10/74
unambiguous messages. The need for scientific clarity and validity, on the other hand, requires that indicators must simplify without, however, distorting the underlying patterns or losing the vital connections and existing interdependencies. Therefore, indicators should be transparent, testable and scientifically sound. ‘Good’ indicators are easily understandable and, consequently, are often used as tools for raising awareness on water issues that cut across every social and political group (UNESCO-WWAP, 2003).
2.1.1 Indicator selection criteria Before moving to the indicator selection criteria it should be useful to describe the types of data that can be expressed through the use of indicators or sets of indicators. An indicator is a single data value (a variable) or an output value from a set of data (aggregation of variables), describing a system or a process, that can be typically tracked over time. The dominant criterion behind an indicator is the scientific knowledge and judgement. An index is a combination (a mathematical aggregation) of two or more indicators often across different measurement units so as the result is dimensionless. An index aims to provide compact and targeted information for management and policy development. However, defining an index is not always an easy task because it involves assigning weights to diverse parameters which depend of course on the user’s preference. The aggregation procedure itself can be linear or on-linear, additive, multiplicative etc. and it is clear that the index may vary largely depending on the selected approach. A variable is an observed datum derived by using basic statistics or monitoring, such as amount of rainfall or runoff, or number of diarrhoeal cases. Indicators are derived when the basic variables or observed data are aggregated using objective and scientific methods; for example mathematical aggregation. Indicators are selected with a goal or objective in mind and thus they describe the value of a system and the bettering or worsening of the conditions over time. The information derived from indicators can therefore be used to develop appropriate actions. The selection process of sustainability indicators takes into account the purposes of the use of indicators, and the expectations in matters of the information sought to be obtained by each target group involved in the process. Therefore, the indicators have to meet a whole set of criteria, which both ‘condition and limit’ the way they are developed, constructed and used (WHO, 1999). A most essential criterion for an indicator is that it should gather as much information and data as to reassure its user that the parameter in question has been thoroughly examined. Other selection criteria are: • Usefulness for the project purposes; • Direct relevance to project objectives. The first phase in the selection process involves the clear
understanding of the objectives of the project and the problems to be dealt with. A vague or very broad objective may disorient the indicator selection process;
• Limitation in number. It is most effective to be selective and use smaller sets of well-chosen indicators. Using too many indicators risks diluting their usefulness.
• Clarity in design. Clearly defined indicators to avoid confusion in the development or interpretation;
• Realistic collection or development costs. In order to ensure indicators are practical and realistic the cost of data collection should be taken into account;

Deliverable 4 Date: 25/09/2007 Version: Final, Dissemination Level: PU 11/74
• Clear cause and effect links; • High quality and reliability. A ‘good’ indicator should represent a reliable measure, built on a
sound scientific basis; • Appropriate spatial and temporal scale. As project activities may have an impact far beyond the
examined area, the spatial and the temporal scale should be taken into account; • Targets and baselines. The selected indicator should have a clear target in information provision
and should take into account the project baseline, the pre-project conditions (World Bank Environment Department, 1999).
2.1.2 Purpose and use of different types of indicators Indicator values serve different purposes, are used for the systematisation of different types of data, and can be of diverse forms: • Descriptive: The most common type of indicators describing the state of the resource.
Descriptive indicators can be related to available water resources, water demand, internal renewable water resources, and water supply on a global scale. When referring to specific location and context they are used at smaller scale.
• Showing trends: Time series indicators depicting trends r that may provide information on the system’s functionality or its response to management.
• Communication: Indicators that are used as instruments to communicate policy objectives and results to the public, often promoting action.
• Assessment: An indicator value can also be used in comparison to a reference condition representing an ideal or desired state. A reference or assessment indicator can for example be the existence or not of a substance in a water body or of a species in a habitat.
• Predicting the future: When models are linked to indicators, a time series can be extended into estimations for the future, and developed of possible scenarios.
2.2 Indicator development models The most popular indicator development models have been shaped by four approaches, the a) bottom-up approach where starting from big numbers of data define the parameters and the indicators, b) the top-down approach, the logic of which is to follow down from vision to themes and objectives and finally to indicators, c) the systems approach, which analyses different systems’ inflows and outflows and their interrelations, and the d) cause-effect approach, most commonly known as the Pressure-State-Response (PSR) and the Driving force-Pressure–State-Impact-Resource (DPSIR) approaches.
2.2.1 The bottom-up approach The bottom-up approach is starting from a big number of possible indicators and is aimed at concluding to a small and indicative sample of sustainability indicators. The nature of the approach, starting from simple and understandable data, allows the involvement of different actors in the development of indicators and is, therefore, often considered a participatory approach. This approach has been exemplified in the Sustainable Seattle project, which as an early grassroots’ effort has been appraised for its pioneering work in the development of sustainability indicators through a participatory process. The project, which was aimed at moving Seattle towards sustainability with compelling indicators and strategies for action (Sustainable Seattle, 2006), has succeeded in

Deliverable 4 Date: 25/09/2007 Version: Final, Dissemination Level: PU 12/74
identifying, selecting and reaching consensus on a series of indicators with the participation of volunteers, 150 citizens. All indicators had to conform to the criteria of being: • Fundamental to long-term economic, social and environmental health; • Understandable and acceptable by the community; • Of interest and appeal for use by local media; • Statistically measurable (Sustainable Seattle, 1998).
The bottom-up approach has, however, been criticised of failing to inform policy making and of being too reductionist, as all this lumping of information is considered to reduce the ‘internal variability’ of the system, and also of losing the relational issues to other resources and processes (UNESCO-WWAP, 2003).
2.2.2 The top-down approach The top-down approach analyses the overall visions and project objectives into their parameters, interrelated actions and finally into indicators. A commonly used top-down practice is the Log Frame Analysis (LFA), which is an analytical, presentational and management tool that can assist in the design, implementation and evaluation of development projects. As an approach it is aimed at achieving objective-oriented planning and strategy formulation that covers the life span of a specific project, plan, or policy act, through the engagement of participatory processes. As such, the LFA provides a structured, logical approach to analysing existing problems and current situations, setting and prioritising objectives, identifying potential risks in achieving the set objectives, determining the intended results and activities of a project, formulating a strategy and monitoring its implementation (AusGUIDE, 2003). The LFA is conducted in 4 main steps: Situation Analysis: This step includes the analysis of the existing situation and the definition of objectives for addressing real needs. The situation analysis starts with stakeholder analysis and identification of the actual state of affairs within the project; it proceeds with problem identification and analysis, and is completed with the objective analysis. Strategy Analysis: A strategy analysis or analysis of alternatives is a systematic way of identifying and deciding on the most appropriate responses to the existing problems. All alternative strategies must contribute to solving an identified problem, and they must contribute to the attainment of identified guiding objectives. The choice of the most appropriate strategy takes into account the overall concepts, strategic plans, objectives, interests of the target groups and organisation, methods, procedures and processes, technologies and services, actions and final outputs. Project Planning Matrix: The Project Planning Matrix is developed based on the strategy analysis and includes the goals, purpose, inputs/activities, and outputs/results of the selected strategy. It provides a summary of the assumptions, concludes on specific indicators, and verifies the processes to be followed in the strategy implementation phase. Implementation: This covers the operational phase of a project which commences after the strategy formulation and when the response activities initiate in order to achieve the expected outputs/results. The implementation phase is based on a plan of operations (IUCN, 1997).
2.2.3 The systems approach The system approach analyses the inflows, stock and outflows of an issue before defining indicators, it takes into account the system dynamics and offers a way forward in understanding the behaviour of the system over time. It draws from the concept of system dynamics and offers a way forward in

Deliverable 4 Date: 25/09/2007 Version: Final, Dissemination Level: PU 13/74
understanding the behaviour of a system over time. The approach adheres to the notion that “all systems depend to some degree on the resource-providing and waste-absorbing capacities of their environment”. The overall approach is considered very promising; however it is also thought as complex, vague, and very much in the sphere of “academic research”, and therefore, it is often thought to be non-practical in developing a set of meaningful indicators (UNESCO-WWAP, 2003). Several indicator development efforts have been undertaken for developing a system dynamics approach to the development of indicators for measuring sustainable development at the regional level. Along this framework, the EC-funded INSURE Project, completed in February 2007, aimed at developing a systems dynamic approach for a unified and scientific representation of sustainable development at the regional level. Instead of measuring the ‘symptoms’ through the corresponding indicators, the project tries to get to the ‘causes’ with a more fundamental understanding of the region as a system.
2.2.4 Cause-effect approaches (PSR - DPSIR) The PSR framework was developed by the OECD in 1994, and followed a cause-effect societal response logic exemplified in EIA efforts underway (Pressures, State, Responses) (OECD, 1994). It is based on the assumption that human activities exert a pressure on the environment and thereby affect the quality and quantity of the natural resources (its state). The pressure in turn, causes a response of the society often expressed through environmental, economic and sectoral policies. Pressures can either be direct or indirect. Direct pressures exert from the use of a resource or a discharge of pollutants, whereas indirect pressures result from the activity itself or from trends of environmental significance.
Pollutant andwaste generation
Resource use
Information
Societal Responses(Intentions-Actions)
ECONOMIC,ENVIRONMENTAL& SOCIAL AGENTS
ENVIRONMENT&NATURAL
RESOURCES
HUMAN ACTIVITIES
Information
Societal Responses (Intentions-Actions)
R E S P O N S ES T A T EP R E S S U R E
Indirect pressures Direct pressures
EnergyTransportIndustryAgricultureOthers
Air/ atmosphereWaterLand/ soilBiodiversityNatural resourcesOthers
AdministrationsHouseholdsEnterprises
Sub-nationalNationalInternational
Figure 3 Pressure- State- Response (P-S-R) model (OECD, 1998)
The original concept of the P-S-R approach has experienced some modifications and adjustments; examples are the Driving force-State-Response (DSR) model that was formerly used by UNCSD or the Driving force-Pressure-State-Impact-Response (DPSIR) model that was introduced by the European Environment Agency (EEA) and has receive wide application. The DPSIR clearly defines pressures and management objectives, provides an evaluation of the state of waters and of impacts and consequences on the environment, and makes use of indicators, targeting the identification of viable options/responses/solutions to the problems. In other words, this approach is useful in describing the links between the origins and the impacts of environmental problems (Smeets & Weterinds, 1999).

Deliverable 4 Date: 25/09/2007 Version: Final, Dissemination Level: PU 14/74
The different DPSIR elements are closely linked and interrelated between them, and are used in such a way that takes into account not only the environmental and physical aspects and impacts on humans, but also the economic and social aspects. DPSIR was engaged in the CIS Guidance Document No 3, as a means of the identification of responses based on the analysis of the state of the environment and the impacts of the driving forces and pressures upon it (Borja et al., 2005). The developed indicators are particularly aimed at providing information on water management and system performance, set priorities in policy making and support policy development, monitor and evaluate effectiveness and efficiency of policy responses/instruments, and can be categorised as: • Indicators on Water Stress (UNESCO - WWAP, 2003; Plan Bleu, 1996; Department of
Environmental Affairs and Tourism of South Africa, 1999). • Indicators for the users' perception on water stress (and water allocation) as well as on
acceptance of options (solutions). • Indicators for evaluating Options.
The DPSIR indicators are categorised as: Driving Forces: The driving forces are expressed through indicators on natural conditions affecting water conditions, human influences in the water resources of region, social, demographic, and economic developments. Pressures: Pressures describe developments in release of pollutants to the water bodies, the use of water resources and land. Pressures are described through indicators to measure the natural supply of water to a catchment area, the anthropogenic supply, water demand, and water pollution. State: The state of the environment in an area is directly affected by the driving forces and pressures, and the indicators to assess it are those addressing water quantity and quality issues. Impact: The changes in the state of the environment often have impacts on the water resources, and the social and economic functions. Indicators to assess impacts are related to ecosystem integrity, water use value, and the socio-demographic consequences. Responses: Responses refer to attempts by groups (and individuals) in the society, as well as governmental efforts to prevent, compensate, ameliorate or adapt to changes in the state of the water resources and conditions.
NATURAL CONDITIONSRainfall
EvaporationCatastrophic Events
SUPPLY(natural)
SUPPLY(anthropogenic)
WATER DEMAND
WATER POLLUTION QUALITY
SalinisationEutrophication
Toxic CompoundsInfectious organisms
Sedimentation
GroundwaterRivers
WetlandsEstuaries
Reservoirs
QUANTITY
Water Balance
USE VALUESocialHealth
RecreationDomestic Use
EconomicAgriculturalIndustrialTourist
RESPONSESPolicy and Management Options
DEVELOPMENT & ECONOMIC ACTIVITY
Population GrowthWaste GenerationLand Use Change
ECOSYSTEM INTEGRITYGroundwater
RiversWetlandsEstuaries
DRIVERS PRESSURES STATE IMPACTS
Figure 4 Schematization of the DPSIR framework in IWRM (Walmsley, 2002)
Deliverable 4 Date: 25/09/2007 Version: Final, Dissemination Level: PU 15/74
The main drawback in applying the DPSIR framework is that it often fails to take the entire system into consideration due to the subjectivity in understanding the categorisation of indicators as drivers, pressures, state, impacts, and responses (UNESCO-WWAP, 2003).
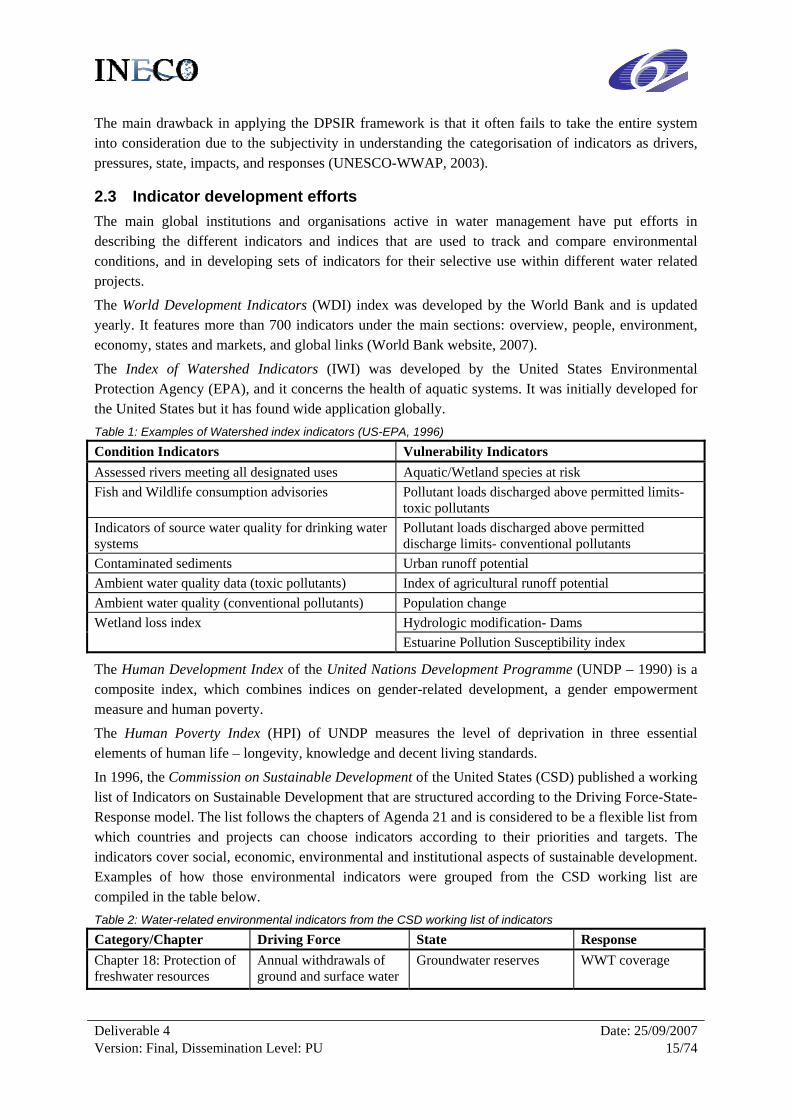
2.3 Indicator development efforts The main global institutions and organisations active in water management have put efforts in describing the different indicators and indices that are used to track and compare environmental conditions, and in developing sets of indicators for their selective use within different water related projects. The World Development Indicators (WDI) index was developed by the World Bank and is updated yearly. It features more than 700 indicators under the main sections: overview, people, environment, economy, states and markets, and global links (World Bank website, 2007). The Index of Watershed Indicators (IWI) was developed by the United States Environmental Protection Agency (EPA), and it concerns the health of aquatic systems. It was initially developed for the United States but it has found wide application globally. Table 1: Examples of Watershed index indicators (US-EPA, 1996)
Condition Indicators Vulnerability Indicators Assessed rivers meeting all designated uses Aquatic/Wetland species at risk Fish and Wildlife consumption advisories Pollutant loads discharged above permitted limits-
toxic pollutants Indicators of source water quality for drinking water systems
Pollutant loads discharged above permitted discharge limits- conventional pollutants
Contaminated sediments Urban runoff potential Ambient water quality data (toxic pollutants) Index of agricultural runoff potential Ambient water quality (conventional pollutants) Population change Wetland loss index Hydrologic modification- Dams
Estuarine Pollution Susceptibility index
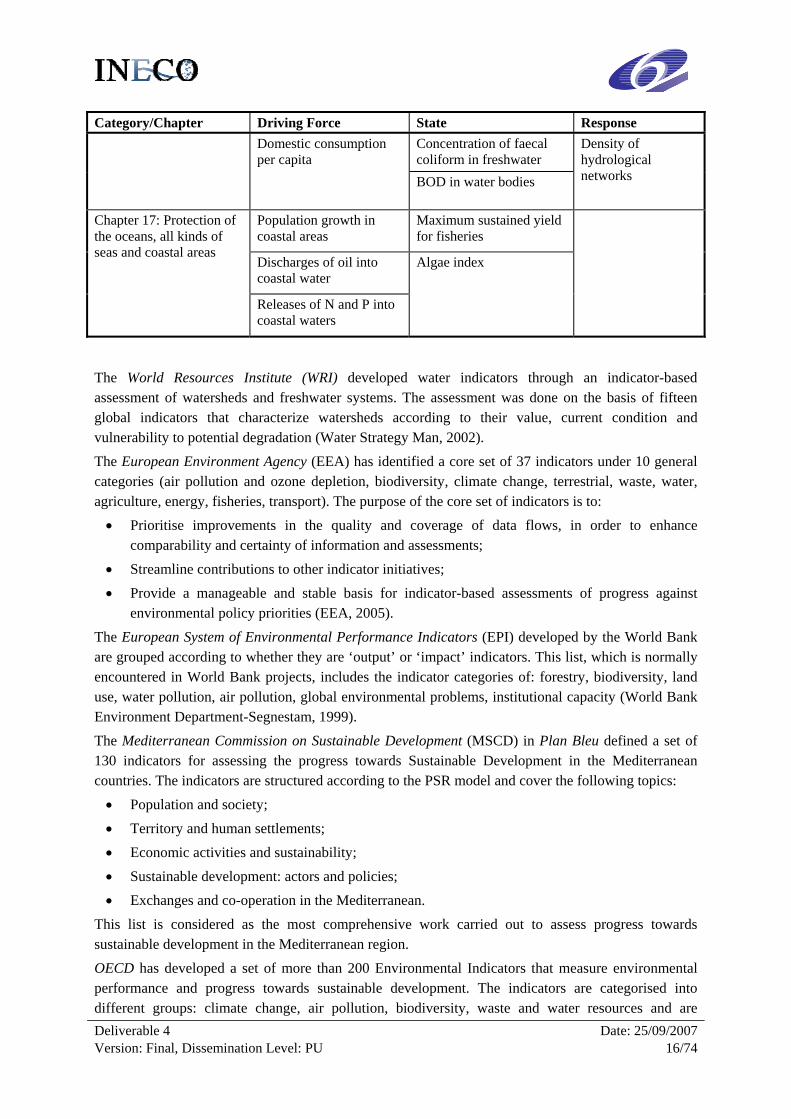
The Human Development Index of the United Nations Development Programme (UNDP – 1990) is a composite index, which combines indices on gender-related development, a gender empowerment measure and human poverty. The Human Poverty Index (HPI) of UNDP measures the level of deprivation in three essential elements of human life – longevity, knowledge and decent living standards. In 1996, the Commission on Sustainable Development of the United States (CSD) published a working list of Indicators on Sustainable Development that are structured according to the Driving Force-State-Response model. The list follows the chapters of Agenda 21 and is considered to be a flexible list from which countries and projects can choose indicators according to their priorities and targets. The indicators cover social, economic, environmental and institutional aspects of sustainable development. Examples of how those environmental indicators were grouped from the CSD working list are compiled in the table below. Table 2: Water-related environmental indicators from the CSD working list of indicators
Category/Chapter Driving Force State Response Chapter 18: Protection of freshwater resources
Annual withdrawals of ground and surface water
Groundwater reserves WWT coverage
Deliverable 4 Date: 25/09/2007 Version: Final, Dissemination Level: PU 16/74
Category/Chapter Driving Force State Response Domestic consumption per capita
Concentration of faecal coliform in freshwater
Density of hydrological networks BOD in water bodies
Chapter 17: Protection of the oceans, all kinds of seas and coastal areas
Population growth in coastal areas
Maximum sustained yield for fisheries
Discharges of oil into coastal water
Algae index
Releases of N and P into coastal waters
The World Resources Institute (WRI) developed water indicators through an indicator-based assessment of watersheds and freshwater systems. The assessment was done on the basis of fifteen global indicators that characterize watersheds according to their value, current condition and vulnerability to potential degradation (Water Strategy Man, 2002). The European Environment Agency (EEA) has identified a core set of 37 indicators under 10 general categories (air pollution and ozone depletion, biodiversity, climate change, terrestrial, waste, water, agriculture, energy, fisheries, transport). The purpose of the core set of indicators is to: • Prioritise improvements in the quality and coverage of data flows, in order to enhance
comparability and certainty of information and assessments; • Streamline contributions to other indicator initiatives; • Provide a manageable and stable basis for indicator-based assessments of progress against
environmental policy priorities (EEA, 2005). The European System of Environmental Performance Indicators (EPI) developed by the World Bank are grouped according to whether they are ‘output’ or ‘impact’ indicators. This list, which is normally encountered in World Bank projects, includes the indicator categories of: forestry, biodiversity, land use, water pollution, air pollution, global environmental problems, institutional capacity (World Bank Environment Department-Segnestam, 1999). The Mediterranean Commission on Sustainable Development (MSCD) in Plan Bleu defined a set of 130 indicators for assessing the progress towards Sustainable Development in the Mediterranean countries. The indicators are structured according to the PSR model and cover the following topics: • Population and society; • Territory and human settlements; • Economic activities and sustainability; • Sustainable development: actors and policies; • Exchanges and co-operation in the Mediterranean.
This list is considered as the most comprehensive work carried out to assess progress towards sustainable development in the Mediterranean region. OECD has developed a set of more than 200 Environmental Indicators that measure environmental performance and progress towards sustainable development. The indicators are categorised into different groups: climate change, air pollution, biodiversity, waste and water resources and are

Deliverable 4 Date: 25/09/2007 Version: Final, Dissemination Level: PU 17/74
structured according to the PSR model. The OECD work focuses primarily on indicators to be used on national and international level. The water related core indicators are subdivided into freshwater quality indicators and indicators for water resources and are summarised below. Table 3 OECD core indicators for freshwater quality
Issue Indicator Type Eutrophication Emissions of N and P in water and soil P
N and P from fertiliser and livestock P Nutrient balance P BOD/ DO in inland waters S Concentration of N and P in inland waters S Population connected to secondary and/or tertiary WWTP R User charges for WWT R Market-share of phosphate free detergents R
Toxic contamination Emissions of heavy metals P Emissions of organic compounds P Consumption of pesticides P Concentration of heavy metals and organic compounds in environmental media
P
Acidification Critical loads of pH in water S Water resources Intensity of use of water resources (abstractions/available
resources) P
Frequency, duration, extent of water shortages S Water prices and charges for sewage treatment R
To this core set of indicators a set of sectoral indicators is added related to transport-environment indicators, energy-environment indicators and others. The World Water Assessment Programme (WWAP) of UN developed indicators that are included in the World Water Development Report (WWDR), and are aiming at: • Providing a simple yet meaningful description of the complex water resource phenomena and
management issues as a basis for action by decision-makers and the public; • Providing insight into problems and potentials for integrated water resources management on a
global scale; • Keeping track of developments regarding the state of the water resources and the effectiveness
of the global response in solving problems; • Assessing the impact of water resources development on economic, social, health and
environmental conditions; and • Keeping track of progress in meeting the set targets and goals.
The WWDR has categorised indicators under eleven challenge areas: Promoting health, Protecting ecosystems, Water and cities, Securing food supply, Industry, Energy, Risks, Sharing water, Valuing water, Ensuring knowledge, and Governing water wisely.
Deliverable 4 Date: 25/09/2007 Version: Final, Dissemination Level: PU 18/74
3. Adaptation of Indicators to the Regional Context 3.1 The case of Cyprus
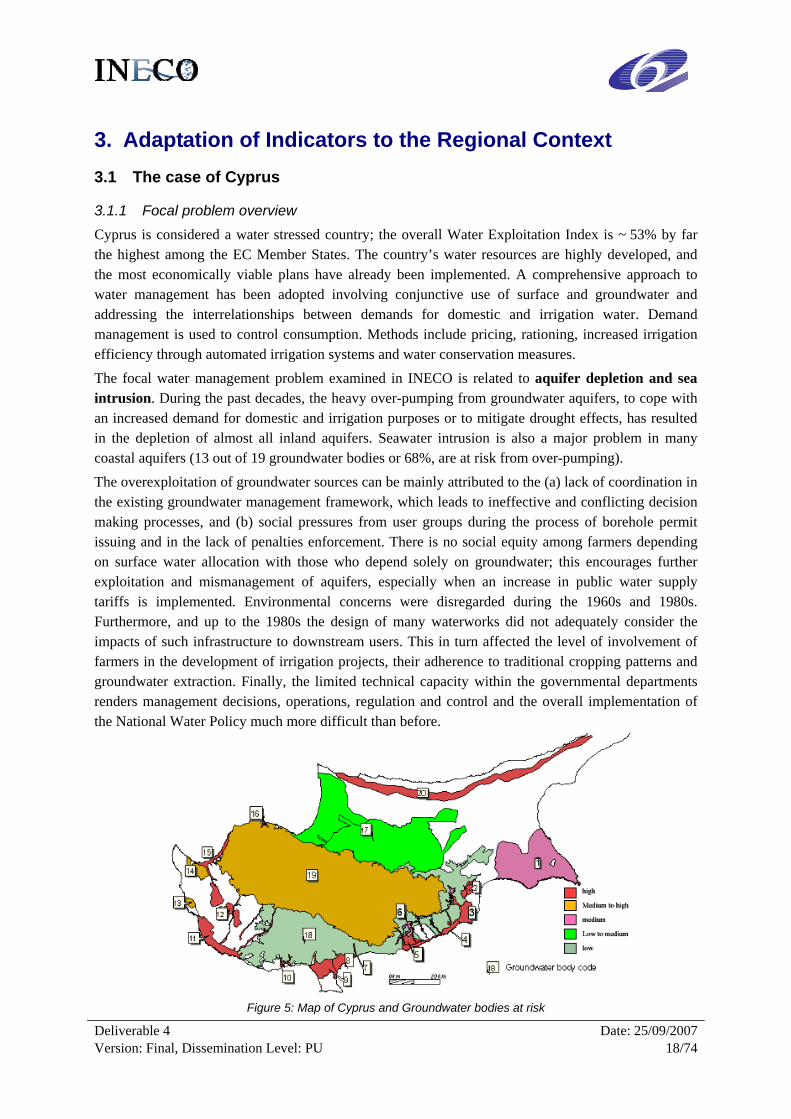
3.1.1 Focal problem overview Cyprus is considered a water stressed country; the overall Water Exploitation Index is ~ 53% by far the highest among the EC Member States. The country’s water resources are highly developed, and the most economically viable plans have already been implemented. A comprehensive approach to water management has been adopted involving conjunctive use of surface and groundwater and addressing the interrelationships between demands for domestic and irrigation water. Demand management is used to control consumption. Methods include pricing, rationing, increased irrigation efficiency through automated irrigation systems and water conservation measures. The focal water management problem examined in INECO is related to aquifer depletion and sea intrusion. During the past decades, the heavy over-pumping from groundwater aquifers, to cope with an increased demand for domestic and irrigation purposes or to mitigate drought effects, has resulted in the depletion of almost all inland aquifers. Seawater intrusion is also a major problem in many coastal aquifers (13 out of 19 groundwater bodies or 68%, are at risk from over-pumping). The overexploitation of groundwater sources can be mainly attributed to the (a) lack of coordination in the existing groundwater management framework, which leads to ineffective and conflicting decision making processes, and (b) social pressures from user groups during the process of borehole permit issuing and in the lack of penalties enforcement. There is no social equity among farmers depending on surface water allocation with those who depend solely on groundwater; this encourages further exploitation and mismanagement of aquifers, especially when an increase in public water supply tariffs is implemented. Environmental concerns were disregarded during the 1960s and 1980s. Furthermore, and up to the 1980s the design of many waterworks did not adequately consider the impacts of such infrastructure to downstream users. This in turn affected the level of involvement of farmers in the development of irrigation projects, their adherence to traditional cropping patterns and groundwater extraction. Finally, the limited technical capacity within the governmental departments renders management decisions, operations, regulation and control and the overall implementation of the National Water Policy much more difficult than before.
Figure 5: Map of Cyprus and Groundwater bodies at risk

Deliverable 4 Date: 25/09/2007 Version: Final, Dissemination Level: PU 19/74
Figure 6: Problem tree analysis for aquifer depletion and sea intrusion in Cyprus

Deliverable 4 Date: 25/09/2007 Version: Final, Dissemination Level: PU 20/74
3.1.2 Adapted indicators to the Cyprus Focal Problem
1. Total groundwater abstraction / Groundwater recharge
Definition (indicators): Groundwater recharge can be defined in a broad sense as ‘the addition of water to a groundwater reservoir’. Total groundwater abstraction means the total withdrawal of water from a given aquifer by means of wells, boreholes, springs and other ways for the purpose of public water supply or agricultural, industrial and other usage. Units: % Relevance: C-FP Proposed presentation format: Time series, per aquifer
Reference: Groundwater Resources Sustainability Indicators, IHP - VI Series on Groundwater, No 14, 2007. Available at: http://unesdoc.unesco.org/images/0014/001497/149754E.pdf
2. Change of groundwater quality characteristics (physical-chemical properties, evolution of sea intrusion fronts etc.)
Definition (indicators): Although the physical-chemical properties of water can vary throughout the aquifer, in conditions of regular exploitation, drastic changes in groundwater quality are not expected (including stable isotope composition). Relevance: C-E1 Proposed presentation format: Time series per groundwater system
Reference: Groundwater Resources Sustainability Indicators, IHP - VI Series on Groundwater, No 14, 2007. Available at: http://unesdoc.unesco.org/images/0014/001497/149754E.pdf
3. Groundwater treatment requirements
Definition (indicators): This indicator describes whether groundwater can feasibly be made potable (drinking water), or usable for other purposes (e.g. agricultural water, industrial water, cooling water) with treatment. The classification divides the indicator into three categories according to how extensive a treatment of groundwater is required: • Suitable for specific use without treatment (appropriate quality)
• Simple treatment needed • Technologically demanding treatment needed
The indicator essentially expresses the percentages of the groundwater abstraction i.e. volume for a specific use divided into the above-mentioned categories. Relevance: C-E5 Proposed presentation format: Time series
Reference: Groundwater Resources Sustainability Indicators, IHP - VI Series on Groundwater, No 14, 2007. Available at: http://unesdoc.unesco.org/images/0014/001497/149754E.pdf
4. Water level decline
Definition (indicators): Two alternatives for identifying water level declines are: 1) to detect from a well monitoring network (when available) a consistent and gradual downward trend of water level, or 2) to compare the groundwater level at wells drilled at different times (i.e. compare water level evolution using near wells, but drilled in different period of time.

Deliverable 4 Date: 25/09/2007 Version: Final, Dissemination Level: PU 21/74
Units: m Relevance: C-E2 Proposed presentation format: Time series per aquifer
Reference: Groundwater Resources Sustainability Indicators, IHP - VI Series on Groundwater, No 14, 2007. Available at: http://unesdoc.unesco.org/images/0014/001497/149754E.pdf
5. Groundwater vulnerability
Definition (indicators): Three classes of groundwater vulnerability indicator can be proposed, on the basis of the assessment of three variables (the soil properties, lithology of the unsaturated zone and thickness of the unsaturated zone): 1. Highly vulnerable aquifers: Uppermost water table aquifers overlain by permeable sandy soils
and by permeable unsaturated zone (sand, gravel, sandstone, chalk, limestone) of limited thickness (less than 10 m); deeper aquifers interconnected to the uppermost vulnerable aquifers; aquifers linked to surface water bodies; karstic aquifers; aquifers recharge area; part of aquifers in coastal area affected by seawater intrusion.
2. Moderately vulnerable aquifers: Deeper water table aquifers or semi confined aquifers overlain by less permeable soil (sandy and silty loam, loam, aggregated clay) and less permeable unsaturated zone of thickness between 10 and 30 m.
3. Low and negligibly vulnerable aquifers: Deep confined renewable aquifers overlain by low permeable soil (clay loam, non aggregated clay) and a thick, low permeability unsaturated zone (more than 30 m). Deep mostly non-renewable aquifers with groundwater which is not part of the hydrological cycle under current conditions and during recent geological periods.
Unit: Sum of (areas with different classes of groundwater vulnerability)/Total studied area x 100% Relevance: C-FP, C-E3 Proposed presentation format: Map
Reference: Groundwater Resources Sustainability Indicators, IHP - VI Series on Groundwater, No 14, 2007. Available at: http://unesdoc.unesco.org/images/0014/001497/149754E.pdf
6. Groundwater per use (irrigation, urban and industrial, rural, environmental)
Definition: An understanding of groundwater use will improve management of resources that rely on groundwater for their continued existence, such as groundwater dependent ecosystems. Quantity of groundwater used for irrigation is a direct measure of this pressure and the effectiveness of management responses to it. Units: m3/yr Relevance: C-C12 Proposed presentation format: Time Series
Reference: Australian Government, Department of the Environment and Water Resources, State of Environment data, 2006. Available at: http://www.environment.gov.au
7. Cost of groundwater use for safe drinking, industrial and irrigation water supply
Units: Euro (or national currency)/m3 of water supplied

Deliverable 4 Date: 25/09/2007 Version: Final, Dissemination Level: PU 22/74
Comments: The indicator shows whether the overexploitation of groundwater resources has resulted in significant increase in water prices especially for drinking water supply provision, and whether it has an affect in the groundwater volumes extracted and used. Relevance: C-E5, C-E7, C-C15 Proposed presentation format: Trend charts
8. Groundwater as a percentage of total use of drinking water at national level
Definition (indicators): Data for formulation of the indicator expressing the relation (in percentage) between groundwater and surface water used for public drinking water supplies are available in many countries. The indicator essentially indicates groundwater-dependency. Use of drinking (household) water is based on permits and control by government and municipal authorities, and registered by water supply companies. Units: % Relevance: C-C7 Proposed presentation format: Time series
Reference: Groundwater Resources Sustainability Indicators, IHP - VI Series on Groundwater, No 14, 2007. Available at: http://unesdoc.unesco.org/images/0014/001497/149754E.pdf
9. Abstraction Monitoring
Definition (relevant sub-indicators): (a) existence of water authority(ies) responsible for abstraction licensing/monitoring and area covered by each; (b) existence of water meters at (1) user-level (2) abstraction points; (c) number of people employed in abstraction monitoring/licensing (d) number of checks (times/year) in correlation to abstraction points. Comments: - Relevance: C-C3, C-C5, C-C6, C-C16
Reference: Various literature sources
10. Dependence of agricultural population on groundwater (Number of farmers dependent on groundwater for agriculture activities/Total population)
Definition (indicators): The proposed indicator is designed to signify the importance of groundwater in rural livelihoods and household incomes. It indicates the percentage of a country’s population that depends on groundwater for supporting livelihoods and household income. The following supplementary indicators could also be designed: 1) number of farmers using groundwater for agricultural activities/number of people engaged in farming and stock rearing, and 2) number of people engaged in farming and stock rearing/population of the country. Unit: % Relevance: C-C12 Proposed presentation format: Time series
Reference: Groundwater Resources Sustainability Indicators, IHP - VI Series on Groundwater, No 14, 2007. Available at: http://unesdoc.unesco.org/images/0014/001497/149754E.pdf
11. Sustainable and Developed groundwater yield
Definition: The sustainable yield can indicate environmental stress on an aquatic ecosystem if water extraction is greater than the sustainable yield. Sustainable yield can also be used to help

Deliverable 4 Date: 25/09/2007 Version: Final, Dissemination Level: PU 23/74
identify aquatic systems where water use can be increased in a sustainable manner. Developed yield is the average annual volume of water that can be diverted for use with the existing infrastructure. Units: m3/yr Relevance: C-C3 Proposed presentation format: Time Series per aquifer
Reference: Australian Government, Department of the Environment and Water Resources, State of Environment data, 2006. Available at: http://www.environment.gov.au
12. Produced wastewater volume from domestic, industrial and other sectors
Definition: Total wastewater volume produced Units: m3/yr Relevance: C-C11 Proposed presentation format: Time Series
Reference: FAO, 2006. Available at: http://www.fao.org/landandwater/aglw/waterquality/waterusedb.jsp
13. Crops irrigated with wastewater (crop type, area share and volume used)
Units: Qualitative, hectares & %, m3/yr Relevance: C-C27 Proposed presentation format: Time Series
Reference: FAO, 2006. Available at: http://www.fao.org/landandwater/aglw/waterquality/waterusedb.jsp
14. Wastewater use other than irrigation (type of use, volume used)
Units: Qualitative, m3/yr Relevance: C-C11, C-C12 Proposed presentation format: Time Series
Reference: FAO, 2006. Available at: http://www.fao.org/landandwater/aglw/waterquality/waterusedb.jsp
15. Wastewater treatment coverage for reuse
Definition (relevant indicators): volume of wastewater collected and treated to reuse level/volume of wastewater produced x 100%. Comments: - Relevance: C-C11, C-C27 Proposed presentation format: Trend charts
Reference: City Managers' Association Gujarat, 2001, Urban Indicators and Performance Measurement Programme, available at: http://www.umcasia.org/Downloads/UIPM-10%20cities,%20Guj.pdf and other literature sources

Deliverable 4 Date: 25/09/2007 Version: Final, Dissemination Level: PU 24/74
16. Participation in decision-making
Definition: The percentage of decisions (%) taken by authorities with public involvement. Comments: A formal participatory process might involve: public announcements with receipt and processing of objections; public meetings and consultations; formation of oversight committees involving non-governmental organisations and public representatives. The indicator aims at measuring the degree of actual involvement of the public in the decision-making processes. Relevance: C-C22, C-C26 Proposed presentation format: Graphs, Trend charts
Reference: UNCHS. http://www.urbanobservatory.org/indicators/guidelines/comprehensive; ICLEI, 2000. Measuring Progress, Cities 21: Pilot Project Final Report; and http://www.ceroi.net/ind/display.asp?setID=&indID=31
3.2 The case of Tunisia
3.2.1 Focal problem overview Water scarcity in Tunisia is becoming more and more severe, as a result of population growth, rising living standards, and accelerated urbanization, which pose a threat on the sustainability of water abstractions and agricultural activities. The escalating urban water demand has led to an increased utilization of fresh water for domestic purposes and to the production of larger wastewater volumes. In spite of the considerable effort for mobilizing water resources, a strategy which has played a prominent and determinant role in the mitigation of socio-economic impacts of the last 15-year droughts, farmers continue to overexploit phreatic water tables at an average rate of 106%. This has resulted in the current focal problem of groundwater depletion and salinisation. Groundwater depletion is the result of low recharge and overexploitation. The current overpumping patterns are attributed to the operation of illegal boreholes mostly drilled by farmers for irrigation purposes. Presently, there is an overall lack of regulation and control over the operation of private boreholes; the absence of a framework for abstraction metering is mostly due to social issues and political pressure from farmers. The problem is exacerbated by the lack of technical capacity in the agricultural sector, due to limited application of water saving methods in irrigation and the current water-intensive cropping patterns, which lead to wasteful water use. Overexploitation of aquifers is expected to impact negatively the environment and upon agriculture in general, resulting in groundwater quality degradation (salinisation, sea intrusion in coastal aquifers), higher groundwater extraction costs, reduced agricultural production, desertification and abandonment of rural areas. Alternatives and disincentives to groundwater overexploitation can be characterised as inadequate; water reuse is barely practiced, due to the low quality of treated water, soil types and cropping patterns and most importantly due to the farmers unwillingness to accept and pay for treated water. Although experiments on aquifer recharge with treated wastewater have produced encouraging results, awareness campaigns and government subsidies targeted at promoting water reuse have thus far proven inadequate, and, with the exception of public irrigation schemes, they have not adequately addressed the concerns of end-users.

Deliverable 4 Date: 25/09/2007 Version: Final, Dissemination Level: PU 25/74
Aquifer Depletion
Higher cost of agricultural products
Overexploitation of groundwater resources
Illegal borehole drilling & operation
Low cost for groundwater
exploitation vs. other sources
Lack of legislative and institutional
measures
Boreholes are not subject to authorization
unless a loan for equipment is requested
No metering of groundwater
abstractions
Social pressure from sensitive user-groups
Irrational management of groundwater in use
Low efficiency in water use especially in irrigated
agriculture
Water intensive cropping patterns
Low-efficiency in irrigation methods
& practices
Absence of integrated strategic planning in
the agricultural sectorLimited technical
capacity
Lack of regulation and control
Causes
Governing
Effects
Valuing
Sharing Environmental
Socioeconomic
LEGEND
Other
Lack of strategic reserves to cope with
drought events
Drying up of wells and boreholes & groundwater quality degradation and higher
salinization
Need to develop more expensive water supply
sources
Increase in rural unemployment and
migration to urban areas
T-FP
T-E1 T-E2
T-E4 T-E3
T-E5
T-C1
T-C2 T-C3 T-C4
T-C5T-C6
T-C7T-C8
T-C9 T-C10T-C11 T-C12
T-C13T-C14
Figure 7: Problem tree analysis for aquifer depletion in Tunisia

Deliverable 4 Date: 25/09/2007 Version: Final, Dissemination Level: PU 26/74
3.2.2 Adapted indicators
1. Total groundwater abstraction / Groundwater recharge
Definition (indicators): Groundwater recharge can be defined in a broad sense as ‘the addition of water to a groundwater reservoir’. Total groundwater abstraction means the total withdrawal of water from a given aquifer by means of wells, boreholes, springs and other ways for the purpose of public water supply or agricultural, industrial and other usage. Units: % Relevance: T-FP, T-C1 Proposed presentation format: Time series, per aquifer
Reference: Groundwater Resources Sustainability Indicators, IHP - VI Series on Groundwater, No 14, 2007. Available at: http://unesdoc.unesco.org/images/0014/001497/149754E.pdf
2. Change of groundwater quality characteristics (physical-chemical properties, evolution of sea intrusion fronts etc.)
Definition (indicators): Although the physical-chemical properties of water can vary throughout the aquifer, in conditions of regular exploitation, drastic changes in groundwater quality are not expected (including stable isotope composition). Therefore, changes in age and origin of groundwater at specific locations in the aquifer can be an indication of groundwater depletion. Relevance: T-E1 Proposed presentation format: Time series per groundwater system
Reference: Groundwater Resources Sustainability Indicators, IHP - VI Series on Groundwater, No 14, 2007. Available at:
http://unesdoc.unesco.org/images/0014/001497/149754E.pdf
3. Groundwater vulnerability
Definition (indicators): Three classes of groundwater vulnerability indicator can be proposed, on the basis of the assessment of three variables (the soil properties, lithology of the unsaturated zone and thickness of the unsaturated zone): 1. Highly vulnerable aquifers: Uppermost water table aquifers overlain by permeable
sandy soils and by permeable unsaturated zone (sand, gravel, sandstone, chalk, limestone) of limited thickness (less than 10 m); deeper aquifers interconnected to the uppermost vulnerable aquifers; aquifers linked to surface water bodies; karstic aquifers; aquifers recharge area; part of aquifers in coastal area affected by seawater intrusion.
2. Moderately vulnerable aquifers: Deeper water table aquifers or semi confined aquifers overlain by less permeable soil (sandy and silty loam, loam, aggregated clay) and less permeable unsaturated zone of thickness between 10 and 30 m.
3. Low and negligibly vulnerable aquifers: Deep confined renewable aquifers overlain by low permeable soil (clay loam, non aggregated clay) and a thick, low permeability

Deliverable 4 Date: 25/09/2007 Version: Final, Dissemination Level: PU 27/74
unsaturated zone (more than 30 m). Deep mostly non-renewable aquifers with groundwater which is not part of the hydrological cycle under current conditions and during recent geological periods.
Unit: Sum of (areas with different classes of groundwater vulnerability)/Total studied area x 100% Relevance: T-FP, T-E1, T-E2 Proposed presentation format: Map
Reference: Groundwater Resources Sustainability Indicators, IHP - VI Series on Groundwater, No 14, 2007. Available at: http://unesdoc.unesco.org/images/0014/001497/149754E.pdf
4. Water level decline
Definition (indicators): Two alternatives for identifying water level declines are: 1) to detect from a well monitoring network (when available) a consistent and gradual downward trend of water level, or 2) to compare the groundwater level at wells drilled at different times (i.e. compare water level evolution using near wells, but drilled in different period of time. Units: m Relevance: T-E2 Proposed presentation format: Time series per aquifer
Reference: Groundwater Resources Sustainability Indicators, IHP - VI Series on Groundwater, No 14, 2007. Available at:
http://unesdoc.unesco.org/images/0014/001497/149754E.pdf
5. Dependence of agricultural population on groundwater (Number of farmers dependent on groundwater for agriculture activities/Total population)
Definition (indicators): The proposed indicator is designed to signify the importance of groundwater in rural livelihoods and household incomes. It indicates the percentage of a country’s population that depends on groundwater for supporting livelihoods and household income. The following supplementary indicators could also be designed: 1) number of farmers using groundwater for agricultural activities/number of people engaged in farming and stock rearing, and 2) number of people engaged in farming and stock rearing/population of the country. Unit: % Relevance: T-E5 Proposed presentation format: Time series
Reference: Groundwater Resources Sustainability Indicators, IHP - VI Series on Groundwater, No 14, 2007. Available at:
http://unesdoc.unesco.org/images/0014/001497/149754E.pdf
6. Cost of groundwater use for drinking and irrigation water supply
Units: Euro (or national currency)/m3 of water supplied

Deliverable 4 Date: 25/09/2007 Version: Final, Dissemination Level: PU 28/74
Comments: The indicator shows whether the overexploitation of groundwater resources has resulted in significant increase in water prices especially for drinking water supply provision, and whether it has an affect in the groundwater volumes extracted and used. Relevance: T-C8, T-E3, T-E5 Proposed presentation format: Trend charts
7. Total groundwater abstraction / Exploitable groundwater resources
Definition (indicators): The term ‘exploitable groundwater resources’ means the amount of water that can be abstracted annually from a given aquifer under prevailing economic, technological and institutional constrains and environmental conditions. In many countries there is an intention to quantify the exploitable groundwater resources (called also usable groundwater reserves) for the large groundwater basins and aquifers. Relevance: T-C1 Proposed presentation format: Time series, per aquifer
Reference: Groundwater Resources Sustainability Indicators, IHP - VI Series on Groundwater, No 14, 2007. Available at: http://unesdoc.unesco.org/images/0014/001497/149754E.pdf
8. Groundwater per use (irrigation, urban and industrial, rural, environmental)
Definition: An understanding of groundwater use will improve management of resources that rely on groundwater for their continued existence, such as groundwater dependent ecosystems. Quantity of groundwater used for irrigation is a direct measure of this pressure and the effectiveness of management responses to it. Units: m3/yr Relevance: - Proposed presentation format: Time Series
Reference: Australian Government, Department of the Environment and Water Resources, State of Environment data, 2006. Available at: http://www.environment.gov.au
9. Sustainable and Developed groundwater yield
Definition: The sustainable yield can indicate environmental stress on an aquatic ecosystem if water extraction is greater than the sustainable yield. Sustainable yield can also be used to help identify aquatic systems where water use can be increased in a sustainable manner. Developed yield is the average annual volume of water that can be diverted for use with the existing infrastructure. Units: m3/yr Relevance: T-C1, T-C2 Proposed presentation format: Trend charts per aquifer system
Reference: Australian Government, Department of the Environment and Water Resources, State of Environment data, 2006. Available at: http://www.environment.gov.au

Deliverable 4 Date: 25/09/2007 Version: Final, Dissemination Level: PU 29/74
10. Wastewater treatment coverage for reuse
Definition (relevant indicators): volume of wastewater collected and treated to reuse level/volume of wastewater produced x 100%. Comments: - Relevance: - Proposed presentation format: Trend charts
Reference: City Managers' Association Gujarat, 2001, Urban Indicators and Performance Measurement Programme, available at: http://www.umcasia.org/Downloads/UIPM-10%20cities,%20Guj.pdf and other literature sources
11. Percentage of the capacity of wastewater facilities being utilized
Definition: Peak volume of wastewater produced (m3/d)/Total capacity of wastewater facilities (m3/d) x100%. Comments: Capacities and volumes of treated/produced wastewater. Values near 100% indicate that there is need for expansion of existing wastewater treatment facilities or construction of new ones. On the other hand, low values indicate oversizing of existing facilities. The indicator provides a measure of the pressure exerted from urban and industrial wastewater production and discharge. Relevance: - Proposed Presentation Format: Trend charts
Reference: Ge et al., Environmental enforcement and compliance indicators in China, available at: http://www.inece.org/indicators/proceedings/04e_china.pdf
12. Constitutional guarantees to public participation
Units: Qualitative (weak, strong) Comments: The classification is performed according to the following scheme:
♦ Weak: Constitution does not explicitly guarantee right to public participation in decision-making.
♦ Strong: Constitution guarantees the right to public participation in decision-making.
Relevance: T-C10
Reference: World Water Assessment Programme II, Chapter 2: The challenges of water governance, available at: http://www.unesco.org/water/wwap/wwdr2/pdf/wwdr2_ch_2.pdf.
13. Participation in decision-making
Definition: The percentage of decisions (%) taken by authorities with public involvement. Comments: A formal participatory process might involve: public announcements with receipt and processing of objections; public meetings and consultations; formation of oversight committees involving non-governmental organisations and public

Deliverable 4 Date: 25/09/2007 Version: Final, Dissemination Level: PU 30/74
representatives. The indicator aims at measuring the degree of actual involvement of the public in the decision-making processes. Relevance: - Proposed presentation format: Graphs, Trend charts
Reference: UNCHS. http://www.urbanobservatory.org/indicators/guidelines/comprehensive; ICLEI, 2000. Measuring Progress, Cities 21: Pilot Project Final Report; and http://www.ceroi.net/ind/display.asp?setID=&indID=31

Deliverable 4 Date: 25/09/2007 Version: Final, Dissemination Level: PU 31/74
3.3 The case of the Bahr-Basandeila Canal, Egypt
3.3.1 Focal problem overview The Bahr-Basandeila region is located in the Dakahlia Governorate, near the Damietta Branch of the Nile River (Figure 8). The main water resource for the region is Bahr Basandeila Canal, which receives water from the Bahr Shibin, and the El Rayah El Abbassy canals and from the Damietta Branch of the River Nile. The Bahr Basandeila Canal is located at the end of Bahr Shibin Canal. Water from the canal is used for the irrigation of 3,000 acres in the Basandeila village (the main village irrigated by Basandeila Canal). The total length of the water canal network originating from the Bahr Basandeila Canal is estimated at 12 km, whereas the length of the irrigation drainage network in is estimated at 8 km.
The re
gion o
f the B
ahr B
asan
deila
Canal
Figure 8: The location of the Bahr-Basandeila Canal
The region faces water quality problems, similar to those encountered in the Nile water distribution network in general. Waste disposal, heavy use of pesticides, inadequate domestic wastewater treatment, and uncontrolled discharge of industrial effluents have transformed open waterways to repositories and conveyors of liquid waste, and have created major pollution issues. In the region of the Bahr Basandeila Canal, water pollution is mostly due to the discharge of industrial and municipal effluents without prior treatment. Furthermore, current agricultural practices, including the excessive application of fertilizers and pesticides, result in high nutrient concentrations in the canal surface water, and exacerbate eutrophication and water quality deterioration. Large amounts of wastewater (domestic, industrial, and agricultural) are discharged onto land, and from the Bahr Basandeila Canal end up in the Damietta Branch of the River Nile, posing a serious threat on human health, agricultural production, and the river and coastal ecosystems. The primary objective of proposed interventions in Bahr Basandeila Canal would be to secure the required quantity of both surface and groundwater of adequate quality to water users. In order to reach such an objective, industrial and municipal discharges within the region must be controlled, and the allocation of canal surface water should be rationalized. These objectives could be achieved through a series of interventions, ranging from regulatory measures, human, technical and institutional capacity building, awareness raising and other

Deliverable 4 Date: 25/09/2007 Version: Final, Dissemination Level: PU 32/74
policy interventions. Figure 9 provides a tentative analysis of the focal problem and its effects and causes.

Deliverable 4 Date: 25/09/2007 Version: Final, Dissemination Level: PU 33/74
Figure 9: Problem tree analysis for water quality degradation in the Bahr-Basandeila Canal

Deliverable 4 Date: 25/09/2007 Version: Final, Dissemination Level: PU 34/74
3.3.2 Adapted indicators for water quality deterioration
1. Water quality and pollution in surface (rivers, lakes, canals) and groundwater
Definition (relevant indicators): Measured concentrations of (a) nitrate in groundwater, (b) organic matter in rivers/canals (c) nutrients in rivers/canals (d) heavy metals in rivers/canals (g) hazardous substances (chemicals, toxic compounds) in rivers/canals. Load estimations: (a) discharges of hazardous substances, (b) use of fertilizers, (c) discharges of organic matter from point sources, (d) use of pesticides, (e) discharge of oil from refineries and off-shore installations, (f) biological effects of hazardous substances on aquatic organisms, etc. Relevance: E-FP, E-E3, E-E1, E-E2 Proposed presentation format: Trend charts
Reference: European Environment Agency (2003) Europe’s water: An indicator-based assessment, available at: http://reports.eea.europa.eu/topic_report_2003_1/en/Topic_1_2003_web.pdf and other sources.
2. Health incidents linked to inadequate water treatment and lack of sanitation
Definition (indicators): Total number of outbreaks and corresponding number of cases (incidents) Relevance: E-E4 Proposed presentation format: Tabular (year, number of outbreaks and number of cases)
Reference: World Health Organization, Surveillance and investigation of contamination incidents and waterborne outbreaks, available at: http://www.who.int/water_sanitation_health/dwq/9241546301_chap7.pdf
3. Sewerage network coverage
Definition (relevant indicators): % population served by sewerage network, % population served by septic tanks, % population served by open drains. Comments: The indicators provide a measure of the pressure exerted from urban wastewater production. In addition, the trend of population connected to the sewerage network indicates whether urban wastewater collection and treatment schemes have been (or are being) implemented. Relevance: E-C8, E-C13 Proposed presentation format: Trend charts
Reference: City Managers' Association Gujarat, 2001, Urban Indicators and Performance Measurement Programme, available at: http://www.umcasia.org/Downloads/UIPM-10%20cities,%20Guj.pdf and other literature sources
4. Wastewater treatment coverage
Definition: %Proportion of the wastewater generated by the community receiving acceptable levels of treatment prior to discharge. The treatment of wastewater can be defined as the collection of waste- water from household, commercial, industrial or public premises and its conveyance to a location where it receives

Deliverable 4 Date: 25/09/2007 Version: Final, Dissemination Level: PU 35/74
treatment sufficient to permit its discharge to the environment without adverse impacts on public health and the ecosystem. Comments: The indicator assesses the potential level of pollution from domestic and industrial/commercial point sources entering the aquatic environment, and monitors progress towards reducing this potential within a framework of integrated water resources management. It helps to identify communities where wastewater treatment action is required to protect the ecosystem. The proportion of treated wastewater is the percentage of water consumed and returned to the environment according to established criteria and standards which ensure that it does not impact on the aquatic environment. Within this context, treatment can comprise a wide range of processes including simple screening, sedimentation, biological-chemical processes, or appropriately designed marine discharge. The proportion of domestic waste (sewage) treated in urban areas can be determined on the basis of the quantity of water consumed by households as compared to the capacity of wastewater treatment facilities. It can also be estimated on the basis of areas of a community connected to the sewerage system and the population inhabiting these. In the case of industrial waste a similar approach can be taken for those installations which are connected to a central sewerage system, using water consumption and allowing for the differentiation between process and cooling waters. In many cases, industrial establishments, either discharging their effluents directly or through the public sewerage system, have their own treatment facilities. As far as the efficacy of treatment is concerned, this can only be determined from the performance information for each wastewater treatment plant against established discharge criteria. Relevance: E-C13 Proposed presentation format: Trend charts
References: City Managers' Association Gujarat, 2001, Urban Indicators and Performance Measurement Programme, available at: http://www.umcasia.org/Downloads/UIPM-10%20cities,%20Guj.pdf; Indicators of SD: UN CSD Methodology Sheets, available at: http://esl.jrc.it/envind/un_meths/UN_ME082.htm and other literature sources
5. Percentage of the capacity of wastewater facilities being utilized
Definition: Peak volume of wastewater produced (m3/d)/Total capacity of wastewater facilities (m3/d) x100%. Comments: Capacities and volumes of treated/produced wastewater should ideally include industrial wastewater treatment. Values near 100% indicate that there is need for expansion of existing wastewater treatment facilities or construction of new ones. On the other hand, low values indicate oversizing of existing facilities. The indicator provides a measure of the pressure exerted from urban and industrial wastewater production and discharge. Relevance: E-C13 Proposed Presentation Format: Trend charts
Reference: Ge et al., Environmental enforcement and compliance indicators in China, available at: http://www.inece.org/indicators/proceedings/04e_china.pdf

Deliverable 4 Date: 25/09/2007 Version: Final, Dissemination Level: PU 36/74
6. Cost per sewerage connection
Definition: Total costs/Number of sewerage connections Comments: Total costs comprise capital cost (depreciation of assets and loans), operation and maintenance costs and administrative costs relevant to sewage collection and treatment. Information indicates if relevant costs are high or low. Relevance: E-C19 Proposed presentation format: Trend charts
Reference: City Managers' Association Gujarat, 2001, Urban Indicators and Performance Measurement Programme, available at: http://www.umcasia.org/Downloads/UIPM-10%20cities,%20Guj.pdf
7. % Cost recovery for sewage collection and wastewater treatment services
Definition: Total revenue from sewerage charges/Total cost for sewage collection and wastewater treatment x 100% Comments: Total cost as defined above. Revenues should correspond to sewerage charges ONLY. Indicator related to the financial sustainability of water utilities and their financial capacity for efficient operation and expansion of existing systems. Relevance: E-C17, E-C19 Proposed presentation format: Trend charts
Reference: City Managers' Association Gujarat, 2001, Urban Indicators and Performance Measurement Programme, available at: http://www.umcasia.org/Downloads/UIPM-10%20cities,%20Guj.pdf and other literature sources
8. Contaminant load from industrial activities
Definition: Specific contaminant load (t COD/ € GDP from industrial activities per year). Comments: The indicator shows the relative importance of pollution from industrial activities in comparison to the annual income generated from the sector. Relevance: E-C1, E-C9 Proposed presentation format: Trend charts
Reference: AquaStress IP (2007), Deliverable 2.1.3, Report on indicators for water stress.
9. Manufacturing units with own wastewater treatment plant (%)
Definition: Number of manufacturing units with own wastewater treatment plant/Total number of manufacturing units for which wastewater treatment is required x 100% Comment: The indicator assesses the potential level of pollution from industrial point sources entering the aquatic environment and monitors progress towards reducing this potential. It helps to identify industries where action is required in the area of wastewater treatment to protect the environment. Reference: E-C9 Proposed presentation format: Trend charts
Reference: Measuring Sustainability: Sustainable Development Indicators, http://esl.jrc.it/envind/

Deliverable 4 Date: 25/09/2007 Version: Final, Dissemination Level: PU 37/74
10. Environmental protection investment
Definition: (a) Percentage of total environmental protection investment as share of GDP (%) – (b) Percentage of total public environmental investment over total environmental investment (%). Comments: Environmental investment here should refer to investments in protection from wastewater discharges. The indicator assesses financial commitment to environmental protection. Relevance: E-C17,E-C9 Proposed presentation format: Trend charts
Reference: Ge et al., Environmental enforcement and compliance indicators in China, available at: http://www.inece.org/indicators/proceedings/04e_china.pdf
11. Existence of environmental supervision institutions
Units: YES/NO Relevance: E-C10, E-C11, E-C18
Reference: Ge et al., Environmental enforcement and compliance indicators in China, available at: http://www.inece.org/indicators/proceedings/04e_china.pdf
12. Number of people working for environmental supervision
Comments: The indicator quantifies the technical capacity of environmental supervision authorities to monitor and control dischargers (industries, utilities etc.) Relevance: E-C10, E-C11, E-C18
Reference: Ge et al., Environmental enforcement and compliance indicators in China, available at: http://www.inece.org/indicators/proceedings/04e_china.pdf
13. Total number of violations vs. total number of inspections (for wastewater discharge)
Comments: The indicator is used to assess the performance of environmental supervision institutions (technical capacity). It should be noted that such activity indicators do not draw a complete picture of the effectiveness of enforcement efforts as it is impossible to discern the actual compliance rates. Relevance: E-C10, E-C11, E-C18 Proposed Presentation Format: Trend charts
Reference: Ge et al., Environmental enforcement and compliance indicators in China, available at: http://www.inece.org/indicators/proceedings/04e_china.pdf and & http://www.unece.org/env/epr/studies/moldova_2/chapter02.pdf
14. Rate of pollution levy collected vs. the one supposed to be collected
Comments: Similar to indicator above. Relevance: E-C10, E-C11, E-C18, E-C12 Proposed Presentation Format: Trend charts
Reference: Ge et al., Environmental enforcement and compliance indicators in China, available at: http://www.inece.org/indicators/proceedings/04e_china.pdf and & http://www.unece.org/env/epr/studies/moldova_2/chapter02.pdf

Deliverable 4 Date: 25/09/2007 Version: Final, Dissemination Level: PU 38/74
15. Legislative compliance
Definition(s): Dischargers complying to discharge emission standards/Total dischargers inspected (%) Comments: Information indicates the level of compliance of industries to legislation standards. Values depend on the number of inspections and are indicative of actual compliance. Relevance: E-C10, E-C11, E-C18 Proposed presentation format: Trend charts
Reference: Ge et al., Environmental enforcement and compliance indicators in China, available at: http://www.inece.org/indicators/proceedings/04e_china.pdf
16. Constitutional guarantees to public participation
Units: Qualitative (weak, strong) Comments: The classification is performed according to the following scheme:
♦ Weak: Constitution does not explicitly guarantee right to public participation in decision-making.
♦ Strong: Constitution guarantees the right to public participation in decision-making.
Relevance: E-C4, E-C5, E-C16
Reference: World Water Assessment Programme II, Chapter 2: The challenges of water governance, available at: http://www.unesco.org/water/wwap/wwdr2/pdf/wwdr2_ch_2.pdf.
17. Comprehensiveness of notice and comment in different types of decision-making processes
Units: Qualitative (weak, intermediate, strong) Comments: The classification is performed according to the following scheme:
♦ Weak: Types of policy-and project-level decisions requiring public notice and comment are not specified.
♦ Intermediate: Types of project-level decisions requiring public notice and comment are specified but types of policy-level decisions are not.
♦ Strong: Types of both policy- and project-level decisions requiring public notice and comment are specified.
Relevance: E-C4, E-C5, E-C16
Reference: World Water Assessment Programme II, Chapter 2: The challenges of water governance, available at: http://www.unesco.org/water/wwap/wwdr2/pdf/wwdr2_ch_2.pdf.
18. Public notice and common requirements for Environmental Impact Assessments (EIAs)
Units: Qualitative (weak, intermediate, strong) Comments: The classification is performed according to the following scheme:
♦ Weak: No requirement for public notice and comment for Environmental Impact Assessments.
♦ Intermediate: EIAs require public notice and comment at final stage. ♦ Strong: EIAs require public notice and comment at various stages.

Deliverable 4 Date: 25/09/2007 Version: Final, Dissemination Level: PU 39/74
Relevance: E-C4, E-C5, E-C16
Reference: World Water Assessment Programme II, Chapter 2: The challenges of water governance, available at: http://www.unesco.org/water/wwap/wwdr2/pdf/wwdr2_ch_2.pdf.
19. Participation in decision-making
Definition: The percentage of decisions (%) taken by authorities with public involvement. Comments: A formal participatory process might involve: (a) public announcements with receipt and processing of objections; (b) public meetings and consultations; (c) formation of oversight committees involving non-governmental organisations and public representatives etc. The indicator aims at measuring the degree of actual involvement of the public in the decision-making processes. Relevance: E-C4, E-C5, E-C16 Proposed presentation format: Graphs, Trend charts
Reference: UNCHS http://www.urbanobservatory.org/indicators/guidelines/comprehensive; ICLEI, 2000. Measuring Progress, Cities 21: Pilot Project Final Report; and http://www.ceroi.net/ind/display.asp?setID=&indID=31
3.3.3 Adapted indicators on drinking water supply provision
20. Per capita water supply
Definition: Total drinking water supply (m3/yr)/Total Population Comments: The indicator is used to quantify water supply consumed per capita, and represents a measure of water availability. Relevance: - Proposed presentation format: Graphs, Trend charts
Reference: City Managers' Association Gujarat, 2001, Urban Indicators and Performance Measurement Programme, available at: http://www.umcasia.org/Downloads/UIPM-10%20cities,%20Guj.pdf and other literature sources
21. Service interruptions
Definition: (a) Average hrs of water supply per day and/or (b) no of supply days per week. Comments: The indicator helps to assess whether water is timely supplied to the citizens. It also indicates the requirement of storage at the city and/or the household level. Relevance: - Proposed presentation format: Graphs, Trend charts
Reference: City Managers' Association Gujarat, 2001, Urban Indicators and Performance Measurement Programme, available at: http://www.umcasia.org/Downloads/UIPM-10%20cities,%20Guj.pdf and other literature sources
22. Withdrawal of groundwater for potable water supply
Definition: Groundwater abstractions for drinking water supply purposes/Total abstractions for drinking water provision

Deliverable 4 Date: 25/09/2007 Version: Final, Dissemination Level: PU 40/74
Comments: The indicator quantifies dependence on groundwater for drinking water supply purposes. Relevance: - Proposed presentation format: Graphs, Trend charts
Reference: City Managers' Association Gujarat, 2001, Urban Indicators and Performance Measurement Programme, available at: http://www.umcasia.org/Downloads/UIPM-10%20cities,%20Guj.pdf and other literature sources
23. Population receiving water supply service (%)
Definition: Population (or households) connected to the piped water supply network vs. total population (or households) x 100% Comments: - Relevance: - Proposed presentation format: Graphs, Trend charts
Reference: City Managers' Association Gujarat, 2001, Urban Indicators and Performance Measurement Programme, available at: http://www.umcasia.org/Downloads/UIPM-10%20cities,%20Guj.pdf and other literature sources
24. Access to safe drinking water - % people with safe drinking water available in their home or with reasonable access
Definition: Proportion of population with access to an adequate amount of safe drinking water in a dwelling or located within a convenient distance from the user’s dwelling (%).This indicator may be also expressed as the percent of population without access to sufficient and safe drinking water. Thus the population indicated in the numerator would be those who do not have access to adequate and safe drinking water. If these data are available in terms of the proportion of households, it should be possible to convert this into a percentage of the population, using average figures for household size. Comments: This indicator requires definitions for several elements: (a) Population covered: This includes urban population served by house connections, urban population without house connections but with reasonable access to public stand posts, and rural population with reasonable access to safe water. (b) Reasonable access to water: This is defined as water supply in the home or within 15 minutes walking distance. Actually a proper definition should be adopted taking into account the local conditions; in urban areas, a distance of not more than 200 metres from a house to a public stand post may be considered reasonable access. In rural areas, reasonable access implies that people do not have to spend a disproportionate part of the day fetching water for the family's needs. (c) Convenient distance: Convenient distance and access are distinct in a sense that there may be access to water but it is not necessarily convenient to fetch the water due to distance. The water should be within a reasonable 200 metres distance from the home. (d) Adequate amount of water: The amount of water needed to satisfy metabolic, hygienic, and domestic requirements. This is usually defined as 20 litres of safe water per person per day. (e) Safe water: The water does not contain biological or chemical agents at concentration levels directly detrimental to health. "Safe water" includes treated surface waters and untreated but uncontaminated water, such as that from protected boreholes, springs, and sanitary wells.
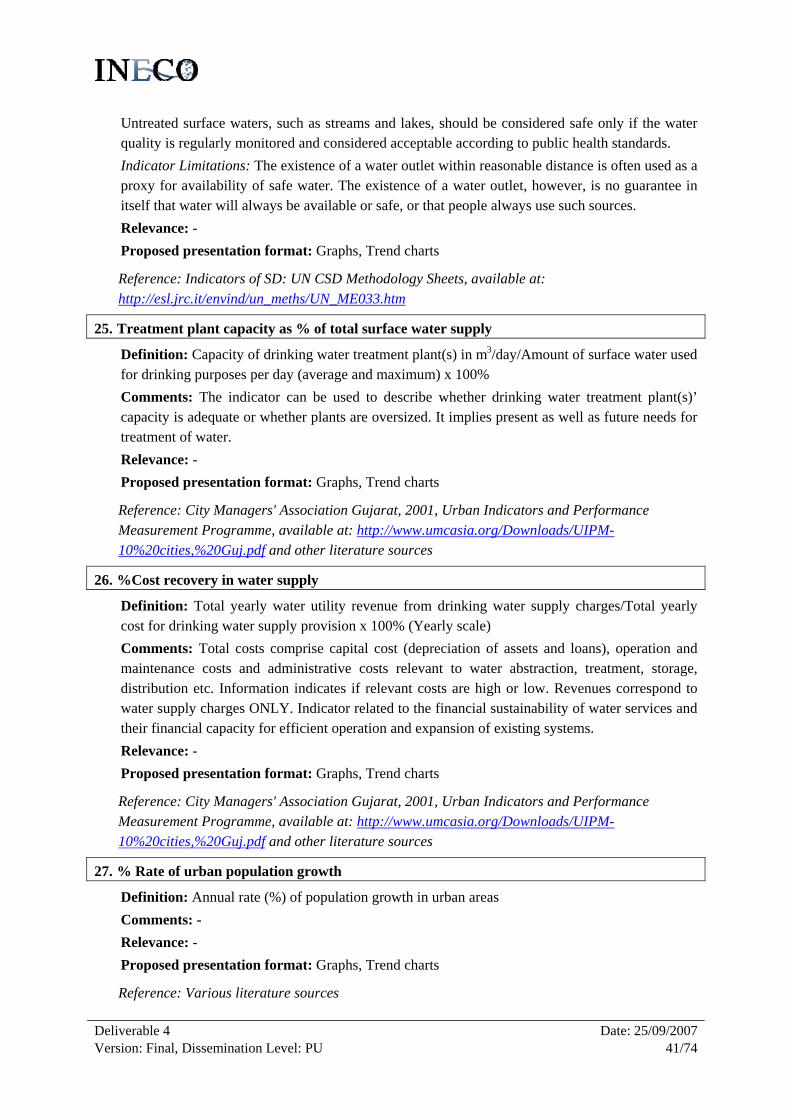
Deliverable 4 Date: 25/09/2007 Version: Final, Dissemination Level: PU 41/74
Untreated surface waters, such as streams and lakes, should be considered safe only if the water quality is regularly monitored and considered acceptable according to public health standards. Indicator Limitations: The existence of a water outlet within reasonable distance is often used as a proxy for availability of safe water. The existence of a water outlet, however, is no guarantee in itself that water will always be available or safe, or that people always use such sources. Relevance: - Proposed presentation format: Graphs, Trend charts
Reference: Indicators of SD: UN CSD Methodology Sheets, available at: http://esl.jrc.it/envind/un_meths/UN_ME033.htm
25. Treatment plant capacity as % of total surface water supply
Definition: Capacity of drinking water treatment plant(s) in m3/day/Amount of surface water used for drinking purposes per day (average and maximum) x 100% Comments: The indicator can be used to describe whether drinking water treatment plant(s)’ capacity is adequate or whether plants are oversized. It implies present as well as future needs for treatment of water. Relevance: - Proposed presentation format: Graphs, Trend charts
Reference: City Managers' Association Gujarat, 2001, Urban Indicators and Performance Measurement Programme, available at: http://www.umcasia.org/Downloads/UIPM-10%20cities,%20Guj.pdf and other literature sources
26. %Cost recovery in water supply
Definition: Total yearly water utility revenue from drinking water supply charges/Total yearly cost for drinking water supply provision x 100% (Yearly scale) Comments: Total costs comprise capital cost (depreciation of assets and loans), operation and maintenance costs and administrative costs relevant to water abstraction, treatment, storage, distribution etc. Information indicates if relevant costs are high or low. Revenues correspond to water supply charges ONLY. Indicator related to the financial sustainability of water services and their financial capacity for efficient operation and expansion of existing systems. Relevance: - Proposed presentation format: Graphs, Trend charts
Reference: City Managers' Association Gujarat, 2001, Urban Indicators and Performance Measurement Programme, available at: http://www.umcasia.org/Downloads/UIPM-10%20cities,%20Guj.pdf and other literature sources
27. % Rate of urban population growth
Definition: Annual rate (%) of population growth in urban areas Comments: - Relevance: - Proposed presentation format: Graphs, Trend charts
Reference: Various literature sources

Deliverable 4 Date: 25/09/2007 Version: Final, Dissemination Level: PU 42/74
28. Concentration of faecal coliforms in freshwater1
Definition: The proportion of freshwater resources containing concentrations of faecal coliforms which exceed the levels recommended in the World Health Organization (WHO) Drinking Water Guidelines – (%) Comments: The concentration of faecal coliforms in freshwater bodies is an indirect indicator of contamination with human and animal excreta. Water contaminated with faecal coliforms poses a serious health risk and is therefore unsuitable for potable supply without being disinfected (chlorination). Faecal indicator organisms remain the most sensitive and specific way of assessing the hygienic quality of water. Escherichia coli (E. coli), the thermotolerant and other coliform bacteria, the faecal streptococci and spores of sulphite-reducing clostridia, are common indicators of this type used, with E. coli being the most specific of all indicators. This measure indicates situations where treatment is required or has to be improved to guarantee safety of supply. As population density increases and/or more people are provided from a supply system, safe, potable water becomes more critical. Diarrhoeal diseases, largely the consequence of faecal contamination of drinking water supply, are variously estimated to be responsible for around 80% of morbidity/mortality in developing countries. A prerequisite for development is a healthy community. Ill health not only reduces the work capability of community members but frequent diarrhoeal episodes disrupt children education which, in the longer term, can have serious consequences for sustainable development. Relevance: - Proposed presentation format: Graphs/Trend charts
Reference: Indicators of SD: UN CSD Methodology Sheets, available at: http://esl.jrc.it/envind/un_meths/UN_ME080.htm
29. Water quality tests performed vs. number of water quality tests required
Definition: Number of treated water tests performed per year/Number of treated water tests required per year Comments: Water quality tests include (a) aesthetic tests, (b) mibrobiological tests (c) physical-chemical tests and (d) radioactivity tests (if relevant). The required tests are those specified either by applicable standards or by legislation. If relevant, disaggregated values (per test type) should be provided, to depict deficiencies in water quality monitoring. Relevance: - Proposed presentation format: Graphs/Trend charts
Reference: Alegre H., Hirner W., Baptista J.M., and Parena R., (2000), Performance Indicators for Water Supply Services, IWA Publishing, Manuals of Best Practice Series.
1 Indicators can be developed for all parameters monitored for drinking water. The Appendix provides a list of parameters, which according to recent guidelines, should be monitored at each level of water supply provision.

Deliverable 4 Date: 25/09/2007 Version: Final, Dissemination Level: PU 43/74
30. Compliance of water quality tests
Definition: Number of tests of treated water, performed during a year and complying with the applicable standards and legislation/Total number of tests Comments: Water quality tests include (a) aesthetic tests, (b) mibrobiological tests (c) physical-chemical tests and (d) radioactivity tests (if relevant). In this case it is preferable to provide disaggregated values (per test type), in order to depict quality parameters that do not comply with water quality standards. Relevance: - Proposed presentation format: Graphs/Trend charts
Reference: Alegre H., Hirner W., Baptista J.M., and Parena R., (2000), Performance Indicators for Water Supply Services, IWA Publishing, Manuals of Best Practice Series.
3.4 The case of the Damour River Basin, Lebanon
3.4.1 Focal problem overview The focal water management problem faced in the Damour River Basin is the decrease in the total amount of surface and groundwater of adequate quality required for meeting the water needs of domestic, agricultural and industrial users. The problem is particularly experienced in the downstream irrigated coastal plains of Damour, where farmers complain about the shortage of water during the summer season, as water is abstracted upstream and there are no rules governing water allocation. Groundwater resources are also under stress due to the significant abstractions, especially for inter-basin transfer. The Damour municipality has repeatedly expressed its concern about the increased salinity of groundwater. A more detailed analysis of the problem is presented in Figure 10. The focal problem is caused by several factors including uncontrolled discharges of industrial and domestic wastewater in surface water, uncontrolled surface water allocation, and seawater intrusion in groundwater. These are in turn attributed to limited law enforcement, inadequate regulatory instruments, limited capacities of authorities (particularly for law enforcement), limited financial resources, absence of a clear planning framework, absence of a participation and coordination platform, and inefficient monitoring. Inter-basin transfer of groundwater resources is leading to deterioration of groundwater quality in the coastal area. These issues are further caused by lack of relevant awareness and technical capacity, by social and political pressure from user groups, and lack of integrated management of the water resources of the area. It is expected that the focal problem could further lead to an increased number of conflicts among water users, and to increased social costs incurred from health problems associated with the use of polluted water.

Deliverable 4 Date: 25/09/2007 Version: Final, Dissemination Level: PU 44/74
Error! Objects cannot be created from editing field codes. Figure 10: Problem tree analysis for the focal water management of the Damour River Basin

Deliverable 4 Date: 25/09/2007 Version: Final, Dissemination Level: PU 45/74
3.4.2 Adapted indicators to the Damour River Basin Focal Problem
31. % Water deficiency per use during the peak season (domestic, irrigation, industrial) and overall
Definition: Water supply per use during the peak season/Water demand per use during the peak season x 100% Comments: The spatial and temporal (daily, monthly) scale for the indicator may vary. As the basin experiences problems due to excessive abstraction upstream, it would be useful to calculate the indicator for both the upstream and downstream areas. Relevance: L-FP
Reference: Various literature sources.
32. Water exploitation index
Definition: Total water abstraction for all uses/Annual renewable freshwater resources 100% Comments: The indicator measures the relative pressure of annual production on conventional renewable natural fresh water resources. It is the sum of the volumes of annual conventional renewable freshwater production for all uses, including conveyance losses, divided by the volume of average annual flows of renewable natural water resources. Data should refer to the same year. Relevance: L-FP, L-C3, L-C4
Reference: Plan Bleu (1996), Les indicateurs d’ économie de l’ eau, available at: http://www.unesco.org/ossbv/bib/docs_home/REAGB0025/sommaire.html
33. Water quality and pollution in surface (rivers, lakes), underground, transitional and coastal waters
Definition (relevant indicators): Measured concentrations (a) nitrate in groundwater, (b) organic matter in rivers (c) nutrients in rivers (d) phosphorus in lakes (e) nutrients in coastal and marine waters (f) heavy metals in rivers (g) hazardous substances (chemicals, toxic compounds) in lakes and rivers (h) chlorophyll in coastal and marine waters. Loads: (a) discharges of hazardous substances, (b) use of fertilizers, (c) discharges of organic matter from point sources, (d) loads of nutrients discharged to sea, (e) use of pesticides, (f) discharge of oil from refineries and off-shore installations etc. Relevance: L-FP Proposed presentation format: Trend charts
Reference: European Environment Agency (2003) Europe’s water: An indicator-based assessment, available at: http://reports.eea.europa.eu/topic_report_2003_1/en/Topic_1_2003_web.pdf and other sources.
34. Health incidents linked to inadequate water treatment and lack of sanitation
Definition (indicators): Total number of outbreaks and corresponding number of cases (incidents) Relevance: L-E2 Proposed presentation format: Tabular (year, number of outbreaks and number of cases)

Deliverable 4 Date: 25/09/2007 Version: Final, Dissemination Level: PU 46/74
Reference: World Health Organization, Surveillance and investigation of contamination incidents and waterborne outbreaks, available at: http://www.who.int/water_sanitation_health/dwq/9241546301_chap7.pdf
35. Contaminant load from industrial activities
Definition: Specific contaminant load (t COD/ € GDP from industrial activities per year). Comments: The indicator shows the relative importance of pollution from industrial activities in comparison to the annual income generated from the sector. Relevance: L-C1 Proposed presentation format: Trend charts
Reference: AquaStress IP (2007), Deliverable 2.1.3, Report on indicators for water stress.
36. Manufacturing units with own wastewater treatment plant (%)
Definition: Number of manufacturing units with own wastewater treatment plant/Total number of manufacturing industries x 100% Comment: The indicator assesses the potential level of pollution from industrial point sources entering the aquatic environment and monitors progress towards reducing this potential within an integrated water resources management framework. It helps to identify industries where action is required in the area of wastewater treatment to protect the environment. Reference: L-C1 Proposed presentation format: Trend charts
Reference: Measuring Sustainability: Sustainable Development Indicators, http://esl.jrc.it/envind/
37. Existence of environmental supervision institutions
Units: YES/NO Relevance: L-C14, L-C12
Reference: Ge et al., Environmental enforcement and compliance indicators in China, available at: http://www.inece.org/indicators/proceedings/04e_china.pdf
38. Existence of responsible authorities for issuing and managing discharge permits
Units: YES/NO. Comment: It could also be useful to indicate whether these authorities are independent of water users, as well as the number of authorities and the area/fields covered by each. Relevance: L-C12
Reference: WWAP, World Water Development Report No 1, “Water for people, water for life”, “Chapter 3: The signing process – Indicators mark the way”, available at: http://www.unesco.org/water/wwap/wwdr1/pdf/chap3.pdf .
39. Sewerage network coverage
Definition (relevant indicators): % population served by sewerage network, % population served by septic tanks, % population served by open drains, % volume of wastewater collected and treated.

Deliverable 4 Date: 25/09/2007 Version: Final, Dissemination Level: PU 47/74
Comments: The indicators provide a measure of the pressure exerted from urban wastewater production. In addition, the evolution of population served by sewerage network indicates whether urban wastewater collection and treatment schemes have been (or are being) implemented. Relevance: L-C2, L-C10 Proposed presentation format: Trend charts
Reference: City Managers' Association Gujarat, 2001, Urban Indicators and Performance Measurement Programme, available at: http://www.umcasia.org/Downloads/UIPM-10%20cities,%20Guj.pdf and other literature sources
40. Wastewater treatment
Definition (relevant indicators): volume of wastewater collected and treated/volume of wastewater produced x 100%. Comments: - Relevance: L-C2, L-C10 Proposed presentation format: Trend charts
Reference: City Managers' Association Gujarat, 2001, Urban Indicators and Performance Measurement Programme, available at: http://www.umcasia.org/Downloads/UIPM-10%20cities,%20Guj.pdf and other literature sources
41. % Cost recovery for sewage collection and wastewater treatment
Definition: Total revenue from sewerage charges/Total cost for sewage collection and wastewater treatment x 100% Comments: Total cost comprises capital cost (depreciation of assets and loans), operation and maintenance costs and administrative costs relevant to sewage collection and treatment. Revenues correspond to sewerage charges ONLY. Indicator related to the financial sustainability of water utilities and their financial capacity for efficient operation and expansion of existing systems. Relevance: L-C16, L-C9 Proposed presentation format: Trend charts
Reference: WFD CIS Guidance Document No 1: Economics and the environment – The implementation challenge of the Water Framework Directive, available at: http://circa.europa.eu/Public/irc/env/wfd/library?l=/framework_directive/guidance_documents/guidancesnos1seconomicss/_EN_1.0_&a=d
42. Planning Framework – Existence of river basin management plans
Units: Y/N (Qualitative indicator) Relevance: L-C8, L-C17
Reference: Various literature sources
43. Abstraction Monitoring
Definition (relevant sub-indicators): (a) existence of water authority(ies) responsible for abstraction licensing/monitoring and area covered by each; (b) existence of water meters at (1)
Deliverable 4 Date: 25/09/2007 Version: Final, Dissemination Level: PU 48/74
user-level (2) abstraction points; (c) number of people employed in abstraction monitoring/licensing (d) number of checks (times/year) in correlation to abstraction points. Comments: - Relevance: L-C3, L-C6
Reference: Various literature sources
44. % Unaccounted for water
Definition: (Quantity supplied to a water distribution network – Metered quantity of water used by customers)/ Quantity supplied to a water distribution network x 100% Comments: Unaccounted-for water has two components: (a) physical losses due to leakage from pipes, and (b) administrative losses due to illegal connections and under registration of water meters. Relevance: L-C6 Proposed presentation format: Trend charts
Reference: Alegre H. et al. (2000), Performance Indicators for water supply services, IWA Publishing.
45. % Cost recovery for water supply provision (Domestic & Irrigation)
Definition: Total revenue from water supply charges/Total cost for water supply provision x 100% Comments: Total cost comprises capital cost (depreciation of assets and loans), operation and maintenance costs and administrative costs relevant to water supply provision (impoundment, storage, distribution etc.). Revenues correspond to water supply charges ONLY. The indicator is related to the financial sustainability of water utilities and their financial capacity for efficient operation and expansion of existing systems. Relevance: L-C19 Proposed presentation format: Trend charts
Reference: WFD CIS Guidance Document No 1: Economics and the environment – The implementation challenge of the Water Framework Directive, available at: http://circa.europa.eu/Public/irc/env/wfd/library?l=/framework_directive/guidance_documents/guidancesnos1seconomicss/_EN_1.0_&a=d
46. Total Groundwater Abstraction/Groundwater Recharge
Units: Dimensionless (%) Comments: Groundwater recharge can be defined in a broad sense as ‘the addition of water to a groundwater reservoir’. Total groundwater abstraction means the total withdrawal of water from a given aquifer by means of wells, boreholes, springs and other ways for the purpose of public water supply or agricultural, industrial and other usage. Relevance: L-C4 Proposed Presentation Format: Trend charts per groundwater body
Reference: Groundwater Resources Sustainability Indicators, IHP - VI Series on Groundwater, No 14, 2007. Available at: http://unesdoc.unesco.org/images/0014/001497/149754E.pdf.

Deliverable 4 Date: 25/09/2007 Version: Final, Dissemination Level: PU 49/74
47. Groundwater per use (irrigation, urban and industrial, rural, environmental)
Definition (relevant indicators): (a) Groundwater used in each sector/Total groundwater used x 100% and (b) Groundwater used in each sector/Total water used in each sector x 100%. Comments: An understanding of groundwater use will improve management of resources that rely on groundwater for their continued existence, such as groundwater dependent ecosystems. Quantity of groundwater used in each sector is a direct measure of pressures that water uses impose and of the effectiveness of management responses to it. Relevance: L-FP, L-C4 Proposed presentation format: Trend charts
Reference: Adapted from the Department of the Environment and Water Resources, State of Environment data, Groundwater-related indicators, Australian Government, 2006, http://www.environment.gov.au
48. Committed water for interbasin transfer
Definition: Committed water for transfer to other basins (or regions)/Annual water resources x 100% Comments: Committed water is that part of outflow (or groundwater resources) of the basin or region that supplies other uses, outside or downstream the river basin. An area becomes more vulnerable if it is largely dependent on water from other regions or if other regions are dependent on the basin for water supply (or downstream flow). Relevance: L-C5 Proposed presentation format: Trend charts
Reference: AquaStress IP (2007), Deliverable 2.1.3, Report on indicators for water stress.
49. Participation in decision-making
Definition: The percentage of decisions (%) taken by authorities with public involvement. Comments: A formal participatory process might involve: public announcements with receipt and processing of objections; public meetings and consultations; formation of oversight committees involving non-governmental organisations and public representatives. The indicator aims at measuring the degree of actual involvement of the public in the decision-making processes. Relevance: L-C7 Proposed presentation format: Graphs, Trend charts
Reference: UNCHS. http://www.urbanobservatory.org/indicators/guidelines/comprehensive; ICLEI, 2000. Measuring Progress, Cities 21: Pilot Project Final Report; and http://www.ceroi.net/ind/display.asp?setID=&indID=31
50. Constitutional guarantees to public participation
Units: Qualitative (weak, strong) Comments: The classification is performed according to the following scheme:
♦ Weak: Constitution does not explicitly guarantee right to public participation in decision-making.

Deliverable 4 Date: 25/09/2007 Version: Final, Dissemination Level: PU 50/74
♦ Strong: Constitution guarantees the right to public participation in decision-making. Relevance: Information indicates the existence of legal framework for public participation (Governing dimension of the FP)
Reference: World Water Assessment Programme II, Chapter 2: The challenges of water governance, available at: http://www.unesco.org/water/wwap/wwdr2/pdf/wwdr2_ch_2.pdf.
51. Comprehensiveness of notice and comment in different types of decision-making processes
Units: Qualitative (weak, intermediate, strong) Comments: The classification is performed according to the following scheme:
♦ Weak: Types of policy-and project-level decisions requiring public notice and comment are not specified.
♦ Intermediate: Types of project-level decisions requiring public notice and comment are specified but types of policy-level decisions are not.
♦ Strong: Types of both policy- and project-level decisions requiring public notice and comment are specified.
Relevance: L-C18, L-C23
Reference: World Water Assessment Programme II, Chapter 2: The challenges of water governance, available at: http://www.unesco.org/water/wwap/wwdr2/pdf/wwdr2_ch_2.pdf.
52. Public notice and common requirements for environmental impact assessment
Units: Qualitative (weak, intermediate, strong) Comments: The classification is performed according to the following scheme:
♦ Weak: No requirement for public notice and comment for Environmental Impact Assessments.
♦ Intermediate: EIAs require public notice and comment at final stage. ♦ Strong: EIAs require public notice and comment at various stages.
Relevance: L-C18, L-C23
Reference: World Water Assessment Programme II, Chapter 2: The challenges of water governance, available at: http://www.unesco.org/water/wwap/wwdr2/pdf/wwdr2_ch_2.pdf

Deliverable 4 Date: 25/09/2007 Version: Final, Dissemination Level: PU 51/74
3.5 The case of the Barada River Basin, Syria
3.5.1 Focal problem overview The Barada Basin is the area where the capital of Syria, Damascus, is located, and therefore the region that concentrates most of the human activities in the country (Figure 11). The area suffers from serious environmental issues. According to the list of policy priorities set by the Ministry of Local Administration and Environment, an immediate action plan should be drafted and implemented in order to address water pollution issues in the Barada Basin. At present, the efforts undertaken in order to address the problem are incomplete due to: (a) the absence of environmental law, (b) legislative limitations, and (c) lack of environmental awareness. Most manufactories discharge contaminants to the sewerage system or simply to land and rivers without treatment, free of charge and without penalties being enforced. In addition, the spatial dispersion of micro- and small-scale industries hinders the effective control over discharges. The current agricultural practices, which include excessive application of fertilizers and pesticides, overexploitation of water resources and application of inefficient irrigation methods have also contributed to the exacerbation of water pollution in the area. A draft analysis of the focal water management problem is presented in Figure 12. In order to address the problem, a feasible and integrated solution should be developed to mitigate environmental damage and prevent further deterioration in water quality. Considering current economic growth patterns and the emerging need for environmental protection, attempts should be made to develop an optimal policy, reflecting trade-offs between economic development and environmental protection in general, and water resources in particular.
Figure 11: The location of the Barada River Basin

Deliverable 4 Date: 25/09/2007 Version: Final, Dissemination Level: PU 52/74
Groundwater contamination (high concentrations of pathogens, nitrates and
agrochemicals). In addition to BOD, the concentration of suspended solids and ammonia
exceed the Syrian water quality standards
Water pollution from household and industrial wastewater and from agricultural drainage water
in the Barada Basin
S-E9
S-FP
Rapid population growth
(3.3% annually)
Poorly maintained sewerage
network-Significant leakage ratio
S-C14
Large-scale uncontrolled discharge from industrial
activities (mostly fertilizer, food processing industries and
tanneries)
Limited financial & technical
capacity of water and wastewater authorities
Limited application of sewerage
and wastewater treatment charges
S-C13
Water services are subsidized within
the context of the overall social policy
Disposal of sewage water to permanent and/or temporary water channels
Lack of adequate facilities for water sanitation
and wastewater collection and treatment
Absence of an integrated policy for
environmental management
Disregarding of environmental issues
Unauthorized discharge of sewage and untreated waste water in the land
near populated areas (city & village outskirts)
Lack of efficient monitoring systems
Deterioration of life quality at the city
outskirts
Increased illness and mortality
Higher direct and indirect costs due to impacts on
human health
Lower income
from tourism
Drop in real estate values at the city
outskirts
Loss of valuable biodiversity
Poor sea water quality and algae
blooms
Use of untreated wastewater for irrigation
(especially in rural areas)
Excessive and irregular application of fertilizers and pesticides
Causes
Governing
EffectsValuing Environmental
Socioeconomic
LEGEND
S-E8
S-E2
S-E7
S-E3
S-E6
S-E4 S-E5
S-E1
S-C1 S-C2 S-C3
S-C4
S-C8
S-C9
S-C12
S-C17
S-C7 S-C6
S-C5
Low share of population connected to wastewater treatment plants in rural
areas (45% only)
Unplanned urban expansion in areas not
served by sewerage systemsS-C10 S-C11
Centralized management and
limited responsibility of local authorities
Inadequate law enforcement
S-C15 S-C16
OtherNeed for expensive
pre-treatment
S-E10
Higher costs for the production of safe
drinking water and industrial water
S-E11
Figure 12: Problem tree analysis for water pollution in the Barada Basin

Deliverable 4 Date: 25/09/2007 Version: Final, Dissemination Level: PU 53/74
3.5.2 Adapted indicators to the Barada River Basin Focal Problem
1. Water quality and pollution in surface (rivers, lakes), underground, transitional and coastal waters
Definition (relevant indicators): Measured concentrations (a) nitrate in groundwater, (b) organic matter in rivers (c) nutrients in rivers (d) phosphorus in lakes (e) nutrients in coastal and marine waters (f) heavy metals in rivers (g) hazardous substances (chemicals, toxic compounds) in lakes and rivers, (h) chlorophyll in coastal and marine waters. Loads: (a) discharges of hazardous substances, (b) use of fertilizers, (c) discharges of organic matter from point sources, (d) loads of nutrients discharged to sea, (e) use of pesticides, (f) discharge of oil from refineries and off-shore installations, (g) Biological effects of hazardous substances on aquatic organisms, etc. Relevance: S-FP, S-C1, S-C2, S-C3, S-E9, S-E4, S-E5 Proposed presentation format: Trend charts
Reference: European Environment Agency (2003) Europe’s water: An indicator-based assessment, available at: http://reports.eea.europa.eu/topic_report_2003_1/en/Topic_1_2003_web.pdf and other sources.
2. Health incidents linked to inadequate water treatment and lack of sanitation
Definition (indicators): Total number of outbreaks and corresponding number of cases (incidents) Relevance: S-E2 Proposed presentation format: Tabular (year, number of outbreaks and number of cases)
Reference: World Health Organization, Surveillance and investigation of contamination incidents and waterborne outbreaks, available at: http://www.who.int/water_sanitation_health/dwq/9241546301_chap7.pdf
3. Evolution of treatment costs for safe drinking, industrial and irrigation water supply
Units: Euro (or national currency)/m3 of water supplied Comments: The indicator shows whether water quality deterioration has resulted in significant increase in water treatment costs, especially for drinking water supply provision. High treatment costs (resulting e.g. from eutrophication) can be incurred as a result from pollution emissions from various activities (agricultural, industrial etc). Relevance: S-E11 Proposed presentation format: Trend charts
4. Tourist overnight stays in coastal areas
Comments: The indicator is used to portray whether increased seawater pollution actually affects the tourist sector. Therefore, information should be presented in relation to algae bloom incidents and/or water pollution accidents and increased pollution loads. Relevance: S-E6 Proposed Presentation Format: Trend charts in relation to algae bloom incidents and/or water pollution accidents

Deliverable 4 Date: 25/09/2007 Version: Final, Dissemination Level: PU 54/74
5. Real estate prices
Comments: Information should be collected and presented as time series for the areas mostly affected by wastewater discharge and waste disposal. Please make sure that prices are comparable (i.e. deflated). Relevance: S-E7 Proposed Presentation Format: Trend charts
Reference: Various literature sources
6. Sewerage network coverage
Definition (relevant indicators): % population served by sewerage network, % population served by septic tanks, % population served by open drains. Comments: The indicators provide a measure of the pressure exerted from urban wastewater production. In addition, the trend of population connected sewerage network indicates whether urban wastewater collection and treatment schemes have been (or are being) implemented. Relevance: S-C9, S-C10 Proposed presentation format: Trend charts
Reference: City Managers' Association Gujarat, 2001, Urban Indicators and Performance Measurement Programme, available at: http://www.umcasia.org/Downloads/UIPM-10%20cities,%20Guj.pdf and other literature sources
7. Wastewater treatment coverage
Definition (relevant indicators): volume of wastewater collected and treated/volume of wastewater produced x 100%. Comments: - Relevance: S-C9, S-C10, S-C8 Proposed presentation format: Trend charts
Reference: City Managers' Association Gujarat, 2001, Urban Indicators and Performance Measurement Programme, available at: http://www.umcasia.org/Downloads/UIPM-10%20cities,%20Guj.pdf and other literature sources
8. Percentage of the capacity of wastewater facilities being utilized
Definition: Peak volume of wastewater produced (m3/d)/Total capacity of wastewater facilities (m3/d) x100%. Comments: Capacities and volumes of treated/produced wastewater should ideally include industrial wastewater treatment. Values near 100% indicate that there is need for expansion of existing wastewater treatment facilities or construction of new ones. On the other hand, low values indicate oversizing of existing facilities. The indicator provides a measure of the pressure exerted from urban and industrial wastewater production and discharge. Relevance: S-C8, S-C9 Proposed Presentation Format: Trend charts
Reference: Ge et al., Environmental enforcement and compliance indicators in China, available at: http://www.inece.org/indicators/proceedings/04e_china.pdf

Deliverable 4 Date: 25/09/2007 Version: Final, Dissemination Level: PU 55/74
9. Cost per sewerage connection
Definition: Total costs/Number of sewerage connections Comments: Total costs comprise capital cost (depreciation of assets and loans), operation and maintenance costs and administrative costs relevant to sewage collection and treatment. Information indicates if relevant costs are high or low. Relevance: S-C7, S-C17 Proposed presentation format: Trend charts
Reference: City Managers' Association Gujarat, 2001, Urban Indicators and Performance Measurement Programme, available at: http://www.umcasia.org/Downloads/UIPM-10%20cities,%20Guj.pdf
10. % Cost recovery for sewage collection and wastewater treatment services
Definition: Total revenue from sewerage charges/Total cost for sewage collection and wastewater treatment x 100% Comments: Total cost as defined above. Revenues correspond to sewerage charges ONLY. Indicator related to the financial sustainability of water utilities and their financial capacity for efficient operation and expansion of existing systems. Relevance: S-C13, S-C17 Proposed presentation format: Trend charts
Reference: City Managers' Association Gujarat, 2001, Urban Indicators and Performance Measurement Programme, available at: http://www.umcasia.org/Downloads/UIPM-10%20cities,%20Guj.pdf and other literature sources
11. Contaminant load from industrial activities
Definition: Specific contaminant load (t COD/ € GDP from industrial activities per year). Comments: The indicator shows the relative importance of pollution from industrial activities in comparison to the annual income generated from the sector. Relevance: S-C3, S-C8 Proposed presentation format: Trend charts
Reference: AquaStress IP (2007), Deliverable 2.1.3, Report on indicators for water stress.
12. Manufacturing units with own wastewater treatment plant (%)
Definition: Number of manufacturing units with own wastewater treatment plant/Total number of manufacturing industries x 100% Comment: The indicator assesses the potential level of pollution from industrial point sources entering the aquatic environment and monitors progress towards reducing this potential within a n integrated water resources management framework. It helps to identify industries where action is required in the area of wastewater treatment to protect the environment. Reference: S-C8 Proposed presentation format: Trend charts
Reference: Measuring Sustainability: Sustainable Development Indicators, http://esl.jrc.it/envind/

Deliverable 4 Date: 25/09/2007 Version: Final, Dissemination Level: PU 56/74
13. Environmental protection investment
Definition: (a) Percentage of total environmental protection investment as share of GDP (%) – (b) Percentage of total public environmental investment over total environmental investment (%). Comments: Environmental investment here should refer to investments in protection from wastewater discharges. The indicator assesses financial commitment to environmental protection. Relevance: S-C9, S-C7 Proposed presentation format: Trend charts
Reference: Ge et al., Environmental enforcement and compliance indicators in China, available at: http://www.inece.org/indicators/proceedings/04e_china.pdf
14. Existence of environmental supervision institutions
Units: YES/NO Relevance: S-C16, S-C12, S-C4
Reference: Ge et al., Environmental enforcement and compliance indicators in China, available at: http://www.inece.org/indicators/proceedings/04e_china.pdf
15. Number of people working for environmental supervision
Comments: The indicator quantifies the technical capacity of environmental supervision authorities to monitor and control dischargers (industries, utilities etc.) Relevance: S-C16, S-C12
Reference: Ge et al., Environmental enforcement and compliance indicators in China, available at: http://www.inece.org/indicators/proceedings/04e_china.pdf
16. Total number of violations vs. total number of inspections (for wastewater discharge)
Comments: The indicators are used to assess the performance of environmental supervision institutions (technical capacity). It should be noted that such activity indicators do not provide a good sense of the effectiveness of enforcement efforts as it is impossible to discern the actual compliance rates. Relevance: S-C8, S-C12 Proposed Presentation Format: Trend charts
Reference: Ge et al., Environmental enforcement and compliance indicators in China, available at: http://www.inece.org/indicators/proceedings/04e_china.pdf and & http://www.unece.org/env/epr/studies/moldova_2/chapter02.pdf
17. Rate of pollution levy collected vs. the one supposed to be collected
Comments: Similar to indicator above. Relevance: S-C12, S-C16 Proposed Presentation Format: Trend charts
Reference: Ge et al., Environmental enforcement and compliance indicators in China, available at: http://www.inece.org/indicators/proceedings/04e_china.pdf and & http://www.unece.org/env/epr/studies/moldova_2/chapter02.pdf

Deliverable 4 Date: 25/09/2007 Version: Final, Dissemination Level: PU 57/74
18. Legislative compliance
Definition(s): Dischargers complying to discharge emission standards/Total dischargers inspected (%) Comments: Information indicates the level of compliance of industries to legislation standards. Values depend on the number of inspections and are indicative of actual compliance. Relevance: S-C16 Proposed presentation format: Trend charts
Reference: Ge et al., Environmental enforcement and compliance indicators in China, available at: http://www.inece.org/indicators/proceedings/04e_china.pdf
19. Constitutional guarantees to public participation
Units: Qualitative (weak, strong) Comments: The classification is performed according to the following scheme:
♦ Weak: Constitution does not explicitly guarantee right to public participation in decision-making.
♦ Strong: Constitution guarantees the right to public participation in decision-making.
Relevance: -
Reference: World Water Assessment Programme II, Chapter 2: The challenges of water governance, available at: http://www.unesco.org/water/wwap/wwdr2/pdf/wwdr2_ch_2.pdf.
20. Comprehensiveness of notice and comment in different types of decision-making processes
Units: Qualitative (weak, intermediate, strong) Comments: The classification is performed according to the following scheme:
♦ Weak: Types of policy-and project-level decisions requiring public notice and comment are not specified.
♦ Intermediate: Types of project-level decisions requiring public notice and comment are specified but types of policy-level decisions are not.
♦ Strong: Types of both policy- and project-level decisions requiring public notice and comment are specified.
Relevance: -
Reference: World Water Assessment Programme II, Chapter 2: The challenges of water governance, available at: http://www.unesco.org/water/wwap/wwdr2/pdf/wwdr2_ch_2.pdf.
21. Public notice and common requirements for environmental impact assessment
Units: Qualitative (weak, intermediate, strong) Comments: The classification is performed according to the following scheme:
♦ Weak: No requirement for public notice and comment for Environmental Impact Assessments.
♦ Intermediate: EIAs require public notice and comment at final stage. ♦ Strong: EIAs require public notice and comment at various stages.

Deliverable 4 Date: 25/09/2007 Version: Final, Dissemination Level: PU 58/74
Relevance: -
Reference: World Water Assessment Programme II, Chapter 2: The challenges of water governance, available at: http://www.unesco.org/water/wwap/wwdr2/pdf/wwdr2_ch_2.pdf.
22. Participation in decision-making
Definition: The percentage of decisions (%) taken by authorities with public involvement. Comments: A formal participatory process might involve: public announcements with receipt and processing of objections; public meetings and consultations; formation of oversight committees involving non-governmental organisations and public representatives. The indicator aims at measuring the degree of actual involvement of the public in the decision-making processes. Relevance: - Proposed presentation format: Graphs, Trend charts
Reference: UNCHS. http://www.urbanobservatory.org/indicators/guidelines/comprehensive; ICLEI, 2000. Measuring Progress, Cities 21: Pilot Project Final Report; and http://www.ceroi.net/ind/display.asp?setID=&indID=31

Deliverable 4 Date: 25/09/2007 Version: Final, Dissemination Level: PU 59/74
3.6 The case of the Seybouse River Basin, Algeria
3.6.1 Focal problem overview The focal water management problem in the Seybouse River Basin is the pollution of the river mainly by domestic sewage and industrial effluents. The water is of poor quality and is improper for domestic and agricultural use. The Seybouse River is an important water source, used mainly for the irrigation of large agricultural plains, extending from the Guelma region and up to Annaba city. The river has a total length of 240 km. Overall the basin extends over the administrative boundaries of 68 municipalities located in 7 wilayas. Its water resources are vital for sustaining the majority of economic activities in the region. At present, there are significant water pollution issues associated with the discharge of both domestic and industrial effluents from the cities and the industries located along the river banks. The annual effluent discharge is approximately 4.5 million m³, of which 3 million are used oils. This is due to the lack of wastewater treatment plants in the cities (domestic sewage) but also and in industrial units. The most vulnerable areas are Meboudja, Bouchegouf and Guelma, where industrial activities are most intense. In those areas aquifer pollution is also a major concern. Furthermore, the mountainous areas, such as Edough and Gelaat Bou Sbaa contribute to high surface run-off which conveys polluted effluents and recharges groundwater tables. At present, there is risk for human health, as children often play at the river banks but also in irrigation, as many farmers abstract water directly from the river. Fauna and flora are also seriously threatened, as well as soil productivity and the overall river ecosystem.
Figure 13: The location of the Seybouse River

Deliverable 4 Date: 25/09/2007 Version: Final, Dissemination Level: PU 60/74
Water Pollution in the Seybouse River Basin
Increased conflicts among water users
Low quality of irrigation water
Increased health risks
Uncontrolled discharge of polluting
industrial effluents in surface waters
Limited law enforcement
Delay in the implementation of sewage treatment
schemes
Limited financial resources
Lack of technical and
institutional capacity
Limited awareness on environmental
issues
Most industries do not have wastewater
treatment facilities
Limited financial resources
Lack of a public
participation platform
LEGEND
Other
Causes
GoverningValuing
Sharing
EffectsEnvironmental
Socioeconomic
A-C1 A-C2
A-C3 A-C4 A-C5 A-C6
A-C7A-C8
A-C9
A-FP
A-E1 A-E2 A-E3
Figure 14: Problem tree analysis for water pollution in the Seybouse River Basin

Deliverable 4 Date: 25/09/2007 Version: Final, Dissemination Level: PU 61/74
3.6.2 Adapted indicators to the Seybouse River Basin Focal Problem
1. Water quality and pollution in surface (rivers, lakes), underground, transitional and coastal waters
Definition (relevant indicators): Measured concentrations (a) nitrate in groundwater, (b) organic matter in rivers (c) nutrients in rivers (d) phosphorus in lakes (e) nutrients in coastal and marine waters (f) heavy metals in rivers (g) hazardous substances (chemicals, toxic compounds) in lakes and rivers, (h) chlorophyll in coastal and marine waters. Loads: (a) discharges of hazardous substances, (b) use of fertilizers, (c) discharges of organic matter from point sources, (d) loads of nutrients discharged to sea, (e) use of pesticides, (f) discharge of oil from refineries and off-shore installations, (g) Biological effects of hazardous substances on aquatic organisms, etc. Relevance: A-FP, A-C1, A-C2, A-C4 Proposed presentation format: Trend charts
Reference: European Environment Agency (2003) Europe’s water: An indicator-based assessment, available at: http://reports.eea.europa.eu/topic_report_2003_1/en/Topic_1_2003_web.pdf and other sources.
2. Health incidents linked to inadequate water treatment and lack of sanitation
Definition (indicators): Total number of outbreaks and corresponding number of cases (incidents) Relevance: A-E3 Proposed presentation format: Tabular (year, number of outbreaks and number of cases)
Reference: World Health Organization, Surveillance and investigation of contamination incidents and waterborne outbreaks, available at: http://www.who.int/water_sanitation_health/dwq/9241546301_chap7.pdf
3. Contaminant load from industrial activities
Definition: Specific contaminant load (t COD/ € GDP from industrial activities per year). Comments: The indicator shows the relative importance of pollution from industrial activities in comparison to the annual income generated from the sector. Relevance: A-C1, A-E2 Proposed presentation format: Trend charts
Reference: AquaStress IP (2007), Deliverable 2.1.3, Report on indicators for water stress.
4. Evolution of treatment costs for safe drinking, industrial and irrigation water supply
Units: Euro (or national currency)/m3 of water supplied Comments: The indicator shows whether water quality deterioration has resulted in significant increase in water treatment costs, especially for drinking water supply provision. High treatment costs (resulting e.g. from eutrophication) can be incurred as a result from pollution emissions from various activities (agricultural, industrial etc). Relevance: - Proposed presentation format: Trend charts

Deliverable 4 Date: 25/09/2007 Version: Final, Dissemination Level: PU 62/74
5. Sewerage network coverage
Definition (relevant indicators): % population served by sewerage network, % population served by septic tanks, % population served by open drains. Comments: The indicators provide a measure of the pressure exerted from urban wastewater production. In addition, the trend of population connected sewerage network indicates whether urban wastewater collection and treatment schemes have been (or are being) implemented. Relevance: A-C2 Proposed presentation format: Trend charts
Reference: City Managers' Association Gujarat, 2001, Urban Indicators and Performance Measurement Programme, available at: http://www.umcasia.org/Downloads/UIPM-10%20cities,%20Guj.pdf and other literature sources
6. Wastewater treatment coverage
Definition (relevant indicators): volume of wastewater collected and treated/volume of wastewater produced x 100%. Comments: - Relevance: A-C1, A-C2, A-C4 Proposed presentation format: Trend charts
Reference: City Managers' Association Gujarat, 2001, Urban Indicators and Performance Measurement Programme, available at: http://www.umcasia.org/Downloads/UIPM-10%20cities,%20Guj.pdf and other literature sources
7. Percentage of the capacity of wastewater facilities being utilized
Definition: Peak volume of wastewater produced (m3/d)/Total capacity of wastewater facilities (m3/d) x100%. Comments: Capacities and volumes of treated/produced wastewater should ideally include industrial wastewater treatment. Values near 100% indicate that there is need for expansion of existing wastewater treatment facilities or construction of new ones. On the other hand, low values indicate oversizing of existing facilities. The indicator provides a measure of the pressure exerted from urban and industrial wastewater production and discharge. Relevance: A-C1, A-C2, A-C4 Proposed Presentation Format: Trend charts
Reference: Ge et al., Environmental enforcement and compliance indicators in China, available at: http://www.inece.org/indicators/proceedings/04e_china.pdf
8. Manufacturing units with own wastewater treatment plant (%)
Definition: Number of manufacturing units with own wastewater treatment plant/Total number of manufacturing industries x 100% Comment: The indicator assesses the potential level of pollution from industrial point sources entering the aquatic environment and monitors progress towards reducing this potential within a n integrated water resources management framework. It helps to identify industries where action is required in the area of wastewater treatment to protect the environment.

Deliverable 4 Date: 25/09/2007 Version: Final, Dissemination Level: PU 63/74
Reference: A-C4 Proposed presentation format: Trend charts
Reference: Measuring Sustainability: Sustainable Development Indicators, http://esl.jrc.it/envind/
9. Environmental protection investment
Definition: (a) Percentage of total environmental protection investment as share of GDP (%) – (b) Percentage of total public environmental investment over total environmental investment (%). Comments: Environmental investment here should refer to investments in protection from wastewater discharges. The indicator assesses financial commitment to environmental protection. Relevance: A-C8, A-C9 Proposed presentation format: Trend charts
Reference: Ge et al., Environmental enforcement and compliance indicators in China, available at: http://www.inece.org/indicators/proceedings/04e_china.pdf
10. Existence of environmental supervision institutions
Units: YES/NO Relevance: A-C6, A-C7
Reference: Ge et al., Environmental enforcement and compliance indicators in China, available at: http://www.inece.org/indicators/proceedings/04e_china.pdf
11. Number of people working for environmental supervision
Comments: The indicator quantifies the technical capacity of environmental supervision authorities to monitor and control dischargers (industries, utilities etc.) Relevance: A-C6, A-C7
Reference: Ge et al., Environmental enforcement and compliance indicators in China, available at: http://www.inece.org/indicators/proceedings/04e_china.pdf
12. Total number of violations vs. total number of inspections (for wastewater discharge)
Comments: The indicator is used to assess the performance of environmental supervision institutions (technical capacity). It should be noted that such activity indicators do not provide a good sense of the effectiveness of enforcement efforts as it is impossible to discern the actual compliance rates. Relevance: A-C1, A-C6 Proposed Presentation Format: Trend charts
Reference: Ge et al., Environmental enforcement and compliance indicators in China, available at: http://www.inece.org/indicators/proceedings/04e_china.pdf and & http://www.unece.org/env/epr/studies/moldova_2/chapter02.pdf
13. Rate of pollution levy collected vs. the one supposed to be collected
Comments: Similar to indicator above. Relevance: A-C6, A-C7, A-C9 Proposed Presentation Format: Trend charts

Deliverable 4 Date: 25/09/2007 Version: Final, Dissemination Level: PU 64/74
Reference: Ge et al., Environmental enforcement and compliance indicators in China, available at: http://www.inece.org/indicators/proceedings/04e_china.pdf and & http://www.unece.org/env/epr/studies/moldova_2/chapter02.pdf
14. Legislative compliance
Definition(s): Dischargers complying to discharge emission standards/Total dischargers inspected (%) Comments: Information indicates the level of compliance of industries to legislation standards. Values depend on the number of inspections and are indicative of actual compliance. Relevance: A-C6, A-C7 Proposed presentation format: Trend charts
Reference: Ge et al., Environmental enforcement and compliance indicators in China, available at: http://www.inece.org/indicators/proceedings/04e_china.pdf
15. Constitutional guarantees to public participation
Units: Qualitative (weak, strong) Comments: The classification is performed according to the following scheme:
♦ Weak: Constitution does not explicitly guarantee right to public participation in decision-making.
♦ Strong: Constitution guarantees the right to public participation in decision-making.
Relevance: A-C3, A-C5
Reference: World Water Assessment Programme II, Chapter 2: The challenges of water governance, available at: http://www.unesco.org/water/wwap/wwdr2/pdf/wwdr2_ch_2.pdf.
16. Comprehensiveness of notice and comment in different types of decision-making processes
Units: Qualitative (weak, intermediate, strong) Comments: The classification is performed according to the following scheme:
♦ Weak: Types of policy-and project-level decisions requiring public notice and comment are not specified.
♦ Intermediate: Types of project-level decisions requiring public notice and comment are specified but types of policy-level decisions are not.
♦ Strong: Types of both policy- and project-level decisions requiring public notice and comment are specified.
Relevance: A-C3
Reference: World Water Assessment Programme II, Chapter 2: The challenges of water governance, available at: http://www.unesco.org/water/wwap/wwdr2/pdf/wwdr2_ch_2.pdf.
17. Public notice and common requirements for environmental impact assessment
Units: Qualitative (weak, intermediate, strong) Comments: The classification is performed according to the following scheme:

Deliverable 4 Date: 25/09/2007 Version: Final, Dissemination Level: PU 65/74
♦ Weak: No requirement for public notice and comment for Environmental Impact Assessments.
♦ Intermediate: EIAs require public notice and comment at final stage. ♦ Strong: EIAs require public notice and comment at various stages.
Relevance: A-C3, A-C5
Reference: World Water Assessment Programme II, Chapter 2: The challenges of water governance, available at: http://www.unesco.org/water/wwap/wwdr2/pdf/wwdr2_ch_2.pdf.
18. Participation in decision-making
Definition: The percentage of decisions (%) taken by authorities with public involvement. Comments: A formal participatory process might involve: public announcements with receipt and processing of objections; public meetings and consultations; formation of oversight committees involving non-governmental organisations and public representatives. The indicator aims at measuring the degree of actual involvement of the public in the decision-making processes. Relevance: A-C3, A-C5 Proposed presentation format: Graphs, Trend charts
Reference: UNCHS. http://www.urbanobservatory.org/indicators/guidelines/comprehensive; ICLEI, 2000. Measuring Progress, Cities 21: Pilot Project Final Report; and http://www.ceroi.net/ind/display.asp?setID=&indID=31

Deliverable 4 Date: 25/09/2007 Version: Final, Dissemination Level: PU 66/74
3.7 The case of the Oum-Er-Rbia River Basin, Morocco
3.7.1 Focal problem overview The focal problem identified for the Moroccan case is the inefficient water use in the Oum Er Rbia basin resulting in demand pressure. The Oum Er Rbia river (550 km length) originates from the Middle Atlas, and stretches across the Middle Atlas chain, the Tadla plain, the inshore Meseta and discharges in the Atlantic Ocean. The basin sustains diverse economic activities, including irrigated and rainfed agriculture, mining, agro-food and numerous large manufacturing industries. The volume of water used in the basin is 3,861 hm³, of which 90% is mobilized surface water, stored in the local storage reservoirs, which permit the irrigation of more than 345,000 ha, the production of 1630 GWh of energy, the provision of drinking water to 5 million inhabitants, and ensure a minimum river flow to maintain ecosystem health. Additionally, an annual volume of 165 hm³ is supplied to the cities of Casablanca and Marrakech, outside the basin. The problem results from increased demand, combined with low efficiency, especially in irrigation distribution networks and in the currently adopted irrigation practices (non-efficient irrigation methods and water intensive, non-economically sustainable cropping patterns). Past policies have targeted the increase of supply through surface water mobilization, the construction of irrigation networks to cope with the increased agricultural demand, governmental subsidies for facilitating the introduction of drip irrigation and wastewater treatment and enhancement of the knowledge base on water resources and their use. However, demand growth and increasing water stress necessitate new responses and instruments for reducing losses, introducing non-conventional supply sources and managing demand especially in the agricultural sector.
Figure 15: Map of the Oum-Er-Rbia Basin, Morocco

Deliverable 4 Date: 25/09/2007 Version: Final, Dissemination Level: PU 67/74
Figure 16: Problem tree analysis for inefficient water use in Morocco

Deliverable 4 Date: 25/09/2007 Version: Final, Dissemination Level: PU 68/74
3.7.2 Adapted indicators to the Oum-Er-Rbia Focal Problem
1. Relative water supply to meet crop demand
Definition: The ratio of total water available for crops, including surface irrigation, groundwater pumped and rainfall, to the amount crops need, calculated individually for each crop. Comments: When the crop is for example rice, the water 'lost' through the soil is considered when calculating crop demand. This indicator provides information about the relative abundance or scarcity of water. Unit: % Relevance: M-FP, M-C4, M-E3, M-E1
Reference: IWMI Publications, Molden D.J., Sakthivadivel R., Perry C.J. and de Fraiture C., ‘Indicators for Comparing Performance of Irrigated Agricultural Systems’: http://www.iwmi.cgiar.org/pubs/pub020/RR020.htm
2. Sustainable and Developed groundwater yield
Definition: The sustainable yield can indicate environmental stress on an aquatic ecosystem if water extraction is greater than the sustainable yield. Sustainable yield can also be used to help identify aquatic systems where water use can be increased in a sustainable manner. Developed yield is the average annual volume of water that can be diverted for use with the existing infrastructure. Units: m3/yr Relevance: M-FP, M-E2, M-E3, M-E5, M-E7, M-E8 Proposed presentation format: Time Series
Reference: Australian Government, Department of the Environment and Water Resources, State of Environment data, 2006. Available at: http://www.environment.gov.au
3. Participation in decision-making
Definition: The percentage of decisions (%) taken by authorities with public involvement. Comments: A formal participatory process might involve: public announcements with receipt and processing of objections; public meetings and consultations; formation of oversight committees involving non-governmental organisations and public representatives. The indicator aims at measuring the degree of actual involvement of the public in the decision-making processes. Relevance: M-FP, M-C5, M-C7 Proposed presentation format: Graphs, Trend charts
Reference: UNCHS. http://www.urbanobservatory.org/indicators/guidelines/comprehensive; ICLEI, 2000. Measuring Progress, Cities 21: Pilot Project Final Report; and http://www.ceroi.net/ind/display.asp?setID=&indID=31

Deliverable 4 Date: 25/09/2007 Version: Final, Dissemination Level: PU 69/74
4. Constitutional guarantees to public participation
Units: Qualitative (weak, strong) Comments: The classification is performed according to the following scheme:
♦ Weak: Constitution does not explicitly guarantee right to public participation in decision-making.
♦ Strong: Constitution guarantees the right to public participation in decision-making.
Relevance: M-E6, M-E9, M-C5
Reference: World Water Assessment Programme II, Chapter 2: The challenges of water governance, available at: http://www.unesco.org/water/wwap/wwdr2/pdf/wwdr2_ch_2.pdf.
5. Relative irrigation supply
Definition: The ratio of total irrigation supply, surface irrigation and pumped water, to the estimated irrigation demand. Comments: Indicates how well irrigation supply and demand are matched. A value greater than 1 would suggest too much water is being supplied, possibly causing waterlogging and negatively impacting yields; a value less than one indicates that crops aren't getting enough water. Unit: % Relevance: M-E3, M-C3, M-C4, M-C5
Reference: IWMI Publications, Molden D.J., Sakthivadivel R., Perry C.J. and de Fraiture C., ‘Indicators for Comparing Performance of Irrigated Agricultural Systems’: http://www.iwmi.cgiar.org/pubs/pub020/RR020.htm
6. Total groundwater abstraction / Groundwater recharge
Definition (indicators): Groundwater recharge can be defined in a broad sense as ‘the addition of water to a groundwater reservoir’. Total groundwater abstraction means the total withdrawal of water from a given aquifer by means of wells, boreholes, springs and other ways for the purpose of public water supply or agricultural, industrial and other usage. Units: % Relevance: M-E2 Proposed presentation format: Time series, per aquifer
Reference: Groundwater Resources Sustainability Indicators, IHP - VI Series on Groundwater, No 14, 2007. Available at:
http://unesdoc.unesco.org/images/0014/001497/149754E.pdf
7. Total groundwater abstraction / Exploitable groundwater resources
Definition (indicators): The term ‘exploitable groundwater resources’ means the amount of water that can be abstracted annually from a given aquifer under prevailing economic, technological and institutional constrains and environmental conditions. In many

Deliverable 4 Date: 25/09/2007 Version: Final, Dissemination Level: PU 70/74
countries there is an intention to quantify the exploitable groundwater resources (called also usable groundwater reserves) for the large groundwater basins and aquifers. Relevance: M-E2 Proposed presentation format: Time series, per aquifer
Reference: Groundwater Resources Sustainability Indicators, IHP - VI Series on Groundwater, No 14, 2007. Available at:
http://unesdoc.unesco.org/images/0014/001497/149754E.pdf
8. Water level decline
Definition (indicators): Two alternatives for identifying water level declines are: 1) to detect from a well monitoring network (when available) a consistent and gradual downward trend of water level, or 2) to compare the groundwater level at wells drilled at different times (i.e. compare water level evolution using near wells, but drilled in different period of time. Units: Relevance: M-E2, M-E5, M-E6 Proposed presentation format: Time series per aquifer
Reference: Groundwater Resources Sustainability Indicators, IHP - VI Series on Groundwater, No 14, 2007. Available at:
http://unesdoc.unesco.org/images/0014/001497/149754E.pdf
9. Total exploitable non-renewable groundwater resources/ Annual abstraction of non-renewable groundwater resources
Definition (indicators): The total exploitable non-renewable groundwater resource means the calculated total amount of water that can be abstracted from a given aquifer under current socio-economic constraints and ecological conditions. The total annual abstraction of groundwater means the total withdrawal of water from a given aquifer by means of wells, boreholes and other artificial ways for the purpose of domestic water supply, industrial, agricultural and other usage. Unit: % Relevance: M-E2 Proposed presentation format: Time series per groundwater system
Reference: Groundwater Resources Sustainability Indicators, IHP - VI Series on Groundwater, No 14, 2007. Available at:
http://unesdoc.unesco.org/images/0014/001497/149754E.pdf
10. Dependence of agricultural population on groundwater (Number of farmers dependent on groundwater for agriculture activities/Total population)
Definition (indicators): The proposed indicator is designed to signify the importance of groundwater in rural livelihoods and household incomes. It indicates the percentage of a country’s population that depends on groundwater for supporting livelihoods and household income. The following supplementary indicators could also be designed: 1)

Deliverable 4 Date: 25/09/2007 Version: Final, Dissemination Level: PU 71/74
number of farmers using groundwater for agricultural activities/number of people engaged in farming and stock rearing, and 2) number of people engaged in farming and stock rearing/population of the country. Unit: % Relevance: M-E3, M-E4, M-E9 Proposed presentation format: Time series
Reference: Groundwater Resources Sustainability Indicators, IHP - VI Series on Groundwater, No 14, 2007. Available at:
http://unesdoc.unesco.org/images/0014/001497/149754E.pdf
11. Network losses
Definition (indicators): the amount of water (%) that is lost through the distribution network between the source and the final recipient. Units: % Relevance: M-C2, M-C6 Proposed presentation format: Time series
Reference: Various Sources
12. Cost of water for irrigation water supply
Units: Euro (or national currency)/m3 of water supplied Comments: The indicator shows whether the overexploitation of resources has resulted in significant increase in water prices especially for drinking water supply provision, and whether it has an affect in the groundwater volumes extracted and used. Relevance: M-C1, M-C7 Proposed presentation format: Trend charts
13. Water delivery capacity for irrigation
Definition: The ratio of canal capacity to deliver water to peak consumptive demand. Comments: The water delivery capacity can suggest changes in irrigation infrastructure or cropping patterns which are needed to maximize cropping intensity. Unit: % Relevance: M-C2, M-C3, M-C4, M-C6
Reference: IWMI Publications, Molden D.J., Sakthivadivel R., Perry C.J. and de Fraiture C., ‘Indicators for Comparing Performance of Irrigated Agricultural Systems’: http://www.iwmi.cgiar.org/pubs/pub020/RR020.htm
14. Gross return on investment for irrigation
Definition: The ratio of gross value of production to the cost of irrigation infrastructure Comments: The gross return on investment indicates whether irrigation infrastructure was a good investment in a particular context, or not. As this indicator is applied to more systems, it is giving planners and policymakers information on how, where and how much they should invest in irrigation Unit: %
Deliverable 4 Date: 25/09/2007 Version: Final, Dissemination Level: PU 72/74
Relevance: M-C2, M-C6
Reference: IWMI Publications, Molden D.J., Sakthivadivel R., Perry C.J. and de Fraiture C., ‘Indicators for Comparing Performance of Irrigated Agricultural Systems’: http://www.iwmi.cgiar.org/pubs/pub020/RR020.htm
15. Financial sustainability of irrigation systems (Cost recovery for irrigation services)
Definition: Showing the financial self-sufficiency of irrigation systems. It is expressed with the ratio of revenue from irrigation services fees to the total operational and maintenance expenditures. Comments: The financial self-sufficiency indicator shows how much of the money spent on operations and maintenance is generated locally. Assuming operations and maintenance expenditures are sufficient to meet actual needs, this indicator can determine the financial sustainablility of the system). The financial self-sufficiency indicator is particularly important for gauging the impacts of irrigation management transfer, where the primary goal is to transfer financial responsibility for the system from the government to the farmers. Relevance: M-C3
Reference: IWMI Publications, Molden D.J., Sakthivadivel R., Perry C.J. and de Fraiture C., ‘Indicators for Comparing Performance of Irrigated Agricultural Systems’: http://www.iwmi.cgiar.org/pubs/pub020/RR020.htm

Deliverable 4 Date: 25/09/2007 Version: Final, Dissemination Level: PU 73/74
References AusAID - Australian Government (2003) ‘AusGUIDElines: The Logical Framework
Approach’ Copyright Commonwealth of Australia 2000.
Beasley B. (2001) Criteria & Indicators Briefing Paper, Background Paper, USDA Forest Service for North Coast LRMP
Borja A., Galparsoro I., Solaun O., Muxika I., Tello E.M., Uriarte A., Valencia V. (2005) ‘The European Framework Directive and the DPSIR, a methodological approach to assess the risk of failing to achieve good ecological status’, Journal of Estuarine, Coastal and Shelf Science, July 25-11-2005
CSD (Commission on Sustainable Development) (1998) Official Records of the Economic and Social Council, 22 December 1997 and 20 April 1 May 1998, Supplement No. 9. New York, UN (United Nations).
Department of Environmental Affairs and Tourism of South Africa (1999) National State of the Environment Report - South Africa, http://www.ngo.grida.no/soesa/nsoer/issues/water/index.htm, Accessed on 24/11/2005
EEA Technical report No 1 (2005) EEA core set of indicators Guide ISSN 1725-2237
Gallopín, G. C. (1997) Indicators and their Use: Information for Decision-making. Sustainability indicators: A Report on the Project on Indicators of Sustainable Development. B. Moldan, S. Billharz and R. Matravers. Chichester, UK, John Wiley & Sons.
Hammond A., Adriaanse A., Rodenburg E., Bryant D., Woodward R. (1995) ‘Environmental Indicators: A Systematic Approach to Measuring and Reporting on Environmental Policy Performance in the Context of Sustainable Development’. Washington: World Resources Institute.
IUCN - International Union for Conservation of Nature and Natural Resources (1997) ‘Draft PDG Guidelines: A guide to the development, review and further processing of projects in IUCN
OECD – Organisation for Economic Cooperation and Development (1994) ‘Environmental Indicators’, OECD core set, Paris
OECD- Organisation for Economic Cooperation and Development (1998) Towards sustainable development - Environmental indicators. OEDC, Paris, France.
Plan Bleu (1996) Les Indicateurs d’economie de l’eau ressources et utilisations, Plan d’Action pour la Mediterranee - Plan Bleu
Smeets E. & Weterinds R. (1999) ‘Environmental Indicators: Typology and Overview’, European Environment Agency, Technical Report No 25
Sustainable Seattle (1998) Indicators of Sustainable Community. Sustainable Seattle, Seattle, USA.
Deliverable 4 Date: 25/09/2007 Version: Final, Dissemination Level: PU 74/74
Sustainable Seattle: ecology, economy, community (2006) Available at World Wide Web URL address: http://www.sustainableseattle.org/, Accessed on 28/09/2006
UNDP (2006), http://europeandcis.undp.org/WaterWiki/index.php/Water_Governance
UNESCO-WWAP: The United Nations World Water Development Report – World Water Assessment Programme (2003) Water for People – Water for life, UNESCO Publishing, Berghahn Books
United Nations Department of Economic and Social Affairs – Division for Sustainable Development, http://www.un.org/esa/sustdev/natlinfo/indicators/isd.htm, Accessed on 18/09/2007
USEPA (United States Environmental Protection Agency). (1996) Environmental Indicators of Water Quality in the United States. EPA 841-R-96-002. Office of Water, 4503F. United States.
USEPA (United States Environmental Protection Agency) (1996) Environmental Indicators of Water Quality in the United States. EPA 841-R-96-002. Office of Water, 4503F.United States.
Walmsley J J. (2002) ‘Framework for measuring sustainable development in catchment systems’, Journal of Environmental Management, Vol. 29, No2, pp.195-206
Water Strategy Man, (2002) Existing Indicator Approaches for Water Resources Assessment, WSM Project Deliverable No 7, Prepared byRuhr-University Bochum.
WHO (World Health Organization). (1999) Environmental Health Indicators: Framework and Methodologies. Prepared by David Briggs. University College Northampton, Nene Centre for Research.
World Bank (1997) ‘Indicators of Pollution Management - Pollution Prevention & Abatement Handbook – Part II’
World Bank Environment Department, Segnestam L. (1999) Environmental Performance Indicators, 2nd Edition
World Bank website (2007) WDI Online, Accessed at: http://go.worldbank.org/6HAYAHG8H0
WRI (World Resource Institute). (1998) Watersheds of the World: An Assessment of the Ecological Value and Vulnerability of the World’s Watersheds. Washington DC.