Embed Size (px)
Citation preview
The GET Service project (http://www.getservice-project.eu) has received funding from the European Commission under the 7th Framework Programme (FP7) for Research and Technological Development under grant agreement n°2012-318275.
03 August 2015
Public Document
ICT-2011.8 GET Service Project
2012-318275
Deliverable D6.4.1: Automatic aggregation rule
generation engine
03 August 2015 Public Document
GET Service ICT-2012-318275 ©GET Service consortium 1
Project acronym: GET Service Project full title: Service Platform for Green European
Transportation
Work package: 6 Document number: D6.4.1
Document title: Automatic aggregation rule generation engine
Version: 1.1
Delivery date: 31 July 2015 (M34) Actual publication date: TBA
Dissemination level: Public Nature: Status:
Prototype
Editor(s) / lead beneficiary: HPI Authors(s): Kimon Batoulis, Anne Baumgrass, Claudio
Di Ciccio, Rami-Habib Eid-Sabbagh, Marcin
Hewelt, Andreas Meyer, Marian Pufahl, Tsun Wong
Reviewer(s): Andreas Raptopoulos, Casper van der Harst
03 August 2015 Public Document
GET Service ICT-2012-318275 ©GET Service consortium 2
History
Version Changes Authors
0.1 Created initial structure and first thoughts on content to be placed in the deliverable
A. Baumgrass
0.21 Described user interface of replayer T. Wong
0.22 Added introduction for replayer M Hewelt
0.23 Revised replayer A. Baumgrass
0.3 Included description to prototypes A. Baumgrass, A. Meyer, M. Pufahl
0.4 Added a description for the outlook A. Baumgrass, R. Eid-Sabbagh, K. Batoulis
0.5 Discussion of real-world data analysis as preparation for automating the event detection
C. Di Ciccio
0.6 Document Reviewed Andreas Raptopoulos, Casper van der Harst
0.7 Incorporated reviews A. Baumgrass, C. Di Ciccio
0.8 Proofreading M. Hewelt, M. Pufahl
0.81 References added M. Hewelt, C. Di Ciccio
0.9 Deliverable structure and conclusion M. Hewelt
1.0 Submitted version M. Hewelt, C. Di Ciccio
1.1 Merged previous unconsidered changes, final submission A. Baumgrass
03 August 2015 Public Document
GET Service ICT-2012-318275 ©GET Service consortium 3
Executive summary
This deliverable presents extensions and prototypes for UNICORN (formerly: information aggregation engine). It presents approaches for (semi-)automating event processing. In particular, it presents generic mechanisms and implementations to correlate events to (logistics) processes and prototypes to automatically generate business events as well as corresponding event notifications. Furthermore, approaches to analyse, test and integrate real-time information in context of the GET Service project are presented. On this basis, D6.4.1 exemplifies methods for an automatic generation of business events from the continuous stream of real-world sensory events. Similarly, this deliverable presents an excerpt of applications using UNICORN to serve real-time information and event notifications to logistics scenarios. These scenarios showcase the opportunities and benefits of event processing for logistics on the one hand and on the other hand how UNICORN is used to easily define a predefined set of event types and aggregation rules and then automatically provide real-time business events and event notifications to logistics scenarios. The scenarios build upon a specific extension of UNICORN for replaying real-world events that allows implementing such scenarios even faster. Finally, D6.4.1 discusses two more general cases that extend the presented scenarios and serve as basis for implementations and usage to the community for further work in this field.
03 August 2015 Public Document
GET Service ICT-2012-318275 ©GET Service consortium 4
Contents
Executive summary .......................................................................................................................... 3
1 Introduction ................................................................................................................................ 8
1.1 Project Goal .................................................................................................................... 8
1.2 Work package goal ......................................................................................................... 8
1.3 Deliverable goal .............................................................................................................. 9
1.4 Deliverable structure ....................................................................................................... 9
2 Automated correlation of events and processes ....................................................................... 10
2.1 Definition of Process Event Monitoring Points ............................................................... 10
2.2 Automatic Generation of Event Processing Rules ......................................................... 13
2.3 Definition of monitorable tasks in a logistics process ..................................................... 18
3 Real-world logs handling .......................................................................................................... 21
3.1 Data import ................................................................................................................... 21
3.2 Data storage and analytics ............................................................................................ 24
3.3 Shipment simulation and process mining ...................................................................... 25
4 Simulation of real-time events in UNICORN ............................................................................. 29
5 Prototypical implementations for the generation of aggregation rules in logistics scenarios ...... 32
5.1 Batch Monitoring ........................................................................................................... 32
5.2 Multi-Instance Activity Monitoring .................................................................................. 33
5.3 Location-based Monitoring ............................................................................................ 34
5.4 Delay Propagation ......................................................................................................... 36
5.5 Deadline Propagation .................................................................................................... 36
6 Outlook ..................................................................................................................................... 39
6.1 Decision support for monitoring ..................................................................................... 39
6.2 Monitoring and Query Generation with Business Process Architectures (BPA) ............. 40
7 Conclusion ............................................................................................................................... 43
8 Bibliography ............................................................................................................................. 44
03 August 2015 Public Document
GET Service ICT-2012-318275 ©GET Service consortium 5
List of Figures
Figure 1 Model of relations for process models and events ............................................................ 10
Figure 2 BPMN metamodel extension for including PEMPs and life cycles in BPMN models.......... 11
Figure 3 BPMN+X model for including PEMPs and life cycles in BPMN models ............................. 11
Figure 4 XML Schema for the definition of PEMPs and life cycles in BPMN models ....................... 12
Figure 5 Definition of a PEMP for a BPMN activity with XML .......................................................... 13
Figure 6 Logistics scenario as BPMN process model...................................................................... 14
Figure 7 Graph representation of the process model in Figure 6 ..................................................... 14
Figure 8 RPST representation of the graph in Figure 7 ................................................................... 14
Figure 9 Component tree derived from the RPST in Figure 8.......................................................... 14
Figure 10 Activity life cycle .............................................................................................................. 15
Figure 11 Life cycle for events and gateways ................................................................................. 15
Figure 12 UNICORN implementation showing the manipulation opportunities of PEMPs in a BPMN process ........................................................................................................................................... 17
Figure 13 Monitoring queries for the scenario given in Figure 6 using Esper .................................. 17
Figure 14 UNICORN implementation showing the monitoring of process instances ........................ 18
Figure 15 Example specification of a monitorable task for aeroplane transportations ..................... 19
Figure 16 Real-world data handling approach ................................................................................. 21
Figure 17 Data collection periods at JdR ........................................................................................ 22
Figure 18 An excerpt of an XML document of the JdR truck fleet tracking system .......................... 22
Figure 19 An excerpt of the JdR shipment reports .......................................................................... 23
Figure 20 An excerpt of encoded Java class that bridges the XML-based truck monitoring information with the unique collecting database .............................................................................. 24
Figure 21 Database schema for truck data ..................................................................................... 25
Figure 22 Representation of truck movements on a map. Light areas represent the regions in which the majority of activities have been performed ................................................................................ 26
Figure 23 Reported traffic jams ....................................................................................................... 26
Figure 24 The route of a truck in a shipment from Brussels to Amsterdam .................................... 27
Figure 25 The route of a truck in a shipment from Frankfurt to Amsterdam ..................................... 27
Figure 26 The process mined from the truck shipment log. The thickness of lines represent the frequency with which activity-based transitions were enacted as per the event log ......................... 28
Figure 27: Access to Replayer ........................................................................................................ 29
Figure 28: Upload interface for events in Replayer ......................................................................... 29
Figure 29: Interface for events to be replayed ................................................................................. 30
Figure 30: Replay thread has been started ..................................................................................... 31
Figure 31: Interface for progress of replay threads .......................................................................... 31
Figure 32 Batch monitoring example ............................................................................................... 33
Figure 33 Multi-instance monitoring example .................................................................................. 34
Figure 34 Important information on the transport from Roosendaal to Eindhoven is shown in the front end ......................................................................................................................................... 34
Figure 35 Visualization of the weather warning events.................................................................... 35
Figure 36 Main view of the Noldep web interface, unexpected events are colored red, regular execution in blue and effect of delay propagation for process steps in green .................................. 36
Figure 37 Logistics example with processes (solid lines) and selected operator assignments (dashed lines) ................................................................................................................................. 37
03 August 2015 Public Document
GET Service ICT-2012-318275 ©GET Service consortium 6
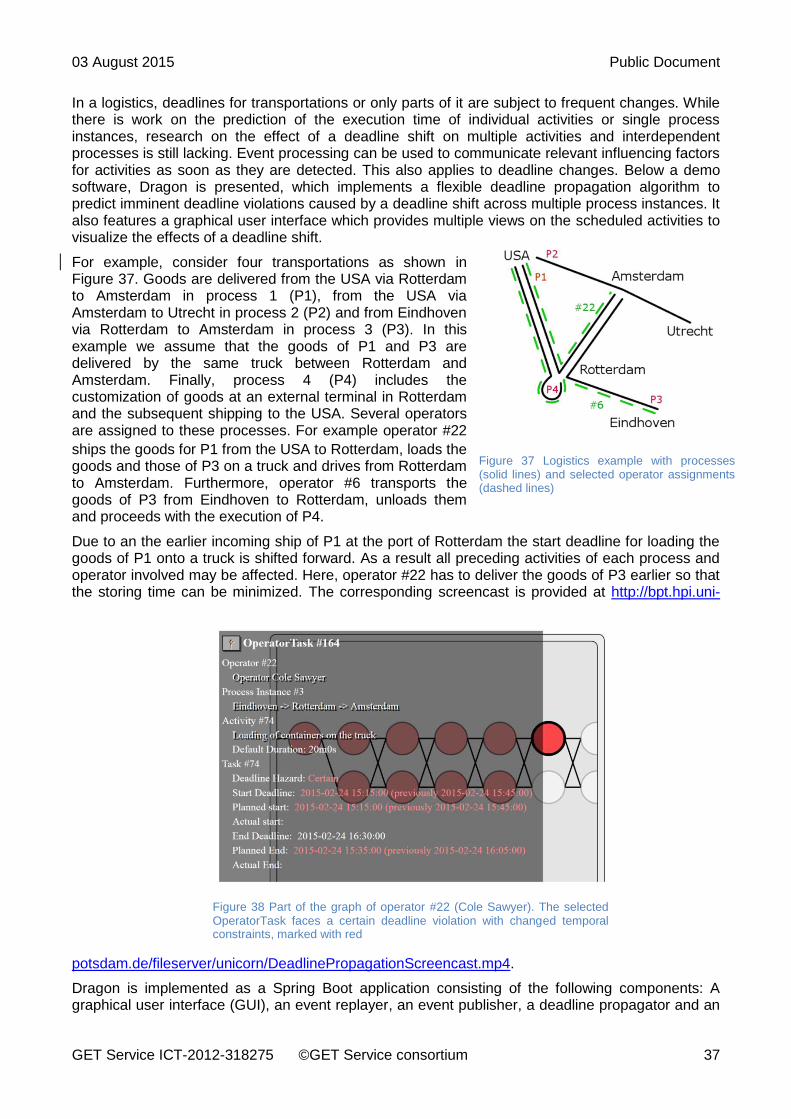
Figure 38 Part of the graph of operator #22 (Cole Sawyer). The selected OperatorTask faces a certain deadline violation with changed temporal constraints, marked with red ............................... 37
Figure 39 Process Relation Types .................................................................................................. 40
Figure 40: The Business Process Architecture (BPA) of the GET Service Scenario 1 – Multi-modal planning .......................................................................................................................................... 41
Figure 41: Monitoring with BPAs ..................................................................................................... 42
Figure 42: BPA Event Occurrence for Detection of Events and Prediction ...................................... 42
List of Tables
Table 1 Results of evaluating the different monitoring strategies .................................................... 39
Table 2: Process Relations ............................................................................................................. 41
03 August 2015 Public Document
GET Service ICT-2012-318275 ©GET Service consortium 7
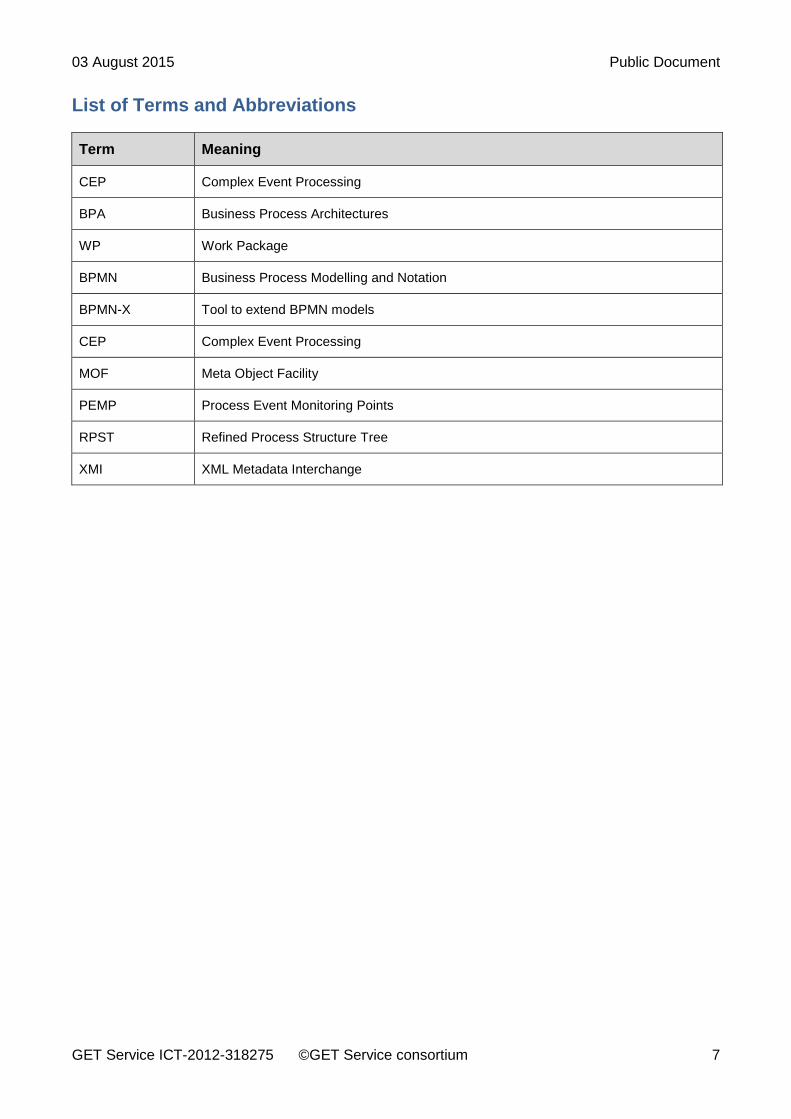
List of Terms and Abbreviations
Term Meaning
CEP Complex Event Processing
BPA Business Process Architectures
WP Work Package
BPMN Business Process Modelling and Notation
BPMN-X Tool to extend BPMN models
CEP Complex Event Processing
MOF Meta Object Facility
PEMP Process Event Monitoring Points
RPST Refined Process Structure Tree
XMI XML Metadata Interchange
03 August 2015 Public Document
GET Service ICT-2012-318275 ©GET Service consortium 8
1 Introduction
This deliverable presents extensions and prototypes for UNICORN (formerly: information aggregation engine) used for the (semi-)automated generation of business events, aggregation and correlation rules, as well as approaches to analyse, test and integrate these in context of the GET Service project. The prototype and details to UNICORN are available at http://bpt.hpi.uni-potsdam.de/UNICORN. This section provides the background to this deliverable, by presenting the goal of the project as a whole, the goal of the work package of which the deliverable is a part, and the goal of the deliverable itself. Finally, it presents the structure of the remainder of the deliverable.
1.1 Project Goal
The GET Service platform provides transportation planners with the means to plan transportation routes more efficiently and to respond quickly to unexpected events during transportation. To this end, it connects to existing transportation management systems and improves on their performance by enabling sharing of selected information between transportation partners, logistics service providers and authorities. In particular, the GET Service platform consists of components that: (i) enable aggregation of information from the raw data that is shared between partners and transportation information providers; (ii) facilitate planning and re-planning of transportation based on that real-time information; and (iii) facilitate real-time monitoring and control of transportation, as it is being carried out by own resources and partner resources. By providing this functionality, the GET Service platform aims to reduce the number of empty miles that is driven, improve the modal split, and reduce transportation times and slack, as well as response times to unexpected events during transportation. Thus it reduces CO2 emissions and improves efficiency.
1.2 Work package goal
WP6 aims at providing the foundation for the planning and service composition work packages by providing accurate state information of service composition instances, with the help of event processing (GET Service, 2012). Therefore, its main objectives include the identification, capture, and dissemination of events that can occur during the transportation of goods. This involves operations in charge of processing the raw events captured from devices (e.g. locations as longitude and latitude), from the environment (e.g., weather conditions), or emitted by other systems (e.g. sensors attached to trucks), for example aggregating events to provide them with a specific meaning, and correlating events to specific activities that are carried out in the transportation.
In the GET Service project, WP6 has connections to several work packages, which deliver, specify, or consume transportation-related information and events (cf. (GET Service, 2012)). WP1 is the requirements analysis work package that delivers information about the scenarios and use cases that are relevant for the project. WP2 to WP7 are the development work packages. WP2 defines the structure of the GET Service architecture, including a standardisation of the interfaces (data flows) between the different components. This architecture serves as basis to integrate the implementation of the aggregation service developed in WP6. In WP3, PC-based and mobile device-based user interfaces for end-user services will be developed for both transportation management and route planning that support run-time aggregated transportation planning and control. The interaction with the user that is enabled through these services can also be captured as events and needs to be processed in the aggregation service. WP4 is aimed at defining a domain-specific modelling language that allows the representation of transportation processes and the coordination of all the parties involved in the platform at run-time. As a consequence, events must be associated to the activities defined in the process models so that they can be automatically monitored together with the other elements. Regarding WP5, planning systems require run-time information about transportation, e.g. current train schedules, available assets or capacities and infrastructures. This information might be captured as events or as persistent information that needs to be aggregated
03 August 2015 Public Document
GET Service ICT-2012-318275 ©GET Service consortium 9
and correlated with events, e.g. to ensure the assets and capacities are actually available as shown in the GET Service platform.
Furthermore, re-planning might be required when unexpected events are detected, e.g. a terminal closed due to construction sites for an unlimited period of time. Therefore, providing accurate event definitions as early as possible is of utmost importance to execute proper re-planning operations. Finally, WP7 requires the specification of events and the aggregation service to support the orchestration of transportation-specific control structures, defined using the concepts developed in WP4. This orchestration should provide novel reconfiguration techniques to support adaptions of running transportation-specific control structures. Therefore, the processing activities mentioned above will be represented in the process models developed in WP4 or required for the purpose of tasks in WP7.
The deployment of the aggregation service requires the other components to specify the structure of events and information that the user interface forwards and that the transport service, the run-time aggregated planning and the orchestration service require.
1.3 Deliverable goal
D6.4.1 aims at providing prototypes for (semi‐) automatically generating business events from the
continuous stream of sensory events. This involves an analysis of the approaches that are required for correlating and aggregating sensory events towards providing business events and state information. For this purpose, the deliverable further includes testing opportunities for event processing, correlation as well as aggregation and pre-processing approaches for logistics in the context of the GET Service project.
For this purpose, the prototypes and extensions provided in this deliverable build upon or are provided for UNICORN (formerly: information aggregation engine), whose implementation is summarized in D6.3. In the end, the deliverable is supposed to serve as basis for implementations that succeed the GET Service project.
1.4 Deliverable structure
The remainder of this deliverable is structured as follows. Section 2 presents ways to automatically generate event queries from process models to facilitate monitoring. Section 3 analyses real-world events and reports the results of this analysis. Section 4 describes the EventReplayer component, which allows to simulate scenarios by sending prepared events in a certain order to the event engine. The approaches presented in Section 5 make use of the EventReplayer and showcase advanced usage scenarios for the event engine in the logistics domain. The outlook in Section 6 sketches further approaches for supporting decisions during monitoring and generating event subscriptions based on Business Process Architectures, an abstracted view on process models. Finally, Section 7 concludes this deliverable.
03 August 2015 Public Document
GET Service ICT-2012-318275 ©GET Service consortium 10
2 Automated correlation of events and processes
Business Process Management (BPM) and Complex Event Processing (CEP) are two individual approaches to manage the work in organisations and to analyse data streams of happenings. Targeting the monitoring of business processes and their execution requires a combination of both worlds, since the data streams provide information about process execution. Typically, business process execution is monitored by Business Process Management Systems (BPMS) on the basis of a process model. In distributed environments such as logistics, however, parts of this execution can only be monitored via CEP techniques. In the following subsections, several approaches researched in the context of GET Service are presented to establish the connection between BPM and CEP.
2.1 Definition of Process Event Monitoring Points
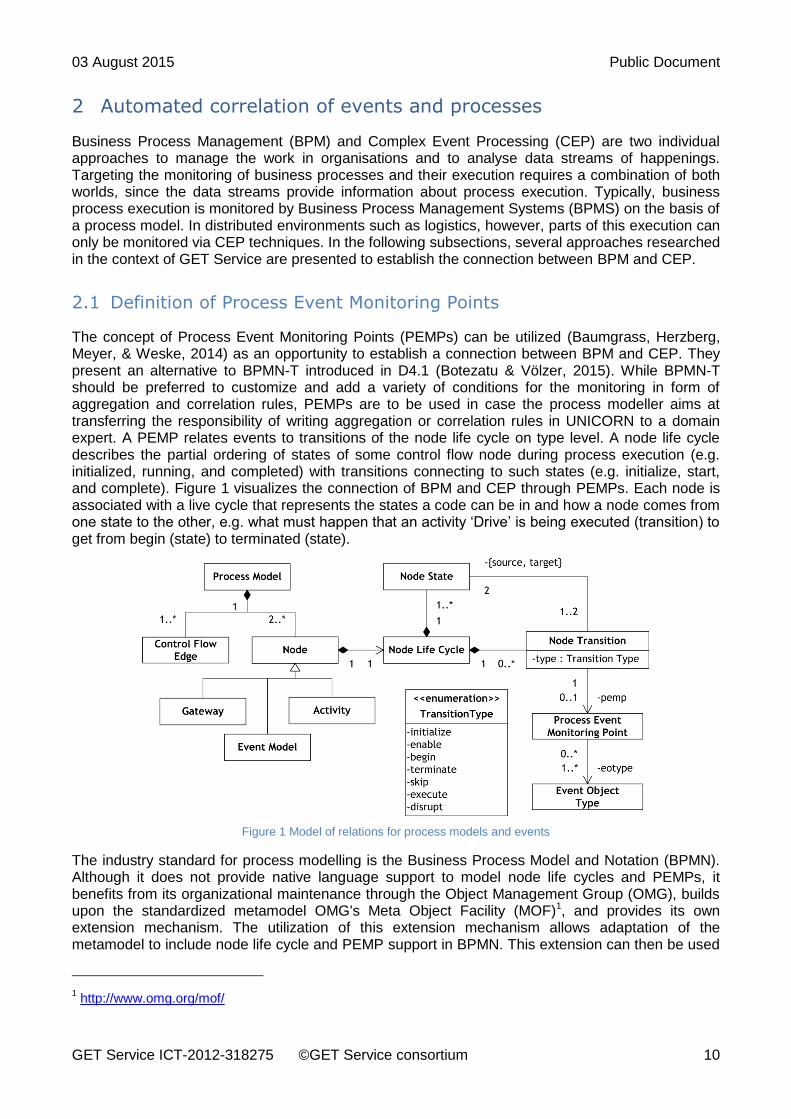
The concept of Process Event Monitoring Points (PEMPs) can be utilized (Baumgrass, Herzberg, Meyer, & Weske, 2014) as an opportunity to establish a connection between BPM and CEP. They present an alternative to BPMN-T introduced in D4.1 (Botezatu & Völzer, 2015). While BPMN-T should be preferred to customize and add a variety of conditions for the monitoring in form of aggregation and correlation rules, PEMPs are to be used in case the process modeller aims at transferring the responsibility of writing aggregation or correlation rules in UNICORN to a domain expert. A PEMP relates events to transitions of the node life cycle on type level. A node life cycle describes the partial ordering of states of some control flow node during process execution (e.g. initialized, running, and completed) with transitions connecting to such states (e.g. initialize, start, and complete). Figure 1 visualizes the connection of BPM and CEP through PEMPs. Each node is associated with a live cycle that represents the states a code can be in and how a node comes from one state to the other, e.g. what must happen that an activity ‘Drive’ is being executed (transition) to get from begin (state) to terminated (state).
Figure 1 Model of relations for process models and events
The industry standard for process modelling is the Business Process Model and Notation (BPMN). Although it does not provide native language support to model node life cycles and PEMPs, it benefits from its organizational maintenance through the Object Management Group (OMG), builds upon the standardized metamodel OMG's Meta Object Facility (MOF)1, and provides its own extension mechanism. The utilization of this extension mechanism allows adaptation of the metamodel to include node life cycle and PEMP support in BPMN. This extension can then be used
1 http://www.omg.org/mof/
03 August 2015 Public Document
GET Service ICT-2012-318275 ©GET Service consortium 11
to transform a process model into CEP-specific code for event detection. This enables the monitoring of events in distributed systems that are associated with a single business process (see Section 2.2).
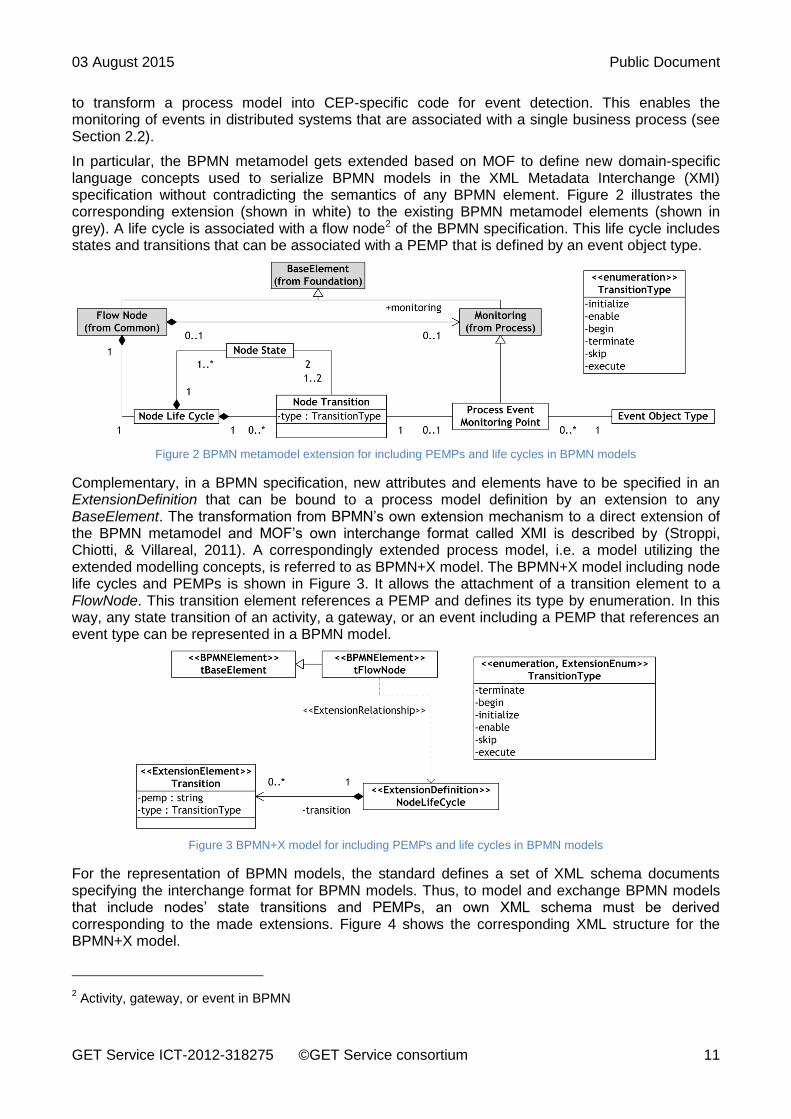
In particular, the BPMN metamodel gets extended based on MOF to define new domain-specific language concepts used to serialize BPMN models in the XML Metadata Interchange (XMI) specification without contradicting the semantics of any BPMN element. Figure 2 illustrates the corresponding extension (shown in white) to the existing BPMN metamodel elements (shown in grey). A life cycle is associated with a flow node2 of the BPMN specification. This life cycle includes states and transitions that can be associated with a PEMP that is defined by an event object type.
Figure 2 BPMN metamodel extension for including PEMPs and life cycles in BPMN models
Complementary, in a BPMN specification, new attributes and elements have to be specified in an ExtensionDefinition that can be bound to a process model definition by an extension to any BaseElement. The transformation from BPMN’s own extension mechanism to a direct extension of the BPMN metamodel and MOF’s own interchange format called XMI is described by (Stroppi, Chiotti, & Villareal, 2011). A correspondingly extended process model, i.e. a model utilizing the extended modelling concepts, is referred to as BPMN+X model. The BPMN+X model including node life cycles and PEMPs is shown in Figure 3. It allows the attachment of a transition element to a FlowNode. This transition element references a PEMP and defines its type by enumeration. In this way, any state transition of an activity, a gateway, or an event including a PEMP that references an event type can be represented in a BPMN model.
Figure 3 BPMN+X model for including PEMPs and life cycles in BPMN models
For the representation of BPMN models, the standard defines a set of XML schema documents specifying the interchange format for BPMN models. Thus, to model and exchange BPMN models that include nodes’ state transitions and PEMPs, an own XML schema must be derived corresponding to the made extensions. Figure 4 shows the corresponding XML structure for the BPMN+X model.
2 Activity, gateway, or event in BPMN
03 August 2015 Public Document
GET Service ICT-2012-318275 ©GET Service consortium 12
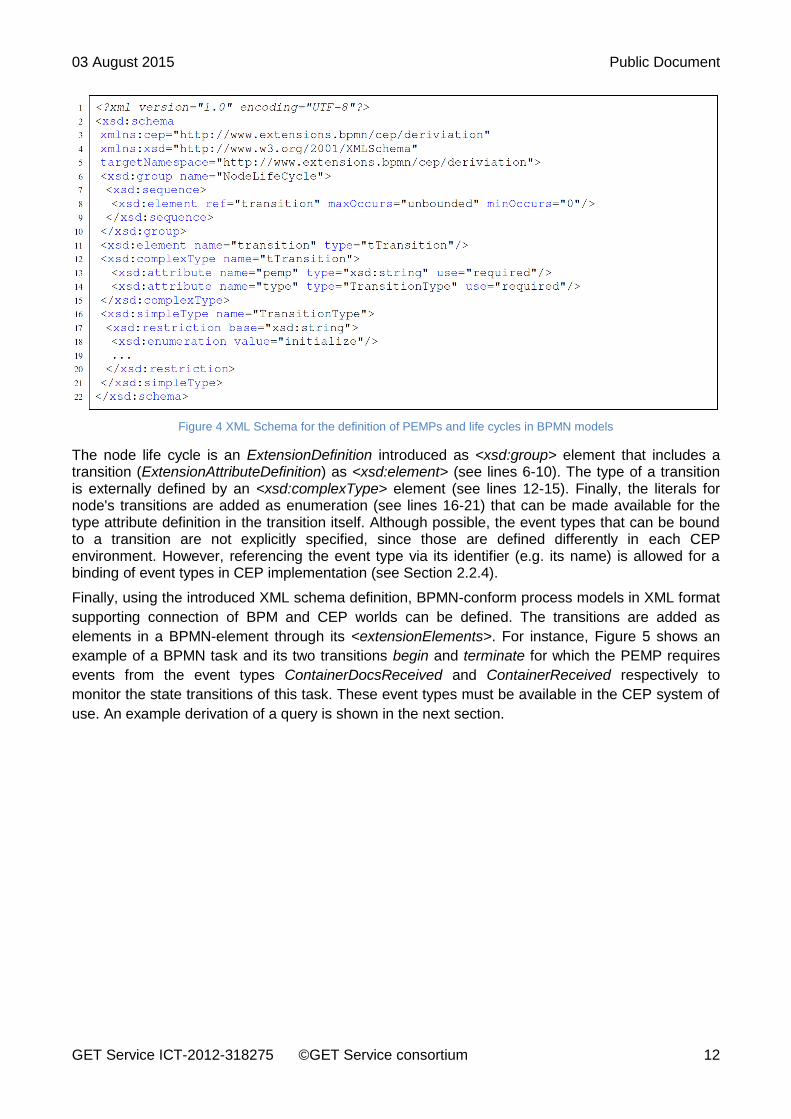
Figure 4 XML Schema for the definition of PEMPs and life cycles in BPMN models
The node life cycle is an ExtensionDefinition introduced as <xsd:group> element that includes a transition (ExtensionAttributeDefinition) as <xsd:element> (see lines 6-10). The type of a transition is externally defined by an <xsd:complexType> element (see lines 12-15). Finally, the literals for node's transitions are added as enumeration (see lines 16-21) that can be made available for the type attribute definition in the transition itself. Although possible, the event types that can be bound to a transition are not explicitly specified, since those are defined differently in each CEP environment. However, referencing the event type via its identifier (e.g. its name) is allowed for a binding of event types in CEP implementation (see Section 2.2.4).
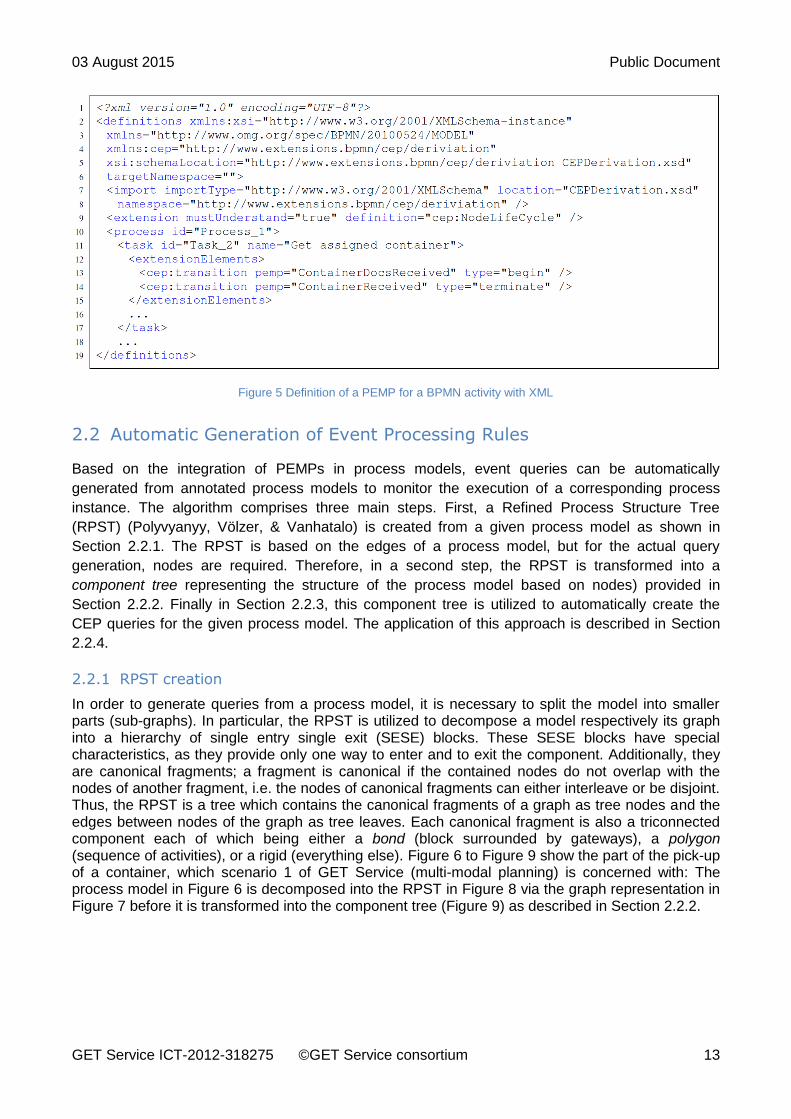
Finally, using the introduced XML schema definition, BPMN-conform process models in XML format
supporting connection of BPM and CEP worlds can be defined. The transitions are added as
elements in a BPMN-element through its <extensionElements>. For instance, Figure 5 shows an
example of a BPMN task and its two transitions begin and terminate for which the PEMP requires
events from the event types ContainerDocsReceived and ContainerReceived respectively to
monitor the state transitions of this task. These event types must be available in the CEP system of
use. An example derivation of a query is shown in the next section.
03 August 2015 Public Document
GET Service ICT-2012-318275 ©GET Service consortium 13
Figure 5 Definition of a PEMP for a BPMN activity with XML
2.2 Automatic Generation of Event Processing Rules
Based on the integration of PEMPs in process models, event queries can be automatically
generated from annotated process models to monitor the execution of a corresponding process
instance. The algorithm comprises three main steps. First, a Refined Process Structure Tree
(RPST) (Polyvyanyy, Völzer, & Vanhatalo) is created from a given process model as shown in
Section 2.2.1. The RPST is based on the edges of a process model, but for the actual query
generation, nodes are required. Therefore, in a second step, the RPST is transformed into a
component tree representing the structure of the process model based on nodes) provided in
Section 2.2.2. Finally in Section 2.2.3, this component tree is utilized to automatically create the
CEP queries for the given process model. The application of this approach is described in Section
2.2.4.
2.2.1 RPST creation
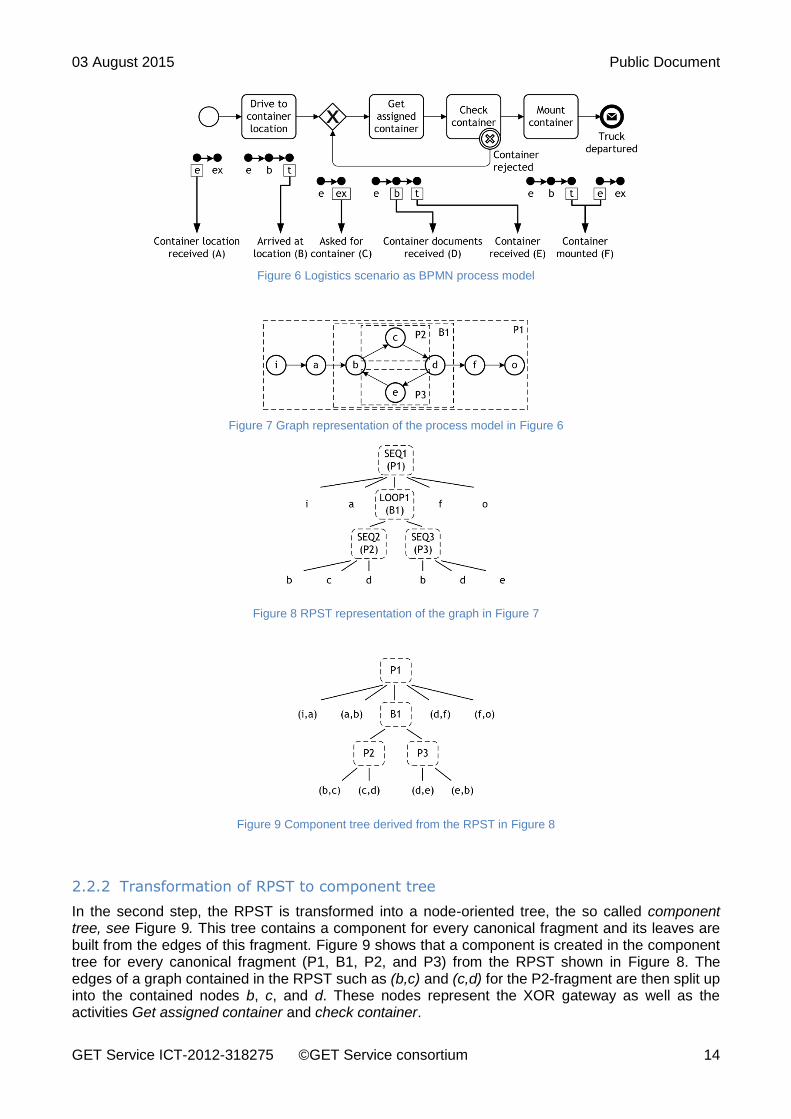
In order to generate queries from a process model, it is necessary to split the model into smaller parts (sub-graphs). In particular, the RPST is utilized to decompose a model respectively its graph into a hierarchy of single entry single exit (SESE) blocks. These SESE blocks have special characteristics, as they provide only one way to enter and to exit the component. Additionally, they are canonical fragments; a fragment is canonical if the contained nodes do not overlap with the nodes of another fragment, i.e. the nodes of canonical fragments can either interleave or be disjoint. Thus, the RPST is a tree which contains the canonical fragments of a graph as tree nodes and the edges between nodes of the graph as tree leaves. Each canonical fragment is also a triconnected component each of which being either a bond (block surrounded by gateways), a polygon (sequence of activities), or a rigid (everything else). Figure 6 to Figure 9 show the part of the pick-up of a container, which scenario 1 of GET Service (multi-modal planning) is concerned with: The process model in Figure 6 is decomposed into the RPST in Figure 8 via the graph representation in Figure 7 before it is transformed into the component tree (Figure 9) as described in Section 2.2.2.
03 August 2015 Public Document
GET Service ICT-2012-318275 ©GET Service consortium 14
Figure 6 Logistics scenario as BPMN process model
Figure 7 Graph representation of the process model in Figure 6
Figure 8 RPST representation of the graph in Figure 7
Figure 9 Component tree derived from the RPST in Figure 8
2.2.2 Transformation of RPST to component tree
In the second step, the RPST is transformed into a node-oriented tree, the so called component tree, see Figure 9. This tree contains a component for every canonical fragment and its leaves are built from the edges of this fragment. Figure 9 shows that a component is created in the component tree for every canonical fragment (P1, B1, P2, and P3) from the RPST shown in Figure 8. The edges of a graph contained in the RPST such as (b,c) and (c,d) for the P2-fragment are then split up into the contained nodes b, c, and d. These nodes represent the XOR gateway as well as the activities Get assigned container and check container.
03 August 2015 Public Document
GET Service ICT-2012-318275 ©GET Service consortium 15
2.2.3 Query generation from component tree
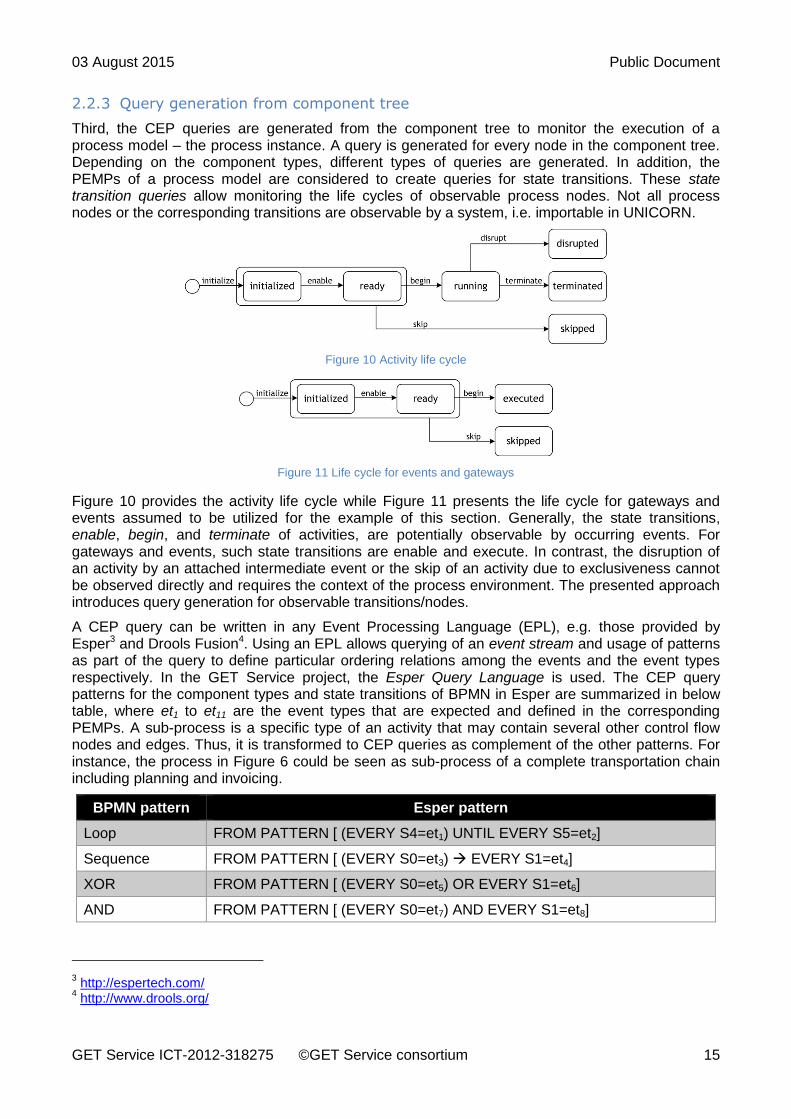
Third, the CEP queries are generated from the component tree to monitor the execution of a process model – the process instance. A query is generated for every node in the component tree. Depending on the component types, different types of queries are generated. In addition, the PEMPs of a process model are considered to create queries for state transitions. These state transition queries allow monitoring the life cycles of observable process nodes. Not all process nodes or the corresponding transitions are observable by a system, i.e. importable in UNICORN.
Figure 10 Activity life cycle
Figure 11 Life cycle for events and gateways
Figure 10 provides the activity life cycle while Figure 11 presents the life cycle for gateways and events assumed to be utilized for the example of this section. Generally, the state transitions, enable, begin, and terminate of activities, are potentially observable by occurring events. For gateways and events, such state transitions are enable and execute. In contrast, the disruption of an activity by an attached intermediate event or the skip of an activity due to exclusiveness cannot be observed directly and requires the context of the process environment. The presented approach introduces query generation for observable transitions/nodes.
A CEP query can be written in any Event Processing Language (EPL), e.g. those provided by Esper3 and Drools Fusion4. Using an EPL allows querying of an event stream and usage of patterns as part of the query to define particular ordering relations among the events and the event types respectively. In the GET Service project, the Esper Query Language is used. The CEP query patterns for the component types and state transitions of BPMN in Esper are summarized in below table, where et1 to et11 are the event types that are expected and defined in the corresponding PEMPs. A sub-process is a specific type of an activity that may contain several other control flow nodes and edges. Thus, it is transformed to CEP queries as complement of the other patterns. For instance, the process in Figure 6 could be seen as sub-process of a complete transportation chain including planning and invoicing.
BPMN pattern Esper pattern
Loop FROM PATTERN [ (EVERY S4=et1) UNTIL EVERY S5=et2]
Sequence FROM PATTERN [ (EVERY S0=et3) EVERY S1=et4]
XOR FROM PATTERN [ (EVERY S0=et5) OR EVERY S1=et6]
AND FROM PATTERN [ (EVERY S0=et7) AND EVERY S1=et8]
3 http://espertech.com/
4 http://www.drools.org/
03 August 2015 Public Document
GET Service ICT-2012-318275 ©GET Service consortium 16
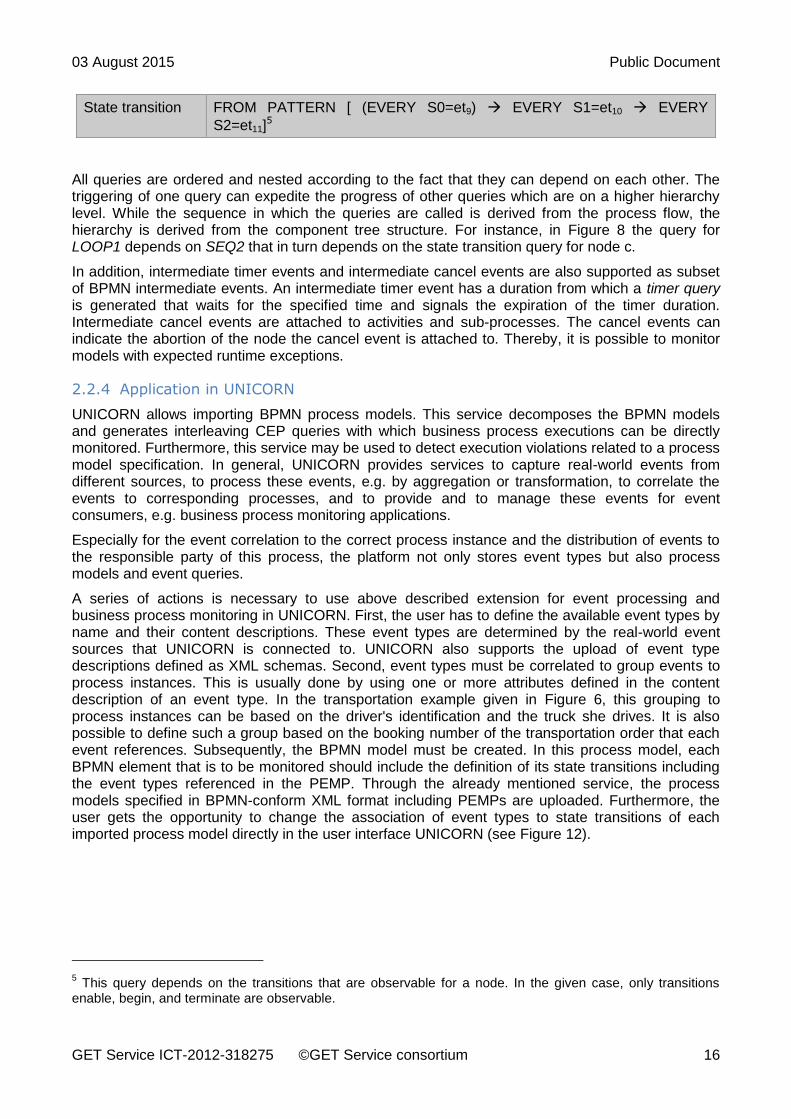
State transition FROM PATTERN [ (EVERY S0=et9) EVERY S1=et10 EVERY
S2=et11]5
All queries are ordered and nested according to the fact that they can depend on each other. The triggering of one query can expedite the progress of other queries which are on a higher hierarchy level. While the sequence in which the queries are called is derived from the process flow, the hierarchy is derived from the component tree structure. For instance, in Figure 8 the query for LOOP1 depends on SEQ2 that in turn depends on the state transition query for node c.
In addition, intermediate timer events and intermediate cancel events are also supported as subset of BPMN intermediate events. An intermediate timer event has a duration from which a timer query is generated that waits for the specified time and signals the expiration of the timer duration. Intermediate cancel events are attached to activities and sub-processes. The cancel events can indicate the abortion of the node the cancel event is attached to. Thereby, it is possible to monitor models with expected runtime exceptions.
2.2.4 Application in UNICORN
UNICORN allows importing BPMN process models. This service decomposes the BPMN models and generates interleaving CEP queries with which business process executions can be directly monitored. Furthermore, this service may be used to detect execution violations related to a process model specification. In general, UNICORN provides services to capture real-world events from different sources, to process these events, e.g. by aggregation or transformation, to correlate the events to corresponding processes, and to provide and to manage these events for event consumers, e.g. business process monitoring applications.
Especially for the event correlation to the correct process instance and the distribution of events to the responsible party of this process, the platform not only stores event types but also process models and event queries.
A series of actions is necessary to use above described extension for event processing and business process monitoring in UNICORN. First, the user has to define the available event types by name and their content descriptions. These event types are determined by the real-world event sources that UNICORN is connected to. UNICORN also supports the upload of event type descriptions defined as XML schemas. Second, event types must be correlated to group events to process instances. This is usually done by using one or more attributes defined in the content description of an event type. In the transportation example given in Figure 6, this grouping to process instances can be based on the driver's identification and the truck she drives. It is also possible to define such a group based on the booking number of the transportation order that each event references. Subsequently, the BPMN model must be created. In this process model, each BPMN element that is to be monitored should include the definition of its state transitions including the event types referenced in the PEMP. Through the already mentioned service, the process models specified in BPMN-conform XML format including PEMPs are uploaded. Furthermore, the user gets the opportunity to change the association of event types to state transitions of each imported process model directly in the user interface UNICORN (see Figure 12).
5 This query depends on the transitions that are observable for a node. In the given case, only transitions
enable, begin, and terminate are observable.
03 August 2015 Public Document
GET Service ICT-2012-318275 ©GET Service consortium 17
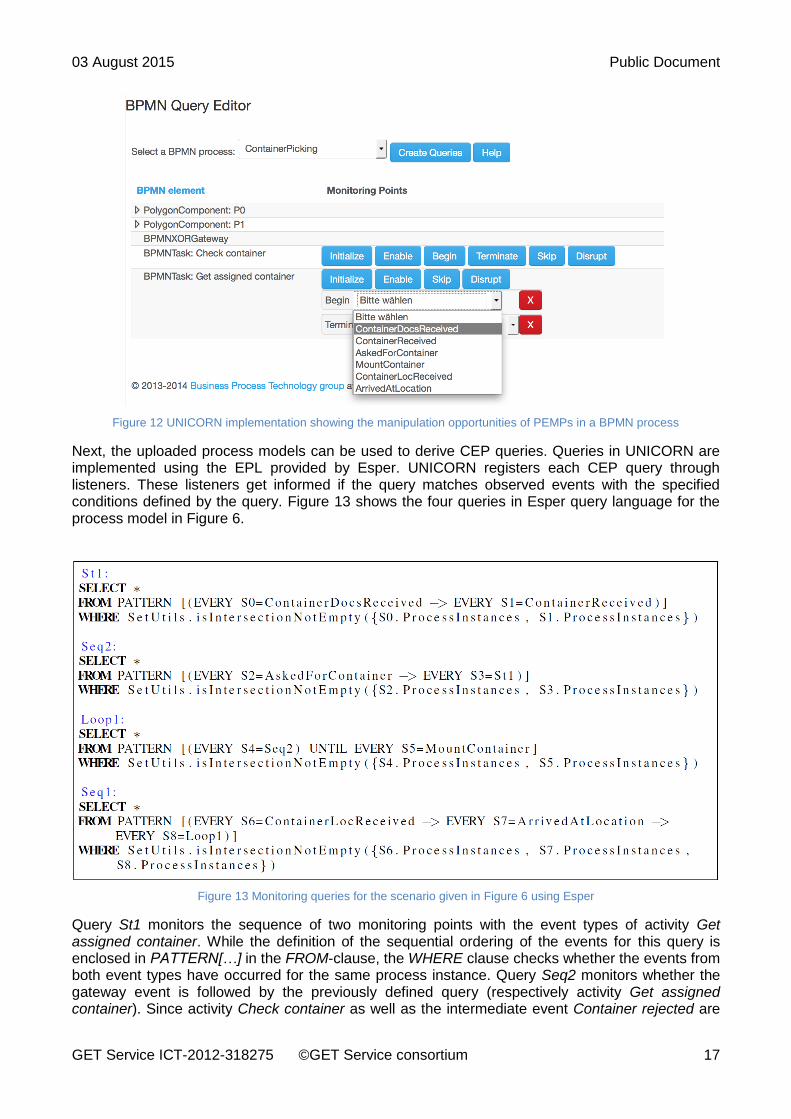
Figure 12 UNICORN implementation showing the manipulation opportunities of PEMPs in a BPMN process
Next, the uploaded process models can be used to derive CEP queries. Queries in UNICORN are implemented using the EPL provided by Esper. UNICORN registers each CEP query through listeners. These listeners get informed if the query matches observed events with the specified conditions defined by the query. Figure 13 shows the four queries in Esper query language for the process model in Figure 6.
Figure 13 Monitoring queries for the scenario given in Figure 6 using Esper
Query St1 monitors the sequence of two monitoring points with the event types of activity Get assigned container. While the definition of the sequential ordering of the events for this query is enclosed in PATTERN[…] in the FROM-clause, the WHERE clause checks whether the events from both event types have occurred for the same process instance. Query Seq2 monitors whether the gateway event is followed by the previously defined query (respectively activity Get assigned container). Since activity Check container as well as the intermediate event Container rejected are
03 August 2015 Public Document
GET Service ICT-2012-318275 ©GET Service consortium 18
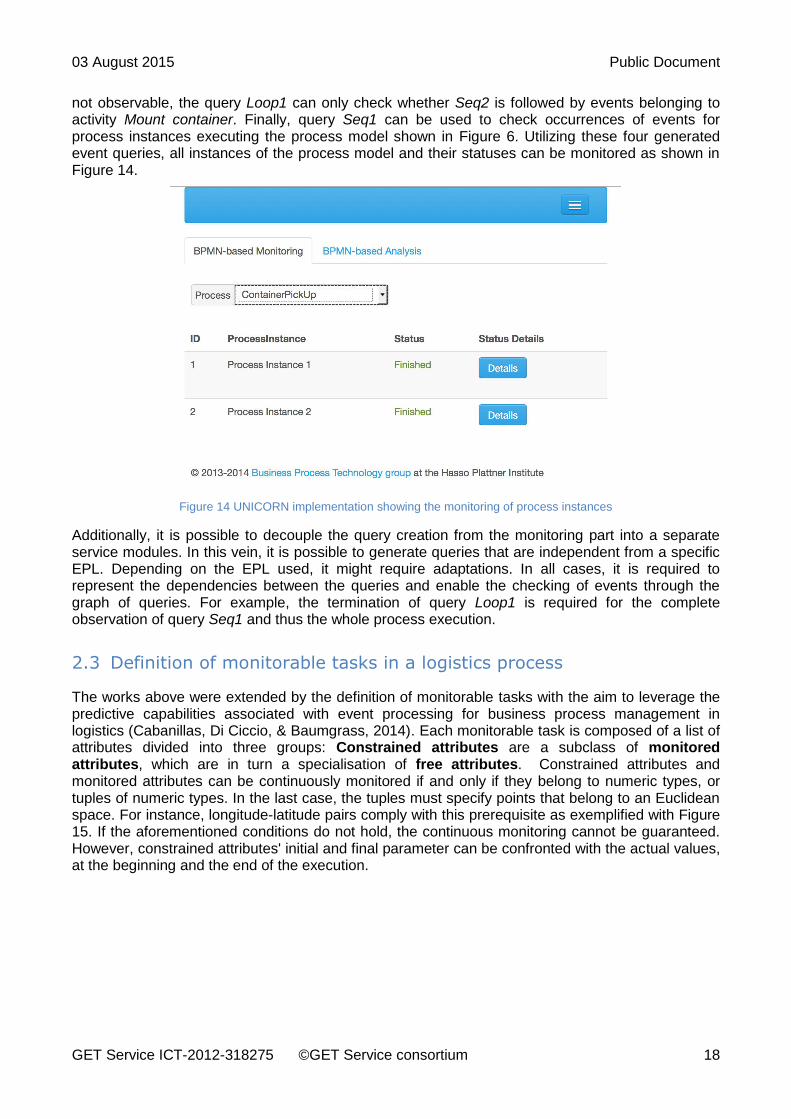
not observable, the query Loop1 can only check whether Seq2 is followed by events belonging to activity Mount container. Finally, query Seq1 can be used to check occurrences of events for process instances executing the process model shown in Figure 6. Utilizing these four generated event queries, all instances of the process model and their statuses can be monitored as shown in Figure 14.
Figure 14 UNICORN implementation showing the monitoring of process instances
Additionally, it is possible to decouple the query creation from the monitoring part into a separate service modules. In this vein, it is possible to generate queries that are independent from a specific EPL. Depending on the EPL used, it might require adaptations. In all cases, it is required to represent the dependencies between the queries and enable the checking of events through the graph of queries. For example, the termination of query Loop1 is required for the complete observation of query Seq1 and thus the whole process execution.
2.3 Definition of monitorable tasks in a logistics process
The works above were extended by the definition of monitorable tasks with the aim to leverage the predictive capabilities associated with event processing for business process management in logistics (Cabanillas, Di Ciccio, & Baumgrass, 2014). Each monitorable task is composed of a list of attributes divided into three groups: Constrained attributes are a subclass of monitored attributes, which are in turn a specialisation of free attributes. Constrained attributes and monitored attributes can be continuously monitored if and only if they belong to numeric types, or tuples of numeric types. In the last case, the tuples must specify points that belong to an Euclidean space. For instance, longitude-latitude pairs comply with this prerequisite as exemplified with Figure 15. If the aforementioned conditions do not hold, the continuous monitoring cannot be guaranteed. However, constrained attributes' initial and final parameter can be confronted with the actual values, at the beginning and the end of the execution.
03 August 2015 Public Document
GET Service ICT-2012-318275 ©GET Service consortium 19
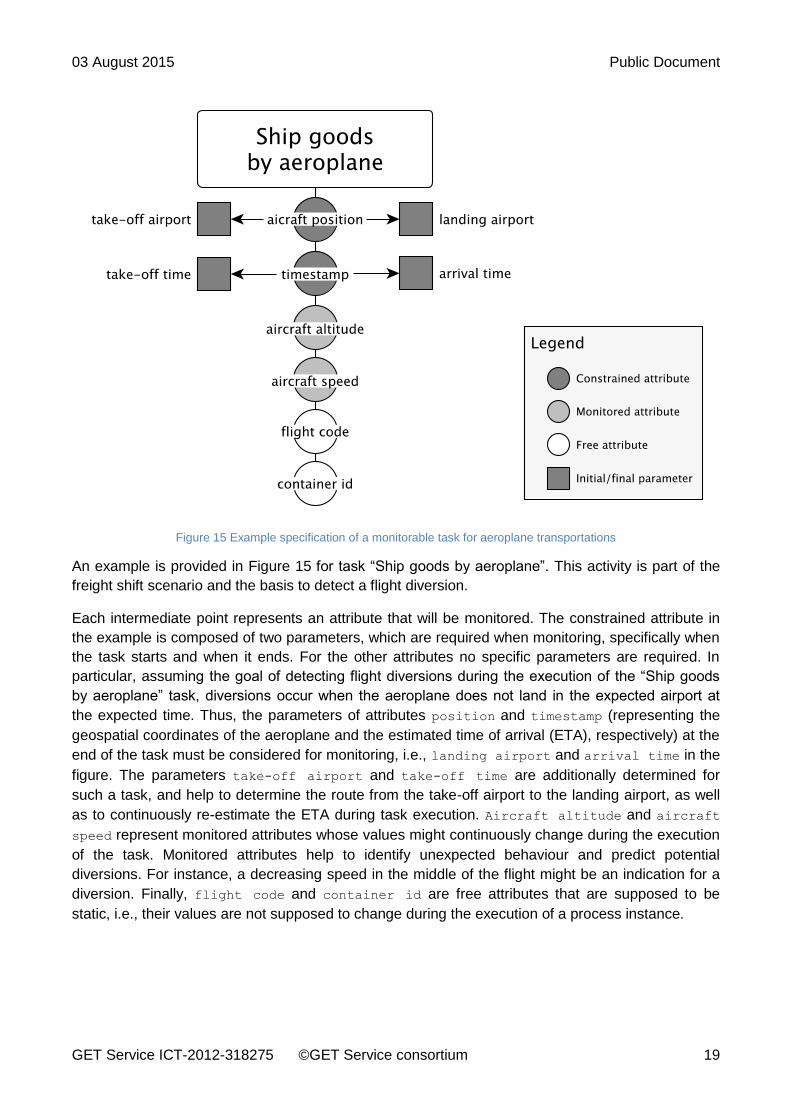
Figure 15 Example specification of a monitorable task for aeroplane transportations
An example is provided in Figure 15 for task “Ship goods by aeroplane”. This activity is part of the
freight shift scenario and the basis to detect a flight diversion.
Each intermediate point represents an attribute that will be monitored. The constrained attribute in
the example is composed of two parameters, which are required when monitoring, specifically when
the task starts and when it ends. For the other attributes no specific parameters are required. In
particular, assuming the goal of detecting flight diversions during the execution of the “Ship goods
by aeroplane” task, diversions occur when the aeroplane does not land in the expected airport at
the expected time. Thus, the parameters of attributes position and timestamp (representing the
geospatial coordinates of the aeroplane and the estimated time of arrival (ETA), respectively) at the
end of the task must be considered for monitoring, i.e., landing airport and arrival time in the
figure. The parameters take-off airport and take-off time are additionally determined for
such a task, and help to determine the route from the take-off airport to the landing airport, as well
as to continuously re-estimate the ETA during task execution. Aircraft altitude and aircraft
speed represent monitored attributes whose values might continuously change during the execution
of the task. Monitored attributes help to identify unexpected behaviour and predict potential
diversions. For instance, a decreasing speed in the middle of the flight might be an indication for a
diversion. Finally, flight code and container id are free attributes that are supposed to be
static, i.e., their values are not supposed to change during the execution of a process instance.
03 August 2015 Public Document
GET Service ICT-2012-318275 ©GET Service consortium 20
To study the effectiveness of this extension for predictions in the context of event processing, a real
case study of an airfreight transportation was conducted which focuses on alerting diversions, i.e.,
the signal to be raised when the aeroplane is going to land in an unplanned airport. As
implementation, Esper was adopted for the event processing and the Scikit-learn6 Python library's
Support Vector Machine to automatically classify regular and diverted flights. An extended
explanation of the usage of this implementation and the underlying classifying algorithm in the
context of the freight shift scenario is given in D6.4.2 (Baumgrass, Di Ciccio, Hewelt, Meyer, &
Pufahl, GET Service Project - Deliverable report D6.4.2: Aggregation rules that support usage
scenarios , 2015).
6 http://scikit-learn.org/
03 August 2015 Public Document
GET Service ICT-2012-318275 ©GET Service consortium 21
3 Real-world logs handling
In the context of GET Service, information based on real-world data has been processed, which stems from the stored logs of our industrial partners. Although, this section of the deliverable for now only focuses on the analysis of Jan de Rijk’s (JdR) logs and documents it gives an impression on the opportunities such data provides for an analysis that serves as input for event processing. All the approaches below are the basis for all three scenarios of the prototype in D2.4.2 (Dijkman, van der Velde, van der Harst, Saraber, Baumgrass, & Völzer, 2015) as well as the evaluation in (Schmiele, Ettinger, & Keller, 2014). For example, currently, a set data of trips transporting cargo between the UK and the Netherlands is analysed inspired by the approaches presented below. The results of such will be described at the end of the GET Service project in WP1 as part of the evaluation and as part of the business model in D8.2 highlighting the benefits of event processing in logistics.
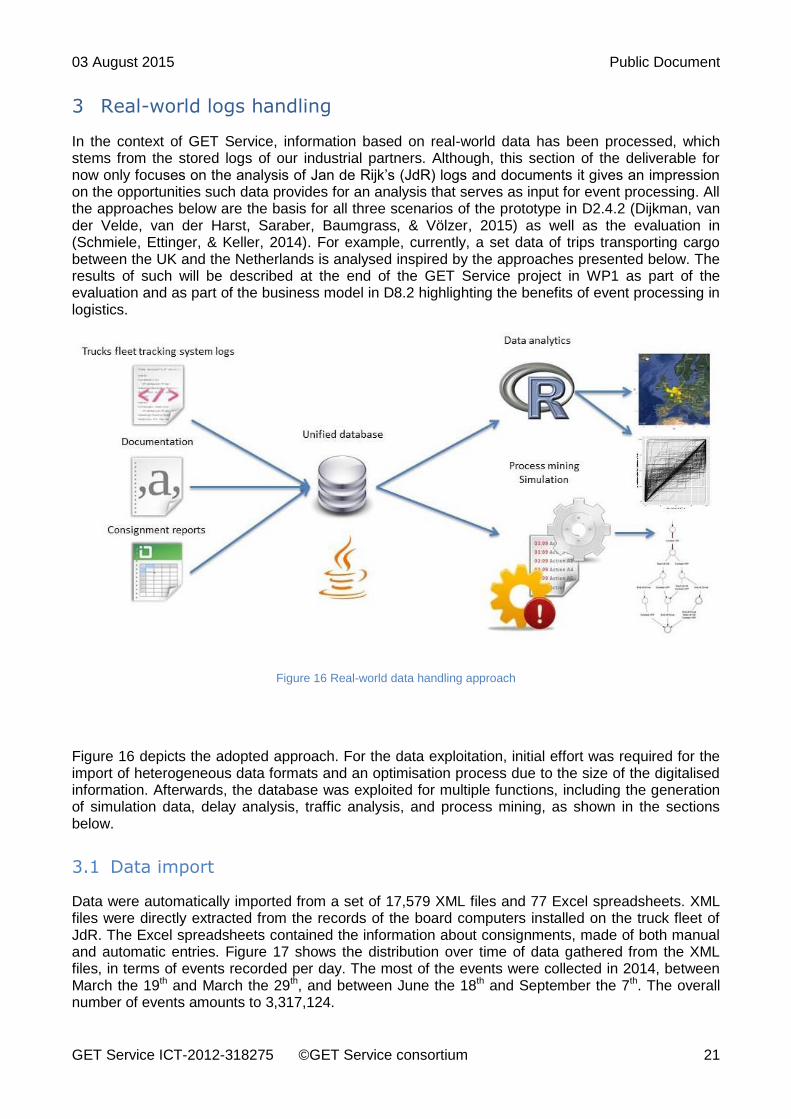
Figure 16 Real-world data handling approach
Figure 16 depicts the adopted approach. For the data exploitation, initial effort was required for the import of heterogeneous data formats and an optimisation process due to the size of the digitalised information. Afterwards, the database was exploited for multiple functions, including the generation of simulation data, delay analysis, traffic analysis, and process mining, as shown in the sections below.
3.1 Data import
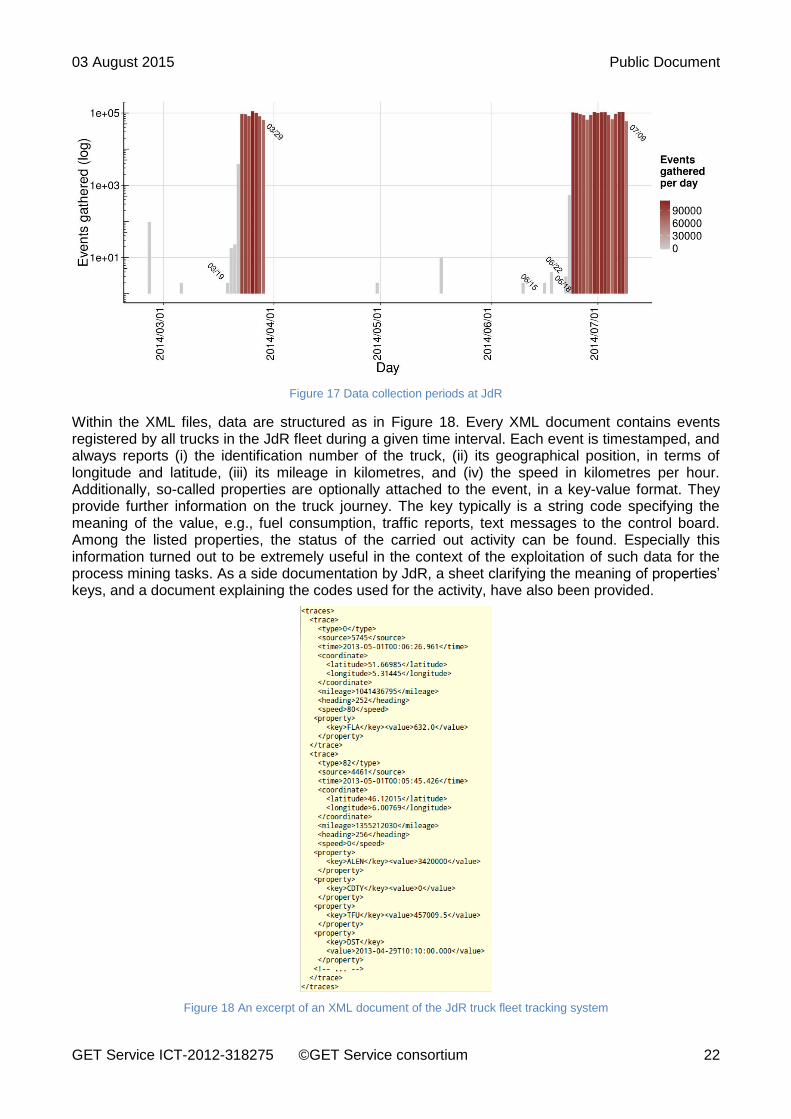
Data were automatically imported from a set of 17,579 XML files and 77 Excel spreadsheets. XML files were directly extracted from the records of the board computers installed on the truck fleet of JdR. The Excel spreadsheets contained the information about consignments, made of both manual and automatic entries. Figure 17 shows the distribution over time of data gathered from the XML files, in terms of events recorded per day. The most of the events were collected in 2014, between March the 19th and March the 29th, and between June the 18th and September the 7th. The overall number of events amounts to 3,317,124.
03 August 2015 Public Document
GET Service ICT-2012-318275 ©GET Service consortium 22
Figure 17 Data collection periods at JdR
Within the XML files, data are structured as in Figure 18. Every XML document contains events registered by all trucks in the JdR fleet during a given time interval. Each event is timestamped, and always reports (i) the identification number of the truck, (ii) its geographical position, in terms of longitude and latitude, (iii) its mileage in kilometres, and (iv) the speed in kilometres per hour. Additionally, so-called properties are optionally attached to the event, in a key-value format. They provide further information on the truck journey. The key typically is a string code specifying the meaning of the value, e.g., fuel consumption, traffic reports, text messages to the control board. Among the listed properties, the status of the carried out activity can be found. Especially this information turned out to be extremely useful in the context of the exploitation of such data for the process mining tasks. As a side documentation by JdR, a sheet clarifying the meaning of properties’ keys, and a document explaining the codes used for the activity, have also been provided.
Figure 18 An excerpt of an XML document of the JdR truck fleet tracking system
03 August 2015 Public Document
GET Service ICT-2012-318275 ©GET Service consortium 23
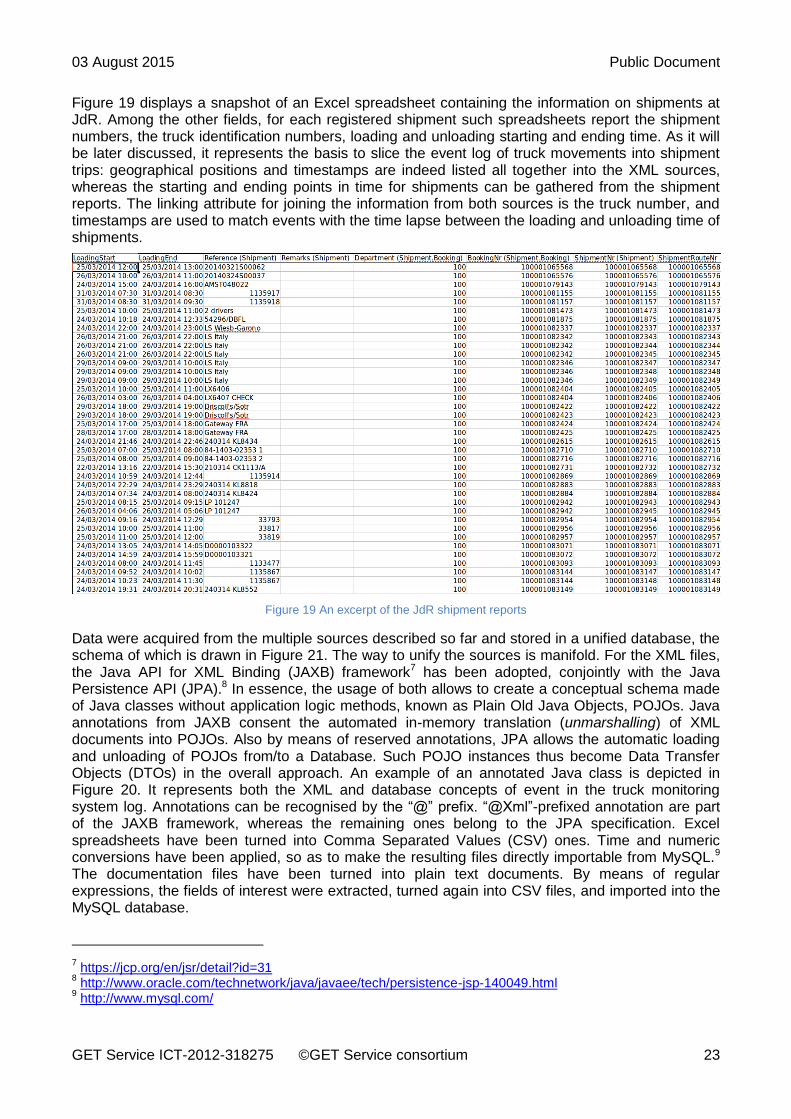
Figure 19 displays a snapshot of an Excel spreadsheet containing the information on shipments at JdR. Among the other fields, for each registered shipment such spreadsheets report the shipment numbers, the truck identification numbers, loading and unloading starting and ending time. As it will be later discussed, it represents the basis to slice the event log of truck movements into shipment trips: geographical positions and timestamps are indeed listed all together into the XML sources, whereas the starting and ending points in time for shipments can be gathered from the shipment reports. The linking attribute for joining the information from both sources is the truck number, and timestamps are used to match events with the time lapse between the loading and unloading time of shipments.
Figure 19 An excerpt of the JdR shipment reports
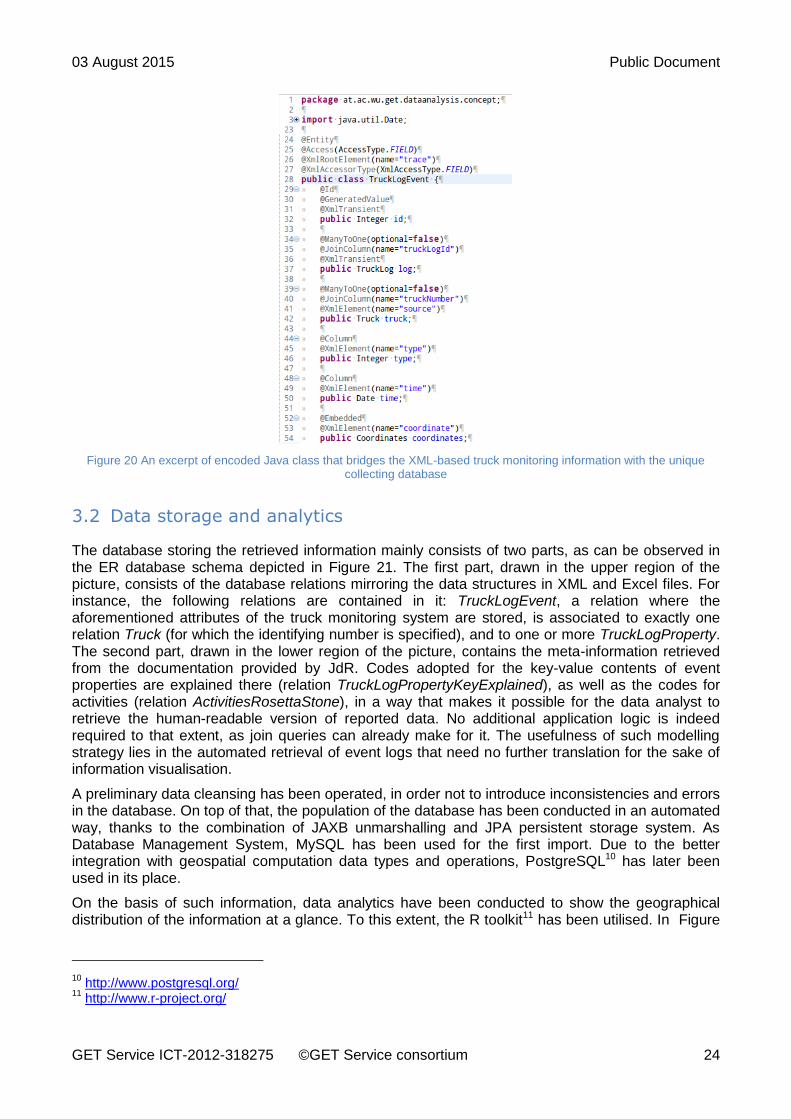
Data were acquired from the multiple sources described so far and stored in a unified database, the schema of which is drawn in Figure 21. The way to unify the sources is manifold. For the XML files, the Java API for XML Binding (JAXB) framework7 has been adopted, conjointly with the Java Persistence API (JPA).8 In essence, the usage of both allows to create a conceptual schema made of Java classes without application logic methods, known as Plain Old Java Objects, POJOs. Java annotations from JAXB consent the automated in-memory translation (unmarshalling) of XML documents into POJOs. Also by means of reserved annotations, JPA allows the automatic loading and unloading of POJOs from/to a Database. Such POJO instances thus become Data Transfer Objects (DTOs) in the overall approach. An example of an annotated Java class is depicted in Figure 20. It represents both the XML and database concepts of event in the truck monitoring system log. Annotations can be recognised by the “@” prefix. “@Xml”-prefixed annotation are part of the JAXB framework, whereas the remaining ones belong to the JPA specification. Excel spreadsheets have been turned into Comma Separated Values (CSV) ones. Time and numeric conversions have been applied, so as to make the resulting files directly importable from MySQL.9 The documentation files have been turned into plain text documents. By means of regular expressions, the fields of interest were extracted, turned again into CSV files, and imported into the MySQL database.
7 https://jcp.org/en/jsr/detail?id=31
8 http://www.oracle.com/technetwork/java/javaee/tech/persistence-jsp-140049.html
9 http://www.mysql.com/
03 August 2015 Public Document
GET Service ICT-2012-318275 ©GET Service consortium 24
Figure 20 An excerpt of encoded Java class that bridges the XML-based truck monitoring information with the unique collecting database
3.2 Data storage and analytics
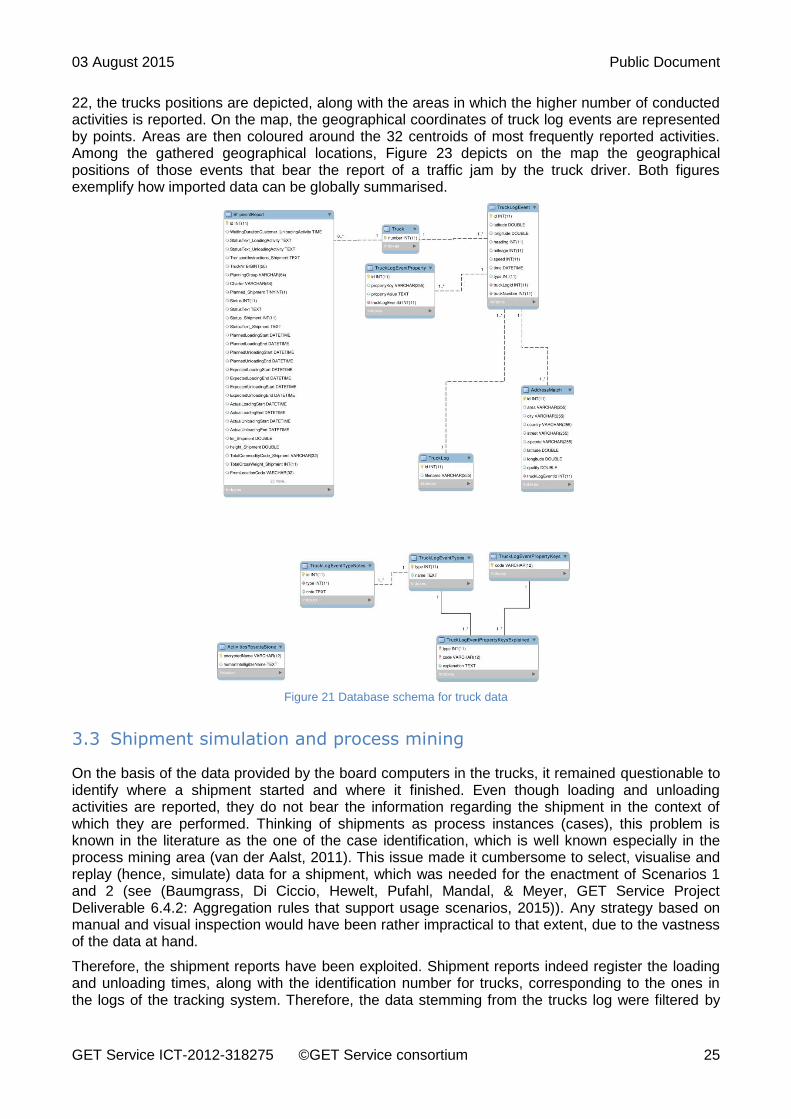
The database storing the retrieved information mainly consists of two parts, as can be observed in the ER database schema depicted in Figure 21. The first part, drawn in the upper region of the picture, consists of the database relations mirroring the data structures in XML and Excel files. For instance, the following relations are contained in it: TruckLogEvent, a relation where the aforementioned attributes of the truck monitoring system are stored, is associated to exactly one relation Truck (for which the identifying number is specified), and to one or more TruckLogProperty. The second part, drawn in the lower region of the picture, contains the meta-information retrieved from the documentation provided by JdR. Codes adopted for the key-value contents of event properties are explained there (relation TruckLogPropertyKeyExplained), as well as the codes for activities (relation ActivitiesRosettaStone), in a way that makes it possible for the data analyst to retrieve the human-readable version of reported data. No additional application logic is indeed required to that extent, as join queries can already make for it. The usefulness of such modelling strategy lies in the automated retrieval of event logs that need no further translation for the sake of information visualisation.
A preliminary data cleansing has been operated, in order not to introduce inconsistencies and errors in the database. On top of that, the population of the database has been conducted in an automated way, thanks to the combination of JAXB unmarshalling and JPA persistent storage system. As Database Management System, MySQL has been used for the first import. Due to the better integration with geospatial computation data types and operations, PostgreSQL10 has later been used in its place.
On the basis of such information, data analytics have been conducted to show the geographical distribution of the information at a glance. To this extent, the R toolkit11 has been utilised. In Figure
10
http://www.postgresql.org/ 11
http://www.r-project.org/
03 August 2015 Public Document
GET Service ICT-2012-318275 ©GET Service consortium 25
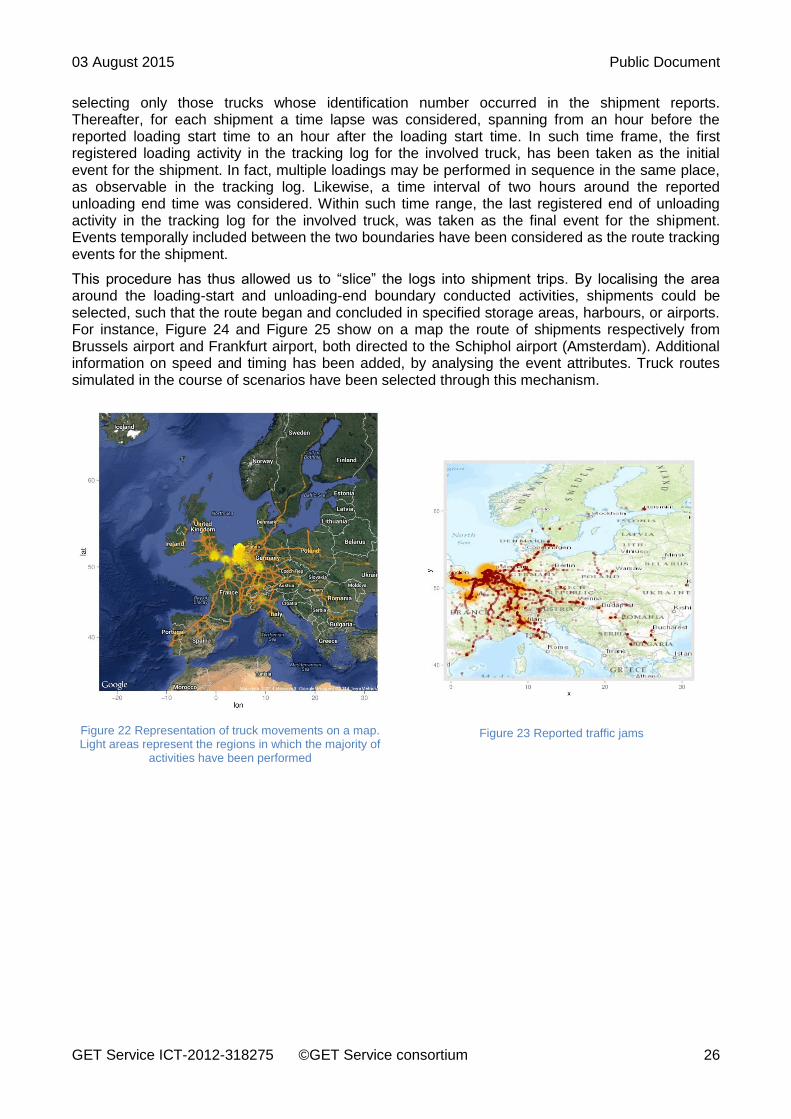
22, the trucks positions are depicted, along with the areas in which the higher number of conducted activities is reported. On the map, the geographical coordinates of truck log events are represented by points. Areas are then coloured around the 32 centroids of most frequently reported activities. Among the gathered geographical locations, Figure 23 depicts on the map the geographical positions of those events that bear the report of a traffic jam by the truck driver. Both figures exemplify how imported data can be globally summarised.
Figure 21 Database schema for truck data
3.3 Shipment simulation and process mining
On the basis of the data provided by the board computers in the trucks, it remained questionable to identify where a shipment started and where it finished. Even though loading and unloading activities are reported, they do not bear the information regarding the shipment in the context of which they are performed. Thinking of shipments as process instances (cases), this problem is known in the literature as the one of the case identification, which is well known especially in the process mining area (van der Aalst, 2011). This issue made it cumbersome to select, visualise and replay (hence, simulate) data for a shipment, which was needed for the enactment of Scenarios 1 and 2 (see (Baumgrass, Di Ciccio, Hewelt, Pufahl, Mandal, & Meyer, GET Service Project Deliverable 6.4.2: Aggregation rules that support usage scenarios, 2015)). Any strategy based on manual and visual inspection would have been rather impractical to that extent, due to the vastness of the data at hand.
Therefore, the shipment reports have been exploited. Shipment reports indeed register the loading and unloading times, along with the identification number for trucks, corresponding to the ones in the logs of the tracking system. Therefore, the data stemming from the trucks log were filtered by
03 August 2015 Public Document
GET Service ICT-2012-318275 ©GET Service consortium 26
selecting only those trucks whose identification number occurred in the shipment reports. Thereafter, for each shipment a time lapse was considered, spanning from an hour before the reported loading start time to an hour after the loading start time. In such time frame, the first registered loading activity in the tracking log for the involved truck, has been taken as the initial event for the shipment. In fact, multiple loadings may be performed in sequence in the same place, as observable in the tracking log. Likewise, a time interval of two hours around the reported unloading end time was considered. Within such time range, the last registered end of unloading activity in the tracking log for the involved truck, was taken as the final event for the shipment. Events temporally included between the two boundaries have been considered as the route tracking events for the shipment.
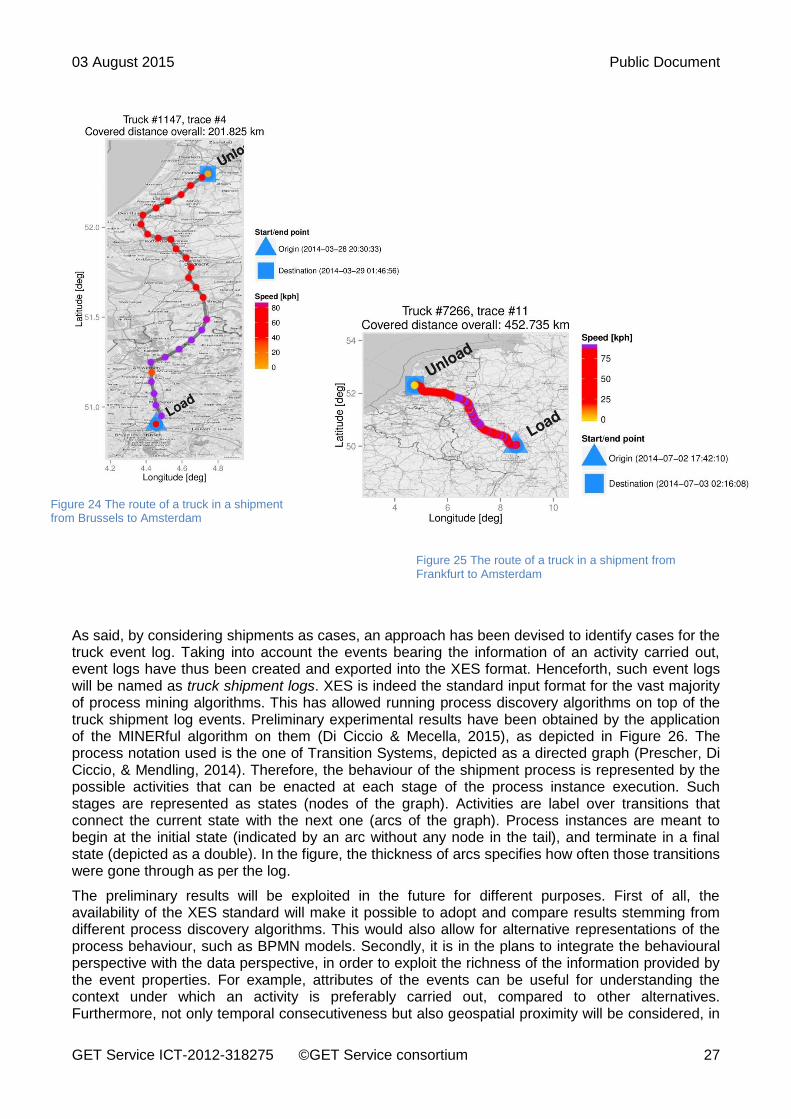
This procedure has thus allowed us to “slice” the logs into shipment trips. By localising the area around the loading-start and unloading-end boundary conducted activities, shipments could be selected, such that the route began and concluded in specified storage areas, harbours, or airports. For instance, Figure 24 and Figure 25 show on a map the route of shipments respectively from Brussels airport and Frankfurt airport, both directed to the Schiphol airport (Amsterdam). Additional information on speed and timing has been added, by analysing the event attributes. Truck routes simulated in the course of scenarios have been selected through this mechanism.
Figure 22 Representation of truck movements on a map. Light areas represent the regions in which the majority of
activities have been performed
Figure 23 Reported traffic jams
03 August 2015 Public Document
GET Service ICT-2012-318275 ©GET Service consortium 27
Figure 24 The route of a truck in a shipment from Brussels to Amsterdam
Figure 25 The route of a truck in a shipment from Frankfurt to Amsterdam
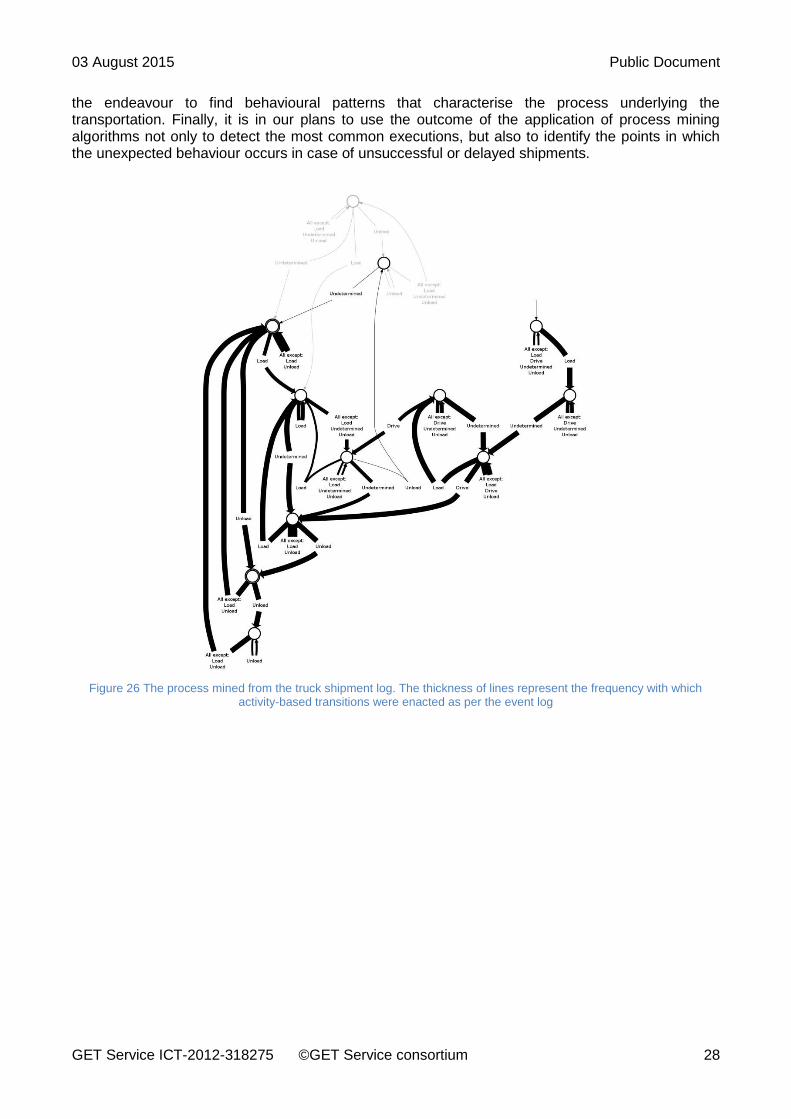
As said, by considering shipments as cases, an approach has been devised to identify cases for the truck event log. Taking into account the events bearing the information of an activity carried out, event logs have thus been created and exported into the XES format. Henceforth, such event logs will be named as truck shipment logs. XES is indeed the standard input format for the vast majority of process mining algorithms. This has allowed running process discovery algorithms on top of the truck shipment log events. Preliminary experimental results have been obtained by the application of the MINERful algorithm on them (Di Ciccio & Mecella, 2015), as depicted in Figure 26. The process notation used is the one of Transition Systems, depicted as a directed graph (Prescher, Di Ciccio, & Mendling, 2014). Therefore, the behaviour of the shipment process is represented by the possible activities that can be enacted at each stage of the process instance execution. Such stages are represented as states (nodes of the graph). Activities are label over transitions that connect the current state with the next one (arcs of the graph). Process instances are meant to begin at the initial state (indicated by an arc without any node in the tail), and terminate in a final state (depicted as a double). In the figure, the thickness of arcs specifies how often those transitions were gone through as per the log.
The preliminary results will be exploited in the future for different purposes. First of all, the availability of the XES standard will make it possible to adopt and compare results stemming from different process discovery algorithms. This would also allow for alternative representations of the process behaviour, such as BPMN models. Secondly, it is in the plans to integrate the behavioural perspective with the data perspective, in order to exploit the richness of the information provided by the event properties. For example, attributes of the events can be useful for understanding the context under which an activity is preferably carried out, compared to other alternatives. Furthermore, not only temporal consecutiveness but also geospatial proximity will be considered, in
03 August 2015 Public Document
GET Service ICT-2012-318275 ©GET Service consortium 28
the endeavour to find behavioural patterns that characterise the process underlying the transportation. Finally, it is in our plans to use the outcome of the application of process mining algorithms not only to detect the most common executions, but also to identify the points in which the unexpected behaviour occurs in case of unsuccessful or delayed shipments.
Figure 26 The process mined from the truck shipment log. The thickness of lines represent the frequency with which activity-based transitions were enacted as per the event log
03 August 2015 Public Document
GET Service ICT-2012-318275 ©GET Service consortium 29
4 Simulation of real-time events in UNICORN
For the purpose of testing aggregation rules and demonstrating the functions of UNICORN an Event Replayer component was implemented. It allows to import historic as well artificial events in a predefined order at specific points in time. The main usage is to simulate real-world happenings, for example the driving of vehicles. At the same time, the replayer is used for testing aggregation rules and the notification mechanisms. For example, to test the aggregation of a vehicle that gets stuck in a congestion, which is then forwarded to the orchestration engine as notification. The replayer and the specific functionalities are derived from the requirements of event provisioning in the prototypical implementations presented in Section 5.
The event replayer is able to take historic data from various sources, convert them into events in UNICORN if the corresponding event type is known in the system, and replays them using a configurable speed-up factor. Thus, the replayer allows to simulate the events that occur in prototype scnearios the GET Service project.
Technically, each event replayer runs in its own thread so as not to block the other ones. The event replayer sends the first event, suspends the thread for a time proportionate to the time difference to the following event (scaled by the speed-up factor), and then resumes to send the next event. This continues until all events that were added to the replayer have been imported as such in UNICORN.
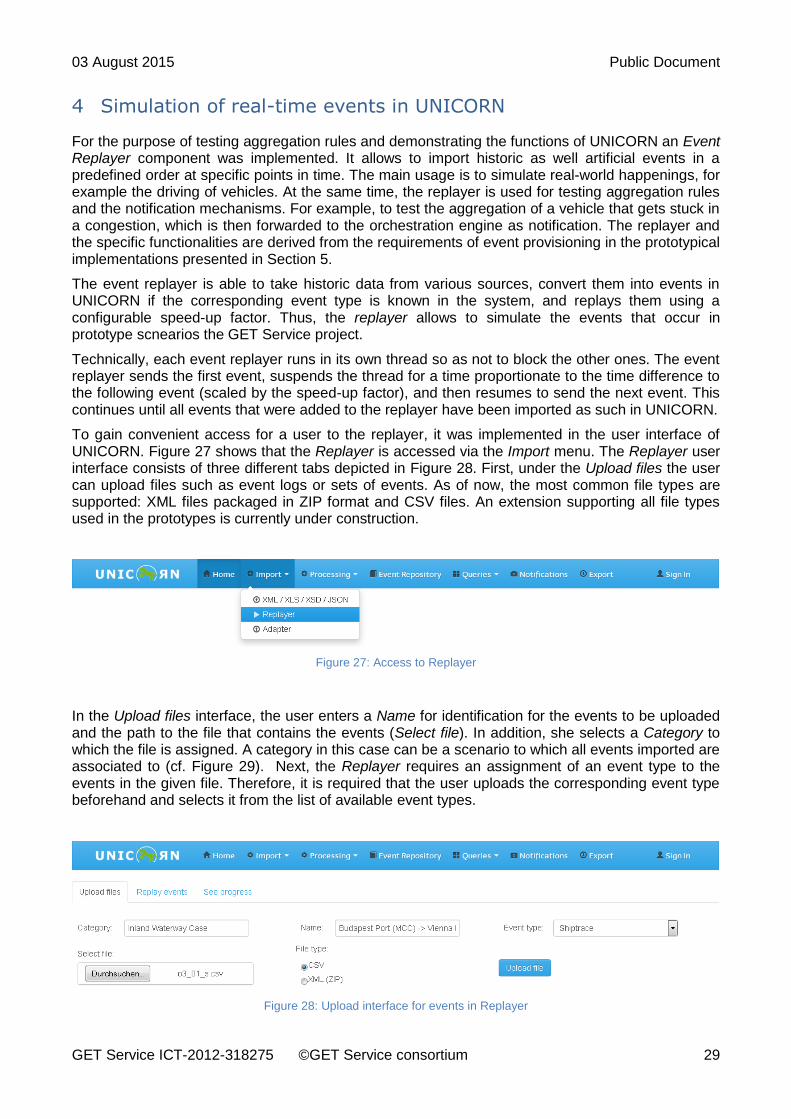
To gain convenient access for a user to the replayer, it was implemented in the user interface of UNICORN. Figure 27 shows that the Replayer is accessed via the Import menu. The Replayer user interface consists of three different tabs depicted in Figure 28. First, under the Upload files the user can upload files such as event logs or sets of events. As of now, the most common file types are supported: XML files packaged in ZIP format and CSV files. An extension supporting all file types used in the prototypes is currently under construction.
Figure 27: Access to Replayer
In the Upload files interface, the user enters a Name for identification for the events to be uploaded and the path to the file that contains the events (Select file). In addition, she selects a Category to which the file is assigned. A category in this case can be a scenario to which all events imported are associated to (cf. Figure 29). Next, the Replayer requires an assignment of an event type to the events in the given file. Therefore, it is required that the user uploads the corresponding event type beforehand and selects it from the list of available event types.
Figure 28: Upload interface for events in Replayer
03 August 2015 Public Document
GET Service ICT-2012-318275 ©GET Service consortium 30
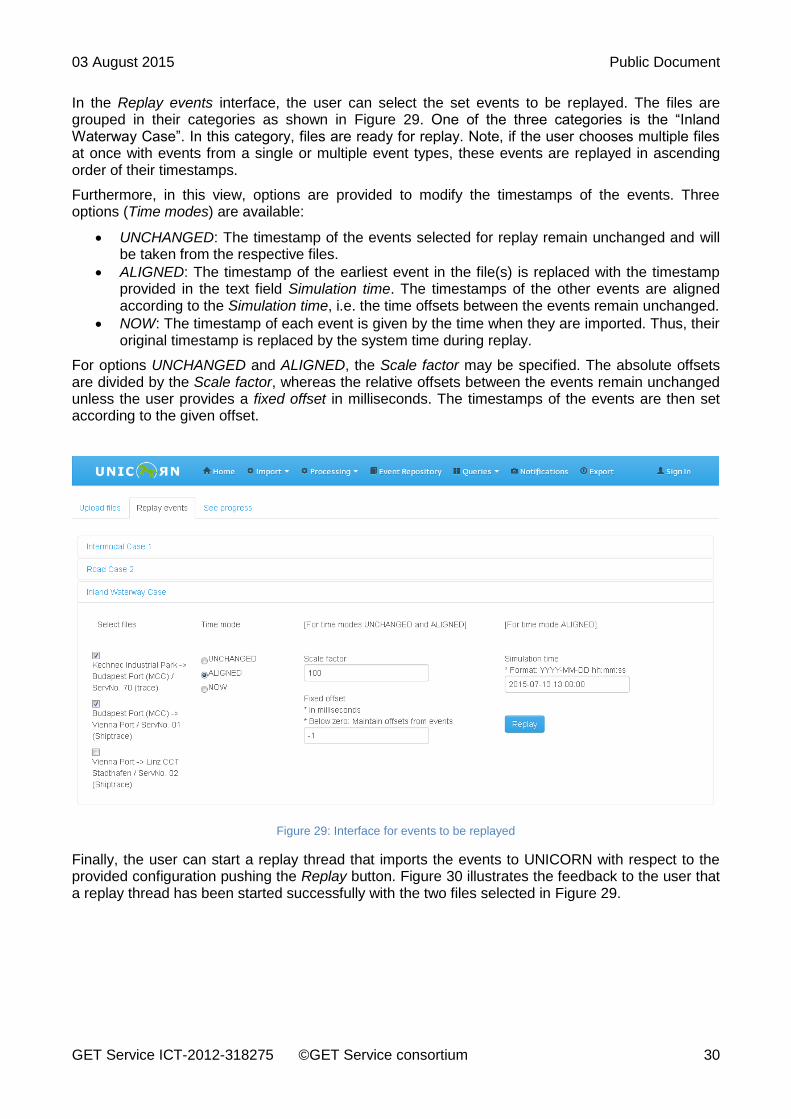
In the Replay events interface, the user can select the set events to be replayed. The files are grouped in their categories as shown in Figure 29. One of the three categories is the “Inland Waterway Case”. In this category, files are ready for replay. Note, if the user chooses multiple files at once with events from a single or multiple event types, these events are replayed in ascending order of their timestamps.
Furthermore, in this view, options are provided to modify the timestamps of the events. Three options (Time modes) are available:
UNCHANGED: The timestamp of the events selected for replay remain unchanged and will be taken from the respective files.
ALIGNED: The timestamp of the earliest event in the file(s) is replaced with the timestamp provided in the text field Simulation time. The timestamps of the other events are aligned according to the Simulation time, i.e. the time offsets between the events remain unchanged.
NOW: The timestamp of each event is given by the time when they are imported. Thus, their original timestamp is replaced by the system time during replay.
For options UNCHANGED and ALIGNED, the Scale factor may be specified. The absolute offsets are divided by the Scale factor, whereas the relative offsets between the events remain unchanged unless the user provides a fixed offset in milliseconds. The timestamps of the events are then set according to the given offset.
Figure 29: Interface for events to be replayed
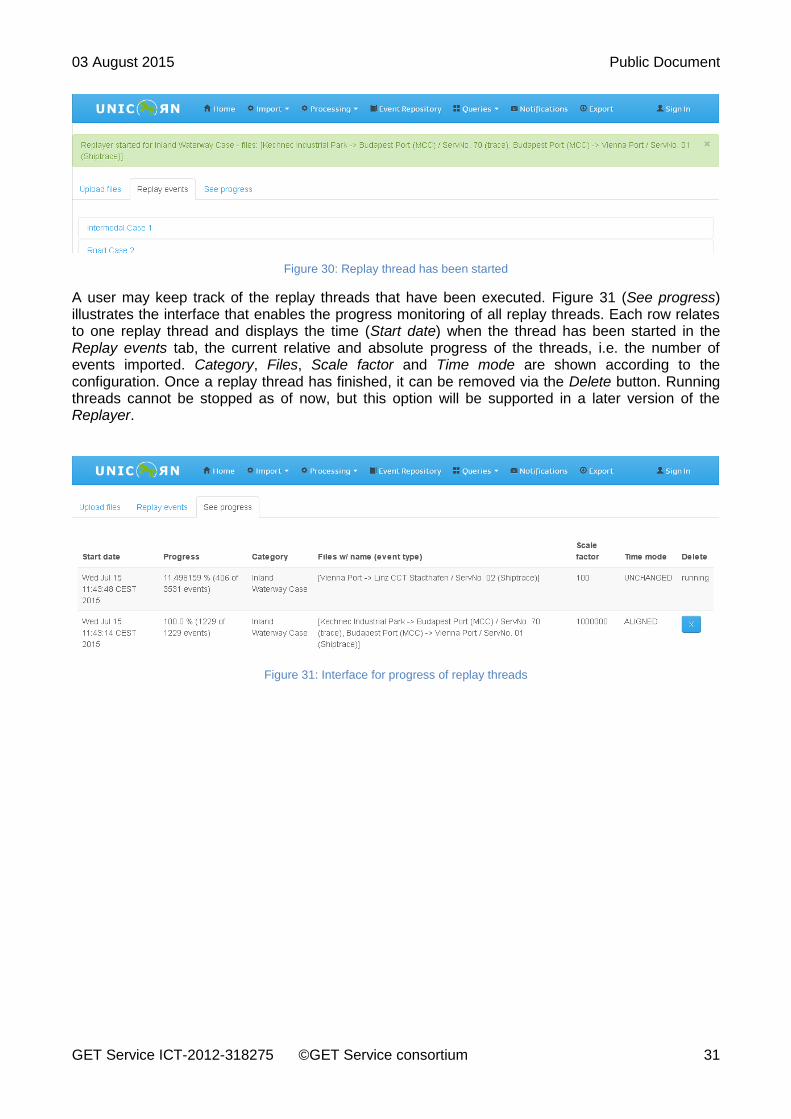
Finally, the user can start a replay thread that imports the events to UNICORN with respect to the provided configuration pushing the Replay button. Figure 30 illustrates the feedback to the user that a replay thread has been started successfully with the two files selected in Figure 29.
03 August 2015 Public Document
GET Service ICT-2012-318275 ©GET Service consortium 31
Figure 30: Replay thread has been started
A user may keep track of the replay threads that have been executed. Figure 31 (See progress) illustrates the interface that enables the progress monitoring of all replay threads. Each row relates to one replay thread and displays the time (Start date) when the thread has been started in the Replay events tab, the current relative and absolute progress of the threads, i.e. the number of events imported. Category, Files, Scale factor and Time mode are shown according to the configuration. Once a replay thread has finished, it can be removed via the Delete button. Running threads cannot be stopped as of now, but this option will be supported in a later version of the Replayer.
Figure 31: Interface for progress of replay threads
03 August 2015 Public Document
GET Service ICT-2012-318275 ©GET Service consortium 32
5 Prototypical implementations for the generation of aggregation rules in logistics scenarios
Deliverable D6.3 contains a manual for the interaction with as well as the usage, functions, and implementation of the event processing platform UNICORN. On this basis, event processing can be utilized for a multitude of everyday challenges in logistics. In the following sections, the results of an application of such are outlined: batch monitoring, multi-instance activity monitoring, location-based monitoring, delay propagation, and deadline propagation. Each of the presented examples provides as own, user-defined, and thereby selected set of event types, aggregation rules as well as correlation rules only applicable for the specific scenario. However, the corresponding prototypes showcase the variants of using UNICORN and its extensibility for serving different scenarios in logistics. At the same time, they exemplify benefits of event processing to logistics. In this way, they serve as input for further exploitation in practice in the evaluation in (Schmiele, Ettinger, & Keller, 2014) of the GET Service project. While the sections below highlight the most relevant parts of the scenarios details of the implementation as well as the screencasts for these are provided at: http://bpt.hpi.uni-potsdam.de/UNICORN/UNICORNUsage. To simulate the real-time provisioning of events a preliminary version of the event replayer was used. The technical report including all corresponding papers are provided at:
https://bpt.hpi.uni-potsdam.de/foswiki/pub/UNICORN/WebHome/proceedings.pdf.
5.1 Batch Monitoring
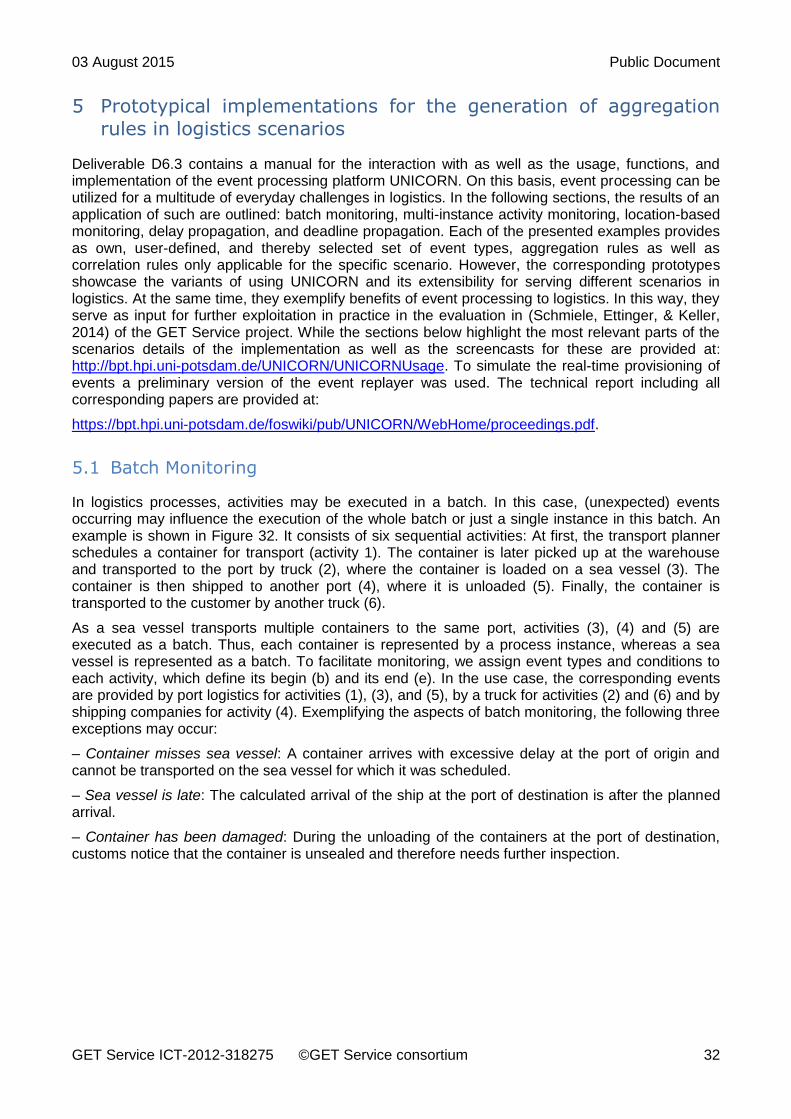
In logistics processes, activities may be executed in a batch. In this case, (unexpected) events occurring may influence the execution of the whole batch or just a single instance in this batch. An example is shown in Figure 32. It consists of six sequential activities: At first, the transport planner schedules a container for transport (activity 1). The container is later picked up at the warehouse and transported to the port by truck (2), where the container is loaded on a sea vessel (3). The container is then shipped to another port (4), where it is unloaded (5). Finally, the container is transported to the customer by another truck (6).
As a sea vessel transports multiple containers to the same port, activities (3), (4) and (5) are executed as a batch. Thus, each container is represented by a process instance, whereas a sea vessel is represented as a batch. To facilitate monitoring, we assign event types and conditions to each activity, which define its begin (b) and its end (e). In the use case, the corresponding events are provided by port logistics for activities (1), (3), and (5), by a truck for activities (2) and (6) and by shipping companies for activity (4). Exemplifying the aspects of batch monitoring, the following three exceptions may occur:
– Container misses sea vessel: A container arrives with excessive delay at the port of origin and cannot be transported on the sea vessel for which it was scheduled.
– Sea vessel is late: The calculated arrival of the ship at the port of destination is after the planned arrival.
– Container has been damaged: During the unloading of the containers at the port of destination, customs notice that the container is unsealed and therefore needs further inspection.
03 August 2015 Public Document
GET Service ICT-2012-318275 ©GET Service consortium 33
Figure 32 Batch monitoring example
The specific scenario is implemented in Java 7, using the Apache Wicket Framework for the frontend. For importing process models the libraries jBPT and promniCAT were used. The underlying engine for event processing is UNICORN. The screencast at http://bpt.hpi.uni-potsdam.de/fileserver/unicorn/Batch_monitoring_screencast.mp4 demonstrates the batch and exception monitoring for the described scenario.
5.2 Multi-Instance Activity Monitoring
Transportation planners continuously monitor the progress of their active transport routes and reschedule certain steps upon encountering problems. The more orders a planner is supposed to overview, the more a technical solution is inevitable to remain efficient. Event-based systems are most appropriate in such cases to keep the overview and to react quickly to events in order to ensure a trouble-free process of all consignments of an order and to provide early information about the delivery. This should help to keep an overview of the order even if it is transported using different modalities.
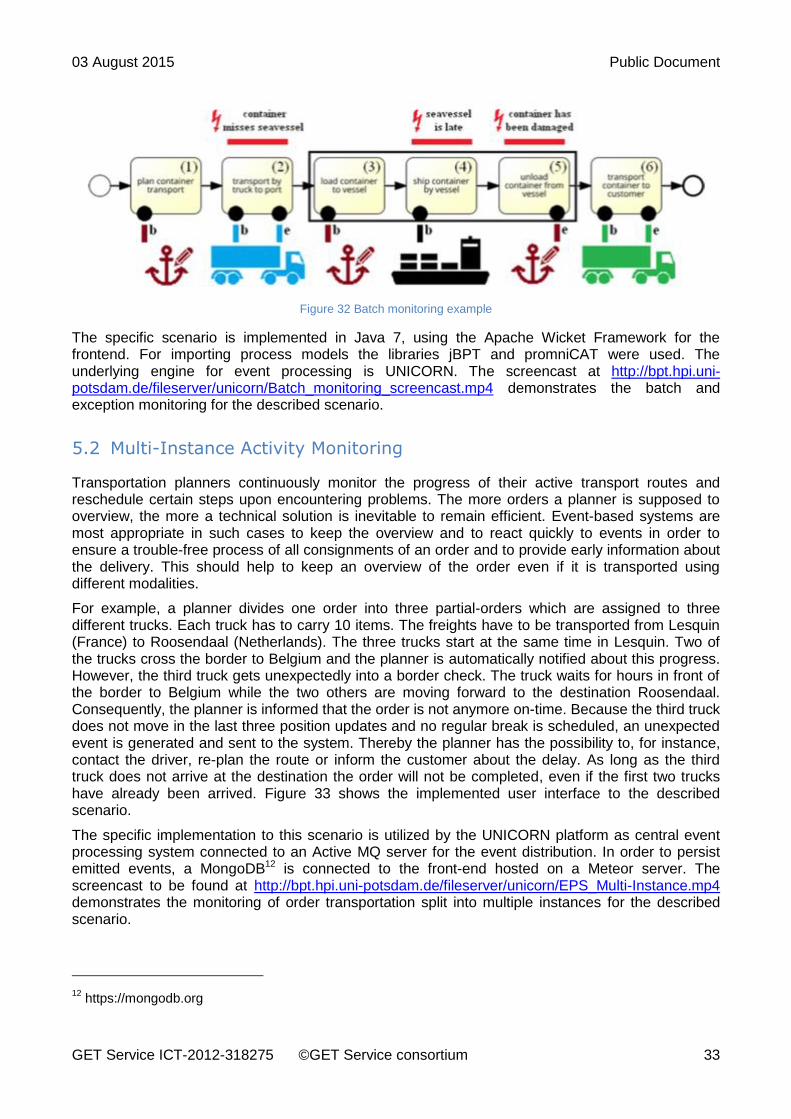
For example, a planner divides one order into three partial-orders which are assigned to three different trucks. Each truck has to carry 10 items. The freights have to be transported from Lesquin (France) to Roosendaal (Netherlands). The three trucks start at the same time in Lesquin. Two of the trucks cross the border to Belgium and the planner is automatically notified about this progress. However, the third truck gets unexpectedly into a border check. The truck waits for hours in front of the border to Belgium while the two others are moving forward to the destination Roosendaal. Consequently, the planner is informed that the order is not anymore on-time. Because the third truck does not move in the last three position updates and no regular break is scheduled, an unexpected event is generated and sent to the system. Thereby the planner has the possibility to, for instance, contact the driver, re-plan the route or inform the customer about the delay. As long as the third truck does not arrive at the destination the order will not be completed, even if the first two trucks have already been arrived. Figure 33 shows the implemented user interface to the described scenario.
The specific implementation to this scenario is utilized by the UNICORN platform as central event processing system connected to an Active MQ server for the event distribution. In order to persist emitted events, a MongoDB12 is connected to the front-end hosted on a Meteor server. The screencast to be found at http://bpt.hpi.uni-potsdam.de/fileserver/unicorn/EPS_Multi-Instance.mp4 demonstrates the monitoring of order transportation split into multiple instances for the described scenario.
12
https://mongodb.org
03 August 2015 Public Document
GET Service ICT-2012-318275 ©GET Service consortium 34
Figure 33 Multi-instance monitoring example
5.3 Location-based Monitoring
This section demonstrates how location-based information such as heavy traffic or adverse weather can be incorporated in order to enrich data at hand and improve monitoring and planning capabilities.
5.3.1 Incorporating traffic information into transportation monitoring
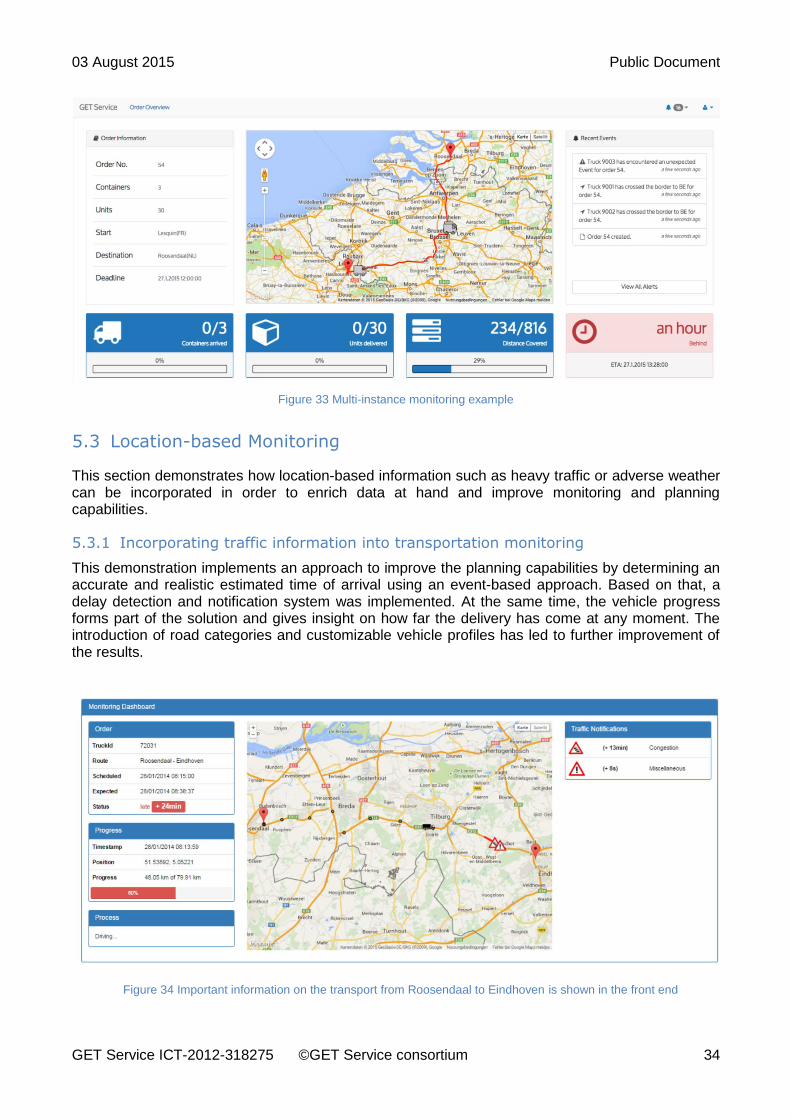
This demonstration implements an approach to improve the planning capabilities by determining an accurate and realistic estimated time of arrival using an event-based approach. Based on that, a delay detection and notification system was implemented. At the same time, the vehicle progress forms part of the solution and gives insight on how far the delivery has come at any moment. The introduction of road categories and customizable vehicle profiles has led to further improvement of the results.
Figure 34 Important information on the transport from Roosendaal to Eindhoven is shown in the front end
03 August 2015 Public Document
GET Service ICT-2012-318275 ©GET Service consortium 35
The screencast for an exemplary transportation from Rosendaal to Eindhoven illustrates the functionality and benefits at http://bpt.hpi.uni-potsdam.de/fileserver/unicorn/EPS_LocationTraffic.avi. External webservices are used to receive real data on routes and traffic conditions. The UI shows exactly where the truck is at any time, what is to be expected on the road ahead of the truck and above all, it visualizes when to expect the delivery at the final destination (cf. Figure 34). A status indicator informs whether the transport is on time or delayed. If there are significant problems on the road they will also be displayed and explained.
The front end uses ActiveMQ13, a Java Messaging Service with AJAX capabilities, to obtain order and traffic information from the platform over the web in real-time. In the background UNICORN is used for implementing the event-based foundation underlying the solution.
5.3.2 Incorporating weather information into transportation monitoring
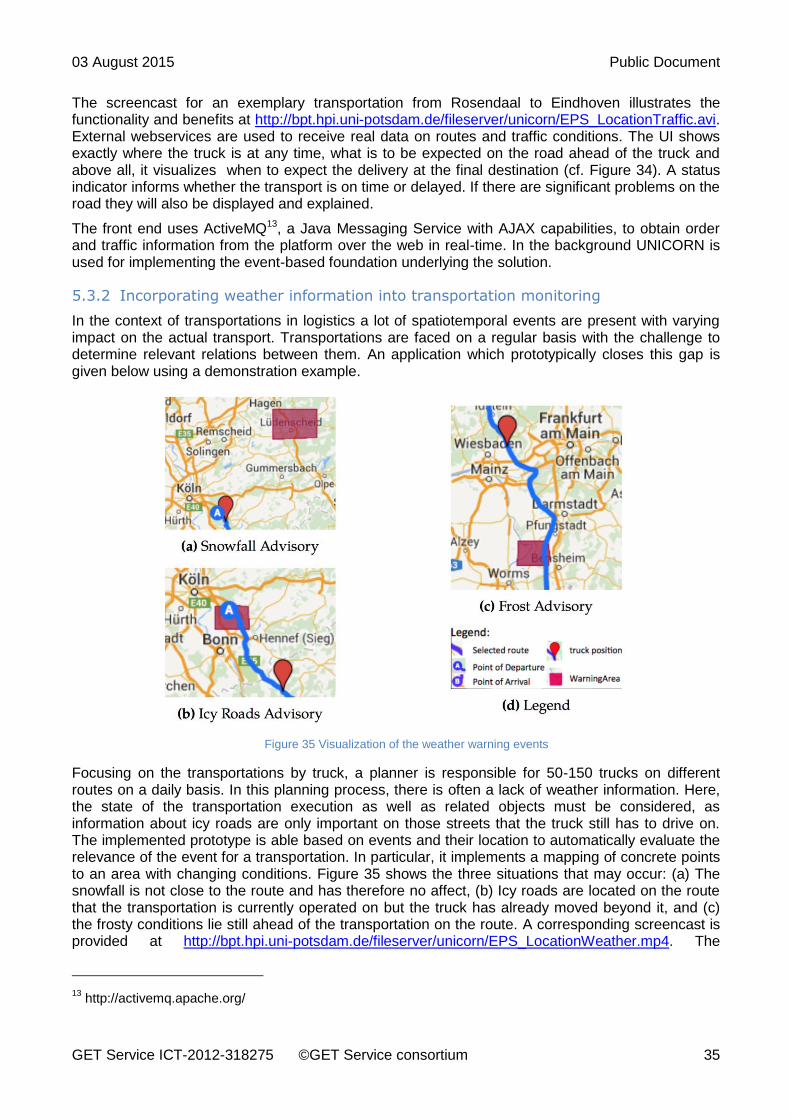
In the context of transportations in logistics a lot of spatiotemporal events are present with varying impact on the actual transport. Transportations are faced on a regular basis with the challenge to determine relevant relations between them. An application which prototypically closes this gap is given below using a demonstration example.
Focusing on the transportations by truck, a planner is responsible for 50-150 trucks on different routes on a daily basis. In this planning process, there is often a lack of weather information. Here, the state of the transportation execution as well as related objects must be considered, as information about icy roads are only important on those streets that the truck still has to drive on. The implemented prototype is able based on events and their location to automatically evaluate the relevance of the event for a transportation. In particular, it implements a mapping of concrete points to an area with changing conditions. Figure 35 shows the three situations that may occur: (a) The snowfall is not close to the route and has therefore no affect, (b) Icy roads are located on the route that the transportation is currently operated on but the truck has already moved beyond it, and (c) the frosty conditions lie still ahead of the transportation on the route. A corresponding screencast is provided at http://bpt.hpi.uni-potsdam.de/fileserver/unicorn/EPS_LocationWeather.mp4. The
13
http://activemq.apache.org/
Figure 35 Visualization of the weather warning events
03 August 2015 Public Document
GET Service ICT-2012-318275 ©GET Service consortium 36
application is console-based, uses Apache Active MQ as a JMS provider, which delivers relevant events published by UNICORN.
5.4 Delay Propagation
The progression of delays caused at an initial logistics step to the subsequent logistics steps may be non-linear due to their dependencies and additional time-dependent resource- and status-constraints of the steps. The prototypical example below visualizes the consideration of non-linear delay propagation considering resource- and status-dependencies and -constraints of sequentially interlinked steps, and a visualization for live monitoring process progression and delay propagation of processes.
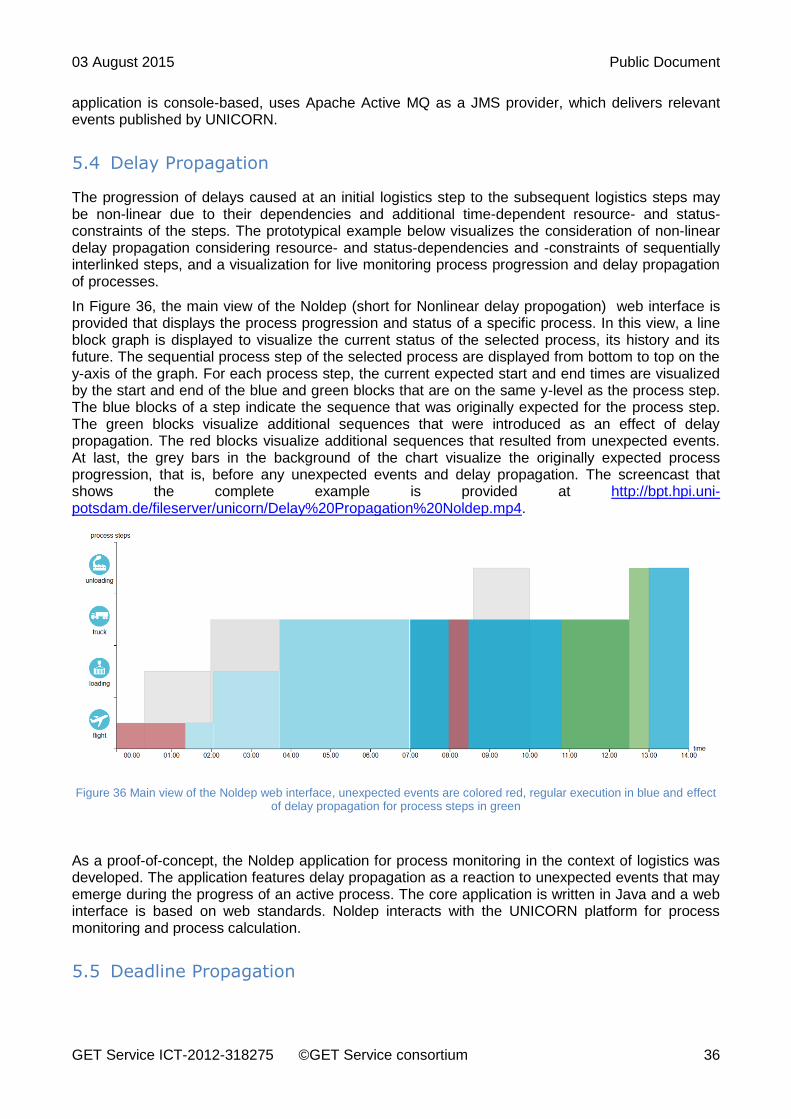
In Figure 36, the main view of the Noldep (short for Nonlinear delay propogation) web interface is provided that displays the process progression and status of a specific process. In this view, a line block graph is displayed to visualize the current status of the selected process, its history and its future. The sequential process step of the selected process are displayed from bottom to top on the y-axis of the graph. For each process step, the current expected start and end times are visualized by the start and end of the blue and green blocks that are on the same y-level as the process step. The blue blocks of a step indicate the sequence that was originally expected for the process step. The green blocks visualize additional sequences that were introduced as an effect of delay propagation. The red blocks visualize additional sequences that resulted from unexpected events. At last, the grey bars in the background of the chart visualize the originally expected process progression, that is, before any unexpected events and delay propagation. The screencast that shows the complete example is provided at http://bpt.hpi.uni-potsdam.de/fileserver/unicorn/Delay%20Propagation%20Noldep.mp4.
As a proof-of-concept, the Noldep application for process monitoring in the context of logistics was developed. The application features delay propagation as a reaction to unexpected events that may emerge during the progress of an active process. The core application is written in Java and a web interface is based on web standards. Noldep interacts with the UNICORN platform for process monitoring and process calculation.
5.5 Deadline Propagation
Figure 36 Main view of the Noldep web interface, unexpected events are colored red, regular execution in blue and effect of delay propagation for process steps in green
03 August 2015 Public Document
GET Service ICT-2012-318275 ©GET Service consortium 37
In a logistics, deadlines for transportations or only parts of it are subject to frequent changes. While there is work on the prediction of the execution time of individual activities or single process instances, research on the effect of a deadline shift on multiple activities and interdependent processes is still lacking. Event processing can be used to communicate relevant influencing factors for activities as soon as they are detected. This also applies to deadline changes. Below a demo software, Dragon is presented, which implements a flexible deadline propagation algorithm to predict imminent deadline violations caused by a deadline shift across multiple process instances. It also features a graphical user interface which provides multiple views on the scheduled activities to visualize the effects of a deadline shift.
For example, consider four transportations as shown in Figure 37. Goods are delivered from the USA via Rotterdam to Amsterdam in process 1 (P1), from the USA via Amsterdam to Utrecht in process 2 (P2) and from Eindhoven via Rotterdam to Amsterdam in process 3 (P3). In this example we assume that the goods of P1 and P3 are delivered by the same truck between Rotterdam and Amsterdam. Finally, process 4 (P4) includes the customization of goods at an external terminal in Rotterdam and the subsequent shipping to the USA. Several operators are assigned to these processes. For example operator #22
ships the goods for P1 from the USA to Rotterdam, loads the goods and those of P3 on a truck and drives from Rotterdam to Amsterdam. Furthermore, operator #6 transports the goods of P3 from Eindhoven to Rotterdam, unloads them and proceeds with the execution of P4.
Due to an the earlier incoming ship of P1 at the port of Rotterdam the start deadline for loading the goods of P1 onto a truck is shifted forward. As a result all preceding activities of each process and operator involved may be affected. Here, operator #22 has to deliver the goods of P3 earlier so that the storing time can be minimized. The corresponding screencast is provided at http://bpt.hpi.uni-
potsdam.de/fileserver/unicorn/DeadlinePropagationScreencast.mp4.
Dragon is implemented as a Spring Boot application consisting of the following components: A graphical user interface (GUI), an event replayer, an event publisher, a deadline propagator and an
Figure 37 Logistics example with processes (solid lines) and selected operator assignments (dashed lines)
Figure 38 Part of the graph of operator #22 (Cole Sawyer). The selected OperatorTask faces a certain deadline violation with changed temporal constraints, marked with red

03 August 2015 Public Document
GET Service ICT-2012-318275 ©GET Service consortium 38
in-memory database containing the data. For retrieving and sending events the event processing platform UNICORN is used. The GUI is implemented via AngularJS14 and reflects the data via double data binding. This means, changes in the data cause corresponding changes in the GUI and vice versa. In order to get information on deadline shifts, the server-side of Dragon, i.e. the database is continuously polled for changes.
14
http://www.angularjs.org/
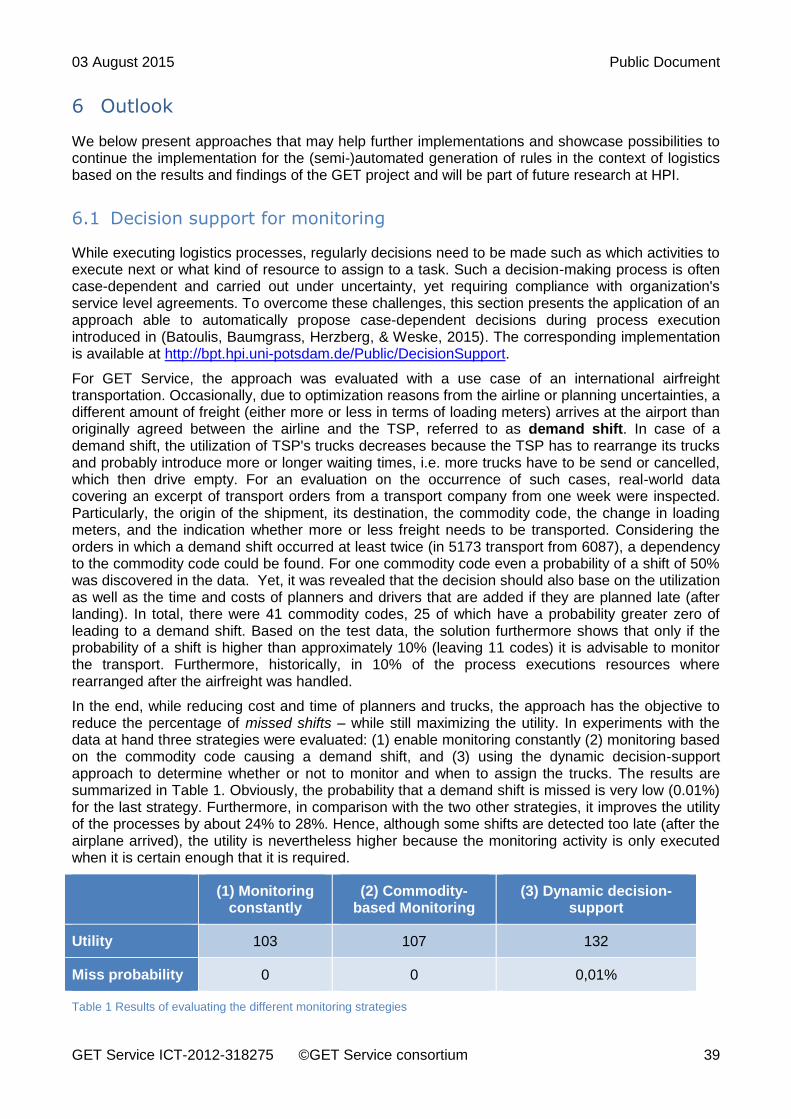
03 August 2015 Public Document
GET Service ICT-2012-318275 ©GET Service consortium 39
6 Outlook
We below present approaches that may help further implementations and showcase possibilities to continue the implementation for the (semi-)automated generation of rules in the context of logistics based on the results and findings of the GET project and will be part of future research at HPI.
6.1 Decision support for monitoring
While executing logistics processes, regularly decisions need to be made such as which activities to execute next or what kind of resource to assign to a task. Such a decision-making process is often case-dependent and carried out under uncertainty, yet requiring compliance with organization's service level agreements. To overcome these challenges, this section presents the application of an approach able to automatically propose case-dependent decisions during process execution introduced in (Batoulis, Baumgrass, Herzberg, & Weske, 2015). The corresponding implementation is available at http://bpt.hpi.uni-potsdam.de/Public/DecisionSupport.
For GET Service, the approach was evaluated with a use case of an international airfreight transportation. Occasionally, due to optimization reasons from the airline or planning uncertainties, a different amount of freight (either more or less in terms of loading meters) arrives at the airport than originally agreed between the airline and the TSP, referred to as demand shift. In case of a demand shift, the utilization of TSP's trucks decreases because the TSP has to rearrange its trucks and probably introduce more or longer waiting times, i.e. more trucks have to be send or cancelled, which then drive empty. For an evaluation on the occurrence of such cases, real-world data covering an excerpt of transport orders from a transport company from one week were inspected. Particularly, the origin of the shipment, its destination, the commodity code, the change in loading meters, and the indication whether more or less freight needs to be transported. Considering the orders in which a demand shift occurred at least twice (in 5173 transport from 6087), a dependency to the commodity code could be found. For one commodity code even a probability of a shift of 50% was discovered in the data. Yet, it was revealed that the decision should also base on the utilization as well as the time and costs of planners and drivers that are added if they are planned late (after landing). In total, there were 41 commodity codes, 25 of which have a probability greater zero of leading to a demand shift. Based on the test data, the solution furthermore shows that only if the probability of a shift is higher than approximately 10% (leaving 11 codes) it is advisable to monitor the transport. Furthermore, historically, in 10% of the process executions resources where rearranged after the airfreight was handled.
In the end, while reducing cost and time of planners and trucks, the approach has the objective to reduce the percentage of missed shifts – while still maximizing the utility. In experiments with the data at hand three strategies were evaluated: (1) enable monitoring constantly (2) monitoring based on the commodity code causing a demand shift, and (3) using the dynamic decision-support approach to determine whether or not to monitor and when to assign the trucks. The results are summarized in Table 1. Obviously, the probability that a demand shift is missed is very low (0.01%) for the last strategy. Furthermore, in comparison with the two other strategies, it improves the utility of the processes by about 24% to 28%. Hence, although some shifts are detected too late (after the airplane arrived), the utility is nevertheless higher because the monitoring activity is only executed when it is certain enough that it is required.
(1) Monitoring constantly
(2) Commodity-based Monitoring
(3) Dynamic decision-support
Utility 103 107 132
Miss probability 0 0 0,01%
Table 1 Results of evaluating the different monitoring strategies
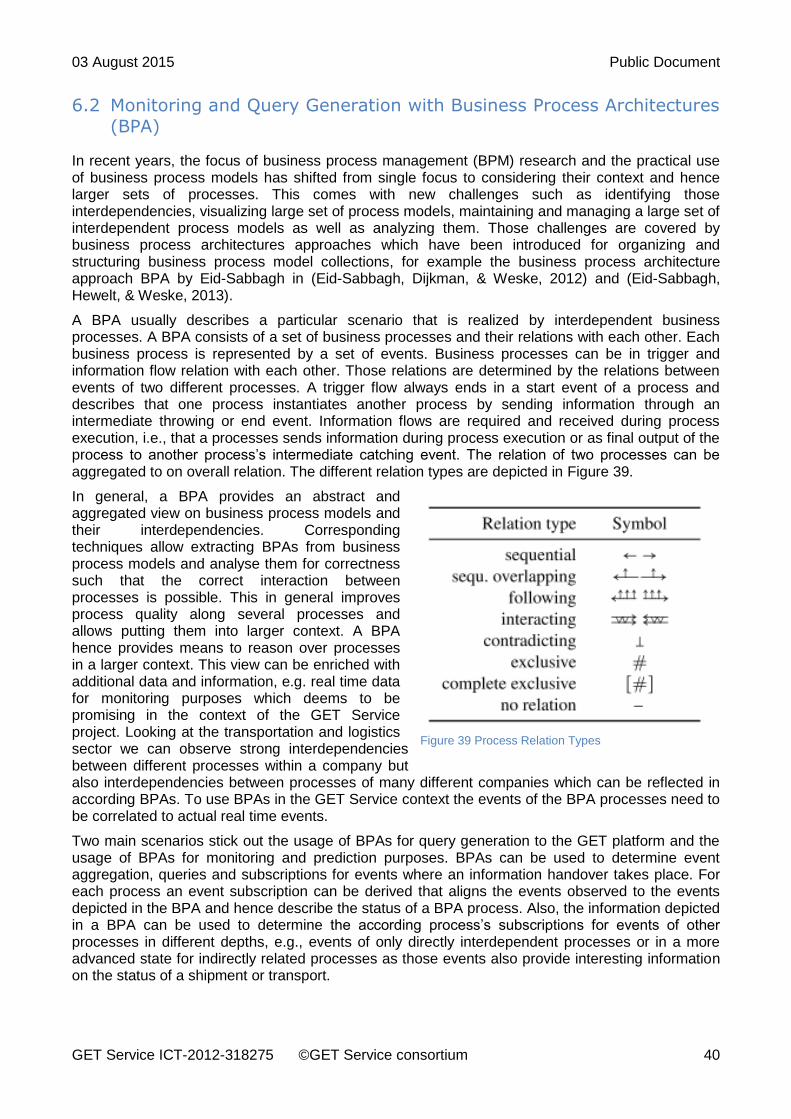
03 August 2015 Public Document
GET Service ICT-2012-318275 ©GET Service consortium 40
6.2 Monitoring and Query Generation with Business Process Architectures
(BPA)
In recent years, the focus of business process management (BPM) research and the practical use of business process models has shifted from single focus to considering their context and hence larger sets of processes. This comes with new challenges such as identifying those interdependencies, visualizing large set of process models, maintaining and managing a large set of interdependent process models as well as analyzing them. Those challenges are covered by business process architectures approaches which have been introduced for organizing and structuring business process model collections, for example the business process architecture approach BPA by Eid-Sabbagh in (Eid-Sabbagh, Dijkman, & Weske, 2012) and (Eid-Sabbagh, Hewelt, & Weske, 2013).
A BPA usually describes a particular scenario that is realized by interdependent business processes. A BPA consists of a set of business processes and their relations with each other. Each business process is represented by a set of events. Business processes can be in trigger and information flow relation with each other. Those relations are determined by the relations between events of two different processes. A trigger flow always ends in a start event of a process and describes that one process instantiates another process by sending information through an intermediate throwing or end event. Information flows are required and received during process execution, i.e., that a processes sends information during process execution or as final output of the process to another process’s intermediate catching event. The relation of two processes can be aggregated to on overall relation. The different relation types are depicted in Figure 39.
In general, a BPA provides an abstract and aggregated view on business process models and their interdependencies. Corresponding techniques allow extracting BPAs from business process models and analyse them for correctness such that the correct interaction between processes is possible. This in general improves process quality along several processes and allows putting them into larger context. A BPA hence provides means to reason over processes in a larger context. This view can be enriched with additional data and information, e.g. real time data for monitoring purposes which deems to be promising in the context of the GET Service project. Looking at the transportation and logistics sector we can observe strong interdependencies between different processes within a company but also interdependencies between processes of many different companies which can be reflected in according BPAs. To use BPAs in the GET Service context the events of the BPA processes need to be correlated to actual real time events.
Two main scenarios stick out the usage of BPAs for query generation to the GET platform and the usage of BPAs for monitoring and prediction purposes. BPAs can be used to determine event aggregation, queries and subscriptions for events where an information handover takes place. For each process an event subscription can be derived that aligns the events observed to the events depicted in the BPA and hence describe the status of a BPA process. Also, the information depicted in a BPA can be used to determine the according process’s subscriptions for events of other processes in different depths, e.g., events of only directly interdependent processes or in a more advanced state for indirectly related processes as those events also provide interesting information on the status of a shipment or transport.
Figure 39 Process Relation Types
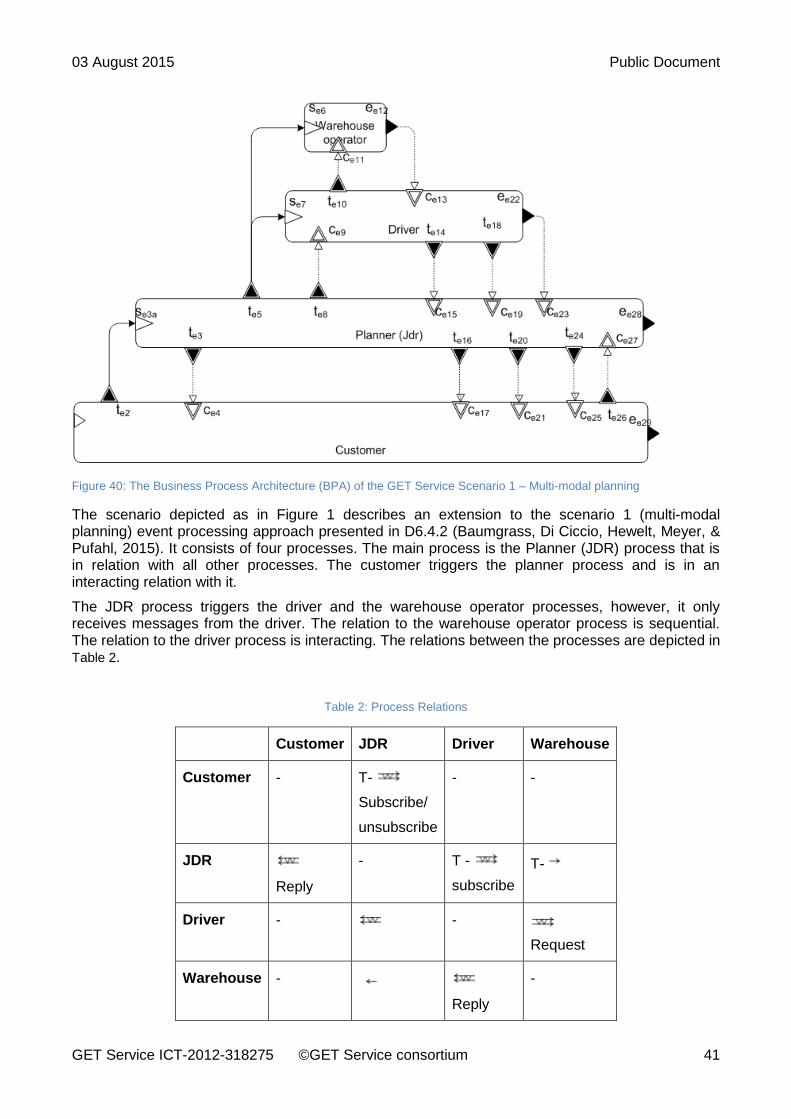
03 August 2015 Public Document
GET Service ICT-2012-318275 ©GET Service consortium 41
Figure 40: The Business Process Architecture (BPA) of the GET Service Scenario 1 – Multi-modal planning
The scenario depicted as in Figure 1 describes an extension to the scenario 1 (multi-modal planning) event processing approach presented in D6.4.2 (Baumgrass, Di Ciccio, Hewelt, Meyer, & Pufahl, 2015). It consists of four processes. The main process is the Planner (JDR) process that is in relation with all other processes. The customer triggers the planner process and is in an interacting relation with it.
The JDR process triggers the driver and the warehouse operator processes, however, it only receives messages from the driver. The relation to the warehouse operator process is sequential. The relation to the driver process is interacting. The relations between the processes are depicted in Table 2.
Table 2: Process Relations
Customer JDR Driver Warehouse
Customer - T-
Subscribe/
unsubscribe
- -
JDR
Reply
- T -
subscribe
T-
Driver - -
Request
Warehouse -
Reply
-
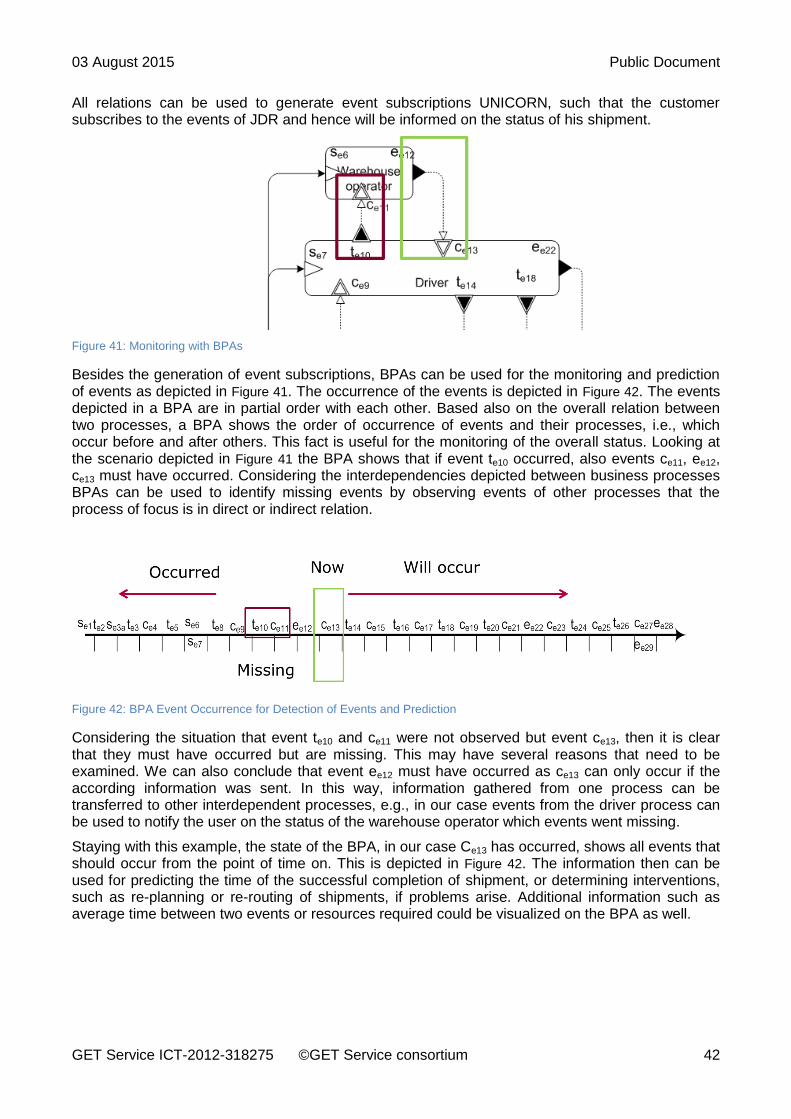
03 August 2015 Public Document
GET Service ICT-2012-318275 ©GET Service consortium 42
All relations can be used to generate event subscriptions UNICORN, such that the customer subscribes to the events of JDR and hence will be informed on the status of his shipment.
Figure 41: Monitoring with BPAs
Besides the generation of event subscriptions, BPAs can be used for the monitoring and prediction of events as depicted in Figure 41. The occurrence of the events is depicted in Figure 42. The events depicted in a BPA are in partial order with each other. Based also on the overall relation between two processes, a BPA shows the order of occurrence of events and their processes, i.e., which occur before and after others. This fact is useful for the monitoring of the overall status. Looking at the scenario depicted in Figure 41 the BPA shows that if event te10 occurred, also events ce11, ee12, ce13 must have occurred. Considering the interdependencies depicted between business processes BPAs can be used to identify missing events by observing events of other processes that the process of focus is in direct or indirect relation.
Figure 42: BPA Event Occurrence for Detection of Events and Prediction
Considering the situation that event te10 and ce11 were not observed but event ce13, then it is clear that they must have occurred but are missing. This may have several reasons that need to be examined. We can also conclude that event ee12 must have occurred as ce13 can only occur if the according information was sent. In this way, information gathered from one process can be transferred to other interdependent processes, e.g., in our case events from the driver process can be used to notify the user on the status of the warehouse operator which events went missing.
Staying with this example, the state of the BPA, in our case Ce13 has occurred, shows all events that should occur from the point of time on. This is depicted in Figure 42. The information then can be used for predicting the time of the successful completion of shipment, or determining interventions, such as re-planning or re-routing of shipments, if problems arise. Additional information such as average time between two events or resources required could be visualized on the BPA as well.
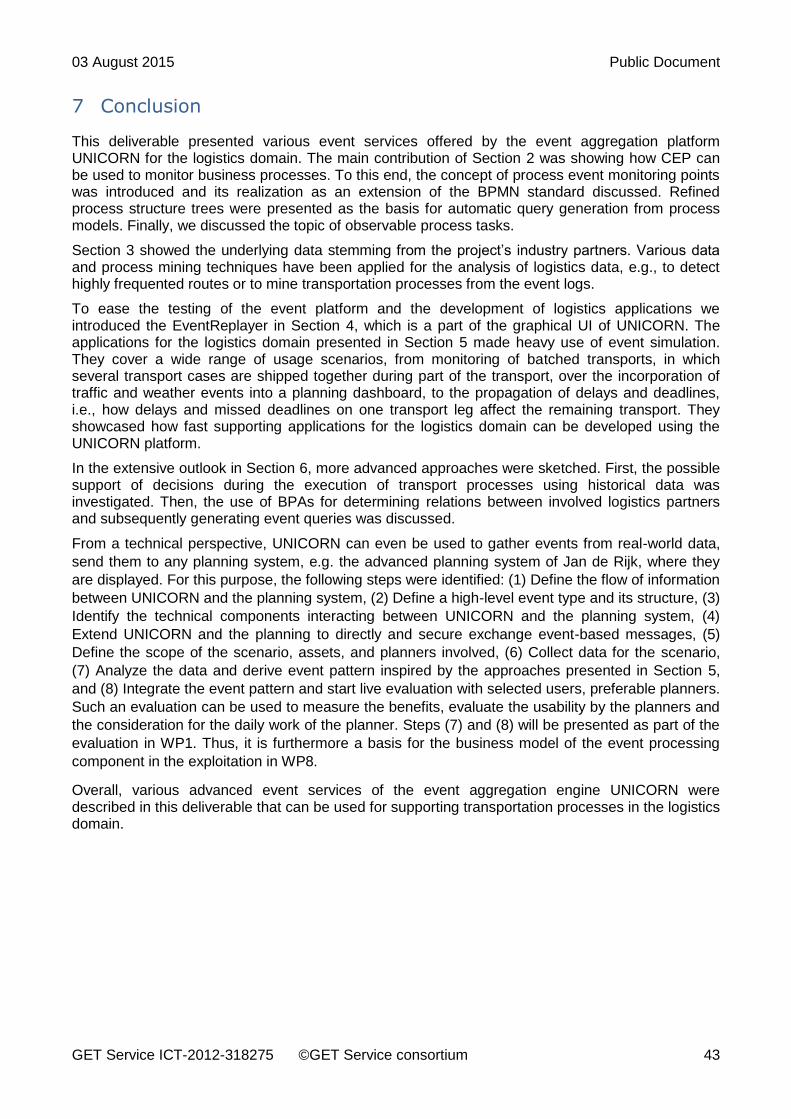
03 August 2015 Public Document
GET Service ICT-2012-318275 ©GET Service consortium 43
7 Conclusion
This deliverable presented various event services offered by the event aggregation platform UNICORN for the logistics domain. The main contribution of Section 2 was showing how CEP can be used to monitor business processes. To this end, the concept of process event monitoring points was introduced and its realization as an extension of the BPMN standard discussed. Refined process structure trees were presented as the basis for automatic query generation from process models. Finally, we discussed the topic of observable process tasks.
Section 3 showed the underlying data stemming from the project’s industry partners. Various data and process mining techniques have been applied for the analysis of logistics data, e.g., to detect highly frequented routes or to mine transportation processes from the event logs.
To ease the testing of the event platform and the development of logistics applications we introduced the EventReplayer in Section 4, which is a part of the graphical UI of UNICORN. The applications for the logistics domain presented in Section 5 made heavy use of event simulation. They cover a wide range of usage scenarios, from monitoring of batched transports, in which several transport cases are shipped together during part of the transport, over the incorporation of traffic and weather events into a planning dashboard, to the propagation of delays and deadlines, i.e., how delays and missed deadlines on one transport leg affect the remaining transport. They showcased how fast supporting applications for the logistics domain can be developed using the UNICORN platform.
In the extensive outlook in Section 6, more advanced approaches were sketched. First, the possible support of decisions during the execution of transport processes using historical data was investigated. Then, the use of BPAs for determining relations between involved logistics partners and subsequently generating event queries was discussed.
From a technical perspective, UNICORN can even be used to gather events from real-world data,
send them to any planning system, e.g. the advanced planning system of Jan de Rijk, where they
are displayed. For this purpose, the following steps were identified: (1) Define the flow of information
between UNICORN and the planning system, (2) Define a high-level event type and its structure, (3)
Identify the technical components interacting between UNICORN and the planning system, (4)
Extend UNICORN and the planning to directly and secure exchange event-based messages, (5)
Define the scope of the scenario, assets, and planners involved, (6) Collect data for the scenario,
(7) Analyze the data and derive event pattern inspired by the approaches presented in Section 5,
and (8) Integrate the event pattern and start live evaluation with selected users, preferable planners.
Such an evaluation can be used to measure the benefits, evaluate the usability by the planners and
the consideration for the daily work of the planner. Steps (7) and (8) will be presented as part of the
evaluation in WP1. Thus, it is furthermore a basis for the business model of the event processing
component in the exploitation in WP8.
Overall, various advanced event services of the event aggregation engine UNICORN were described in this deliverable that can be used for supporting transportation processes in the logistics domain.
03 August 2015 Public Document
GET Service ICT-2012-318275 ©GET Service consortium 44
8 Bibliography
Batoulis, K., Baumgrass, A., Herzberg, N., & Weske, M. (2015). Enabling Dynamic Decision Making in Business Processes with DMN. BPM Workshops 2015.
Baumgrass, A., Di Ciccio, C., Hewelt, M., Meyer, A., & Pufahl, M. (2015). GET Service Project - Deliverable report D6.4.2: Aggregation rules that support usage scenarios .
Baumgrass, A., Di Ciccio, C., Hewelt, M., Pufahl, M., Mandal, S., & Meyer, A. (2015). GET Service Project Deliverable 6.4.2: Aggregation rules that support usage scenarios. GET Service Consortium.
Baumgrass, A., Herzberg, N., Meyer, A., & Weske, M. (2014). BPMN Extension for Business Process Monitoring. Enterprise Modelling and Information Systems Architectures (EMISA). Gesellschaft fuer Informatik (GI).
Botezatu, M., & Völzer, H. (2015). GET Service Project - D4.1: Language and Meta-Model for transport processes and snippets.
Cabanillas, C., Di Ciccio, C., & Baumgrass, A. (2014). Predictive Task Monitoring for Business Processes. In Business Process Management (pp. 424-432). Eindhoven: Springer.
Eid-Sabbagh, R.-H., Dijkman, R., & Weske, M. (2012). Business Process Architecture: Use and Correctness. Business Process Management (BPM) (pp. 65--81). Springer.
Eid-Sabbagh, R.-H., Hewelt, M., & Weske, M. (2013). Business Process Architectures with Multiplicities: Transformation and Correctness. Business Process Management (pp. 227-234). Beijing: Springer.
Polyvyanyy, A., Völzer, H., & Vanhatalo, J. (n.d.). Simplified Computation and Generalization of the Refined Process Structure Tree. In M. Bravetti, & T. Bultan (Eds.), Web Services and Formal Methods (Vol. 6551). Springer.
Schmiele, J., Ettinger, R., & Keller, H. (2014). GET Service Project - Deliverable 1.4.2: End-User Tests, Cycle 1. GET Service Consortium.
Stroppi, L. J., Chiotti, O., & Villareal, P. D. (2011). Extending BPMN 2.0: Method and Tool Support. BPM Workshops (pp. 59-73). Lucerne: Springer.