Embed Size (px)
Citation preview

Delivering for ShareholdersDelivering for Shareholders
Australia and New Zealand Banking Group LimitedAustralia and New Zealand Banking Group Limited
Peter MarriottChief Financial OfficerFebruary 2000

Briefing OutlineBriefing Outline
Review of ANZ’s 1999 Results
- Financial Perspective
- Business Perspective
Outline Group Strategy with particular focus on Personal Financial Services strategy.
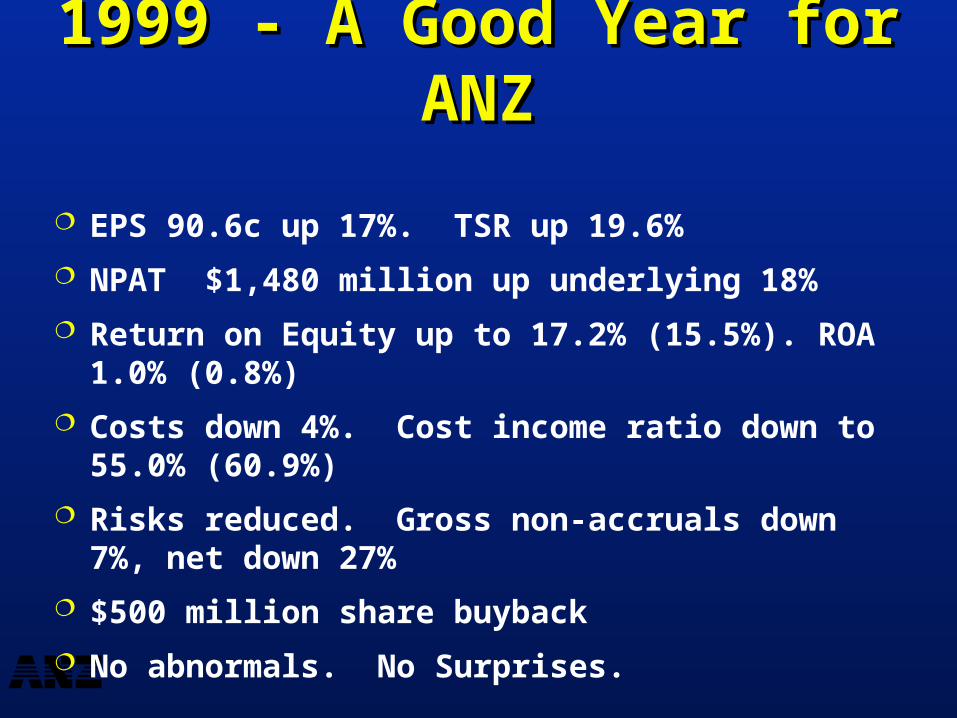
1999 - A Good Year for ANZ1999 - A Good Year for ANZ
EPS 90.6c up 17%. TSR up 19.6%
NPAT $1,480 million up underlying 18%
Return on Equity up to 17.2% (15.5%). ROA 1.0% (0.8%)
Costs down 4%. Cost income ratio down to 55.0% (60.9%)
Risks reduced. Gross non-accruals down 7%, net down 27%
$500 million share buyback
No abnormals. No Surprises.
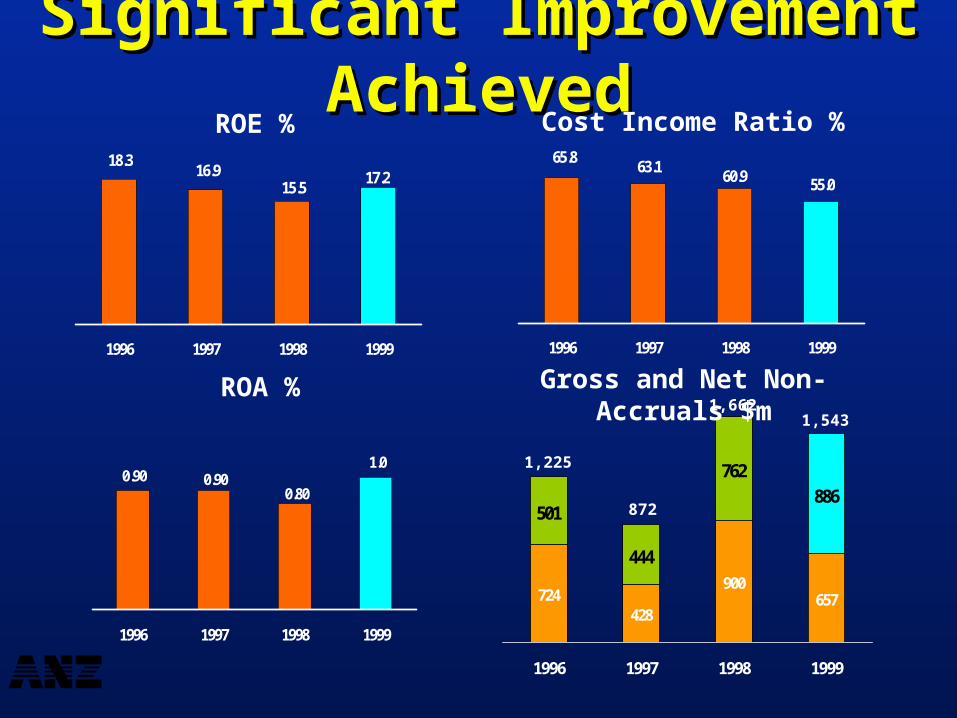
18.3
15.516.9 17.2
1996 1997 1998 1999
724428
900657
501
444
762886
1996 1997 1998 1999
Significant Improvement AchievedSignificant Improvement Achieved65.8
60.963.1
55.0
1996 1997 1998 1999
0.900.80
0.901.0
1996 1997 1998 1999
ROE % Cost Income Ratio %
ROA % Gross and Net Non-Accruals $m
1,225
872
1,6621,543
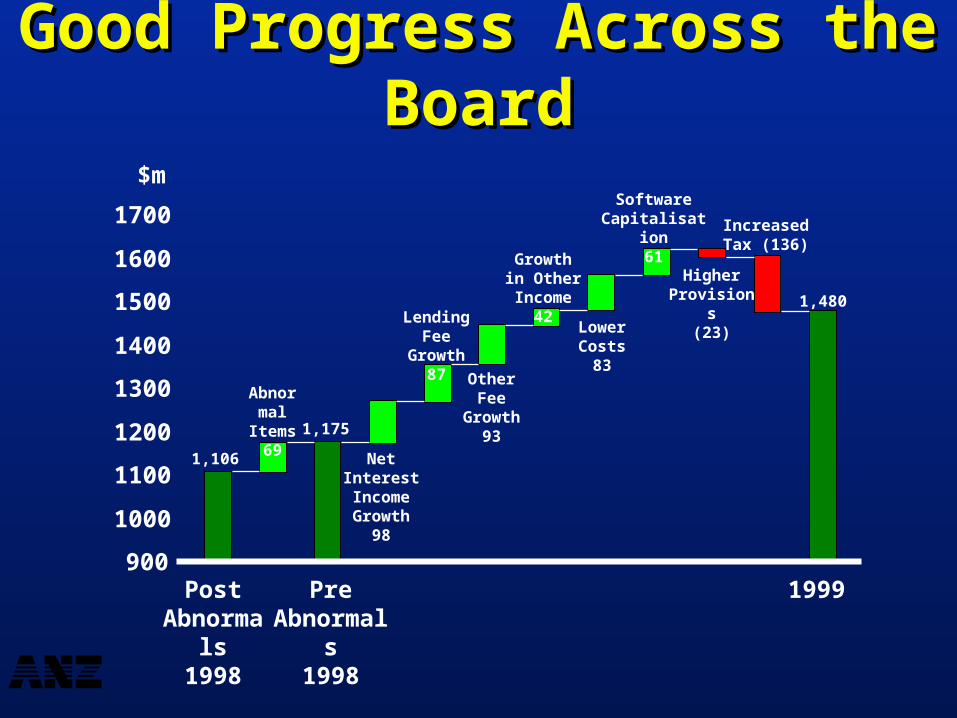
Good Progress Across the BoardGood Progress Across the Board
900
1000
1100
1200
1300
1400
1500
1600
1700
1,106
Abnormal Items
69 1,175
Net InterestIncome Growth
98
Lending Fee Growth
87
Other Fee Growth
93
Growth in Other
Income42
Lower Costs
83
Software Capitalisation
61
Higher Provisions
(23)
Increased Tax (136)
1,480
$m
PostAbnormals
1998
PreAbnormals
1998
1999

Drivers of PerformanceDrivers of Performance
15.517.2
1998 1999
0.81.0
2.37 2.46
1.4 1.57
2.29 2.22
0.32 0.34
2.97 3.05
60.9 55
0.45 0.43
ROA
ROE
NII/Interest Earning AssetsNet Interest
Assets
Other IncomeAssets
CostAssets
ProvisionsAssets
Leverage
Risk
Business Mix
Cost/Income
Provisions/NLA
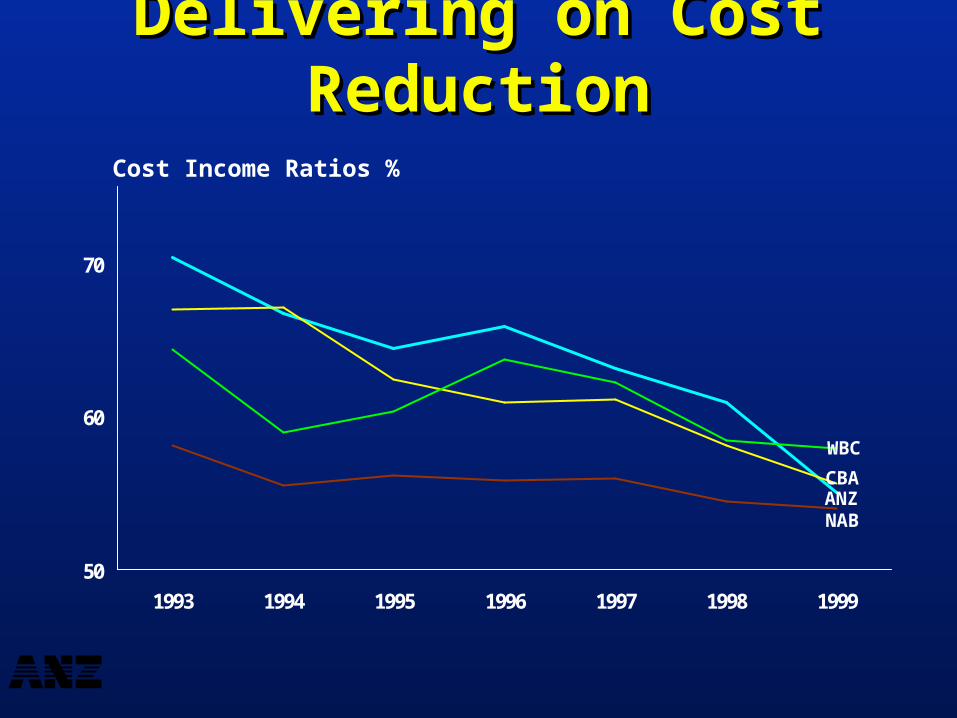
Delivering on Cost ReductionDelivering on Cost Reduction
50
60
70
1993 1994 1995 1996 1997 1998 1999
Cost Income Ratios %
ANZ
WBC
CBA
NAB
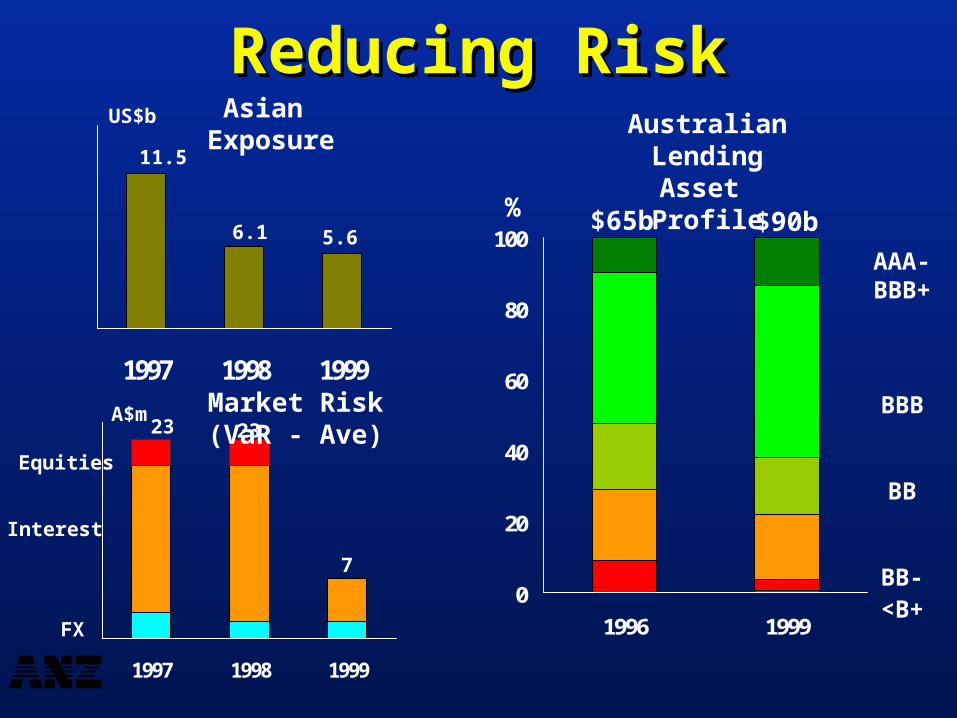
0
20
40
60
80
100
1996 1999
1997 1998 1999
1997 1998 1999
FX
Interest
Reducing RiskReducing RiskUS$b Asian
Exposure
Market Risk (VaR - Ave)A$m2323
AAA-BBB+
BBB
BB
BB-<B+
$65b $90b
Australian Lending Asset Profile
7
11.5
6.1 5.6%
Equities
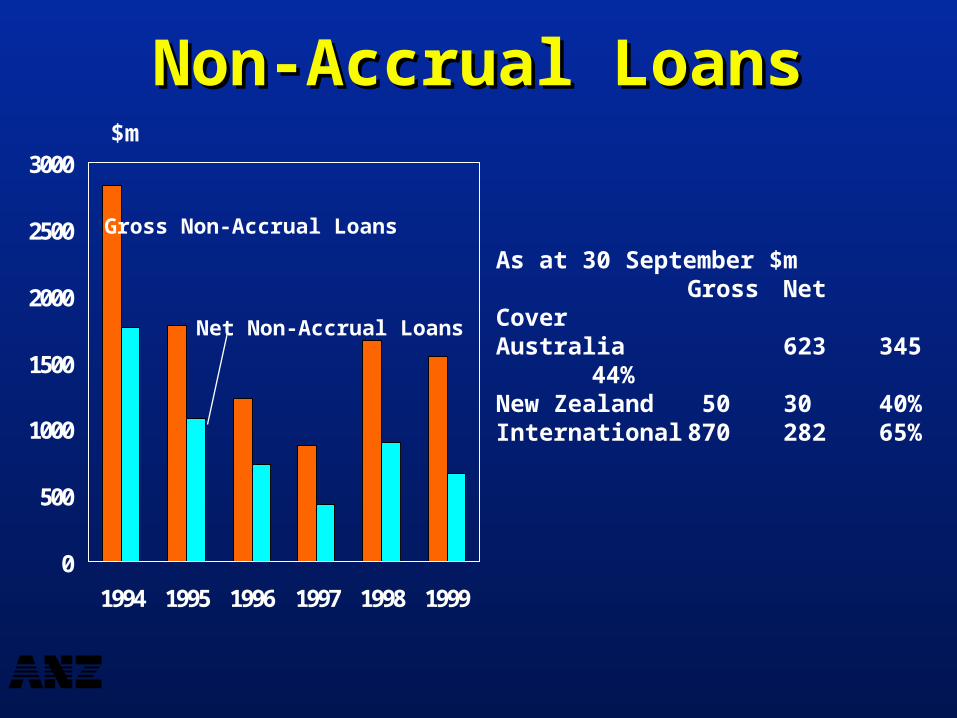
0
500
1000
1500
2000
2500
3000
1994 1995 1996 1997 1998 1999
Gross Non-Accrual Loans
Non-Accrual LoansNon-Accrual Loans
Net Non-Accrual Loans
As at 30 September $mGross Net Cover
Australia 623 345 44%New Zealand 50 30 40%International 870 282 65%
$m
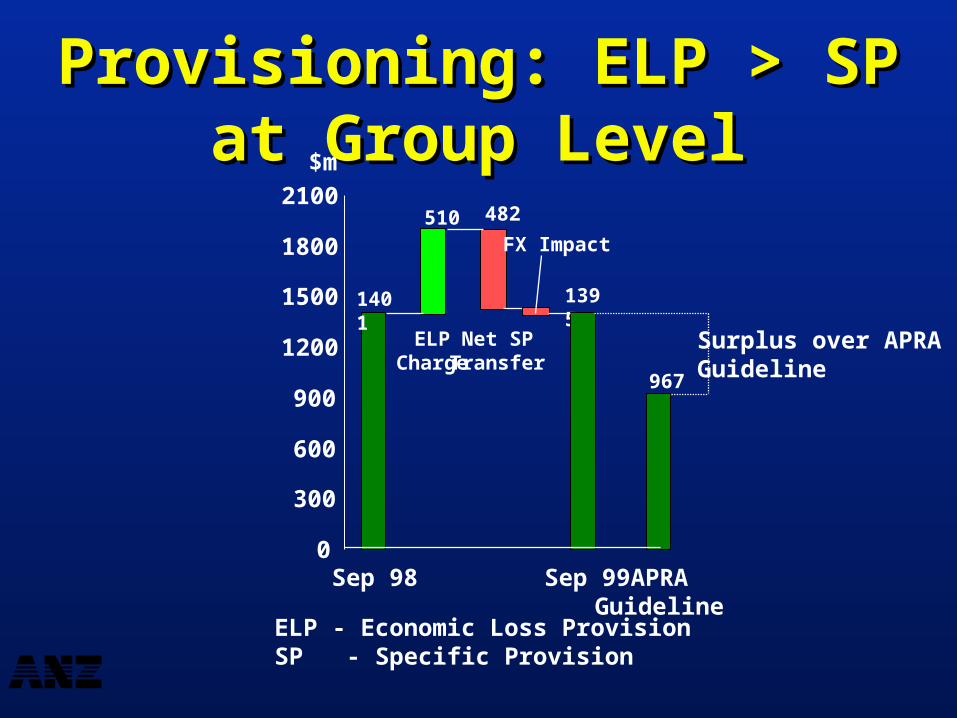
Provisioning: ELP > SP at Group Provisioning: ELP > SP at Group LevelLevel
ELP - Economic Loss ProvisionSP - Specific Provision
Sep 98 Sep 99 APRAGuideline
ELPCharge
Net SPTransfer
1395
0
300
600
900
1200
1500
1800
2100
1401
510 482
967
$m
FX Impact
Surplus over APRAGuideline
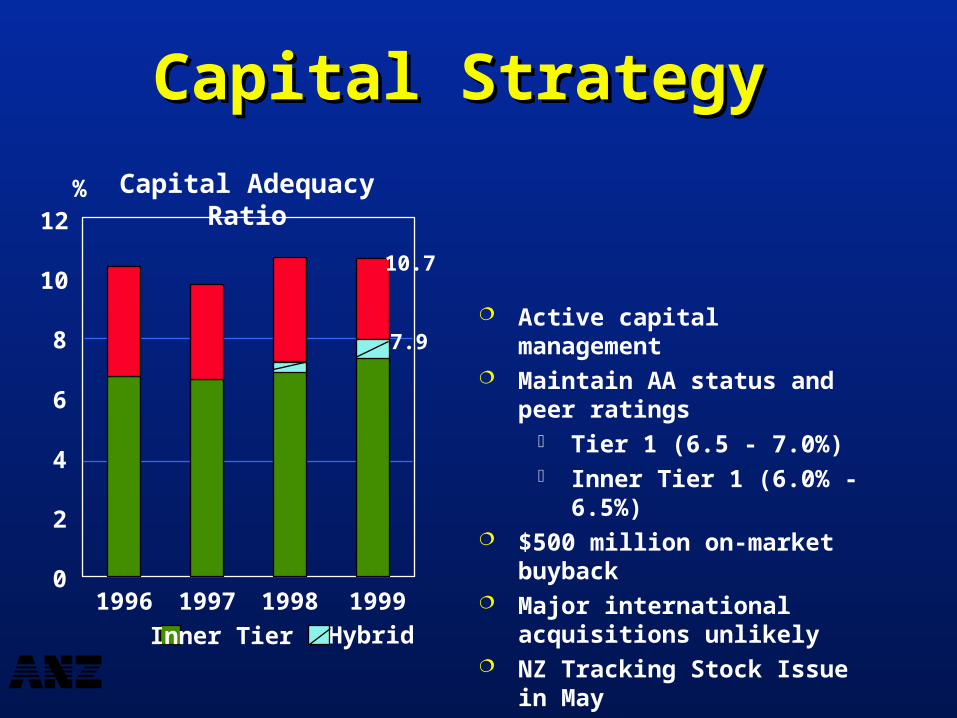
Capital Strategy Capital Strategy
Active capital management Maintain AA status and peer ratings
Tier 1 (6.5 - 7.0%) Inner Tier 1 (6.0% - 6.5%)
$500 million on-market buyback Major international acquisitions
unlikely NZ Tracking Stock Issue in May
Capital Adequacy Ratio%
Inner Tier 1
0
2
4
6
8
10
12
1996 1997 1998 1999
Hybrid
10.7
7.9
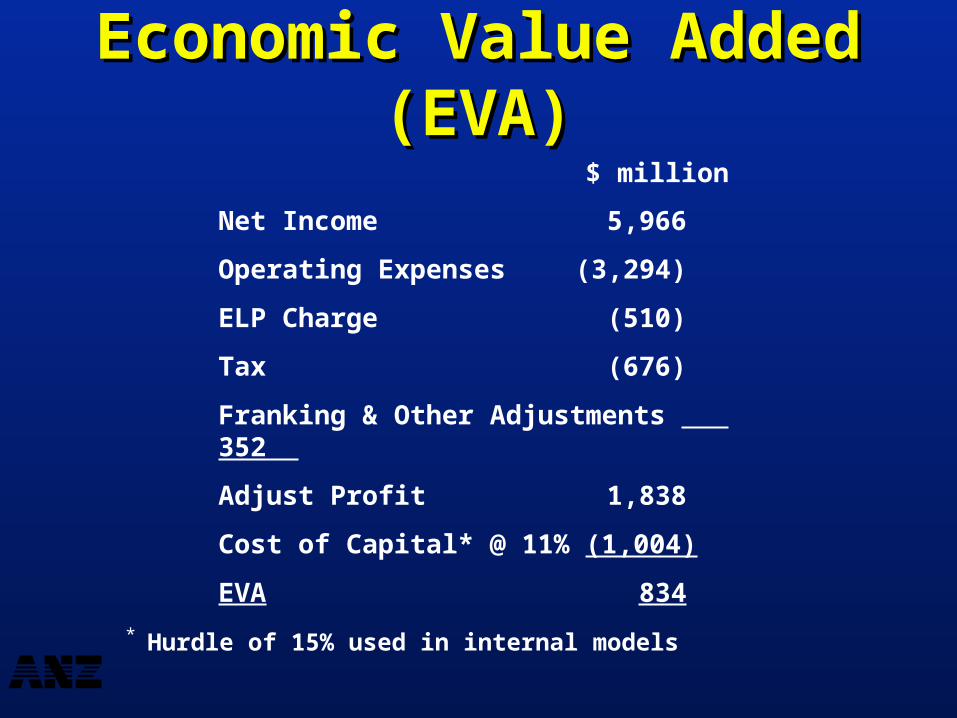
Economic Value Added (EVA)Economic Value Added (EVA)
Net Income 5,966
Operating Expenses (3,294)
ELP Charge (510)
Tax (676)
Franking & Other Adjustments 352
Adjust Profit 1,838
Cost of Capital* @ 11% (1,004)
EVA 834
* Hurdle of 15% used in internal models
$ million
Business on TrackBusiness on Track
Strategic re-positioning on track in all segments
Good earnings growth in Australia and New Zealand
Business mix substantially improved. High risk businesses exited
Domestic market share up notwithstanding cost focus
140,000 Internet banking customers (8000). ANZ E*Trade launched
Major technology projects completed on time, on budget

Business Mix ImprovedBusiness Mix Improved
0
500
1000
1500
1998 1999
Business Segment Profit After Tax
Other
International
Corporate
PersonalUp 33%
Up 17%
Down 20%
Business Segment Proportion
Personal
Corporate
InternationalOther
$m
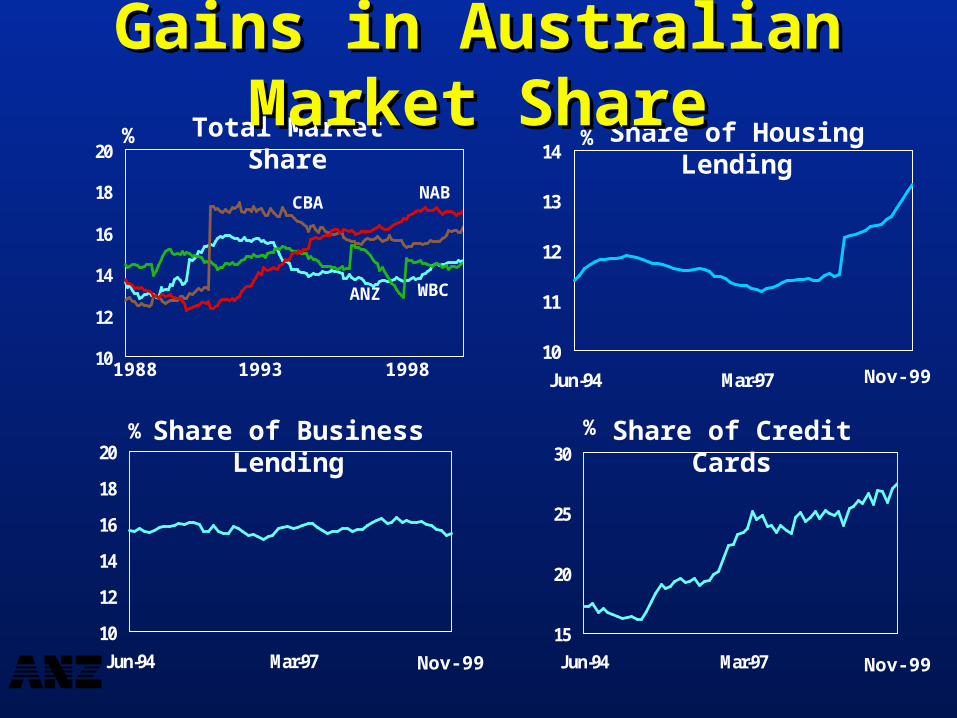
Total Market Share
Share of Credit Cards
10
12
14
16
18
20 %
ANZ
NABCBA
WBC
10
11
12
13
14
Jun-94 Mar-97
Share of Housing Lending%
10
12
14
16
18
20
Jun-94 Mar-97
% Share of Business Lending %
19931988 1998
15
20
25
30
Jun-94 Mar-97 Nov-99
Nov-99
Nov-99
Gains in Australian Market ShareGains in Australian Market Share
Overall Strategic Direction in PlaceOverall Strategic Direction in Place
Balance business mix towards consumer and low risk Personal offers greatest growth and earnings potential Leading position in corporate to be leveraged International to be simplified and focused A leading presence in e-Commerce to be established
Transform management process to deliver EVA Withdraw from high-risk and non core segments Improve performance in suboptimal businesses Invest in high growth revenue streams Hold costs flat Optimise capital efficiency
Strategy for PersonalStrategy for Personal
Aggressively build market position in all consumer segments
An intergrated financial services approach
Special focus on insurance and retail funds management
Differentiated service propositions by customer segment
Build strong product businesses
Continue intense focus on cost management
Build a leading consumer e-Commerce capability
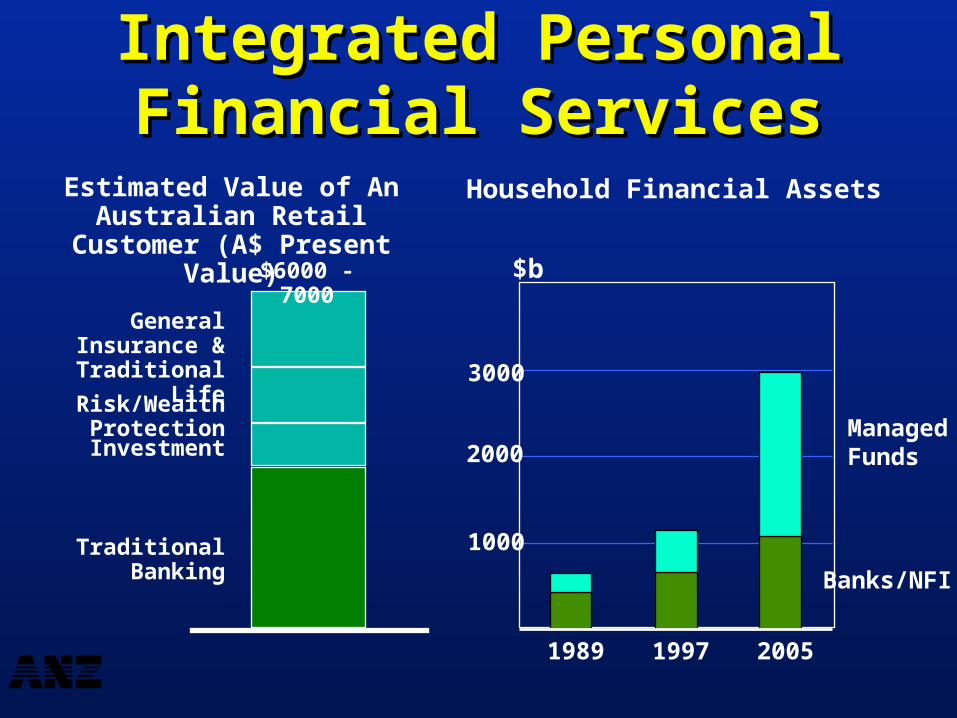
Integrated Personal Financial Integrated Personal Financial ServicesServices
Estimated Value of An Australian Retail Customer (A$ Present Value)
Risk/Wealth Protection
Traditional Banking
$6000 - 7000
Investment
General Insurance & Traditional Life
1989 1997 2005
Banks/NFI
Managed Funds
Household Financial Assets
1000
2000
3000
$b
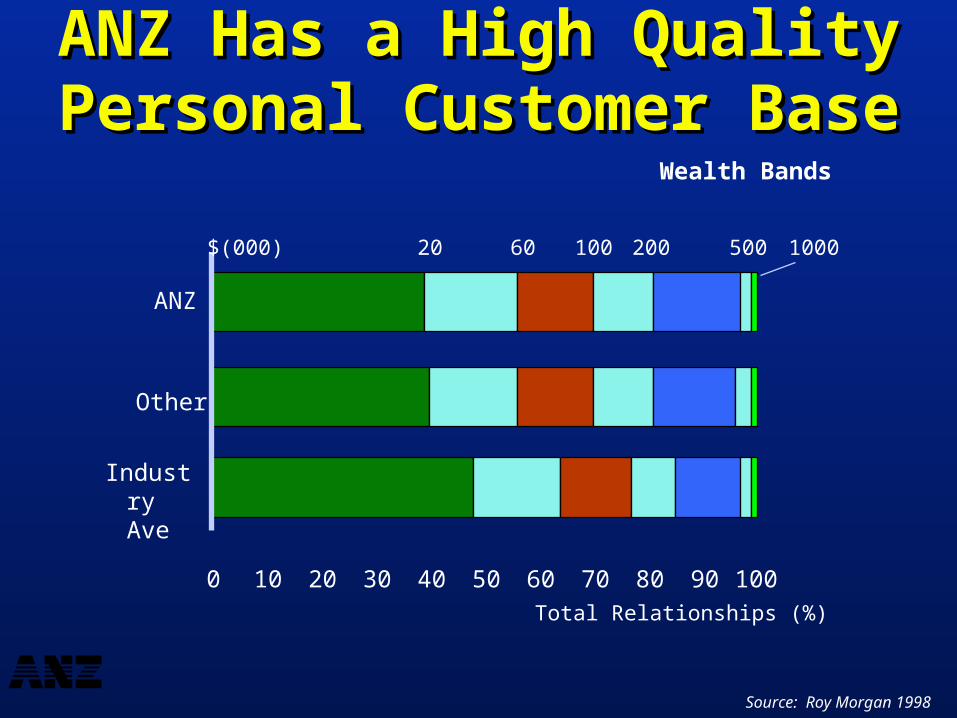
ANZ Has a High Quality Personal ANZ Has a High Quality Personal Customer BaseCustomer Base
0 10 20 30 40 50 60 70 80 90 100
Industry Ave
ANZ
20 100 200 500 100060
Total Relationships (%)
Wealth Bands
Source: Roy Morgan 1998
Other
$(000)
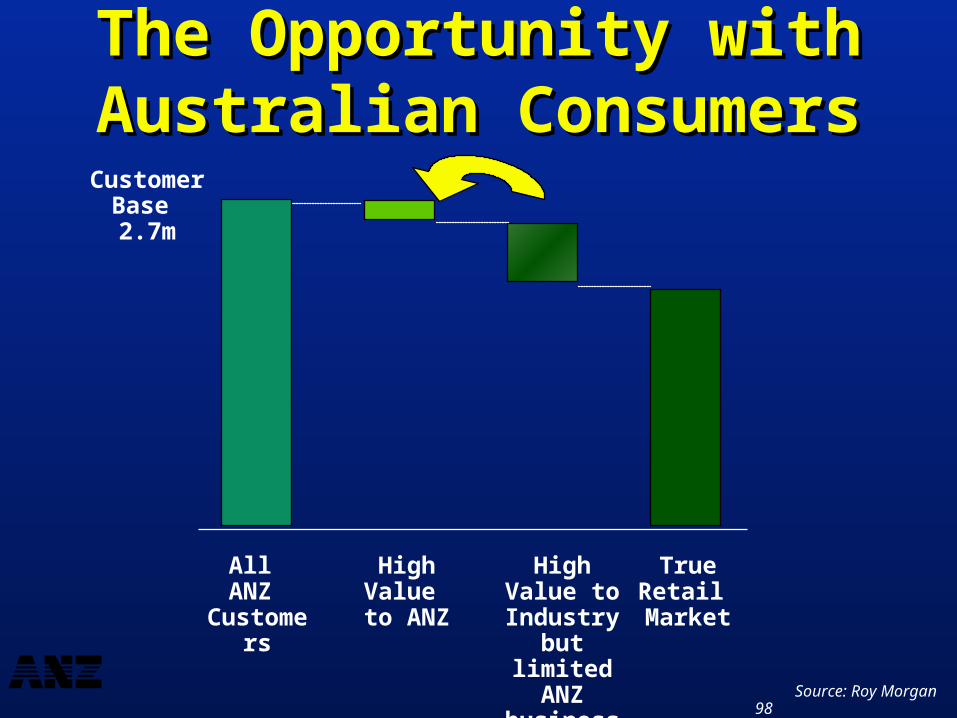
The Opportunity with Australian The Opportunity with Australian ConsumersConsumers
Source: Roy Morgan 98
All ANZ Customers
High Value to ANZ
High Value to
Industry but limited
ANZ business
True Retail
Market
CustomerBase 2.7m

A New Dedicated Business for A New Dedicated Business for Premier CustomersPremier Customers
Premier Financial Package Dedicated Managers Premier Suites Dedicated Service Officers
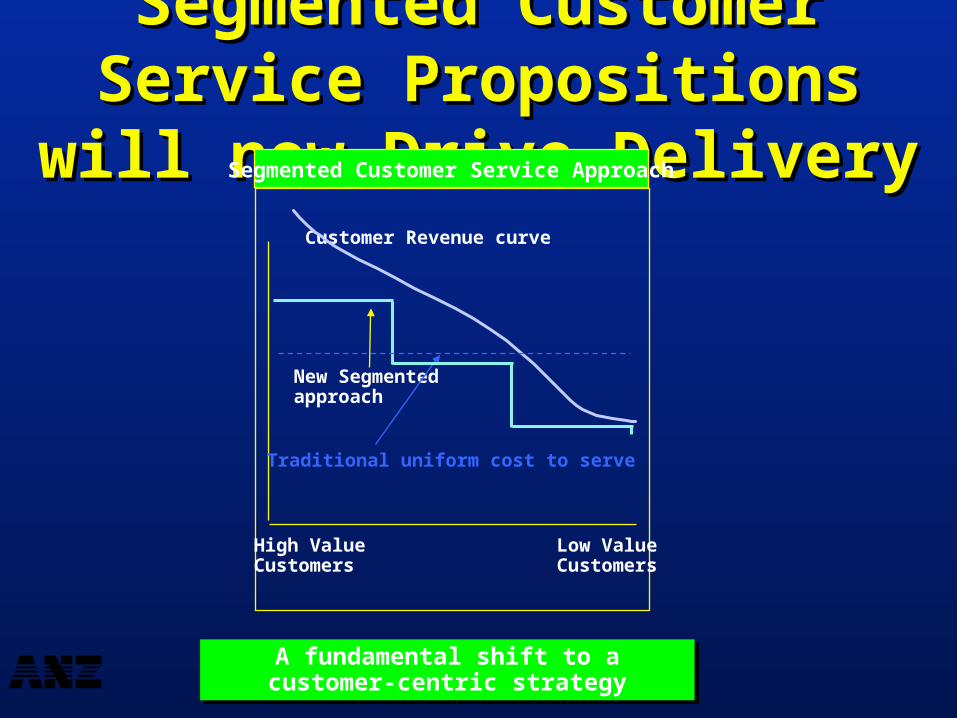
A fundamental shift to a customer-centric strategyA fundamental shift to a customer-centric strategy
Segmented Customer Service Segmented Customer Service Propositions will now Drive DeliveryPropositions will now Drive Delivery
High ValueCustomers
Low ValueCustomers
New Segmented approach
Customer Revenue curve
Traditional uniform cost to serve
Segmented Customer Service Approach
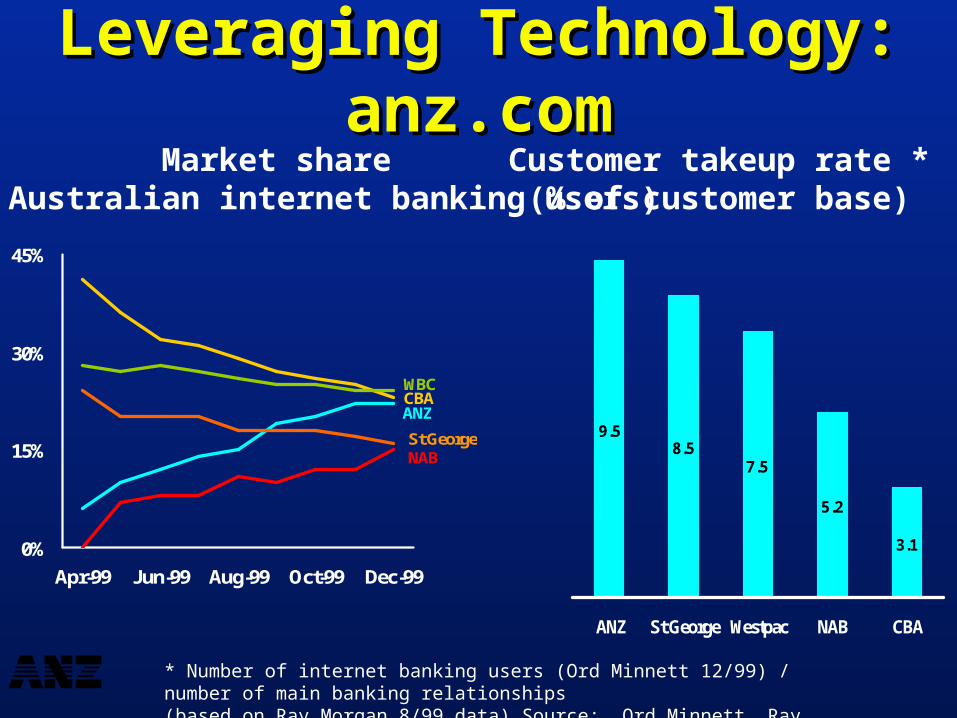
0%
15%
30%
45%
Apr-99 Jun-99 Aug-99 Oct-99 Dec-99
CBAWBC
ANZ
St GeorgeNAB
9.58.5
7.5
5.2
3.1
ANZ St George Westpac NAB CBA
Market share(% of Australian internet banking users)
Customer takeup rate *(% of customer base)
* Number of internet banking users (Ord Minnett 12/99) / number of main banking relationships(based on Ray Morgan 8/99 data) Source: Ord Minnett, Ray Morgan
Leveraging Technology: anz.comLeveraging Technology: anz.com
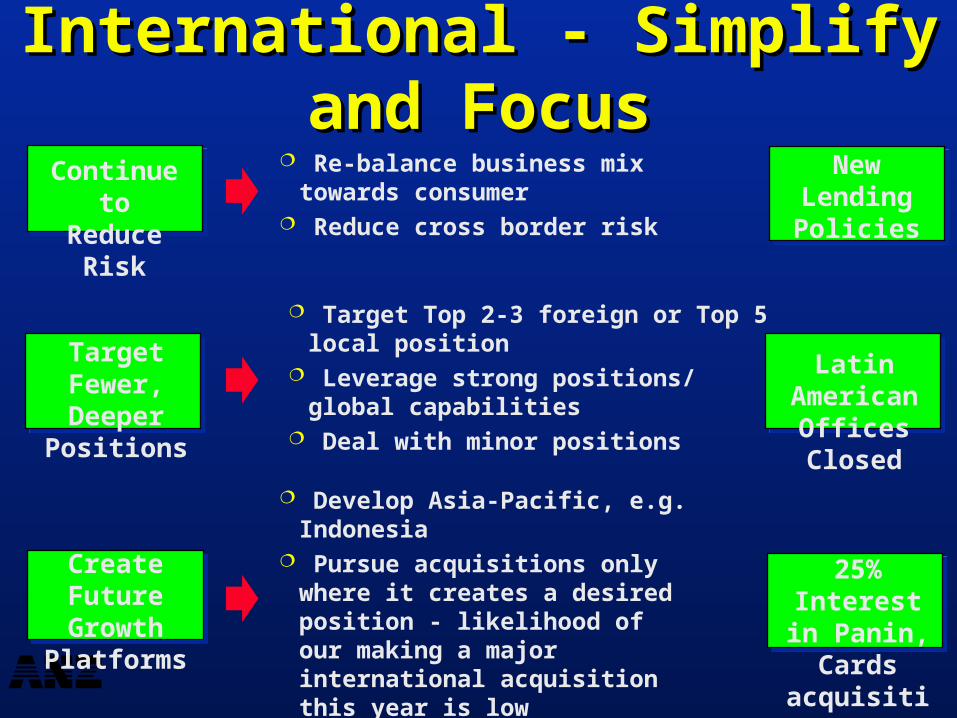
International - Simplify and FocusInternational - Simplify and Focus Re-balance business mix towards
consumer Reduce cross border risk
Target Top 2-3 foreign or Top 5 local position Leverage strong positions/ global capabilities Deal with minor positions
Develop Asia-Pacific, e.g. Indonesia Pursue acquisitions only where it creates
a desired position - likelihood of our making a major international acquisition this year is low
Continue to Reduce Risk
Target Fewer, Deeper
Positions
Create Future Growth
Platforms
New Lending Policies
Latin American Offices Closed
25% Interest in Panin, Cards acquisition
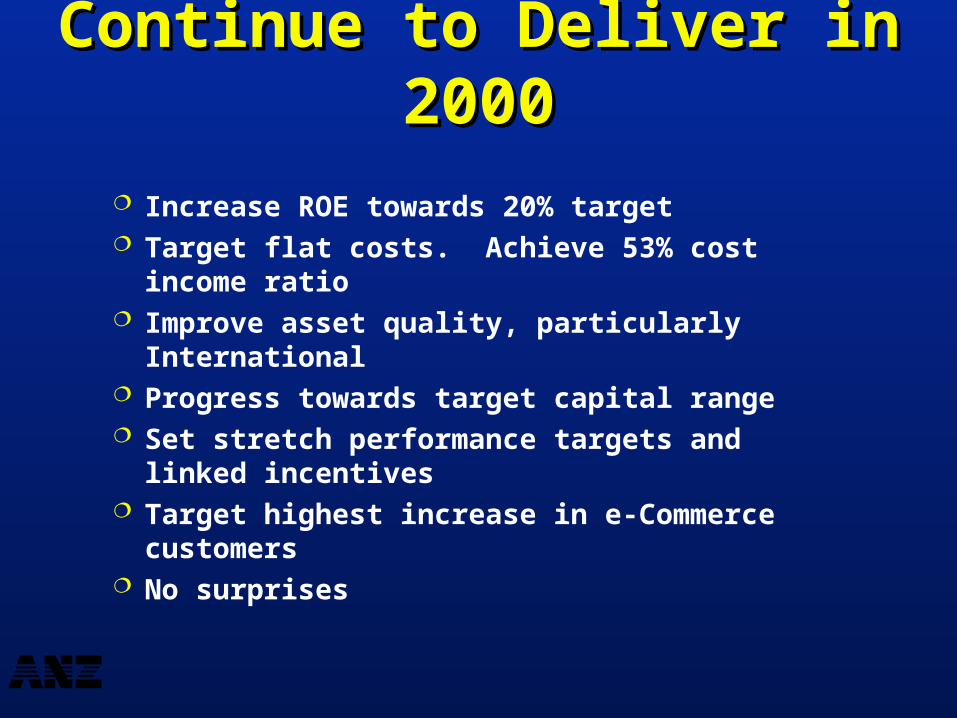
Increase ROE towards 20% target Target flat costs. Achieve 53% cost income ratio Improve asset quality, particularly International Progress towards target capital range Set stretch performance targets and linked incentives Target highest increase in e-Commerce customers No surprises
Continue to Deliver in 2000Continue to Deliver in 2000
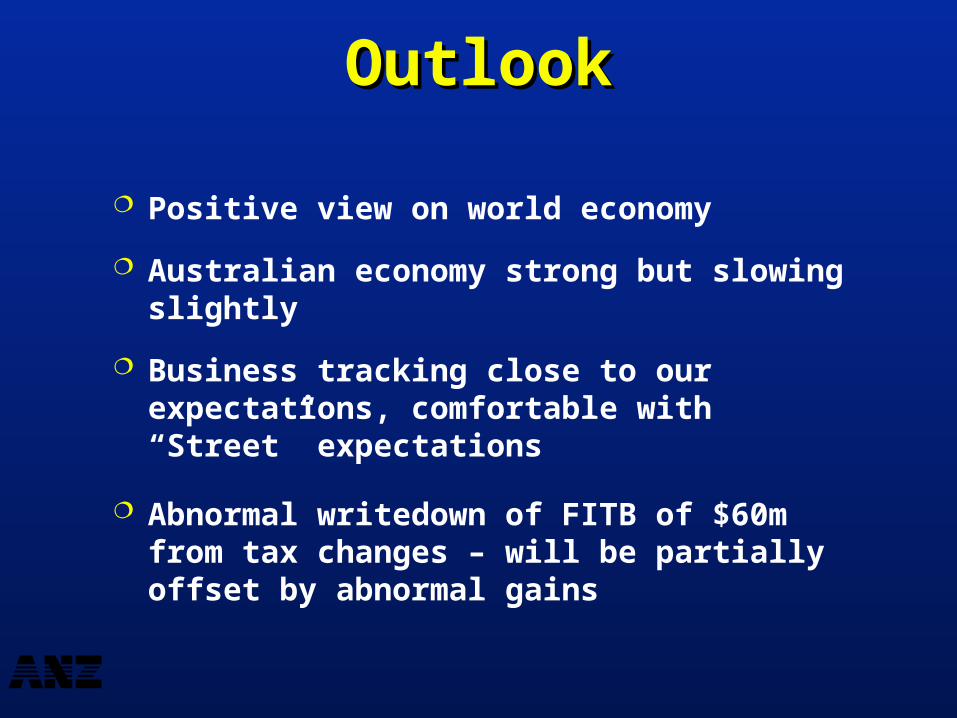
Positive view on world economy
Australian economy strong but slowing slightly
Business tracking close to our expectations, comfortable with “Street” expectations
Abnormal writedown of FITB of $60m from tax changes – will be partially offset by abnormal gains
OutlookOutlook
The material in this presentation is general background information about the Bank’s activities current at the date of the presentation. It is information given in summary form and does not purport to be complete. It is not intended to be
relied upon as advice to investors or potential investors and does not take into account the investment objectives, financial situation or needs of any
particular investor. These should be considered, with or without professional advice when deciding if an investment is appropriate.
For further information visit www.anz.com or contact
David Ward
General Manager Office of the Chief Executive
ph (613) 9273 4185 fax (613)9273 4091 email [email protected]

Sep-99
Profit & LossProfit & LossA$M Sep-97 Sep-98Net Interest Income 3,437 3,547
Fees 1,459 1,574FX 237 373
Trading Securities 182 <83> Other 232 235
Net Income 5,547 5,646Expenses Personnel 1,949 1,854
Premises 362 347Computer 330 341
Other 771 776Restructuring Costs 90 120Total Expenses 3,502 3,438Profit Before Provisions 2,045 2,208Doubtful Debts 400 487Tax 466 537NPAT Before Abnormal Items 1,171 1,175Abnormal Items <147> <69>NPAT and Abnormal Items 1,024 1,106
3,6451,754
34089
138
5,9661,732
31434481391
3,2942,672
510676
1,480-
1,480
Non Interest Income 2,110 2,099 2,321

Profit Before Provisions 1,024 1,021 1,164 1,044 1,302 1,370
Mar-99
Profit & LossProfit & LossA$M Mar-97 Sep-97 Mar-98 Sep-98Net Interest Income 1,718 1,719 1,773 1,774 1,811
Fees 693 766 774 800 850FX 111 126 196 177 180
Trading Securities 80 102 62 <145> 44 Other 116 116 96 139 60
Net Income 2,718 2,829 2,901 2,745 2,945Expenses Personnel 954 995 972 882 860
Premises 184 178 172 175 157Computer 173 157 168 173 186
Other 383 388 385 391 391Sub Total 1,694 1,718 1,697 1,621 1,594Restructuring Costs - 90 40 80 49Total Expenses 1,694 1,808 1,737 1,701 1,643
Doubtful Debts 197 203 237 250 258Tax 243 223 298 239 324NPAT Before Abnormal Items 580 591 625 550 716Abnormal Items <31> <116> - <69> -NPAT and Abnormal Items 549 475 625 481 716
Sep-991,834
9041604578
3,021872157158422
1,60942
1,651
252352764
-764
Non Interest Income 1,000 1,110 1,128 971 1,134 1,187
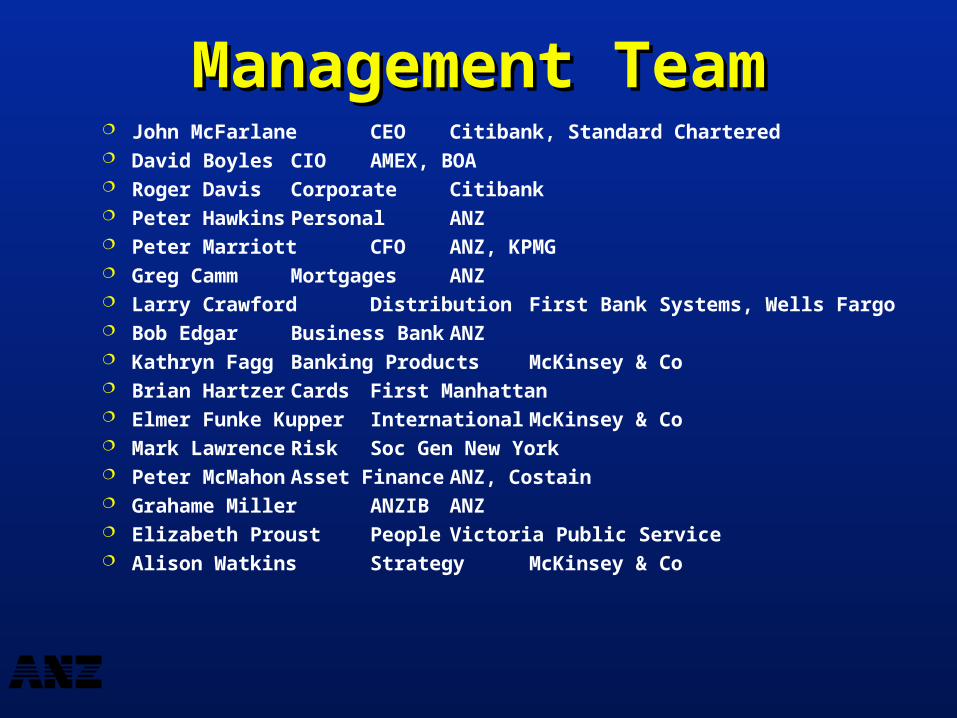
Management TeamManagement Team John McFarlane CEO Citibank, Standard Chartered David Boyles CIO AMEX, BOA Roger Davis Corporate Citibank Peter Hawkins Personal ANZ Peter Marriott CFO ANZ, KPMG Greg Camm Mortgages ANZ Larry Crawford Distribution First Bank Systems, Wells Fargo Bob Edgar Business Bank ANZ Kathryn Fagg Banking Products McKinsey & Co Brian Hartzer Cards First Manhattan Elmer Funke Kupper International McKinsey & Co Mark Lawrence Risk Soc Gen New York Peter McMahon Asset Finance ANZ, Costain Grahame Miller ANZIB ANZ Elizabeth Proust People Victoria Public Service Alison Watkins Strategy McKinsey & Co