Embed Size (px)
Citation preview
Delivering Healthier Communities in London
NHS London Healthy Urban Development UnitLand Use Consultants
and CREH
JULY2007


i
Delivering Healthier Communities in London
i
This guidance is an output of a contract commissioned by the NHS London Healthy Urban Development Unit (HUDU). It was undertaken by Land Use Consultants in association with the Centre for Research into Environment and Health at the University of Aberystwyth.
The Guidance should be referenced as: Land Use Consultants in association with the Centre for Research into Environment and Health (2007). Delivering Healthier Communities in London. HUDU, London.
July 2007
Delivering Healthier Communities in London
ii
CONTENTS
1 Introduction1.1 Approach to the Guidance1.2 Navigation1.3 What is the NHS Healthy Urban Development Unit?1.4 Aims and Objectives of this Guidance1.5 Health and Healthier Communities 1.5.1 What is Health? 1.5.2 Health in London 1.5.3 Timeline for Health and Planning in London 1.5.4 What are Healthier Communities? 1.5.5 The use of a ‘Settlement’ Model to define healthier communities
2 Why Plan for Health?2.1 Introduction2.2 Health Policy 2.2.1 European Context 2.2.2 National Health Policy 2.2.3 Health in London2.3 Health Considerations in National Planning Policy and Guidance2.4 Health Considerations in Regional Planning Policy: The London Plan2.5 Health Planning to Meet the Tests of Soundness
3 Health and Planning3.1 Introduction3.2 Mental Health 3.2.1 Evidence Base 3.2.2 Case Studies 3.2.3 Neighbourhood Quality Case Study 1: Beddington Zero Energy Development 3.2.4 Housing Design and Density 3.2.5 Housing Quality 3.2.6 Fear of Crime Case Study 2: Russell Square Case Study 3: Regeneration of Swanley’s Northview Estate 3.2.7 Flooding Case Study 4: Queenborough and Rushenden Regeneration Case Study 5: River Quaggy Flood Alleviation Scheme
13467999
101214
171819192022232425
313233333434353639404142454649
iii
Delivering Healthier Communities in London
iii
52525353
57596062
6565666667
717172727577
78787979808282
878990909197
117118120121126
3.3 Obesity and Cardiovascular Disease 3.3.1 Evidence Base 3.3.2 Case Studies 3.3.3 Access to open space in new and existing developments/ regeneration projects for physical activity Case Study 6: Mile End Park, Tower Hamlets 3.3.4 Accessibility to new and existing sport and leisure facilities Case Study 7: Lammas Park, Staines Case Study 8: St Peter’s Integrated Health and Leisure Centre
3.4 Respiratory Disease 3.4.1 Evidence Base 3.4.2 Case Studies 3.4.3 Tackling respiratory disease by improving air quality Case Study 9: Camden’s Air Quality Action Plan
3.5 Excess winter (cold) and excess summer (heat) mortality 3.5.1 Evidence Base 3.5.2 Case Studies 3.5.3 Excess summer (heat) mortality: Site Layout and Building Scale Case Study10: Beddington Zero Energy Development 3.5.4 Excess winter (cold) mortality
3.6 Injuries 3.6.1 Evidence Base 3.6.2 Case Studies 3.6.3 Road Layout and Traffic Case Study 11: HomeZone West Ealing, London 3.6.4 Inequalities in Child Pedestrian Injuries 3.6.5 Designing for People instead of Cars
4 A Spatial Plan for Health4.1 Introduction4.2 Good Practice Health Policy Wording 4.2.1 Considering Options for Health 4.2.2 How to Incorporate Health within the Core Strategy 4.2.3 How to Incorporate Health within Core Strategy Policies 4.2.4 How to be Locally Distinctive 4.2.5 Health as a Cross-Cutting Issue4.3 Meeting the Tests of Soundness4.4 Checklist for Planners and Health Practitioners4.5 Monitoring Health Outcomes
Delivering Healthier Communities in London
iv
REFERENCES
APPENDICES
APPENDIX 1: Consideration of Health in National Planning Policy Statements/Guidance Notes
APPENDIX 2 Consideration of Direct and Indirect Links to Health in the London Plan
APPENDIX 3.2 Detailed Mental Health Evidence Base
APPENDIX 3.3 Detailed Obesity Evidence Base
APPENDIX 3.4 Detailed Cardiovascular and Respiratory Disease Evidence Base
APPENDIX 3.5 Detailed Winter (cold) and Summer (heat) mortality Evidence Base
APPENDIX 3.6Detailed Evidence Base for Injuries
Key
Signposts – these provide interactive links to documents or web pages in the text.
Links – These provide links between different sections within the guidance document.
CONTENTS
131
139
140
142
146
168
174
184
188
v
Delivering Healthier Communities in London
v
This guidance document, Delivering Healthier Communities in London, has been prepared to help integrate health and wellbeing into the planning process. In particular, the guidance provides links to the tests of soundness and how to address these when planning for health, provides evidence supporting the linkages between health and planning, and results in a series of tools to guide practitioners. This includes a policy framework for health, principles to follow to incorporate health into design and indicators to monitor health outcomes.
The guidance is aimed at planners (those involved in the writing of plans and policies; and in reviewing development applications), health practitioners (such as those working within Primary Care Trusts who are involved in the review of plans, policies and development applications and/or the provision of health advice to borough planners and developers) and to developers (involved in the design of development and regeneration schemes).
The document has been health led to emphasise the importance of public health issues and hence demonstrate the need to plan for healthier outcomes and avoid negative heath impacts at the earliest possible opportunity. The final section of the document provides ‘A Spatial Plan for Health’ with health driving the selection and formulation of policy.
Five public health issues were chosen: mental health, obesity and cardiovascular disease, respiratory disease, excess summer and winter mortality and injuries. The public health issues were chosen taking account of the significance of the public health impact and the likely influence of spatial planning in modifying health risk factors. There are of course other major public health issues (e.g. cancer), however, the document is not intended to address every possible public health issue and was restricted to those most likely to be influenced by spatial planning.
A detailed evidence base is provided identifying links between spatial planning and the public health issues (for example encouraging physical activity is strongly linked to a reduction in obesity). Case studies were then selected to explore how planning can achieve more favourable healthier outcomes (for example, physical activity can be encouraged through the provision of good quality, accessible green spaces, combined with initiatives to support the ongoing use of such spaces). Case studies have also been used to illustrate the application of policy or to demonstrate changes in the physical and built environment as a means to promote healthier outcomes.
Finally, ‘A Spatial Plan for Health’ is prepared which addresses the recommendations and lessons learnt from the case studies, aiming to move towards better practice. The Spatial Plan sets out a health policy framework for those writing and reviewing health policies within Local Development Frameworks. The framework is intended to be cherry picked by practitioners and adapted as appropriate to their local circumstances.
EXECUTIVE SUMMARY

Delivering Healthier Communities in London
vi

Delivering Healthier Communities in London
1
1 - INTRODUCTION

2
Delivering Healthier Communities in London
3
Delivering Healthier Communities in LondonDelivering Healthier Communities in London
1.1 APPROACH TO THE GUIDANCE
1 - INTRODUCTION 2 - WHY PLAN FOR HEALTH
4 - A SPATIAL PLAN FOR HEALTH
3 - HEALTH AND PLANNING
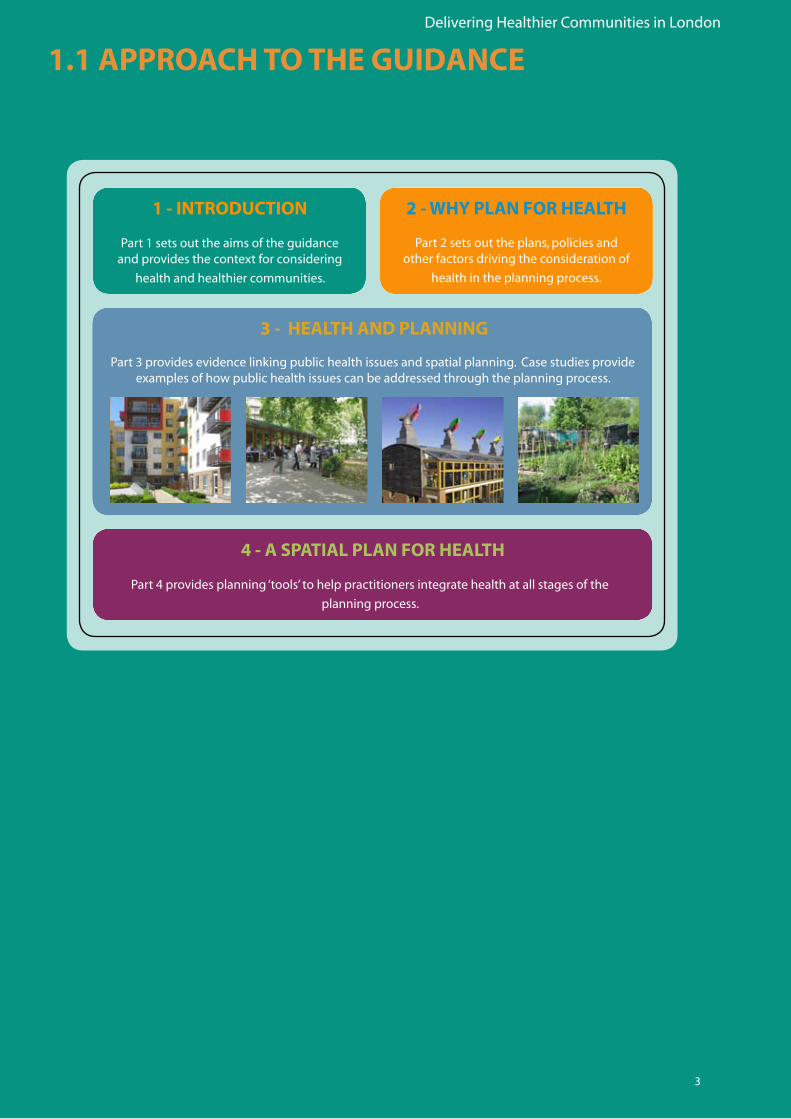
Part 3 provides evidence linking public health issues and spatial planning. Case studies provide examples of how public health issues can be addressed through the planning process.
Part 4 provides planning ‘tools’ to help practitioners integrate health at all stages of the
planning process.
Part 1 sets out the aims of the guidance and provides the context for considering
health and healthier communities.
Part 2 sets out the plans, policies and other factors driving the consideration of
health in the planning process.
4
Delivering Healthier Communities in London
Respiratory disease
Excess winter and summer mortality
Injuries
Obesity and cardiovascular
disease
Mental health
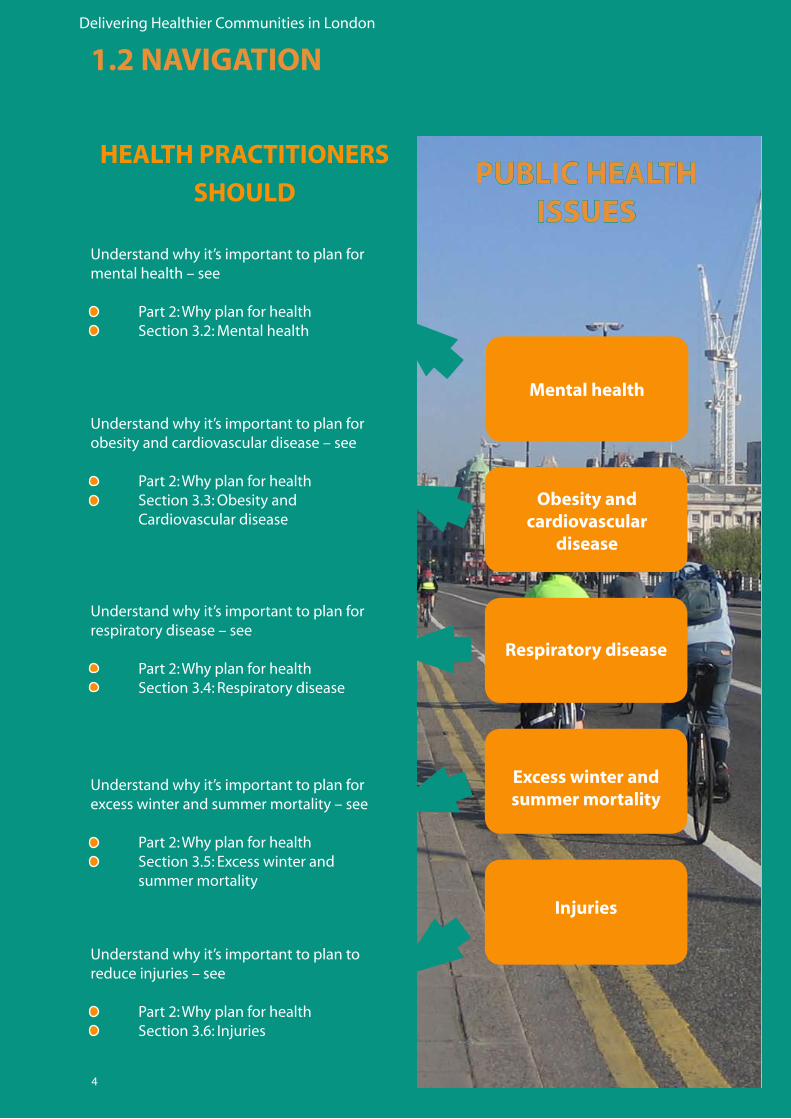
Understand why it’s important to plan for mental health – see
• Part2:Whyplanforhealth• Section3.2:Mentalhealth
Understand why it’s important to plan for obesity and cardiovascular disease – see
• Part2:Whyplanforhealth• Section3.3:Obesityand Cardiovascular disease
Understand why it’s important to plan for respiratory disease – see
• Part2:Whyplanforhealth• Section3.4:Respiratorydisease
Understand why it’s important to plan for excess winter and summer mortality – see
• Part2:Whyplanforhealth• Section3.5:Excesswinterand summer mortality
Understand why it’s important to plan to reduce injuries – see
• Part2:Whyplanforhealth• Section3.6:Injuries
1.2 NAVIGATION
PUBLIC HEALTH ISSUES
HEALTH PRACTITIONERS
SHOULD

5
Delivering Healthier Communities in LondonDelivering Healthier Communities in London
Design process
Planning application
Implementation, monitoring and review
Preparation of Development Plan
& Sustainability Appraisal
Have a mechanism in place to monitor the health outcomes of policies– see
• Part4:Aspatialplanforhealth
Consider whether appropriate use has been made of measures to promote healthy communities in consideration of the planning application – see
• Part3:Healthandplanning• Part4:Aspatialplanforhealth
Be informed of the links between health and planning during pre-application discussions – see
• Part2:Whyplanforhealth• Part3:Healthandplanning
IntegratehealthintoALL policy and plan preparation to help meet criteria for a sound plan – see
• Part2:Whyplanforhealth• Part4:Aspatialplanforhealth
THE PLANNING PROCESS
PLANNERS SHOULD
6
Delivering Healthier Communities in London
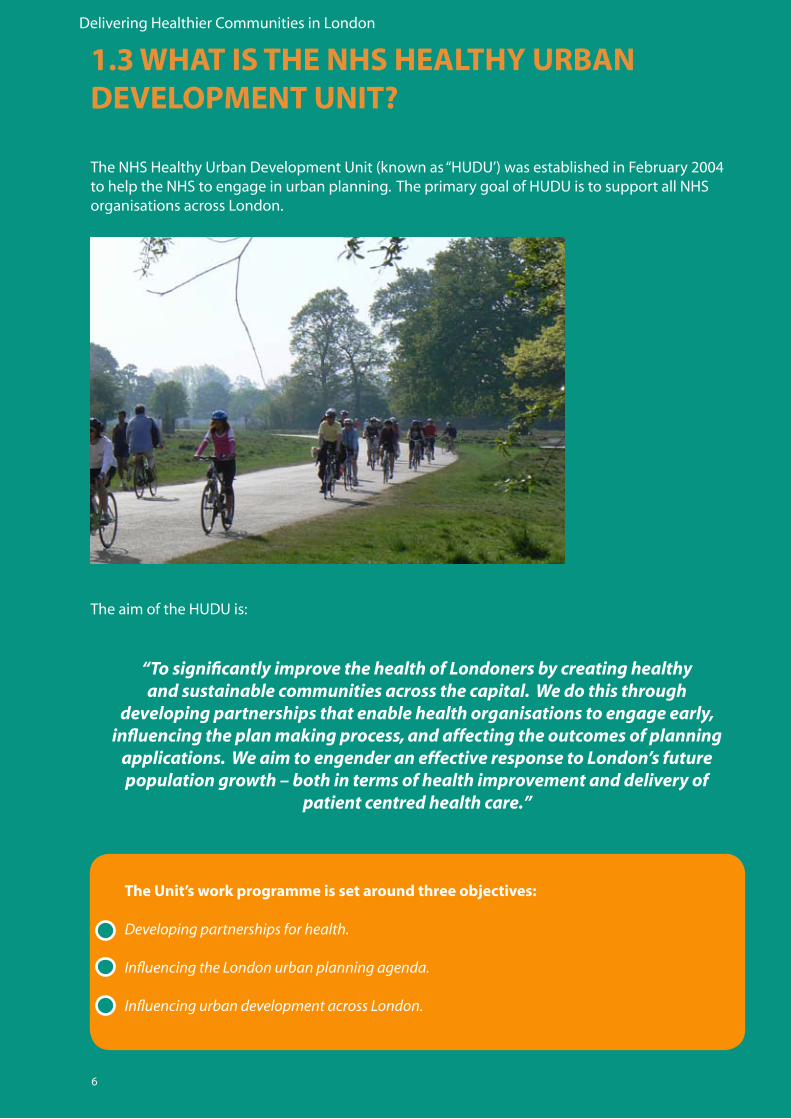
The Unit’s work programme is set around three objectives:
Developing partnerships for health.
Influencing the London urban planning agenda.
Influencing urban development across London.
1.3 WHAT IS THE NHS HEALTHY URBAN DEVELOPMENT UNIT?
TheaimoftheHUDUis:
“To significantly improve the health of Londoners by creating healthy and sustainable communities across the capital. We do this through
developing partnerships that enable health organisations to engage early, influencing the plan making process, and affecting the outcomes of planning
applications. We aim to engender an effective response to London’s future population growth – both in terms of health improvement and delivery of
patient centred health care.”
TheNHSHealthyUrbanDevelopmentUnit(knownas“HUDU’)wasestablishedinFebruary2004tohelptheNHStoengageinurbanplanning.TheprimarygoalofHUDUistosupportallNHSorganisations across London.
7
Delivering Healthier Communities in LondonDelivering Healthier Communities in London
1.4 AIMS AND OBJECTIVES OF THIS GUIDANCE
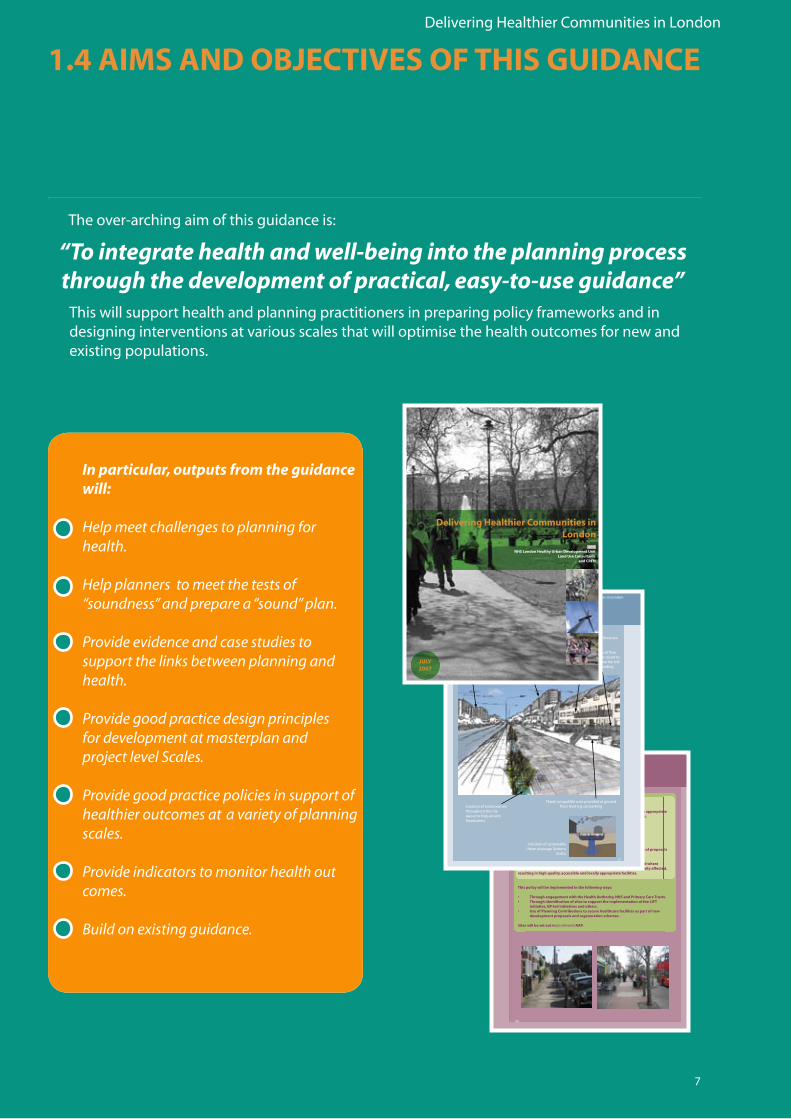
This will support health and planning practitioners in preparing policy frameworks and in designing interventions at various scales that will optimise the health outcomes for new and existing populations.
In particular, outputs from the guidance will:
Help meet challenges to planning for health.
Help planners to meet the tests of “soundness” and prepare a “sound” plan.
Provide evidence and case studies to support the links between planning and health.
Provide good practice design principles for development at masterplan and project level Scales. Provide good practice policies in support of healthier outcomes at a variety of planning scales.
Provide indicators to monitor health out comes.
Build on existing guidance.
“To integrate health and well-being into the planning process through the development of practical, easy-to-use guidance”
Theover-archingaimofthisguidanceis:
8
Delivering Healthier Communities in London
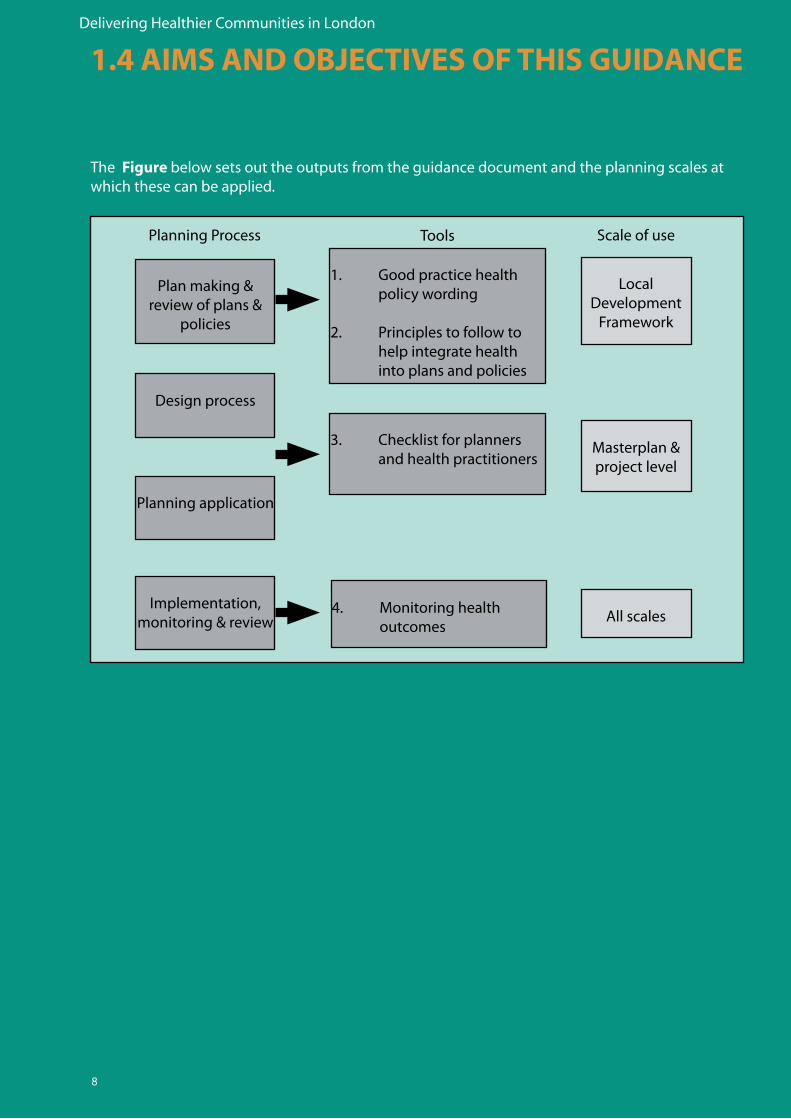
The Figure below sets out the outputs from the guidance document and the planning scales at which these can be applied.
1.4 AIMS AND OBJECTIVES OF THIS GUIDANCE
1. Good practice health policy wording
2. Principles to follow to help integrate health into plans and policies
3. Checklist for planners and health practitioners
4. Monitoring health outcomes
Local Development
Framework
Masterplan & project level
All scales
Plan making & review of plans &
policies
Design process
Planning application
Implementation, monitoring & review
Planning Process Tools Scale of use
9
Delivering Healthier Communities in LondonDelivering Healthier Communities in London
1.5 HEALTH AND HEALTHIER COMMUNITIES
1.5.1 What is Health?
TheWorldHealthOrganisation(WHO)defineshealthas:
“A state of complete physical, mental and social wellbeing and not merely the absence of disease or infirmity” 1
Thisdefinitionrecognisesthathealthcomprisesawiderangeoffactorsandmovesawayfromthetraditional focus on health treatment to one of prevention and cure. This ties in with one of the keyprinciplesofthePublicHealthWhitePaper2 which aims to create an environment which will enable people to make healthier choices.
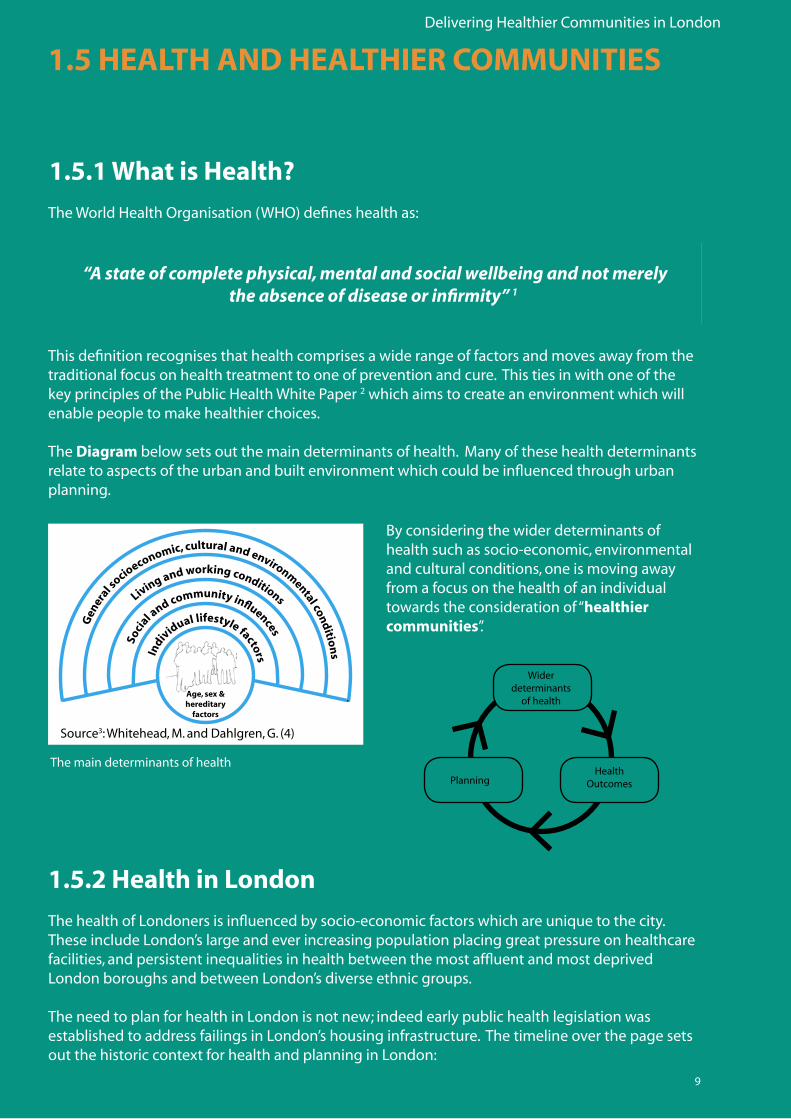
The Diagrambelowsetsoutthemaindeterminantsofhealth.Manyofthesehealthdeterminantsrelate to aspects of the urban and built environment which could be influenced through urban planning.
By considering the wider determinants of health such as socio-economic, environmental and cultural conditions, one is moving away from a focus on the health of an individual towardstheconsiderationof“healthier communities”.
The main determinants of health
Source3:Whitehead,M.andDahlgren,G.(4)
1.5.2 Health in London
The health of Londoners is influenced by socio-economic factors which are unique to the city.These include London’s large and ever increasing population placing great pressure on healthcare facilities, and persistent inequalities in health between the most affluent and most deprived London boroughs and between London’s diverse ethnic groups.
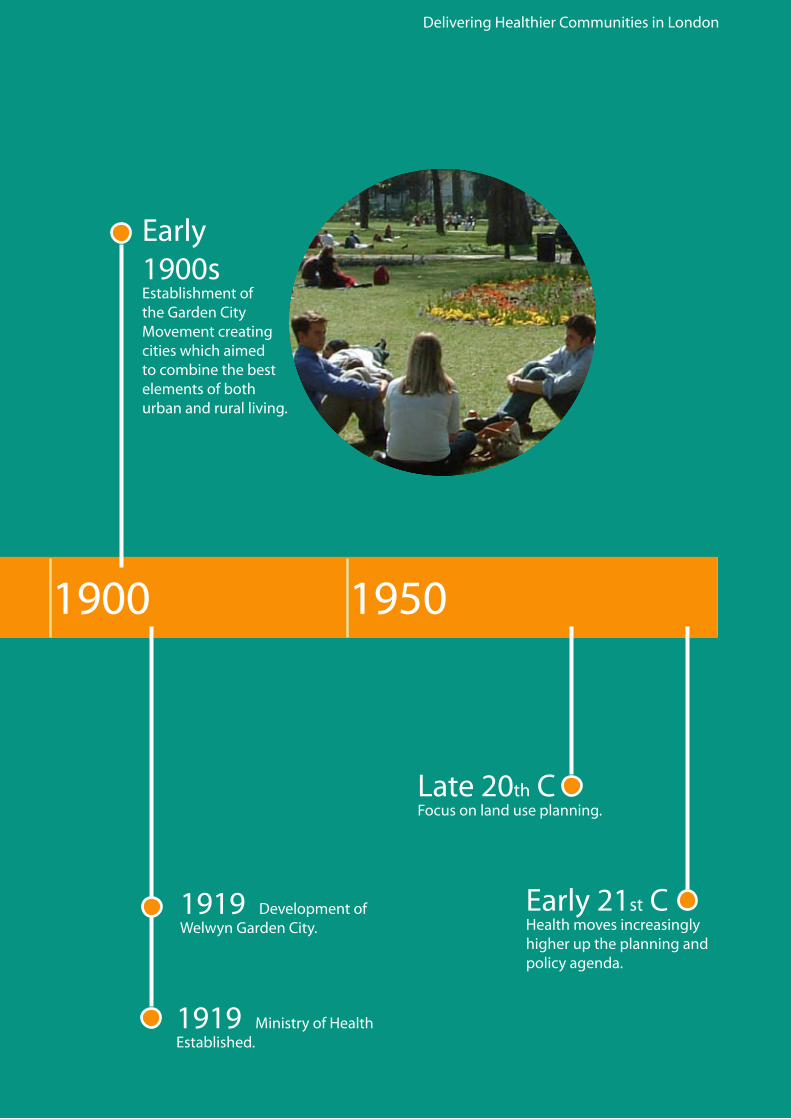
The need to plan for health in London is not new; indeed early public health legislation was established to address failings in London’s housing infrastructure. The timeline over the page sets outthehistoriccontextforhealthandplanninginLondon:
Widerdeterminants
of health
PlanningHealth
Outcomes
10
Delivering Healthier Communities in London
1.5 HEALTH AND HEALTHIER COMMUNITIES
1.5.3 Timeline
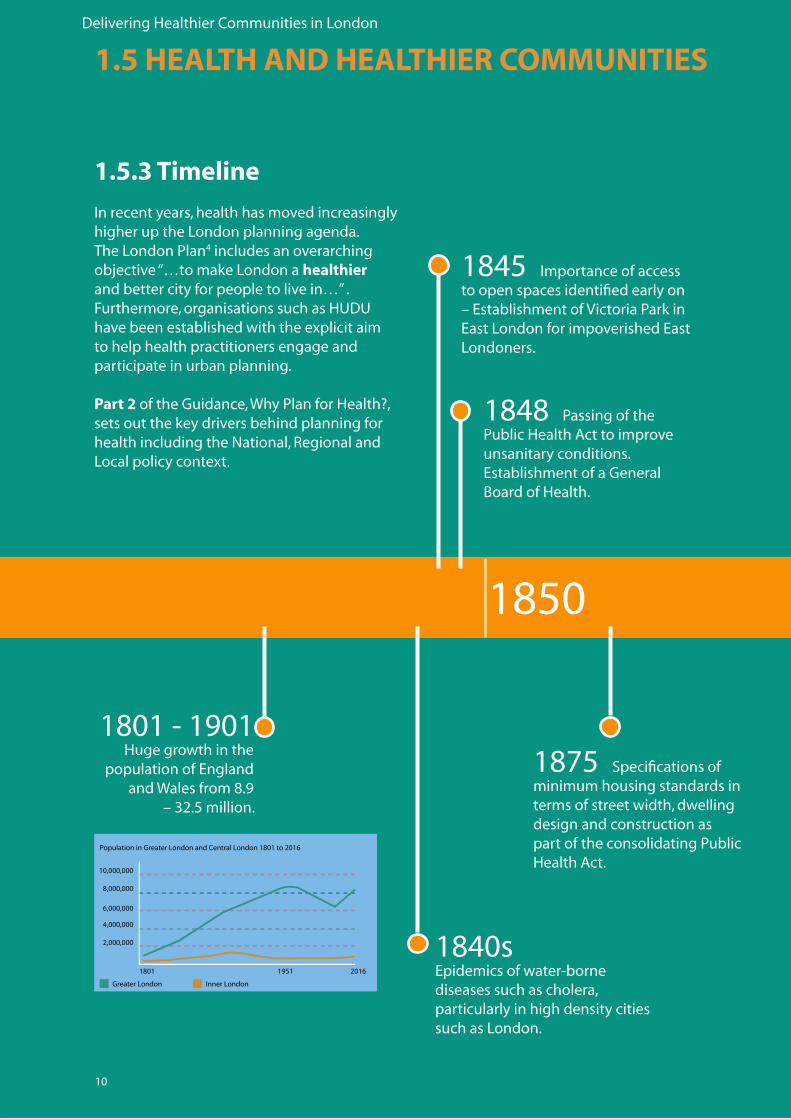
Inrecentyears,healthhasmovedincreasinglyhigher up the London planning agenda. The London Plan4 includes an overarching objective“…tomakeLondonahealthier andbettercityforpeopletolivein…”.Furthermore,organisationssuchasHUDUhave been established with the explicit aim to help health practitioners engage and participate in urban planning.
Part 2oftheGuidance,WhyPlanforHealth?,sets out the key drivers behind planning for healthincludingtheNational,RegionalandLocal policy context.
1850
1801-1901 Huge growth in the
populationofEnglandandWalesfrom8.9
–32.5million.
1840sEpidemicsofwater-bornediseases such as cholera, particularly in high density cities such as London.
1848 Passing of the PublicHealthActtoimproveunsanitary conditions. EstablishmentofaGeneralBoard of Health.
1845Importanceofaccesstoopenspacesidentifiedearlyon–EstablishmentofVictoriaParkinEastLondonforimpoverishedEastLondoners.
1875Specificationsofminimum housing standards in terms of street width, dwelling design and construction as part of the consolidating Public HealthAct.
11
Delivering Healthier Communities in London
1900 1950
Early1900s EstablishmentoftheGardenCityMovementcreatingcities which aimed to combine the best elements of both urban and rural living.
1919 Development of WelwynGardenCity.
1919 MinistryofHealthEstablished.
Late20th CFocusonlanduseplanning.
Early21st CHealth moves increasingly higher up the planning and policy agenda.
12
Delivering Healthier Communities in London
1.5 HEALTH AND HEALTHIER COMMUNITIES
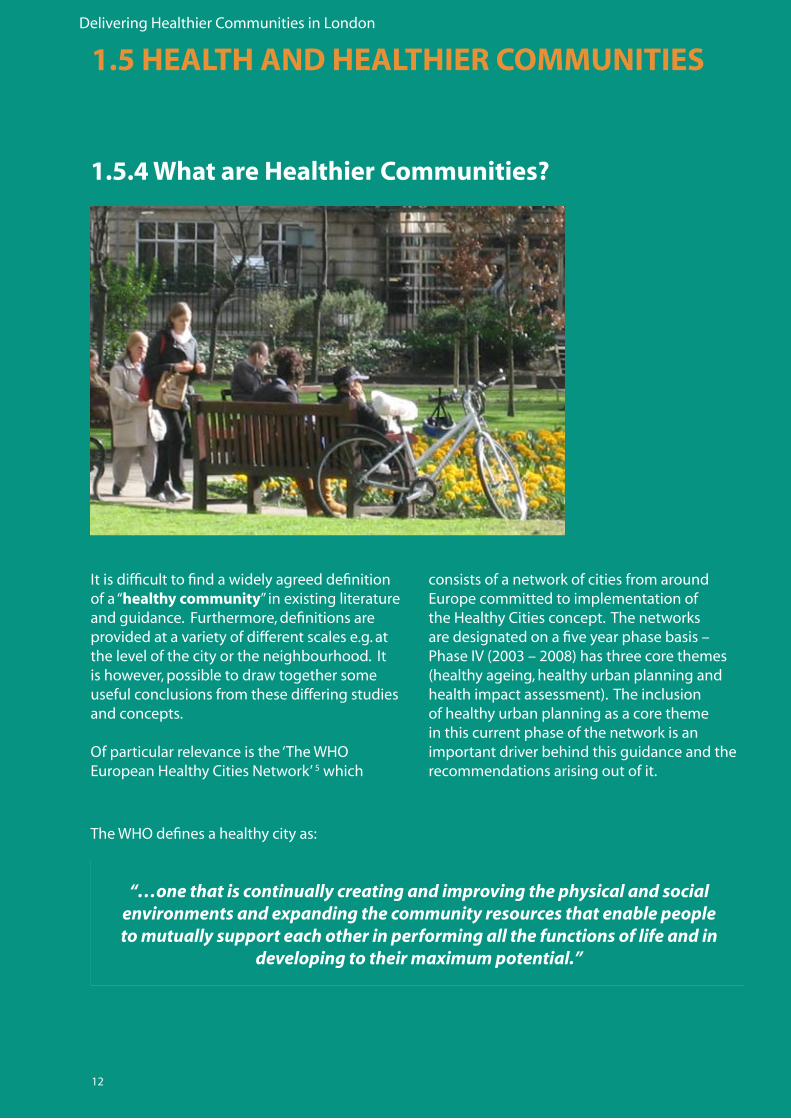
1.5.4 What are Healthier Communities?
Itisdifficulttofindawidelyagreeddefinitionofa“healthy community” in existing literature andguidance.Furthermore,definitionsareprovided at a variety of different scales e.g. at thelevelofthecityortheneighbourhood.Itis however, possible to draw together some useful conclusions from these differing studies and concepts. Ofparticularrelevanceisthe‘TheWHOEuropeanHealthyCitiesNetwork’5 which
TheWHOdefinesahealthycityas:
“…one that is continually creating and improving the physical and social environments and expanding the community resources that enable people to mutually support each other in performing all the functions of life and in
developing to their maximum potential.”
consists of a network of cities from around Europecommittedtoimplementationofthe Healthy Cities concept. The networks aredesignatedonafiveyearphasebasis–PhaseIV(2003–2008)hasthreecorethemes(healthyageing,healthyurbanplanningandhealthimpactassessment).Theinclusionof healthy urban planning as a core theme in this current phase of the network is an important driver behind this guidance and the recommendations arising out of it.

13
Delivering Healthier Communities in LondonDelivering Healthier Communities in London
The WHO expands upon this definition and sets out the key qualities of a healthy city6. These are set out below:
A clean, safe physical environment of high quality.
Stable and sustainable ecosystems.
A strong, mutually supportive, integrated and non-exploitative community.
A high degree of participation and control by inhabitants over decisions affecting their lives, health and wellbeing.
Basic needs of all inhabitants met (in terms of food, water, shelter, income, safety and employment).
Access to a wide variety of experiences and social and cultural resources.
A diverse, vital and innovative urban economy.
Enabling connections with the cultural and biological heritage of the various urban inhabitants.
An urban form that is compatible with enhancement of all the other specified characteristics.
An optimum level of appropriate public health and care services accessible to all
High levels of positive health outcomes and low levels of morbidity.
14
Delivering Healthier Communities in London
1.5 HEALTH AND HEALTHIER COMMUNITIES
1.5.5 The use of a ‘Settlement’ Model to define Healthier Communities
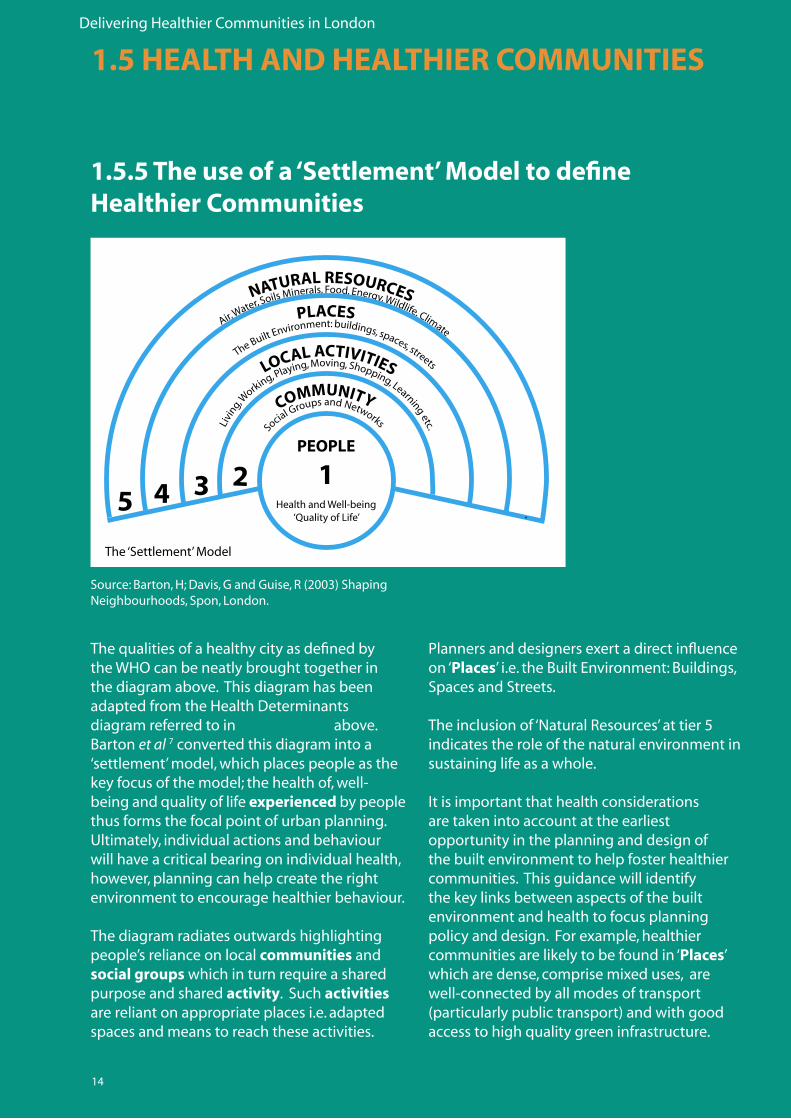
ThequalitiesofahealthycityasdefinedbytheWHOcanbeneatlybroughttogetherinthe diagram above. This diagram has been adapted from the Health Determinants diagram referred to in Section 1.5.1 above. Barton et al 7 converted this diagram into a ‘settlement’ model, which places people as the key focus of the model; the health of, well-being and quality of life experienced by people thus forms the focal point of urban planning. Ultimately, individual actions and behaviour will have a critical bearing on individual health, however, planning can help create the right environment to encourage healthier behaviour.
The diagram radiates outwards highlighting people’s reliance on local communities and social groups which in turn require a shared purpose and shared activity.Suchactivities are reliant on appropriate places i.e. adapted spaces and means to reach these activities.
Planners and designers exert a direct influence on ‘Places’i.e.theBuiltEnvironment:Buildings,SpacesandStreets.
Theinclusionof‘NaturalResources’attier5indicates the role of the natural environment in sustaining life as a whole.
Itisimportantthathealthconsiderationsare taken into account at the earliest opportunity in the planning and design of the built environment to help foster healthier communities. This guidance will identify the key links between aspects of the built environment and health to focus planning policyanddesign.Forexample,healthiercommunities are likely to be found in ‘Places’ which are dense, comprise mixed uses, are well-connected by all modes of transport (particularlypublictransport)andwithgoodaccess to high quality green infrastructure.
Source:Barton,H;Davis,GandGuise,R(2003)ShapingNeighbourhoods,Spon,London.
The‘Settlement’Model

15
Delivering Healthier Communities in LondonDelivering Healthier Communities in London

16
Delivering Healthier Communities in London
17
Delivering Healthier Communities in London
2- WHY PLAN FOR HEALTH ?

Delivering Healthier Communities in London
18
2.1 INTRODUCTION
This section provides a context for the consideration of health in the planning process. First, it sets out the Health Policy Context (e.g. the European policies, plans and programmes driving the health agenda), followed by the National context including Department of Health (DH) ‘White Papers’. The second section provides an outline of the England’s Plan-Led system and the statutory and non-statutory health drivers therein.
Planning for health is important not only from a legislative perspective, but also in relation to costs. Promoting healthy lifestyles, avoiding health impacts and tackling health inequalities throughout the planning process will result in major cost savings to society. By focusing on the prevention of public health issues the need for costly treatments can be avoided. This frees up money which boroughs can re-allocate to other priority areas.
The Wanless Report8 examined future trends and identified factors to inform the long-term financial and resource needs of the NHS to 2022. The review considered three scenarios varying in relation to a number of factors including the extent to which people protected, promoted and managed their own health. The ‘fully engaged’ scenario assumes people are highly engaged in personal health management and focus is on health prevention. The report concluded that there is a health expenditure gap of around £30 billion (by 2022/23) between the best and worst health scenarios. This means that £30 billion could be saved by shifting from a culture of little engagement in personal health to one of individual management and control. This saving relates to half of the current NHS expenditure.
Planning can help create the right circumstances to enable people to engage more in personal health prevention and management.
Positive planning and management of health can also help reduce the burden of health inequalities (pertinent given the Mayor of London’s forthcoming Health Inequalities Strategy) and improve economic productivity. The Confederation of British Industry (CBI)9 estimated that workplace absence cost British business nearly £11 billion in 2000.
Delivering Healthier Communities in London
19
The role of HIA is becoming increasingly important as a decision-making tool in the UK at policy, plan, programme and project level although it remains non-statutory. The DH recently published Draft Guidance on SEA and Health. This will help practitioners integrate health considerations within statutory assessment processes.
For more information on how to consider health in SEA, see Draft Guidance on Health in Strategic Environmental Assessment: Consultation Document (Department of Health, 2007)11.
2.2 HEALTH POLICY
2.2.1 European Context
One of the outcomes of the Finnish Presidency of the European Union (May to December 2006) was the publication of the document Health in All Policies10 and its subsequent adoption and promotion by the EU. This considered the role of Health Impact Assessment (HIA) in policy formulation.
What is Health Impact Assessment?
A combination of procedures, methods and tools that systematically judges the potential and sometimes unintended, effects of a policy, plan, programme or project on the health of a population and the distribution of those effects within the population. HIA identifies appropriate actions to manage those effects.
Adapted from the Gothenberg Consensus Paper (1999) by the International Association of Impact Assessment.
The Health Issues in Planning: Best Practice Guidance (June 2007)12 provides a section on HIA in London. This includes details of where HIA has been used in practice, and further sources of information for those intending to use HIA.
Part 4 of this document provides an example of how HIA may be integrated into health policy.

Delivering Healthier Communities in London
20
CHOOSING HEALTHMaking healthy choices easier
Working in partnership across government with people, theircommunities, local government, voluntary agencies and businessWorking in partnership across government with people, theircommunities, local government, voluntary agencies and business
2.2.2 National Health Policy
Health Policy in England is set by the Department of Health (DH) with an aim to “..improve the health and well-being of the people of England..” This includes setting national standards, shaping the direction of the National Health Service (NHS) and social care services, and promoting healthier living.
The NHS was established in 1948 with a founding principle to “…improve health and prevent disease, not just provide treatment for those who are ill..”.
This principle has formed one of the core focuses of recent DH White Papers in addition to tackling inequalities and empowering communities to make better health choices. Key DH White Papers are listed below:
• SavingLives:OurHealthierNation-Actionplan(July1999).13
• TacklingHealthInequalities:aprogrammeforaction(2003).14
• Securinggoodhealthforthewholepopulation-ReporttotheTreasury(Wanless,2004).15
• ChoosingHealth:makinghealthierchoiceseasier(November2004).16
• OurHealth,ourcare,oursay–WhitePaper(2006).17
Health and social care working together in partnership
Our health, our care, our say:
a new direction for community services
Published by TSO (The Stationery Office) and available from:
Onlinewww.tso.co.uk/bookshop
Mail,Telephone, Fax & E-mailTSOPO Box 29, Norwich NR3 1GNTelephone orders/General enquiries 0870 600 5522Fax orders 0870 600 5533Order through the Parliamentary Hotline Lo-call 0845 7 023474E-mail [email protected] 0870 240 3701
TSO Shops123 Kingsway, London WC2B 6PQ020 7242 6393 Fax 020 7242 639468-69 Bull Street, Birmingham B4 6AD0121 236 9696 Fax 0121 236 96999-21 Princess Street, Manchester M60 8AS0161 834 7201 Fax 0161 833 063416 Arthur Street, Belfast BT1 4GD028 9023 8451 Fax 028 9023 540118-19 High Street, Cardiff CF10 1PT029 2039 5548 Fax 029 2038 434771 Lothian Road, Edinburgh EH3 9AZ0870 606 5566 Fax 0870 606 5588
The Parliamentary Bookshop12 Bridge Street, Parliament Square,London SW1A 2JXTelephone orders/General enquiries 020 7219 3890Fax orders 020 7219 3866
TSO Accredited Agents(see Yellow Pages)
and through good booksellers
Our health, our care, our say: a new
direction for comm
unity services
80771-COI-WP-coverN.qxp 28/1/06 21:10 Page 1
2.2 HEALTH POLICY

Delivering Healthier Communities in London
21
To help meet the White Paper commitments, the Office of the Deputy Prime Minister (ODPM) established Local Area Agreements (LAA) in 2005 with a primary objective to deliver genuinely sustainable communities through better outcomes for local people. LAAs can help promote healthier communities and narrow health inequalities by providing a framework to support and maintain different initiatives and services (such as health, education and housing).
A Local Area Agreement18 is a three year agreement, based on local Sustainable Community Strategies, that sets out the priorities for a local area agreed between Central Government, represented by the Government Office (GO) and a local area, represented by the local authority and other key partners through Local Strategic Partnerships (LSPs).
They are structured around 4 blocks (or policy fields): Children and Young People, Safer and Stronger Communities, Healthier Communities and Older People and Economic Development and Enterprise.
The DH is also committed to a number of Public Service Agreements (PSAs)19 to help meet policy proposals. These cover the period 2005 – 2008 and are outlined below:
Objective I: Improve the health of the population. By 2010 increase life expectancy at birth in England to 78.6 years for men and 82.5 years for women.
1. Substantially reduce mortality rates by 2010 (with particular reference to deaths from heart disease and stroke and related diseases, from cancer and from suicide and undetermined injury).
2. Reduce health inequalities by 10% by 2010 as measured by infant mortality and life expectancy at birth.
3. Tackle the underlying determinants of ill health and health inequalities (with particular reference to adult smoking rates, childhood obesity and improving sexual health).
Objective II: Improve health outcomes for people with long-term conditions.
Objective III: Improve access to services.
Objective IV: Improve the patient and user experience.

Delivering Healthier Communities in London
22
2.2.3 Health in London
Regional Public Health Groups are part of the Department of Health and are co-located in each of England’s nine Government Offices. They work alongside public health colleagues in NHS, local authorities and other agencies to improve and protect their local population. This involves addressing all determinants of health such as diet, housing, the economy, transport and mental health and factors that create health inequalities within their region.
The NHS in England is split into 10 Strategic Health Authorities (SHA), including NHS London. NHS London is responsible for ensuring that the capital’s health services deliver world-class care by:
• DevelopingandimplementingastrategyforhealthandhealthcareinLondon.
• Holdinglocalorganisations(seebelow)toaccountforthequalityofcarewhichthey provide.
• Ensuringcapacitythroughthedevelopmentoftheworkforce,technologyandbuildings.
NHS London manages the performance of 31 primary care trusts, 25 acute trusts, 9 mental health trusts and the London Ambulance Service. The 10 Foundation Trusts in London have greater freedom to manage their own affairs and improve services.
There are 31 PCTs in London, generally aligned to each of the London Boroughs. The three main functions of a Primary Care Trust are:
• Engagingwithitslocalpopulationtoimprovehealthandwell-being.
• Commissioningacomprehensiveandequitablerangeofhighquality,responsiveand efficient services, within allocated resources, across all service sectors.
• Directlyprovidinghighqualityresponsiveandefficientserviceswherethisgivesbest-value.
2.2 HEALTH POLICY
Delivering Healthier Communities in London
23
2.3 HEALTH CONSIDERATIONS IN NATIONAL PLANNING POLICY AND GUIDANCE
Sustainable development is the core principle underpinning planning20. The Government sets out five guiding principles for sustainable development in Securing the Future: DeliveringUKSustainableDevelopmentStrategy21. One of the five principles is to ensure a strong, healthy and just society, which aims to meet the diverse needs of all people in existing and future communities, promoting personal wellbeing, social cohesion and inclusion, and creating equal opportunity for all.
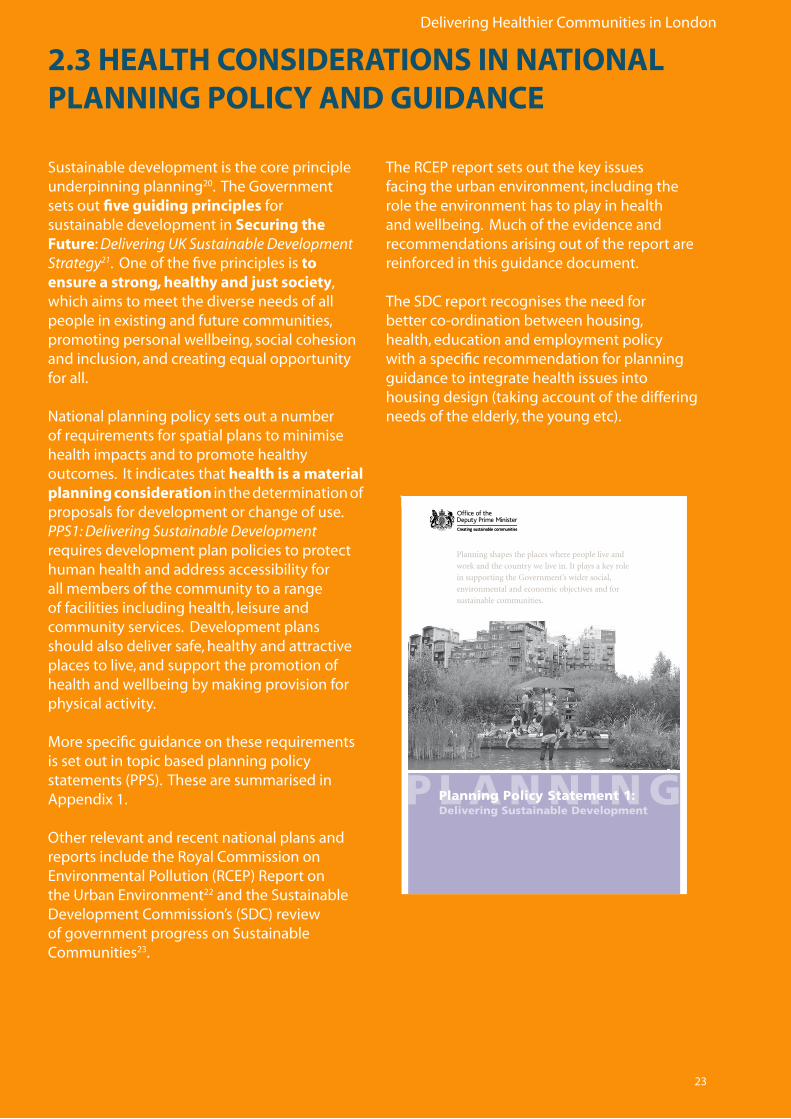
National planning policy sets out a number of requirements for spatial plans to minimise health impacts and to promote healthy outcomes. It indicates that health is a material planning consideration in the determination of proposals for development or change of use. PPS1:DeliveringSustainableDevelopmentrequires development plan policies to protect human health and address accessibility for all members of the community to a range of facilities including health, leisure and community services. Development plans should also deliver safe, healthy and attractive places to live, and support the promotion of health and wellbeing by making provision for physical activity.
More specific guidance on these requirements is set out in topic based planning policy statements (PPS). These are summarised in Appendix 1.
Other relevant and recent national plans and reports include the Royal Commission on Environmental Pollution (RCEP) Report on the Urban Environment22 and the Sustainable Development Commission’s (SDC) review of government progress on Sustainable Communities23.
P L A N N I N G
Planning shapes the places where people live and
work and the country we live in. It plays a key role
in supporting the Government’s wider social,
environmental and economic objectives and for
sustainable communities.
Planning Policy Statement 1:Delivering Sustainable Development
The RCEP report sets out the key issues facing the urban environment, including the role the environment has to play in health and wellbeing. Much of the evidence and recommendations arising out of the report are reinforced in this guidance document.
The SDC report recognises the need for better co-ordination between housing, health, education and employment policy with a specific recommendation for planning guidance to integrate health issues into housing design (taking account of the differing needs of the elderly, the young etc).
Delivering Healthier Communities in London
24
2.4 HEALTH CONSIDERATIONS IN REGIONAL PLANNING POLICY: THE LONDON PLAN
In London, the Mayor has a statutory duty to promote the health of Londoners. In exercising its general powers, the Greater London Authority (GLA) Act 1999 requires the GLA to promote improvements to the health of people in Greater London, in addition to contributing towards the achievement of sustainable development in the UK (para. 30 (5)). In preparing or revising the Mayor’s Strategies24, the GLA Act requires the Mayor to have regard to the effect which the proposed strategy would have on the health of people in Greater London (para. 41 (4b)).
Health features throughout the London Plan and its Draft Further Alterations, from reference to health considerations in the Mayor’s objectives to specific policies seeking to promote healthy outcomes and avoid negative health impacts. The London Plan seeks to protect and enhance existing healthcare and other community facilities and support the provision of additional healthcare in boroughs. It also includes specific policies to:
• Promotepublichealth.
• Ensuredevelopmentshaveregardto health impacts.
• ImproveLondon’sopenenvironment.
• Tacklehealthinequalities.
• Ensurehealthistakenintoaccountin the preparation of Community Strategies. Health is considered more directly and comprehensively in the Draft Further Alterations to the London Plan. For example, the second Mayor’s objective has been revised to ‘make London a healthier and better city for people to live in’.
There are a number of Supplementary Planning Guidance (SPG) and Best Practice
Guidance (BPG) documents which sit alongside the London Plan and provide additional information on how to integrate health benefits into development and regeneration projects. These include SustainableDesignand Construction (May 2006)25 and Accessible London: Achieving an Inclusive Environment (April 2004)26 SPGs and HealthIssuesinPlanning:BestPracticeGuidance(June2007).27
The requirements and guidance for health considerations as set out in the London Plan, its Draft Further Alterations and accompanying documents are provided in Appendix 2 . This summarises the direct and indirect links between development or regeneration and either promoting healthy outcomes or avoiding health impacts. The HUDU Watch Out for Health Checklist28 and the Health Issues in Planning: Best Practice Guidance also detail London Plan policies which have indirect links to health.
It is recognised that mechanisms exist for sub-regional or transboundary planning within London. For example, East London boroughs from the East London Waste Disposal Authority are working jointly to produce a Waste Development Plan Document.
This document could be equally applied to planning at this level.
Delivering Healthier Communities in London
25
Planning decisions on proposals for development or change of use are determined using a plan-led system, as illustrated in the Figure over the page. The context for this system is provided by national planning policy set out in PPSs and PPGs29. National planning policy informs the statutory Development Plan, which is the starting point in the consideration of planning applications for the development or use of land. The Development Plan therefore provides the essential framework for determining planning decisions..
In London, the statutory Development Plan consists of:
• TheSpatialDevelopmentStrategypreparedbytheMayorofLondon,whichiscalled the London Plan; and
• UnitaryDevelopmentPlansor,underthePlanningandCompulsoryPurchaseAct 2004, Development Plan Documents (DPDs) for the local planning authority (LPA) in which the planning decision is made. DPDs are one of a number of documents that make up Local Development Frameworks (LDFs).
2.5 HEALTH PLANNING TO MEET THE TESTS OF SOUNDNESS

Delivering Healthier Communities in London
26
The Plans and Policies areSubject to SEA/SA (third test of soundness)
The Plans and Policies areSubject to SEA/SA (third test of soundness)
Planning Policy Statements (PPSs) and Planning Policy Guidance notes (PPGs)
Spatial Development Strategy for London, the London Plan ( or outside London,
Regional Spatial Strategies)
Unitary Development Plans or Local Development frameworks
Proposal for development or change of use
Large projects are subject to EIA or HIA
Statutory requirement for DPDs to
be consistent with national
and in general conformity
with regional policy (fourth
test of soundness)
Evidence base
(seventh test of
soundness)Development Plan, against which planning applications are determined
Project
Local
Regional
National
The Plan-led system Note: tests to assess the soundness of a Plan are in dark blue
2.5 HEALTH PLANNING TO MEET THE TESTS OF SOUNDNESS

Delivering Healthier Communities in London
27
The Planning and Compulsory Purchase Act 2004 requires policies in Local Development Documents to be sound and sets out nine tests which should be used to assess the soundness of the Plan. These tests are summarised in the box below and their links to the plan-led system are shown above.
TESTS OF SOUNDNESS
A DPD will be sound if it meets the following tests:Procedural
i. it has been prepared in accordance with the local development scheme;ii. it has been prepared in compliance with the statement of community involvement, or with the minimum requirements set out in the Regulations where no statement of community involvement exists;iii. the plan and its policies have been subjected to sustainability appraisal;
Conformity
iv. it is a spatial plan which is consistent with national planning policy and in general conformity with the London Plan and it has properly had regard to any other relevant plans, policies and strategies relating to the area or to adjoining areas;v. it has had regard to the authority’s community strategy;
Coherence, consistency and effectiveness
vi. the strategies/policies/allocations in the plan are coherent and consistent within and between development plan documents prepared by the authority and by neighbouring authorities, where cross boundary issues are relevant;vii. the strategies/policies/allocations represent the most appropriate in all the circumstances, having considered the relevant alternatives, and they are founded on a robust and credible evidence base;viii. there are clear mechanisms for implementation and monitoring; andix. the plan is reasonably flexible to enable it to deal with changing circumstances.
Adapted from tests of soundness set out in PPS 12: Local Development Frameworks (ODPM, 2004).30
Delivering Healthier Communities in London
28
The tests of soundness can be linked to health both in terms of the consideration of health impacts and the promotion of healthier outcomes, (evidently health is just one of the aspects which planners should take account of when aiming to prepare a sound plan).
The links between health and the tests of soundness include:
• Thethird test of soundness which requires the Plan and its policies to be subject to Strategic Environmental Assessment (SEA) and Sustainability Appraisal (SA). The SEA Directive requires authorities to assess the likely significant effects on ‘the environment, including on issues such as…human health’. Government guidance on SA suggests that maintaining and enhancing human health should be an objective against which the Plan and its policies are appraised.
For more information on how to consider health in SEA, see Draft Guidance on Health in StrategicEnvironmentalAssessment:Consultation Document (Department of Health, 2007).31
• Thefourth test of soundness which requires the Plan to be consistent with national planning policy and in general conformity with the London Plan. This policy framework requires DPDs to provide access to health facilities, deliver healthier communities and support the promotion of health through provision for physical activity. Policies at the local level are therefore expected to have a wide scope encompassing these factors, providing a statutory requirement for development and regeneration projects to reflect such requirements.
• The fifth test of soundness which requires the Plan to have had regard to the Community Strategy. Boroughs should take note of the high-level vision set in the Community Strategy and the health issues identified.
• Theseventh test of soundness which requires that the strategies, policies and allocations in Development Plan Documents are appropriate, having considered the relevant alternatives, and are based on a robust and credible evidence base. This guidance document includes good practice text for health policies and provides evidence (and sources of evidence) to support health and health-related policies. The evidence is necessarily of a general nature, but it provides strong pointers as to what evidence needs to be assembled at the local level.
• Theeighth test of soundness which requires the plan to have clear mechanisms in place for implementation and monitoring. The need to monitor policy outcomes is critical to ensure that targets and objectives can be met. Boroughs must have this in mind during policy formulation.

Delivering Healthier Communities in London
29

Delivering Healthier Communities in London
30
31
Delivering Healthier Communities in London
3 - HEALTH AND PLANNING

Delivering Healthier Communities in London
32
3.1 INTRODUCTION
This section provides evidence linking public health issues to factors which may be influenced by spatial planning. Five public health issues have been chosen and the chapter is structured around each of these. The chosen public health issues are:
• Mentalhealth.• Obesityandcardio-vasculardisease.• Respiratorydisease.• Excesswinter(cold)andsummer(heat)mortality.• Injuries.
These public health issues have been chosen based on the significance of the public health impact andonthebasisofaninitialscopingexercisetoidentifypotentiallinksbetweenhealthandplanning.Thereare,ofcourse,othermajorpublichealthissues(e.g.cancer),butonlythosewhererisk factors may be modified by spatial planning are addressed. The detailed evidence reviews are provided in Appendices 3.2-3.6.
Where strong links between the public health issue and spatial planning factors are identified withintheevidencebase,casestudiesareprovidedwhichaimtoexplorethedifferentmeansbywhich planning can have an effect. These “interventions” may include the application of national policy or specific changes in the physical or built environment. The case studies which have been includedprovideexamplesofwherehealthisanindirectoutcomeofpolicyordesign.Findingcase studies where health was planned to be a direct outcome has been difficult in practice.
Win/Wins and Conflicts/Constraints are identified for each case study.
Win/Wins
Win/wins are achieved where an intervention may deliver multiple benefits e.g. for more than one public health issue and/or wider benefits e.g. for economic development or sustainability.
Conflicts/Constraints
Conflicts/Constraints may arise when interventions have negative impacts e.g. an intervention may address one public health issue but impact directly or indirectly onanother.Otherimpactse.g.costinvolvedortimetoimplementarealsoidentified.
Following on from the evidence base and case studies, a suite of recommendations are provided for each public health issue. These recommendations can be applied at a number of different spatialplanningscalese.g.attheLDFlevelorprojectlevel(duringthedesignofsitelayoutsorbuildings)andguidethedevelopmentoftheplanningtoolsprovidedinPart 4: A Spatial Plan for Health.
Delivering Healthier Communities in London
33
3.2 MENTAL HEALTH
3.2.1 Evidence Base
Depressionandanxietyareimportantpublichealthproblemsoccurringin15-30%oftheUKpopulationandaccountingforapproximately20%ofGPconsultationsintheUK.
Takingaccountofindividualcharacteristics(e.g.age,socioeconomicstatus),thereisstillsubstantialvariationinratesofCommonMentalDisorders(CMD)betweenhouseholds.Thisvariationcanberelatedtofactorsoperatingatalevelbetweenwardandhousehold(a‘neighbourhood’effect).This‘neighbourhood’effectisbeingincreasinglyresearchedbutiscurrently not well understood.
The factors which appear to be most strongly associated with the lowest ratings for mental health are:
• Densityandescapei.e.feelingdissatisfiedwithavailablegreenspace,and/or social facilities or feeling overcrowded.
• Design,forexample; a)notlikingthelookoftheestateorroadetcor b)highriseanddeckaccessdwellingswhichareariskinparticulartomotherswith young children.
• Physicalincivilities,forexample a)vandalismtoproperty b)lowexternalbeautification c)poorpropertymaintenance
• Housingqualitye.g.damp.
• Fearofcrimei.e.feelingunsafetogoout.
• Neighbournoise,althoughanindividual’straitanxietymayitselfaffectnoisesensitivity.
Spatial planning can markedly affect the following risk factors:• Neighbourhood Quality • Housing Design and Density• Housing Quality • Fear of crime
Residentswhosehomeshavebeenfloodedexperiencepsychologicaldistressforconsiderableperiods of time after the flood event.
Spatial planning can minimise the risks of flooding through design and careful location of vulnerable land-uses.
See
Ap
pen
dix
3.2
for m
ore
info
rmat
ion
on
th
e ev
iden
ce b
ase
un
der
pin
nin
g t
he
links
bet
wee
n m
enta
l hea
lth
an
d s
pat
ial p
lan
nin
g.
Delivering Healthier Communities in London
34
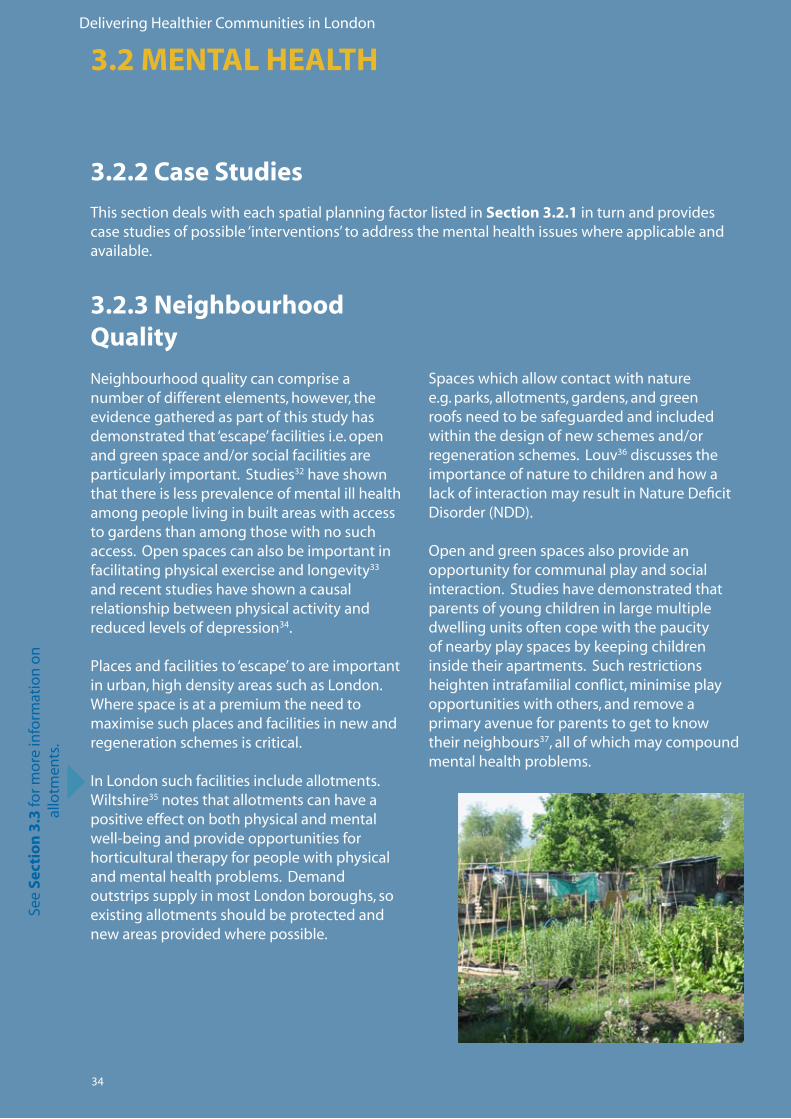
Spaces which allow contact with nature e.g. parks, allotments, gardens, and green roofs need to be safeguarded and included within the design of new schemes and/or regeneration schemes. Louv36 discusses the importance of nature to children and how a lackofinteractionmayresultinNatureDeficitDisorder(NDD).
Openandgreenspacesalsoprovideanopportunity for communal play and social interaction. Studies have demonstrated that parents of young children in large multiple dwelling units often cope with the paucity of nearby play spaces by keeping children inside their apartments. Such restrictions heighten intrafamilial conflict, minimise play opportunities with others, and remove a primary avenue for parents to get to know their neighbours37, all of which may compound mental health problems.
3.2.2 Case Studies
This section deals with each spatial planning factor listed in Section 3.2.1 in turn and provides case studies of possible ‘interventions’ to address the mental health issues where applicable and available.
3.2 MENTAL HEALTH
3.2.3 Neighbourhood Quality
Neighbourhoodqualitycancompriseanumber of different elements, however, the evidence gathered as part of this study has demonstrated that ‘escape’ facilities i.e. open and green space and/or social facilities are particularly important. Studies32 have shown that there is less prevalence of mental ill health among people living in built areas with access to gardens than among those with no such access.Openspacescanalsobeimportantinfacilitatingphysicalexerciseandlongevity33 and recent studies have shown a causal relationship between physical activity and reduced levels of depression34.
Placesandfacilitiesto‘escape’toareimportantin urban, high density areas such as London. Where space is at a premium the need to maximisesuchplacesandfacilitiesinnewandregeneration schemes is critical.
InLondonsuchfacilitiesincludeallotments.Wiltshire35 notes that allotments can have a positive effect on both physical and mental well-beingandprovideopportunitiesforhorticultural therapy for people with physical and mental health problems. Demand outstrips supply in most London boroughs, so existingallotmentsshouldbeprotectedandnew areas provided where possible.
See
Sect
ion
3.3
for m
ore
info
rmat
ion
on
al
lotm
ents
.

Delivering Healthier Communities in London
35
Case study 1: Beddington Zero Energy Development (BedZED), London
Win/Wins
• Provisionofcommunityandsocialfacilitiesinnewandregenerationschemesprovide ‘escape facilities’ and opportunity for community interaction.
• Facilitiessuchasallotmentsalsoprovideopportunitiesforphysicalactivityandaccess to healthy food both with positive health outcomes. Conflicts/Constraints
• Provisionoffacilitieswillnotnecessarymeanresidentsusethem.Section3.3Obesity andCardiovascularDiseasediscussestheimportanceofthequalityofspaceandthe development of initiatives to encourage their use.
• Newdevelopmentsand/orregenerationschemesneedtoconsiderthewider neighbourhood i.e. outwith the immediate regeneration area as any health benefits will dependonthiswidercontext.
Themajorityofresidentsliketheirimmediateneighbourhoodi.e.atBedZED,butdislikedthewiderHackbridgearea.Reasonscitedincludedanti-socialbehaviour,graffitiandvandalism.
BedZEDwasdevelopedbythePeabodyTrust,in partnership with Bioregional Development GroupanddesignedbyBillDunsterArchitects.
TheBedZEDdevelopmentinSouthLondonincluded a number of features aimed at enhancing the immediate neighbourhood suchasfirststoreygardens,anon-siteplaying field, community centre, nursery and allotments. Walkways link up the terraced houses providing opportunities for neighbours to interact.
AninitialQualityofLifeSurvey(conductedbetweenJanuarytoMarch2007)providedpositive results of residents use of community facilities.Ofthe23householdsquestioned(23%ofhouseholdsatBedZED),themajority(74%)usethecommunitycentre.Otherfacilities(e.g.allotments,nursery,sportsfieldandvillagesquare)areusedbyapproximately25%ofrespondents.Itisnotablethat87%ofrespondents consider community facilities to be better than where they previously lived.
Thecasestudybelowprovidesanexampleofwhereneighbourhoodandcommunityfeatureswere included as part of scheme design.
See
Sect
ion
3.3
Ob
esit
yan
d
Car
dio
vasc
ula
r Dis
ease
Source:BioRegional
Delivering Healthier Communities in London
36
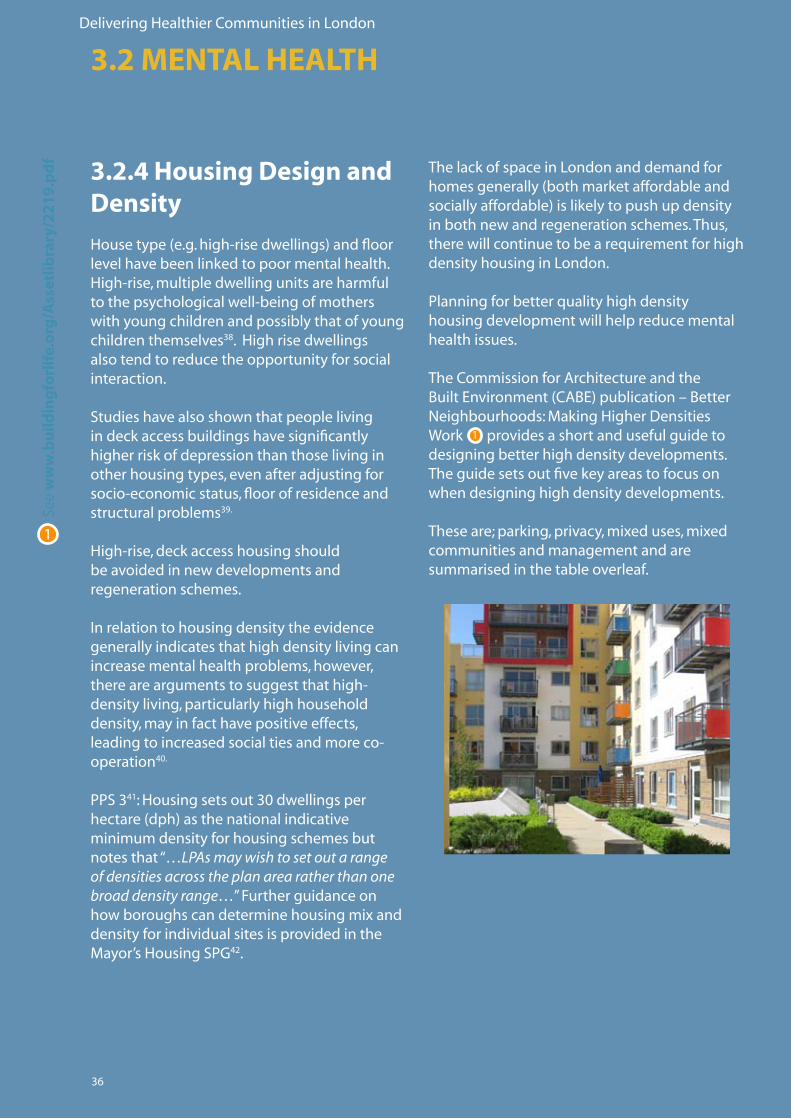
3.2.4 Housing Design and Density
Housetype(e.g.high-risedwellings)andfloorlevel have been linked to poor mental health. High-rise,multipledwellingunitsareharmfultothepsychologicalwell-beingofmotherswith young children and possibly that of young children themselves38. High rise dwellings also tend to reduce the opportunity for social interaction.
Studies have also shown that people living in deck access buildings have significantly higher risk of depression than those living in otherhousingtypes,evenafteradjustingforsocio-economicstatus,floorofresidenceandstructural problems39.
High-rise,deckaccesshousingshouldbe avoided in new developments and regeneration schemes.
Inrelationtohousingdensitytheevidencegenerally indicates that high density living can increase mental health problems, however, thereareargumentstosuggestthathigh-density living, particularly high household density, may in fact have positive effects, leadingtoincreasedsocialtiesandmoreco-operation40.
PPS341:Housingsetsout30dwellingsperhectare(dph)asthenationalindicativeminimum density for housing schemes but notes that “…LPAs may wish to set out a range of densities across the plan area rather than one broad density range…” Further guidance on howboroughscandeterminehousingmixanddensity for individual sites is provided in the Mayor’sHousingSPG42.
The lack of space in London and demand for homesgenerally(bothmarketaffordableandsociallyaffordable)islikelytopushupdensityin both new and regeneration schemes. Thus, therewillcontinuetobearequirementforhighdensity housing in London.
Planningforbetterqualityhighdensityhousing development will help reduce mental health issues.
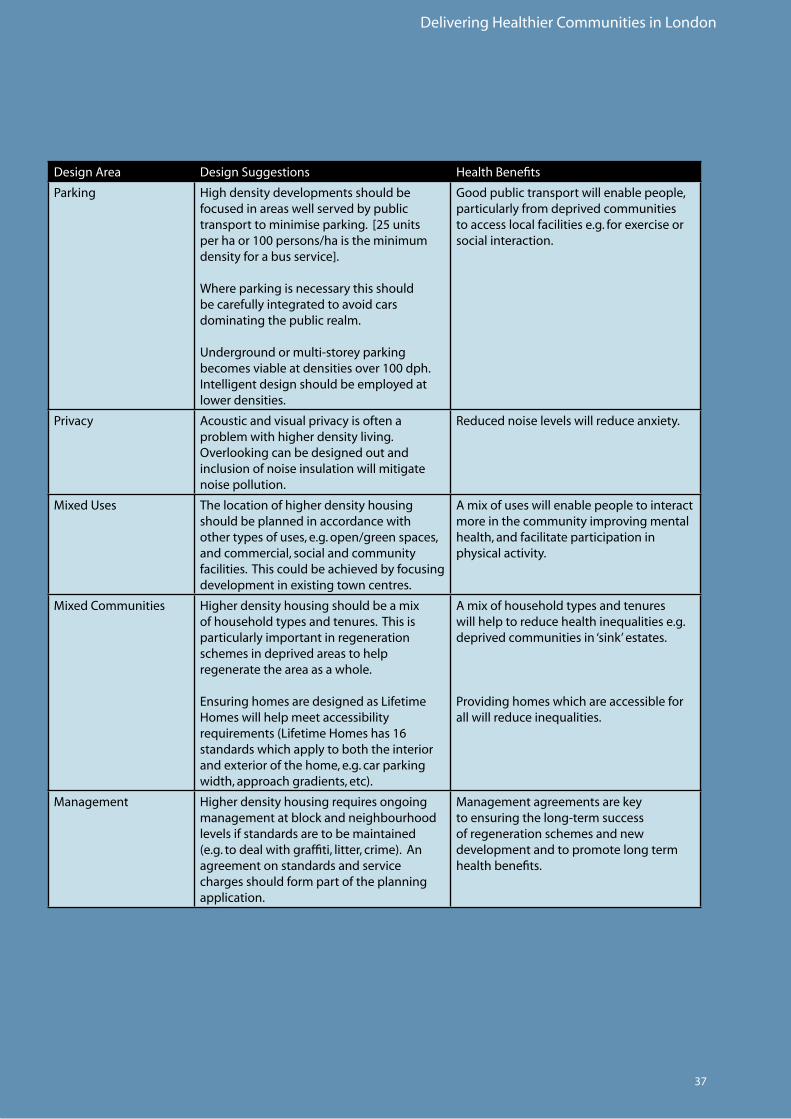
TheCommissionforArchitectureandtheBuiltEnvironment(CABE)publication–BetterNeighbourhoods:MakingHigherDensitiesWork provides a short and useful guide to designing better high density developments. The guide sets out five key areas to focus on when designing high density developments.
Theseare;parking,privacy,mixeduses,mixedcommunities and management and are summarised in the table overleaf.
1
1
See
ww
w.b
uild
ing
forl
ife.
org
/Ass
etlib
rary
/22
19
.pd
f3.2 MENTAL HEALTH
Delivering Healthier Communities in London
37
DesignArea Design Suggestions Health Benefits
Parking High density developments should be focused in areas well served by public transporttominimiseparking.[25unitsperhaor100persons/haistheminimumdensity for a bus service].
Where parking is necessary this should be carefully integrated to avoid cars dominating the public realm.
Undergroundormulti-storeyparkingbecomesviableatdensitiesover100dph.Intelligentdesignshouldbeemployedatlower densities.
Goodpublictransportwillenablepeople,particularly from deprived communities toaccesslocalfacilitiese.g.forexerciseorsocial interaction.
Privacy Acousticandvisualprivacyisoftenaproblem with higher density living. Overlookingcanbedesignedoutandinclusion of noise insulation will mitigate noise pollution.
Reducednoiselevelswillreduceanxiety.
MixedUses The location of higher density housing should be planned in accordance with other types of uses, e.g. open/green spaces, and commercial, social and community facilities. This could be achieved by focusing developmentinexistingtowncentres.
Amixofuseswillenablepeopletointeractmore in the community improving mental health, and facilitate participation in physical activity.
MixedCommunities Higherdensityhousingshouldbeamixof household types and tenures. This is particularly important in regeneration schemes in deprived areas to help regenerate the area as a whole.
EnsuringhomesaredesignedasLifetimeHomes will help meet accessibility requirements(LifetimeHomeshas16standards which apply to both the interior andexteriorofthehome,e.g.carparkingwidth,approachgradients,etc).
Amixofhouseholdtypesandtenureswillhelptoreducehealthinequalitiese.g.deprived communities in ‘sink’ estates.
Providinghomeswhichareaccessibleforallwillreduceinequalities.
Management Higherdensityhousingrequiresongoingmanagement at block and neighbourhood levels if standards are to be maintained (e.g.todealwithgraffiti,litter,crime).Anagreement on standards and service charges should form part of the planning application.
Managementagreementsarekeytoensuringthelong-termsuccessof regeneration schemes and new development and to promote long term health benefits.
Delivering Healthier Communities in London
38
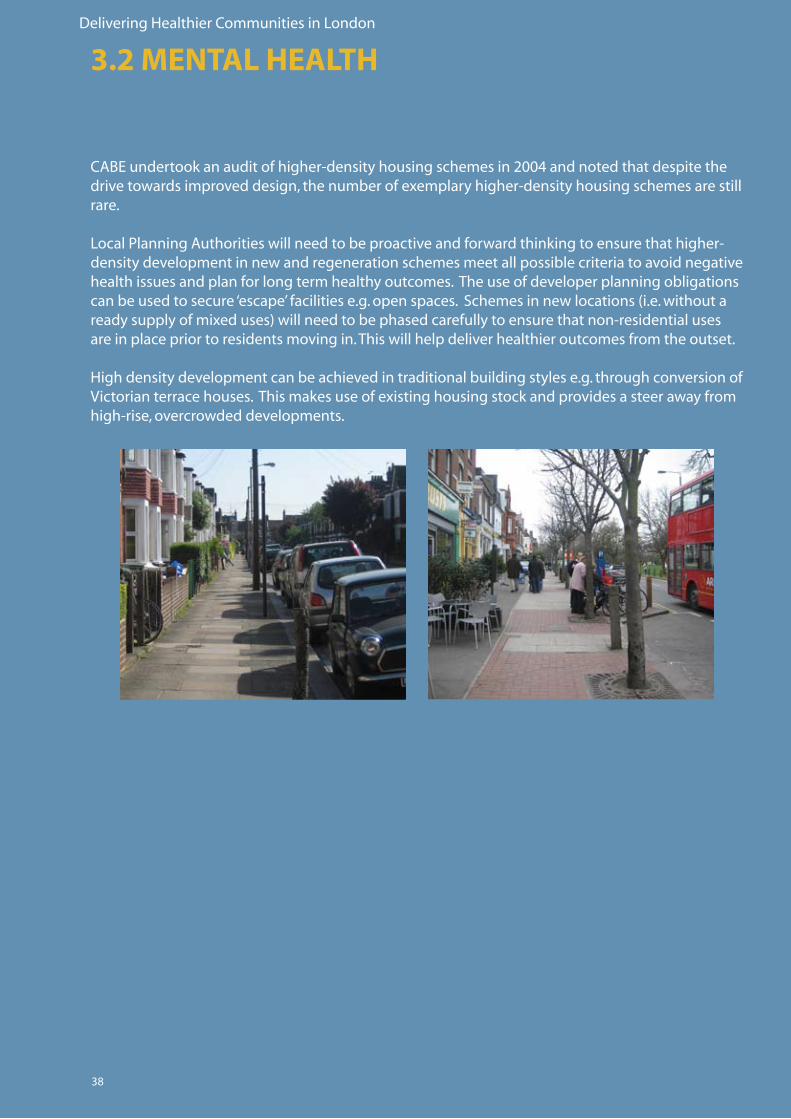
CABEundertookanauditofhigher-densityhousingschemesin2004andnotedthatdespitethedrivetowardsimproveddesign,thenumberofexemplaryhigher-densityhousingschemesarestillrare.
LocalPlanningAuthoritieswillneedtobeproactiveandforwardthinkingtoensurethathigher-density development in new and regeneration schemes meet all possible criteria to avoid negative health issues and plan for long term healthy outcomes. The use of developer planning obligations canbeusedtosecure‘escape’facilitiese.g.openspaces.Schemesinnewlocations(i.e.withoutareadysupplyofmixeduses)willneedtobephasedcarefullytoensurethatnon-residentialusesare in place prior to residents moving in. This will help deliver healthier outcomes from the outset. High density development can be achieved in traditional building styles e.g. through conversion of Victorianterracehouses.Thismakesuseofexistinghousingstockandprovidesasteerawayfromhigh-rise,overcrowdeddevelopments.
3.2 MENTAL HEALTH
Delivering Healthier Communities in London
39
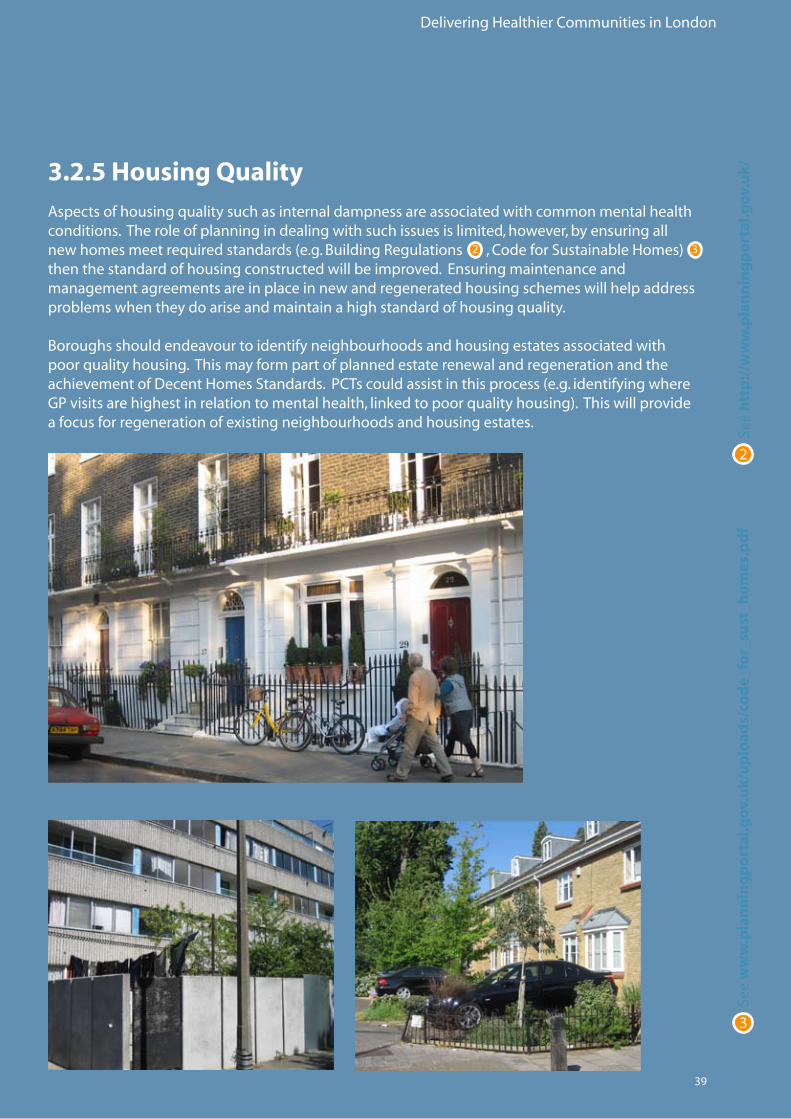
3.2.5 Housing QualityAspectsofhousingqualitysuchasinternaldampnessareassociatedwithcommonmentalhealthconditions. The role of planning in dealing with such issues is limited, however, by ensuring all newhomesmeetrequiredstandards(e.g.BuildingRegulations,CodeforSustainableHomes)thenthestandardofhousingconstructedwillbeimproved.Ensuringmaintenanceandmanagement agreements are in place in new and regenerated housing schemes will help address problemswhentheydoariseandmaintainahighstandardofhousingquality. Boroughs should endeavour to identify neighbourhoods and housing estates associated with poorqualityhousing.ThismayformpartofplannedestaterenewalandregenerationandtheachievementofDecentHomesStandards.PCTscouldassistinthisprocess(e.g.identifyingwhereGPvisitsarehighestinrelationtomentalhealth,linkedtopoorqualityhousing).Thiswillprovideafocusforregenerationofexistingneighbourhoodsandhousingestates.
2
2
See
htt
p:/
/ww
w.p
lan
nin
gp
ort
al.g
ov.
uk/
3
See
ww
w.p
lan
nin
gp
ort
al.g
ov.
uk/
up
load
s/co
de_
for_
sust
_ho
mes
.pd
f
3

Delivering Healthier Communities in London
40
3.2.6 Fear of Crime
Fear of crime is strongly associated with mental health problems43. This is a particular problem forexistingdevelopmentsandtendstodisproportionatelyaffectminoritygroups.Fearofcrimecanprofoundlyaffectthequalityofindividual’slivesbycausingbothmentaldistressandsocialexclusion44.
Nationalplanningpolicye.g.PPS145 Sustainable Development aims to:
“…promote communities which are inclusive, healthy, safe and crime free, whilst respecting the diverse needs of communities and the special needs of particular sectors of
the community…”
The need to “design out crime” is emphasised inothernationalPPSse.g.PPS646: Town Centres andwithintheMayor’sLondonPlan(e.g.Policy4B1:DesignPrinciplesforaCompactCityandPolicy4B.5iSafety,securityandfirepreventionandprotection).
TheODPMpublicationSaferPlaces:ThePlanningSystemandCrimePrevention(April2004)setsout7attributesofsaferplaces that are particularly relevant to crime prevention which should be incorporated in design. These are:
• Access and Movement: places with well-definedroutes,spaces and entrances that provide for convenient movement without compromising security.
• Structure:Placesthatarestructuredso that different uses do not cause conflict.
• Surveillance:Placeswereallpublicly accessible spaces are overlooked.
• Ownership:Placesthatpromote a sense of ownership, respect, territorial responsibility and community.
• Physical Protection:Placesthat includenecessary,well-designed security features.
• Activity:Placeswherethelevelof human activity is appropriate to the location and creates a reduced risk of crime and a sense of safety at all times.
• Management and Maintenance: Placesthataredesignedwith management and maintenance in mind to discourage crime in the present and the future.
Secured by Design provides a series of DesignGuidesonhowtodesignoutcrimeand provides information on construction companies and architects who are registered as Secured by Design providers.
Redesigninganurbanenvironmenttomakeit safer has been shown to bring financial benefits as well as positively contributing to the health of the local community. For example,improvingthestreetenvironment,throughbetterlightinginDudleyandStoke-on-Trentshowedthatforevery£1spentonlighting,£27-47wassavedintangiblelossesfrom crime47.
5
See
ww
w.s
ecu
red
byd
esig
n.c
om
5
44
See
ww
w.c
om
mu
nit
ies.
go
v.u
k/p
ub
/72
4/s
afer
Pla
cesT
heP
lan
nin
gSy
stem
and
Cri
mep
reve
nti
on
_id
11
44
72
4.p
df
3.2 MENTAL HEALTH
Delivering Healthier Communities in London
41
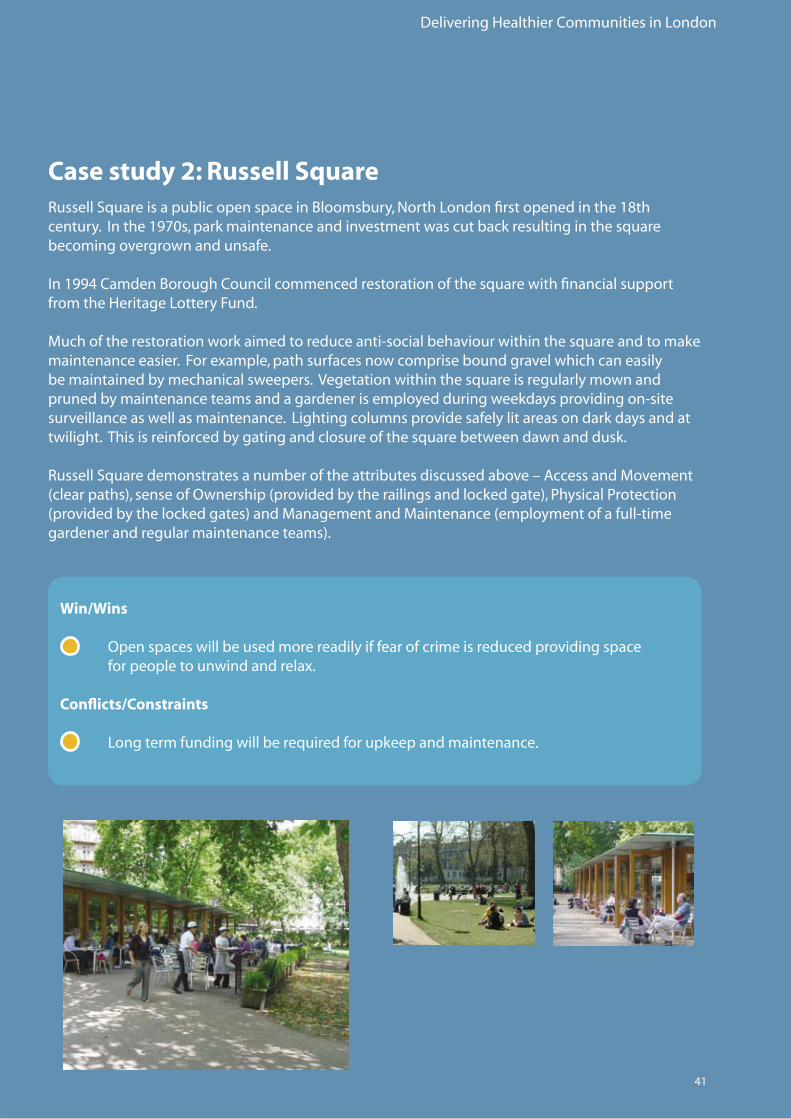
Case study 2: Russell SquareRussellSquareisapublicopenspaceinBloomsbury,NorthLondonfirstopenedinthe18thcentury.Inthe1970s,parkmaintenanceandinvestmentwascutbackresultinginthesquarebecoming overgrown and unsafe.
In1994CamdenBoroughCouncilcommencedrestorationofthesquarewithfinancialsupportfrom the Heritage Lottery Fund.
Muchoftherestorationworkaimedtoreduceanti-socialbehaviourwithinthesquareandtomakemaintenanceeasier.Forexample,pathsurfacesnowcompriseboundgravelwhichcaneasilybemaintainedbymechanicalsweepers.Vegetationwithinthesquareisregularlymownandprunedbymaintenanceteamsandagardenerisemployedduringweekdaysprovidingon-sitesurveillance as well as maintenance. Lighting columns provide safely lit areas on dark days and at twilight.Thisisreinforcedbygatingandclosureofthesquarebetweendawnanddusk.
RussellSquaredemonstratesanumberoftheattributesdiscussedabove–AccessandMovement(clearpaths),senseofOwnership(providedbytherailingsandlockedgate),PhysicalProtection(providedbythelockedgates)andManagementandMaintenance(employmentofafull-timegardenerandregularmaintenanceteams).
Win/Wins
• Openspaceswillbeusedmorereadilyiffearofcrimeisreducedprovidingspace forpeopletounwindandrelax. Conflicts/Constraints
• Longtermfundingwillberequiredforupkeepandmaintenance.

Delivering Healthier Communities in London
42
Case study 3: Regeneration of Swanley’s, Northview Estate, West Kent
Theoriginalestatewasconstructedinthe1970s,comprisingtenblocksofthreestoreyhousing.Bythemid-1990stheestatehaddegeneratedwithantisocialbehaviourconcentratedinoutsideareas.
WestKentHousingAssociationbeganaprogrammeofregenerationinthe1990sfocusingonexternallandscapingandinclusionofsecurityfeatureswithintheresidentialproperties.Theschemewascompletedin1997andinvolvedcloseworkingbetweenthearchitects(FryDrewKnightCreamer),theHousingAssociationandalocalresidentsteeringgroup.
Notable features within the regeneration package included:
• Definedoutsidespacese.g.partsofthecommunalareasgiventogroundfloorareas and other areas given distinct uses such as children’s play area.
• Lowfencealongtheroadfrontage.
• Securestorageareasforrefuseandbicycles.
• Secureentrancetoflatswithentrancecanopy.
• Goodqualitylighting.
The scheme addresses a number of the attributesdefinedearlier–Surveillance,Ownership,PhysicalProtectionandManagementandMaintenance.
Landscaping was designed in such a way to screentheestate(andclearlyestablishitasprivate).Theestateisclearlyvisiblefromwithin,providing natural surveillance all around. The landscapinghadmaturedby2007.
Maintenanceisundertakenbyaresidentwhois employed as a caretaker by the Housing Association.Paidandprofessionalhelpisprovidedwhenrequired.
Crime figures were measured pre and post schemecompletion.An80%reductionincrime(includingcriminaldamage,theftfrommotorvehiclesandtheftoffences)wasrecorded between September 1996 and September2000.
3.2 MENTAL HEALTH

Delivering Healthier Communities in London
43
Win/Wins
• Includingsimpledesignfeaturesinexistingresidentialdevelopmentscanhelpdesign out crime and reduce fear of crime.
• Involvinglocalresidentsinmaintenancecanreinforceownershipandcreateasenseof empowerment,improvingself-worthandoverallmentalhealth.
• Clearlysettingoutownershipgivesresponsibilitytoresidentsandprovidesincentives to maintain private space in good order.
Conflicts/Constraints
• Longtermfundingwillberequiredforupkeepandmaintenance.
Before
BeforeandafterphotographsofNorthviewEstate.
After

Delivering Healthier Communities in London
44
Recommendations: Planning for Mental Health
Open and Green Space
• Developersandplanningauthoritiesshouldaimtoincludeadequate“escapefacilities” such as open and green spaces within new developments and regeneration schemes. • Allotmentsareimportantas“escapefacilities”andcanprovidemultiplehealthand sustainabilitygains.Planningauthoritiesshouldlookforopportunitiestoincludethese in new developments/regeneration schemes.
Community and Social Infrastructure
• Maximiseopportunitiesforsocialinteractionthroughtheinclusionofsocialand community facilities within new developments and regeneration schemes.
Design and Reduction of Crime
• Newdevelopments/regenerationschemesshouldaimto“design-out”crime.• “Escapefacilities”suchasopenspacesshouldbedesignedtoavoidthelikelihoodof crime(e.g.followSecuredbyDesignprinciples).• Estateregenerationschemes/newdevelopmentsshouldtakeaccountoftheconditions of the surrounding areas as wider problems may offset immediate health gains.
Design Quality and Type
• BoroughsshouldworkwithPCTstoidentifyneighbourhoods/housingestateswhere housingqualityand/ordesignishavingnegativeeffectsonpublichealth.• Thedesignofhighdensitydevelopmentshouldtakeaccountofprivacy,mixeduses, mixedcommunitiesandmanagement.
Management and Maintenance
• Phasingofdevelopmentinnewandregenerationschemeswillbeimportanttoensure that health gains are secured from the outset e.g. provision of open spaces/community facilities before residents move in. • Managementandmaintenanceiscriticaltothelongtermsuccessofnew developments and regeneration schemes and to optimise health outcomes. Involvementoflocalresidentsinlongtermmaintenancecanengenderempowerment and a sense of pride in surroundings.• Developercontributionscouldhelpsecurelongtermmanagementfunding.
3.2 MENTAL HEALTH
Delivering Healthier Communities in London
45
3.2.7 Flooding
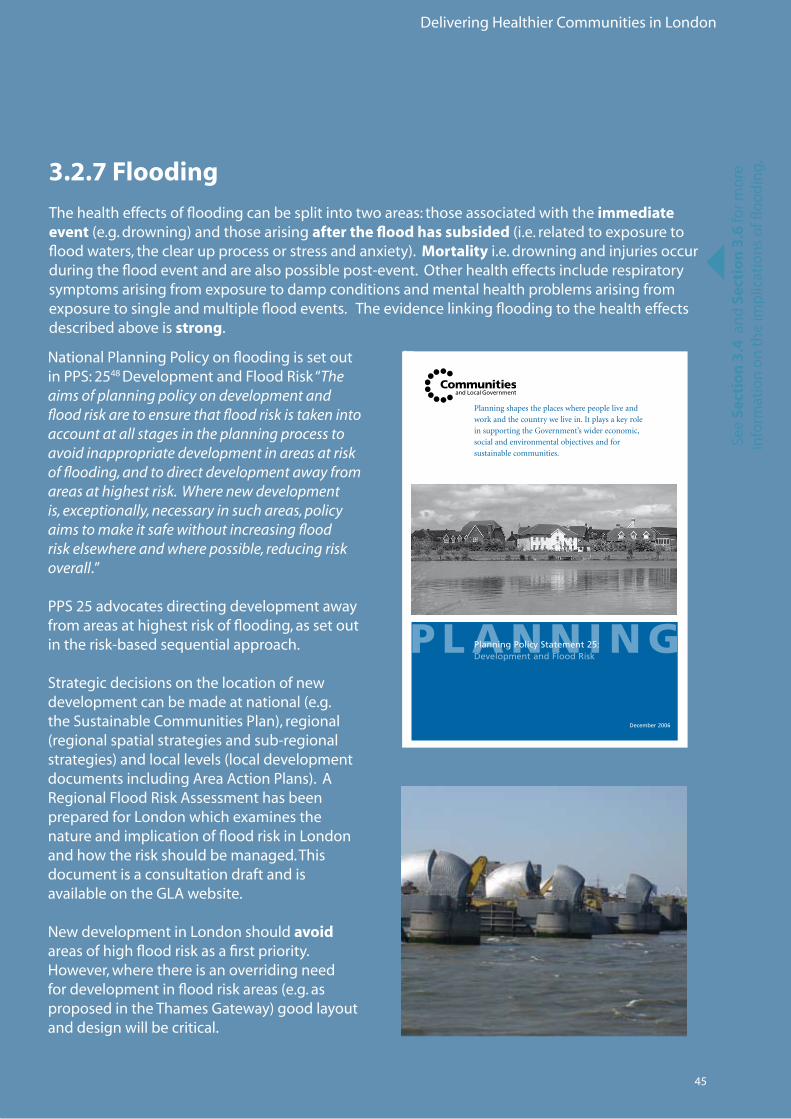
The health effects of flooding can be split into two areas: those associated with the immediate event(e.g.drowning)andthosearisingafter the flood has subsided(i.e.relatedtoexposuretofloodwaters,theclearupprocessorstressandanxiety).Mortalityi.e.drowningandinjuriesoccurduringthefloodeventandarealsopossiblepost-event.Otherhealtheffectsincluderespiratorysymptomsarisingfromexposuretodampconditionsandmentalhealthproblemsarisingfromexposuretosingleandmultiplefloodevents.Theevidencelinkingfloodingtothehealtheffectsdescribed above is strong.
P L A N N I N G
Planning shapes the places where people live and
work and the country we live in. It plays a key role
in supporting the Government’s wider economic,
social and environmental objectives and for
sustainable communities.
Planning Policy Statement 25: Development and Flood Risk
December 2006
See
Sect
ion
3.4
an
d S
ecti
on
3.6
for m
ore
in
form
atio
n o
n t
he
imp
licat
ion
s o
f flo
od
ing.
NationalPlanningPolicyonfloodingissetoutinPPS:2548DevelopmentandFloodRisk“The aims of planning policy on development and flood risk are to ensure that flood risk is taken into account at all stages in the planning process to avoid inappropriate development in areas at risk of flooding, and to direct development away from areas at highest risk. Where new development is, exceptionally, necessary in such areas, policy aims to make it safe without increasing flood risk elsewhere and where possible, reducing risk overall.”
PPS25advocatesdirectingdevelopmentawayfrom areas at highest risk of flooding, as set out intherisk-basedsequentialapproach.
Strategic decisions on the location of new developmentcanbemadeatnational(e.g.theSustainableCommunitiesPlan),regional(regionalspatialstrategiesandsub-regionalstrategies)andlocallevels(localdevelopmentdocumentsincludingAreaActionPlans).ARegionalFloodRiskAssessmenthasbeenpreparedforLondonwhichexaminesthenature and implication of flood risk in London and how the risk should be managed. This document is a consultation draft and is availableontheGLAwebsite.
NewdevelopmentinLondonshouldavoid areas of high flood risk as a first priority. However, where there is an overriding need fordevelopmentinfloodriskareas(e.g.asproposedintheThamesGateway)goodlayoutand design will be critical.
Delivering Healthier Communities in London
46
Case study 4: Minimising Flood Risk:Queenborough and Rushenden Regeneration, Isle of Sheppey, Swale
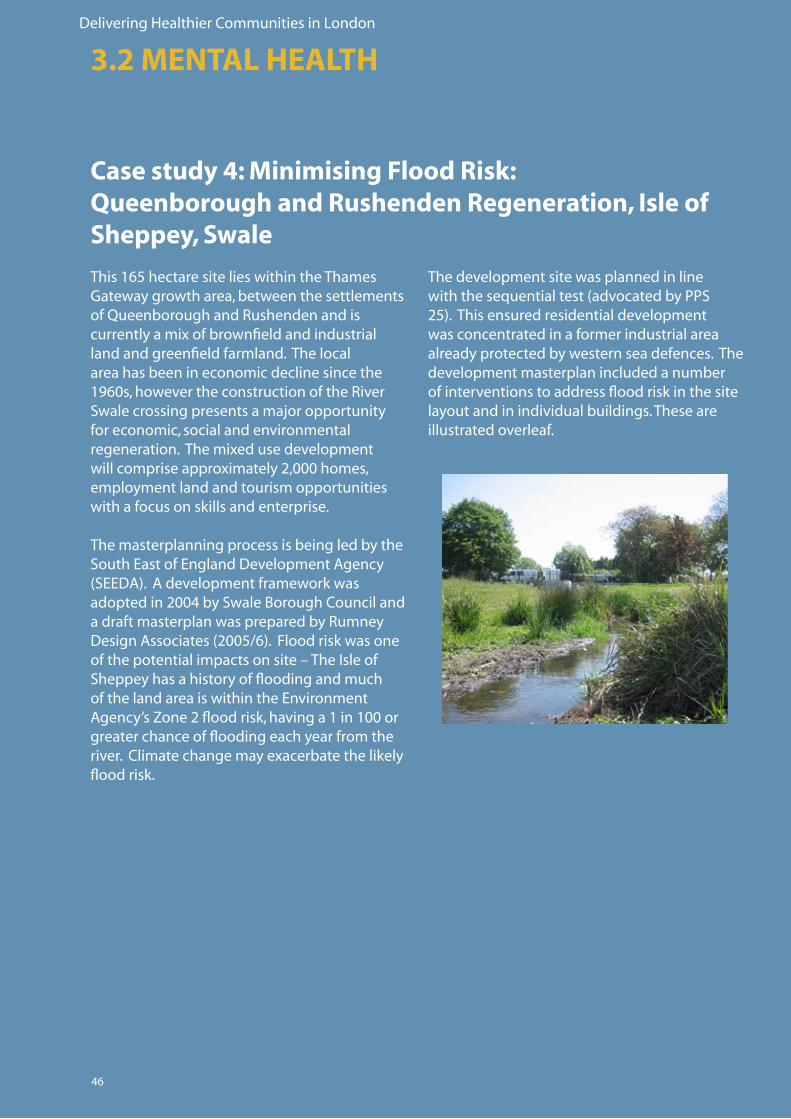
This165hectaresitelieswithintheThamesGatewaygrowtharea,betweenthesettlementsofQueenboroughandRushendenandiscurrentlyamixofbrownfieldandindustrialland and greenfield farmland. The local area has been in economic decline since the 1960s,howevertheconstructionoftheRiverSwalecrossingpresentsamajoropportunityfor economic, social and environmental regeneration.Themixedusedevelopmentwillcompriseapproximately2,000homes,employment land and tourism opportunities with a focus on skills and enterprise.
The masterplanning process is being led by the SouthEastofEnglandDevelopmentAgency(SEEDA).Adevelopmentframeworkwasadoptedin2004bySwaleBoroughCouncilandadraftmasterplanwaspreparedbyRumneyDesignAssociates(2005/6).Floodriskwasoneofthepotentialimpactsonsite–TheIsleofSheppey has a history of flooding and much ofthelandareaiswithintheEnvironmentAgency’sZone2floodrisk,havinga1in100orgreater chance of flooding each year from the river.Climatechangemayexacerbatethelikelyflood risk.
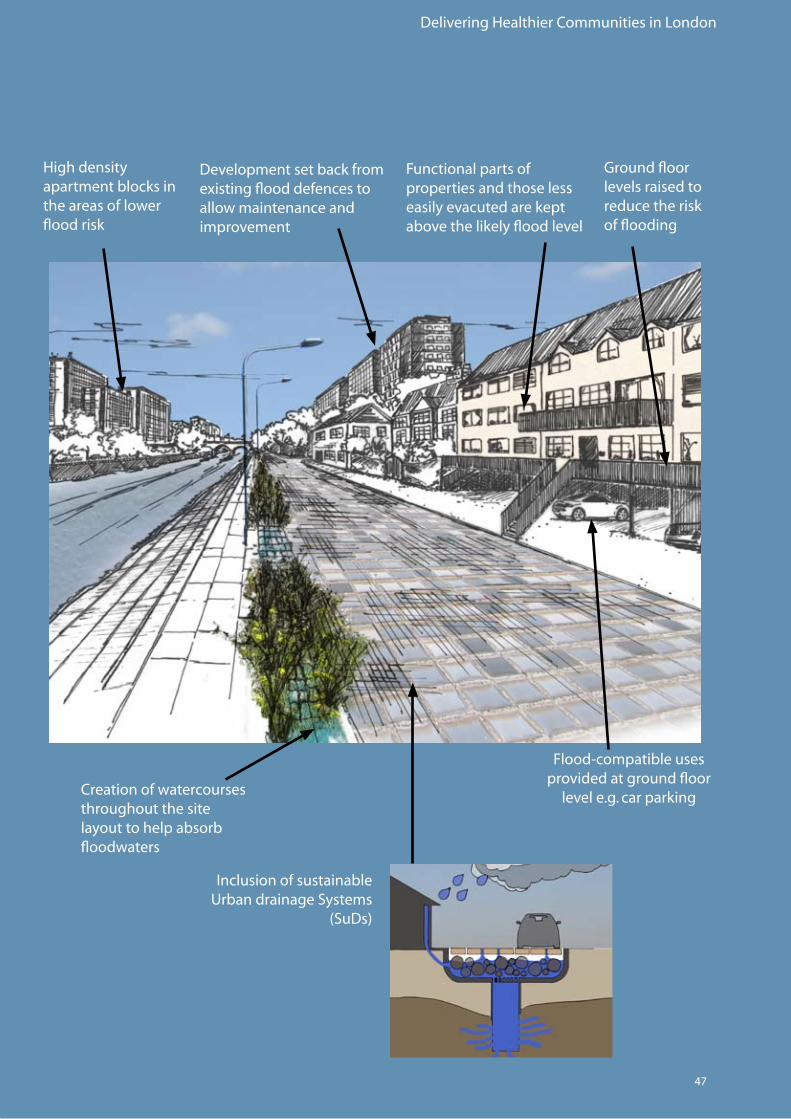
The development site was planned in line withthesequentialtest(advocatedbyPPS25).Thisensuredresidentialdevelopmentwas concentrated in a former industrial area already protected by western sea defences. The development masterplan included a number of interventions to address flood risk in the site layout and in individual buildings. These are illustrated overleaf.
3.2 MENTAL HEALTH
Delivering Healthier Communities in London
47
InclusionofsustainableUrbandrainageSystems
(SuDs)
Creation of watercourses throughout the site layout to help absorb floodwaters
Development set back from existingflooddefencestoallow maintenance and improvement
High density apartment blocks in the areas of lower flood risk
Functional parts of properties and those less easily evacuted are kept above the likely flood level
Groundfloorlevels raised to reduce the risk of flooding
Flood-compatibleusesprovided at ground floor
level e.g. car parking

Delivering Healthier Communities in London
48
What are Sustainable Urban Drainage Systems (SuDs)?
SuDs provide a means to manage runoff from buildings and hardstanding. They reduce the total amount, flow and rate of surface water that runs directly to rivers through stormwater systems.
InformationontypesofSuDsaresetoutintheMayorofLondon’sSPG:SustainableDesignandConstruction(2006).Themayor’sSPGalsoprovidesanumberofotherinterventionstocreateflood resistant development.
Win/Wins
• Designing development to minimise flood risk will help avoid direct and indirect health effects.
• SuDscreatehabitatsofbenefittobiodiversityandamenityandimprove waterquality–indirecthealthbenefits.
Conflicts/Constraints
• Residentsstilllivinginafloodriskareawhichcouldincreaseanxietyand other mental health problems.
• HighdensityhousingcanoftenexceedthecapacityofSuDs.
• Increasinginvestmentinflooddefencesandbuildinginflood-resiliencewill add to the cost of development.
6
See
htt
p:/
/ww
w.lo
nd
on
.go
v.u
k/m
ayo
r/st
rate
gie
s/sd
s/su
stai
nab
le_d
esig
n.j
sp
6
3.2 MENTAL HEALTH
Delivering Healthier Communities in London
49
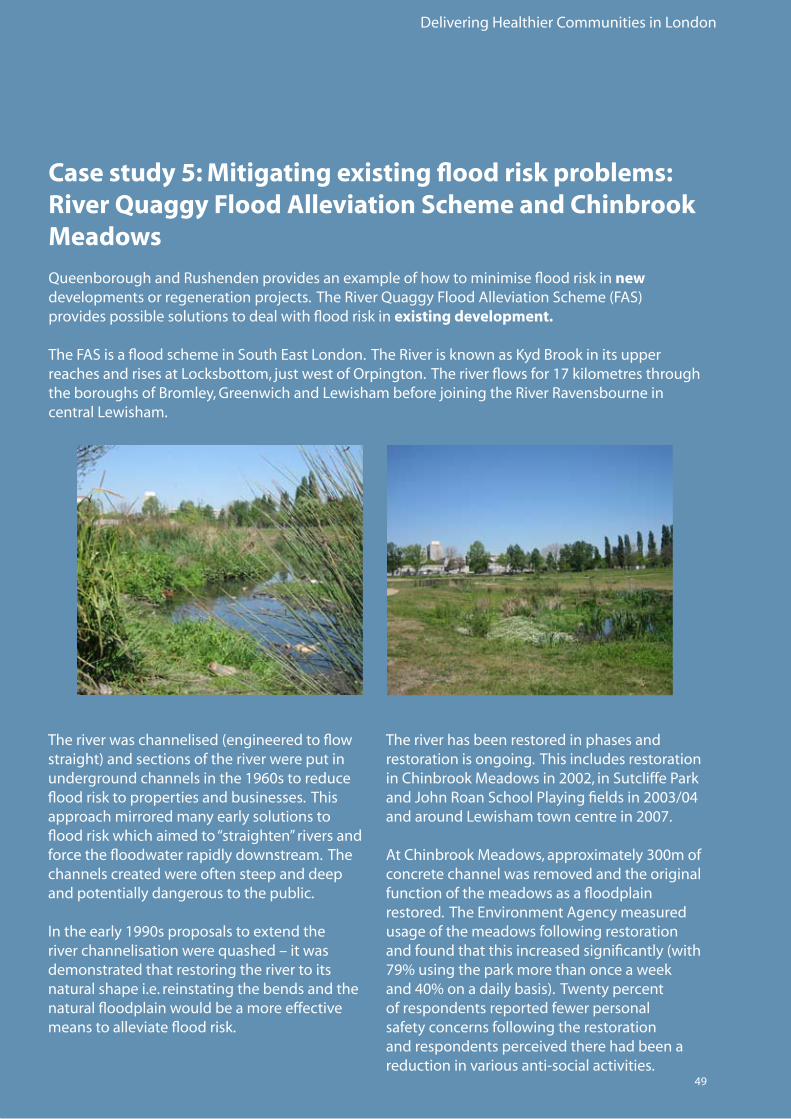
Case study 5: Mitigating existing flood risk problems:River Quaggy Flood Alleviation Scheme and Chinbrook Meadows
QueenboroughandRushendenprovidesanexampleofhowtominimisefloodriskinnew developmentsorregenerationprojects.TheRiverQuaggyFloodAlleviationScheme(FAS)provides possible solutions to deal with flood risk in existing development.
TheFASisafloodschemeinSouthEastLondon.TheRiverisknownasKydBrookinitsupperreachesandrisesatLocksbottom,justwestofOrpington.Theriverflowsfor17kilometresthroughtheboroughsofBromley,GreenwichandLewishambeforejoiningtheRiverRavensbourneincentral Lewisham.
Theriverwaschannelised(engineeredtoflowstraight)andsectionsoftheriverwereputinundergroundchannelsinthe1960storeduceflood risk to properties and businesses. This approach mirrored many early solutions to flood risk which aimed to “straighten” rivers and force the floodwater rapidly downstream. The channels created were often steep and deep and potentially dangerous to the public.
Intheearly1990sproposalstoextendtheriverchannelisationwerequashed–itwasdemonstrated that restoring the river to its natural shape i.e. reinstating the bends and the natural floodplain would be a more effective means to alleviate flood risk.
The river has been restored in phases and restoration is ongoing. This includes restoration inChinbrookMeadowsin2002,inSutcliffeParkandJohnRoanSchoolPlayingfieldsin2003/04andaroundLewishamtowncentrein2007.
AtChinbrookMeadows,approximately300mofconcrete channel was removed and the original function of the meadows as a floodplain restored.TheEnvironmentAgencymeasuredusage of the meadows following restoration andfoundthatthisincreasedsignificantly(with79%usingtheparkmorethanonceaweekand40%onadailybasis).Twentypercentof respondents reported fewer personal safety concerns following the restoration and respondents perceived there had been a reductioninvariousanti-socialactivities.

Delivering Healthier Communities in London
50
AtSutcliffePark,theriverpreviouslyflowedinanundergroundculvert.TheriverwasbroughtbackabovegroundatthissectionandfloodwaterswereabletospilloutontothePark.SurveysfollowingrestorationofSutcliffeParkfoundthatusageoftheparkhadincreasedsignificantly(byover70%).
Theongoingrestorationofthisriverprovidesanaward-winningexampleofhowexistingfloodriskcanbemanagedinapositiveway,re-creatingnaturalriverfeaturesandcreatinganenvironmentof benefit to biodiversity, whilst reducing the risk of flooding to properties and businesses. The originalrecreationalspacesatChinbrookMeadows,SutcliffeParkandJohnRoadPlayingFieldswere uninspiring and underused. The river restoration enabled these spaces to be enhanced increasing their attractiveness to potential users.
Win/Wins
• Positiveplanningcanhelpreducefloodriskinexistingdevelopmentsandhence reduceanxietyandthelikelihoodofmoredirecthealtheffectse.g.injuries.
• Riverrestorationhasmultiplebenefits–enhancingbiodiversityandimproving recreationalspaces–thismayindirectlybenefitmentalhealthandincreasethe likelihood of engaging in physical activity. • Suchfloodmanagementsolutionsareoftencheaperthanmoreconventional engineering options. • Developercontributionscanbeusedtofundrestorationinregenerationschemes.
• Riverrestorationcouldbetiedtoarea-wideregenerationandhelpaddress environmentalandsocialinequalities.
Conflicts/Constraints
• Riverrestorationwilltaketimetoimplementandwillnotaddressfloodriskinthe short term.
• Requireslargeareasofundevelopedlandtorecreatefloodstorageareas-not always available in London.
• Riverrestoration,althoughoftencheaperthanconventionalengineeringoptions,isstill expensive.
3.2 MENTAL HEALTH
Delivering Healthier Communities in London
51
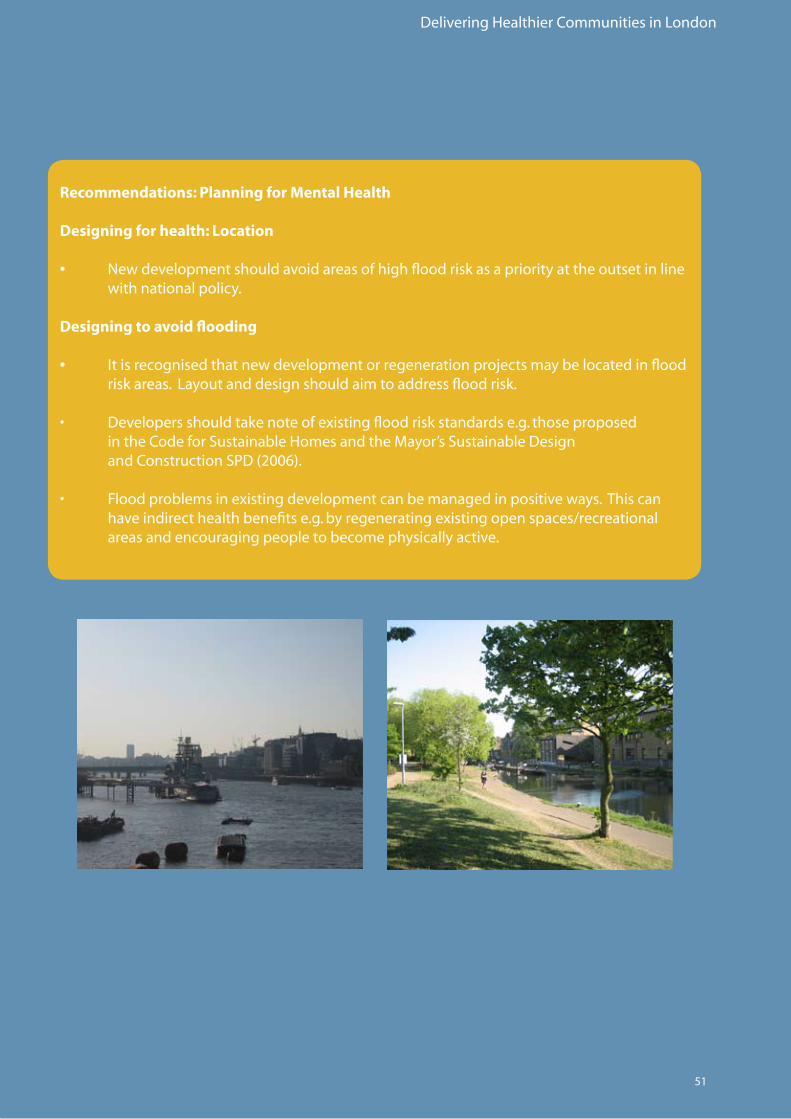
Recommendations: Planning for Mental Health
Designing for health: Location
• Newdevelopmentshouldavoidareasofhighfloodriskasapriorityattheoutsetinline with national policy.
Designing to avoid flooding
• Itisrecognisedthatnewdevelopmentorregenerationprojectsmaybelocatedinflood risk areas. Layout and design should aim to address flood risk.
• Developersshouldtakenoteofexistingfloodriskstandardse.g.thoseproposed intheCodeforSustainableHomesandtheMayor’sSustainableDesign andConstructionSPD(2006).
• Floodproblemsinexistingdevelopmentcanbemanagedinpositiveways.Thiscan haveindirecthealthbenefitse.g.byregeneratingexistingopenspaces/recreational areas and encouraging people to become physically active.
Delivering Healthier Communities in London
52
3.3 OBESITY AND CARDIO-VASCULAR DISEASE
3.3.1 Evidence Base
Oneoftoday’sbiggestpublichealthissuesistheobesityepidemic,linkedtorisingincidenceofdiabetes49.Obesityanddiabetesareriskfactorsforcoronaryheartdisease.InEngland,15%ofchildrenbetween2and10yearsofageareobeseandtheprevalenceofchildrenthatareobeseand overweight is increasing steadily50.Encouragingphysicalactivitycanhelptoarrestthistrend.
Physicalactivityhasstronglinkswithaddressingobesityanddiabetesandreducingtheriskofcardiovascular disease. Cardiovascular disease refers to diseases involving the heart and/or blood vessels.Cardiovasculardiseaseisthemajorcauseofdeathandthedeathratewas389/100,000inEngland51. There is evidence that physical activity such as brisk walking or cycling on most days of the week has a clear association with reduced risk of cardiovascular disease in middle aged and old people.
Physicalactivitydoesnotneedtobevigoroustoachievehealthbenefits.Keyfactorsthatsupportphysical activity include:
1) Walkingandcyclewaystoconnecthomeswithschools,workplacesandshops;2) Accessibilitytoplayingintheparkandsportsfacilities;and3) Removalofenvironmentalbarrierstopermitresidentsinpoorerareastobecomephysically active.
There is evidence that creation or enhancement of these factors is effective in engaging people acrossthesocio-economicandethnicspectruminlevelsofphysicalactivitythatimprovetheirhealth.
EncouragingphysicalactivitycanresultinsubstantialcostsavingstotheNHS.Thecostsof physical inactivity has been estimated at £8.2billionperyear,madeupof£1.7billionindirecthealthcarecostsfortheNHS,£5.4billioninearningslosttosicknessabsenceand£1billion in earnings lost to premature mortality52. Itissuggestedthata10%increaseinadultphysicalactivitycouldbenefitEnglandby£500millionayearandsave6,000lives.
Spatial planning can encourage physical activity by promoting walking and cycling through well-designed paths and cycleways,
improving accessibility to open and green spaces and sports facilities, and removing environmental barriers to allow residents in
poorer areas to become physically active.
Evidently,obesityisalsolinkedtoapoordietand access to a range of food at a reasonable price.Planningcanprovidefacilitiestobuyfoodthroughmixedusedevelopmentsandtogrowfoodlocally(e.g.throughprovisionof allotments or garden spaces in new developments).
Further information on the evidence underpinning the links between obesity and cardiovascular disease and spatial planning is provided in Appendices 3.3 and 3.4.
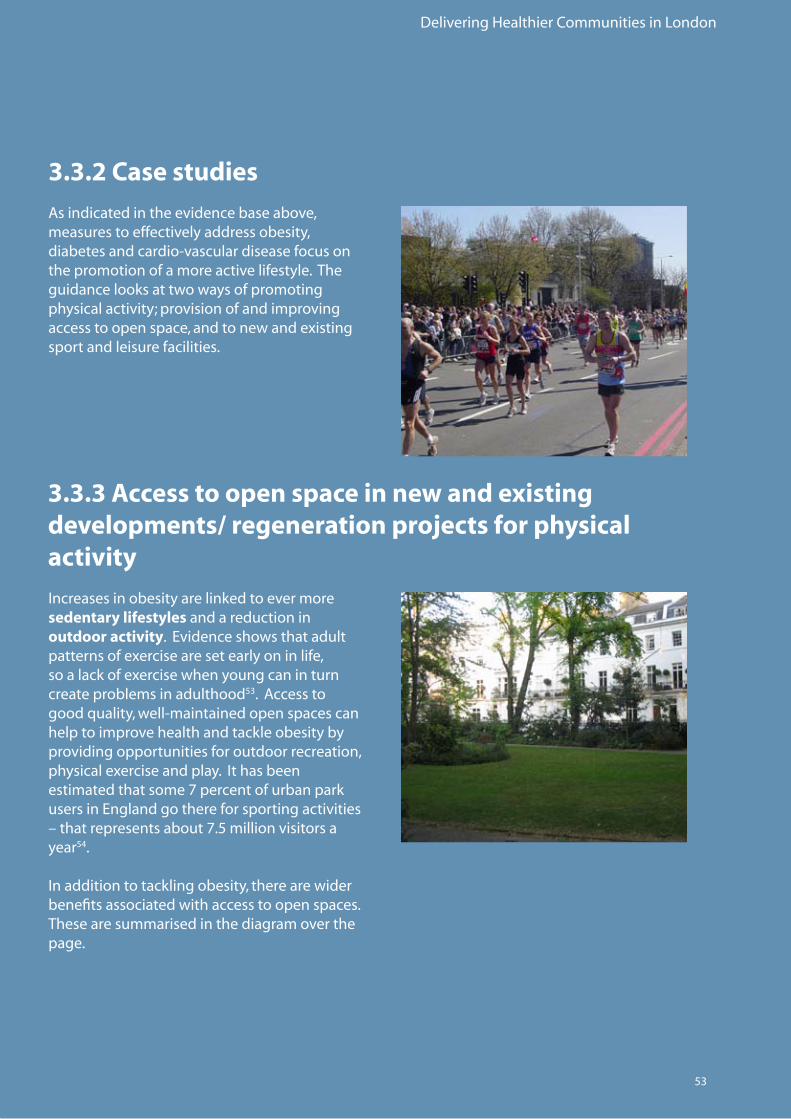
Delivering Healthier Communities in London
53
3.3.2 Case studies
Asindicatedintheevidencebaseabove,measures to effectively address obesity, diabetesandcardio-vasculardiseasefocusonthe promotion of a more active lifestyle. The guidance looks at two ways of promoting physicalactivity;provisionofandimprovingaccesstoopenspace,andtonewandexistingsport and leisure facilities.
3.3.3 Access to open space in new and existing developments/ regeneration projects for physical activity
Increasesinobesityarelinkedtoevermoresedentary lifestyles and a reduction in outdoor activity.Evidenceshowsthatadultpatternsofexercisearesetearlyoninlife,soalackofexercisewhenyoungcaninturncreate problems in adulthood53.Accesstogoodquality,well-maintainedopenspacescanhelp to improve health and tackle obesity by providing opportunities for outdoor recreation, physicalexerciseandplay.Ithasbeenestimated that some 7 percent of urban park usersinEnglandgothereforsportingactivities–thatrepresentsabout7.5millionvisitorsayear54.
Inadditiontotacklingobesity,therearewiderbenefits associated with access to open spaces. These are summarised in the diagram over the page.
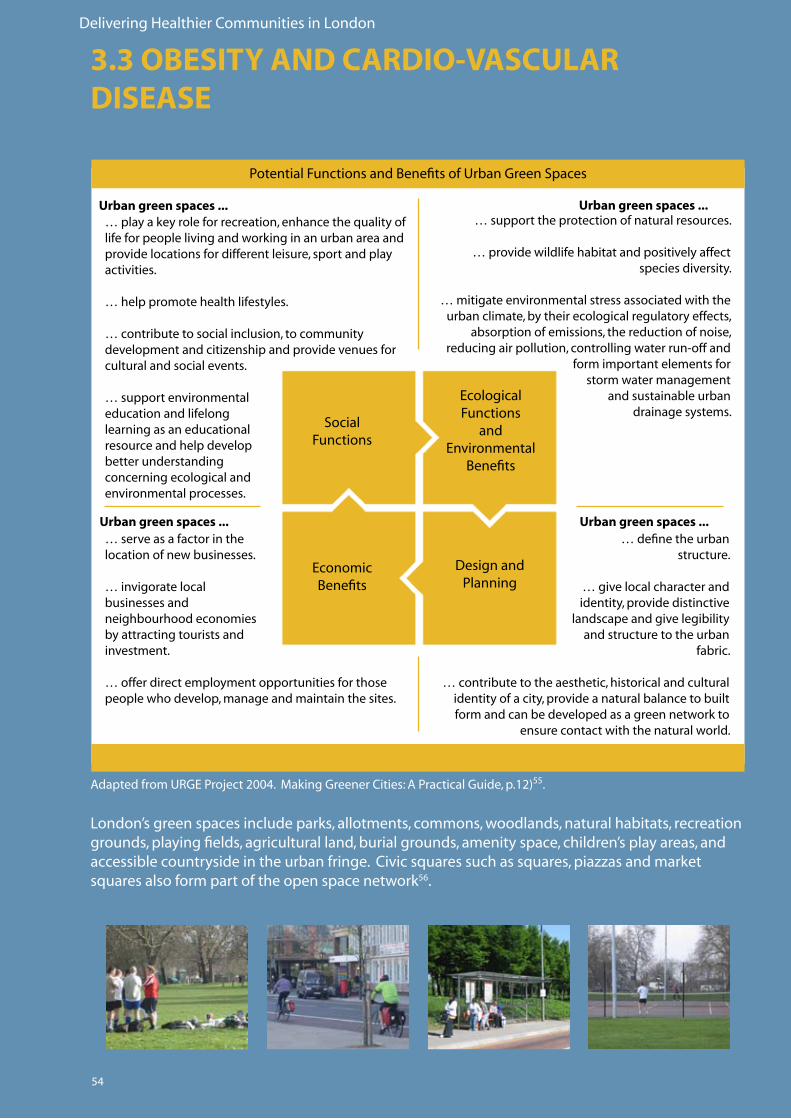
Delivering Healthier Communities in London
54
…playakeyroleforrecreation,enhancethequalityoflife for people living and working in an urban area and provide locations for different leisure, sport and play activities.
… help promote health lifestyles.
… contribute to social inclusion, to community development and citizenship and provide venues for cultural and social events.
… support environmental education and lifelong learning as an educational resource and help develop better understanding concerning ecological and environmental processes.
… serve as a factor in the location of new businesses.
… invigorate local businesses and neighbourhood economies by attracting tourists and investment.
… offer direct employment opportunities for those people who develop, manage and maintain the sites.
… define the urban structure.
… give local character and identity, provide distinctive
landscape and give legibility and structure to the urban
fabric.
… contribute to the aesthetic, historical and cultural identity of a city, provide a natural balance to built form and can be developed as a green network to
ensure contact with the natural world.
… support the protection of natural resources.
… provide wildlife habitat and positively affect species diversity.
… mitigate environmental stress associated with the urban climate, by their ecological regulatory effects,
absorption of emissions, the reduction of noise, reducingairpollution,controllingwaterrun-offand
form important elements for storm water management
and sustainable urban drainage systems.
Urban green spaces ... Urban green spaces ...
Urban green spaces ... Urban green spaces ...
PotentialFunctionsandBenefitsofUrbanGreenSpaces
Social Functions
EcologicalFunctions
and Environmental
Benefits
Design and Planning
EconomicBenefits
AdaptedfromURGEProject2004.MakingGreenerCities:APracticalGuide,p.12)55.
3.3 OBESITY AND CARDIO-VASCULAR DISEASE
London’s green spaces include parks, allotments, commons, woodlands, natural habitats, recreation grounds, playing fields, agricultural land, burial grounds, amenity space, children’s play areas, and accessiblecountrysideintheurbanfringe.Civicsquaressuchassquares,piazzasandmarketsquaresalsoformpartoftheopenspacenetwork56.
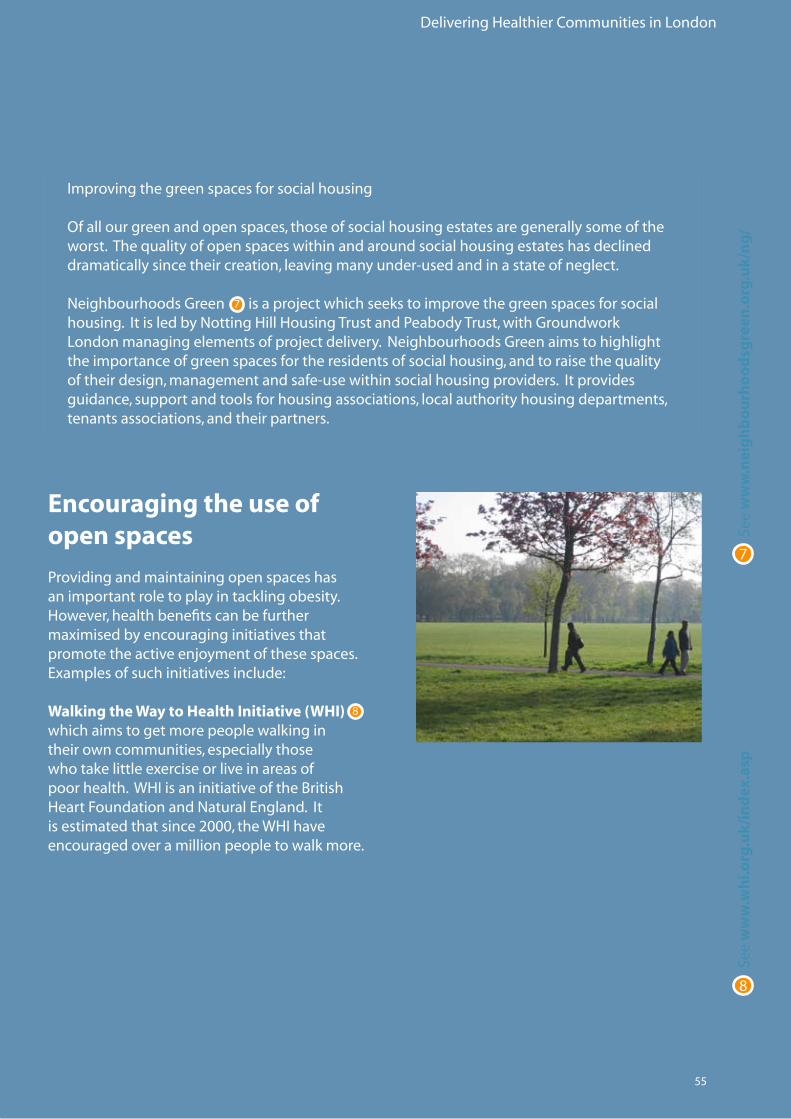
Delivering Healthier Communities in London
55
Improvingthegreenspacesforsocialhousing
Ofallourgreenandopenspaces,thoseofsocialhousingestatesaregenerallysomeoftheworst.Thequalityofopenspaceswithinandaroundsocialhousingestateshasdeclineddramaticallysincetheircreation,leavingmanyunder-usedandinastateofneglect.
NeighbourhoodsGreenisaprojectwhichseekstoimprovethegreenspacesforsocialhousing.ItisledbyNottingHillHousingTrustandPeabodyTrust,withGroundworkLondonmanagingelementsofprojectdelivery.NeighbourhoodsGreenaimstohighlighttheimportanceofgreenspacesfortheresidentsofsocialhousing,andtoraisethequalityoftheirdesign,managementandsafe-usewithinsocialhousingproviders.Itprovidesguidance, support and tools for housing associations, local authority housing departments, tenants associations, and their partners.
Encouraging the use of open spaces
Providingandmaintainingopenspaceshasan important role to play in tackling obesity. However, health benefits can be further maximisedbyencouraginginitiativesthatpromotetheactiveenjoymentofthesespaces.Examplesofsuchinitiativesinclude:
Walking the Way to Health Initiative (WHI) which aims to get more people walking in their own communities, especially those whotakelittleexerciseorliveinareasofpoorhealth.WHIisaninitiativeoftheBritishHeartFoundationandNaturalEngland.Itisestimatedthatsince2000,theWHIhaveencouraged over a million people to walk more.
See
ww
w.n
eig
hb
ou
rho
od
sgre
en.o
rg.u
k/n
g/
7
See
ww
w.w
hi.o
rg.u
k/in
dex
.asp
8
7
8
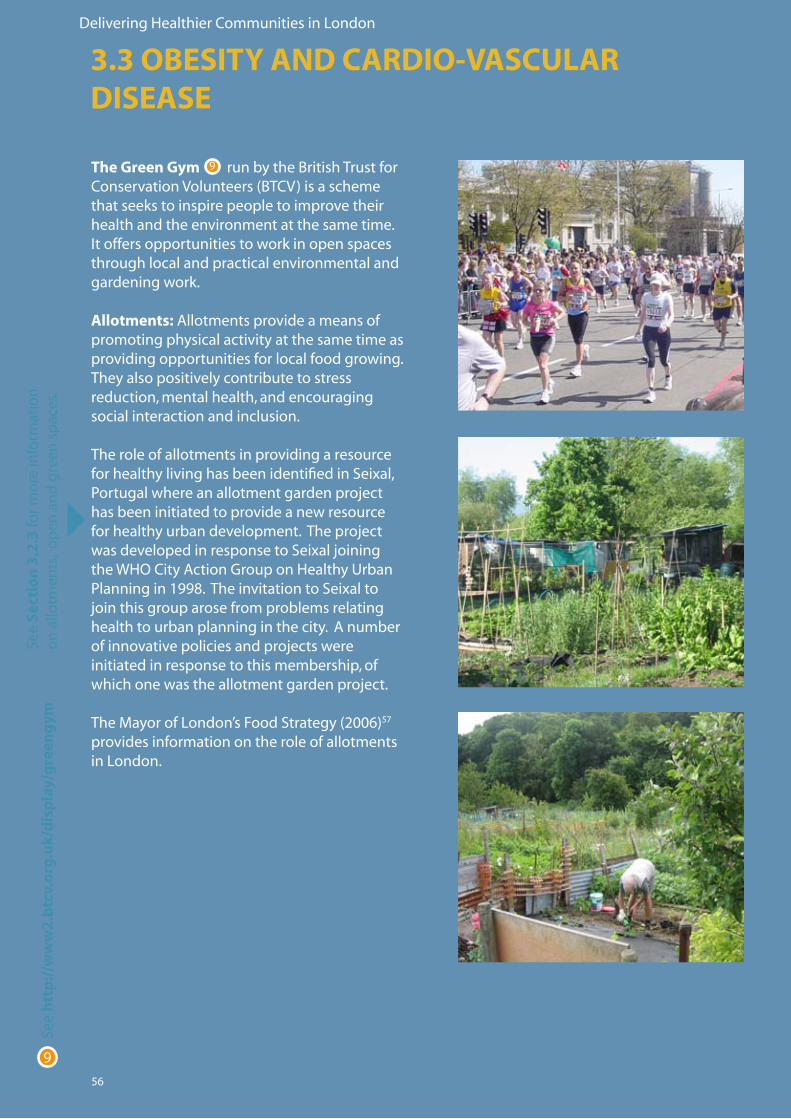
Delivering Healthier Communities in London
56
The Green Gym run by the British Trust for ConservationVolunteers(BTCV)isaschemethat seeks to inspire people to improve their health and the environment at the same time. Itoffersopportunitiestoworkinopenspacesthrough local and practical environmental and gardening work.
Allotments:Allotmentsprovideameansofpromoting physical activity at the same time as providing opportunities for local food growing. They also positively contribute to stress reduction, mental health, and encouraging social interaction and inclusion.
The role of allotments in providing a resource forhealthylivinghasbeenidentifiedinSeixal,Portugalwhereanallotmentgardenprojecthas been initiated to provide a new resource forhealthyurbandevelopment.TheprojectwasdevelopedinresponsetoSeixaljoiningtheWHOCityActionGrouponHealthyUrbanPlanningin1998.TheinvitationtoSeixaltojointhisgrouparosefromproblemsrelatinghealthtourbanplanninginthecity.Anumberofinnovativepoliciesandprojectswereinitiated in response to this membership, of whichonewastheallotmentgardenproject.
TheMayorofLondon’sFoodStrategy(2006)57 provides information on the role of allotments in London.
See
htt
p:/
/ww
w2
.btc
v.o
rg.u
k/d
isp
lay/
gre
eng
ym
9
See
Sect
ion
3.2
.3 fo
r mo
re in
form
atio
n
on
allo
tmen
ts,
op
en a
nd
gre
en s
pac
es.
9
3.3 OBESITY AND CARDIO-VASCULAR DISEASE
Delivering Healthier Communities in London
57
Case study 6: Tackling obesity and cardiovascular disease through the refurbishment of an urban park – Mile End Park, Tower HamletsPriortorefurbishment,MileEndParkwasableak,fragmentedandunder-usedopenspaceinthecentre of the London Borough of Tower Hamlets. Tower Hamlets has a large population but little goodqualityopenspace.
Refurbishment of the park included a number of measures which sought to encourage healthy lifestyles for those living and working in Tower Hamlets:
• Provisionofsafeandattractivepedestrianandcycleroutes,e.g.thePathway,which runsthelengthofthepark,andtheGreenBridge,whichlinkstwopartsofthePark previouslyseparatedbyamajorroad.Theseroutesarelikelytoencouragewalkingand cycling as a recreation activity within the park itself and also encourage the use of sustainable modes of transport to access work or local services and facilities where they form part of wider pedestrian and cycle networks.
• Thepathwayshavebeendesignedtoincludecarefulgrading,ensuringthatthepark and its facilities are accessible to all, including young children, older people and wheelchairusers.Inclusiveaccessandeaseofuseencouragestheuseofopenspaces and leisure facilities and the promotion of active lifestyles for all groups of people.
• Provisionofwatersport,leisure,artandplayfacilities,e.g.thePlayArena,encouraging activeoutdoorexercise.Thesefacilitiesarewidelyusedbylocalresidents,forexample, in commenting on the refurbished park, one local resident commented that ‘I usually come here with my mates to play football or cricket. It feels great to have a place like this’58.
The health benefits associated with the refurbishmentofMileEndParkcouldbefurther enhanced by providing people with clear information about the availability of safeandenjoyableopportunitiestobeactiveinthepark.Forexample,‘active-livingmaps’could be designed illustrating facilities that offer physical activity facilities and setting out the location of pedestrian and cycle routes and where they link to wider walking and cycling networks.
Maintainingthelongtermqualityofopenspaces is crucial if their integrity is to be preserved and their use is to be encouraged. ThiswasrecognisedbytheprojectteamredevelopingMileEndPark.TomaintainthequalityofthisPark,rentsfromtheshopsborderingtheParkgotowardsparkmaintenance and all revenue generated by park facilities is allocated to pay for park directors, rangers, events and general upkeep.
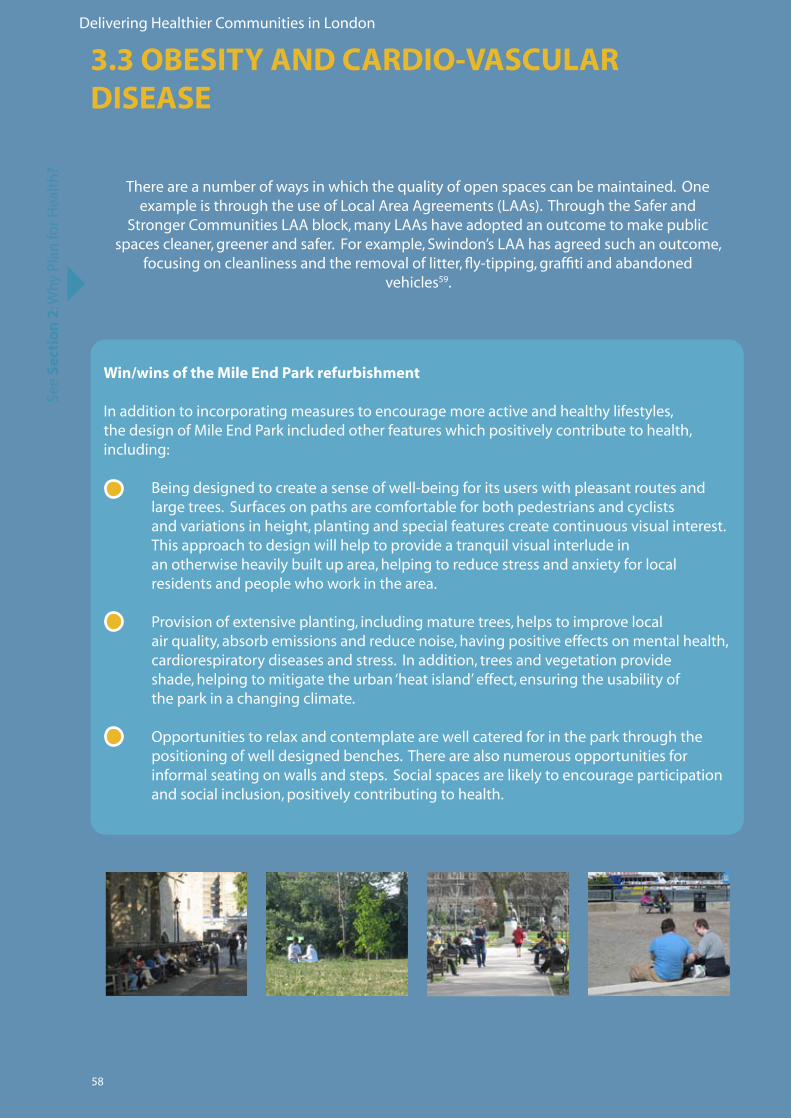
Delivering Healthier Communities in London
58
Win/wins of the Mile End Park refurbishment
Inadditiontoincorporatingmeasurestoencouragemoreactiveandhealthylifestyles,thedesignofMileEndParkincludedotherfeatureswhichpositivelycontributetohealth,including:
• Beingdesignedtocreateasenseofwell-beingforitsuserswithpleasantroutesand large trees. Surfaces on paths are comfortable for both pedestrians and cyclists and variations in height, planting and special features create continuous visual interest. Thisapproachtodesignwillhelptoprovideatranquilvisualinterludein anotherwiseheavilybuiltuparea,helpingtoreducestressandanxietyforlocal residents and people who work in the area.
• Provisionofextensiveplanting,includingmaturetrees,helpstoimprovelocal airquality,absorbemissionsandreducenoise,havingpositiveeffectsonmentalhealth, cardiorespiratorydiseasesandstress.Inaddition,treesandvegetationprovide shade, helping to mitigate the urban ‘heat island’ effect, ensuring the usability of the park in a changing climate.
• Opportunitiestorelaxandcontemplatearewellcateredforintheparkthroughthe positioning of well designed benches. There are also numerous opportunities for informal seating on walls and steps. Social spaces are likely to encourage participation and social inclusion, positively contributing to health.
Thereareanumberofwaysinwhichthequalityofopenspacescanbemaintained.OneexampleisthroughtheuseofLocalAreaAgreements(LAAs).ThroughtheSaferand
StrongerCommunitiesLAAblock,manyLAAshaveadoptedanoutcometomakepublicspacescleaner,greenerandsafer.Forexample,Swindon’sLAAhasagreedsuchanoutcome,
focusingoncleanlinessandtheremovaloflitter,fly-tipping,graffitiandabandonedvehicles59.
See
Sect
ion
2:W
hy
Plan
forH
ealt
h?
3.3 OBESITY AND CARDIO-VASCULAR DISEASE
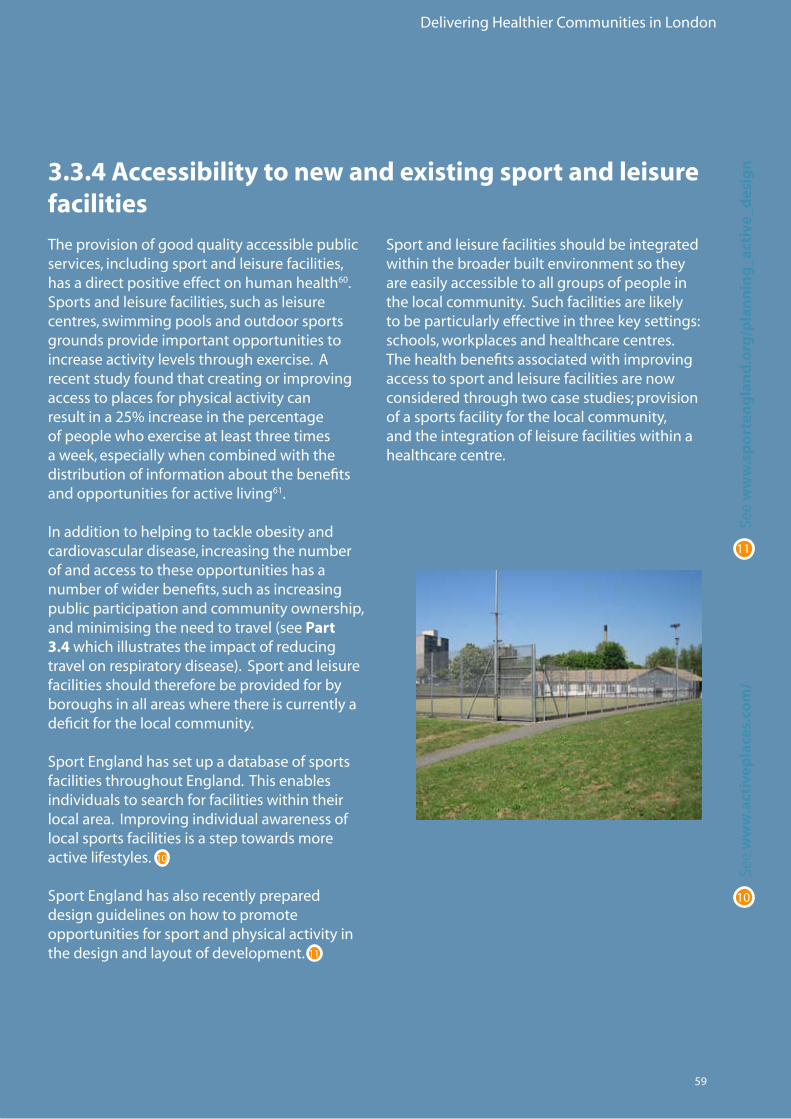
Delivering Healthier Communities in London
59
3.3.4 Accessibility to new and existing sport and leisure facilities
Theprovisionofgoodqualityaccessiblepublicservices, including sport and leisure facilities, has a direct positive effect on human health60. Sports and leisure facilities, such as leisure centres, swimming pools and outdoor sports grounds provide important opportunities to increaseactivitylevelsthroughexercise.Arecent study found that creating or improving access to places for physical activity can resultina25%increaseinthepercentageofpeoplewhoexerciseatleastthreetimesa week, especially when combined with the distribution of information about the benefits and opportunities for active living61.
Inadditiontohelpingtotackleobesityandcardiovascular disease, increasing the number of and access to these opportunities has a number of wider benefits, such as increasing public participation and community ownership, andminimisingtheneedtotravel(seePart 3.4 which illustrates the impact of reducing travelonrespiratorydisease).Sportandleisurefacilities should therefore be provided for by boroughs in all areas where there is currently a deficit for the local community.
SportEnglandhassetupadatabaseofsportsfacilitiesthroughoutEngland.Thisenablesindividuals to search for facilities within their localarea.Improvingindividualawarenessoflocal sports facilities is a step towards more active lifestyles.
SportEnglandhasalsorecentlyprepareddesign guidelines on how to promote opportunities for sport and physical activity in the design and layout of development.
Sport and leisure facilities should be integrated within the broader built environment so they are easily accessible to all groups of people in the local community. Such facilities are likely to be particularly effective in three key settings: schools, workplaces and healthcare centres. The health benefits associated with improving access to sport and leisure facilities are now consideredthroughtwocasestudies;provisionof a sports facility for the local community, and the integration of leisure facilities within a healthcare centre.
See
ww
w.a
ctiv
epla
ces.
com
/
10
10
See
ww
w.s
po
rten
gla
nd
.org
/pla
nn
ing
_act
ive_
des
ign
11
11
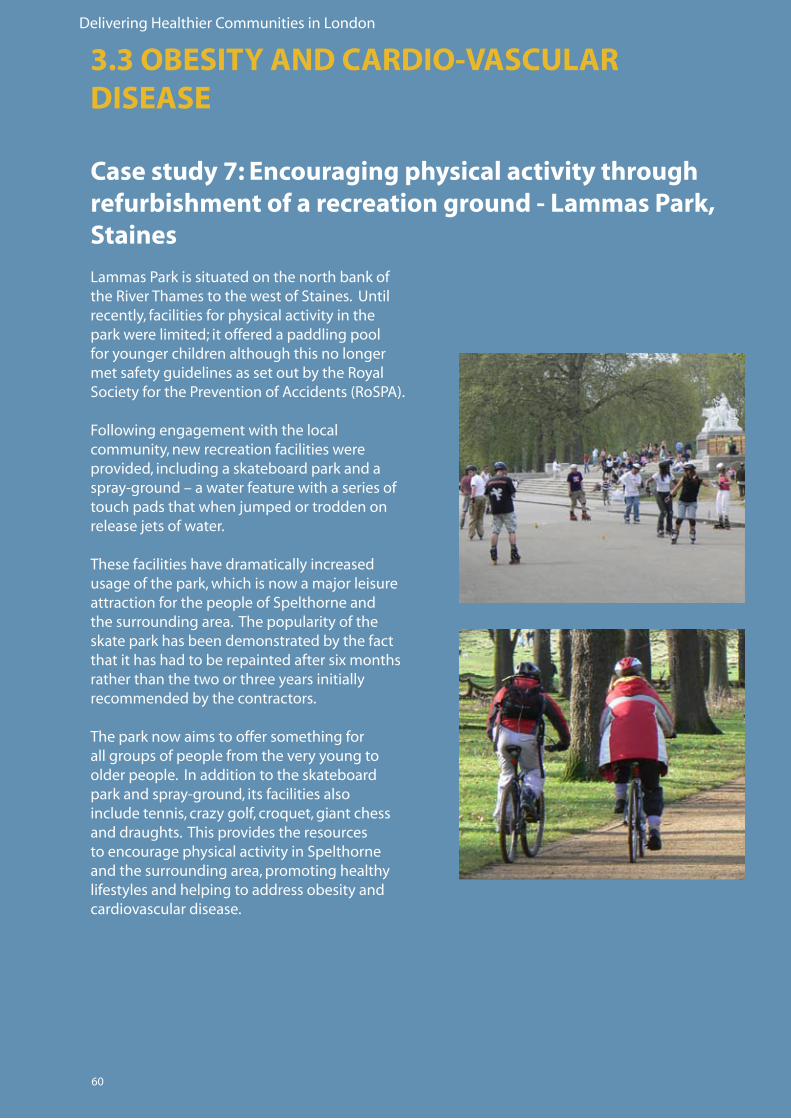
Delivering Healthier Communities in London
60
Case study 7: Encouraging physical activity through refurbishment of a recreation ground - Lammas Park, Staines
LammasParkissituatedonthenorthbankoftheRiverThamestothewestofStaines.Untilrecently, facilities for physical activity in the parkwerelimited;itofferedapaddlingpoolfor younger children although this no longer metsafetyguidelinesassetoutbytheRoyalSocietyforthePreventionofAccidents(RoSPA).
Following engagement with the local community, new recreation facilities were provided, including a skateboard park and a spray-ground–awaterfeaturewithaseriesoftouchpadsthatwhenjumpedortroddenonreleasejetsofwater.
These facilities have dramatically increased usageofthepark,whichisnowamajorleisureattraction for the people of Spelthorne and the surrounding area. The popularity of the skate park has been demonstrated by the fact thatithashadtoberepaintedaftersixmonthsrather than the two or three years initially recommended by the contractors.
The park now aims to offer something for all groups of people from the very young to olderpeople.Inadditiontotheskateboardparkandspray-ground,itsfacilitiesalsoincludetennis,crazygolf,croquet,giantchessand draughts. This provides the resources to encourage physical activity in Spelthorne and the surrounding area, promoting healthy lifestyles and helping to address obesity and cardiovascular disease.
3.3 OBESITY AND CARDIO-VASCULAR DISEASE
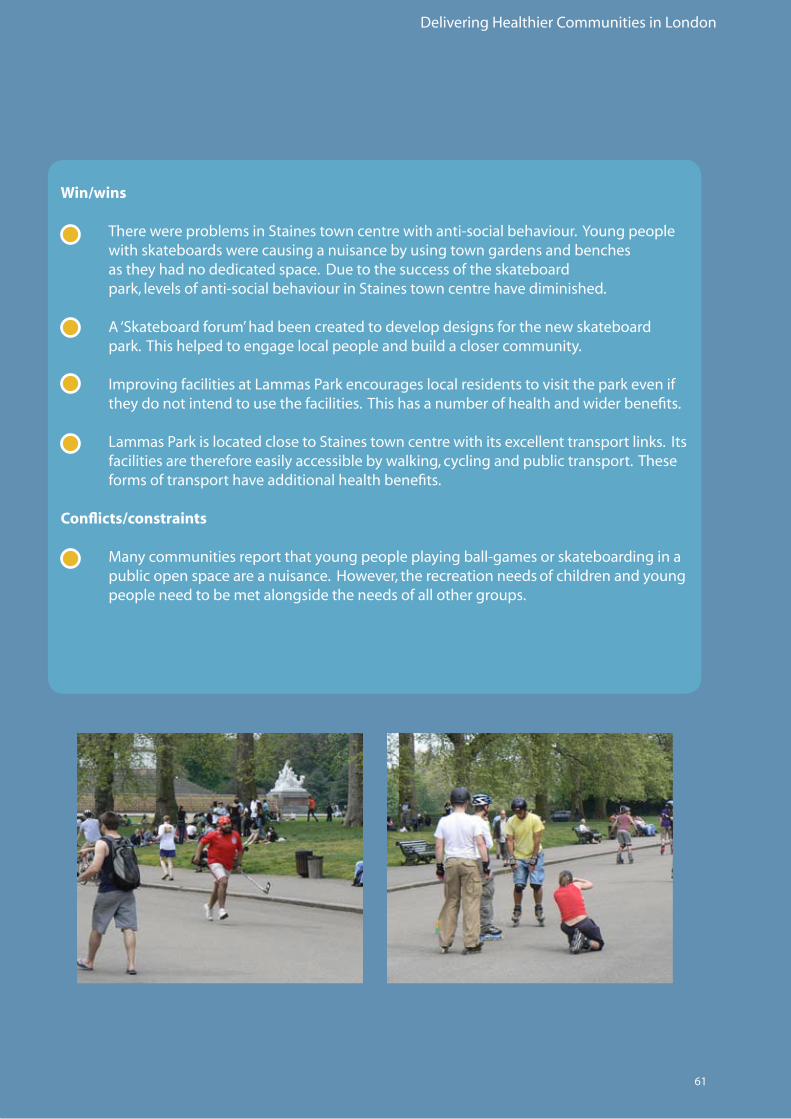
Delivering Healthier Communities in London
61
Win/wins
• TherewereproblemsinStainestowncentrewithanti-socialbehaviour.Youngpeople with skateboards were causing a nuisance by using town gardens and benches as they had no dedicated space. Due to the success of the skateboard park,levelsofanti-socialbehaviourinStainestowncentrehavediminished.
• A‘Skateboardforum’hadbeencreatedtodevelopdesignsforthenewskateboard park. This helped to engage local people and build a closer community.
• ImprovingfacilitiesatLammasParkencourageslocalresidentstovisittheparkevenif they do not intend to use the facilities. This has a number of health and wider benefits.
• LammasParkislocatedclosetoStainestowncentrewithitsexcellenttransportlinks.Its facilities are therefore easily accessible by walking, cycling and public transport. These forms of transport have additional health benefits.
Conflicts/constraints
• Manycommunitiesreportthatyoungpeopleplayingball-gamesorskateboardingina public open space are a nuisance. However, the recreation needs of children and young people need to be met alongside the needs of all other groups.
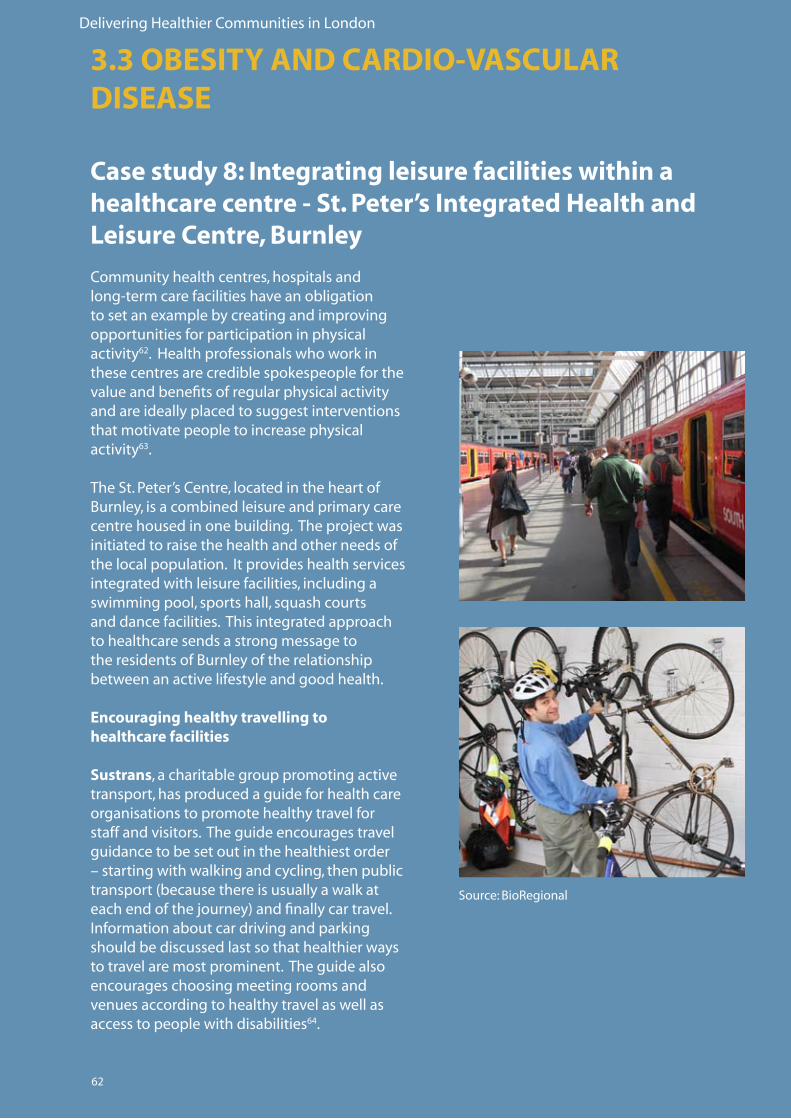
Delivering Healthier Communities in London
62
Case study 8: Integrating leisure facilities within a healthcare centre - St. Peter’s Integrated Health and Leisure Centre, Burnley
Community health centres, hospitals and long-termcarefacilitieshaveanobligationtosetanexamplebycreatingandimprovingopportunities for participation in physical activity62. Health professionals who work in these centres are credible spokespeople for the value and benefits of regular physical activity and are ideally placed to suggest interventions that motivate people to increase physical activity63.
TheSt.Peter’sCentre,locatedintheheartofBurnley, is a combined leisure and primary care centrehousedinonebuilding.Theprojectwasinitiated to raise the health and other needs of thelocalpopulation.Itprovideshealthservicesintegrated with leisure facilities, including a swimmingpool,sportshall,squashcourtsand dance facilities. This integrated approach to healthcare sends a strong message to the residents of Burnley of the relationship between an active lifestyle and good health.
Encouraging healthy travelling to healthcare facilities
Sustrans, a charitable group promoting active transport, has produced a guide for health care organisations to promote healthy travel for staff and visitors. The guide encourages travel guidance to be set out in the healthiest order –startingwithwalkingandcycling,thenpublictransport(becausethereisusuallyawalkateachendofthejourney)andfinallycartravel.Informationaboutcardrivingandparkingshould be discussed last so that healthier ways to travel are most prominent. The guide also encourages choosing meeting rooms and venues according to healthy travel as well as access to people with disabilities64.
3.3 OBESITY AND CARDIO-VASCULAR DISEASE
Source:BioRegional

Delivering Healthier Communities in London
63
Win/wins
• Encouraginganactivelifestylewillhelptoaddressobesityandcardiovasculardiseasein additiontoanumberofotherhealth-relatedissues,e.g.regaininghealthandvigour followinganillnessorinjury,andmentalhealth.
• Sportsandrecreationfacilities,alongwithcommunityfacilities,helptocontributeto the area’s social capital through interactions with other members of the community.
• Promotinghealthytraveltohealthcareorganisationsforstaffandvisitorshaswider benefits, including reducing traffic volumes and congestion, which have positive effects on respiratory disease by reducing air pollution.
See
Sect
ion
3.4
for i
nfo
rmat
ion
on
th
e ef
fect
of
hea
lth
y tr
avel
on
resp
irat
ory
dis
ease
.
Delivering Healthier Communities in London
64
Recommendations: Planning for Obesity and Cardiovascular Disease
Open and Green Space
• Createanddevelopgreenandopenspacesinnewdevelopments.• Integrateadditionalandprotectexistingopportunitiesforphysicalactivityinparksand green spaces.• Allpublicspacesshouldofferinclusiveaccess,easeofuseandbeaffordable,providing opportunities for recreation for all groups of people.• Theprovision/refurbishmentofopenspacesshouldcontributetoanetworkofopen spaces, by either improving linkages or contributing to areas of deficiency. • Planningforopenspacesinthefuturewillneedtoconsidertheimpactsofclimate change.
Management and Maintenance
• Openspacesshouldbemaintainedtoahighlevelofgeneralquality.Thequalityof these facilities is key to how regularly they are used by those in the local community.• Employparkattendantstomakeparkusersfeelsafe.
Sport and Recreation Facilities
• Plananddesignforactiveliving.Ensurethatplanningdocumentsandguidelines address the impact on residents’ ability to engage in physical activity.• Providepeoplewithclearinformationabouttheavailabilityofsafeandenjoyable opportunitiestobeactive.Designandpromoteacommunity-wideactivelivingmapof parks, paths, cycle and pedestrian routes and facilities that offer physical activity programmes.• DPDpoliciesshouldprotectandenhancefacilitiesandaccesstofacilitieswhichenable young people to play within their local neighbourhoods.• Ensuresportsfacilitiesareintegratedinnewdevelopmentsandregenerationprojects.• Providerecreationandsportfacilitiesthatareaccessibletoallandareaffordable.
Healthcare Provision
• Localplanningauthoritiesshouldcollaboratewithhealthandlong-termcarefacilities to increase opportunities for active living and appropriate physical activity for their employees and patients/residents.• Localplanningauthoritiesshouldencouragehealthprofessionalsinprimarycare settings to promote active living and to motivate inactive people to begin appropriate moderateexercise.• Promotehealthytraveltohealthcareorganisationsforstaffandvisitors.
3.3 OBESITY AND CARDIO-VASCULAR DISEASE
Delivering Healthier Communities in London
65
3.4.1 Evidence Base
There is strongevidencethatshort-termexposuretorespirableparticles(PM10
)inurbanareasincreases deaths and respiratory and cardiovascular hospital admissions. The primary source of PM
10inurbanareasismotortraffic.NitrogendioxidemodifiestheeffectofPM
10 such that daily
mortalityincreasesfurtherwhenhighconcentrationsofPM10
areincombinationwithhighlong-termconcentrationsofnitrogendioxide.Nitrogendioxideisalsoproducedbymotorvehicleexhausts.
Increasesinozonealsoleadtoincreasesindeathsandrespiratoryhospitaladmissions.Ozoneiscreatedbytheactionofsunlightonnitrogendioxideinthepresenceofvolatileorganiccompounds(VOCs).Ozonemaybetransportedoverlongdistancesgivingrisetopopulationexposureinbothurbanandruralareas.
Ithasbeenestimatedthatifactionsareputinplacetoaddressrespiratoryproblemsassociatedwithtransport,itcouldsavetheNHS£1,400-£2,500peradmissiontohospitalavoided65.
Thereisevidencethatresidentsaremorelikelytoreportexacerbationsofasthma,coughsandrespiratoryinfectionsfollowingexposuretoflooding.
Spatial planning can minimise the risks of flooding through design and careful location of vulnerable land-uses.
Further information on the evidence base underpinning the links between respiratory disease and spatial planning is provided in Appendix 3.4.
3.4 RESPIRATORY DISEASE
Spatial planning can modify the total volume of traffic as well as congestion of traffic at certain locations. This may have a
preventative effect on population cardio-respiratory disease by reducing air pollution.
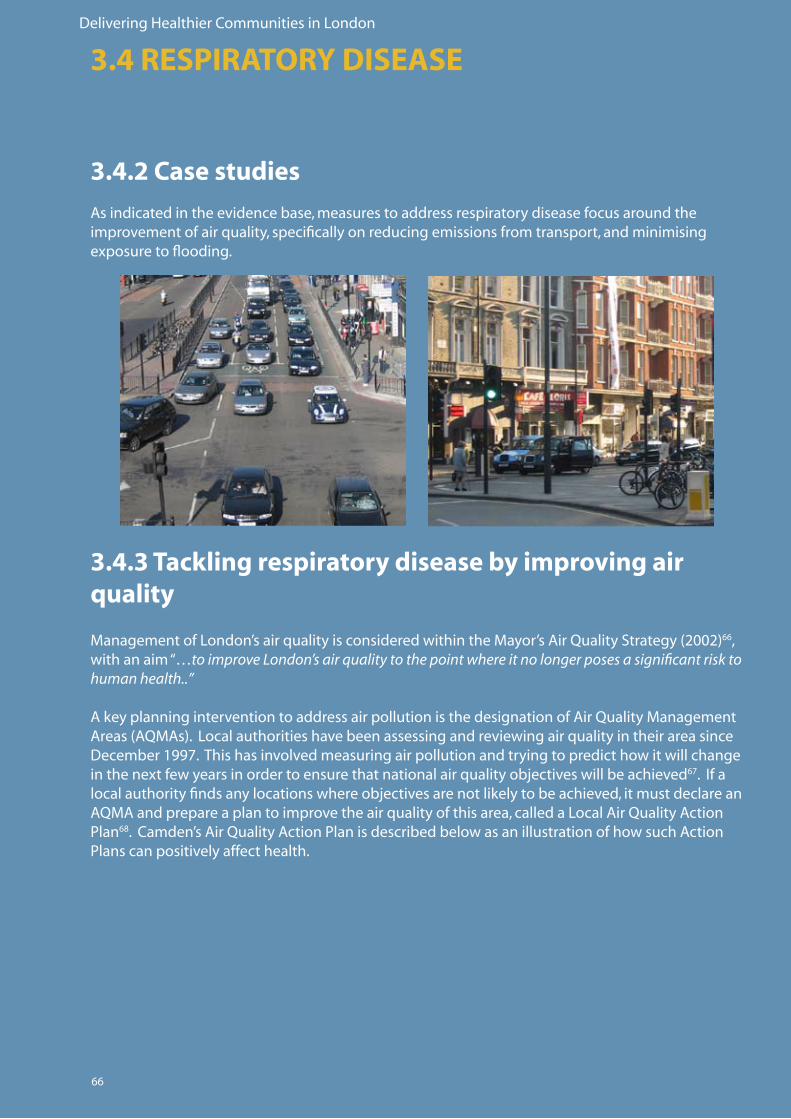
Delivering Healthier Communities in London
66
3.4.2 Case studies
Asindicatedintheevidencebase,measurestoaddressrespiratorydiseasefocusaroundtheimprovementofairquality,specificallyonreducingemissionsfromtransport,andminimisingexposuretoflooding.
3.4.3 Tackling respiratory disease by improving air quality
ManagementofLondon’sairqualityisconsideredwithintheMayor’sAirQualityStrategy(2002)66, with an aim “…to improve London’s air quality to the point where it no longer poses a significant risk to human health..”
AkeyplanninginterventiontoaddressairpollutionisthedesignationofAirQualityManagementAreas(AQMAs).LocalauthoritieshavebeenassessingandreviewingairqualityintheirareasinceDecember 1997. This has involved measuring air pollution and trying to predict how it will change inthenextfewyearsinordertoensurethatnationalairqualityobjectiveswillbeachieved67.Ifalocalauthorityfindsanylocationswhereobjectivesarenotlikelytobeachieved,itmustdeclareanAQMAandprepareaplantoimprovetheairqualityofthisarea,calledaLocalAirQualityActionPlan68.Camden’sAirQualityActionPlanisdescribedbelowasanillustrationofhowsuchActionPlanscanpositivelyaffecthealth.
3.4 RESPIRATORY DISEASE
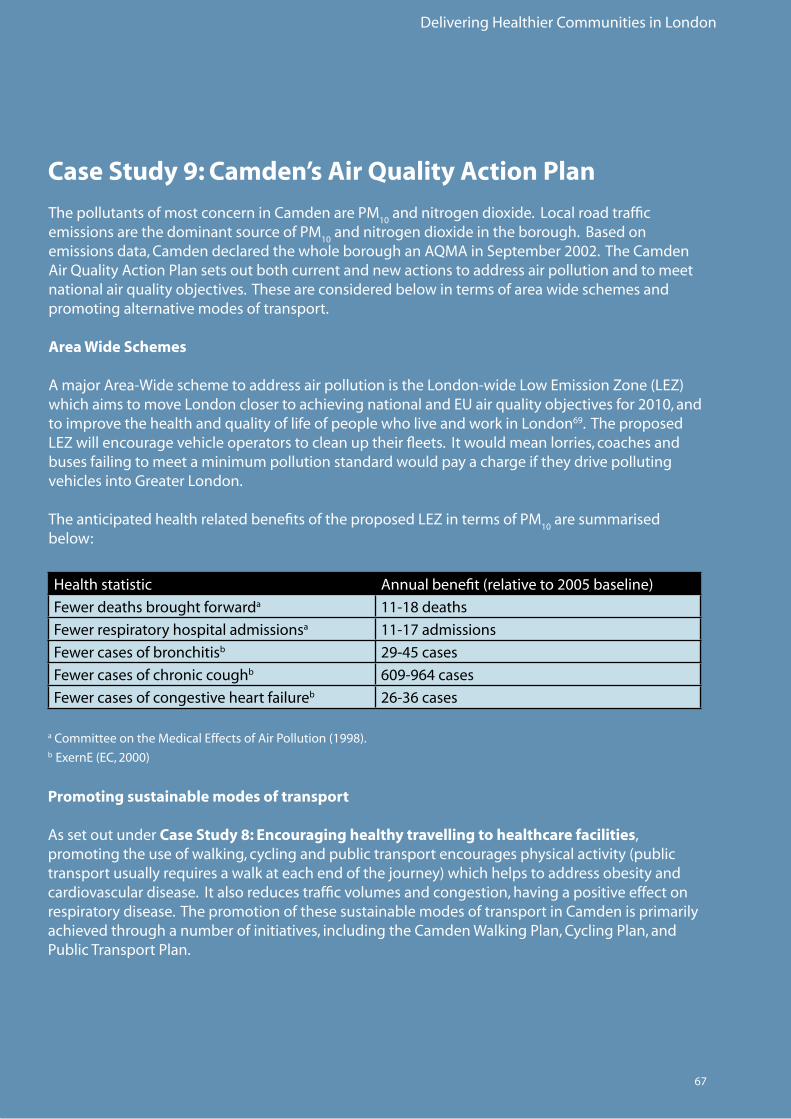
Delivering Healthier Communities in London
67
Case Study 9: Camden’s Air Quality Action Plan
ThepollutantsofmostconcerninCamdenarePM10
andnitrogendioxide.LocalroadtrafficemissionsarethedominantsourceofPM
10andnitrogendioxideintheborough.Basedon
emissionsdata,CamdendeclaredthewholeboroughanAQMAinSeptember2002.TheCamdenAirQualityActionPlansetsoutbothcurrentandnewactionstoaddressairpollutionandtomeetnationalairqualityobjectives.Theseareconsideredbelowintermsofareawideschemesandpromoting alternative modes of transport.
Area Wide Schemes
AmajorArea-WideschemetoaddressairpollutionistheLondon-wideLowEmissionZone(LEZ)whichaimstomoveLondonclosertoachievingnationalandEUairqualityobjectivesfor2010,andtoimprovethehealthandqualityoflifeofpeoplewholiveandworkinLondon69. The proposed LEZwillencouragevehicleoperatorstocleanuptheirfleets.Itwouldmeanlorries,coachesandbuses failing to meet a minimum pollution standard would pay a charge if they drive polluting vehiclesintoGreaterLondon.
TheanticipatedhealthrelatedbenefitsoftheproposedLEZintermsofPM10
are summarised below:
Promoting sustainable modes of transport
AssetoutunderCase Study 8: Encouraging healthy travelling to healthcare facilities, promotingtheuseofwalking,cyclingandpublictransportencouragesphysicalactivity(publictransportusuallyrequiresawalkateachendofthejourney)whichhelpstoaddressobesityandcardiovasculardisease.Italsoreducestrafficvolumesandcongestion,havingapositiveeffectonrespiratory disease. The promotion of these sustainable modes of transport in Camden is primarily achievedthroughanumberofinitiatives,includingtheCamdenWalkingPlan,CyclingPlan,andPublicTransportPlan.
Health statistic Annualbenefit(relativeto2005baseline)
Fewer deaths brought forwarda 11-18deaths
Fewer respiratory hospital admissionsa 11-17admissions
Fewer cases of bronchitisb 29-45cases
Fewer cases of chronic coughb 609-964cases
Fewer cases of congestive heart failureb 26-36cases
aCommitteeontheMedicalEffectsofAirPollution(1998).b ExernE(EC,2000)
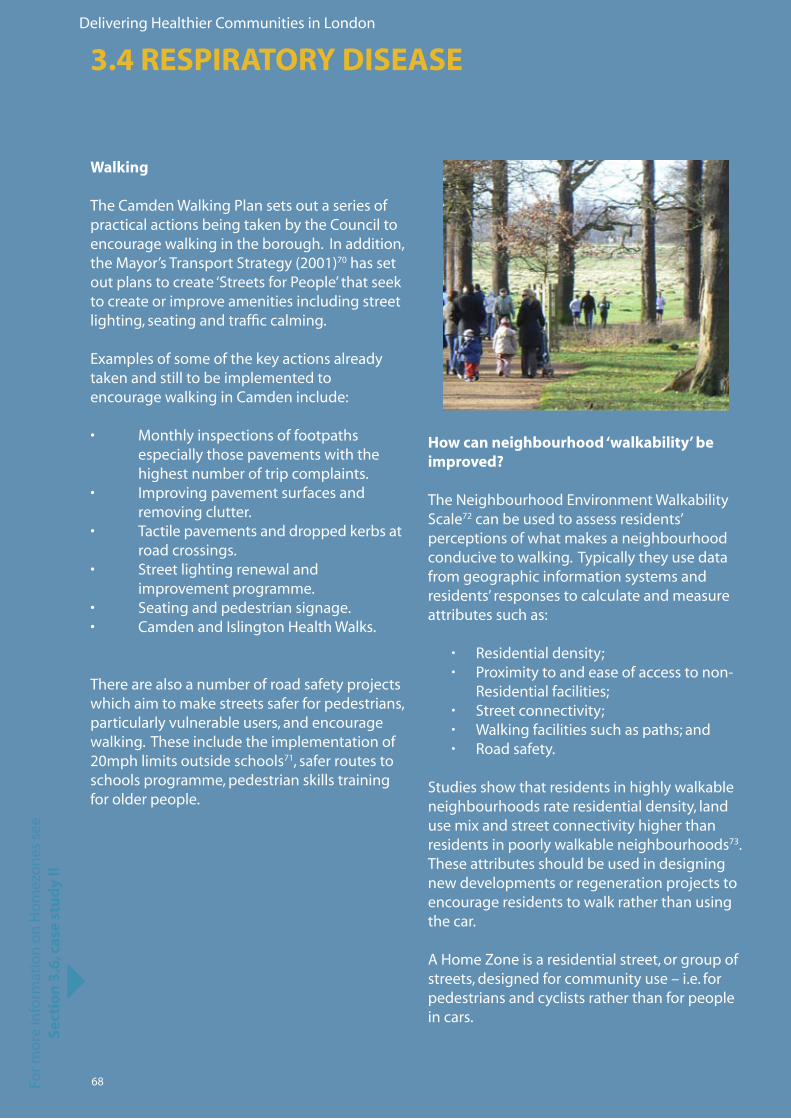
Delivering Healthier Communities in London
68
Walking
TheCamdenWalkingPlansetsoutaseriesofpractical actions being taken by the Council to encouragewalkingintheborough.Inaddition,theMayor’sTransportStrategy(2001)70 has set outplanstocreate‘StreetsforPeople’thatseekto create or improve amenities including street lighting, seating and traffic calming.
Examplesofsomeofthekeyactionsalreadytaken and still to be implemented to encourage walking in Camden include:
• Monthlyinspectionsoffootpaths especially those pavements with the highest number of trip complaints.• Improvingpavementsurfacesand removing clutter.• Tactilepavementsanddroppedkerbsat road crossings.• Streetlightingrenewaland improvement programme.• Seatingandpedestriansignage.• CamdenandIslingtonHealthWalks.
Therearealsoanumberofroadsafetyprojectswhich aim to make streets safer for pedestrians, particularly vulnerable users, and encourage walking. These include the implementation of 20mphlimitsoutsideschools71, safer routes to schools programme, pedestrian skills training for older people.
How can neighbourhood ‘walkability’ be improved?
TheNeighbourhoodEnvironmentWalkabilityScale72 can be used to assess residents’ perceptions of what makes a neighbourhood conducive to walking. Typically they use data from geographic information systems and residents’ responses to calculate and measure attributes such as:
Residentialdensity; Proximitytoandeaseofaccesstonon- Residentialfacilities; Streetconnectivity; Walkingfacilitiessuchaspaths;and Roadsafety.
Studies show that residents in highly walkable neighbourhoods rate residential density, land usemixandstreetconnectivityhigherthanresidents in poorly walkable neighbourhoods73. These attributes should be used in designing newdevelopmentsorregenerationprojectstoencourage residents to walk rather than using the car.
AHomeZoneisaresidentialstreet,orgroupofstreets,designedforcommunityuse–i.e.forpedestrians and cyclists rather than for people in cars.
3.4 RESPIRATORY DISEASEFo
r mo
re in
form
atio
n o
n H
om
ezo
nes
see
Se
ctio
n 3
.6, c
ase
stu
dy
II
.
.
.
.
.

Delivering Healthier Communities in London
69
Cycling
TheCamdenCyclingPlanrecognisesthemanybarrierstocycling,includingfearofinjury,fearoftheftandlackofgoodfacilities.TheCamdenCyclingPlan,whichstemsfromtheNationalCyclingStrategy,aimstoovercomesuchbarriers.ThePlanaimstogosomewaytowardsmeetingoneofthekeytargetsof10%ofalljourneysinLondontobemadebybicycleby2012.ProposalsinthePlanincludenewcycleroutesandlanes,advancedstoplinestohelpcycliststhroughsignalledjunctions,signalledcontrolcyclecrossings,andmorecycleparkingstands.
Public transport
TheLocalAirQualityActionPlanrecognisestheroleofpublictransportinreducingroadtraffic.TheLondonBoroughofCamdenandTransportforLondon(TfL)plantomakepublictransportmoreefficient,reliableandquicker.TheMayor’sTransportStrategyalsosetsoutplanstotackleLondon’stransportproblems.TheMayor’scoreprinciplesaretoinvestinincreasingsafety,reliability, capacity and comfort and to improve the infrastructure of public transport.
Win/wins
• Inadditiontoreducingtrafficvolumesandcongestion(therebyimprovingairquality andreducingrespiratorydisease),encouragingwalkingandcyclingalsohelpsto promote active lifestyles, positively addressing obesity and cardiovascular disease.
Delivering Healthier Communities in London
70
Minimising exposure to flooding
Minimisingexposuretofloodingcanhelptoreducetheriskofrespiratoryinfections.
Recommendations: Planning for Respiratory Disease
Road Traffic Emissions
• EnsureLDFsencourageandpromotewalkingandcyclingratherthanrelianceonthe privatecarforshortjourneys.• Addressexistingbarrierstoordeficienciesinprovisionforwalkingandcycling.• Promoteimprovementstowalkingandcyclingfacilitieswithinandaroundnew developments.• Increasewalkingandcyclingthroughdevelopinggreen/activeworkplaceandschool travel plans.• Providehigh-quality,segregatedpedestrianandcyclepaths,whicharedirectand providegoodconnectionstotheexistingpatternsofstreets,andtobusstops,stations andlocalamenities,aspartofmajornewdevelopments.
Flooding
Refertorecommendationssetoutunder Recommendations: Planning for Mental Health.
For m
ore
info
rmat
ion
on
min
imis
ing
ex
po
sure
tofl
oo
din
gs
eeS
ecti
on
3.2
.73.4 RESPIRATORY DISEASE
Delivering Healthier Communities in London
71
3.5.1 Evidence Base
Urbanareasgeneratea‘heatisland’effectandLondoncanbeupto8%warmerthanruralareasandnighttemperaturesinthecitycanremainabove19°C.Mortalityincreasesinhotweatherandelderlypeopleareparticularlyvulnerable;inthe1995heatwaveinLondontherewasa16%excessindeathsforallagesandthoseagedover85hada20%excessmortality.Climatechangewillfurtherexacerbatethisproblem.
InEnglandapproximatelyathirdofexcessdeathsinwinter(18excessdeathsper100,000adults)arerelatedtolowindoortemperaturesand90%oftheseoccurinthosemorethan65yearsofage.ThreethousandpensionersdiedinLondoninwinter2006ofcoldrelatedillnesses74.
Poorhomeinsulationandfuelpovertycontributetotheproblem.
Spatial Planning can ensure that measures are incorporated into
building design to improve insulation.
Furtherinformationontheevidencebaseunderpinningthelinksbetweenexcesswinter(cold)andsummer(heat)mortalityandspatialplanningisprovidedinAppendix 3.5.
3.5 EXCESS WINTER (COLD) AND SUMMER (HEAT) MORTALITY
Spatial Planning can ensure that measures are incorporated into the layout of a development to reduce the heat island effect.

Delivering Healthier Communities in London
72
3.5.3 Excess Summer Heat Mortality
There is strong evidence linking the number of deaths and likelihood of deaths with hot weather, and elderly people are particularly vulnerable. This is a key issue in London due to the predicted impact of climate change and ‘heat island effect’. The Consultation Draft Supplementary PPS on Climate Change75 recognises that the urban heat island effect may be more pronounced in those in low income households as they are more likely to live in high density social housing where ventilation cannot be easily retrofitted. This is also notable within the elderly community who have fixed incomes and are less able to pay for adaptation measures.
PPS 176 Sustainable Development, PPS 1177 Regional Spatial Strategies and PPS 1278 Local Development Frameworks all require that development is located to take account of climate change impacts.
PPS 379 Housing recommends that “…Local Planning Authorities should encourage applicants to bring forward sustainable and environmentally friendly new housing developments, including affordable housing developments, and in doing so should reflect the approach set out in the forthcoming PPS on climate change…”
The London Plan Further Alterations includes recommendations for strengthened climate change policies. For example, Policy 4A.2i Sustainable Design and Construction suggests that DPDs should include policies which incorporate measures to “.. manage overheating..”.
London Plan Policy 4A.5iv specifically relates to overheating and recommends encouraging development that “…avoids internal overheating and excessive heat generation and contributes to the prevention of further over-heating especially where the urban heat island is most intense…”
It is recognised that dealing with excessive summer heat is largely a design issue, although DPD policies can be worded to include for adaptation measures. There are a number of interventions which could be included in new developments, both within site layout and at building scale. It is not the intention to illustrate all of these, as more detailed good practice examples are provided elsewhere, such as:
• Energy Efficient Best Practice in Housing: Reducing Overheating - a designer’s guide. CE129, 2005.
• Adapting to Climate Change: A good practice guide for sustainable communities.
• Adapting to Climate Change: A Checklist for Development.
3.5.2 Case StudiesAs indicated in the evidence base above, measures to effectively address excess summer (heat) mortality relate to the inclusion of measures in development layout to address overheating. Measures incorporated into building design to improve insulation can tackle excess winter (cold) mortality.
See
ww
w.la
nd
use
.co.
uk/
new
s
13
13
See
ww
w.c
limat
eso
uth
east
.org
.u
k/p
ub
licat
ion
s_re
po
rts.
ph
p
14
See
ww
w.e
ner
gys
avin
gtr
ust
.org
.uk/
ho
usi
ng
bu
ildin
gs/
pu
blic
atio
ns
12
3.5 EXCESS WINTER (COLD) AND SUMMER (HEAT) MORTALITY
12
14

Delivering Healthier Communities in London
73
Site Layout
Green spaces
The inclusion of green spaces within site layout, provides an opportunity for people to sit outsideduringwarmerweather(particularlyiftreesareprovidedforshading–deciduousspecieswillalsoallowsolargaininwinter)andhelp reduce local heat island effects. Building Orientation
When considering building layout and orientation the opportunity for natural ventilationshouldbemaximised.Forexamplethe top levels of buildings may be set back from street level to encourage natural ventilation. Buildings may also be orientated tofaceprevailingwindsandhencemaximisenatural ventilation.
Building Scale
Green Roofs
Greenroofs,canbeplantedwithheat-absorbing species and provide an opportunity to reduce the effect of the urban heat island effect. These are of particular value in city centre locations where space is scarce and buildingstendtobehigh-riseandhighdensity(thesearealsothehottestpartsofthecity). Thermal Mass Thermal mass can be used to store heat temporarilye.g.instructuresorspaces(suchasconstructionmaterials)andpreventinternalareasheatingup.Effectiveventilationisrequiredtoreleasethisstoredheatatnight.
The type of thermal mass will depend on the expecteddevelopmentuseandoccupancy.
See
ww
w.li
vin
gro
ofs
.org
1515
Source:MarcusLyon
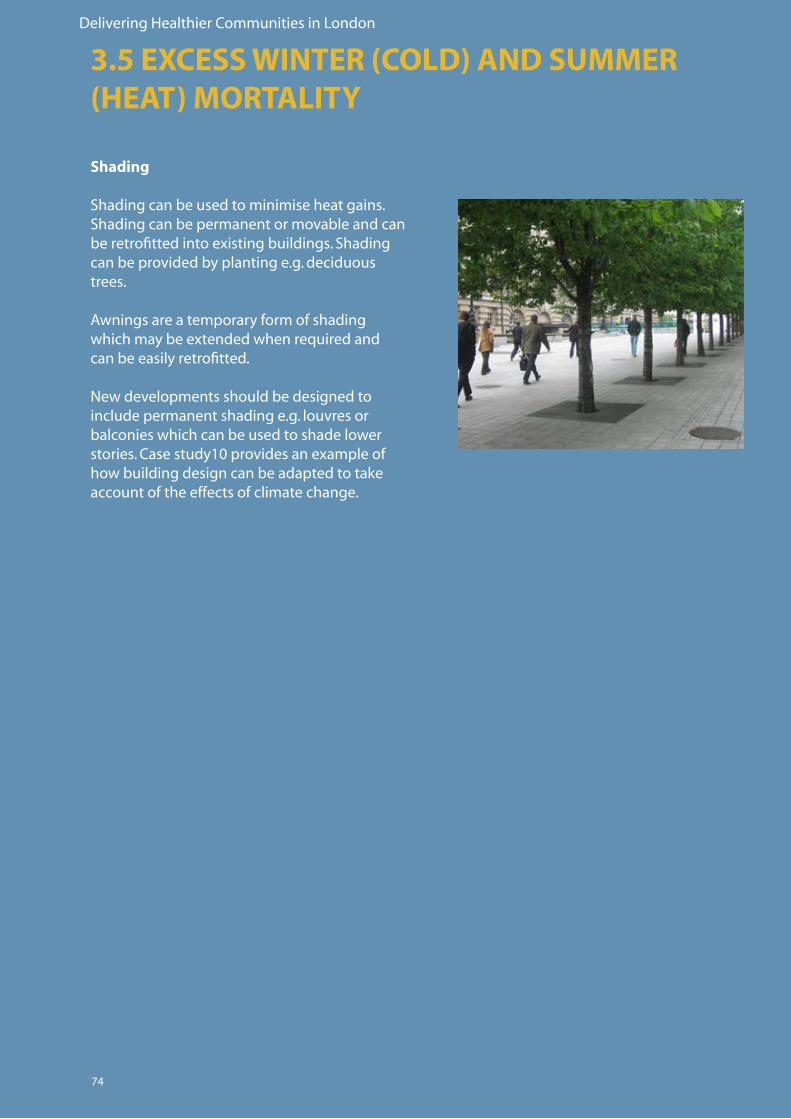
Delivering Healthier Communities in London
74
Shading
Shading can be used to minimise heat gains. Shading can be permanent or movable and can beretrofittedintoexistingbuildings.Shadingcan be provided by planting e.g. deciduous trees.
Awningsareatemporaryformofshadingwhichmaybeextendedwhenrequiredandcan be easily retrofitted.
Newdevelopmentsshouldbedesignedtoinclude permanent shading e.g. louvres or balconies which can be used to shade lower stories.Casestudy10providesanexampleofhow building design can be adapted to take account of the effects of climate change.
3.5 EXCESS WINTER (COLD) AND SUMMER (HEAT) MORTALITY
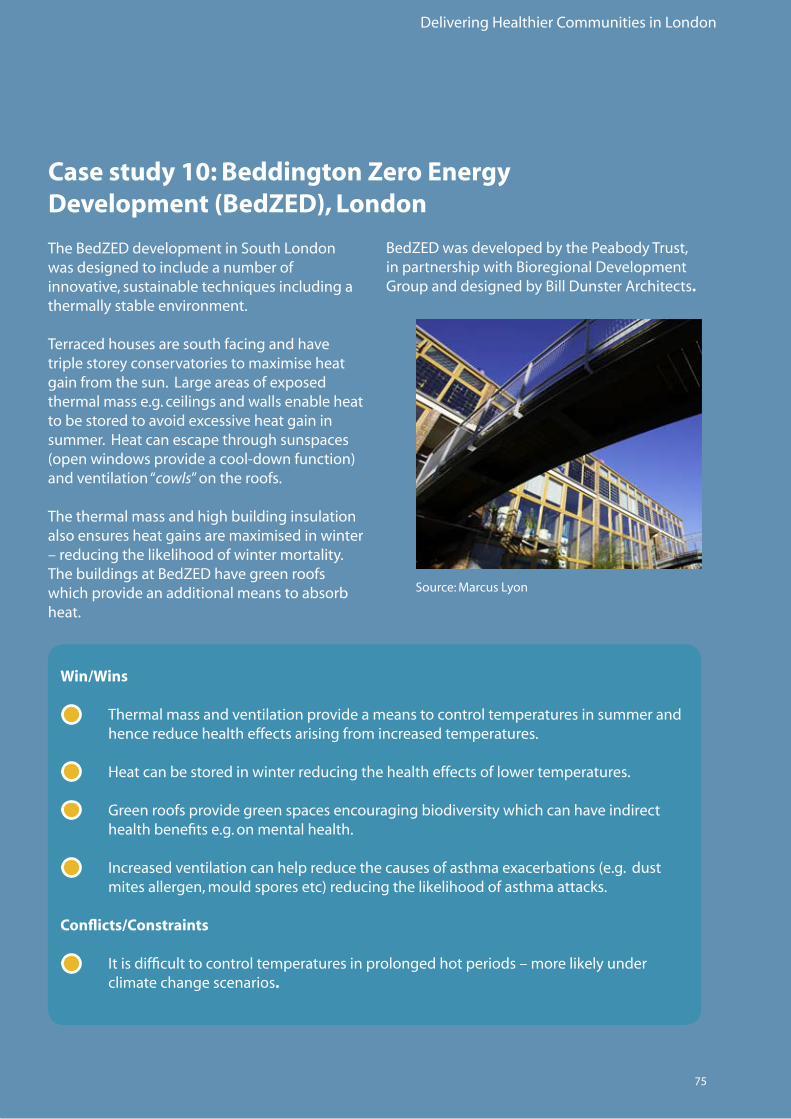
Delivering Healthier Communities in London
75
Case study 10: Beddington Zero Energy Development (BedZED), London
TheBedZEDdevelopmentinSouthLondonwas designed to include a number of innovative,sustainabletechniquesincludingathermally stable environment.
Terraced houses are south facing and have triplestoreyconservatoriestomaximiseheatgainfromthesun.Largeareasofexposedthermal mass e.g. ceilings and walls enable heat tobestoredtoavoidexcessiveheatgaininsummer. Heat can escape through sunspaces (openwindowsprovideacool-downfunction)and ventilation “cowls” on the roofs.
The thermal mass and high building insulation alsoensuresheatgainsaremaximisedinwinter–reducingthelikelihoodofwintermortality.ThebuildingsatBedZEDhavegreenroofswhich provide an additional means to absorb heat.
Source:MarcusLyon
Win/Wins
• Thermal mass and ventilation provide a means to control temperatures in summer and hence reduce health effects arising from increased temperatures.
• Heatcanbestoredinwinterreducingthehealtheffectsoflowertemperatures.
• Greenroofsprovidegreenspacesencouragingbiodiversitywhichcanhaveindirect health benefits e.g. on mental health.
• Increasedventilationcanhelpreducethecausesofasthmaexacerbations(e.g.dust mitesallergen,mouldsporesetc)reducingthelikelihoodofasthmaattacks. Conflicts/Constraints
• Itisdifficulttocontroltemperaturesinprolongedhotperiods–morelikelyunder climate change scenarios.
BedZEDwasdevelopedbythePeabodyTrust,in partnership with Bioregional Development GroupanddesignedbyBillDunsterArchitects.

Delivering Healthier Communities in London
76
3.5 EXCESS WINTER (COLD) AND SUMMER (HEAT) MORTALITY
The need to Retrofit.
Asdescribedearlier,theurbanheatislandeffectmaybemorepronouncedinlowincomehouseholds, particularly high density, social housing where ventilation and other adaptation measures cannot be easily retrofitted.
Totacklethehealthimpactsandinequalitiesarisingfromhighsummertemperatures,spatialplanners should keep abreast of evolving research into retofitting such as that recently commissionedbytheLondonClimateChangePartnership(LCCP).
Delivering Healthier Communities in London
77
3.5.4 Excess Winter (Cold) Mortality
There is strong evidence in the literature linking winter mortality and home insulation, with the elderly being particularly vulnerable.
Reductionsinwintermortalitycanbeachievedinnewdevelopmentsandregenerationschemesthrough inclusion of some of the interventions described above e.g. high thermal mass in buildings(tostoreheatinwinter)andensuringbuildingsareorientatedtomaximisesolargain.Buildings should be well insulated to ensure they do not lose heat in winter.
Winterdeaths(causedbylowerwintertemperaturesinexistinghomes)arebeingpartlyaddressedthroughtheGovernment’sWarmFrontInitiative.ThisschemeaimstoendFuelPovertybyprovidinggrantswhichofferapackageofinsulationandheating.TheMayoralsosupportstheWinter Warmth Campaign providing advice to Londoners about how to stay warm in winter.
LocalAreaAgreements(LAAs)alsoprovideameanstoaddressfuelpoverty.Forexample,Swindon’sLAApartnershiphassetatargetintheHealthierCommunitiesandOlderPeopleblockto increase energy efficiency in private sector and social housing occupied by vulnerable people. ThetargetwillbedeliveredbytheLocalAffordableWarmthPartnership.
Recommendations: Planning for Excess winter (cold) and summer (heat) mortality.
• PlannersshouldworkwithPCTstomonitormortalityandillnessfromexcesssummer (heat)andexcesswinter(cold)withintheboroughonanannualbasis.Thisshouldbe usedtoidentifywhichneighbourhoodsandhousingschemesrequire retrofitting measures or regeneration.
Excess summer (heat) mortality
• DPDpoliciesshouldpromotenewdevelopmentsandregenerationschemeswhich include measures to adapt to overheating.• Newdevelopments/regenerationschemesshouldbeadaptedaccordingtotheir specific location e.g. green roofs can be provided in city centres where space is limited. • Plannersanddesignersshouldhaveregardtoexistingstandardse.g.Building Regulations,BREEAMandCodeforSustainableHomes.• Plannersanddesignersshouldbeawareofpotentialconflictsarisingfromadaptation measurese.g.excessiveplantingtoprovidesummershademayincreasefearofcrime andcreateanxiety.• Retrofittingfortheeffectsofclimatechangeisessentialtotacklehealthimpactsand inequalitiesinexistingdevelopments.PlannersshouldrecognisethiswithintheirDPDs and keep abreast of evolving research.
See
htt
p:/
/ww
w.d
efra
.go
v.u
k/en
viro
nm
ent/
clim
atec
han
ge/
uk/
ho
use
ho
ld/f
uel
po
vert
y/w
arm
fro
nt/
ind
ex.h
tm
16
16
See
Sect
ion
2W
hy
Plan
forH
ealt
h?

Delivering Healthier Communities in London
78
Injuriesaccountfor3%ofannualdeathsintheUK.Injuryisthegreatestthreattolifeinchildrenandyoungpeopleandroadtrafficaccidents(RTA)aretheleadingcauseofdeathwhereasfallscause4.1%ofinjurydeathsinolderagegroups.Increasedvehiclespeedsresultingfromdecreasedtrafficcongestion(toaddressairpollutionissues)mayincreaseRoadTrafficAccident(RTA)injuries.RTAsshowsubstantialinequalitiesbetweengroupsofdifferingsocialclass.
Annually,injuriesleadto720,000admissionstohospitaland6millionemergencydepartmentvisits.
TwelvemonthdatafromtheDepartmentforTransport(DFT)80fortheMetropolitanPoliceForceareareportedatotalof29,775roadcasualtiesin2006(ofwhich226werefatalities).ThecostburdenofeveryfatalityinLondonis£1.4million.
Thereisgoodevidencethatarea-widetrafficcalmingreduceschildpedestrianinjuryratesandalsoreducesthedifferentialinratesbasedoninequalitiesinsocialgroups.
Thereisevidencethatbypassesdecreaseaccidentratesbuttheevidencefornewmajorurbanroads and their effect on local road networks and accidents is less strong.
3.6.1 Evidence Base
Injuriesinthehomearecommonbuttheevidenceofeffectsofenvironmentaladaptation in the home is weak.
Injuryratesassociatedwithfloodingareoftheorderof0.4%.
3.6 INJURIES
Spatial planning can address road safety through the introduction of traffic calming.
Spatial planning can minimise the risks of flooding through design and careful location of vulnerable land-uses.
Furtherinformationontheevidencebaseunderpinningthelinksbetweeninjuriesandspatialplanning is provided in Appendix 3.6.

Delivering Healthier Communities in London
79
3.6.3 Road Layout and Traffic
Asnotedabove,thereisstrong evidence demonstrating the use of traffic calming measures as a meanstoreduceroadtrafficdeathsandinjuries.Trafficcalmingaimstoreducetrafficspeedandvolumesandhenceroadtrafficrelatedinjuries.
Traffic calming measures take a variety of forms such as:
• Verticalandhorizontalshiftsintraffic(e.g.roadhumps,speedcushions,raised crosswalks,raisedsectionsofroad,chicanes,mini-roundabouts,roadnarrowing, channelisedsliplanesetc).
• Opticalmeasures(chevronroadsigns,roadsurfacetreatment,reducedhorizontal visibility,audiblemeasuressuchasrumbleareasandalterationstoroadlighting).
• Redistributionoftrafficoralterationtoroadhierarchy(e.g.permanentortemporary blockingofroad,diagonalblocks,gateways,creationofone-waystreets, re-introductionoftwo-waystreets,four-waystops).
• Changestoroadenvironment(increasedvegetationalongroad,introductionofstreet furniture).
3.6.2 Case Studies
Spatialplanningcanaddressroadsafetythroughtheintroductionoftrafficcalming(thisisillustratedinCaseStudy11below).Spatialplanningcanpreventfloodrisk,andthedesignoffloodresilientbuildingscanreducethelikelihoodofinjuriesarisingfromflooding.
Delivering Healthier Communities in London
80
Proposals took time to agree and implement (up to five years from establishment of the Home Zone) and included:
• IntroductionofaControlledParkingZone(CPZ)(2001).• Closureofa‘rat-run’atHastingsRoad(2002).• Changedroadlayouttoincorporate30-degreeparkingbays(2003).• SpeedbumpsinHastingsRoad(2003).• Roadmarkingstocreatechicanes(2003).• Introductionofa20mphzone(2003).• CreationofaplayspaceinArdenRoad(2003).
3.6 INJURIES S
ee w
ww
.five
road
sfo
rum
.org
/ho
me.
htm
18
Case study 11: Home Zone West Ealing, London
AHomeZoneisaresidentialstreet,orgroupofstreets,designedforcommunityuse–i.e.forpedestriansandcyclistsratherthanforpeopleincars.ItisbasedontheDutch‘woonerf’concept, where pedestrians and cyclist have legal priority over motorists.
HomeZonescanbeachievedbythemodificationofexistingstreets,orcanbedesignedaspartofanewhousingdevelopment.ThereiscurrentlynospecificlegislationsupportingUKHomeZones.However,theUKDfTprovidedfundingfor59LocalAuthoritiesaswellasninepilotstudiestopromote Home Zones.
OneofthepilotstudiesincludedaschemeinWestEaling,Londoncomprisingfiveroads:HastingsRoad,HartingdonRoad,BroughtonRoad,DenmarkRoadandArdenRoad.
Theareabecamecongestedanddangerous,withtheroadsusedasshort-cutstoavoidtraffic-lightsontheA4020UxbridgeRoadandnon-residentsparkinginthestreets.RTAswerealsoarisk–achildresidentwashitandinjuredbyanon-residentcar. Residentsfromeachoftheroadsformedagroup,theFiveRoadsForum,toencourageEalingCouncil to pilot a Home Zone in the area. The resident group was proactive, appointing a Chairperson, attending regular meetings, publishing a newsletter and designing and maintaining awebpage.ResidentsregularlyliaisedwiththeprojectofficerfromEalingCouncilandprovidedinput into plans for the neighbourhood.
See
ww
w.h
om
ezo
nes
.org
17
Therehavebeennofollow-upstudiestomeasurethereductioninRTA’s,orhowperceptionsofroadsafetyhavechanged.However,discussionswiththeChairpersonoftheFiveRoadsForum indicated that generally the area is a much nicer place to live in, people considered their qualityoflifetohaveimprovedandtheprocessengenderedasenseofcommunityspiritandneighbourliness.
18
17
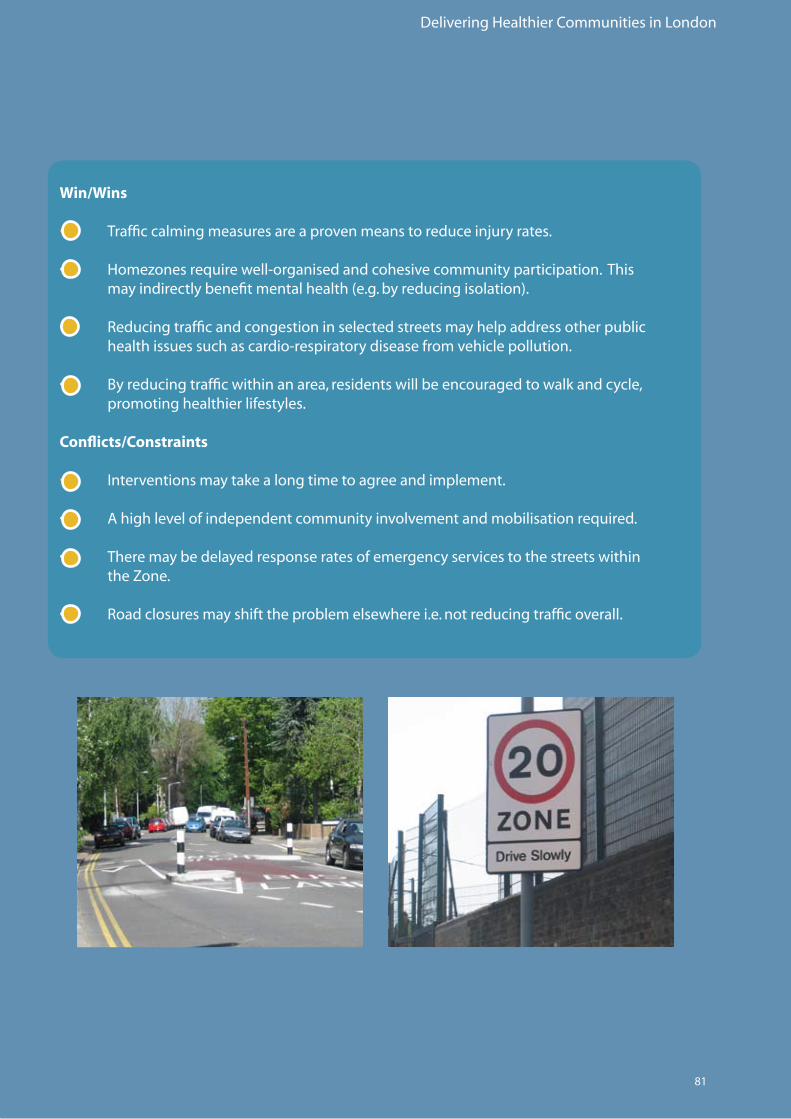
Delivering Healthier Communities in London
81
Win/Wins
• Trafficcalmingmeasuresareaprovenmeanstoreduceinjuryrates.
• Homezonesrequirewell-organisedandcohesivecommunityparticipation.This mayindirectlybenefitmentalhealth(e.g.byreducingisolation).
• Reducingtrafficandcongestioninselectedstreetsmayhelpaddressotherpublic healthissuessuchascardio-respiratorydiseasefromvehiclepollution.
• Byreducingtrafficwithinanarea,residentswillbeencouragedtowalkandcycle, promoting healthier lifestyles.
Conflicts/Constraints
• Interventionsmaytakealongtimetoagreeandimplement.
• Ahighlevelofindependentcommunityinvolvementandmobilisationrequired.
• Theremaybedelayedresponseratesofemergencyservicestothestreetswithin the Zone.
• Roadclosuresmayshifttheproblemelsewherei.e.notreducingtrafficoverall.
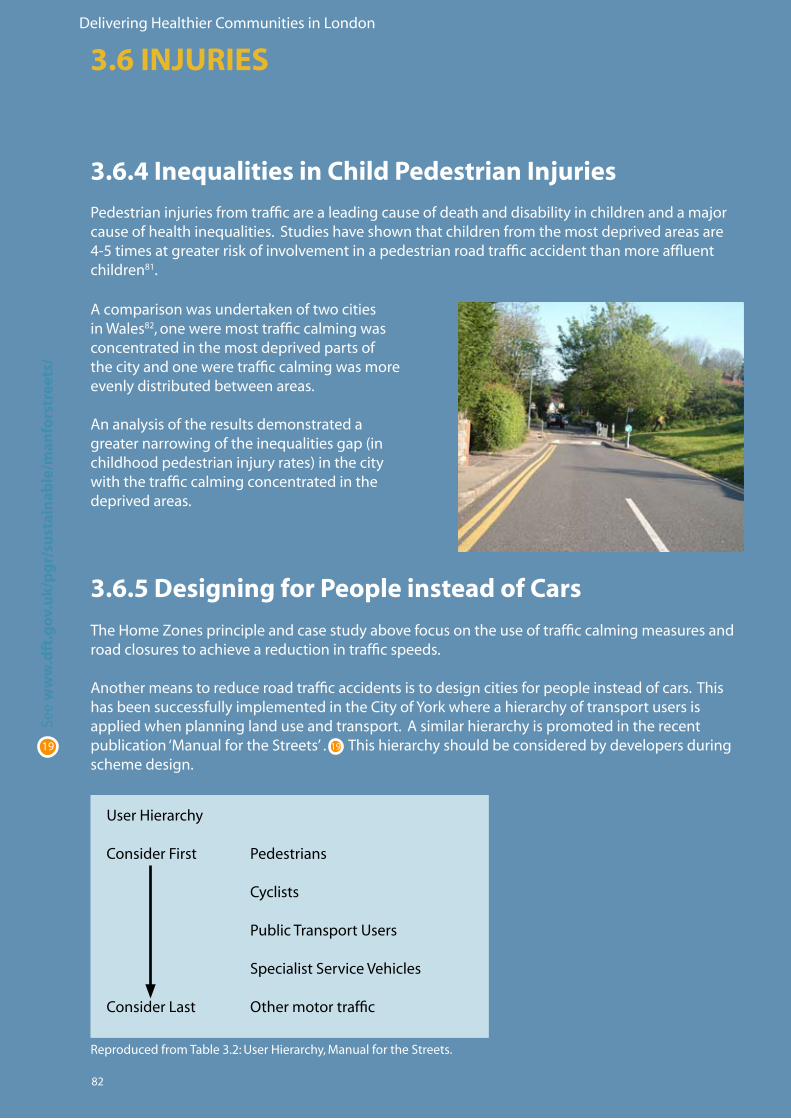
Delivering Healthier Communities in London
82
3.6.4 Inequalities in Child Pedestrian Injuries
Pedestrianinjuriesfromtrafficarealeadingcauseofdeathanddisabilityinchildrenandamajorcauseofhealthinequalities.Studieshaveshownthatchildrenfromthemostdeprivedareasare4-5timesatgreaterriskofinvolvementinapedestrianroadtrafficaccidentthanmoreaffluentchildren81.
3.6 INJURIES
3.6.5 Designing for People instead of Cars
The Home Zones principle and case study above focus on the use of traffic calming measures and road closures to achieve a reduction in traffic speeds.
Anothermeanstoreduceroadtrafficaccidentsistodesigncitiesforpeopleinsteadofcars.ThishasbeensuccessfullyimplementedintheCityofYorkwhereahierarchyoftransportusersisappliedwhenplanninglanduseandtransport.Asimilarhierarchyispromotedintherecentpublication‘ManualfortheStreets’.Thishierarchyshouldbeconsideredbydevelopersduringscheme design.
Acomparisonwasundertakenoftwocitiesin Wales82, one were most traffic calming was concentrated in the most deprived parts of the city and one were traffic calming was more evenly distributed between areas.
Ananalysisoftheresultsdemonstratedagreaternarrowingoftheinequalitiesgap(inchildhoodpedestrianinjuryrates)inthecitywith the traffic calming concentrated in the deprived areas.
ReproducedfromTable3.2:UserHierarchy,ManualfortheStreets.
See
ww
w.d
ft.g
ov.
uk/
pg
r/su
stai
nab
le/m
anfo
rstr
eets
/
19 19
UserHierarchy
ConsiderFirst Pedestrians Cyclists
PublicTransportUsers
Specialist Service Vehicles
ConsiderLast Othermotortraffic
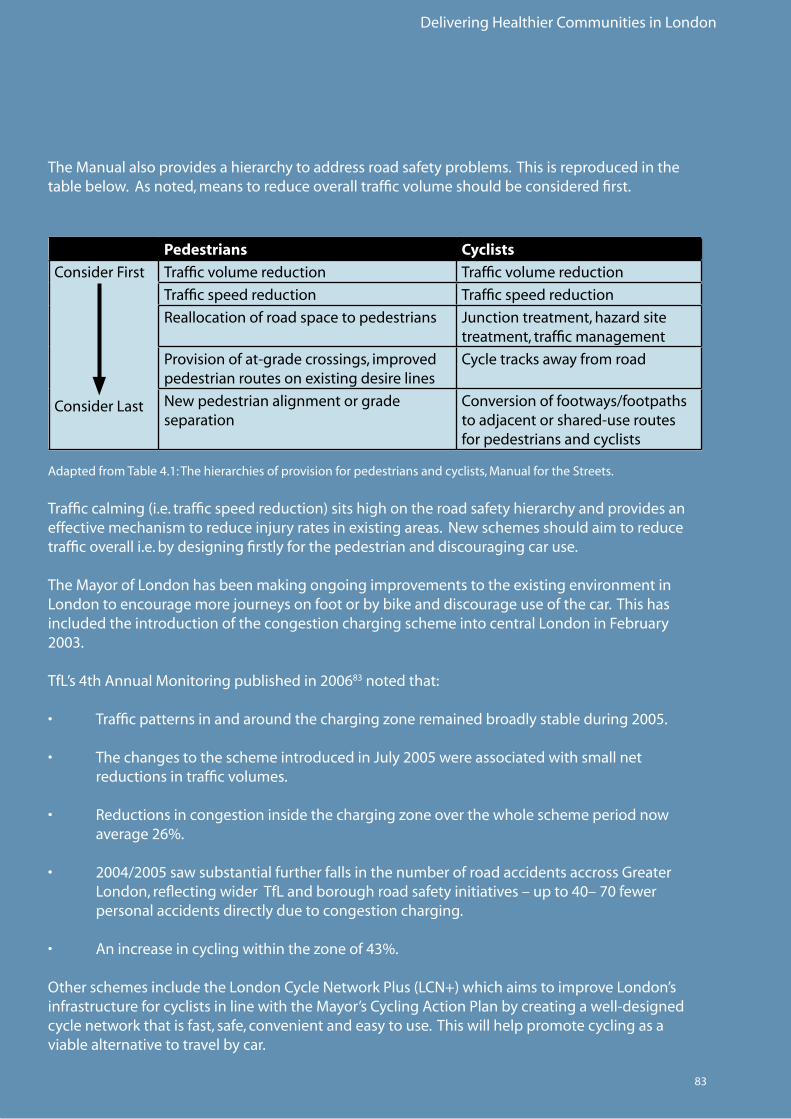
Delivering Healthier Communities in London
83
TheManualalsoprovidesahierarchytoaddressroadsafetyproblems.Thisisreproducedinthetablebelow.Asnoted,meanstoreduceoveralltrafficvolumeshouldbeconsideredfirst.
Pedestrians Cyclists
Consider First
Consider Last
Traffic volume reduction Traffic volume reduction
Traffic speed reduction Traffic speed reduction
Reallocationofroadspacetopedestrians Junction treatment, hazard site treatment, traffic management
Provisionofat-gradecrossings,improvedpedestrianroutesonexistingdesirelines
Cycle tracks away from road
Newpedestrianalignmentorgradeseparation
Conversion of footways/footpaths toadjacentorshared-useroutesfor pedestrians and cyclists
AdaptedfromTable4.1:Thehierarchiesofprovisionforpedestriansandcyclists,ManualfortheStreets.
Trafficcalming(i.e.trafficspeedreduction)sitshighontheroadsafetyhierarchyandprovidesaneffectivemechanismtoreduceinjuryratesinexistingareas.Newschemesshouldaimtoreducetraffic overall i.e. by designing firstly for the pedestrian and discouraging car use.
TheMayorofLondonhasbeenmakingongoingimprovementstotheexistingenvironmentinLondontoencouragemorejourneysonfootorbybikeanddiscourageuseofthecar.Thishasincluded the introduction of the congestion charging scheme into central London in February 2003.
TfL’s4thAnnualMonitoringpublishedin200683 noted that:
• Trafficpatternsinandaroundthechargingzoneremainedbroadlystableduring2005. • ThechangestotheschemeintroducedinJuly2005wereassociatedwithsmallnet reductions in traffic volumes.
• Reductionsincongestioninsidethechargingzoneoverthewholeschemeperiodnow average26%.
• 2004/2005sawsubstantialfurtherfallsinthenumberofroadaccidentsaccrossGreater London,reflectingwiderTfLandboroughroadsafetyinitiatives–upto40–70fewer personal accidents directly due to congestion charging. • Anincreaseincyclingwithinthezoneof43%.
OtherschemesincludetheLondonCycleNetworkPlus(LCN+)whichaimstoimproveLondon’sinfrastructureforcyclistsinlinewiththeMayor’sCyclingActionPlanbycreatingawell-designedcycle network that is fast, safe, convenient and easy to use. This will help promote cycling as a viable alternative to travel by car.
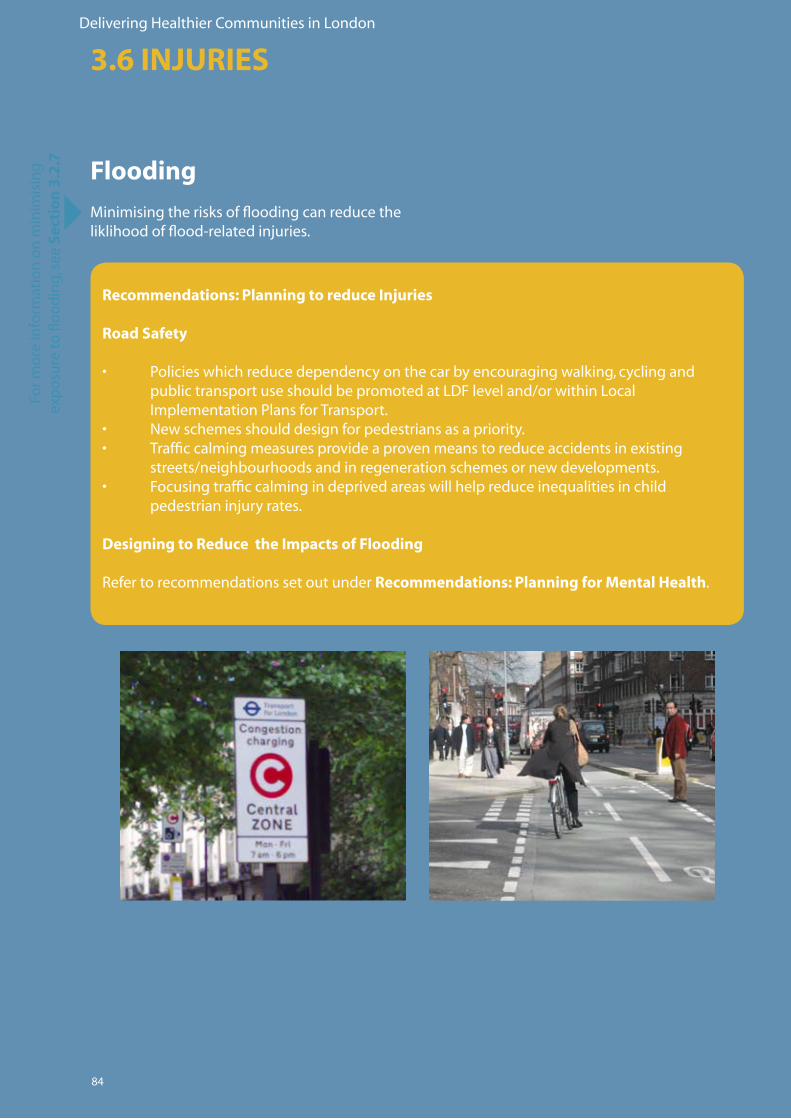
Delivering Healthier Communities in London
84
Recommendations: Planning to reduce Injuries
Road Safety
• Policieswhichreducedependencyonthecarbyencouragingwalking,cyclingand public transport use should be promoted at LDF level and/or within Local ImplementationPlansforTransport.• Newschemesshoulddesignforpedestriansasapriority.• Trafficcalmingmeasuresprovideaprovenmeanstoreduceaccidentsinexisting streets/neighbourhoods and in regeneration schemes or new developments. • Focusingtrafficcalmingindeprivedareaswillhelpreduceinequalitiesinchild pedestrianinjuryrates.
Designing to Reduce the Impacts of Flooding
RefertorecommendationssetoutunderRecommendations: Planning for Mental Health.
Flooding
Minimisingtherisksoffloodingcanreducetheliklihoodofflood-relatedinjuries.
3.6 INJURIESFo
r mo
re in
form
atio
n o
n m
inim
isin
g
exp
osu
reto
flo
od
ing,
see
Sec
tio
n 3
.2.7

Delivering Healthier Communities in London
85

Delivering Healthier Communities in London
86

87
Delivering Healthier Communities in London
4 - A SPATIAL PLAN FOR HEALTH

Delivering Healthier Communities in London
88
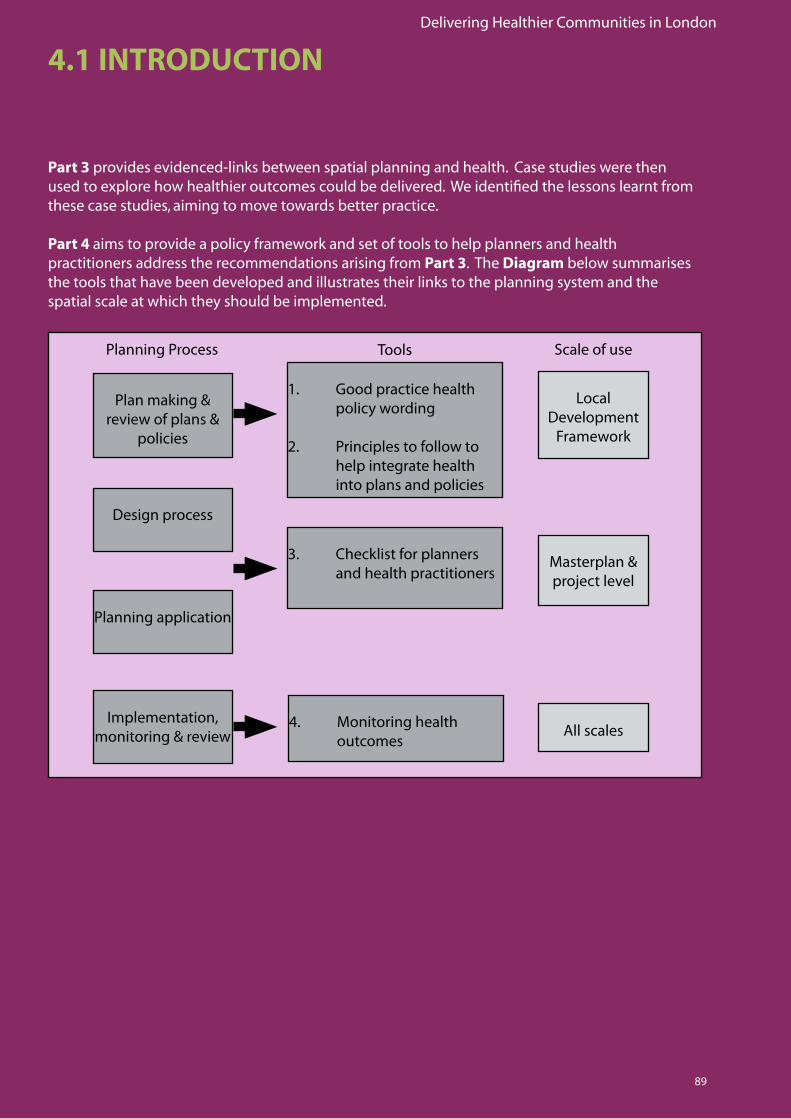
Delivering Healthier Communities in London
89
4.1 INTRODUCTION
Part 3 provides evidenced-links between spatial planning and health. Case studies were then used to explore how healthier outcomes could be delivered. We identified the lessons learnt from these case studies, aiming to move towards better practice.
Part 4 aims to provide a policy framework and set of tools to help planners and health practitioners address the recommendations arising from Part 3. The Diagram below summarises the tools that have been developed and illustrates their links to the planning system and the spatial scale at which they should be implemented.
1. Good practice health policy wording
2. Principles to follow to help integrate health into plans and policies
3. Checklist for planners and health practitioners
4. Monitoring health outcomes
Local Development
Framework
Masterplan & project level
All scales
Plan making & review of plans &
policies
Design process
Planning application
Implementation, monitoring & review
Planning Process Tools Scale of use
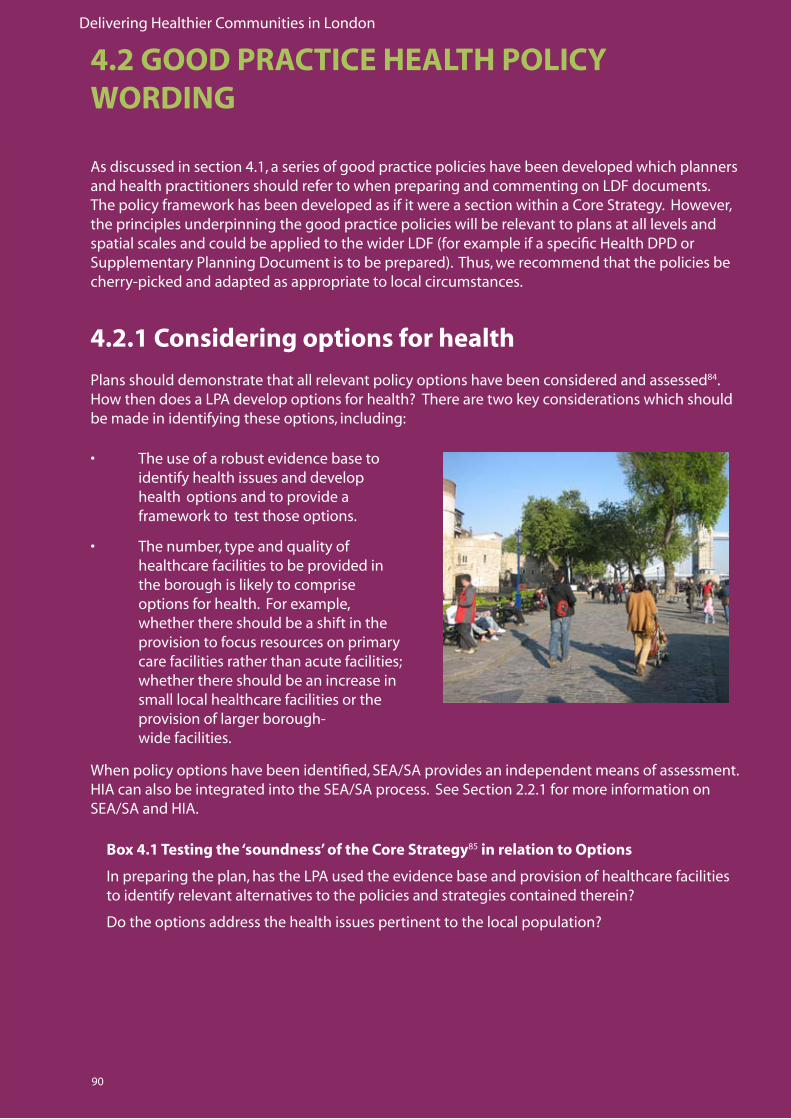
Delivering Healthier Communities in London
90
4.2.1 Considering options for health
Plans should demonstrate that all relevant policy options have been considered and assessed84. How then does a LPA develop options for health? There are two key considerations which should be made in identifying these options, including:
4.2 GOOD PRACTICE HEALTH POLICY WORDING
Box 4.1 Testing the ‘soundness’ of the Core Strategy85 in relation to Options
In preparing the plan, has the LPA used the evidence base and provision of healthcare facilities to identify relevant alternatives to the policies and strategies contained therein?
Do the options address the health issues pertinent to the local population?
As discussed in section 4.1, a series of good practice policies have been developed which planners and health practitioners should refer to when preparing and commenting on LDF documents. The policy framework has been developed as if it were a section within a Core Strategy. However, the principles underpinning the good practice policies will be relevant to plans at all levels and spatial scales and could be applied to the wider LDF (for example if a specific Health DPD or Supplementary Planning Document is to be prepared). Thus, we recommend that the policies be cherry-picked and adapted as appropriate to local circumstances.
• Theuseofarobustevidencebaseto identify health issues and develop health options and to provide a framework to test those options.
• Thenumber,typeandqualityof healthcare facilities to be provided in the borough is likely to comprise options for health. For example, whether there should be a shift in the provision to focus resources on primary care facilities rather than acute facilities; whether there should be an increase in small local healthcare facilities or the provision of larger borough- wide facilities.
When policy options have been identified, SEA/SA provides an independent means of assessment. HIA can also be integrated into the SEA/SA process. See Section 2.2.1 for more information on SEA/SA and HIA.

Delivering Healthier Communities in London
91
4.2.2 How to incorporate health within the Core Strategy
The Core Strategy sets out the long-term spatial vision for the local authority and the strategic policiesandproposalsrequiredtodeliverthevision.PPS1286 states that “…the policies prepared by the local planning authority should be founded on a thorough understanding of the needs of their area and the opportunities and constraints which operate within that area…” Before drafting policies therefore, planners, in conjunction with other stakeholders, should think about the local context of their area and, in particular, set out:
• Anevidence-based profile of the local area;
• Theissues arising from the local profile that should to be addressed by the Core Strategy;
• Aspatial vision of the area in the future; and
• Asetofspatial objectives which fit the vision and address the identified issues. The evidence-based profile, issues which should be addressed by the Core Strategy, spatial vision and spatial objectives will now be considered in turn to identify how health should be considered in their development.
An evidence-based profile
The profile should set out the context for the local authority including, for example, its area and population, economic base, transport links, and community and social facilities. Health should be drawn into this profile through, for example, health issues currently facing the local authority, theprovisionofanddemandforauthority-widehealthcarefacilities(includingthequalityandtype of these facilities), and links between socio-economic factors and health, specific to the local authority.

Delivering Healthier Communities in London
92
Box 4.2 Testing the ‘soundness’ of the Core Strategy87 in relation to the evidence-based profile
In preparing the profile, has the LPA:
• Setouthealthissuescurrentlyfacingtheirarea?• Identifiedwiderissueswhichmayhaveindirectlinkstohealthanddocumentedthese links?• Summarisedtheprovisionofanddemandforauthoritywidehealthcarefacilities, specificallyreferringtothequalityandtypeofthesefacilities?• Providedarobustevidencebasefromwhichtodrawoutandmonitorthehealth characteristics specific to their area?
The profile must be evidence-based and locally distinctive. PPS12 states that “LPAs should prepare and maintain an up-to-date information base on key aspects of the social, economic and environmental characteristics of their area. LPAs should keep under review the following matters:
(i) the principal physical, economic, social and environmental characteristics of their area;
(ii) the principal purposes for which land is used in the area;
(iii) the size, composition and distribution of the population of the area;
(iv) the communications, transport system and traffic of the area (including accessibility by public transport); and
(v) any other considerations which may be expected to affect those matters.”
4.2 GOOD PRACTICE HEALTH POLICY WORDING

Delivering Healthier Communities in London
93
Health issues could include:
• Thenumberofroadtrafficaccidentsin[boroughx]ishigherthantheaveragenumber of road traffic accidents for other London boroughs.
• Lifeexpectancyin[wardx],adeprivedwardintheborough,issignificantlylowerthan [wardy],oneofthemoreaffluentwardsintheborough.
• Therearehighlevelsofhospitaladmissionsforrespiratorydiseaseintheborough.
Wider issues which may have indirect links to health include:
• Therearehighlevelsofunemploymentin[wardx].
• Thereisalackofaffordablehousingintheborough.
• Therearepoorpublictransportlinksinsomeareasoftheborough.
• Thereisalownumberofsportsandleisurefacilitiesandopenandgreenspacesper 1000 population in the borough.
Issues to be addressed
The profile should be used to identify local authority-specific issues which need to be addressed. These should include health issues currently facing the borough in addition to wider issues which may have indirect links to health.
Examples of the range of issues which could be identified are set out below:
Delivering Healthier Communities in London
94
Spatial vision
The spatial vision should present the plan’s key areas of future focus in as concise a manner as possible, taking into account the issues arising from the profile. Where relevant, health should be integrated into the overall vision for the area, both in terms of direct health outcomes and wider outcomes which may have indirect links to health. The vision may include aspirations such as:
Box 4.3 Testing the ‘soundness’ of the Core Strategy88 in relation to the spatial vision
In preparing the spatial vision, has the LPA:
• Integrateddirecthealthaspirations?
• Integratedwideraspirationswhichmayhaveindirectlinkstohealthanddocumented the links between these aspirations and health?
• Relatedhealthandwideraspirationstodevelopmentanduseoflandontheground?
• Hadregardtotheauthority’scommunitystrategy?
• A healthy place to live and work;• A safe, prosperous and fair borough; and• Equalaccessforalltohomes,jobs,leisureandsportsservices,andcommunityand healthcare facilities.
Although the spatial vision may consist of high-level aspirations, local authorities should consider how these relate to development and use of land on the ground. In relation to health, this would mean understanding how the health issues currently facing the borough (as identified from the local profile) can be managed through the planning process. For example, hospital admissions for respiratorydiseasemaybeparticularlyhighinspecificwardsduetopoorqualityhousingand/orroad traffic pollution. Dealing with these issues may involve targeting regeneration to particular housing estates and/or introducing measures to reduce traffic levels.
The vision for the borough should be linked to the Community Strategy. PPS12 states that “…the LDF should be a key component in the delivery of the community strategy… setting out its spatial aspects where appropriate and providing a long term spatial vision…” Furthermore, the fifth test ofsoundness,(undertheConformityheading)requiresDPDstohaveregardtotheauthority’scommunity strategy.
4.2 GOOD PRACTICE HEALTH POLICY WORDING

Delivering Healthier Communities in London
95
Strategic objectivesThe objectives should illustrate, in a meaningful way, how the strategy contributes to the outcomes outlined in the spatial vision89. Given that health should be integrated into the vision, health should form one of the overall strategic plan objectives.
An example of how health may be incorporated as a strategic objective is outlined below. This examplesetsoutthegenericrequirementswhichalllocalauthoritiesshouldstriveforwhenaiming to promote health and well-being. There will inevitably be authority-specific health issues which will need to be included. Boroughs should work in partnership with PCTs from the outset to help identify these.
Tosetaspatialplanningframeworkfortheimprovementof[borough x’s]communityhealthand well-being for everyone. This will be achieved through the following objectives:
1. Toensurehealthinequalitiesareaddressedthroughequalaccessforalltohomes, jobs, sports and leisure facilities, open and green space, social and community, and healthcare facilities.
2. To ensure that the potential health impacts of development and regeneration are identified and addressed at an early stage in the planning process.
3. To ensure that the design and management of new developments and regeneration schemes promote and maintain healthy lifestyles.
4. To encourage physical activity, e.g. through the provision of opportunities to walk and cycle in the design of new developments and regeneration schemes.
5. To provide opportunities to improve physical and mental well-being through the provisionofhighqualityopen&greenspacesandsportsandrecreationfacilities.
6. To avoid mental health effects arising from direct exposure to or fear of exposure to crime/criminal activity through appropriate design in new developments and regeneration schemes.
7. To avoid the public health impacts related to climate change, such as overheating, through adaptation and mitigation measures.

Delivering Healthier Communities in London
96
Setting objectives correctly and effectively is critical to the formulation of good policies. Objectives should:
• bedifferenttoaims/aspirations,whicharehigh-level,over-archingvisions;
• providethemeanstoachievesuccess;
• beSMART:
S Specific – language used is appropriate and free from jargon
M Measurable–whatevidencewillbeusedtoprovethattheobjectivehasbeen achieved?
A Achievable – outcomes of objective can actually be met
R Realistic–itisclearwhowilldelivertheobjectiveandhowitwillbefunded
T Timely – A deadline for completion of objectives should be set to make it measurable
Box 4.4 Testing the ‘soundness’ of the Core Strategy in relation to objectives
In preparing the strategic objectives, has the LPA:
• Integratedhealthasanoverallstrategicplanobjective?
• Correctlyandeffectivelysetobjectives,inlinewiththeprinciplessetoutabove?
SMART Objective
Health Issue: Child injuries and fatalities from road-based transport.
Objective: To reduce the number of child pedestrian injuries and accidents from road-based transport.
Aims: The borough should aim to exceed the national level target (by 2010, a 50% reduction in child pedestrians killed or seriously injured versus 1994-1998 levels).
How to Achieve: Through the introduction of traffic calming measures, Homezones etc. Focus on wards where child pedestrian injuries and accidents are highest.
How to measure: Monitorthenumberofchildinjuriesandfatalitiesonanannualbasis.Datashould be collated between wards to identify ward level differences.
4.2 GOOD PRACTICE HEALTH POLICY WORDING
Delivering Healthier Communities in London
97
4.2.3 How to incorporate health within the Core Strategy Policies
Within the Core Strategy, health may feature either as a cross-cutting theme or as an individual section within the plan:
• Healthasacross-cutting theme would enable the traditional topic-based approach of plan-writing to be followed so that health is considered under each topic heading (e.g. housing, employment, transport, etc). The health issues specific to the local area will need to be identified at the outset. The health issues should then be linked to appropriate plan topic(s)andreflectedinobjectivesandpolicy.Section4.2.5discusseshealthasacross- cutting issue further.
• Incorporatinghealthasanindividual topic is likely to more closely align the structure of the Core Strategy with that of the Community Strategy. Whilst there is wide diversity in the form and content of Community Strategies, a survey of 28 strategies identified health/well- being as the most popular theme to be included90. Whilst this approach may explicitly set out the links between health and spatial planning, it may result in policy overlap between topics of the Plan and confusion to readers who are used to more traditional Plan layouts.
The approach to integrating health within the Core Strategy will depend on many factors, such as local circumstances, experience, time available and the involvement of others. Whichever approach is chosen, policy development should follow the steps outlined above:
Evidence –> Issues –> Vision –> Objectives -> Policy
Health as an individual topic section
This guidance document follows a topic based approach to the development of health policies. ThisreflectstheselectivityadoptedinPart3(policieshavebeendevelopedaroundthechosenpublic health issues). The policies also develop the evidence base provided in Part 3 - where strong linksareidentifiedbetweenthepublichealthissueandspatialplanningfactorsthesearereflectedwithin health policy.
Following the individual health policies, good practice wording for overarching health policies is provided, which focuses around healthcare provision, designing for health and minimising the health impacts of development. The example policy, “Designing for Health aims” to draw together a series of principles to follow in the design of new developments and regeneration schemes which will help to deliver healthier outcomes. This policy could be applied to a range of public health issues.
The policy framework provided below should help planners to generate policies which are appropriate to their local circumstances.

Delivering Healthier Communities in London
98
FORMULATING POLICIES FOR HEALTH
Health and well-being are major issues on the national agenda. Health is more than access to medical treatments and services; it also extends to prevention and cure and centres on enabling people to make healthier choices.
This topic of the Core Strategy relates to the important issues connected with creating and maintaining healthier communities. The task of the LDF is to set a spatial planning framework which will facilitate positive improvements to the borough’s health and well-being and supports the borough’s spatial vision and spatial objectives.
This topic includes eight policies:
Example policy 1: Mentalhealth
Example policy 2: Obesity and cardiovascular disease
Example policy 3:Respiratorydisease
Example policy 4: Excess winter (cold) and summer (heat) mortality
Example policy 5: Injuries
Example policy 6: Healthcare provision
Example policy 7: Designing for health
Example policy 8: Health impacts
[This introduction to the topic should be grounded in evidence; it should set out the borough’s current situation with regard to health and well-being].
4.2 GOOD PRACTICE HEALTH POLICY WORDING

Delivering Healthier Communities in London
99
MENTAL HEALTH
Depression and anxiety are important public health problems occurring in the range of 15 to 30% and they account for approximately 20% of GP consultations in the UK. Key factors associated with poor mental well-being include lack of ‘escape facilities’ (such as green space and social infrastructure), a sense of overcrowding, fear of crime and dissatisfaction with existinglivingconditionsandthelocalarea(e.g.highrise,deckaccessdwellings,poorqualityhousing and neighbour noise). Allotments are cited as ‘escape facilities’ that have a positive effect on both physical and mental well-being.
Thereisalsoevidencedemonstratingthatresidentswhosehomeshavebeenfloodedexperiencepsychologicaldistressforconsiderableperiodsoftimeafterafloodevent.
New developments and regeneration schemes can help to reduce the incidence of mental healthproblemsthroughprovisionofgoodqualitygreenspaceandsocialinfrastructure,designing to avoid crime and fear of crime, involving local communities in regeneration schemesandensuringdevelopmentsareofahighqualityandareappropriatetotheirlocation.
Proposals should incorporate innovative means to manage and maintain open and green spaces and encourage long-term use. E.g. through the use of S106 funding to provide on-site wardens.
Avoidingdevelopmentinareasatriskoffloodingordesigningsitelayoutandbuildingstominimisefloodriskmayhelpreduceflood-relatedpsychologicaldistress.
Example strategic objective 1: Mental Health
To set a spatial planning framework for addressing the borough’s mental health problems. This will be achieved by:
1. Protecting and enhancing the borough’s open and green spaces through the implementation of the Open Space Strategy.
2. Integrating open space provision within new developments and regeneration schemes.
3. Protecting and enhancing the borough’s social and community infrastructure.
4. Integrating social and community infrastructure within new developments and regeneration schemes.
5. Designing new developments to avoid crime and fear of crime.
6. Involving local communities in regeneration and development schemes to ensure design takes account of community health concerns.
7. Designingsitelayoutandbuildingstominimisefloodrisk.

Delivering Healthier Communities in London
100
Example policy 1: Mental health
The borough will aim to reduce the incidence of mental health problems through the provisionofgoodquality,accessibleopenandgreenspacesandsocialinfrastructure,involving local communities in the design of development and regeneration schemes, designingoutcrimeinnewdevelopmentsanddesigningtominimisefloodrisk.
Open and green space
The borough will protect and support a diverse and multi-functional network of open and green spaces through the:
• Identificationofanetworkofstrategicallyandlocallyimportantgreenspaceareasin Site Allocations Development Plan Documents and Area Action Plans.
• Identificationanddesignationofopenspacesites,e.g.GreenBelt,MetropolitanOpen Land in the Site Allocations Development Plan Documents and Area Actions Plans.
• Identificationofcurrentareasofopenspacedeficiencythroughthepreparation of an Open Space Strategy.
Support will be given to:
• Proposalsandactivitiesthatprotect,retainorenhanceexistingopenandgreen spaces, lead to the provision of additional open and green spaces or improve access to existing areas, particularly by non-car modes.
• Proposalswhichincorporateinnovativemeasurestomanageandmaintainopen and green spaces and encourage long-term use.
• Majordevelopmentproposalswhichhelpmeettheincreasingdemandforopen space.
• Developmentproposalswhichincludeprovisionforallotmentsasameansto provide multiple health and sustainability benefits.
• Developmentproposalswhichincludeinnovativemeanstoincorporateopenspace, e.g. through the provision of green roofs, wildlife gardens or play space created as a result of traffic calming.
There will be a presumption against:
• Developmentonexistingopenorgreenspace.
• InappropriatedevelopmentofMetropolitanOpenLandorGreenBeltLand,i.e. development that damages the ‘open function’ of the space.
4.2 GOOD PRACTICE HEALTH POLICY WORDING

Delivering Healthier Communities in London
101
Community and social infrastructure
The borough will undertake an assessment of local infrastructure to identify areas of deficiency and to plan for projected population increase and demographic changes. This will be conjunction with local strategic partnerships, healthcare organisations and others.
All those proposing new development and regeneration schemes will:
• Identifythesocialinfrastructureneedsofthedevelopment(SocialandEconomic ImpactAssessmentsmayberequiredforlargeresidentialsites).
• Consultthelocalcommunityontheirsocialandcommunityrequirements.
• Providefacilitieswithineasyaccessbywalking/cyclingorpublictransport.
• Providefacilitieswhichareaccessibletoallsectorsofthecommunity.
Support will be given to proposals which seek to promote long-term community involvement in the ownership and management of new development and regeneration schemes.
Proposals involving the loss of community and social infrastructure will only be permitted whereadequatealternativeprovisionismadetomeettheneedsofthecommunityaffected,resultinginhighquality,accessibleandlocallyappropriatefacilities.

Delivering Healthier Communities in London
102
Design and the reduction of crime
Design of all developments and regeneration schemes should reduce the opportunity for crime. Support will be given for proposals which meet the principles below:
• Provideplaceswithwell-definedroutes,spacesandentrancesthatprovidefor convenient movement without compromising security.
• Provideadequateandnaturalsurveillanceofadjacentstreetsandspacese.g.by maximising active frontages in development design.
• Createasenseofownershipbyprovidingacleardistinctionbetweenpublicand private spaces.
• Promoteactivitythatisappropriatetothearea,providingconvenientaccessand movement routes.
• Avoidthecreationofgatedcommunities.
• Provideplacesthataredesignedwithfuturemanagementandmaintenancein mind to discourage crime in the long-term. The involvement of local communities in long term management and maintenance will be particularly supported.
Designing to avoid flooding
All those proposing new development and regeneration schemes will aim to avoid areas at riskoffloodingorareaslikelytoincreasetheriskoffloodingelsewhere.
Ifnewdevelopmentorregenerationschemesareinareasatriskoffloodingthefollowingshould be undertaken:
(i) Carry out a site survey to determine which Sustainable Urban Drainage Systems (SuDS) will be appropriate for use on the site.(ii) Incorporate watercourses throughout the site.(iii) Setdevelopmentbackfromexistingflooddefences.(iv) Orientateinfrastructureaccordingtofloodriskvulnerability.
Boroughswilltakeopportunitiestoaddresssocialandenvironmentalinequalitiesandhelpmanageexistingfloodriskthroughriverrestorationandopeningupculverts. Principles set out in Example policy 7: Designing for health and Example policy 8: Health impacts should be adhered to when designing and determining planning applications.
4.2 GOOD PRACTICE HEALTH POLICY WORDING

Delivering Healthier Communities in London
103
OBESITY AND CARDIOVASCULAR DISEASE
One of today’s biggest public health problems is the obesity epidemic, linked to a rising incidence of diabetes. Obesity and diabetes are risk factors for coronary heart disease. In England, 15% of children between the ages of 2 and 10 are obese and the prevalence of children that are obese and overweight is increasingly steadily.
This trend can be addressed by encouraging physical activity. New developments and regeneration schemes can be designed to encourage more active lifestyles by providing goodquality,accessibleopenspacesandsportsandrecreationfacilities,andbyencouragingwalking and cycling. In addition to addressing obesity and diabetes, these interventions will also tackle cardiovascular disease and musculoskeletal conditions. There is evidence that leisure time physical activity is associated with reduced risk of cardiovascular disease in middle-aged and older men and women.
Example strategic objective 2: Obesity and cardiovascular disease
To set a spatial planning framework for addressing the borough’s obesity problem and cardiovascular disease. This will be achieved by encouraging physical activity through:
1. Protection and enhancement of the borough’s open and green spaces through the implementation of the Open Space Strategy.
2. Integration of open space provision within new developments.
3. Protection and enhancement of the borough’s sport and leisure facilities through the Sports Facilities Strategy and Playing Pitch Strategy.
4. Provision of appropriate facilities for sports and recreation in development proposals.

Delivering Healthier Communities in London
104
Example policy 2: Obesity and cardiovascular disease
The borough will tackle obesity and address cardiovascular disease by encouraging physical activity.Thiswillbeachievedthroughtheprovisionofgoodquality,accessibleopenandgreen spaces and sport and recreation facilities.
Open and green space
TheboroughwillfollowtherequirementssetoutinExamplepolicy1:Mentalhealth in protecting and enhancing open and green spaces.
Sports and recreation facilities
The borough will enhance sport and recreation facilities by identifying locations for the delivery of major new facilities in Site Allocations Development Plan Documents and Area Action Plans.
Support will be given to:
• Proposalsandactivitiesthatprotect,retainorenhanceexistingsportsand recreation facilities, lead to the provision of additional facilities or improve access to facilities, particularly by non-car modes.
• Developmentproposalswhichprovideappropriatefacilitiesforsport,recreation and children’s play to meet the needs of the development.
• Developmentproposalsfornewsport,recreationandchildren’splayfacilities,or for the enhancement of existing facilities, provided that:
- There is no demonstrable harm from noise, lighting, transport or environmental impacts.
- The development contributes to meeting identified shortfalls in provisionorenhancingthequalityofprovisionofsportandrecreation facilities.
- The development is accessible by sustainable modes of transport, especially walking and cycling.
There will be a presumption against any development that involves the loss of a sport or recreation facility except where it can be demonstrated that there is currently an excess of provision,orwherealternativefacilitiesofequalorbetterqualitywillbeprovidedaspartofthe development.
4.2 GOOD PRACTICE HEALTH POLICY WORDING
Delivering Healthier Communities in London
105
RESPIRATORY DISEASE
Short-termexposuretorespirableparticles(PM10
) in urban areas increases deaths and respiratoryandcardiovascularhospitaladmissions.TheprimarysourceofPM
10 in urban
areasismotortraffic.NitrogendioxidemodifiestheeffectofPM10
such that daily mortality increasesfurtherwhenhighlong-termconcentrationsofPM
10 are in combination with
nitrogen dioxide. Nitrogen dioxide is also produced by motor vehicle exhausts. Increases in ozone also lead to increases in deaths and respiratory hospital admissions. Ozone is created by the action of sunlight on nitrogen dioxide in the presence of volatile organic compounds (VOCs). Artificial sources of VOCs include cleaning solvents and some constituents of petroleum fuels.
Spatial planning can modify the total volume of traffic as well as congestion of traffic at certain locations, thereby reducing air pollution.
There is evidence that residents are more likely to report exacerbations of asthma, coughs and respiratoryinfectionsfollowingexposuretoflooding.Avoidingdevelopmentinareasatriskoffloodingordesigningsitelayoutandbuildingstominimisefloodriskmayreduceflood-related respiratory infections.
Example strategic objective 3: Respiratory disease
TosetaspatialplanningframeworkforaddressingRespiratorydiseaseintheborough.Thiswill be achieved by:
1. Reducingtheneedtoandlengthoftravelandpromoteasustainabletransport system.
2. Integrating sustainable modes of transport to access and move around new developments.
Example policy 3: Respiratory disease
The borough will aim to reduce the incidence of respiratory disease by tackling air pollution from road traffic emissions by encouraging the use of more sustainable modes of transport. This will also help reduce the number of cardiovascular hospital admissions related to air pollution.

Delivering Healthier Communities in London
106
Road traffic emissions
Theboroughwilldevelopandpromoteahighqualityandsustainabletransportsystemandwill reduce the need to and length of travel through spatial planning and design, including:
• Improvingaccessibility.Newdevelopmentwhichgeneratessignificantdemandfor travel should be provided in locations well served by a variety of modes of travel, including public transport. Higher densities of development will berequiredneartopublictransportinterchanges.
• Safeguardinglandforstrategicpublictransportinfrastructure.Landto be safeguarded will be identified in Area Action Plans and the Site Allocations Development Plan Documents.
• Promotingwalkingandcycling.Developmentofanetworkofsafewalkingand cycling will be promoted, connecting transport interchanges, and linking communities,services,facilitiesandrecreationareas.Minimumcycleparking standardswillbeappliedtoensurethatnewdevelopmentprovidesadequate provision for cycling as a sustainable mode of transport.
• Promotingwatertransport.Developmentofnewwatertransportinfrastructure will be supported.
• Demandmanagement.Developmentproposalswillbeassessedinrelationtocar parking standards set by the borough. These will set a maximum level of provision for different types of proposal.
Proposalsfornewdevelopmentthatgeneratesfrequenttripstoandfromasitemustincludeprovision for sustainable forms of transport to access the site, and within the development. Whereprovisionisrequired,measuresmustbeincorporatedasanintegralpartofthedesignof all development proposals, and should include where appropriate:
• Footpathsandcycleways,linkedtothewidergreennetwork;• Safeprovisionforcycleparkingandcycleshelters;• Busstops/sheltersandlivetransportinformation;• Supportforsustainableformsoftransport,e.g.communitytransportschemes;• PreparationandimplementationofGreenTravelPlansformajordevelopments, which consider and promote alternatives to car use; and• Minimallevelsofcarparking,commensuratewithroadsafety,thereductionof congestion, and the availability of alternative means of transport.
Flooding
TheboroughwillfollowtherequirementssetoutinExample policy 1: Mental health in designingtoavoidflooding.
4.2 GOOD PRACTICE HEALTH POLICY WORDING

Delivering Healthier Communities in London
107
EXCESS WINTER (COLD) AND SUMMER (HEAT) MORTALITY
In England approximately a third of excess deaths in winter (18 excess deaths per 100,000 adults) are related to low indoor temperatures and 90% of these occur in those more than 65 years of age. Three thousand pensioners in London died in winter 2006 of cold related illnesses. Poor home insulation and fuel poverty contribute to the problem.
Measurescanbeincorporatedintobuildingdesigntoimproveinsulationandmaximisetheheat retained through solar gain.
Urban areas generate a ‘heat island’ effect and London can be up to 8% warmer than rural areasandnighttemperaturesinthecitycanremainabove19°C.Mortalityincreasesinhotweather and elderly people are particularly vulnerable; in the 1995 heatwave in London there was a 16% excess in deaths for all ages and those aged over 85 had a 20% excess mortality. Climate change will further exacerbate this problem.
Measurescanbeincorporatedintothelayoutofdevelopmentandbuildingstoreduceoverheating and hence the likelihood of heat mortality.
Example strategic objective 4: Excess winter (cold) and summer (heat) mortality
To set a spatial planning framework to reduce the incidence of winter and summer related mortalities:
1. Ensure that site layout and the design of buildings adapts to and mitigates for the effects of climate change.
2. Ensure that improvements are made to existing housing stock to reduce winter mortality.
Delivering Healthier Communities in London
108
Example policy 4: Excess winter (cold) and summer (heat) mortality
Excess winter (cold) mortality
The borough will identify areas where winter mortality and/or levels of cold-related illness are highest. This will provide a means to prioritise regeneration schemes and/or housing improvements.
Boroughs will seek to ensure that regeneration schemes and/or housing improvements maximise internal insulation and opportunity for solar gain.
Excess summer (heat) mortality
Boroughs will identify existing areas where retrofitting climate change adaptation measures should be prioritised.
The borough will ensure that new developments and regeneration schemes adapt to and mitigate for the effects of climate change, in particular over-heating.
Support will be given to proposals which:
• Maximiseopportunitiesfornaturalventilationinbuildings.• Maximiseareasofexposedthermalmassinbuildings.• Incorporateadequateshading.• Incorporateheat-absorbingplantspeciese.g.throughgreenroofs,gardensetc.• Ensurelandscapingtakesaccountofhotter,driersummers.
Principles set out in Example policy 7: Designing for health should be adhered to when designing and determining planning applications.
4.2 GOOD PRACTICE HEALTH POLICY WORDING

Delivering Healthier Communities in London
109
INJURIES
Injuries account for 3% of annual deaths in the UK and were ranked the 14th leading cause of death in 2004. Injury is the greatest threat to life in children and young people (road traffic accidentscausethemostdeaths).RoadTrafficAccidents(RTAs)showsubstantialinequalitiesbetween groups of differing social class.
InLondon,RTAsdisproportionatelyaffectpedestrians.Inequalitiesexistbetweendifferingsocio-economic and ethnic groups.
DepartmentforTransportstatisticsfortheMetropolitanPoliceForceAreain2006reportedatotal of 29,775 road casualties, of which 226 were fatalities. The cost burden of every fatality in London is £1.4 million.
Injuriescanalsooccurduringorfollowingfloodevents.Injuryratesassociatedwithfloodingare in the order of 0.4%.
Annually, injuries lead to 720,000 admissions to hospital and 6 million emergency department visits.
There is good evidence that area-wide traffic calming reduces child pedestrian injury rates andalsoreducesthedifferentialinratesbasedoninequalitiesinsocialgroups.
Minimisingfloodriskmayhelpreducetheincidenceofinjuriesarisingfromflooding.
Example strategic objective 5: Injuries
To set a spatial planning framework to address rates of road traffic injury and avoid the risk of injuryfromfloodingwithintheborough.Thiswillbeachievedby:
1. Encouraging development and regeneration schemes which minimise dependence on the car. 2. Encourage developments and regeneration schemes which promote greater road safety and reduce vehicle speeds. 3. Designingsitelayoutandbuildingstominimisefloodrisk.

Delivering Healthier Communities in London
110
Example policy 5: Injuries
TheboroughwillaimtoreduceRTAs(andinequalitiesbetweendifferentsocialgroups)byencouraging developments and regeneration schemes which minimise dependence on the car, promote greater road safety and reduce vehicle speeds.
Minimisingfloodriskmayhelpreducetheincidenceofinjuriesarisingfromflooding.
Road Safety
Theboroughwillidentifyareaswhereratesofpedestrianinjuriesarehighest.Roadsafetymeasures should be targeted in these areas.
Support will given for new developments and regeneration schemes which:
• Maximiseroadsafetythroughtheprovisionof: - Traffic management/calming measures. - HomeZones. - Speed limits and road signage. - Safe walking and cycling routes linked to the wider green network. • Reducedependenceonthecare.g.bylocatinginareasaccessiblebywalkingand cycling and well served by public transport. Designing to avoid flooding
All those proposing new development and regeneration schemes will aim to avoid areas at riskoffloodingorareaslikelytoincreasetheriskoffloodingelsewhere.
Ifnewdevelopmentorregenerationschemesareinareasatriskoffloodingappropriatedesignwillhelptoreducethelikelihoodofexposuretofloodeventsandhenceinjuries.Thismayincludethedesignoffunctionalpartsofpropertiesabovethelikelythefloodlevel.
4.2 GOOD PRACTICE HEALTH POLICY WORDING
Delivering Healthier Communities in London
111
HEALTHCARE PROVISION
Improvements in health and wellbeing will be achieved through the safeguarding and enhancement of existing healthcare facilities and the creation of new facilities (healthcare facilities are taken to include hospitals, primary healthcare centres, GP practices and dentists).
In order to meet the demands of an increasing population and to identify areas of deficiency, an assessment will be undertaken of local healthcare infrastructure to identify locations for new facilities. This assessment will be based on a robust methodology, which takes account of local context, population and access to healthcare facilities. Access to facilities is a key factor in health status; high transport costs may prohibit certain socio-economic and ethnic groups from accessing facilities. Appropriate models to assist this process include the Social InfrastructureFramework(SIF)Toolkit[seehttp://www.healthyurbandevelopment.nhs.uk/pages/integrating_social_infrastructure/social_infrastucture.htm].NewhealthcareprovisionshouldfocusonthedeliveryofhighqualityPrimaryCareserviceswhichareaccessibletoallsectors of the community.
PCTs should provide assistance in assessing the existing healthcare infrastructure of the borough and in providing recommendations on where new facilities should be located.
Example strategic objective 6: Healthcare provision
To set a spatial planning framework to support the appropriate provision of healthcare facilities by:
1. Protecting existing healthcare facilities in accordance with an appropriate assessment of need.2. Supportinghighqualityappropriatenewhealthcarefacilitiesinaccordancewith an appropriate assessment of need.
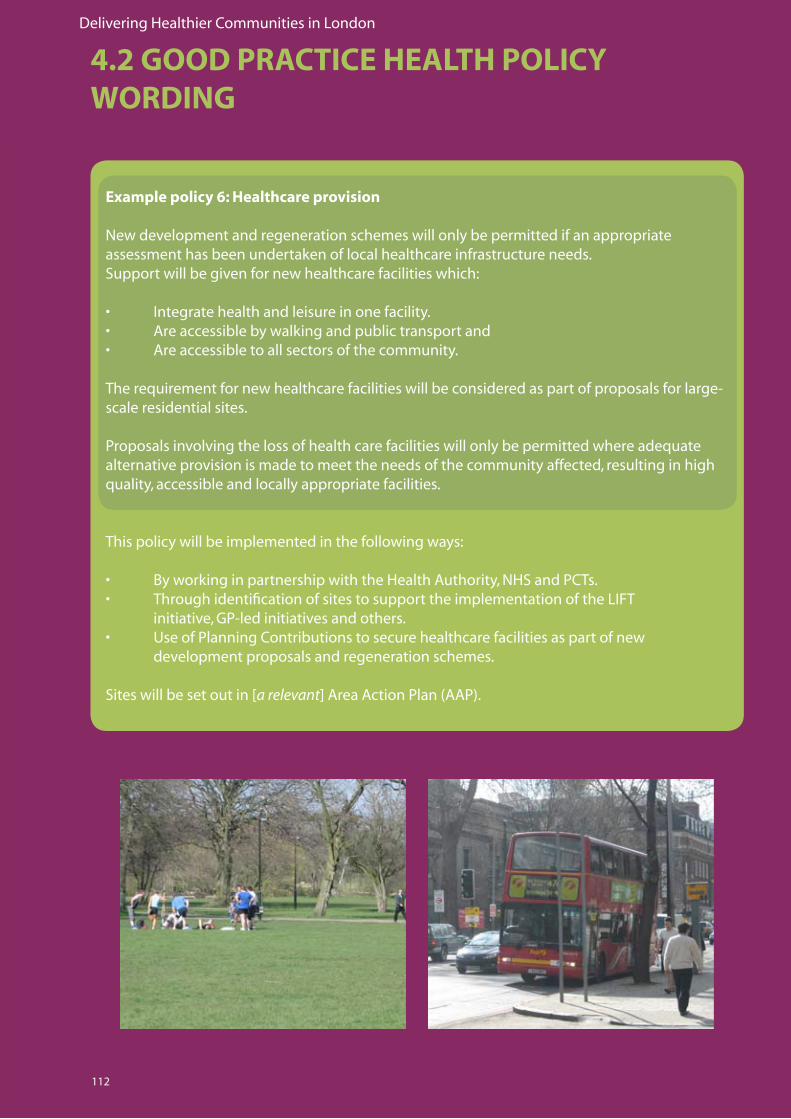
Delivering Healthier Communities in London
112
Example policy 6: Healthcare provision
New development and regeneration schemes will only be permitted if an appropriate assessment has been undertaken of local healthcare infrastructure needs. Support will be given for new healthcare facilities which:
• Integratehealthandleisureinonefacility.• Areaccessiblebywalkingandpublictransportand• Areaccessibletoallsectorsofthecommunity.
Therequirementfornewhealthcarefacilitieswillbeconsideredaspartofproposalsforlarge-scale residential sites.
Proposalsinvolvingthelossofhealthcarefacilitieswillonlybepermittedwhereadequatealternative provision is made to meet the needs of the community affected, resulting in high quality,accessibleandlocallyappropriatefacilities.
This policy will be implemented in the following ways:
• ByworkinginpartnershipwiththeHealthAuthority,NHSandPCTs.• ThroughidentificationofsitestosupporttheimplementationoftheLIFT initiative, GP-led initiatives and others.• UseofPlanningContributionstosecurehealthcarefacilitiesaspartofnew development proposals and regeneration schemes.
Siteswillbesetoutin[a relevant]AreaActionPlan(AAP).
4.2 GOOD PRACTICE HEALTH POLICY WORDING

Delivering Healthier Communities in London
113
DESIGNING FOR HEALTH
Good design is a key component of promoting healthy outcomes and a firm aspiration of [your]borough.
MoredetailedguidanceondesignrequirementswillbecontainedintheDevelopmentPolicies DPD. In addition, all those proposing development are advised to consult the Government guidance document ‘By Design’(thecompaniontoPPS1)andtheMayor’sSustainable Planning Guidance Documents ‘Sustainable Design and Construction’ and ‘Housing’.
The type of health impacts encountered will differ between development schemes. Therefore, the health impacts of development should be considered early on the design process (refer to Example Policy 8: Health Impacts).
Example strategic objective 7: Designing for health
To set a spatial planning framework to support the provision of well-designed developments that optimise healthy outcomes by:
1. Considering the health impacts of new developments and regeneration schemes through the design process.2. Appropriately locating new developments.3. Promotinghigh-qualitydevelopment.4. Ensuring provision for future management and maintenance of new development.5. Monitoringtheprovisionofwell-designeddevelopments.
Example policy 7: Designing for health
A design-led approach should be followed to optimise healthy outcomes in new development and regeneration-schemes. Support will be given for proposals that are consistent with the LDF’s detailed design policies and meet all the principles for ‘healthy design’ set out below:
Health Impact
The health impacts of new development and regeneration schemes will be considered throughoutthedesignprocess.RefertoExample policy 8: Health impacts.
Location
• Developmentshouldbelocatedinareaswellservedbypublictransport,inexisting mixed use areas wherever possible and in areas with good access to social infrastructure and green/open spaces.
• Avoiddevelopinginareasatriskoffloodingorlikelytoincreasetheriskofflooding elsewhere.
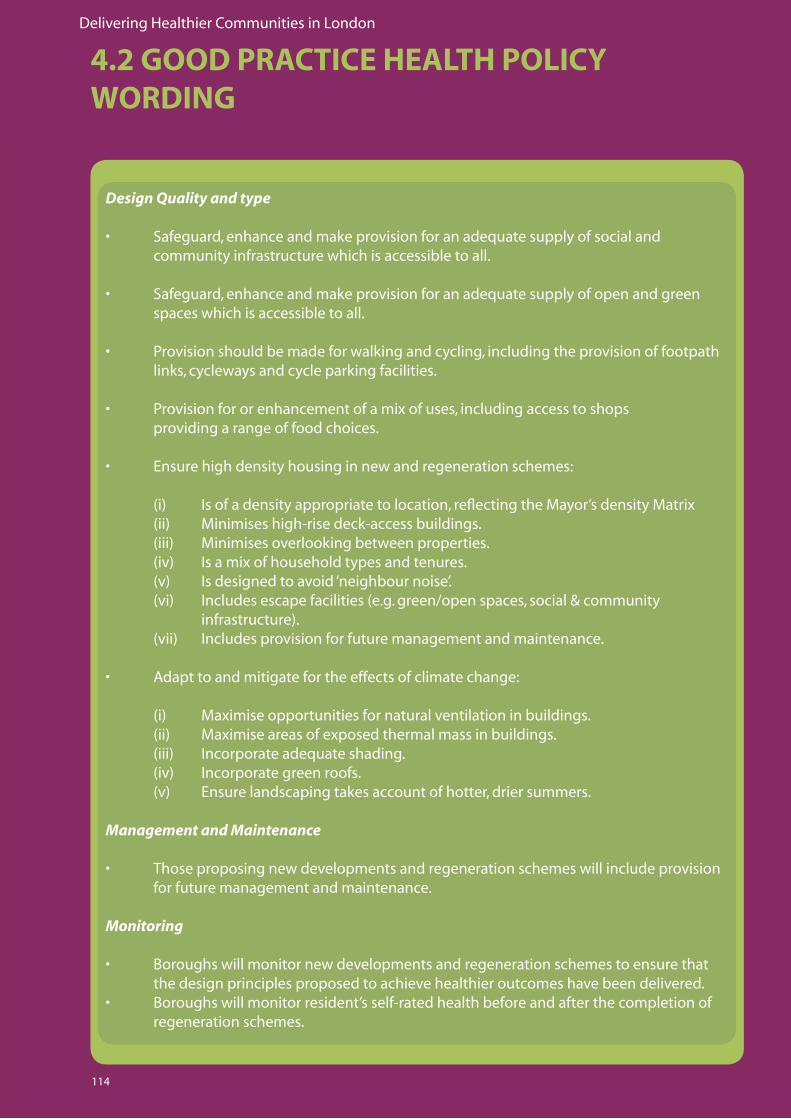
Delivering Healthier Communities in London
114
Design Quality and type
• Safeguard,enhanceandmakeprovisionforanadequatesupplyofsocialand community infrastructure which is accessible to all.
• Safeguard,enhanceandmakeprovisionforanadequatesupplyofopenandgreen spaces which is accessible to all.
• Provisionshouldbemadeforwalkingandcycling,includingtheprovisionoffootpath links, cycleways and cycle parking facilities.
• Provisionfororenhancementofamixofuses,includingaccesstoshops providing a range of food choices.
• Ensurehighdensityhousinginnewandregenerationschemes:
(i) Isofadensityappropriatetolocation,reflectingtheMayor’sdensityMatrix (ii) Minimiseshigh-risedeck-accessbuildings. (iii) Minimisesoverlookingbetweenproperties. (iv) Is a mix of household types and tenures. (v) Is designed to avoid ‘neighbour noise’. (vi) Includesescapefacilities(e.g.green/openspaces,social&community infrastructure). (vii) Includes provision for future management and maintenance.
• Adapttoandmitigatefortheeffectsofclimatechange:
(i) Maximiseopportunitiesfornaturalventilationinbuildings. (ii) Maximiseareasofexposedthermalmassinbuildings. (iii) Incorporateadequateshading. (iv) Incorporate green roofs. (v) Ensure landscaping takes account of hotter, drier summers.
Management and Maintenance
• Thoseproposingnewdevelopmentsandregenerationschemeswillincludeprovision for future management and maintenance.
Monitoring
• Boroughswillmonitornewdevelopmentsandregenerationschemestoensurethat the design principles proposed to achieve healthier outcomes have been delivered. • Boroughswillmonitorresident’sself-ratedhealthbeforeandafterthecompletionof regeneration schemes.
4.2 GOOD PRACTICE HEALTH POLICY WORDING
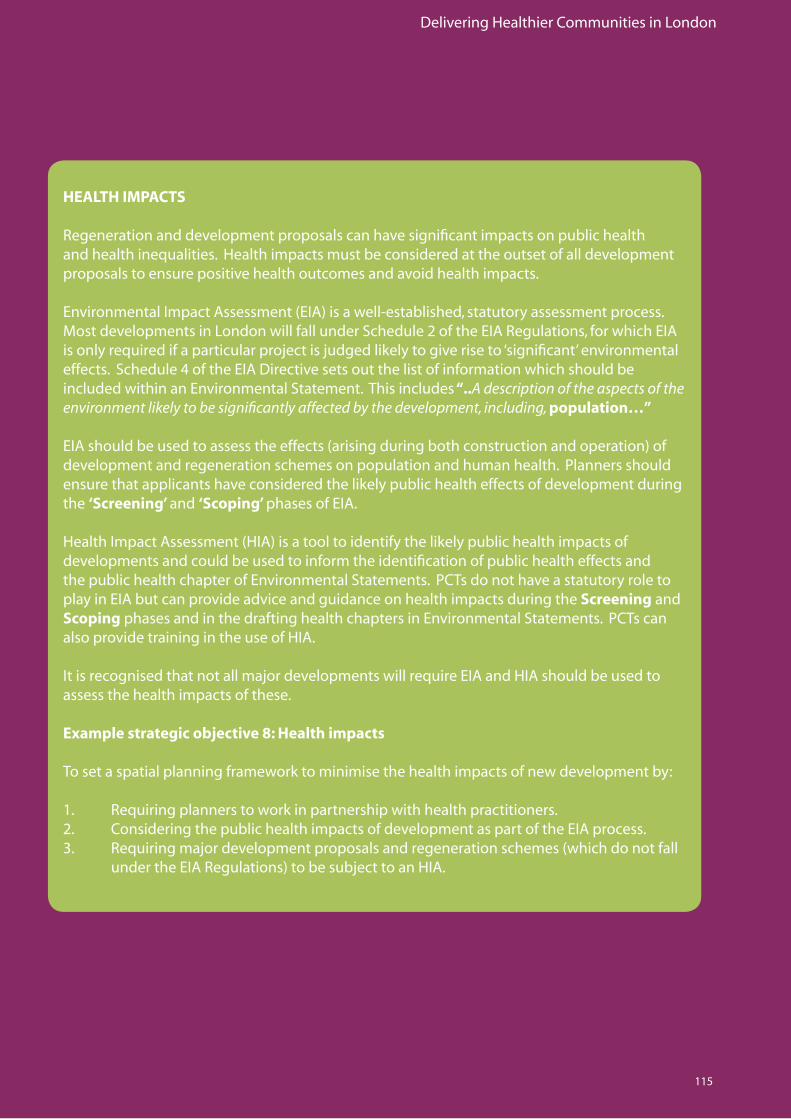
Delivering Healthier Communities in London
115
HEALTH IMPACTS
Regenerationanddevelopmentproposalscanhavesignificantimpactsonpublichealthandhealthinequalities.Healthimpactsmustbeconsideredattheoutsetofalldevelopmentproposals to ensure positive health outcomes and avoid health impacts.
Environmental Impact Assessment (EIA) is a well-established, statutory assessment process. MostdevelopmentsinLondonwillfallunderSchedule2oftheEIARegulations,forwhichEIAisonlyrequiredifaparticularprojectisjudgedlikelytogiveriseto‘significant’environmentaleffects. Schedule 4 of the EIA Directive sets out the list of information which should be included within an Environmental Statement. This includes “..A description of the aspects of the environment likely to be significantly affected by the development, including, population…”
EIA should be used to assess the effects (arising during both construction and operation) of development and regeneration schemes on population and human health. Planners should ensure that applicants have considered the likely public health effects of development during the ‘Screening’ and ‘Scoping’ phases of EIA.
Health Impact Assessment (HIA) is a tool to identify the likely public health impacts of developments and could be used to inform the identification of public health effects and the public health chapter of Environmental Statements. PCTs do not have a statutory role to play in EIA but can provide advice and guidance on health impacts during the Screening and Scoping phases and in the drafting health chapters in Environmental Statements. PCTs can also provide training in the use of HIA.
ItisrecognisedthatnotallmajordevelopmentswillrequireEIAandHIAshouldbeusedtoassess the health impacts of these.
Example strategic objective 8: Health impacts
To set a spatial planning framework to minimise the health impacts of new development by:
1. Requiringplannerstoworkinpartnershipwithhealthpractitioners.2. Considering the public health impacts of development as part of the EIA process.3. Requiringmajordevelopmentproposalsandregenerationschemes(whichdonotfall undertheEIARegulations)tobesubjecttoanHIA.

Delivering Healthier Communities in London
116
Example policy 8: Health impacts
Planners will work in partnership with healthcare practitioners from the outset of development proposal formulation to ensure that health impacts and health opportunities are maximised in all new development and regeneration schemes.
EIA is a statutory requirementforcertaintypesofprojects.Thepublichealtheffectsofdevelopment will be considered as part of the EIA process. For example, planners should ensure that applicants have:
• Consideredthelikelypublichealtheffectsduringthe‘Screening’and‘Scoping’of proposals.
• IncorporatedapublichealthchapterwithintheEnvironmentalStatement.
All major development proposals and regeneration schemes not subject to EIA will be accompanied by a HIA.
This policy will be implemented through the consideration of health within Screening and Scoping Opinions and Environmental Statements.
Box 4.5 Testing the ‘soundness’ of the Core Strategy in relation to policies91
In preparing policies, has the LPA:
• Providedarobustandcredibleevidencebasefromwhichtobasetheirpolicies?
• Addressedspecifichealthissues?
• CorrectlyandeffectivelysetobjectivesforpoliciesinlinewithSMARTprinciples?
• Formulatedpolicieswhichcandelivertheproposedobjectives?
• Setmechanismsforimplementingandmonitoringthepolicies?
4.2 GOOD PRACTICE HEALTH POLICY WORDING
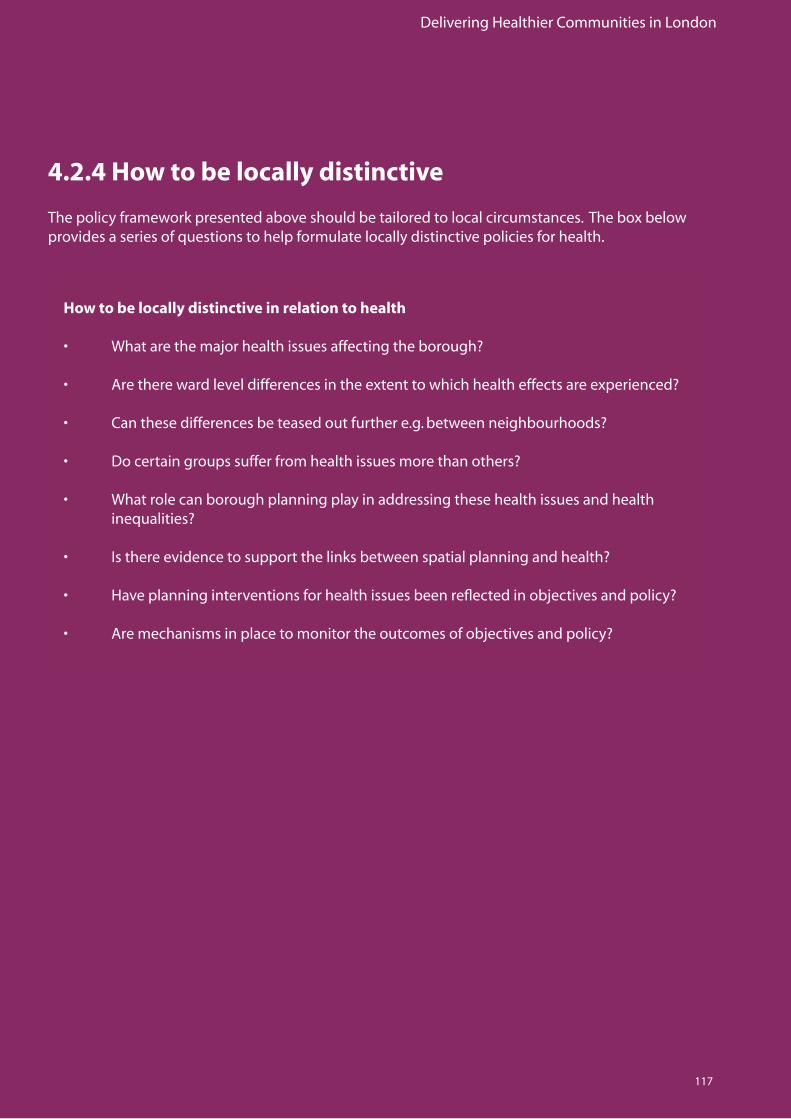
Delivering Healthier Communities in London
117
4.2.4 How to be locally distinctive
The policy framework presented above should be tailored to local circumstances. The box below providesaseriesofquestionstohelpformulatelocallydistinctivepoliciesforhealth.
How to be locally distinctive in relation to health
• Whatarethemajorhealthissuesaffectingtheborough?
• Aretherewardleveldifferencesintheextenttowhichhealtheffectsareexperienced?
• Canthesedifferencesbeteasedoutfurthere.g.betweenneighbourhoods?
• Docertaingroupssufferfromhealthissuesmorethanothers?
• Whatrolecanboroughplanningplayinaddressingthesehealthissuesandhealth inequalities?
• Isthereevidencetosupportthelinksbetweenspatialplanningandhealth?
• Haveplanninginterventionsforhealthissuesbeenreflectedinobjectivesandpolicy?
• Aremechanismsinplacetomonitortheoutcomesofobjectivesandpolicy?

Delivering Healthier Communities in London
118
4.2.5 Health as a Cross-Cutting Issue
Sections 4.2.1 - 4.2.4 have set out health as an individual topic within a Core Strategy. The matrix below provides a means to identify the links between health issues and conventional Core Strategy topics for those adopting a cross-cutting approach. For example, access to greenspace/open space (often considered under the ‘Natural Environment’ topic) would be of benefit to a numberofthepublichealthissueswehaveidentified,MentalHealth,ObesityandCardiovasculardisease. The HUDU Watch-Out for Health Checklist provides a more comprehensive source of such linkages.
Beyond the Matrix: How to incorporate Health as a Cross-cutting Issue
Those undertaking a cross-cutting approach should be aware that merely noting the links between health and plan topics in a matrix is not enough.
Planners and others must:
• Identifylocally-specifichealthissues.• Quantifywhathealthoutcomestheplanisseekingtoachieve.• Demonstratewhichhealthoutcomeswillbeachievedbyeachpolicywherethe intersection with health is identified in the matrix. • EnsurethatALL health issues and outcomes have been addressed under appropriate plantopicsandreflectedinobjectivesandpolicy.
Adopting the cross-cutting approach still means that the approach outlined in section 4.2 must be followed:
Evidence –> Issues –> Vision –> Objectives -> Policy
See
htt
p:/
/ww
w.h
ealt
hyu
rban
dev
elo
pm
ent.
nh
s.u
k/d
ocu
men
ts/
chec
klis
t_fo
r_h
ealt
h/W
atch
_Ou
t_Fo
r_H
ealt
h_P
lan
nin
g_C
hec
klis
t.p
df
20
20
4.2 GOOD PRACTICE HEALTH POLICY WORDING
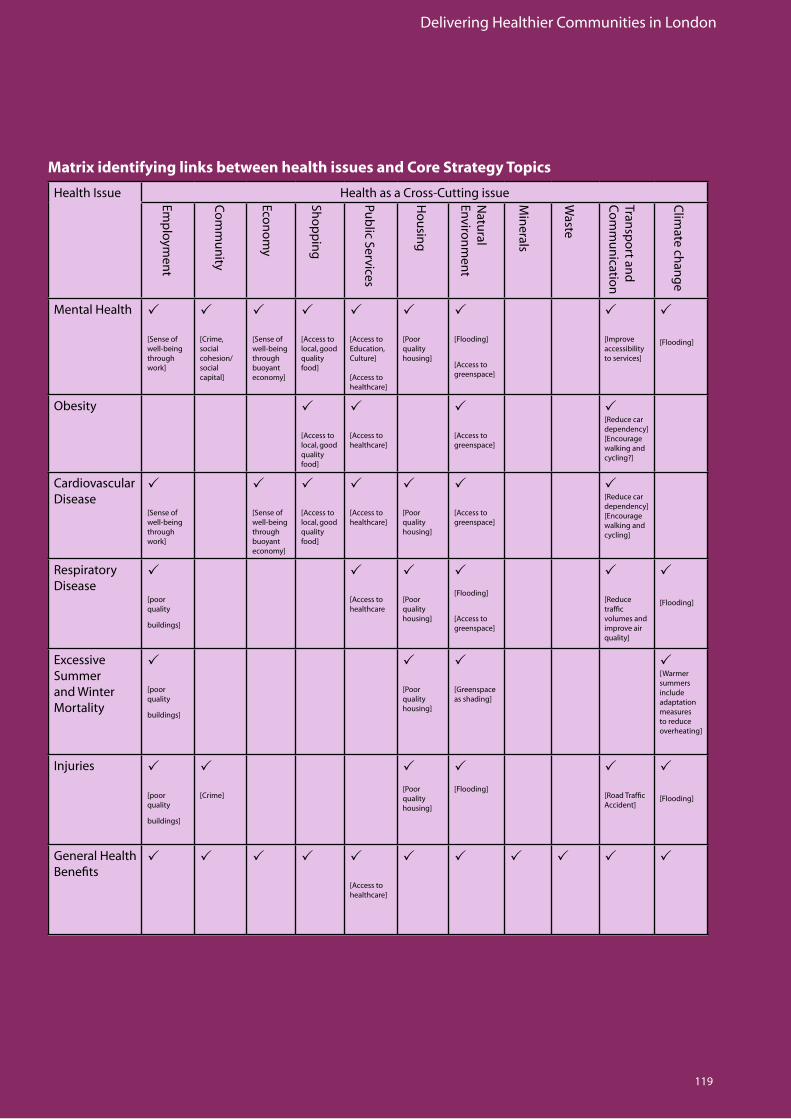
Delivering Healthier Communities in London
119
Health Issue Health as a Cross-Cutting issue
MentalHealth P
[Senseofwell-being through work]
P
[Crime,social cohesion/social capital]
P
[Senseofwell-being through buoyant economy]
P
[Accesstolocal, good qualityfood]
P
[AccesstoEducation, Culture]
[Accesstohealthcare]
P
[Poorqualityhousing]
P
[Flooding]
[Accesstogreenspace]
P
[Improveaccessibility toservices]
P
[Flooding]
Obesity P
[Accesstolocal, good qualityfood]
P
[Accesstohealthcare]
P
[Accesstogreenspace]
P[Reducecardependency][Encouragewalking and cycling?]
Cardiovascular Disease
P
[Senseofwell-being through work]
P
[Senseofwell-being through buoyant economy]
P
[Accesstolocal, good qualityfood]
P
[Accesstohealthcare]
P
[Poorqualityhousing]
P
[Accesstogreenspace]
P[Reducecardependency][Encouragewalking and cycling]
RespiratoryDisease
P
[poorquality
buildings]
P
[Accesstohealthcare
P
[Poorqualityhousing]
P[Flooding]
[Accesstogreenspace]
P
[Reducetraffic volumes and improve air quality]
P
[Flooding]
Excessive Summer and Winter Mortality
P
[poorquality
buildings]
P
[Poorqualityhousing]
P
[Greenspaceasshading]
P[Warmersummers include adaptation measures to reduce overheating]
Injuries P
[poorquality
buildings]
P
[Crime]
P[Poorqualityhousing]
P
[Flooding]
P
[RoadTrafficAccident]
P
[Flooding]
General Health Benefits
P P P P P
[Accesstohealthcare]
P P P P P P
Emp
loymen
t
Co
mm
un
ity
Econ
om
y
Sho
pp
ing
Pub
lic Services
Ho
usin
g
Natu
ral Enviro
nm
ent
Min
erals
Waste
Transp
ort an
d
Co
mm
un
ication
Clim
ate chan
ge
Matrix identifying links between health issues and Core Strategy Topics
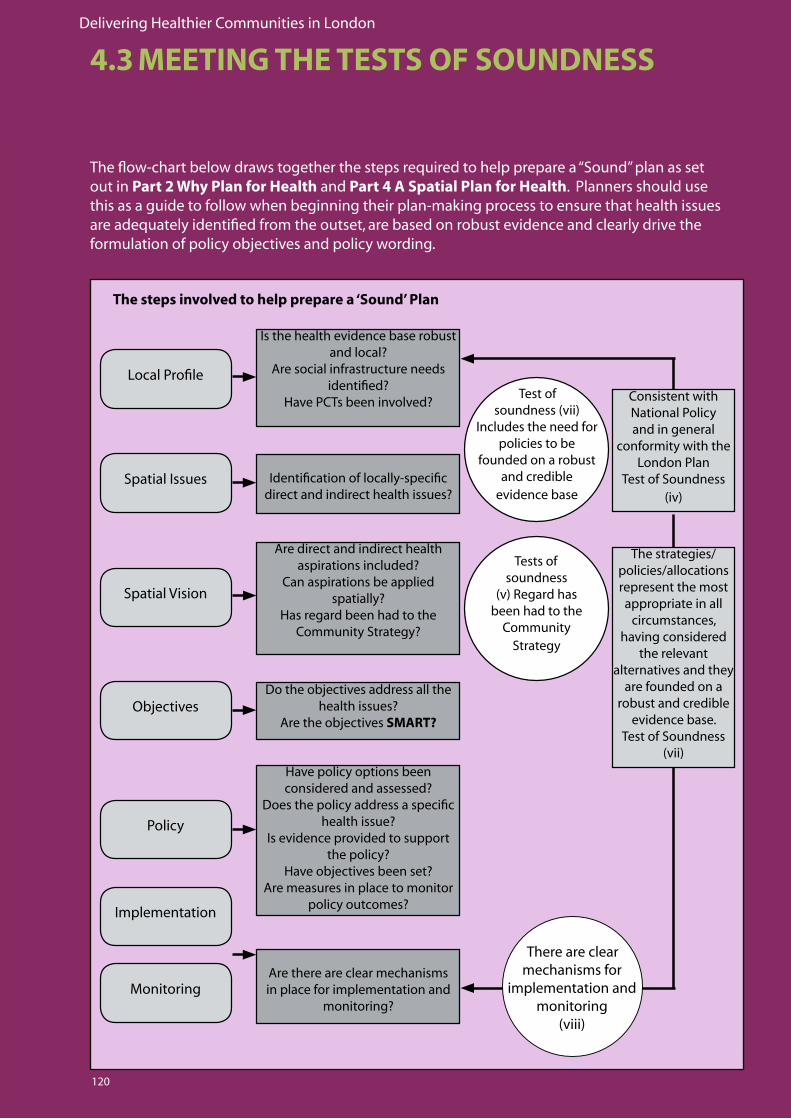
Delivering Healthier Communities in London
120
4.3 MEETING THE TESTS OF SOUNDNESS
Theflow-chartbelowdrawstogetherthestepsrequiredtohelppreparea“Sound”planassetout in Part 2 Why Plan for Health and Part 4 A Spatial Plan for Health. Planners should use this as a guide to follow when beginning their plan-making process to ensure that health issues areadequatelyidentifiedfromtheoutset,arebasedonrobustevidenceandclearlydrivetheformulation of policy objectives and policy wording.
Is the health evidence base robust and local?
Are social infrastructure needs identified?
Have PCTs been involved?
Identification of locally-specific direct and indirect health issues?
Are direct and indirect health aspirations included?
Can aspirations be applied spatially?
Has regard been had to the Community Strategy?
Do the objectives address all the health issues?
Are the objectives SMART?
Have policy options been considered and assessed?
Does the policy address a specific health issue?
Is evidence provided to support the policy?
Have objectives been set? Are measures in place to monitor
policy outcomes?
Local Profile
Spatial Issues
Spatial Vision
Objectives
Policy
Test of soundness (vii)
Includes the need for policies to be
founded on a robust and credible
evidence base
Tests of soundness
(v) Regard has been had to the
Community Strategy
There are clear mechanisms for
implementation and monitoring
(viii)
Consistent with National Policy and in general
conformity with the London Plan
Test of Soundness (iv)
The strategies/policies/allocations represent the most appropriate in all
circumstances, having considered
the relevant alternatives and they
are founded on a robust and credible
evidence base. Test of Soundness
(vii)
The steps involved to help prepare a ‘Sound’ Plan
Are there are clear mechanisms in place for implementation and
monitoring?
Implementation
Monitoring
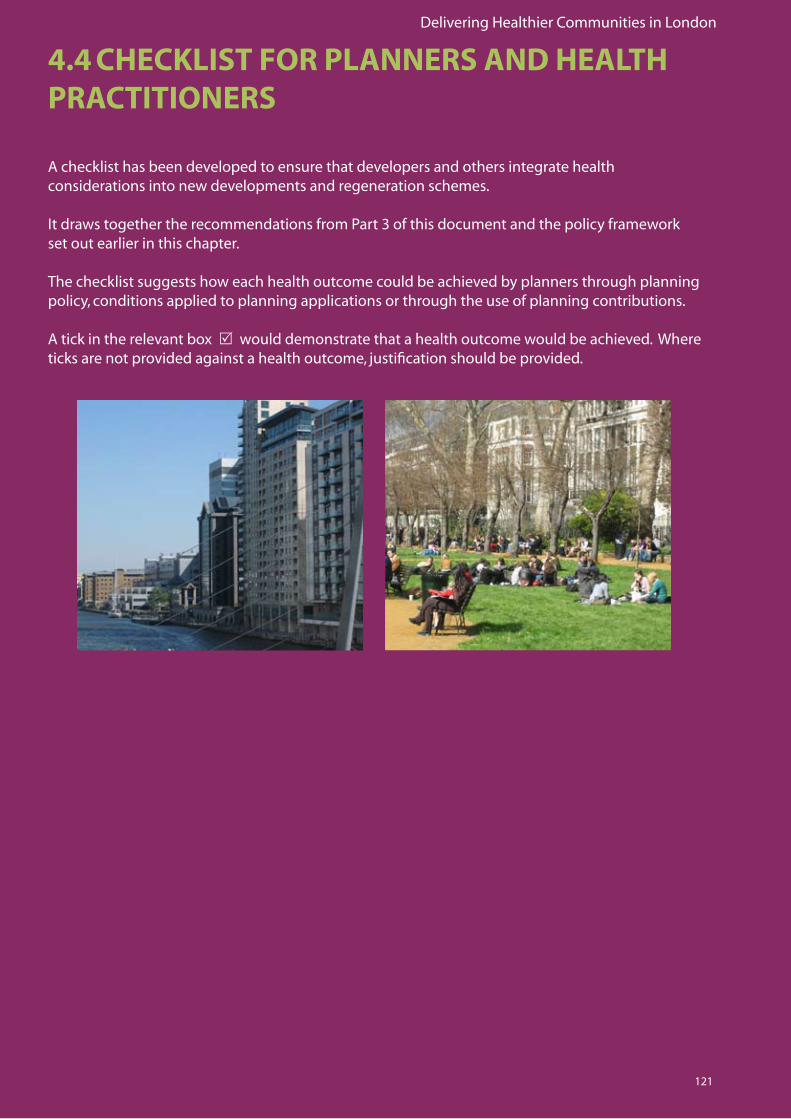
Delivering Healthier Communities in London
121
4.4 CHECKLIST FOR PLANNERS AND HEALTH PRACTITIONERS
A checklist has been developed to ensure that developers and others integrate health considerations into new developments and regeneration schemes.
It draws together the recommendations from Part 3 of this document and the policy framework set out earlier in this chapter.
The checklist suggests how each health outcome could be achieved by planners through planning policy, conditions applied to planning applications or through the use of planning contributions.
A tick in the relevant box R would demonstrate that a health outcome would be achieved. Where ticks are not provided against a health outcome, justification should be provided.
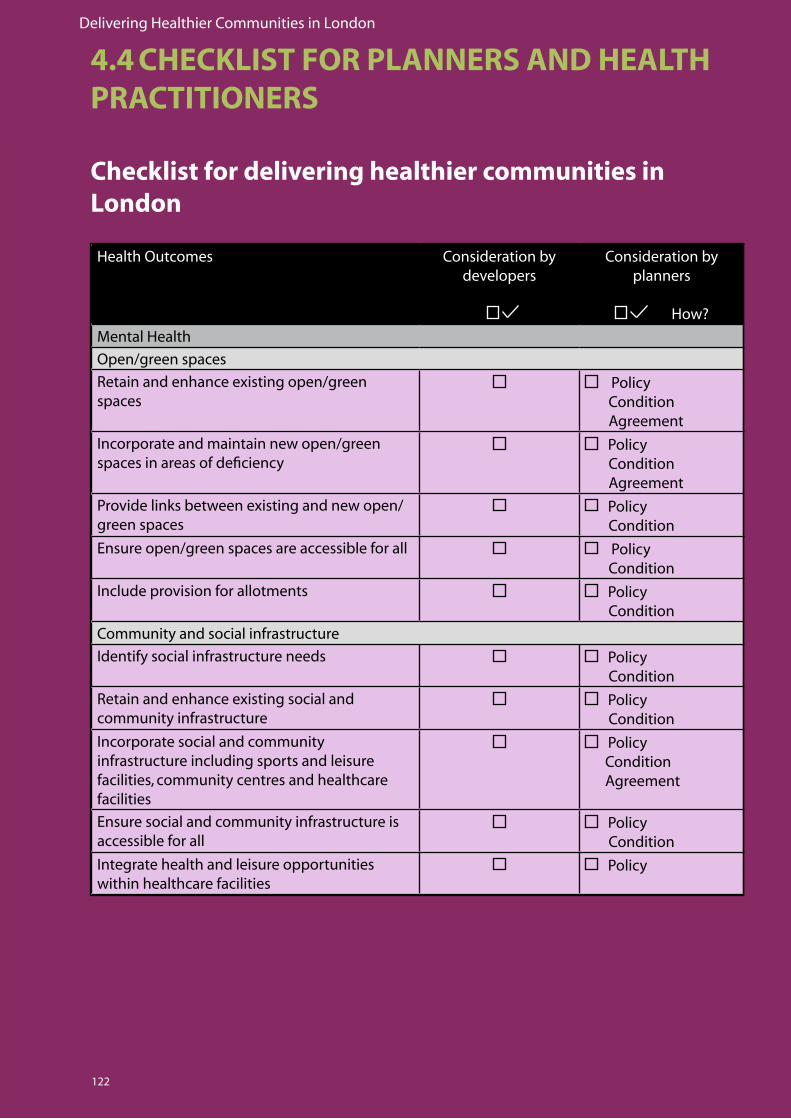
Delivering Healthier Communities in London
122
Health Outcomes Consideration by developers
Consideration by planners
How?
MentalHealth
Open/green spaces
Retainandenhanceexistingopen/greenspaces
Policy Condition Agreement
Incorporate and maintain new open/green spaces in areas of deficiency
Policy Condition Agreement
Provide links between existing and new open/green spaces
Policy Condition
Ensure open/green spaces are accessible for all Policy Condition
Include provision for allotments Policy Condition
Community and social infrastructure
Identify social infrastructure needs Policy Condition
Retainandenhanceexistingsocialandcommunity infrastructure
Policy Condition
Incorporate social and community infrastructure including sports and leisure facilities, community centres and healthcare facilities
Policy Condition Agreement
Ensure social and community infrastructure is accessible for all
Policy Condition
Integrate health and leisure opportunities within healthcare facilities
Policy
Checklist for delivering healthier communities in London
4.4 CHECKLIST FOR PLANNERS AND HEALTH PRACTITIONERS

Delivering Healthier Communities in London
123
Health Outcomes Consideration by developers
Consideration by planners
How?
Crime
Provide places with well-defined routes, spaces and entrances
Policy
Maximiseactivefrontages Policy
Clearly define public and private space Policy
Provideadequateandnaturalsurveillance Policy
Promote activity that is appropriate to the area Policy
Avoid creation of gated communities Policy
Include provision for future management and maintenance
Policy Agreement
Flooding
Locatedevelopmenttoavoidfloodriskareas Policy
LayoutinFloodRiskAreas• InclusionofSustainableUrban Drainage Systems• Inclusionofwatercoursesthroughout site• Developmentsetbackfromexistingflooddefences?• Isinfrastructureorientatedaccordingtofloodriskvulnerability?
Policy Condition
Obesity and Cardio-vascular disease
Open/green spaces
See principles set out under mental health
Sport and recreation facilities
Protect, retain or enhance existing sports and leisure facilities
Policy
Incorporate new facilities for sports, recreation and children’s play
Policy Condition Agreement
Ensure sport and recreation facilities are accessible for all
Policy Condition
Integrate health and leisure opportunities within healthcare facilities
Policy
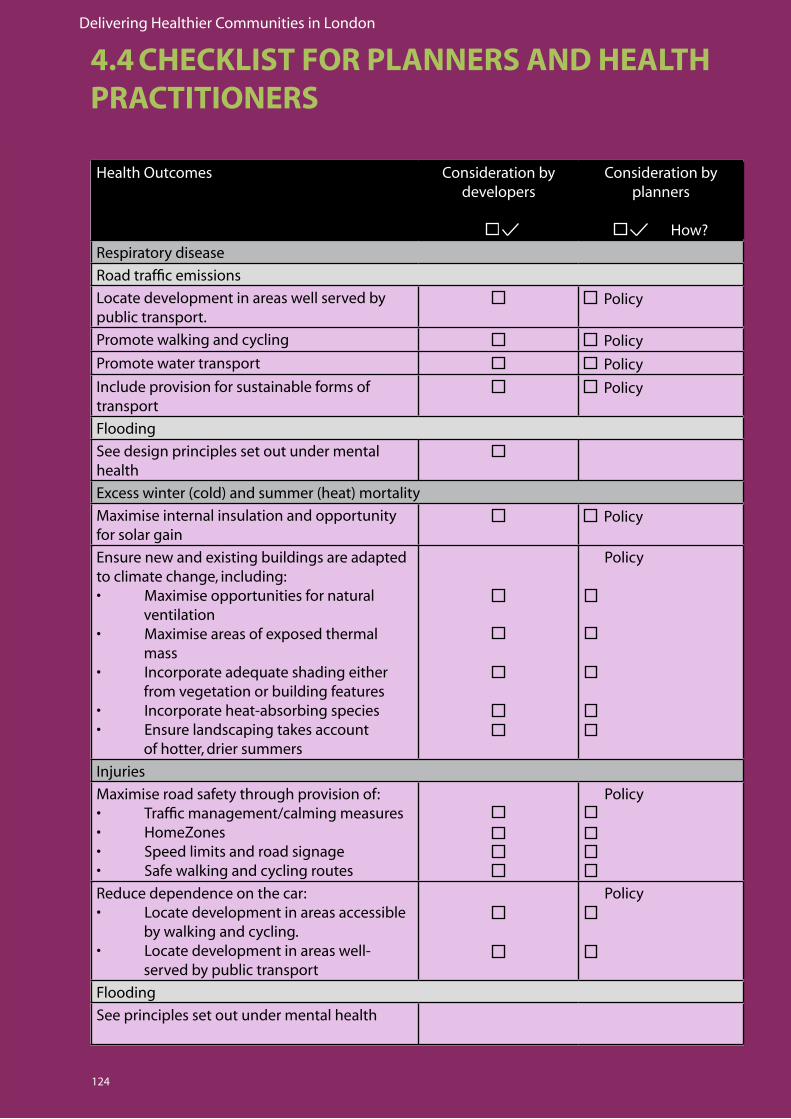
Delivering Healthier Communities in London
124
Health Outcomes Consideration by developers
Consideration by planners
How?
Respiratorydisease
Roadtrafficemissions
Locate development in areas well served by public transport.
Policy
Promote walking and cycling Policy
Promote water transport Policy
Include provision for sustainable forms of transport
Policy
Flooding
See design principles set out under mental health
Excess winter (cold) and summer (heat) mortality
Maximiseinternalinsulationandopportunityfor solar gain
Policy
Ensure new and existing buildings are adapted to climate change, including:• Maximiseopportunitiesfornatural ventilation• Maximiseareasofexposedthermal mass • Incorporateadequateshadingeither from vegetation or building features• Incorporateheat-absorbingspecies• Ensurelandscapingtakesaccount of hotter, drier summers
Policy
Injuries
Maximiseroadsafetythroughprovisionof:• Trafficmanagement/calmingmeasures• HomeZones• Speedlimitsandroadsignage• Safewalkingandcyclingroutes
Policy
Reducedependenceonthecar:• Locatedevelopmentinareasaccessible by walking and cycling.• Locatedevelopmentinareaswell- served by public transport
Policy
Flooding
See principles set out under mental health
4.4 CHECKLIST FOR PLANNERS AND HEALTH PRACTITIONERS

Delivering Healthier Communities in London
125
Health Outcomes Consideration by developers
Consideration by planners
How?
General
Mixofuses
Provision for or enhancement of a mix of uses, including access to shops providing a range of food choices.
Policy
High Density Development
Appropriate density Policy Condition
Minimisehigh-riseanddeckaccessbuildings Policy
Ensure high density housing: • Minimisesoverlookingbetween properties• Isamixofhouseholdtypesandtenures• Isdesignedtoavoid‘neighbournoise’• Includes‘escape’facilities (e.g. green/open spaces, social, community and sports facilities)
Policy
Include provision for future management and maintenance
Policy
Buildings
Design residential buildings to Sustainable Code for Buildings Level 6 “Exemplar” development
DesignallotherbuildingstoBREEAM“Excellent” standards.
Design homes as Lifetime Homes
Other
Consider appropriate phasing of development (e.g. ensuring social and community infrastructure is in place prior to residents’ occupation).
Condition
Ensure community empowerment/involvement in regeneration schemes
Policy
Consider the public health impacts within EIA Policy
Carry out HIA of major development and where appropriate in other schemes
Policy
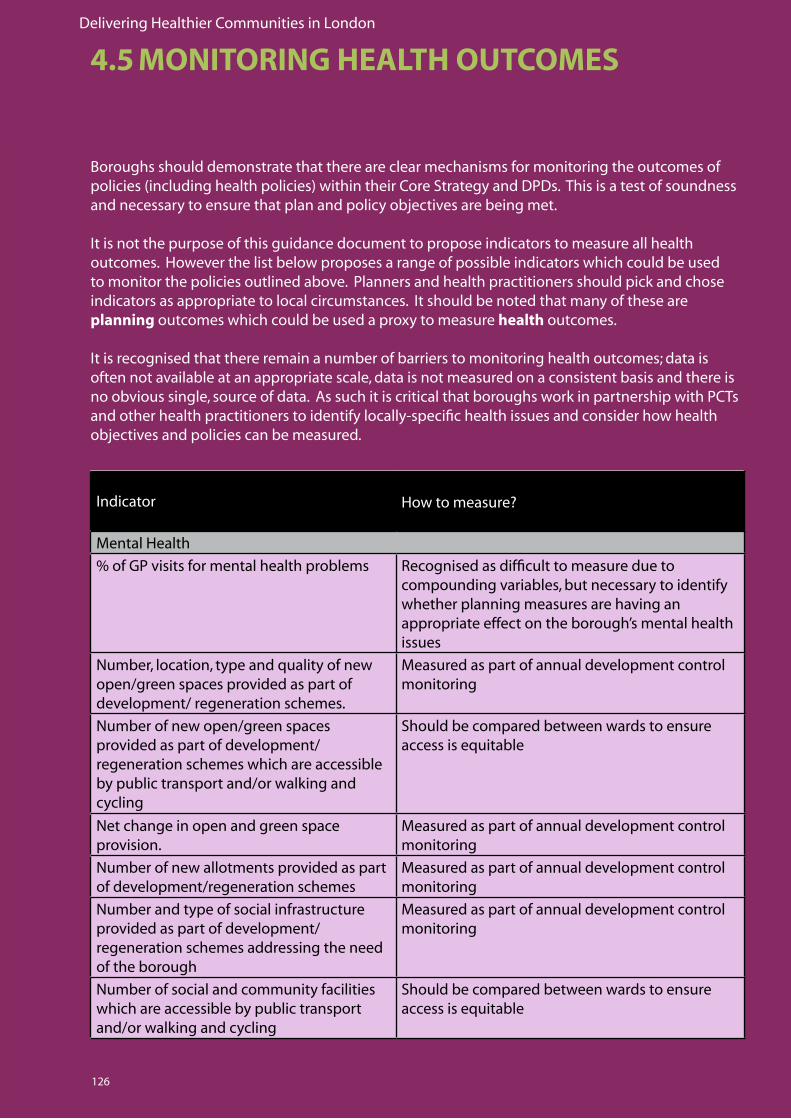
Delivering Healthier Communities in London
126
Indicator How to measure?
MentalHealth
% of GP visits for mental health problems Recognisedasdifficulttomeasureduetocompounding variables, but necessary to identify whether planning measures are having an appropriate effect on the borough’s mental health issues
Number,location,typeandqualityofnewopen/green spaces provided as part of development/ regeneration schemes.
Measuredaspartofannualdevelopmentcontrolmonitoring
Number of new open/green spaces provided as part of development/ regeneration schemes which are accessible by public transport and/or walking and cycling
Should be compared between wards to ensure accessisequitable
Net change in open and green space provision.
Measuredaspartofannualdevelopmentcontrolmonitoring
Number of new allotments provided as part of development/regeneration schemes
Measuredaspartofannualdevelopmentcontrolmonitoring
Number and type of social infrastructure provided as part of development/ regeneration schemes addressing the need of the borough
Measuredaspartofannualdevelopmentcontrolmonitoring
Number of social and community facilities which are accessible by public transport and/or walking and cycling
Should be compared between wards to ensure accessisequitable
Boroughs should demonstrate that there are clear mechanisms for monitoring the outcomes of policies (including health policies) within their Core Strategy and DPDs. This is a test of soundness and necessary to ensure that plan and policy objectives are being met.
It is not the purpose of this guidance document to propose indicators to measure all health outcomes. However the list below proposes a range of possible indicators which could be used to monitor the policies outlined above. Planners and health practitioners should pick and chose indicators as appropriate to local circumstances. It should be noted that many of these are planning outcomes which could be used a proxy to measure health outcomes. It is recognised that there remain a number of barriers to monitoring health outcomes; data is often not available at an appropriate scale, data is not measured on a consistent basis and there is no obvious single, source of data. As such it is critical that boroughs work in partnership with PCTs and other health practitioners to identify locally-specific health issues and consider how health objectives and policies can be measured.
4.5 MONITORING HEALTH OUTCOMES
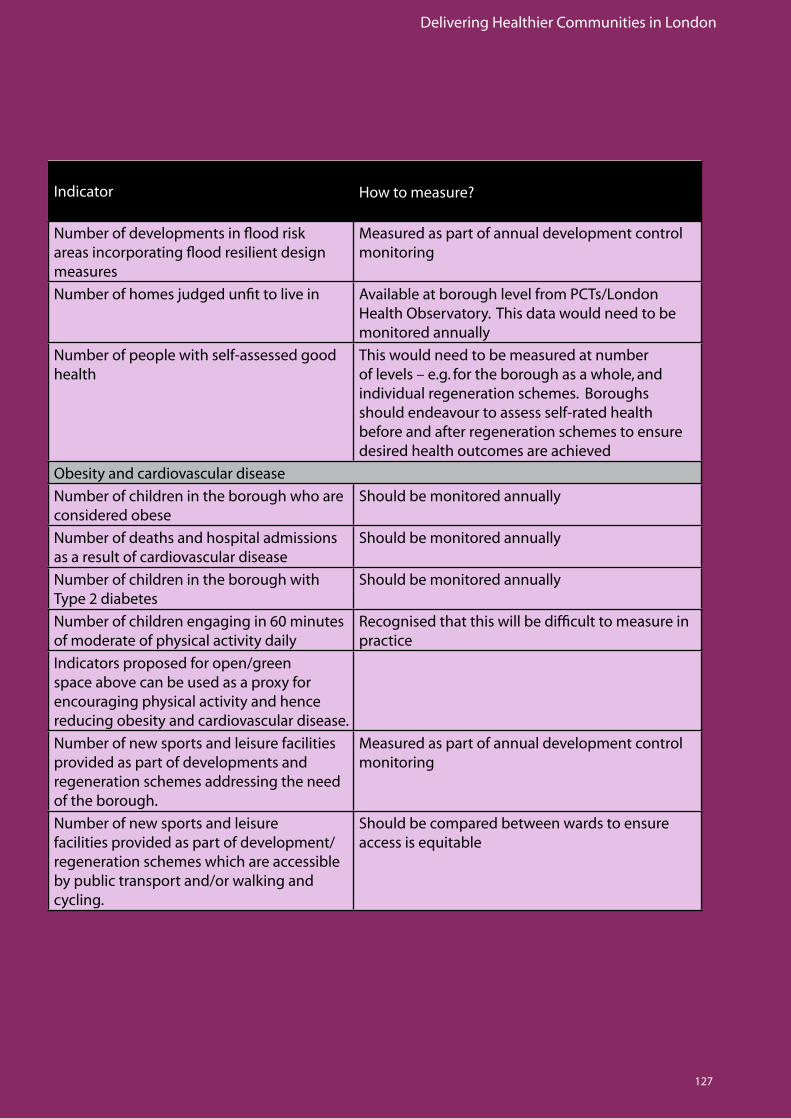
Delivering Healthier Communities in London
127
Indicator How to measure?
Numberofdevelopmentsinfloodriskareasincorporatingfloodresilientdesignmeasures
Measuredaspartofannualdevelopmentcontrolmonitoring
Number of homes judged unfit to live in Available at borough level from PCTs/London Health Observatory. This data would need to be monitored annually
Number of people with self-assessed good health
This would need to be measured at number of levels – e.g. for the borough as a whole, and individual regeneration schemes. Boroughs should endeavour to assess self-rated health before and after regeneration schemes to ensure desired health outcomes are achieved
Obesity and cardiovascular disease
Number of children in the borough who are considered obese
Should be monitored annually
Number of deaths and hospital admissions as a result of cardiovascular disease
Should be monitored annually
Number of children in the borough with Type 2 diabetes
Should be monitored annually
Number of children engaging in 60 minutes of moderate of physical activity daily
Recognisedthatthiswillbedifficulttomeasureinpractice
Indicators proposed for open/green space above can be used as a proxy for encouraging physical activity and hence reducing obesity and cardiovascular disease.
Number of new sports and leisure facilities provided as part of developments and regeneration schemes addressing the need of the borough.
Measuredaspartofannualdevelopmentcontrolmonitoring
Number of new sports and leisure facilities provided as part of development/regeneration schemes which are accessible by public transport and/or walking and cycling.
Should be compared between wards to ensure accessisequitable
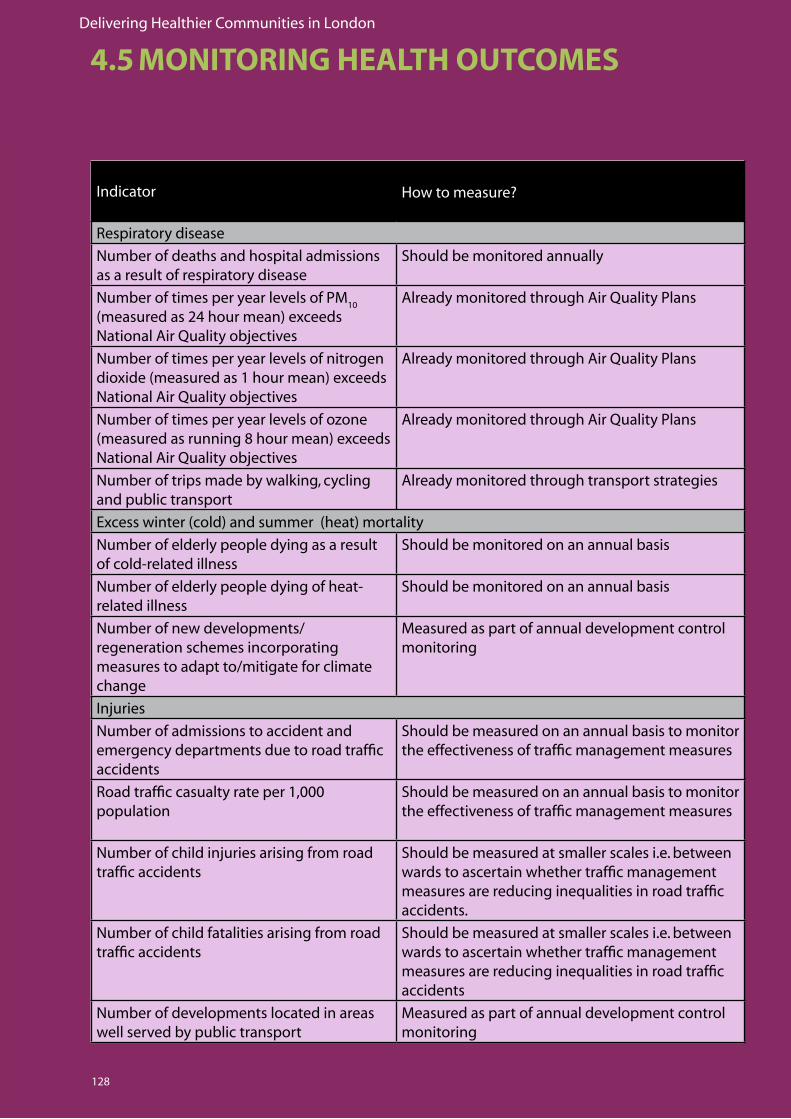
Delivering Healthier Communities in London
128
Indicator How to measure?
Respiratorydisease
Number of deaths and hospital admissions as a result of respiratory disease
Should be monitored annually
NumberoftimesperyearlevelsofPM10
(measured as 24 hour mean) exceeds NationalAirQualityobjectives
AlreadymonitoredthroughAirQualityPlans
Number of times per year levels of nitrogen dioxide (measured as 1 hour mean) exceeds NationalAirQualityobjectives
AlreadymonitoredthroughAirQualityPlans
Number of times per year levels of ozone (measured as running 8 hour mean) exceeds NationalAirQualityobjectives
AlreadymonitoredthroughAirQualityPlans
Number of trips made by walking, cycling and public transport
Already monitored through transport strategies
Excess winter (cold) and summer (heat) mortality
Number of elderly people dying as a result of cold-related illness
Should be monitored on an annual basis
Number of elderly people dying of heat-related illness
Should be monitored on an annual basis
Number of new developments/ regeneration schemes incorporating measures to adapt to/mitigate for climate change
Measuredaspartofannualdevelopmentcontrolmonitoring
Injuries
Number of admissions to accident and emergency departments due to road traffic accidents
Should be measured on an annual basis to monitor the effectiveness of traffic management measures
Roadtrafficcasualtyrateper1,000population
Should be measured on an annual basis to monitor the effectiveness of traffic management measures
Number of child injuries arising from road traffic accidents
Should be measured at smaller scales i.e. between wards to ascertain whether traffic management measuresarereducinginequalitiesinroadtrafficaccidents.
Number of child fatalities arising from road traffic accidents
Should be measured at smaller scales i.e. between wards to ascertain whether traffic management measuresarereducinginequalitiesinroadtrafficaccidents
Number of developments located in areas well served by public transport
Measuredaspartofannualdevelopmentcontrolmonitoring
4.5 MONITORING HEALTH OUTCOMES
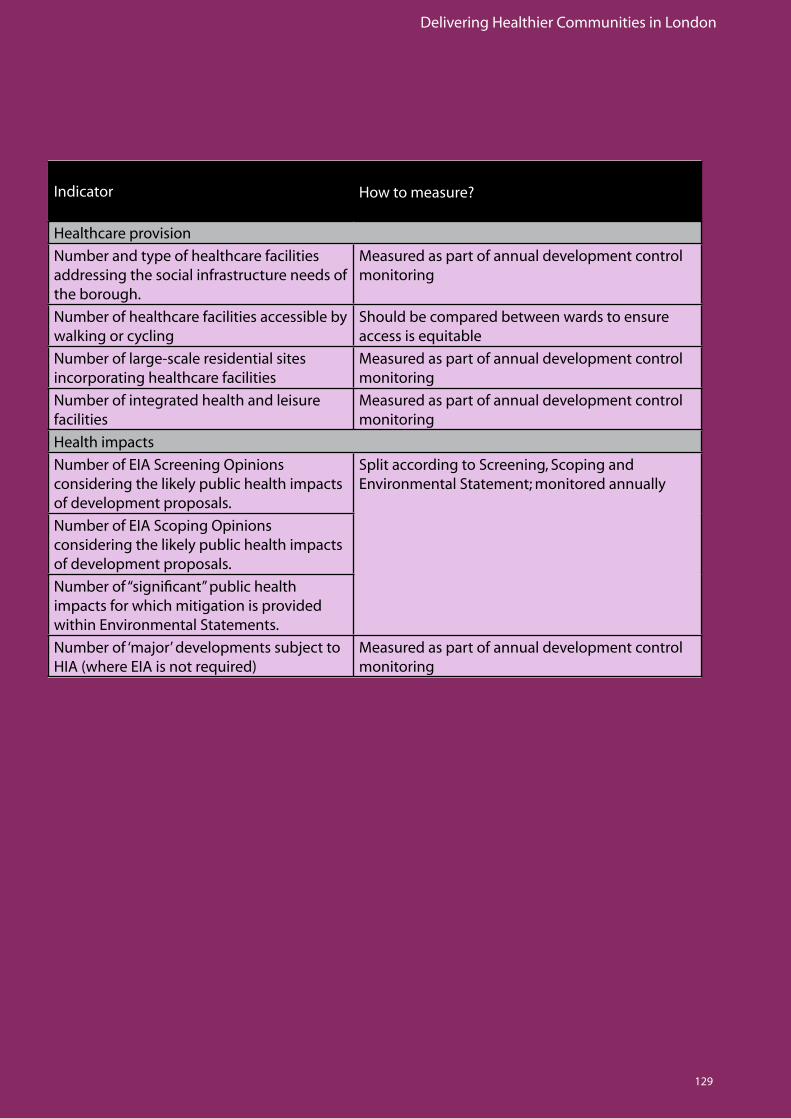
Delivering Healthier Communities in London
129
Indicator How to measure?
Healthcare provision
Number and type of healthcare facilities addressing the social infrastructure needs of the borough.
Measuredaspartofannualdevelopmentcontrolmonitoring
Number of healthcare facilities accessible by walking or cycling
Should be compared between wards to ensure accessisequitable
Number of large-scale residential sites incorporating healthcare facilities
Measuredaspartofannualdevelopmentcontrolmonitoring
Number of integrated health and leisure facilities
Measuredaspartofannualdevelopmentcontrolmonitoring
Health impacts
Number of EIA Screening Opinions considering the likely public health impacts of development proposals.
Split according to Screening, Scoping and Environmental Statement; monitored annually
Number of EIA Scoping Opinions considering the likely public health impacts of development proposals.
Number of “significant” public health impacts for which mitigation is provided within Environmental Statements.
Number of ‘major’ developments subject to HIA(whereEIAisnotrequired)
Measuredaspartofannualdevelopmentcontrolmonitoring

Delivering Healthier Communities in London
130

Delivering Healthier Communities in London
131
REFERENCES
Delivering Healthier Communities in London
132
1. World Health Organisation (1947). The Constitution of the World Health Organisation. WHO Chronicle, 1 WHO, Geneva.
2. Department of Health; HM Government (16th November, 2004): Public Health White Paper: Choosing Health – Making Healthy Choices Easier.
3. G Dahlgren and M Whitehead: Policies and strategies to promote social equity in health, Institute of Futures Studies, Stockholm, 1991.
4. Greater London Authority (September 2006). Draft Further Alterations to the London Plan (Spatial Development Strategy for Greater London).
5. The WHO European Healthy Cities Network: http://www.euro.who.int/healthy-cities
6. The WHO (1992) Twenty Steps for Developing a Healthy Cities Project. WHO Regional Office for Europe, Copenhagen.
7. The Settlement Model cited in: Barton, H; Davis, G and Guise, R (2003) Shaping Neighbourhoods, Spon, London.
8. Wanless, Derek, HM Treasury (February 2004): Securing Good Health for the Whole Population: Final Report.
9. Confederation of British Industry (May, 2001): Pulling Together.
10. Health in All Policies: Prospects and Potentials. Edited by Timo Stahl, Matthias Wismar, Eeva Ollila, Eero Lahtinen & Kimmo Leppo.
11. Department of Health (2007): Draft Guidance on Health in Strategic Environmental Assessment: Consultation Document.
12. Mayor of London (June 2007): Health Issues in Planning: Best Practice Guidance.
13. Department of Health (1999): Saving Lives our Healthier Nation – Action Plan.
14. Department for Health (2003): Tackling Health Inequalities: A Programme for Action.
15. Derek Wanless (2004): Securing good health for the whole population – Report to the Treasury.
16. Department for Health (November 2004): Choosing Health: Making healthier choices easieir.
17. Department for Health (2006): Our health, our care, our say: A new direction for community services.
18. Local Area Agreements: www.communities.gov.uk/index.asp?id=1163655
19. Public Service Agreements: http://www.hm-treasury.gov.uk/spending_review/spend_sr04/psa/ spend_sr04_psaindex.cfm
Delivering Healthier Communities in London
133
20. (ODPM, 2005): Planning Policy Statement 1: Delivering Sustainable Development
21. Department for Environment, Food and Rural Affairs (May, 1999) Securing the Future: UK Government Sustainable Development Strategy.
22. Royal Commission on Environmental Pollution (March 2007): 26th Report: The Urban environment 23. Sustainable Development Commission (2007): Building Houses or Creating Communities: A Review of Government Progress on Sustainable Communities
24. The Mayor’s Strategies include the transport strategy, the London Development Agency strategy, the spatial development strategy, the London Biodiversity Action Plan, the municipal waste management strategy, the London air quality strategy, the London ambient noise strategy and the culture strategy.
25. Mayor of London (May 2006): Sustainable Design and Construction: The London Plan Supplementary Planning Guidance.
26. Mayor of London (April 2004): Accessible London: Achieving an Inclusive Environment: The London Plan Supplementary Planning Guidance.
27. Mayor of London (June 2007): Health Issues in Planning: Best Practice Guidance.
28. NHS London Healthy Urban Development Unit: Watch Out For Health Planning Checklist.
29. Under the reforms of the planning system, PPGs are gradually being reviewed and replaced by PPSs.
30. (ODPM, 2004): Planning Policy Statement 12: Local Development Frameworks
31. Department of Health (2007): Draft Guidance on Health in Strategic Environmental Assessment: Consultation Document.
32. Lewis G, Booth M. Are cities bad for your mental health? Psychological Medicine 1994; 24:913-915
33. Takano T, Nakamura K, Watanbe M. Urban residential environments and senior citizens: longevity in megacity areas – the importance of walkable green spaces. Journal of Epidemiology and Community Health 2002; 56(12): 913-918.
34. Mutrie N. The relationship between physical activity and clinically defined depression. In: Biddle SJH, Fox KR, Boutcher SH (eds). Physical activity and psychological well-being. London: Routledge, 2000.
35. Wiltshire R. Rewriting the plot: Photographs and Images. http://www.btinternet.com/-richard.wiltshire/le2.htm
36. Richard Louv (2005). Last Child in the Woods: Saving our Children from Nature Deficit Disorder,
Delivering Healthier Communities in London
134
37a. Bartlett S. Does inadequate housing perpetuate children’s poverty? Childhood, 1998; 5:403-420.
37b. Stewart W. Children in flats: A family study. London, England: National Society for the Prevention of Cruelty to Children: 1970.
38a. Evans GW, Wells NM, Moch A. housing and Mental Health: A review of the evidence and a methodological and conceptual critique. J Soc Issues 2003; 59:475-500.
38b. Freeman H. Housing. In: Freeman HL, Ed. Mental Health and the Environment. London, England: Churchill Livingstone; 1984; 197-225.
38c. Gifford R. Satisfaction, health, security and social relationships in high rise buildings. In: Seidel A, Health T, eds. Social Effects of the Built Environment. London, England: E&FN Spon. In Press.
39. Weich S, Blanchard M, Prince M, Burton E, Erens B, Sproston K. Mental health and the built environment: cross sectional survey of individual and contextual risk factors for depression. Br J Psychiatry 2002; 176:428-433.
40. Halpern D. Mental Health and the Built Environment. London, England: Taylor and Francis Ltd. 1995
41. CLG (November 2006): Planning Policy Statement 3: Housing
42. Mayor of London (2005): Housing – The London Plan Supplementary Planning Guidance.
43. Norris F, Kaniasty K. Psychological distress following criminal victimization in the general population – cross-sectional, longitudinal and prospective analyses. Journal of Consulting and Clinical Psychology 1994; 62 (1):111-123
44. Evans D, Fletcher M. Fear of crime: Testing alternative hypotheses. Applied Geography 2000; 20:395- 411.
45. (ODPM, 2005): Planning Policy Statement 1: Delivering Sustainable Development
46. (ODPM, 2005): Planning Policy Statement 6: Planning for Town Centres.
47. Living Streets, Streets are for Living. The importance of streets and public spaces for community life, August 2001: 7-8.
48. CLG (December 2006): Planning Policy Statement 25: Development and Flood Risk.
49. Town and County Planning February 2007 (Volume 76 Number 2).
50. Health Survey for England (HSE) (2002-04 data combined) (http://dh.gov.uk/en/publicationsandstatistics/PublishedSurvey/HealthSurveyforEngland)
51. Mortality Statistics cause. Series DH2 no30. Office for National Statistics, London.
REFERENCES
Delivering Healthier Communities in London
135
52. Pretty J, Griffin M, Sellens M, Pretty C (2003): Green Exercise: Complementary roles of nature, exercise and diet in physical and emotional well-being and implications for public health policy. CES Occasional Paper 2003-1, University of Essex.
53. Kuh, D.J.L and Cooper, C (1992). Physical activity at 36 years: patterns and childhood predictors in a longitudinal study. Journal of Epidemiology and Community Health Vol. 46, pp 114-19.
54. Woolley, H. (2003). Urban Open Spaces. London, Spon Press.
55. Potential Functions and Benefits of Urban Green Spaces Diagram cited in: URGE – Development of Urban Green Spaces to Improve the Quality of Life in Cities and Urban Regions (June, 2004): Making Greener Cities: A Practical Guide.
56. Mayor of London (June, 2007): Health Issues in Planning: Best Practice Guidance.
57. Mayor of London (May 2006): The Mayor’s Food Strategy: Healthy and Sustainable Food for London.
58. Mile End Park Project Summary.
59. Town and County Planning February 2007 (Volume 76 Number 2).
60. Mayor of London (June 2007): Health Issues in Planning: Best Practice Guidance.
61. The guide to community preventative services: What works to promote health? Atlanta, United States Centers for Disease Control and Prevention (2002).
62. Edwards, P. and Tsouros, A. (2006). Promoting physical activity and active living in urban environments: the role of local governments. World Health Organisation.
63. Four commonly used methods to increase physical activity: brief interventions in primary care, exercise referral schemes, pedometers and community-based exercise programmes for walking and cycling. London. National Institute for Health and Clinical Excellence (2006).
64. Sustrans (2006). Active Travel: how to produce active directions for your visitors and staff. London.
65. Department of Health and ad hoc group on the economic appraisal of the health effects of air pollutants. Economic appraisal of health effects of air pollution, report, 1999: Table 1.
66. Mayor of London (September 2002): Cleaning London’s Air: The Mayor’s Air Quality Strategy.
67. Air quality objectives and the deadlines against which these objectives should be met are set out in the UK’s Air Quality Strategy (January, 2000).
68. The UK Air Quality Archive (available at http://www.airquality.co.uk/archive/laqm/laqm.php)
69. The Mayor of London (2007). Health Issues in Planning: Best Practice Guidance.
Delivering Healthier Communities in London
136
70. The Mayor of London (2001): The Mayor’s Transport Strategy.
71. Research shows that of those 20 mph zones introduced in 2002, average speeds had reduced and accident rates had dropped.
72. Sallis, J.F. (2002). Neighbourhood Environment Walkability Scale. Version 12/2002. San Diego University, 2002.
73. Leslie, E et al., (2005). Residents perceptions of walkability attributes in objectively different neighbourhoods: a pilot study. Health and Place 11: 227-236.
74. Help the Aged.
75. CLG (December 2006): Consultation Planning Policy Statement: Planning and Climate Change – Supplement to Planning Policy Statement 1: Tomorrow’s Climate, Today’s Challenges.
76. ODPM (2005): Planning Policy Statement 1: Delivering Sustainable Development.
77. ODPM (2004): Planning Policy Statement 11: Regional Spatial Strategies.
78. ODPM (2004): Planning Policy Statement 12: Local Development Frameworks.
79. CLG (November 2006): Planning Policy Statement 3: Housing.
80. National Statistics, Department for Transport, Table 11 available to the Department for Transport on the 13th of April 2007: Transport Statistics Bulletin, Road Casualties in Great Britain: Quarterly Provisional Estimates, Fourth Quarter 2006.
81a. UNICEF (February 2001): A league table of child deaths by injury in rich nations, Innocenti Report Card No.2
81b. Roberts, I (1996): Safely to School. Lancet: 347: 1642.
81c. Christie, N. (1995): Social, Economic and Environmental Factors in Child Pedestrian Accidents: A Research Review. Project Report 116. Crowthorne: Transport Research Laboratory.
81d. Avery, J.G, Jackson, R.H (1993): Children and their accidents. Sevenoaks: Edward Arnold.
81e. Lyons, R.A, Jones S.J, Deacon, T. et al (2003): Socioeconomic variations in injury in children and older people: population based study. Inj Prev 2003, 9:33-7.
82. Jones, S.J, Lyons, R.A, John, A and Palmer S,R (2005): Traffic Calming Policy can reduce inequalities in child pedestrian injury rates: database study. Inj Prev, 2005; 11: 152 - 156.
83. Transport for London (2006): Central London Congestion Charging: Impacts Monitoring Fourth Annual Report.
REFERENCES
Delivering Healthier Communities in London
137
84. Test of soundness vii states that ‘the strategies/policies/allocations represent the most appropriate in all the circumstances, having considered the relevant alternatives, and they are founded on a robust and credible evidence base’
85. The Core Strategy needs to conform to all nine tests of soundness. The questions set out in Box 4.1 relate specifically to the seventh test of soundness (which includes the consideration of relevant alternatives to strategies/policies/allocations in the plan).
86. ODPM (2004): Planning Policy Statement 12: Local Development Frameworks.
87. The Core Strategy needs to conform to all nine tests of soundness. The questions set out in Box 4.2 relate specifically to the seventh and eighth tests of soundness (including the provision of a robust and credible evidence base and provision of mechanisms for implementation and monitoring).
88. The Core Strategy needs to conform to all nine tests of soundness. The questions set out in Box4.3. relates to the fifth test of soundness (having regard to the authority’s community strategy).
89. Planning Officer’s Society (July, 2005): Policies for Spatial Plans: A guide to writing the policy content of Local Development Documents.
90. ODPM (2003): Survey carried out as part of the relationships between Community Strategies and Local Development Frameworks.
91. The Core Strategy needs to conform to all nine tests of soundness. The questions set out in Box 4.5 relate specifically to the seventh and eighth tests of soundness (including the provisionof a robust and credible evidence base and provision of mechanisms for implementation and monitoring respectively).

Delivering Healthier Communities in London
138

Delivering Healthier Communities in London
139
APPENDICES
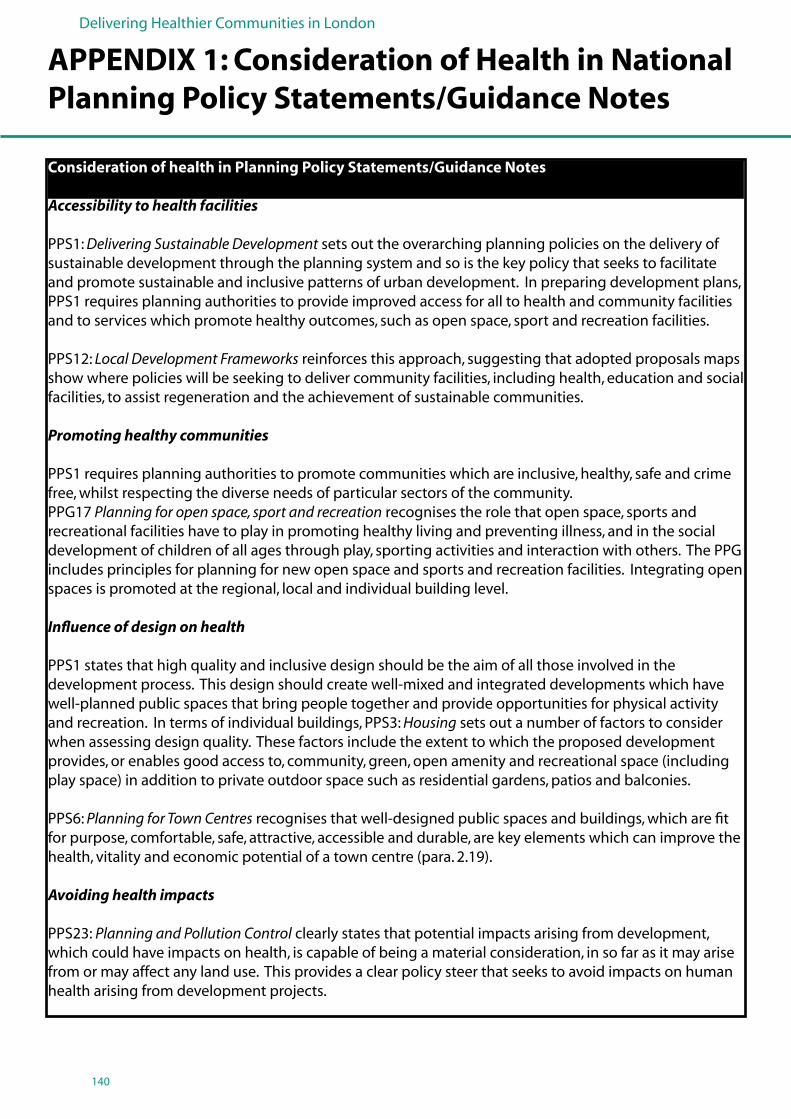
Delivering Healthier Communities in London
140
APPENDIX 1: Consideration of Health in National Planning Policy Statements/Guidance Notes
Accessibility to health facilities
PPS1: Delivering Sustainable Development sets out the overarching planning policies on the delivery of sustainable development through the planning system and so is the key policy that seeks to facilitate and promote sustainable and inclusive patterns of urban development. In preparing development plans, PPS1 requires planning authorities to provide improved access for all to health and community facilities and to services which promote healthy outcomes, such as open space, sport and recreation facilities.
PPS12: Local Development Frameworks reinforces this approach, suggesting that adopted proposals maps show where policies will be seeking to deliver community facilities, including health, education and social facilities, to assist regeneration and the achievement of sustainable communities.
Promoting healthy communities
PPS1 requires planning authorities to promote communities which are inclusive, healthy, safe and crime free, whilst respecting the diverse needs of particular sectors of the community. PPG17 Planning for open space, sport and recreation recognises the role that open space, sports and recreational facilities have to play in promoting healthy living and preventing illness, and in the social development of children of all ages through play, sporting activities and interaction with others. The PPG includes principles for planning for new open space and sports and recreation facilities. Integrating open spaces is promoted at the regional, local and individual building level.
Influence of design on health
PPS1 states that high quality and inclusive design should be the aim of all those involved in the development process. This design should create well-mixed and integrated developments which have well-planned public spaces that bring people together and provide opportunities for physical activity and recreation. In terms of individual buildings, PPS3: Housing sets out a number of factors to consider when assessing design quality. These factors include the extent to which the proposed development provides, or enables good access to, community, green, open amenity and recreational space (including play space) in addition to private outdoor space such as residential gardens, patios and balconies.
PPS6: Planning for Town Centres recognises that well-designed public spaces and buildings, which are fit for purpose, comfortable, safe, attractive, accessible and durable, are key elements which can improve the health, vitality and economic potential of a town centre (para. 2.19).
Avoiding health impacts
PPS23: Planning and Pollution Control clearly states that potential impacts arising from development, which could have impacts on health, is capable of being a material consideration, in so far as it may arise from or may affect any land use. This provides a clear policy steer that seeks to avoid impacts on human health arising from development projects.
Consideration of health in Planning Policy Statements/Guidance Notes
Delivering Healthier Communities in London
141
Similarly, PPS1 advises that development plans should take account of environmental issues such as the management of waste in ways that protect the environment and human health. Whilst PPS10: Planning for Sustainable Waste Management expects modern and well-regulated waste management facilities operated in line with current pollution control techniques to pose little threat to human health, para. 30 reiterates policy set out in PPS23 acknowledging that planning operates in the public interest and seeks to ensure that the location of proposed development is acceptable and that health can be material to such decisions.
Taking into account relevant health strategies and plans
PPS12 requires local planning authorities to take account of the principles and characteristics of other relevant plans and programmes when preparing local development documents and in particular the core strategy. These should include the community strategy and strategies for, among other things, education, health, social inclusion, waste and environmental protection. This will ensure that the overarching objectives of the London Health Strategy and Local Delivery Plans are taken into consideration in the preparation of development plans.
Consideration of health in Planning Policy Statements/Guidance Notes
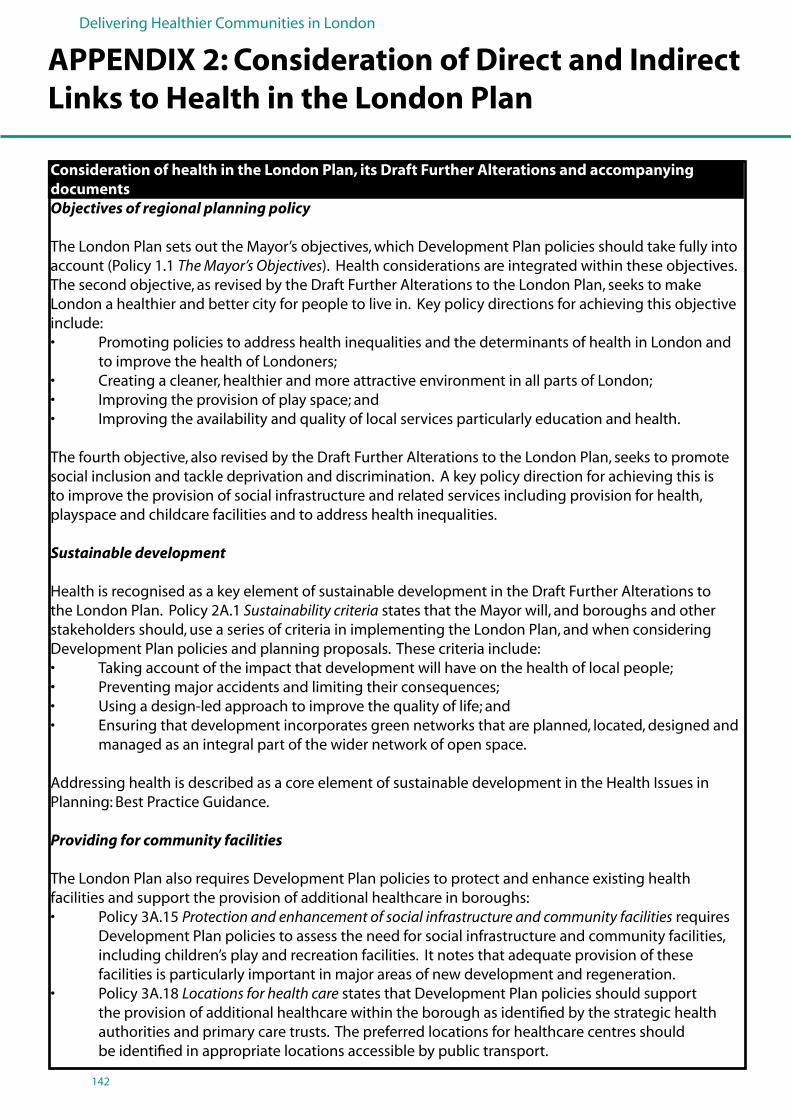
Delivering Healthier Communities in London
142
APPENDIX 2: Consideration of Direct and Indirect Links to Health in the London Plan
Consideration of health in the London Plan, its Draft Further Alterations and accompanying documentsObjectives of regional planning policy
The London Plan sets out the Mayor’s objectives, which Development Plan policies should take fully into account (Policy 1.1 The Mayor’s Objectives). Health considerations are integrated within these objectives. The second objective, as revised by the Draft Further Alterations to the London Plan, seeks to make London a healthier and better city for people to live in. Key policy directions for achieving this objective include:• PromotingpoliciestoaddresshealthinequalitiesandthedeterminantsofhealthinLondonand to improve the health of Londoners;• Creatingacleaner,healthierandmoreattractiveenvironmentinallpartsofLondon;• Improvingtheprovisionofplayspace;and• Improvingtheavailabilityandqualityoflocalservicesparticularlyeducationandhealth.
The fourth objective, also revised by the Draft Further Alterations to the London Plan, seeks to promote social inclusion and tackle deprivation and discrimination. A key policy direction for achieving this is to improve the provision of social infrastructure and related services including provision for health, playspace and childcare facilities and to address health inequalities.
Sustainable development
Health is recognised as a key element of sustainable development in the Draft Further Alterations to the London Plan. Policy 2A.1 Sustainability criteria states that the Mayor will, and boroughs and other stakeholders should, use a series of criteria in implementing the London Plan, and when considering Development Plan policies and planning proposals. These criteria include: • Takingaccountoftheimpactthatdevelopmentwillhaveonthehealthoflocalpeople;• Preventingmajoraccidentsandlimitingtheirconsequences;• Usingadesign-ledapproachtoimprovethequalityoflife;and• Ensuringthatdevelopmentincorporatesgreennetworksthatareplanned,located,designedand managed as an integral part of the wider network of open space.
Addressing health is described as a core element of sustainable development in the Health Issues in Planning: Best Practice Guidance.
Providing for community facilities
The London Plan also requires Development Plan policies to protect and enhance existing health facilities and support the provision of additional healthcare in boroughs:• Policy3A.15Protection and enhancement of social infrastructure and community facilities requires Development Plan policies to assess the need for social infrastructure and community facilities, including children’s play and recreation facilities. It notes that adequate provision of these facilities is particularly important in major areas of new development and regeneration.• Policy3A.18Locations for health care states that Development Plan policies should support the provision of additional healthcare within the borough as identified by the strategic health authorities and primary care trusts. The preferred locations for healthcare centres should be identified in appropriate locations accessible by public transport.
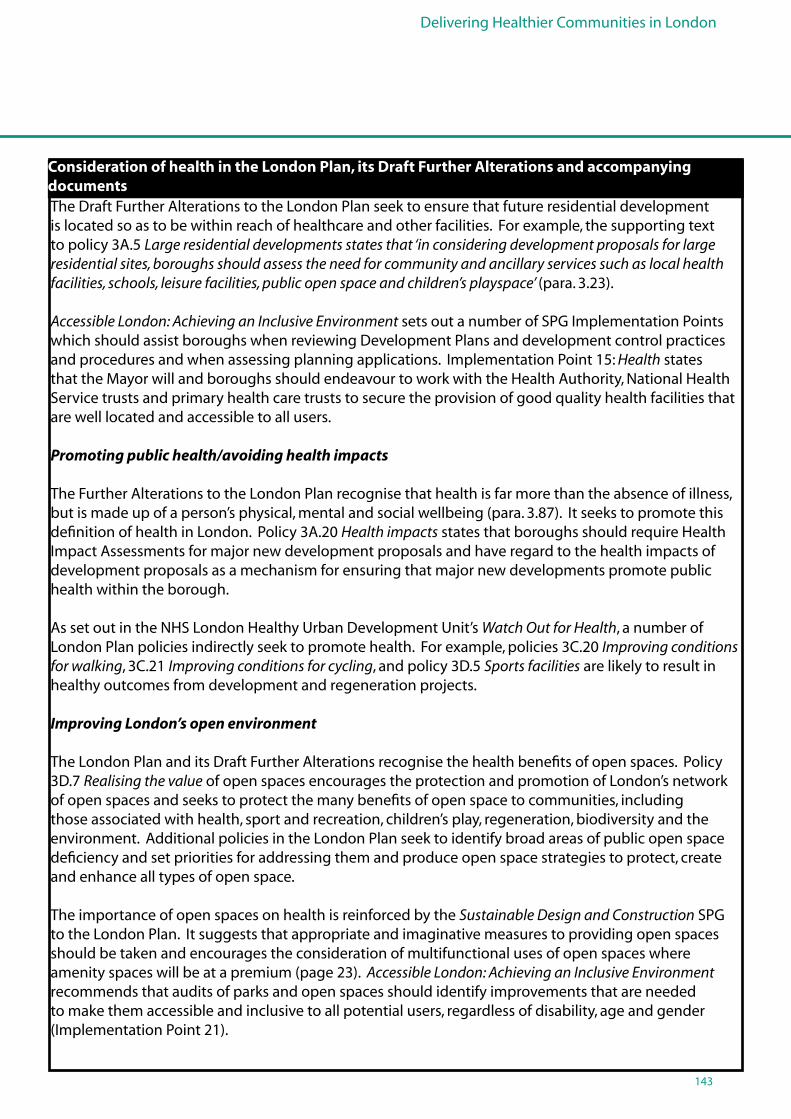
Delivering Healthier Communities in London
143
The Draft Further Alterations to the London Plan seek to ensure that future residential development is located so as to be within reach of healthcare and other facilities. For example, the supporting text to policy 3A.5 Large residential developments states that ‘in considering development proposals for large residential sites, boroughs should assess the need for community and ancillary services such as local health facilities, schools, leisure facilities, public open space and children’s playspace’ (para. 3.23).
Accessible London: Achieving an Inclusive Environment sets out a number of SPG Implementation Points which should assist boroughs when reviewing Development Plans and development control practices and procedures and when assessing planning applications. Implementation Point 15: Health states that the Mayor will and boroughs should endeavour to work with the Health Authority, National Health Service trusts and primary health care trusts to secure the provision of good quality health facilities that are well located and accessible to all users.
Promoting public health/avoiding health impacts
The Further Alterations to the London Plan recognise that health is far more than the absence of illness, but is made up of a person’s physical, mental and social wellbeing (para. 3.87). It seeks to promote this definition of health in London. Policy 3A.20 Health impacts states that boroughs should require Health Impact Assessments for major new development proposals and have regard to the health impacts of development proposals as a mechanism for ensuring that major new developments promote public health within the borough.
As set out in the NHS London Healthy Urban Development Unit’s Watch Out for Health, a number of London Plan policies indirectly seek to promote health. For example, policies 3C.20 Improving conditions for walking, 3C.21 Improving conditions for cycling, and policy 3D.5 Sports facilities are likely to result in healthy outcomes from development and regeneration projects.
Improving London’s open environment
The London Plan and its Draft Further Alterations recognise the health benefits of open spaces. Policy 3D.7 Realising the value of open spaces encourages the protection and promotion of London’s network of open spaces and seeks to protect the many benefits of open space to communities, including those associated with health, sport and recreation, children’s play, regeneration, biodiversity and the environment. Additional policies in the London Plan seek to identify broad areas of public open space deficiency and set priorities for addressing them and produce open space strategies to protect, create and enhance all types of open space.
The importance of open spaces on health is reinforced by the Sustainable Design and Construction SPG to the London Plan. It suggests that appropriate and imaginative measures to providing open spaces should be taken and encourages the consideration of multifunctional uses of open spaces where amenity spaces will be at a premium (page 23). Accessible London: Achieving an Inclusive Environment recommends that audits of parks and open spaces should identify improvements that are needed to make them accessible and inclusive to all potential users, regardless of disability, age and gender (Implementation Point 21).
Consideration of health in the London Plan, its Draft Further Alterations and accompanying documents
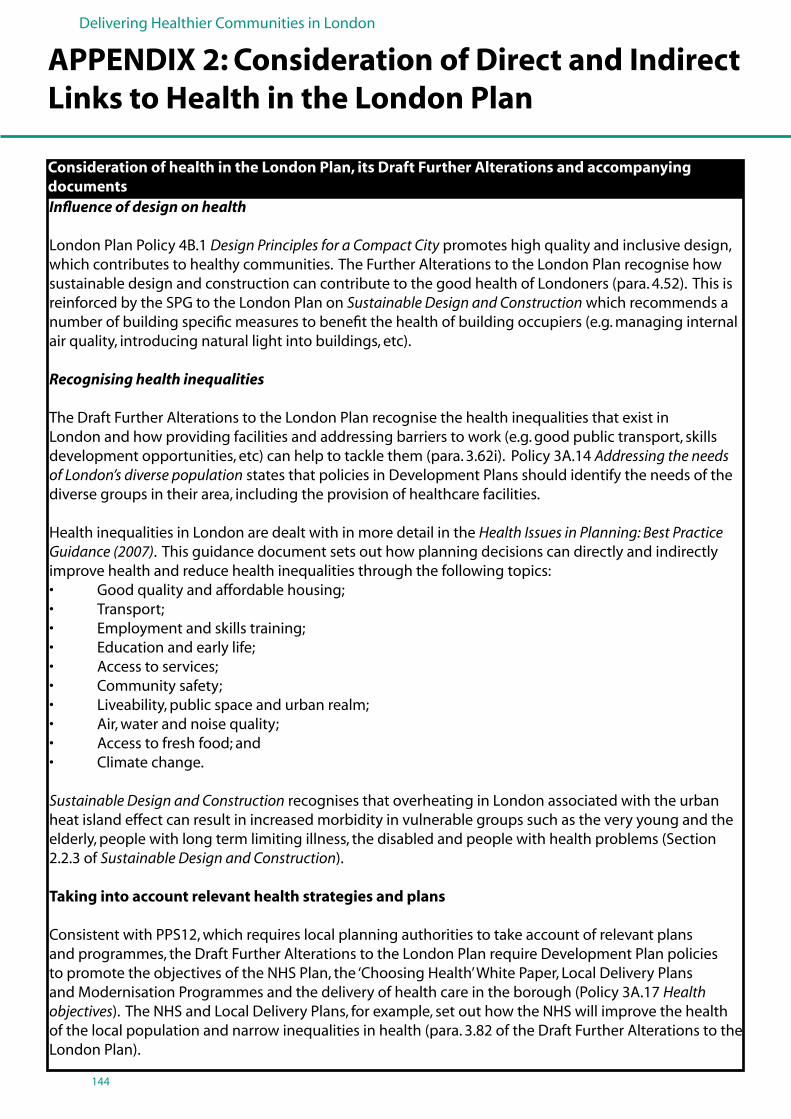
Delivering Healthier Communities in London
144
Influence of design on health
London Plan Policy 4B.1 Design Principles for a Compact City promotes high quality and inclusive design, which contributes to healthy communities. The Further Alterations to the London Plan recognise how sustainable design and construction can contribute to the good health of Londoners (para. 4.52). This is reinforced by the SPG to the London Plan on Sustainable Design and Construction which recommends a number of building specific measures to benefit the health of building occupiers (e.g. managing internal air quality, introducing natural light into buildings, etc).
Recognising health inequalities
The Draft Further Alterations to the London Plan recognise the health inequalities that exist in London and how providing facilities and addressing barriers to work (e.g. good public transport, skills development opportunities, etc) can help to tackle them (para. 3.62i). Policy 3A.14 Addressing the needs of London’s diverse population states that policies in Development Plans should identify the needs of the diverse groups in their area, including the provision of healthcare facilities.
Health inequalities in London are dealt with in more detail in the Health Issues in Planning: Best Practice Guidance (2007). This guidance document sets out how planning decisions can directly and indirectly improve health and reduce health inequalities through the following topics:• Goodqualityandaffordablehousing;• Transport;• Employmentandskillstraining;• Educationandearlylife;• Accesstoservices;• Communitysafety;• Liveability,publicspaceandurbanrealm;• Air,waterandnoisequality;• Accesstofreshfood;and• Climatechange.
Sustainable Design and Construction recognises that overheating in London associated with the urban heat island effect can result in increased morbidity in vulnerable groups such as the very young and the elderly, people with long term limiting illness, the disabled and people with health problems (Section 2.2.3 of Sustainable Design and Construction).
Taking into account relevant health strategies and plans
Consistent with PPS12, which requires local planning authorities to take account of relevant plans and programmes, the Draft Further Alterations to the London Plan require Development Plan policies to promote the objectives of the NHS Plan, the ‘Choosing Health’ White Paper, Local Delivery Plans and Modernisation Programmes and the delivery of health care in the borough (Policy 3A.17 Health objectives). The NHS and Local Delivery Plans, for example, set out how the NHS will improve the health of the local population and narrow inequalities in health (para. 3.82 of the Draft Further Alterations to the London Plan).
Consideration of health in the London Plan, its Draft Further Alterations and accompanying documents
APPENDIX 2: Consideration of Direct and Indirect Links to Health in the London Plan
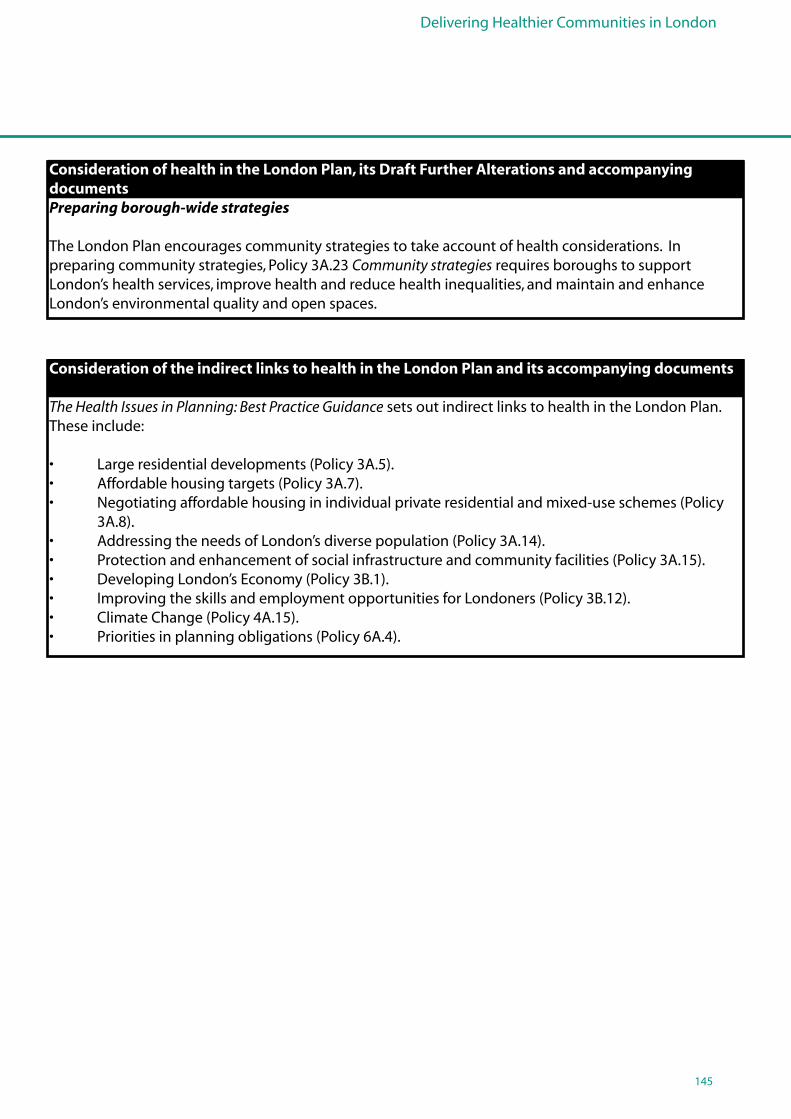
Delivering Healthier Communities in London
145
Consideration of health in the London Plan, its Draft Further Alterations and accompanying documentsPreparing borough-wide strategies
The London Plan encourages community strategies to take account of health considerations. In preparing community strategies, Policy 3A.23 Community strategies requires boroughs to support London’s health services, improve health and reduce health inequalities, and maintain and enhance London’s environmental quality and open spaces.
Consideration of the indirect links to health in the London Plan and its accompanying documents
The Health Issues in Planning: Best Practice Guidance sets out indirect links to health in the London Plan. These include:
• Largeresidentialdevelopments(Policy3A.5).• Affordablehousingtargets(Policy3A.7).• Negotiatingaffordablehousinginindividualprivateresidentialandmixed-useschemes(Policy 3A.8).• AddressingtheneedsofLondon’sdiversepopulation(Policy3A.14).• Protectionandenhancementofsocialinfrastructureandcommunityfacilities(Policy3A.15).• DevelopingLondon’sEconomy(Policy3B.1).• ImprovingtheskillsandemploymentopportunitiesforLondoners(Policy3B.12).• ClimateChange(Policy4A.15).• Prioritiesinplanningobligations(Policy6A.4).
Delivering Healthier Communities in London
146
MENTAL HEALTH AND RISK FACTORS WHICH MAY BE MODIFIED THROUGH SPATIAL PLANNING
Synopsis of the Evidence
Depression and anxiety are important public health problems occurring in 15-30% of the UK population and accounting for approximately 20% of GP consultations in the UK.
Taking account of individual characteristics (e.g. age, socio economic status), there is still substantial variation in rates of Common Mental Disorders (CMD) between households. This variation can be related to factors operating at a level between ward and household (a ‘neighbourhood’ effect). This ‘neighbourhood’ effect is being increasingly researched but is currently not well understood.
The factors which appear to be most strongly associated with the lowest ratings for mental health are:
• Densityandescapei.e.feelingdissatisfiedwithavailablegreenspace,and/or social facilities or feeling overcrowded.
• Design,forexample; a) not liking the look of the estate or road etc or b) high rise and deck access dwellings which are a risk in particular to mothers with young children.
• Physicalincivilities,forexample a) vandalism to property b) low external beautification c) poor property maintenance
• Housingqualitye.g.damp.
• Fearofcrimei.e.feelingunsafetogoout.
• Neighbournoise,althoughanindividual’straitanxietymayitselfaffectnoisesensitivity. Spatial planning can markedly affect the following risk factors:
• Neighbourhood Quality • Housing Design and Density• Housing Quality • Fear of crime
Residents whose homes have been flooded experience psychological distress for considerable periods of time after the flood event.
Spatial planning can minimise the risks of flooding through design and careful location of vulnerable land-uses.
APPENDIX 3.2: Detailed Mental Health Evidence Base
Delivering Healthier Communities in London
147
MENTAL HEALTH and the BUILT ENVIRONMENT – effects of neighbourhood and housing
Common Mental Diseases
Anxiety and depression are the most common form of psychiatric morbidity in the British general population (Meltzer H et al, 1995) and are a major public health problem (Paykel ES, 1978, Goldberg D & Huxley P, 1980, Goldberg D & Huxley P, 1992). The distribution of the common mental disorders (CMDs) is measured in population surveys, using validated questionnaire instruments, such as the General Health Questionnaire (Goldberg D & Williams P, 1988), and the Short Form-36 (SF-36) (Ware JE et al, 2000). Surveys show that the population prevalence of CMDs is between 15% and 30% and they account for approximately 20% of GP consultations without diagnosed psychiatric disorder but a poor level of mental health (Weich S & Lewis G, 1998), (Weich S, 1997). The case to reduce the public health burden of CMDs was recognised by the UK government during the 1990s in a succession of UK strategy documents, including The Health of the Nation in 1992 (Secretary of State for Health, 1992) and more recently in the National Service Framework for Mental Health (http://www.dh.gov.uk/assetRoot/04/01/45/02/04014502.pdf ).
People and Places
Understanding the contribution of risk factors at the individual and area (contextual) level, that is the contribution of people and places, to determining mental health status is clearly necessary as a first step towards planning evidence-based interventions to improve population mental health.
A research focus has been developed on investigating the inter-relationships between ‘People and Places’: i.e. what are relations between CMDs and either characteristics of individuals, ‘compositional’ factors, such as age, gender, social class, educational level, economic status or the contextual factors of the neighbourhoods, or communities, in which they live (Macintyre S et al, 1993). “Contextual” measures reflect characteristics of places rather than residents (Weich S et al, 2002), (for example, educational attainment, employment) may be influenced by area characteristics (for example, quality of local schools, job opportunities, public transport). MacIntyre and her colleagues, who are developing measures of place based on needs, represent a major empirical advance (MacIntyre S et al, 2003). Another approach has been to classify small areas according to a particular characteristic. These contextual factors relate to the wider social, economic and built environment and may be area-based measures of social and/or material deprivation, economic conditions relating to local employment opportunities, type and quality of local housing and local environmental quality. (Kawachi I & Berkman L, 2000).
There is a need to study directly those features of the local social and physical environments which might promote or inhibit health. Improvements in public health might be achieved by a greater focus on places (Macintyre S et al, 1993).
Delivering Healthier Communities in London
148
A number of studies have attempted to investigate whether area differences in a variety of health outcomes were due to the composition of the resident population, or to features of place not captured by individual, compositional, properties. In the late 1990s, however, most studies which tried to partition area effects into compositional or contextual explanations tended to find that there was some residual effect of area having taken into account a number of compositional features. Thus, although cautioning that the finding of contextual effects may be due to unmeasured individual effects, most investigators have tended to conclude that where you live matters for health, although probably not as much as who you are (Pickett K & Pearl M, 2001)
UK studies have found variations in the associations between social class and health depending on the type of area, particularly steep health gradients, between more deprived and affluent small areas, being observed in more affluent districts or regions (Shouls S et al, 1996). Gender and age differences have also been observed in patterning by area (Ellaway A & Macintyre S, 2001), as have differences in the likelihood of observing ‘area effects’ according to the health measure of choice.
Investigators have tended to seek to establish both whether there is any explanatory role for context after taking population composition into account, and how much of the observed geographical variation this context might explain. There are problems with this common approach. Firstly, the distinction between composition and context may not be as conceptually clear or as useful as may appear at first glance. The properties of individuals or households which are used in many multilevel models are themselves shaped by the properties of the locality used in the same models. For example, social class as based on occupation is likely to be constrained and shaped by the local labour market economy, educational achievement may be based on local school standards, and housing tenure on the local housing market (Macintyre S & Ellaway A, 2002). However, more recently there has been some interest in the possibility of ‘pull up’ or ‘pull down’ effects on health of adjacency to different types of people or places (Graham E et al, 2000).
Macintyre states that: ‘people create places and places create people’ (Macintyre S & Ellaway A, 2003). The presence of spatial variation in mental health status and ecological associations with measures of social deprivation does not imply that the places where people live necessarily have any independent effects on mental health, since variation at area level may simply arise from variation in the characteristics of individuals living in these areas (Duncan C et al, 1996; Duncan C et al, 1998). Dissatisfaction with housing and the urban neighbourhood may also be a consequence of emotional distress, rather than a cause, thus further compounding the difficulties in isolating housing factors that may contribute to mental ill health. Since psychological well-being can affect one’s judgment about environmental quality, some of the apparent correlation between housing quality and well-being may be spurious. For example, people who are depressed might rate their housing quality lower than others not suffering psychological distress. People living in poor-quality housing experience stigma and may attribute some of their predicament to themselves (Halpern D, 1995; Kearns A et al, 2000).
For research into contextual explanations of variations in mental health, firstly, the geographical area for the measurement of context must be defined. ‘Neighbourhood’ is a commonly used term to try and capture the essence of a local social and community structure, but common agreement on geographical definitions of neighbourhood remains elusive, with a range of definitions for neighbourhoods, (Lee BA & Campbell KE, 1997; Kearns A & Parkinson M, 2001; Meegan R & Mitchell A, 2001; Glaster G, 2001). In the absence of any agreed definition, neighbourhoods must be pragmatically defined for the UK. (Mitchell R, 2001, Lynch J & Kaplan G, 2000, Diex-Roux AV, 2003).
APPENDIX 3.2: Detailed Mental Health Evidence Base
Delivering Healthier Communities in London
149
A method of statistical analysis (multilevel modelling) is necessary that can disentangle compositional (individual characteristic) from contextual (neighbourhood) effects on mental health, and to model how contextual effects might vary between different groups of people. (Goldstein H, 1995).
Personal control, socially supportive relationships, and restoration from stress and fatigue are all affected by properties of the built environment and so characteristics of the built environment can directly influence mental health. Environmental characteristics with direct effects on mental health include housing, crowding, noise and indoor air quality. In addition to direct effects, the built environment can indirectly impact mental health by altering psychosocial processes with known mental health consequences. For example, higher residential density interferes with the development of socially supportive relationships with the household.
Housing
House type (e.g. high-rise), floor level, and housing quality (e.g. structural problems) have all been linked to mental health. High-rise, multiple dwelling units are inimical to the psychological well-being of mothers with young children and possibly that of young children themselves (Evans GW et al, 2003; Freeman HL, 1984; Gifford R, 2003). High-rise housing and poor quality housing have also been associated with more uncontrollable social interaction (Churchman A et al, 1984; Evans GW et al, 2001). Evans GW et al (2000) suggest that high-rise dwelling can be associated with negative mental health impact on children and mothers, because of lack of play space and social isolation. Young mothers are particularly at risk: a study in Glasgow has shown that women in their early 20s are three times more likely to consult their GP for a mental health problem if they (the women) live in flats (Lowry S, 1991). McCarthy P et al (1985) demonstrated that levels of psychopathology are high among the inhabitants of high-rise flats on inner city problem estates but not among those in the suburbs. Weich S (2002) has shown that people living in deck access building have a significantly higher risk of depression (odds ratio of 1.28, 95% CI 1.03-1.58) than those living in other housing types, even after adjusting for socio-economic status, floor of residence and structural problems. Parents of young children in large multiple-dwelling units often cope with the paucity of nearby play spaces by keeping children inside their apartments. Such restrictions heighten intrafamilial conflict, minimize play opportunities with others, and remove a primary avenue for parents to get to know their neighbours (Bartlett S, 1998; Stewart W, 1970).
The availability and arrangement of communal social space is an element covered in the literature on a range of spatial scales. The development of a neighbourhood community social life can be fragmented by lack of communal space. In a study of a school, for example, architect Sebastian Quin found that the social life was interrupted and fragmented by a lack of a central meeting place and the separation of spaces for different activities (Thompson-Fullilove M, 2001).
Maintenance of housing may also be an important issue in understanding mental well-being. A systematic review by Thomson H et al (2001) considers the evidence of the effects on health of interventions to improve housing. Two studies that examined the effects of housing improvement in the context of area regeneration reported that residents’ concerns about local crime were reduced (Thomson H et al, 2001). Kahlmeier S (2001) examined the influence of changes in environmental housing quality on people’s well-being when they moved house. They found a gain in self-rated health score was most strongly predicted by an improvement in satisfaction with location of building and perceived air quality.
Delivering Healthier Communities in London
150
The suitability of the apartment itself, quality of relationship with neighbours and noise from neighbours were found to be important indicators. Evans GW et al (2000) examined the potential link between housing quality and mental health. Their study demonstrates that, after controlling for income, physical housing quality is a significant predictor of psychological distress and that as housing quality rises symptoms of psychological distress diminish.
Although not all recent housing stock is of poor quality design and construction the view that people living in more recently constructed buildings have lower levels of mental well-being has been confirmed by Weich S (2002). This study found that people living in houses built after 1969 have a 43% higher risk of depression than those living in houses built earlier. These odds for poor mental health were found after adjusting for socio-economic deprivation, floor of residence and structural housing problems.
Temperature and humidity
A study by Hopton JL and Hunt SM (1996) used household interviews of people living in a local authority housing estate on the outskirts of Glasgow to demonstrate that dampness and cold could be significantly associated with mental health problems. In particular they found that a problem with dampness was significantly and independently associated with scoring more than five on the GHQ scale after controlling for possible confounding variables. Raw GJ et al (2001) also refer to the psychological effects arising from the constant sight of fungal growth, the sometimes unpleasant smell and the difficulty of getting rid of mould, although these have not been quantified.
Neighbourhood Quality
What constitutes a healthy neighbourhood?
1. Physical features of the environment shared by all residents in a locality2. Availability of healthy environments at home, work and play3. Services provided, publicly or privately to support people in their daily lives4. Socio-cultural features of a neighbourhood5. The reputation of an area.
When people change houses, they often move to new neighbourhoods as well. Relocating from low-income neighbourhoods to middle-income areas is associated with enhanced mental health for both adults and children (Johnson MP et al, 2002; Dalgard OS et al, 1997). When public housing residents relocate to middle-class suburban neighbourhoods, feelings of mastery increase relative to other public housing residents who relocate to low-income neighbourhoods (Rosenbaum JE et al, 2002). Poor-quality housing is more likely to be located in neighbourhoods with multiple indicators of urban decay (Evans GW et al, 2002; Wandersman A et al, 1998). There is growing literature demonstrating that neighbourhood quality has mental health impacts on children and their families, independent of household SES (Wandersman A et al, 1998; Leventhal T et al, 2000). Unfortunately, none of these studies specifies physical qualities of neighbourhoods; instead defining neighbourhood quality as a bundled index of multiple social (e.g. percentage unemployed) and physical attributes (e.g. number of abandoned buildings).
APPENDIX 3.2: Detailed Mental Health Evidence Base
Delivering Healthier Communities in London
151
Children with attentional disorders (e.g. attention-deficit/hyperactivity disorder) have fewer behavioural problems when they spend more time in natural settings (Kuo FE, 2002). Wells NM (2000) found similar results for residential access to nature in a longitudinal study comparing children who relocated. Low-income housing areas in London with less access to private gardens have higher prevalence of depression, independent of SES (Weich S et al, 2002) and public housing residents living adjacent to natural outdoor areas report better adjustment to their living environment, feel safer, and have more positive affect than others from the same housing development living near outdoor spaces devoid of nature (Kuo FE et al, 1998).
Crowding/Density
Indices of crowding measured in the aggregate such as people per census tract bear little relationship to mental health outcomes (Baum A et al, 1987; Evans GW, 2001). It is important to exclude people living alone, since single residence is a well-documented correlate of mental illness.
With particular reference to inner-city boroughs, Kennedy HG et al (1999) found strong correlations between violence, homicide and suicide rates and population density and indices of deprivation. Rates were highest in boroughs with high population density and deprivation scores. A study of women in West London showed a ‘J’ shaped relationship between internal density and psychological symptoms (i.e. symptoms initially fell then rose as density increased). This relationship persisted when variables such as social class, unemployment and the presence of children were controlled for (Gabe J et al, 1993). The main factor contributing to stress appears to be the loss or lack of personal control associated with crowding (Lowry S, 1991). High-density living, particularly high household density, may in fact have positive effects, leading to increased social ties and more co-operation (Halpern D, 1995). Dalgard OS et al (1997) investigated the reasons for variations in rates of mental disorder in five urban neighbourhoods. Of the five neighbourhoods surveyed, one had previously been a poorly functioning neighbourhood with high levels of mental ill health among its residents. Following a major development programme that included improvements to schools, kindergartens and playgrounds, and to ‘escape facilities’ such as transport, shops and youth activities, levels of residents’ mental well-being rose. These findings support the environment stress hypothesis, implying that the quality of a neighbourhood has an impact on mental health and that improving the urban environment can be a key factor in improving mental well-being, although it is extremely difficult to identify the specific impact of the different improvements: whether it is reduction in graffiti or increased access to green, open spaces, and so forth.
‘Escape facilities’’
A national survey on public attitudes undertaken in 1995 that nine out of ten people value the countryside and that there is a very strong desire for greater opportunities to access rural areas and for green, open spaces in urban areas (Countryside Commission, 1997). A study by Lewis G et al (1994) indicates less prevalence of mental ill health among people living in built areas with access to gardens than among people with no such access. Open spaces can also be important in facilitating physical exercise and longevity (Takano T, 2002) and recent studies have shown a causal relationship between physical activity and reduced levels of depression (Mutrie N, 2000). Allotment gardening is another example of an ‘escape facility’ that has a positive effect on both physical and mental well-being and also provides opportunities for horticultural therapy for people with physical and mental health problems (Wiltshire R, 2000).
Delivering Healthier Communities in London
152
Crime and fear of crime
In the urban neighbourhood both crime rates (Norris F et al, 1994) and fear of crime have a significant impact on health, including individuals’ sense of physical and emotional vulnerability. Keithley J et al (1999) make the case for a major impact of crime on mental health. Fear of crime can profoundly affect the quality of individuals’ lives by causing both mental distress and social exclusion (Evans D et al, 2000). Wandersman’s neighbourhood disorder model (1998) demonstrates that anti-social behaviour and neighbourhood decline can impact on feelings of safety and on mental health. He cites physical signs including dilapidated houses, abandoned buildings, vandalism, litter and garbage. Practical interventions to improve the look of the urban neighbourhood – for example, work on improving deteriorated housing and open land, repairing vandalised facilities, removing graffiti and regular rubbish clearance – can help increase residents’ sense of safety and reduce actual crime levels (Blackman T, 2001). This study of the effects of regeneration on an area of Newcastle upon Tyne (2001) found that residents who perceive where they live to be unsafe are more likely also to report mental health problems. Greenberg SW et al (1984) suggest that high risk areas are generally characterised by more major thoroughfares, a larger percentage of commercial and mixed land use, more permeable boundaries, the close proximity of poorer areas, more multi-family units, higher levels of public parking and vacant land and lower levels of social cohesion. Dwellings that are located in areas of relatively low usage but with many thoroughfares tend to be an easy target for burglars, according to Halpern D (1995). Major MD and colleagues (1997) contend that busy streets and areas make people feel safer by providing a ‘virtual community’ through ‘natural surveillance’.
Social participation and Support
Measures which help promote mental health through environmental interventions can help strengthen an individual’s connection to the informal and ‘associational’ life of neighbourhoods and local communities. A healthy environment, provides safety, opportunities for social integration, and the ability to predict and/or control aspects of that environment (Taylor SE et al, 1997).
A multitude of empirical studies reflect positive relationships between social support and mental health (Cohen S et al, 2000; Cohen S et al, 1985; Kawachi I et al, 2001; Vaux A, 1988).
APPENDIX 3.2: Detailed Mental Health Evidence Base
Delivering Healthier Communities in London
153
Spatial variation in rates of the common mental disorders at different spatial scales
The spatial scale at which contextual factors might have an impact on mental health remains unknown. Most studies have used data collected within administrative boundaries (MacIntyre S et al, 2002; Mitchell R, 2001). The independent associations between the prevalence of depression and (a) area level indices of socio-economic deprivation, and (b) urbanicity and population density, after adjusting for individual socio-economic status have been examined at the geographical scale of ward and wider area. (Reijneveld SA et al, 2000) The results based on the analysis of the full dataset showed no evidence for a significant association between individual mental health and ward deprivation, rurality or population density. Studies of large areas, such as UK regions (with hundreds of thousands of residents), are difficult to interpret (Lewis G et al, 1992; Duncan C et al, 1995; Skapinakis P et al, 2007). Wards may be too large and heterogeneous to detect contextual effect, and variance in CMD may be greater over smaller areas (Reijneveld SA et al, 2000). Recent studies have examined effects over smaller UK electoral wards (average population 5500) (McCulloch A, 2001; Weich S et al, 2003; Wainwright NWJ et al, 2004). Effect sizes at these levels are small and rarely statistically significant – percentage of variance in symptoms of anxiety and depression ranges from 0.5% to 4% before adjusting for residents’ characteristics, to less than 1% after doing so.
A number of studies have examined ways of measuring neighbourhood characteristics using a variety of neighbourhood sizes, principally in large American cities. Chicago (Sampson & Raudenbush, 1999), and Salt Lake City (Brown et al., 2003). However this approach needs to be extended to more detailed assessments in different types of urban settings, where the cultural and environmental contexts are different, and with different criteria for defining neighbourhoods. Survey tools have been developed (Dunstan F. et al) to assist with the definition and assessment of urban residential environments at smaller scales than ward level and closer to the level directly experienced by householders.
A postal survey based on a theoretical model of domains that might link the physical and urban environment with mental well-being was sent to 2696 adults aged 18 years or over, in four areas of Greenwich, London. (Guite H.F. 2006) Mental health was measured using the SF36 subscales for mental health (MH) and vitality (V).
Within domain analysis, adjusting for each of the confounding factors, resulted in the following factors being significantly associated with being in the lowest quartile for MH score: (i) control over the internal environment (damp), (ii) design and maintenance (not liking the look of the estate/road, (iii) noise (neighbour noise), (iv) density and escape (feeling over-crowded in the home, being dissatisfied with green spaces, dissatisfied with social and entertainment facilities) being dissatisfied with community facilities (such as libraries and community centres) was only significant for vitality, (v) fear of crime and harassment (feeling unsafe to go out in the day, feeling unsafe to go out at night, agreeing that needles and syringes left lying around are a problem) (vi) social participation (not enough events to get people together, not enough places to stop and chat).
Delivering Healthier Communities in London
154
One notable finding is substantial between household variation in rates of CMD in Britain, although most studies overlook this as a discrete level (McCulloch A, 2001; Wainwright NWJ et al, 2003; Silver E et al, 2002). In a national study, over 10% of variance in score on the 12 item general health questionnaire occurred at household level. This finding was not changed, even by adjusting for characteristics of individuals (including marital status, ethnicity, education, employment status, financial strain, and the number of current physical health problems), households (income, car access, housing tenure, social class, composition), or wards (Weich S et al, 2003). This finding remains unexplained, but could be attributable to exposures operating at a spatial level between ward and household.
Conclusions
There is little cross sectional variance in the prevalence of the CMD between areas with populations of 5000-8000 in the UK. Such areas may be too large to observe effects at a very localised level. However, substantial variance at the household level and at spatial scales below ward level indicate that place may still matter – but not in ways that have been studied to date. Anxiety and depression are important public health problems in their own right, and their prevalence is not declining. These conditions are also associated with mortality and physical morbidity, particularly cardiovascular disease. As acute and chronic environment stressors are potent drivers of onset and outcome, living in places with fewer amenities, or where personal safety is less secure, might lead to higher rates of psychiatric morbidity. Alternatively, risk may be confined to those with specific vulnerabilities. Modifying the physical or social environments could lead to substantial reductions in rates of the most common mental disorders.
Key domains through which the urban and built environment might impact on mental well-being:• controlovertheinternalhousingenvironment• qualityofhousingdesignandmaintenance• presenceofvalued‘escapefacilities;especiallywherethereishighresidentialdensity• crimeandfearofcrime• socialparticipation.
Noise and Psychological Morbidity in the Community
In Survey of Psychiatric Morbidity in West London, 5885 adults were randomly selected from within four aircraft noise zones and no overall relationship was found between aircraft noise and the prevalence of psychiatric morbidity. However there was an association between noise and psychiatric morbidity in two subgroups: those who finished full time education at more than 19 years of age and professionals (Tarnopolsky A. & Morton-Williams J. 1980)
In a follow-up of a cohort of male residents in Caerphilly, South Wales no association was found between the initial level of road traffic noise and minor psychiatric disorder but there was a small association of noise with increased anxiety scores (Stansfield S et al 1996).
APPENDIX 3.2: Detailed Mental Health Evidence Base
Delivering Healthier Communities in London
155
Noise sensitivity, based on attitudes to noise in general, in an intervening variable that explains much of the variance between exposure and individual annoyance responses (Fields J.M. 1992). Noise-sensitive people tended to have higher levels of defence/startle responses and noise sensitivity may be an indicator of vulnerability to minor psychiatric disorder (Stansfield S 1992). In the Caerphilly cohort study, noise sensitivity did predict psychiatric disorder at follow-up, but did not interact with noise level, suggesting that noise sensitivity does not specifically moderate the effect of noise on psychiatric disorder. After adjusting for trait anxiety at baseline, the effect of noise sensitivity was no longer statistically significant, which suggests that the association between noise sensitivity and psychological morbidity may be accounted for by the confounding association with trait anxiety (Stansfield S 1996).
Noise
A study of children exposed to traffic noise from roads and trains in small towns in Austria generated a dose-response function between noise and psychological distress (Lercher P et al, 2002). On the other hand, studies around Heathrow Airport have found more equivocal data on noise and children’s mental health (Haines MM et al, 2001; Haines MM et al, 2001; Haines MM et al, 2001). Ouis D (2001) concluded that exposure to noise has been shown to lead to various kinds of discomfort, and can engender physiological reactions typical of stress. Stansfeld SA et al (2000) argue that the question of whether environmental noise exposure causes mental ill-health is still largely unanswered. Haines MM et al (2001) found that, although chronic aircraft noise is associated with higher levels of annoyance and also impairs reading comprehension, it is not associated with mental health problems in children. However, the relationship between noise and mental health is influenced by individual attitudes and perceived sense of control (Ludlow B et al, 1997).
If there are few overall effects of environmental noise on the psychological health of the population, it may be that there are certain groups who are more vulnerable to noise, particularly children, the elderly and people with existing illness (Stansfield S 1997).
MENTAL HEALTH EFFECTS FROM FLOODING
There has been increasing interest in the possible mental health effects of flooding events. Mental health impacts vary in severity and include a wide range of symptoms, including possible suicide attempts, post-traumatic stress disorder (PTSD - characterised by intrusive memories, avoidance behaviour, sleep disturbances, irritability, anger and excessive vigilance), depression and substance abuse. The studies identified from the literature have been divided according to whether they examined a single flooding event, or multiple events.
Delivering Healthier Communities in London
156
SINGLE EVENT STUDIES
A number of retrospective studies examining single events have been identified from the literature. The earlier studies typically examined a flooded population and sought information on symptoms or GP visits in the 12 months prior to and 12 months after the flood, either through self-reported symptoms or GP records (Bennet, 1970; Abrahams et al., 1976). However, in the most recent UK-based quantitative study, (Reacher et al, 2004) simply compared a flooded group and a control group on the basis of their experiences after the flood. In France, Duclos et al. (1991) examined the immediate health impact of the flash flood in Nîmes, without using a control group. Studies often included a variety of physical illnesses (which have been outlined in earlier sections) as well as mental health effects.
Post-traumatic stress disorder
Verger et al. (1999; 2000) examined the risk factors for post-traumatic stress disorder symptoms five years after a large flood in the Vaucluse area of France. The flood, which affected over 60 municipalities, resulted in 38 deaths. In a pilot study, the researchers conducted face-to-face interviews with residents from two different areas affected by the flooding and found that the PTSD scale (based on a standardized questionnaire) was an effective tool (Verger et al., 1999). In the main study, a single area (Bedarrides) was targeted and 500 people interviewed. Significantly higher PTSD scores were observed for females, people over the age of 35, with a low monthly income and those who had a history of psychological disorders or life-threatening traumatic events. They also found a significant exposure-response relationship with the level of exposure to the flood and PTSD score (Verger et al., 2000).
In Canada, Auger et al. (2000) conducted a telephone survey of flooded and non flooded areas in Saguenay four months after a flood event. A total of 141 adults were interviewed; 62 from the flood area and 79 from an adjacent non-flooded area. PTSD was found to be significantly elevated in the flooded group (OR 6.08; 95% CI 1.63 – 22.64), with prevalence in the flooded group being almost 20% compared to 3.8% in the control group. Emotional distress was also significantly higher in the flooded group (OR 2.42; 95% CI 1.04 – 5.61).
McMillen at al. (2002) studied people who had been affected by the Midwest floods in 1993, which resulted in 50 deaths, damage to 50,000 homes and the evacuation of 54,000 people. Interviews were conducted with 160 people (from those thought to be worst affected by the flooding), 40 of whom reported flood-related injuries. 16 of the respondents saw others injured or killed in the flood, 25 had a family member injured or killed in the flood and 118 people reported doing or seeing something disgusting during the flood. McMillan et al. (2002) found that 60 people (38%) met criteria for a post-flood psychiatric disorder and that 35 people (22%) met criteria for PTSD related to the flood, although it should be noted that the response rate to the invitation to participate in the study was only 30%.
In Poland, Bokszczanin (2002) found that exposure to the 1997 flood disaster was a strong predictor of symptoms of PTSD, depression and feelings of loneliness in children and adolescents. The study, which took place 20 months after the flood, collected questionnaire response data from children and adolescents between the ages of 11 and 20. The occurrence of more intense symptoms was seen in those who had suffered greater threats during the flood event (fear of death, evacuation, being trapped by the flood and so on).
APPENDIX 3.2: Detailed Mental Health Evidence Base
Delivering Healthier Communities in London
157
General symptoms
In the USA, Ginexi et al. (2000) studied Iowa residents before and after the 1993 Midwest floods. An Iowa Health Poll (IHP) conducted in 1992 (with 2379 respondents), a year before the flooding event, was used to provide pre-disaster data. Attempts were made to contact those who had participated in IHP, two – three months after the flooding, to provide post-disaster data (Iowa Flood Study – IFS). The researchers were successful in contacting and re-interviewing over 70% of the original respondents. Although the whole of Iowa had been declared a Federal disaster area as a result of the flood, the actual level of flooding experienced by people varied markedly. Over 50% of the respondents to the IFS reported some flood impact but only 2% of the respondents had vacated their homes. Despite this the study was able to demonstrate a small but true rise in depressive symptoms in those affected by the flood.
Reacher and colleagues performed a historical cohort study using telephone interviews to establish physical illness and psychological distress in residents from 103 flooded and 104 non flooded properties in the same postcode area in Lewes, Southern England (Reacher et al., 2004). Previous studies (Bennet, 1970; Abrahams et al., 1976) had suggested that psychological distress may be associated with flooding, so this was specifically examined in adults using the GHQ-12 (a 12-item General Health Questionnaire, which is a standardised tool used to assess psychological symptoms). At the peak of the flooding some areas of the town were under 3.6 m of water. No deaths or trauma were reported as a result of the flood and routine surveillance of infectious disease did not detect an increase in the aftermath of the flood. The telephone interviews were conducted nine months after the flooding; information was recorded for injuries, other physical symptoms (see earlier sections) and, for adults, psychological health. Psychological distress in adults (pre-defined as a score of ≥4 in response to the GHQ-12) was significantly raised in the flooded group (RR 4.1; 95% CI 2.6-6.4). Psychological distress also exhibited a significant trend by flood depth. There were marked decreases in the risk estimates for physical illnesses in adults after adjustment for psychological distress. The authors note that their results suggest that the risk of psychological distress from being flooded was independent of reported physical illness and sanitary disruption within flooded households: “Our findings support the view that psychological distress is a leading adverse health outcome associated with flooding and may explain a proportion of physical illness.”
MULTIPLE EVENT STUDIES
In 2003, Defra and the EA published a study on the appraisal of human-related intangible impacts of flooding, much of which was aimed at producing a methodology to account for the impacts of flooding on human health in order to assess the benefits of flood alleviation measures (Defra/EA, 2003; Tunstall et al., 2006). Questionnaires were developed based on other questionnaires and a number of previously used scales designed to assess health effects. The scales considered the most appropriate to flooding and a UK population after pilot trials were the GHQ-12 and PTSS (Post-Traumatic Stress Scale). The SF-12 (Short Form) could not be used as the group were unable to obtain formal approval for its use.
Delivering Healthier Communities in London
158
In the main study over 1,500 face-to-face interviews were conducted with people who had been flooded (983) or those at risk of flooding (527) in 30 locations across England and Wales. The questionnaires were used to assess both health status at the time of the interview (considered to be an indicator of the long-term effects of flooding) and health at the time when the flooding was most severe for them (an indicator of the short-term effects of flooding). The number of people who had been flooded scoring 4 (the threshold indicative of some degree of mental health problems) or greater on the GHQ-12 was high, with 64% of all respondents recording this level at the worst time of flooding (generally within three months of the event), and 25% when current health was being assessed. In comparison, only 10% of those ‘at risk’ of flooding scored 4 or more. Interestingly, the figure of 10% is less than that reported by the general population, for whom the proportions scoring four or more on this scale were reported to be 13% for men and 18% for women (DoH, 1999). Most of the respondents (72%) reported experiencing some psychological effects as a result of the flooding, with most people reporting an increase in anxiety when it rains. In subjective terms stress rated highly in terms of the severity of the effects of flooding, while health effects (presumably, other than stress) were rated among the lesser effects of flooding.
Three factors were considered in relation to the effects on health:
• Socio-demographicfactors;• Floodcharacteristics;and• Post-floodfactors.
The socio-demographic factors found to be important were gender, prior health, age, rented housing, flood risk awareness and long-term illness, although the ranking of these depended upon the health measure used (PTSS, current GHQ-12 or worst time GHQ-12). The flood characteristics found to be important were contamination, depth of flooding, years since flooding and warning time. Problems with insurers and evacuation were found to be significant post-flood factors.
In a series of studies conducted by the FHRC on behalf of the EA in response to the Easter floods of 1998 and the summer floods of 2000, the following self-reported psychological health effects were reported by those who had been flooded (Tapsell and Tunstall, 2003):
• Anxiety(e.g.duringheavyrainfall)• Increasedstresslevels• Sleepingproblems• Depression• Panicattacks• Flashbackstoflood• Difficultyconcentratingoneverydaytasks• Lethargy/lackofenergy• Feelingsofisolation• Increaseduseofalcoholorprescription(other)drugs• Nightmares• Anger/tantrums• Moodswings/badmoods• Increasedtensionsinrelationships(e.g.morearguing)• Thoughtsofsuicide
APPENDIX 3.2: Detailed Mental Health Evidence Base
Delivering Healthier Communities in London
159
VULNERABILITY AND HASTENED MORTALITY
Although many studies note that certain groups may be more or less vulnerable to health impacts (e.g. Huerta and Horton, 1978 – who actually noted that the elderly in their study coped well in terms of emotional effects), few studies have enough participants to be able to quantify the interaction between age and these effects. In addition to vulnerable groups that can, to some degree, be predicted, Few et al. (2004) note that “vulnerability is shaped by a combination of physical, social, economic and environmental factors – the attributes of the person/system that condition the impacts resulting from flooding.”
It has also been noted that, in some instances, flooding seems to hasten mortality in the elderly or chronically sick (Bennet, 1970). Anecdotal evidence from flooding in Banbury and Kidlington (Tapsell, 2000) supports this with a number of people being upset about elderly neighbours who had died shortly after the flooding and feeling that the experience had accelerated their demise. There are, however, very little data with which to quantify this effect and it is not accounted for within the quantification (as this only reflects deaths up to a week after the event). Deaths other than drowning are included as a heart attack during an evacuation while not caused by the water, is nevertheless directly related to the flood event (Kelman, 2004).
The FHRC have developed a social flood vulnerability index, which is based upon the number of people aged 75 and over, people suffering from long term illness, lone parent households and financially deprived households. This could be employed to determine areas that may have more susceptible populations but it can not be translated into differential health impacts.
While the immediate effects of flooding, both in terms of health impact and damage to the property, are the most obvious, Tapsell and Tunstall (2001) note that “the aftermath of the flooding and coping with the recovery process was for the majority of participants the most stressful and difficult time”.
Delivering Healthier Communities in London
160
REFERENCES
Abrahams MJ, Price J, Whitlock FA, Williams G (1976) The Brisbane floods, January 1974: their impact on health. Medical Journal of Australia 2: 936-939.
Auger C, Latour S, Trudel M, Fortin M (2000) [Post-traumatic stress disorder. After the flood in Saguenay]. Canadian Family Physician 46(12): 2420-2427. [Article in French].
Bartlett S. Does inadequate housing perpetuate children’s poverty? Childhood, 1998;5:403-420.
Baum A, Paulus PB. Crowding. In: Stokols D, Altman I, eds. Handbook of Environmental Psychology. New York, NY: Wiley; 1987:533-570.
Bennet G (1970) Bristol floods 1968. Controlled survey of effects on health of local community disaster. British Medical Journal 3: 454-458.
Blackman T, Harvey J. Housing renewal and mental health: a case study. Journal of Mental Health 2001;10(5):571-583.
Bokszczanin (2002) Long-term negative psychological effects of a flood on adolescents. Polish Psychological Bulletin 33(1): 55-61.
Brown B, Perkins DD, Brown G. Place attachment in a revitalizing neighbourhood: Individual and block levels of analysis. Journal of Environmental Psychology, 2003;23:273-281.
Churchman A, Ginsberg Y. The image and experience of high rise housing in Israel. J Environ Psychol 1984;4:27-41.
Cohen S, Gottlieb BH, Underwood LG. Social relationships and health. In: Cohen S, Underwood LG, Gottlieb BH eds. Social Support Measurement and Intervention. New York, NY: Oxford University Press; 2000:3-28.
Cohen S, Syme SL, eds. Social Support and Health. New York, NY: Academic; 1985.
Countryside Commission. Public attitudes to the countryside. Northampton: Countryside Commission, 1997.
Dalgard OS, Tambs K. Urban environment and mental health: a longitudinal study. Br J Psychiatry 1997;171:530-536.
Davey-Smith G, Hart C, Watt G, Hole D, Hawthorne V. Individual social class, area-based deprivation, cardiovascular disease risk factors, and mortality: the Renfrew and Paisley study. Journal of Epidemiology and Community Health 1998;52:399-405.
Defra/EA (2003) The appraisal of human-related intangible impacts of flooding. R&D Project FD2005. Defra/Environment Agency Flood and Coastal Defence R&D Programme. Policy Development Theme, London.
APPENDIX 3.2: Detailed Mental Health Evidence Base
Delivering Healthier Communities in London
161
Diez-Roux AV, Nieto FJ, Muntaner C, Tyroler HA, Comstock GW, Shahar E, Cooper LS, Watson RL, Szklo M. Neighbourhood environments and coronary heart disease: a multilevel analysis. American Journal of Epidemiology 1997;146(1):48-63.
Diez-Roux AV. Methodological and conceptual approaches to studying neighbourhood effects on health. In: Neighbourhoods and Health. Kawachi I, Berkman LF (eds). New York, Oxford University Press, 2003, pp47.
DoH (1999) Health Survey for England 1998. Cardiovascular Diseases. Erens B, Primatesta P (Eds.) The Stationery Office, London.
Duclos P, Vidonne O, Beuf P, Perray P, Stoebner A (1991) Flash flood disaster – Nîmes, France, 1988. European Journal of Epidemiology 7(4): 365-371.
Duncan C, Jones K, Moon G. Psychiatric morbidity: a multilevel approach to regional variation in the UK. J Epidemiol Community Health 1995;49:290-5.
Duncan C, Jones K, Moon G. Health-Related Behaviour in Context: A Multilevel Modelling Approach. Social Science and Medicine 1996;42(6):817-830.
Duncan C, Jones K, Moon G. Context, composition and heterogeneity: using multilevel models in health research. Soc Sci Med 1998;46:97-117.
Dunstan F, Weaver N, Aray R, Bell T, Lannon S, Lewis g, Patterson J, Thomas H, Jones P, Palmer S. An observation tool to assist with the assessment of urban environments. J Environmental Psychology. 25 (2005) 293-305.
Ellaway A, Macintyre S. Women in their place: gender and perceptions of neighbourhoods and health in the West of Scotland. In: I. Dyck, N Lewis, S McLafferty (eds). Geographies of Women’s Health (pp264-281) London: Routledge.
Evans GW, Chan E, Wells H et al. Housing quality and mental health. Journal of Consulting and Clinical Psychology 2000;68(3):526-530.
Evans D, Fletcher M. Fear of crime: testing alternative hypotheses. Applied Geography 2000;20:395-411.
Evans GW. Environmental stress and health. In: Baum A, Revenson T, Singer JE, eds. Handbook of Health Psychology. Mahwah, NJ: Erlbaum; 2001:571-610.
Evans GW, Kantrowitz E. Socioeconomic status and health: the potential role of environmental risk exposure Annu Rev Public Health, 2002;23:303-331.
Evans GW, Saltzman H, Cooperman J. Housing quality and children’s socioemotional health. Env Behav 2001;33:389-399.
Evans GW, Wells NM, Moch A. Housing and mental health: a review of the evidence and a methodological and conceptual critique. J Soc Issues 2003;59:475-500.
Delivering Healthier Communities in London
162
Few R, Ahern M, Matthies F, Kovats S (2004) Fllods, health and climate change: a strategic review. Tyndall Centre for Climate Change. Working Paper 63.
Fields JM (1993). Effects of personal and situational variables on noise annoyance in residential areas. Journal of the Acoustical Society of America 93(5):2753-2763.
Freeman H. Housing. In: Freeman HL, ed. Mental Health and the Environment. London, England: Churchill Livingstone; 1984:197-225.
Gabe J, Williams P. Women, overcrowding and mental health. In: Burridge R, Ormandy D (eds). Unhealthy housing: research, remedies and reform. London: E&FN Spon, 1993.
Gifford R. Satisfaction, health, security, and social relationships in high-rise buildings. In: Seidel A, Health T, eds. Social Effects of the Built Environment. London, England: E&FN Spon. In press.
Ginexi EM, Weihs K, Simmens SJ, Hoyt DR (2000) Natural disaster and depression: a prospective investigation of reactions to the 1993 Midwest floods. American Journal of Community Psychology 28: 495-518.
Glaster G. On the nature of neighbourhood. Urban Studies 2001;38(12):2111-24.
Goldberg D, Huxley P. Mental illness in the community: the pathway to psychiatric care. London: Tavistock, 1980.
Goldberg D, Huxley P. Common mental disorders: a bio-social model. London: Routledge, 1992.
Goldberg D, Williams P. A User’s Guide to the General Health Questionnaire. Windsor: NFER-Nelson, 1988.
Goldstein H. Multilevel Statistical Models (2nd Edition). Edward Arnold: London, 1995.
Graham E, MacLeod M, Johnston M, Dibben C, Briscoe S. Individual deprivation, neighbourhood and recovery from illness. In: H Graham (ed). Understanding Health Inequalities (pp156-169). Buckingham: Open University Press, 2000.
Greenberg SW, Rohe WM. Neighbourhood design and crime: a test of two perspectives. Journal of American Planning 1984;50(1):48-61.
Guite H.F., Clark C, Ackrill G. The impact of the physical and urban environment on mental well-being. Public Health 2006;120:1117-1126.
Haines MM, Stansfeld SA, Brenthall S et al. The West London schools study: the effects of chronic noise exposure on child health. Psychol Med 2001;31:1385-1396.
Haines MM, Stansfeld SA, Job RFS, Berglund B, Head J. A follow-up study of effects of chronic aircraft noise exposure on child stress responses and cognition. Int J Epidemiol 2001;30:839-845.
APPENDIX 3.2: Detailed Mental Health Evidence Base
Delivering Healthier Communities in London
163
Haines MM, Stansfeld SA, Job RFS, Berglund B, Head J. Chronic aircraft noise exposure, stress responses, mental health and cognitive performance in school children. Psychol Med 2001;31:265-277.
Halpern D. Mental health and the Built Environment. London, England: Taylor and Francis; 1995.
Halpern D. Mental health and the environment: more bricks than mortar? London: Taylor and Francis Ltd, 1995.
Hopton JL, Hunt SM. Housing conditions and mental health in a disadvantaged area in Scotland. Journal of Epidemiology and Community Health 1996;50(1):56-61.
Huerta F, Horton R (1978) Coping behaviour of elderly flood victims. The Gerontologist 18(6): 541-546.
Johnson MP, Ladd HF, Ludwig J. The benefits and costs of residential mobility programs for the poor. Housing Stud 2002;17:125-138.
Kahlmeier S, Schindler C, Grize L et al. Perceived environmental housing quality and well-being of movers. Journal of Epidemiological Community Health 2001;55(11):708-718.
Kawachi I, Berkman L. Social Cohesion, Social Capital, and Health. In: Social Epidemiology, Kawachi I, Berkman L (eds). New York, Oxford University Press, 2000, pp174-190.
Kawachi I, Bergman LF. Social ties and mental health. J Urban Health. 2001;78:458-467.
Kearns A, Hiscock R, Ellaway A, Macintrye S. Beyond four walls. The psychosocial benefits of home: evidence from West Central Scotland. Housing Stud 2000;15:387-410.
Kearns A, Parkinson M. The Significance of Neighbourhood. Urban Studies 2001;38(12):2103-10.
Keithley J, Robinson F. Exploring the impacts of crime on health and health services: a feasibility study. Durham: Durham University, 1999.
Kelman I (2004) Philosophy of flood fatalities. http://www.floodrisknet.org.uk/newsletters/2004-01/flood- fatalities.
Kennedy HG, Iveson RCY, Hill O. Violence, homicide and suicide: strong correlation and wide variation across districts. British Journal of Psychiatry 1999;175:462-469.
Kuo FE. Bridging the gap: how scientists can make a difference. In: Bechtel RB, Churchman A, eds. Handbook of Environmental Psychology. 2nd ed. New York, NY: Wiley; 2002.
Kuo FE, Sullivan WC, Coley R, Brunson L. Fertile ground for community: inner-city neighbourhood common spaces. Am J Community Psychol, 1998;26:823-851.
Lee BA, Campbell KE. Common Ground? Urban neighbourhoods as survey respondents see them. Social Science Quarterly 1997;78(4):922-930.
Delivering Healthier Communities in London
164
Lercher P, Evans GW, Meis M, Kofler W. Ambient neighbourhood noise and children’s mental health. Occup Environ Med, 2002;59:380-386.
Leventhal T, Brooks-Gunn J. Neighbourhoods they live in: the effects of neighbourhood residence on child and adolescent outcomes. Psychol Bull 2000;126:309-337.
Lewis G, Booth M. Regional differences in mental health in Great Britain. J Epidemiol Community Health 1992;46:608-11.
Lewis G, Booth M. Are cities bad for your mental health? Psychological Medicine 1994;24:913-915.
Lowry S. Health and housing. London: BMJ Publishing, 1991.
Ludlow B, Flindell IH. An overview of noise and health effects – one way forward. Proceedings of Internoise 1997;97(3):1199-1202.
Lynch J, Kaplan G. Socioeconomic position. In: Social Epidemiology. Kawachi I, Berkman L (eds). New York, Oxford University Press, 2000, pp20.
McCarthy P, Byrne D, Harrison S. Housing type, housing location and mental health. Social Psychiatry 1985;20:125-130.
McCulloch A. Ward-level deprivation and individual social and economic outcomes in the British household panel study. Environment and Planning A 2001;33:667-84.
McMillen C, North C, Mosley M, Smith E (2002) Untangling the psychiatric comorbidity of posttraumatic stress disorder in a sample of flood survivors. Comprehensive Psychiatry 43(6): 478-485.
Macintyre S. Inequalities in health – geographical inequalities in mortality, morbidity and health-related behaviour in England. In: D Gordon, M Shaw, D Dorling, G Davey-Smith (eds). Inequalities in health: The evidence presented to the Independent Inquiry into Inequalities in Health (pp 148- 154). Bristol: The Policy Press, 1999.
MacIntyre S, Ellaway A, Cummins S. Place effects on health: how can we conceptualise, operationalise and measure them? Soc Sci Med 2002;55:125-39.
Macintyre S, Ellaway A. Neighbourhoods and Health: An Overview. In: Neighbourhoods and Health. Kawachi I, Berkman LF (eds). New York: Oxford University Press, 2003, pp26.
Macintyre S, Maciver S, Sooman A. Area, class and health: should we be focusing on places or people? Jnl Soc Pol 1993;22:213-34.
MacIntyre S, Ellaway A, Hiscock R et al. What features of the home and the area might help to explain the observed relationships between housing tenure and health? Evidence from the west of Scotland. Health and Place 2003;9:207-18.
APPENDIX 3.2: Detailed Mental Health Evidence Base
Delivering Healthier Communities in London
165
Major MD, Stonor T, Penrose A et al. Housing design and the virtual community. In: Proceedings of the 19th International Making Cities Livable conference: children and youth in the city. Charleston, USA, 1997.
Meegan R, Mitchell A. ‘It’s not community round here, it’s neighbourhood’: Neighbourhood change and cohesion in urban regeneration policies. Urban Studies 2001;39(12):2167-2194.
Meltzer H, Gill B, Petticrew M. OPCS Surveys of Psychiatric Morbidity in Great Britain. Report No.1, The prevalence of psychiatric morbidity among adults aged 16-64 living in private households in Great Britain. London, UK: The Stationery Office, 1995.
Mitchell R. Multilevel modelling might not be the answer. Environment and Planning A 2001;33:1357-60.
Mutrie N. The relationship between physical activity and clinically defined depression. In: Biddle SJH, Fox KR, Boutcher SH (eds). Physical activity and psychological well-being. London: Routledge, 2000.
Norris F, Kaniasty K. Psychological distress following criminal victimization in the general population – cross-sectional, longitudinal and prospective analyses. Journal of Consulting and Clinical Psychology 1994;62(1):111-123.
On-line. http://www.dh.gov.uk/assetRoot/04/01/45/02/04014502.pdf
Ouis D. Annoyance from road traffic noise: a review. Journal of Environmental Psychology 2001;21(1):101-120.
Paykel ES. Contribution of life events to causation of psychiatric illness. Psych Med 1978;8:245-53.
Pickett K, Pearl M. Multilevel analyses of neighbourhood socio-economic context and health outcomes: a critical review. Journal of Epidemiology and Community Health 2001;55:111-122.
Raw GJ, Aizlewood CE, Hamilton R. Building regulation, health and safety. London: Building Research Establishment, DETR, 2001.
Reacher M, McKenzie K, Lane C, Nichols T, Kedge I, Iversen A, Hepple P, Walter T, Laxton C, Simpson J (2004) Health impacts of flooding in Lewes: a comparison of reported gastrointestinal and other illness and mental health in flooded and non-flooded households. Communicable Disease and Public Health 7(1): 39-46.
Reijneveld SA, Verheij R, de Bakker DH. The impact of area deprivation on differences in health: does the choice of the geographical classification matter? J Epidemiol Community Health 2000;54:306-313.
Rosenbaum JE, Reynolds L, Deluca S. How do places matter? The geography of opportunity, self-efficacy, and a look inside the black box of residential mobility. Housing Stud 2002;17:71-82.
Sampson RJ, Raudenbush SW. Systematic social observation of public space: A new look at disorder in urban neighborhoods. American Journal of Sociology 1999;105:603-651.
Delivering Healthier Communities in London
166
Secretary of State for Health. The Health of the Nation: a strategy for health in England. London: HMSO, 1992.
Shaw M. Health and housing: a lasting relationship. Journal of Epidemiological and Community Health 2001;55(5):291.
Shouls S, Congdon P, Curtis S. Modelling inequality in reported long term illness in the UK: combining individual and area characteristics. Journal of Epidemiology and Community Health 1996;50:366- 376.
Silver E, Mulvey EP, Swanson JW. Neighbourhood structural characteristics and mental disorder: Faris and Dunham revisited. Soc Sci Med 2002;55:1457-70.
Skapinakis P, Lewis E, Araya R et al. Mental health inequalities in Wales, UK: a multilevel investigation of the affect of area deprivation. Br J Psychiatry (in press).
Stansfeld SA, Haines MM, Burr M et al. A review of environmental noise and mental health. Noise and Health 2000;8:1-8.
Stansfield SA Noise, noise sensitivity and psychiatric disorder: epidemiological and psycho physiological studies. In: Psychological Medicine (monograph suppl22), Cambridge University press, UK, 1992.
Stansfield SA Noise and Mental Health. In: The non-auditory effects of noise. Institute for Environment and Health. 1997 Report R10, Leicester, UK.
Stewart W. Children in flats: A Family Study. London, England: National Society for the Prevention of Cruelty to Children; 1970.
Takano T, Nakamura K, Watanabe M. Urban residential environments and senior citizens: longevity in megacity areas – the importance of walkable green spaces. Journal of Epidemiology and Community Health 2002;56(12):913-918.
Tapsell SM (2000) The health effects of flooding. A follow-up study of the 1998 Easter flooding in Banbury and Kidlington. Report to the Environment Agency. Flood Hazard Research Centre, Middlesex.
Tapsell SM, Tunstall SM (2001) The health and social effects of the June 2000 flooding in the North East Region. Report to the Environment Agency. Flood Hazard Research Centre, Middlesex.
Tapsell S, Tunstall S (2003) An examination of the health effects of flooding in the United Kingdom. Journal of Meteorology 28: 341-349.
Taylor SE, Repetti RL, Seeman T. Health psychology: what is an unhealthy environment and how does it get under the skin? Annual Review of Psychology 1997;48:411-447.
Thompson-Fullilove M. The links between the social and physical environments and children’s environmental health. Paediatric Clinics of North America 2001;48:5.
APPENDIX 3.2: Detailed Mental Health Evidence Base
Delivering Healthier Communities in London
167
Thomson H, Petticrew M, Morrison D. Health effects of housing improvement: systematic review of intervention studies. British Medical Journal 2001;323:187-190.
Tunstall S, Tapsell S, Green C, Floyd P, George C (2006) The health effects of flooding: social research results from England and Wales. Journal of Water and Health 4(3): 365-380.
Vaux A. Social Support: Theory, Research, and Intervention. New York, NY: Praeger; 1988.
Verger P, Hunault C, Rotily M, Baruffol E (2000) [Risk factors for post traumatic stress symptoms five years after the flood in the Vaucluse (France)] Revue Epidemiol Sante Publique 48(Suppl 2): 2S44-2S53. [Article in French]
Verger P, Rotily M, Baruffol E, Boulanger N, Vial M, Sydor G, Pirard P, Bard D (1999) [Evaluation of the psychological consequences of environmental catastrophes: a feasibility study based on the 1992 floods in Vaucluse] Sante 9(5): 313-318. [Article in French].
Wainwright NWJ, Surtees PG. Places, people, and their physical and mental functional health. J Epidemiol Community Health 2003;58:333-9.
Wainwright NWJ, Surtees PG. Area and individual circumstances and mood disorder prevalence. Br J Psychiatry 2004;185:227-32.
Wandersman A, Nation M. Urban neighbourhoods and mental health: psychological contributions to understanding toxicity, resilience and interventions. American Psychologist 1998;53(6):647-656.
Ware JE, Snow KK, Kosinski M. SF-36 Health Survey: Manual and Interpretation Guide. Lincoln, RI: QualityMetric Incorporated, 1993, 2000.
Weich S, Blanchard M, Prince M, Burton E, Erens B, Sproston K. Mental health and the built environment: cross sectional survey of individual and contextual risk factors for depression. Br J Psychiatry 2002;176:428-433.
Weich S, Holt G, Twigg L, Lewis G et al. Geographical variation in the prevalence of common mental disorders in Britain: a multilevel investigation. Am J Epidemiol 2003;157:730-7.
Weich S, Lewis G. Material standard of living, social class, and the prevalence of the common mental disorders in Great Britain. J Epidemiol Community Health 1998;52:8-14.
Weich S. Prevention of the common mental disorders: a public health perspective (editorial). Psychol Med 1997;27:757-64.
Wells NM. At home with nature: effects of ‘greenness’ on children’s cognitive functioning. Env Behav 2000;32:775-795.
Wiltshire R. Rewriting the plot: photographs and images. http://www.btinternet.com/-richard.wiltshire/ le2.htm.
Delivering Healthier Communities in London
168
OBESITY
Synopsis of the Evidence
In England, 15% of children between 2 and 10 year of age are obese and the prevalence of obesity and overweight children is increasing steadily. Further to this, since 1990 there has been a dramatic increase in the incidence of type 2 diabetes which has occurred in tandem with the prevalence of sedentary lifestyles and obesity.
There are ways to address this trend by encouraging physical activity. In adults physical activity reduces the risk for all-cause mortality as well as for cardiovascular disease, obesity and diabetes and musculoskeletal conditions. Physical activity does not need to be vigorous and sustained to achieve health benefits.
Factors key to supporting physical activity are:
a) Walking and cycle ways to connect homes with schools, workplaces and shops.b) Accessibility to playing in the park and sports facilities.c) Removal of environmental barriers to permit residents in poorer areas to become physically active. There is evidence that creation or enhancement of the above factors is effective in engaging people across the socio-economic and ethnic spectrum in levels of physical activity that improve their health.
Spatial planning can encourage physical activity by promoting walking and cycle ways, improving accessibility to open and green spaces and sports facilities, and removing environmental barriers to allow residents in poorer areas to become physically active.
APPENDIX 3.3: Detailed Obesity Evidence Base
Delivering Healthier Communities in London
169
The prevalence of obesity and overweight in children is rising steadily and if this trend continues, obesity may constitute the single most serious health threat to the current generation of children. According to the latest figures from the Health Survey for England (HSE) (2002-04 data combined), 15% of children aged 2-10 are obese (http://www.dh.gov.uk/en/Publicationsandstatistics/PublishedSurvey/HealthSurveyforEngland)
The incidence of Type 2 diabetes has increased dramatically since 1990 and this rise has occurred in tandem with the prevalence of sedentary lifestyles and obesity. There are ways to address this trend by encouraging physical activity (McGinnis JM 2002) and in the U.S.A a large clinical trial (Diabetes Prevention Program DPP) demonstrated that through diet and engaging in walking or other moderate intensity exercise for thirty minutes each day, participants reduced their body weight by 5% to 7% with a consequent reduction in risk for diabetes of 60% (National Institute of Diabetes and Digestive and Kidney Disease 2001). 45% of the participants in the DPP trial were from minority groups that suffer disproportionately from Type 2 diabetes, including African-American and Hispanic-Americans, demonstrating that exercise intervention is effective in dealing with inequalities in health (Kriska A 2002). The physical activity prescription used in the DPP was similar to public health recommendations (Centres for Disease Control 1996, Pate RR 1995) which call for an increase in moderate levels of physical activity, such a brisk walking for about thirty minutes on most days. Such activities are more likely to be maintained over the years by people of different ethnic/racial and economic groups than are high-intensity sports (Task Force on Community Preventive Services 2002). Planning changes are needed to build environments that are more favourable to physical activity and which will maximise the likelihood that walking will be maintained.
Physical activity is essential to the aim of addressing the problems of sedentary living and obesity amongst children and adults. Accessibility (determined by land-use patterns and the transport system) to playing in the park, sport and other facilities is key to supporting physical activity. Proximity to routine destinations is an important correlate of physical activity (D.A. Cohen 2006) and residents living in poorer areas have more environmental barriers to overcome to become physically active (W.C. Taylor 2006) which highlights the need for environmental justice. Active living requires that development plans incorporate walking and cycle ways to connect homes with schools, workplaces and shops whilst implementing appropriate control of motor traffic. The World Health Organisation (WHO 2006) has produced guidance for local governments and examples of case-studies whereby physical activity and active living may be promoted in urban environments. For example, the Sandness Municipal Council in Norway has made a systematic effort to identify and promote the interests of children in planning. Schools and children have registered hundreds of play areas and short cuts on digital maps and these areas are required to be safeguarded in planning activities.
Physical activity does not need to be vigorous and sustained to achieve health benefits. Improved health can be attained through the accumulation of shorter bouts of moderate-intensity activity (US Department of Health and Human Services 1996); however, greater levels of activity do produce greater health benefits.
Delivering Healthier Communities in London
170
In the U.S.A the Task Force on Community Preventive Services conducted a systematic review of community interventions to increase physical activity. It found sufficient evidence to recommend creation of or enhanced access to places for physical activity combined with informational outreach activities. This was effective as measured, for example, by percentage of persons exercising on three or more days of the week (Task Force on Community Preventive Services 2002a, 2002b). Lack of data is one of the main barriers to progress in examining the causal links between the built environment and physical activity levels (Transportation Research Board of the Institute of Medicine, 2005) There is a need for geographic and environmental data which will permit the linking of information on physical activity with details about the respondents’ location and physical environment (Boarnet MG 2004, Handy 2004, Handy et al 2002).
There is a growing awareness that cities can be designed to fight obesity (Larkin M 2003) and there is increasingly a marriage of city planning and public health. Planners have the imperative of solving problems of congestion and lack of open-space and public health professionals are realizing that these problems contribute to the prevalence of obesity in the population. There are initiatives in the U.S.A with projects looking at ways communities can be designed to encourage more physical activity (e.g. Active Living by Design: http://www.activelivingbydesign.org and American Planning Association: http://www.planning.org/physicallyactive). The U.K also has several well developed programmes for promoting fitness-friendly environments such as the UK’s Walking the Way to Health Initiative (http://www.whi.org.uk) which is a project of the British Health Foundation and the Countryside Agency.
The rising prevalence of obesity and Type 2 diabetes as well as the recognised preventive measure of increasing physical activity resulted in guidance from the National Institute for Health and Clinical Excellence (www.nice.org.uk). NICE has published a quick reference guide for local authorities and the public in the prevention of obesity in adults and children (NICE 2006). This encourages planners to facilitate links between health professionals and others to ensure that local policies improve access to opportunities for physical activity and healthy food.
Evidence such as that cited above as well as others (Kahn E 2002, Spence JC 2001, ACES 2006) have made the case for how land use planning can impact on the public health and healthy living. Researchers are now addressing how perceptions of the local environment affect people’s preparedness to exercise (Rutten et al 2001) as well as the issues relating to access to facilities by socioeconomic status (Gordon-Larsen P 2006). Also, attention is being focused on vulnerable groups such as children (Active Living Research 2005), people with disabilities (Active Living Research 2006) and older adults (Cunningham GO 2004, King AC 1998).
Regular physical activity is associated with enhanced health and reduced risk for all-cause mortality (Lee et al 1995, Paffenbarger et al 1993, Paffenbarger et al 1994, Blair et al 1995). Beyond the effects on mortality, physical activity has multiple health benefits, including reducing the risk for cardiovascular disease, diabetes, obesity, selected cancers and musculoskeletal conditions (Bouchard et al 1994).
APPENDIX 3.3: Detailed Obesity Evidence Base
Delivering Healthier Communities in London
171
REFERENCES
ACES: Active Community Environments Initiative Working Paper. How land use and transportation systems impact public health: a literature review of the relationship between physical activity and built form. (http://www.cdc.gov/nccdphp/dnpa/physical/health_professionals/active_ environments/aces.htm)
Active Living Research (2005). Designing to reduce childhood obesity. (www.activelivingresearch.org)
Active Living by Design (2006) Disability and physical activity: an overview of issues related to active living. Chapel, Hill, NC, Active Living by Design. (http://www.activelivingbydesign.org/index. php?id=377)
Blair SN, Kohl HW 3rd, Barlow CE, Paffenbarger RS Jr, Gibbons LW, Macera CA. Changes in physical fitness and all-cause mortality: a prospective study of healthy and unhealthy men. JAMA 1995;273:1093-8
Boarnet MG The built environment and physical activity: empirical methods and data resources. Prepared for the Committee on Physical Activity, Health, Transportation and Land Use. 2004 July 18.
Bouchard C, Shephard RJ, Stevens T eds. Physical activity, fitness and health: international proceedings and consensus statement. In: Proceedings of the 1992 International Conference on Physical Activity, Fitness and Health. Champaign, IL: Human Kinetics Publisher, 1994.
Centres for Disease Control and Prevention (1996). Physical activity and health: a report of the surgeon general. US Department of Health and Human Services.
Cohen Deborah A, Ashwood Scott et al Proximity to School and Physical Activity Among Middle School Girls: The Trial of activity for Adolescent Girls Study. JPAH 2006 3;Supp1:
Cunningham GO and Michael YL Concepts guiding the study of the impact of the built environment on physical activity for older adults: a review of the literature. Am J of Health Promotion 2004 18;6:435-442.
Gordon-Larsen P, Nelson MC, Page P and Popkin BM Inequalities in the built environment underlie key health disparities in physical activity and obesity. Paediatrics 2006 117;2:417-424
Handy S. Community design and physical activity: what do we know? – and what don’t we know? National Institute of Environmental Health Sciences conference on “Obesity and the Built Environment. Improving Public health through Community Design.” Washington, DC (http:// www.des.ucdavis.edu/faculty/handy/Handy_NIEHS_revised.pdf )
Handy S, Boarnet MG, Ewing R, Killingsworth RE. How the built environment affects physical activity: views from urban planning. Am J Prev Med 2002 23;2s:64-73.
Kahn, EB, Ramsey LT, Brownson RC et al The effectiveness of interventions to increase physical activity: a systematic review. Am J Prev Med 2002 22;45:Supp1: 73-107.
Delivering Healthier Communities in London
172
King AC, Rejeski J, Buchner D Physical activity interventions targeting older adults: a critical review and recommendations. Am J Prev Med 1998 15;4:316-333.
Kriska A (2002). Striving for a more active community: lessons from the diabetes prevention programme and beyond. Am J Prev Med. 22;45:6-7.
Larkin M Can cities be designed to fight obesity? Lancet 2003 362:1046-7.
Lee IM, Hsieh CC, Paffenbarger RS Jr. Exercise intensity and longevity in men; the Harvard Alumni Health Study. JAMA 1995; 273:1179-84.
McGinnis JM Diabetes and physical activity: translating evidence into action. Am J Prev Med, 2002 22;45:1-2.
National Institute for Health and Clinical Excellence, NICE (2006). Quick reference guide 1: for local authorities, schools and early years providers, workplaces and the public. Obesity – guidance on the prevention, identification, assessment and management of overweight and obesity in adults and children. (http://www.nice.org.uk/)
National Institute of Diabetes and Digestive and Kidney Disease (2002). Diet and exercise dramatically delay Type 2 diabetes: diabetes medication metformin also effective. Available: http://www.niddk. nih.gov/welcome/releases/8_8_01.htm
Paffenbarger RS Jr, Hyde RT, Wing AL, Lee IM, Jung DL, Kampert JB. Association of changes in physical activity level and other lifestyle characteristics with mortality among men. N Engl J Med 1993;328:538-45.
Paffenbarger RS Jr, Kampert JB, Lee IM, Hyde RT, Leung RW, Wing AL. Changes in physical activity and other lifeway patterns influencing longevity. Med Sci Sports Exerc 1994;26:857-65
Pate RR, Pratt M, Blair SN et al. Physical activity and public health: recommendations from the centres for disease control and prevention and the American college of sports medicine. JAMA 1995 273:402- 7.
Rutten A, Abel L, Kannas L et al Self-reported physical activity, public health and perceived environment: results from a comparative European study. J Epidemiol Community Health. 2001 55:139-146.
Spence JC, Shephard RJ and Craig C (2001). Compilation of evidence of effective active living interventions: a case study approach. A report submitted to Health Canada on behalf of the Canadian Consortium of Health Promotion Research.
Task Force on Community Preventive Services. Increasing physical activity: a report on recommendations of the task force on community preventive services. Morbidity and Mortality Weekly 50:RR-18, October 26 2001. Centres for Disease Control and Prevention, Atlanta.
Task Force on Community Preventive Services. The effectiveness of interventions to increase physical activity: a systematic review. Am J Prev Med 2002a 22;45:73-107.
Delivering Healthier Communities in London
173
Task Force on Community Preventive Services. Recommendations to increase physical activity in communities. Am J Prev Med. 2002b 22:45, pages 67-72.
Taylor Wendell C, Poston Walker S.C. et al environmental Justice: Obesity, Physical Activity, and Healthy Eating JPAH 2006 3;(Supp 1):
Transportation Research Board, Institute of Medicine of the National Academies (2005) Does the built environment influence physical activity? Examining the evidence. TRB Special Report 282. (http:// gulliver.trb.org/bookstore/)
US Department of Health and Human Services. Physical activity and health: a report of the Surgeon General. Atlanta, GA: US Department of Health and Human Services, CDC, National Centre for Chronic Disease Prevention and Health Promotion, 1996.
WHO Europe. Promoting physical activity and active living in urban environments: the role of local governments. Edewards P and Tsouros A eds. Copenhagen, Denmark: 2006.
Delivering Healthier Communities in London
174
APPENDIX 3.4: Detailed Cardiovascular and Respiratory Disease Evidence Base
CARDIOVASCULAR AND RESPIRATORY DISEASE AND RISK FACTORS WHICH MAY BE MODIFIED THROUGH SPATIAL PLANNING
Synopsis of the Evidence
• Thereisstrongquantitativeevidencethatrespirableparticles(PM10)inurbanareashavea short term effect on deaths from all causes (0.75% per 10 µgm-3 PM
10 as 24 hour mean) and
respiratory hospital admissions (0.8% per 10 µgm-3 PM10
as 24 hour mean). The primary source of PM
10 in urban areas is motor traffic.
• Nitrogendioxideisproducedbymotorvehicleexhaustsandisaneffectmodifier.Increasein daily mortality associated with a 10 µgm-3 increase in PM10 was 0.8% for a city with high long term average NO
2 concentrations compared to 0.19% for a city with low long term average.
• Ozonegivesrisetopopulationexposureinbothruralandurbanareas.Deaths(allcauses)and respiratory hospital admissions are +3% and +3.5% respectively for 50 µgm-3 eight hour mean O
3
concentration.
u Spatial planning can modify the total volume of traffic as well as congestion of traffic at certain locations. This may have a preventive effect on population CVD and respiratory disease by reducing air pollution.
• Thereisevidencethatvigorousphysicalactivitiessuchasbriskwalkingorcyclingonmostdaysof the week has a clear association with reduced risk of CHD in middle aged and older people.
u Spatial planning has the potential to provide opportunities for walking to work, cycling and access to leisure facilities.
• TheepidemiologicalevidenceforassociationbetweennoiseexposureandCVDisnotstrong.
• Thereisevidencethatfollowingfloodingresidentsaremorelikelytoreportexacerbationsof asthma, coughs and respiratory infections.
u Spatial planning can prevent flood risk to residential properties.
Delivering Healthier Communities in London
175
CARDIOVASCULAR AND RESPIRATORY DISEASE
Health Risks Associated with Respirable Particles in ambient air
There is a body of epidemiologic evidence which demonstrates that there are small health risks associated with population short-term (acute) and long-term (chronic) exposure to ambient levels of PM
10 particles. The evidence base is sufficiently robust to permit quantitative risk estimates The DOH’s
Committee on the Medical Effects of Air Pollutants have reviewed the available epidemiological evidence and published exposure-response coefficients (COMEAP 1998) for short term effects of air pollution on health. These are:
• Deaths,allcauses: +0.75%per10µg/m3PM10
(24 hour mean)• Respiratoryhospitaladmissions: +0.8%per10µg/m3PM
10 (24 hour mean)
The estimates of the exposure-response relationships are based on the results of time-series studies. These studies examine the relationship between daily levels of pollution and the risk of adverse health effects, on the same day or subsequent days, adjusting for climate and other factors.
The APHEA-2 mortality study (Air Pollution and Health: a European Approach) covered a population of more than forty three million people living in European cities studied for more than five years in the 1990’s. The all-cause daily mortality increased by 0.6% (95% CI 0.4-0.8) for each 10µgm-3 increase in PM
10.
(Katsouyanni K et al, 2001). The National Mortality, Morbidity and Air Pollution Studies (NMMAPS) in the USA investigated 50 million inhabitants of metropolitan areas during 1987-94 and all-cause mortality increased by 0.5% (95% CI 0.1-0.9) for each 10µgm-3 increase in PM
10. (Samet JM et al, 2000).
In Europe, a World Health Organisation (WHO) task group conducted a meta-analysis of time series studies. (Anderson HR et al, 2005). Estimates of PM
10 effects on all cause mortality were taken from 33
separate European cities or regions and all cause mortality increased by 0.6% (95% CI 0.4-0.8) for each 10µgm-3 increase in PM
10. The summary estimates for cardiovascular and respiratory mortality separately
were 0.9% (95% CI 0.5-1.3) and 1.3% (95% CI 0.5-2.0) respectively for each 10µgm-3 increase in PM10
.
The APHEA-2 hospital admission study covered a population of thirty eight million living in eight European cities during the 1990s. Hospital admissions for chronic obstructive lung disease (COPD) and asthma for people of more than sixty five years of age were increased by 1% (95% CI 0.4-1.5) per 10µgm-3 increase in PM
10, and admissions for cardiovascular disease (CVD) were increased by 0.5% (95% CI 0.2-0.8)
per 10ugm-3 increase in PM10
. (Le Tertre A et al, 2003). In the USA effects on people of more than sixty five years of age who were studied in ten cities were an increase of 1.5% (95% CI 1.0-1.9) on COPD admissions and 1.1% (95% CI 0.9-1.3) on CVD admissions per 10µgm-3 increase in PM
10. (Zanobetti A, 2000).
It is important to realise that these outcomes are likely to only apply to patients who already have severe, pre-existing disease (e.g. Chronic Obstructive Pulmonary Disease and ischaemic heart disease). In these circumstances the increment in level of an air pollutant acts as the precipitating factor.
Delivering Healthier Communities in London
176
Two epidemiological studies in the United States have shown long term effects and that those living in less polluted cities live longer than those living in more polluted cities. The measure of particulates employed was PM
2.5 defined analogously to PM
10 (i.e. smaller particles). COMEAP considers that this
evidence demonstrates that it is more likely than not that a causal association exists between long term exposure to particles and although the results of the US studies may be transferable to the UK, the size of the impact could differ.
COMEAP reviewed these two studies (COMEAP, 2001) and also a reanalysis of their data by the Health Effects Institute. The COMEAP review reported that:
The ‘Six Cities; study (Dockery DW et al, 1993) examined the mortality experience of over 8000 adults living in six cities in relation to measurements of air pollution in the cities in which they lived. They were followed up for 14 to 16 years between 1974 and 1991. All cause mortality rates, adjusted for sex, age, smoking, education, occupational exposure and body mass index, were shown to be associated with levels of fine particles (measured from 1979 to 1985) and sulphate (1979 to 1984). The ratio of the adjusted mortality rate in the most polluted city to that in the least polluted city (using fine particles as a measure) was 1.26 (95% confidence intervals 1.08-1.47). Air pollution was positively associated with death from lung cancer and cardiopulmonary disease but not other causes.
The ACS study (Pope CA et al, 1995) made use of a cohort of 552,138 adults living in 151 cities across the United States. The cohort was followed for 7 years from 1982 to 1989. Again, there was an association between all cause mortality (adjusted for age, sex, race, smoking, occupational exposure, education, body mass index and alcohol use) and sulphates (measured in 1980 in all 151 cities) or fine particles (measured from 1979 to 1983 in 50 of the cities). The adjusted relative risk for the most polluted areas compared with the least polluted areas (as indicated by fine particles) was 1.17 (95% confidence intervals 1.09-1.26). Positive associations were found with cardiopulmonary mortality and, for sulphates only, with lung cancer.
The HEI reanalysis (Krewski D, 2000) also looked at whether the associations between fine particles and mortality varied in different subgroups. Those with pre-existing heart or lung disease are one plausible susceptible subgroup but the relative risk was not increased in this group in the ACS study and the increase seen in the six cities study was not statistically significant. Similarly, the increased relative risk in those with reduced FEV1 in the six cities study was not significant. There was also no difference in relative risk between smokers and non-smokers. It seemed that only cardiovascular mortality was affected in both studies. It might be suggested that the apparent lack of an effect on respiratory mortality might be due to misclassification between cardiovascular and respiratory deaths. Schwartz (1994) has shown that cardiac deaths associated with short-term exposure to air pollution more often have respiratory disease as a contributing cause of death. It is unknown whether this is the case for the long-term effects.
The cohort studies (Dockery DW et al, 1993; Pope CA et al, 1995) were unable to take account of different durations of exposure or of the differences in historical levels of air pollution in the cities. Particle levels measured over relatively brief periods (6 years at most (Dockery DW et al, 1993)) were used to represent the pollution experience of cities.
APPENDIX 3.4: Detailed Cardiovascular and Respiratory Disease Evidence Base
Delivering Healthier Communities in London
177
Stratification of age in the ACS study indicated that risks were not reduced in those under 50 as would be expected if more than 40 to 50 years of exposure were needed before the onset of an effect.The studies examine mortality in relation to spatial rather than temporal differences in pollution so there are additional uncertainties when applying them to assess the impact of changing pollution over time. The mix of pollutants in the air may vary between countries and this may be important for transferability of the results.
The ACS study (Pope CA et al, 1995) represented the PM2.5
levels in terms of a single value of long-term average concentration in each of the cities studied. It used a median concentration, based on measurements from 1979-1983, as its index of long-term annual average PM
2.5. The relative risk for fine
particles and mortality in the ACS study (Pope CA et al, 1995) was 1.17.
A multi-disciplinary team co-ordinated by the Institute of Occupational Medicine (IOM) (Hurley JF et al, 2000) has analysed the possible implications of the effects of long-term exposure to particles on the UK population. The IOM report used life-table methods to link the results of the US cohort studies with the age and mortality experience of the UK population. This allowed an estimate of the possible loss of life expectancy due to long-term exposure to fine particles subject to certain assumptions. The calculations are for changes in all-cause mortality in those over 30 (as in the cohort studies).
The results apply to the population of England and Wales alive in 2000 followed to the end of their lives assuming a 1µg/m3 drop in annual mean PM
2.5 is maintained for the rest of their lifetime. The baseline
assumes current mortality rates remain unchanged (sensitivity analyses have shown that changing this assumption has little effect on the results). In a statement on the long-term effects of particles on mortality (COMEAP 2001) COMEAP also provided a separate rough estimate of the life years gained, if the effect of short-term exposure on mortality is calculated for a 1ugm-3 drop in annual mean PM
10 rather
than PM2.5
. This includes the under 30s and assumes an effect on all ages.
The answers range from 0.2 to 4.1 million life years gained over the rest of the lifetime of the population alive today. This could be expressed as 1 day to 1 month per person per µg/m3 PM
2.5 on average but
it should be noted that the gains if life expectancy are unlikely to be evenly distributed across the population.
To put this reduction into context, a series of measurements of PM2.5
made at 3 urban background sites in London during 2000-2001 gave an average of 18µ gm-3. A reduction of 1ugm-3 PM
2.5 represents around a
5% reduction from this level (COMEAP 2001).
In addition to studies on hospital admissions and mortality the effects of air pollution on respiratory morbidity have also been investigated. Lung function and symptoms of bronchitis in adults was negatively associated with PM
10 in different communities in Switzerland (Zemp E 1999). Associations
were also reported between lung function and symptoms of bronchitis in children and fine particles in children in US and Canadian communities. (Raizenne M. 1996, Dockety D.W. 1996). Also lung function growth has been shown to be affected by exposure to air particulates. (Gauderman W.J. 2000). The evidence base of air pollution and health is very extensive and a review of the major studies is given by Brunekreef and Holgate (Brunekreef B 2002).
Delivering Healthier Communities in London
178
Health Effects Associated with Nitrogen Dioxide in Ambient Air
Nitrogen dioxide is produced with nitric oxide by motor traffic. Epidemiological studies have tended not to show that nitrogen dioxide contributes much to health effects associated with ambient air pollution (Department of Health, 1999). COMEAP reported on acute and chronic effects of nitrogen dioxide in 1998 (Department of Health, 1998) and commented that:
The effects of NO2 appear to be dependent on a wide range of modifying influences and are difficult
to assess. All cause mortality is increased by approximately 3.5% per 100µgm-3 on days with elevated NO
2. There is little evidence that admissions to hospital are increased by increased levels of NO
2 for
all respiratory causes but there are apparent increases in admissions for COPD and asthma. A large proportion of all studies on the acute effects of NO
2 emphasize the heterogeneity of response between
groups defined either by personal characteristics or by coexistent exposures. COMEAP quotes a risk coefficient for respiratory hospital admissions of +2.5% per 50µgm-3 NO
2 increase in 24 hour average NO
2.
There is a lack of consistency in the results of studies examining the chronic effects of NO2 on respiratory
symptoms and lung function in children and therefore COMEAP has not yet estimated risk coefficients for these effects.
Since 1998 the APHEA study which relates time-series of routinely collected mortality and hospital admissions to daily air pollution data (Katsouyanni K, 2001) has found that NO
2 is an effect modifier and
that the estimated increase in daily mortality associated with a 10µgm-3 increase in PM10
was 0.8% for a city with high long term average NO
2 concentrations compared to 0.19% for a city with low long term
average.
Health Effects Associated with Ozone in Ambient Air
Ozone is created by the action of sunlight on nitrogen dioxide in the presence of volatile organic compounds and ambient concentrations show yearly, seasonal and diurnal variation. Ozone and its precursors may be transported over long distances giving rise to population exposure in both rural and urban areas.
COMEAP concluded that for the purposes of health impact assessment only data for respiratory admissions and all cause mortality should be used and published exposure response coefficients (Department of Health 1998):
Deaths (all causes) and respiratory hospital admissions +3% and +3.5% respectively per 50µgm-3 8 hour mean 03 concentrations.
APPENDIX 3.4: Detailed Cardiovascular and Respiratory Disease Evidence Base
Delivering Healthier Communities in London
179
Physical activity in the prevention of Cardiovascular Disease
The amount and type of physical activity required for the primary prevention of coronary heart disease is not known precisely. There is evidence from a number of studies (Wannamethee SG, 2001) that leisure time physical activity is associated with reduced risk of CHD in middle-aged and older people of both sexes. Perhaps the strongest evidence comes from an ongoing cohort of men in the USA (Sesso HD, 2000) which demonstrates that vigorous activities are associated with a reduced risk of CHD but that moderate or light activities have no clear association with the risk of CHD. Vigorous activities equate to activities such as brisk walking and recreational cycling on most days of the week. Such activity may favourably affect CHD risk even in the presence of other CHD risk factors.
Noise and Cardiovascular Disease in the Community
Concerns have been expressed that long term exposure to community noise may have adverse health affects. There is some evidence that noise is a non-specific stressor that arouses the autonomous nervous system and the endocrine system. (Spreng 2000a, Spreng 200b) and that the arousal of the endocrine and autonomic nervous system in turn affects classical biological risk factors for cardiovascular disease (e.g. blood pressure) (Babisch 2002).
In a community cardiovascular survey in the early 1970s, into cardiovascular health and aircraft noise around Schiphol airport in Amsterdam, over 5,800 people were screened for cardiovascular symptoms using a questionnaire and medical examination (Knipschild, 1977, Knipschild & Oudshoorn 1977). It was found that in areas with “more” aircraft noise a significantly greater number of people were receiving medical treatment for heart trouble (p<0.05), were receiving medical treatment for hypertension (high blood pressure – p<0.001) or were taking cardiovascular drugs (p<0.01). These changes could not be explained by potential confounding factors such as age, sex, smoking habits and so on. This work has been criticised, however, because of the poor response rate (of the people contacted only 42% took part in the survey) (Green et al , 1982). It was also not possible to control for socio-economic factors, and socio-economic status was lower in the group exposed to the greatest aircraft noise (Knipschild, 1977).
In a study on GP contacts (Knipschild, 1977a), total contact rate was found to be significantly higher (p<0.001) in the group exposed to the greatest aircraft noise. As with the cardiovascular screening survey socio-economic variables were not accounted for, nor were other confounding factors, such as the prevalence of smoking, considered.
In a study on school children, (Cohen et al, 1980) found that children attending a school near the Los Angeles International airport (mean peak classroom noise: 74 dB) were more likely to have higher systolic and diastolic blood pressure than children from “quiet” schools (mean peak noise: 56 dB). Socio-economic factors, race, mobility etc. were taken into account. Living in a quiet home but attending a noisy school was not found to affect the results. A longitudinal study (where participants are followed through time), conducted 1 year after the original study failed to confirm these findings (Cohen et al, 1981). The authors attribute this to the high drop out rate, with a large proportion of the children from the noisy school not being re-tested. Although the original study did demonstrate a statistically significant difference in blood pressure readings between the two groups of children, the readings from the high-noise exposed children were still within the normal range (Voors et al, 1976).
Delivering Healthier Communities in London
180
In Slovak Republic, children between the ages of 3 – 7, attending kindergartens subject to high traffic noise (>60 dBA) have been shown to have higher mean systolic and diastolic blood pressure and lower mean heart rate than children attending quiet kindergartens (<60 dBA). The location of the kindergarten in relation to noise exposure was found to be more important than home noise exposure estimates (Regecova, Kellerova, 1995). In this study account was taken of confounding factors and statistical analysis showed that noise was the most important variable (p<0.001).
In case-control studies undertaken in Berlin relative risks greater that 1 for the incidence of myocardial infarction were found only in men who lived adjacent to streets where daytime noise levels exceeded 70 dB(A) outdoors (Babisch W et al 1994). However assessment of cardiovascular risk associated with prolonged exposure to traffic noise at home through a 10 year follow-up cohort study of middle-aged men in Caerphilly and Bristol found no statistically significant noise effects (Babisch W. et al 1999). More recently, meta analyses of case-control and cohort data from the epidemiological studies in Caerphilly and Speedwell in the United Kingdom (Babisch 2003) and from Berlin (Babisch 2005) have been undertaken on the relationship between road traffic noise level and the incidence of myocardial infarction (Babisch 2006). A dose response relationship was observed when the incidence of myocardial infarction was compared by exposure category i.e. <60 dBA, 61-65 dBA, 66-70 dBA, 71-75 dBA and 76-80 dBA but none of the exposure category estimates achieved statistical significance.
The epidemiological evidence for association between noise exposure and cardiovascular disease is not strong as indicated by reviews (Babisch 2000, Kempen 2002, Passchier-Vermeer et al 2000).
RESPIRATORY DISEASE ASSOCIATED WITH FLOODING
Dales et al. (1991a and b) examined the effects on health in adults and children (between the ages of 5 and 8) exposed to home dampness and moulds (defined as damp spots, visible mould or mildew, water damage and flooding). In adults, lower respiratory symptoms (any cough, phlegm, wheeze or wheeze with dyspnoea – laboured or difficult breathing) were reported more frequently in those living in homes with dampness or mould (Dales et al., 1991a). The relationship remained after adjusting for a number of socio-demographic and exposure variables (adjusted odds ratio [OR] 1.62; 95% confidence interval [CI] 1.48 – 1.78). In children, the prevalence of all respiratory symptoms was higher in homes with reported dampness or moulds. The adjusted odds ratios ranged from 1.32 (95% CI 1.06 – 1.39) for bronchitis to 1.89 (95% CI 1.58 – 2.26) for cough (Dales et al., 1991b). Although these studies were conducted as questionnaire surveys and no fungal spore measurements were taken, previous studies have suggested that respondents’ perceptions of home dampness correlate with measured spore concentrations (von Wageningen et al., 1987) and that where a ‘water problem’ existing for more than three days this was associated with an increase in measured spore levels (Gallup et al., 1987).
Research conducted in the UK by the Flood Hazard Research Centre (FHRC), has suggested that respondents at focus group meetings following flooding in the northeast of England (June 2000) were likely to report asthma, chest infections, coughs, colds and flu believed to be due to the flooding (Tapsell et al., 2002), although the specific symptoms reported vary by the area studied. In a Defra/EA study (Defra/EA, 2003) respondents were asked to report on physical health effects following flooding. Respiratory symptoms (namely colds, cough, sore throats and flu) were reported by 20% of the respondents. Reacher et al. (2004), in a study of the health impacts experienced as a result of flooding in Lewes found a significant association between flooding and self-reported worsening of asthma in adults (relative risk [RR] 3.1; 95% CI 1.2 – 4.4) but not for respiratory illness in children or adults.
APPENDIX 3.4: Detailed Cardiovascular and Respiratory Disease Evidence Base
Delivering Healthier Communities in London
181
REFERENCES
Anderson HR (2005). Meta-analysis of time series studies and Panel studies of particulate matter and ozone. Report of a WHO task-group retrieved from http://www.euro.who.int/document/e82792. pdf
Brunekreef B and Holgate S.T. (2002) Air Pollution and health. Lancet 360:1233-42.
COMEAP (2001). Committee on the Medical Effects of Air Pollutants. Statement on long-term effects of particles on mortality and report on long-term effects of particles on mortality. http://www.doh. gov.uk/comeap/index.htm
Cohen S, Evans GW, Krantz DS and Stokols D. 1980 Physiological, motivational, and cognitive effects of aircraft noise on children: moving from the laboratory to the field. American Psychologist 35, 231- 243.
Cohen S, Evans GW, Krantz DS, Stokols D and Kelly S. 1981 Aircraft noise and children: Longitudinaland cross-sectional evidence on adaptation to noise and the effectiveness of noise abatement. Journal of Personality and Social Psychology 40, 331-345.
Dales RE, Burnett R, Zwanenburg H (1991a) Adverse health effects among adults exposed to home dampness and molds. American Review of Respiratory Diseases 143: 505-509.
Dales RE, Zwanenburg H. Burnett R, Franklin CA (1991b) Respiratory health effects of home dampness and molds among Canadian children. American Journal of Epidemiology 134(2): 196-203.
Defra/EA (2003) The appraisal of human-related intangible impacts of flooding. R&D Project FD2005.
Defra/Environment Agency Flood and Coastal Defence R&D Programme. Policy Development Theme, London.
Department of Health. Committee on the Medical Effects of Air Pollutants. Quantification of the effects of air pollution on health in the United Kingdom (1998). HMSO.
Dockery DW, Pope CA, Xu X, Spengler JD, Ware JH, Fay ME, Ferris BG, Speizer FE. An association between air pollution and mortality in six US cities. New England Journal of Medicine (1993) 329:1753- 1759.
Dockery DW, Cunningham J, Damokosh AI et al. Health effects of acid aerosols on North American children: respiratory symptoms. Environ. Health Perspect. (1996) 104;500-05.
Gallup J, Kozak P, Cummins L, Gillman S (1987) Indoor mold spore exposure: characteristics of 127 homes in Southern California with engogenous mold problems. Cited by Dales et al., 1991.
Gauderman WJ, McConnell R, Gilliland F et al. Association between air pollution and lung function growth in southern California children. Am. J. Respir Crit Care Med (2000) 162;1383-90.
Delivering Healthier Communities in London
182
Green KB, Pasternack BS and Shore RE 1982 Effects of aircraft noise on reading ability of school-age children. Archives of Environmental Health 37, 24-31.
Hurley JF, Holland MR, Markandya A, Miller BG, Anderson HR, Ayres JG, Donnan PT, Harrison RM, King K, Stedman JR, Stevenson KJ. Towards assessing and costing the health impacts of ambient particulate air pollution in the UK. Edinburgh: Institute of Occupational Medicine, 2000.
Katsouyanni K, Touloumi G, Samoli E et al. Confounding and effect modification in the short-term effects of ambient particles on total mortality: results from 29 European cities within the APHEA2 project. Epidemiology (2001) 12,521-531.
Knipschild P. 1977 Medical effects of aircraft noise: community cardiovascular survey. International Archive of Occupational and Environmental Health 40, 185-190.
Knipschild P. 1977a Medical effects of aircraft noise: general practice survey. International Archive of Occupation and Environmental Health 40, 197-200.
Knipschild P and Oudshoorn N. 1977 Medical effects of aircraft noise: drug survey. International Archive of Occupational and Environmental health 40, 191-196.
Krewski D, Burnett RT, Goldberg MS et al. Re-analysis of the Harvard Six-Cities study and the American Cancer Society Study of air pollution and mortality. Cambridge, Massachusetts: Health Effects Institute, 2000.
Pope CA, Thun MJ, Namboodiri MM, Dockery DW, Egans JS, Speizer FE, Heath CW. Particulate air pollution as a predictor of mortality in a prospective study of US adults. Am J Respiratory Critical Care Medicine (1995) 151:669-674.
Raizenne M, Neas LM Damokosh AI et al Health Effects of acid aerosols on North American children: pulmonary function. Environ Health Perspect (1996) 104;506-14.
Reacher M, McKenzie K, Lane C, Nichols T, Kedge I, Iversen A, Hepple P, Walter T, Laxton C, Simpson J (2004) Health impacts of flooding in Lewes: a comparison of reported gastrointestinal and other illness and mental health in flooded and non-flooded households. Communicable Disease and Public Health 7(1): 39-46.
Regecova V and Kellerova E. Effects of urban noise pollution on blood pressure and heart rate in preschool children. J. Hypertension 1995 4:405-412.
Samet JM, Dominici F, Curriero FC, Coursac I, Zeger SL. Fine particulate air pollution and mortality in 20 US cities, 1987-1994. N Engl J Med (2000), 343:1742-49.
Schwartz J. What are people dying of on high air pollution days? Environ Res (1994) 64:26-35.
Sesso HD, Paffenbarger S Jr, Lee IM (2000). Physical activity and coronary heart disease in men. The Harvard Alumni Health Study. Circulation 102;975-980. http://circ.ahajournals.org/cgi/content/ full/102/9/975.
APPENDIX 3.4: Detailed Cardiovascular and Respiratory Disease Evidence Base
Delivering Healthier Communities in London
183
Tapsell S, Penning-Rowsell EC, Tunstall SM, Wilson TL (2002) Vulnerability to flooding: health and social dimensions. Philosophical Transactions of the Royal Society of London, Series A 360: 1511-1525.
Von Wageningen N, Waegenmaekers M, Brunekreef B, Boleij J (1987) Health complaints and indoor moulds in relation to moist problems in homes. Cited by Dales et al., 1991.
Voors AW, Foster RA, Frerichs RR, Weber LS and Berenson GS 1976 Studies of blood pressure in children, ages 5-14 years, in a biracial community. Circulation 54, 319-327.
Wannamethee SG, Shaper AG (2001). Physical activity in the prevention of cardiovascular disease. An epidemiological perspective. Sports Med 31;2:101-114.
Zanobetti A, Schwartz J, Dockery DW. Airborne particles are a risk factor for hospital admissions for heart and lung disease. Environmental Health Perspectives (2000) 108;1071-1077.
Zemp E, Elsasser S, Schindler C et al Long-term ambient air pollution and respiratory symptoms in adults (SAPALDIA study) Am. J. Respir Crit Care Med (2999) 159;1257-66.

Delivering Healthier Communities in London
184
Heat and Cold Related Mortality and Morbidity
Synopsis of the Evidence
Urban areas generate a ‘heat island’ effect and London can be up to 8% warmer than rural areas and night temperatures in the city can remain above 19°C. Mortality increases in hot weather and elderly people are particularly vulnerable; in the 1995 heatwave in London there was a 16% excess in deaths for all ages and those aged over 85 had a 20% excess mortality. Climate change will further exacerbate this problem.
Measures can be incorporated into the layout of a development to reduce the heat island effect.
In England approximately a third of excess deaths in winter (18 excess deaths per 100,000 adults) are related to low indoor temperatures and 90% of these occur in those more than 65 years of age. Poor home insulation and fuel poverty contribute to the problem.
Measures can be incorporated into building design to improve insulation.
APPENDIX 3.5: Detailed Winter (cold) and Summer (heat) mortality Evidence Base
Delivering Healthier Communities in London
185
Mortality and morbidity rise in hot weather and elderly people are particularly vulnerable (Kunst AE 1993). Increases in death rates during heat waves are associated with underlying cardiovascular, cerebrovascular and respiratory disease. A proportion of those dying may have experienced a death hastened by only days or weeks due to severe illness and there may also be an interaction between temperature and concurrent episodes of air pollution (Sartor F 1995). Heat-related deaths begin to occur when mean daily temperatures rise above the minimum mortality band of 15.6 – 18.6 C. Currently, approximately 800 heat-related deaths occur in the U.K each year with 80 thousand extra hospital admissions (Department of Health 2001). A comparison of excess mortality during the 1995 and 1976 heat waves (Rooney C 1998, McMichael AJ & Kovats RS 1998) showed that excess deaths for all ages for England and Wales was 9.7% in 1976 and 8.9% in 1995. The impact of heat waves is higher in Greater London with excess deaths for all ages of 15.4% in 1976 and 16.1% in 1995. In the 1995 heat wave, those aged over 85 in Greater London had an excess mortality of 20.1%. There is also some indication that excess mortality was proportionately higher in more deprived populations (McMichael AJ & Megens T 1998). A study of heat-related deaths during a 1995 heat wave in Chicago showed that risk was increased for people with known medical problems who were confined to bed, those who did not leave home each day or who lived on the top floor of a building (Semenza JC 1996). All urban areas generate an urban heat island effect where night-time temperatures are higher compared to rural areas. London can be up to 8% warmer than rural areas and night temperatures in the city can remain above 19 C (Greater London Authority 2007). Measures can be incorporated into the layout of a development to reduce the heat island effect (Land Use Consultants 2006). A set of widely accepted climate change scenarios for the U.K have been developed under the U.K Climate Impacts Programme (UKCIP). The impact of climate change on temperature related mortality under a medium-high climate change scenario would result in an estimated 2800 heat-related deaths per year in the U.K in the 2050’s compared to 800 currently (DOH 2001).
The Eurowinter study found that mortality increased for outdoor temperatures below 18oC but that variations in mortality were independently associated with both outdoor and indoor temperature. (Eurowinter Group 1997; Healy J.D. 2003). In England approximately 90% of excess winter deaths are in those over 65 years of age and approximately a third of excess deaths are related to indoor temperatures yielding 18 excess deaths per 100,000 adults (Kingman S 2001; Wilkinson P 2001). This seasonal excess, although it has declined (Donaldson GC 1997), is still high compared to other European countries (Keatinge WR 1997). In the U.K, fuel poverty and poor home insulation contribute and are being addressed through the Government’s Warm Front Programme. Climate change will result in less excess winter deaths in the future.
Delivering Healthier Communities in London
186
REFERENCES
Department of Health (2001). Health effects of climate change in the U.K. (http://www.dh.gov.uk/PublicationsAndStatistics/Publications)
Donaldson GC, Keatinge WR. Mortality related to cold weather in elderly people in southeast England, 1979 -94. BMJ 1997; 315:1005–1056.
Eurowinter Group Cold exposure and winter mortality from ischaemic heart disease, cerebrovascular disease, respiratory disease, and all causes in warm and cold regions of Europe. Lancet 1997 349;9062:1341-1346.
Greater London Authority (2007). Draft Climate Change Adaptation Strategy.
Healy JD Excess winter mortality in Europe: a cross country analysis identifying key risk factors. J. Epidemiol. Community Health 2003 57;784-789.
Keatinge WR, Donaldson GC, Butcher K, Cordioli E, Dardanoni L, Jendritzky G, Katsouyanni K, Kunst AE, Makenbach JP, Martinelli M, McDonald C, Nyh S, Vuori I. Cold exposure and winter mortality from ischaemic heart disease, cerebrovascular disease, respiratory disease and all causes in warm and cold regions of Europe. Lancet 1997; 349: 1341-1346.
Kingman S Research briefing: Cold comfort: the link between housing and excess winter deaths. 2001 Available at: http://www.lshtm.ac.uk/php/publications/briefing6.pdf )
Kunst AE, Looman CWN, Mackenback JP. Outdoor air temperature and mortality in the Netherlands: a time series analysis. Am J Epidemiol 1993; 137: 331-341.
Land Use Consultants in association with Oxford Brookes University, CAG consultants and Gardiner & Theobald (2006). Adapting to climate change impacts – a good practice guide for sustainable communities. DEFRA, London.
McMichael AJ, Kovats RS. Assessment of the impact on mortality in England and Wales of the heat wave and associated air pollution episode of 1976. Report to the Department of Health. London: London School of Hygiene and Tropical Medicine, 1998.
McMichael AJ, Megens T, Wilkinson P, Rooney C. Material deprivation: a risk factor for heat-related mortality? Unpublished report. London: London School of Hygiene and Tropical Medicine, 1998.
Rooney C, McMichael AJ, Kovats RS, Coleman MP. Excess mortality in Greater London during the 1995 heat wave. J Epidemiol Community Health 1998; 52:482-486.
Sartor F, Snacken R, Demuth C, Walckiers D. Temperature, ambient ozone levels and mortality during summer 1994 heat wave in Belgium. Environ Res 1995; 70:105-113.
Semenza JC, Rubin CH, Falter KH, Selanikio JD, Flanders WD, Houre HL, Wilhelm JL. Heat-related deaths during the 1995 heat wave in Chicago. New Eng J Med 1996; 335:84-90.
APPENDIX 3.5: Detailed Winter (cold) and Summer (heat) mortality Evidence Base

Delivering Healthier Communities in London
187
Wilkinson P, Landon M, Armstrong B, Stevenson S, Pattenden S, McKee M, Fletcher T Cold comfort. The social and environmental determinants of excess winter death in England, 1986-96. 2001 Bristol: The Policy Press
Delivering Healthier Communities in London
188
INJURIES AND RISK FACTORS WHICH MAY BE MODIFIED THROUGH SPATIAL PLANNING
Synopsis of the Evidence
• Injuriesaccountfor3%ofannualdeathsintheUK.Injuryisthegreatestthreattolifeinchildren and young people and road traffic accidents are the leading cause of death whereas falls cause 4.1% of injury deaths in older age groups. Increased vehicle speeds resulting from decreased traffic congestion (to address air pollution issues) may increase RTA injuries.
• RTAsshowsubstantialinequalitiesbetweengroupsofdifferingsocialclass.
• Annually,injuriesleadto720,000admissionstohospitaland6millionemergencydepartment visits.
• Thereisgoodevidencethatareawidetrafficcalmingreduceschildpedestrianinjuryratesand also reduces the differential in rates based on inequalities in social groups.
• Thereisevidencethatbypassesdecreaseaccidentratesbuttheevidencefornewmajorurban roads and their effect on local road networks and accidents is less strong.
u Spatial planning can address area traffic calming.
• Injuriesinthehomearecommonbuttheevidenceofeffectsofenvironmentaladaptationinthe home is weak.
• Injuryratesassociatedwithfloodingareoftheorderof0.4%.
u Spatial planning can prevent flood risk.
APPENDIX 3.6: Detailed Evidence Base for Injuries
Delivering Healthier Communities in London
189
INJURIES
Public Health Burden of Injuries
The Centre for Health and Environment Research has reported on the burden of injuries in the UK. (Jones S and Parry S 2005 www.hpa.org.uk/publications/2005/burden_disease/10_supporting_doc.pdf )Injuries account for 3% of annual deaths in the UK and are ranked 14th leading cause of death in 2004. In the UK, injury is the greatest threat to life in children and young people. Between the ages of 15 and 24 years, 57% of all deaths are the result of injuries. The risks to older people are also substantial as around 20,000 deaths each year are due to injury, 4600 of which are over 75 year olds. In the UK, road traffic accidents and falls are the leading causes of unintentional injury death. RTA deaths are highest amongst young adult males, with falls predominantly affecting older females. Injury deaths in the UK have fallen by around 8% during the last decade, as a result of factors such as better medical treatment, improved safety practices and changing lifestyles (BMA, 2001).
Most injury deaths result from unintentional incidents, particularly amongst children and young adults; 76% of fatal injuries to 1-4 year olds, 83% to 5-14 year olds and 59% to 15-24 year olds are classified as ‘unintentional’. Unintentional injury deaths can be divided into a number of groups, but it is road traffic accidents (RTAs) and falls, both accounting for 27% of all deaths, that are of greatest concern. However, while the overall burden of these groups of incidents is similar, age related patterns are very different. RTAs tend to affect children and younger adults, peaking in the 15-24 year age group at 76% of all unintentional injury deaths, while falls affect older age groups, causing up to 41% of unintentional injury deaths.
Child pedestrian death rates have decreased during recent years but this is thought by many to be due to decreases in exposures of children as pedestrians, rather than as a result of roads being safer. As government targets for increasing physical activity and decreasing obesity are addressed, it is likely that pedestrian exposure will increase, with the possible effect of increasing pedestrian injury and death rates again. Furthermore, increased vehicle speeds resulting from decreased traffic congestion (to address congestion and pollution issues) is likely to compound this problem still further, increasing the severity of injuries and the likelihood of death.
ONS (2004) data presented here do not allow for deprivation based analysis. Previous analysis of trends in injury deaths, in England and Wales, by social class, has shown that the risk to the poorest is considerably greater than that to richer members of society (BMA, 2001).
Delivering Healthier Communities in London
190
Motor vehicle accidents are a leading cause of death amongst children and adolescents and also show substantial inequalities between different social class groups. However, while the actual rates and inequalities are of concern, it is also of note that the inequalities gap widened throughout the 1980s. This was due to a drop in rates amongst the most affluent, while rates for the most deprived showed no change. It is possible that the changes in driving habits and vehicle use that have occurred during the 1990s have lead to a further increase in inequalities. Pedestrian deaths account for a substantial proportion of all RTA related deaths in this age group and given the inequalities that exist for all RTAs, it is of little surprise that pedestrian incidents also show variation between the most affluent and most deprived. The more recent data indicate that the most deprived are more than 5 times more likely to be killed in pedestrian incidents than their more affluent counterparts. Again, changes in exposure that have occurred in recent years are unlikely to be equitable – affluent families have greater access to cars, meaning that there is greater potential for these children to walk less. Therefore, it is possible that inequalities in child pedestrian death rates have increased further during recent years.
Inequalities in injury related deaths are substantial and the gap between the most deprived and most affluent may be increasing. Prioritising the reduction of inequalities would have a substantial effect on the overall burden of injuries.
Only a very small proportion of injury episodes result in death. It is estimated that for every injury death there are 45 hospital episodes (HEs), 630 doctor consultations and 5000-6000 minor injuries (BMA, 2001). Annually, injuries lead to 720,000 admissions to hospital and 6 million emergency department visits (DTI, 2000). Twice are many pre-retirement life years are lost to injury as to coronary heart disease and 5% of health service expenditure is on the treatment of injuries (NHS Executive, 1996).
Any analysis of hospital admissions data and the burden of injuries on inpatient resources must be mindful of the fact that the likelihood of admission following an injury is not only affected by the severity, diagnosis and anatomical site of injury, but also by factors such as bed availability, seasonal variations, admission polices and procedure and treatment factors.
Almost two thirds of injury HEs are the result of unintentional incidents (61%). Falls and RTAs are the main causes of injuries, in terms of hospital episode data and deaths data.
Pedal cyclists account for the greatest proportion of HEs and emergency admissions for RTA incidents, but pedestrian injuries are associated with longer stays and a greater proportion of bed days.
Deprivation is an important risk factor for injury. However, when studying the relationship between hospital admission based injuries and deprivation, it needs to be remembered that deprivation influences the likelihood of admission. It has been shown, particularly for children, that admission is often dependent upon the perceived deprivation status, with judgements being made about the quality of care available at home and the likelihood of return for outpatient treatment. This leads to the most deprived being more readily admitted (Beattie et al, 1998; Kendrick, 1993).
APPENDIX 3.6: Detailed Evidence Base for Injuries
Delivering Healthier Communities in London
191
Amongst 0-15 year olds, unintentional injury rates are considerably higher for the most deprived compared with the most affluent. Amongst males aged 20-64, unintentional injury rates were lower in all social classes than for the equivalent 0-15 year olds, and while rate ratios were similar in 1979-83, the inequalities gap was wider for 0-15 year olds by 1989-92. Analysis of emergency admissions data for Welsh residents treated at Welsh or English hospitals between 1997 and 1999 shows how deprivation based inequalities vary between age groups and cause of injury (Lyons et al, 2003).
There are substantial differences in the deprivation gradient for 0-14 year olds injured in pedestrian and non-pedestrian RTAs. For pedestrian RTAs, the SHR for the deprived is 2.5 times higher than that for the affluent. However, for non-pedestrian RTAs in the same age group, the gradient is minimal, with rates amongst the deprived just 1.3 times the affluent.
Amongst 15-75 year olds the pattern is very similar. For pedestrian RTAs the deprived are at 2.1 times greater risk than the affluent, while for non-pedestrian incidents, the difference is just 1.1 times.
Child pedestrian deaths and injuries are a particular concern for a number of reasons. In the UK, children pedestrian death rates are higher than those of many other western nations, particularly Scandinavian countries (Belin et al, 1997).
Substantial inequalities in child pedestrian injury risk also exist, with the most deprived at up to 5 times greater risk of death or injury than the most affluent.
Falls are a particular problem amongst older people. Although people of any age may fall, the outcomes for older people are poorer, often including substantial disability or death. Osteoporosis significantly affects fall outcomes, in some cases causing the fall, but in most cases influencing the likelihood of suffering a fracture. Hip and wrist fractures are common fall outcomes amongst older people and hip fractures, in particular, have poor recovery and survival rates.
As the older population is healthier and more mobile, the numbers of falls is likely to increase, increasing the burden of fall related injuries. Identifying strategies by which to tackle the problem of falls before the burden increases substantially is an important task for health promotion and protection professionals.
The burden of injuries on hospital admissions is in the long lengths of stay required following injury. Compared with all other disease and condition diagnoses, injury diagnoses, particularly fractures and specifically femur fractures, are ranked in the leading causes of burden of finished consultant episodes, emergency admissions and bed days.
Falls account for more finished consultant episodes than any other injury causation group, with RTAs accounting for a relatively small proportion. Falls place a substantial burden on hospital in-patient resources, accounting for a substantial proportion of emergency admissions and injury related bed days. Those who have fallen are often older people who suffer a substantial impact upon their quality of life as a result. Although the in-patient burden of RTAs is considerably lower than that of falls, the concern with these cases is the potential for long term effects on health and quality of life amongst younger people.
Child pedestrian RTAs show significant deprivation related inequalities, with the most deprived around 3 times more likely to be injured and admitted to hospital than the most affluent. Falls amongst older people, however, show little variations according to deprivation.
Delivering Healthier Communities in London
192
Tackling road traffic injuries, particularly child pedestrian injuries, the deprivation based inequalities in these injuries, and fall related injuries is essential to reducing the numbers of deaths and the burden upon the NHS in the UK.
Injuries and the Built Environment
The Safe Communities concept was introduced to the world during the First World Conference on Accident and Injury Prevention held in Stockholm, Sweden in September 1989. It arose as the celebrated response to a successful community approach to the problem of injury which had been implemented as a pilot project in the Swedish municipality of Falkoping in 1974 (WHO 1999).
Since then, the Safe Communities approach has been embraced around the world as a model for co-ordinating community-oriented effort to enhance safety and reduce injury. The official WHO Safe Communities Web site is available at http://www.phs.ki.se/csp/default.htm and describes the Safe Communities model in detail.
Most of the road deaths in developing countries involve vulnerable road users such as pedestrians and cyclists. Pedestrian injuries account for 84% of all road traffic fatalities compared with 32%. Pedestrians account for a large proportion of road deaths involving children.
Falun a Swedish municipality with 55,000 residents introduced an injury prevention programme in 1989 with interventions which included a focus on cycling and pedestrian injuries. The Safe Community intervention may have prevented an increase in injuries which was observed to have occurred in a control area. (Bjerre B et al 2000). In Harstad, a Norwegian municipality of 22,000 residents a traffic injury prevention campaign and a cyclist and prevention injury campaign resulted in a 26% decrease in traffic injury rates following intervention. (Ytterstad B 1995) In Motala, Sweden interventions including a “Safe way to school” programme implemented at every primary school did not lead to a reduction in traffic injuries. (Lindquist K et al 2001).
Reported studies make it difficult to assess the effectiveness of interventions as the information is limited concerning differences in outcome compared to control communities.
The identification of effective strategies for the prevention of traffic related injuries is of global health importance. Area-wide traffic calming schemes that discourage through traffic on residential roads is one such strategy. Area-wide traffic calming measures are designed to discourage the use of residential streets for through travel and to create an environment where residential streets are safe. Eligible schemes included those that involved a number of specific named changes to the road layout, road hierarchy, or road environment, such as:
- Vertical and horizontal shifts in traffic (e.g. road humps, speed cushions, raised crosswalks, raised sections of road, chicanes, mini-roundabouts, road narrowing, channelized slip lanes, etc.)
- Optical measures (chevron road sings, road surface treatment (colour, texture), reduced horizontal visibility (shortened sightlines); audible measures (rumble areas, jiggle bars), alterations to road lighting
APPENDIX 3.6: Detailed Evidence Base for Injuries
Delivering Healthier Communities in London
193
- Redistribution of traffic or alteration to road hierarchy, (e.g. permanent or temporary blocking of road, diagonal blocks, gateways, creation of one-way streets, re-introduction of two-way streets, four-way stops)
- Changes to road environment (increased vegetation (trees, shrubs) along road, introduction of street furniture).
A meta-analysis found that area-wide traffic calming schemes on average reduce the number of injury accidents by about 15% (Elvik 2001). However, this study included uncontrolled before-after studies in which the effect of traffic calming could be confounded by the effect of other concurrent changes in road traffic injury rates. For example, in many high income countries pedestrian injury rates have fallen because nowadays fewer people walk. In this case, the inclusion of uncontrolled studies could exaggerate the apparent effect of traffic calming.
Sixteen non-randomized before and after studies (i.e. contemporaneous data collection before and after the intervention and an appropriate control site) of area wide traffic calming schemes have been reviewed (Bunn F. et al Cochrane Review).
The results of each study are expressed as rate ratios. The rate ratio is the ratio of event rates post and pre intervention in the intervention area divided by the corresponding post to pre intervention event ratio in the control area. Provided that any changes in the population at risk are the same in both control and intervention areas, the rate ratio gives the reduction in the accident rate in the intervention area compared to that in the control area. For example, a rate ratio of 0.8 corresponds to a 20% reduction in events compared to that predicted from the rates in the control area.
Eight trials reported the number of road traffic crashes resulting in deaths. The pooled rate ratio was 0.63 (0.14, 2.59 95% CI). Sixteen studies reported the number of road traffic crashes resulting in injuries (fatal and non fatal). The pooled rate ratio was 0.89 (0.80, 1.00 95% CI). Nine studies reported the total number of road traffic crashes. The pooled rate ratio was 0.95 (0.81, 1.11 95% CI). Thirteen trials reported the number of pedestrian-motor vehicle collisions . The pooled rate ratio was 1.00 (0.84, 1.18). There was significant heterogeneity for the total number of crashes and deaths and injuries.
The results from this review suggest that area-wide traffic calming in towns and cities may be a promising intervention for reducing the number of road traffic injuries, and deaths. English studies identified included Swindon (Dalby E 1981), Bristol, Reading and Sheffield (Mackie AM 1988). In the Stockton cycle route after study (Dean D 1986) the number of accidents to cyclists increased in both a national catchment area for the cycle route and in a control area elsewhere in the town.
In a report which examined Urban street activity in 20 mph zones in London (Babtie Group 2001) the mean annual number of accidents decreased in all zones by between 32% and 100%.
Delivering Healthier Communities in London
194
The effects of area wide traffic in calming on reductions in child pedestrian injury rates and reduction in relative inequalities in these rates in two UK cities, 45 miles apart with similar 4-16 year old populations were examined (S.J.Jones et al 2005). The most deprived fourth of city a had 4.8 times (95% Cl 3.72 to 6.22) the number of traffic calming features per 1000 population compared with the most affluent fourth. Injury rates among the most deprived dropped from 9.42 to 5.07 from 1992-94 to 1998-2000 (95% CI for change 2.82 to 5.91) in city B, the traffic calming ratio of the most to least deprived fourth was 1.88 (95% CI 1.46 to 2.42); injury rates in the deprived areas dropped from 8.92 to 7.46 (95% CI for change 0.84 to 3.77). Similar proportions of 9-12 year olds walked to school in both cities. Area wide traffic calming is associated with absolute reduction in child pedestrian injury rates and reductions in relative inequalities in child pedestrian injury rates. The importance of local political support to ensure the most appropriate spatial distribution of area traffic calming with respect to inequalities has also been highlighted. (Lyons RA et al 2006).
A systematic review has been undertaken (Egan M et al 2003) of studies assessing effects of new roads on injury prevalence rates. Four studies considered major urban roads which take traffic through urban areas and considered the effects of new roads on the wider local network. (Judaan KS. Et al 1988; Levine DW, Golob TF. 1988). Two of these showed small decreases 4% and 1% in the incidence of accidents including injuries and two showed larger increases 8% and 19% respectively. 5 by pass studies showed a general decline in the incidence of injury accidents after the opening of new by-passes. (Elvik R et al 2001) Three studies of major connecting roads joining two urban areas showed a 25% reduction in injury accidents in one study. Overall there was little evidence that new major urban roads significantly reduce the incidence of injury accidents.
In a study of the effects of Bypasses around English towns (Social Research Associates 1999, Barrell J 1995) the mean annual number of accidents decreased in all six towns. The annual number of accidents to pedestrians and cyclists decreased in five towns and increased in one town.
Injuries in the home are very common. Most of the injuries of older people and children under five occur at home. Many people are encouraged to alter their home to try to reduce such injuries. Common alterations include improvement of lighting in halls and stairways and the removal of falls hazards. A review has been conducted of 5 randomised trails involving children and 14 involving older people. (Lyons RA, Cochrane ref ). None of the studies demonstrated a reduction in injuries that might have been due to environmental adaptation in the home.
FLOODING
Much of the literature is based on opportunist retrospective studies of flooding (sometimes conducted a considerable time after the event), cases studies or anecdotal information.
Research into the health effects associated with flooding and the number of health reviews conducted (e.g. Hajat et al., 2003; Tapsell and Tunstall, 2001; Ohl and Tapsell, 2000) seems to have increased relatively recently, perhaps driven by the increase in flooding. The health effects of flooding are generally split into those associated with the immediate event (with drowning being the most obvious) and those arising after the flood has resolved (i.e. post-onset, which may be related to exposure to flood waters, the clear up process or stress and anxiety).
APPENDIX 3.6: Detailed Evidence Base for Injuries
Delivering Healthier Communities in London
195
1. MORTALITY
Examination of the EM-DAT database (on the occurrence and immediate effects of all reported mass disasters), which was established in 1988, reveals that the UK has suffered from 17 flooding events since 1900 that warrant an entry1 . A total of 51 people were reported killed and eight injured in these events, with over 4000 people affected by the events (EM-DAT, 2005). This, however, does not seem to be comprehensive as it does not include the 1953 storm surge affecting coastal areas of several North Sea countries, including the UK. Although reported death tolls vary according to which source is examined, it would seem that over 300 were killed on land, during the event, with a further 200+ killed at sea (Kelman, 2003a). In addition, 20 people were killed in eastern England in floods on January 11th, 1978, and five people were killed during the April flooding in 1998 (Kelman 2003b). Analysis of events surrounding the autumn 2000 floods suggests that four drownings may have been related to the flood and the fact that there weren’t many directly attributable to the event seems to be more the result of luck than judgement (Kelman 2003b), as many people are, perhaps not surprisingly, ignorant of appropriate behaviour during flooding.
Duclos and Isaccson (1987) report on 24 deaths related to flooding events in the USA, only nine of which had drowning as the primary cause. Another nine were due to heart attacks while people were involved with unusual flood-related stress or activities (including moving furniture and clean up processes). The other two deaths relevant to the flood event were asphyxiation while using a gas generator to pump water out of a basement and electrocution while connecting a pump in a flooded basement. In flash floods affecting Georgia, 28 deaths were classified as flood-related (CDC, 1994a), 27 of these deaths were due to drowning (cause of death was unknown in one case), with 20 being motor-vehicle related (i.e. victims drove into low-lying areas, across washed out bridges or off the road into deep water).
In France, Duclos et al. (1991) reported details of a flash flood that occurred in the region of Nîmes. Despite extensive flooding and a great deal of damage only nine deaths were reported (all due to drowning) and three severe injuries. The low impact in terms of mortality and serious injuries was attributed to the time of flooding (most people were still at home).
2. INJURIES
Injuries may occur during the flooding (e.g. from impact with flood-related debris or being knocked over by the floodwater) and also from the subsequent clean up process. During surveillance of emergency departments and enhanced surveillance (including contact with emergency shelters) following the Midwest flood in Missouri, USA, in 1993, 524 flood-related conditions were reported, 250 (47.7%) of which were injuries, with the most common being sprains, strains and lacerations (CDC, 1993). It is estimated that 60,000 people were displaced during these floods – giving a reported injury rate of 0.4%.
In France, Duclos et al. (1991) reported three serious injuries as a result of flooding (arm and face burns, a broken leg, broken arms) and found that 6% of occupants in households surveyed following the flooding in Nîmes reported mild injuries (such as bruises, cuts and sprains).
1 For entry at least one of the following criteria must be satisfied: 10 or more people reported killed, 100 people reported affected, a call for international assistance or declaration of a state of emergency. It should be noted, however, that not all of the UK flood examples in this database seem to fall into one of these categories.

Delivering Healthier Communities in London
196
Daley et al. (2001) reported an ‘outbreak’ of carbon monoxide poisoning that resulted from the use of petrol-powered pressure washers for the cleaning of flooded basements. There were 18 separate incidents, involving 33 cases. Thirty of the cases reported that the basement was ventilated while the pressure washer was in use. The most common symptoms were dizziness, headache, nausea, and fatigue. With the exception of a patient who lost consciousness, all the cases were released from hospital after receiving oxygen.
APPENDIX 3.6: Detailed Evidence Base for Injuries
Delivering Healthier Communities in London
197
REFERENCES
Babtie Group. Urban street activity in 20 mph zones: final report. London: Department for Transport, Local Government and the Regions, 2001.
Barrell J, Robson C. The Bypass Demonstration Project: an overview. Traffic Eng control 1995; 36:398-403.
Beattie, T.F., Currie, C.E., Williams, J.M., Wright, P. (1998). Measures of injury severity in childhood: a critical overview. Injury Prevention, 4, 228-231.
Belin MA, Jahanssen R, Lindberg J et al (1997). The Vision Zero and its consequences in safety and the environment in the 21st century. Proceedings of the 4th International Conference on safety in the environment in the 21st century. Tel Aviv, Israel, 1997, 1-14.
Bjerre B, Schelp L. The community safety approach in Falun, Sweden – is it possible to characterise the most effective prevention endeavours and how long-lasting are the results?. Accident Analysis and Prevention 2000;32:461-70.
BMA (2001). Injury Prevention. BMA. London
Bun F, Collier T, Frost C, Ker K, Roberts I, Wentz R. Area-wide traffic calming for preventing traffic related injuries. The Cochrane Database of Systematic Reviews (2007). ISSN 1464-780X.
CDC (1993) Morbidity surveillance following the Midwest flood – Missouri, 1993. Morbidity and Mortality Weekly Report 42(41): 797-798.
CDC (1994a) Flood related mortality – Georgia, July 4-14, 1994. Morbidity and Mortality Weekly Report 43(29): 526-530.
Cryer, P.C., Jarvis, S.N., Edwards, p. (2000). Why the government was right to change the “our Healthier Nation” accidental injury target. Public Health, 116, 257-62.
Dalby E. Application of low-cost road accident countermeasures according to an area-wide strategy. Traffic Engineering & Control. 1981, 22:56-574.
Daley WR, Shireley L, Gilmore R (2001) A flood-related outbreak of carbon monoxide poisoning – Grand Forks, North Dakota. The Journal of Emergency Medicine 21(3): 249-253.
Dean D. The Stockton cycle route after study (1986). Crowthorne: Reansport Research laboratory, 1993.
DTI (2000). Home accident surveillance system including leisure activities. London. Department of Trade and Industry.
Duclos P, Vidonne O, Beuf P, Perray P, Stoebner A (1991) Flash flood disaster – Nîmes, France, 1988. European Journal of Epidemiology 7(4): 365-371.
Delivering Healthier Communities in London
198
Elvik R. Area-wide urban traffic calming schemes: a meta-analysis of safety effects. Accident Analysis & Prevention 2001;33:327-336.
Elvik R, Amundsen FH, Hofset F. Road safety effects of bypasses. Transportation Res Rec 2001;1758:13-20.
EM-DAT (2005) http://www.cred.be/emdat/ accessed 28.01.05
Hajat S, Ebi KL, Kovats S, Menne B, Edwards S, Haines A (2003) The human health consequences of flooding in Europe and the implications for public health: a review of the evidence. Applied Environmental Science and Public Health 1(1): 13-21.
Jadaan KS, Nicholson AJ. Effect of a new urban arterial on road safety. Aust Road Res 1988;18:213-323.
Jones SJ, Lyons RA, John A, Palmer SR. Traffic calming policy can reduce inequalities in child pedestrian injuries: database study. Injury Prevention 2005; 11:152-156.
Kelman I (2003a) CURBE Fact Sheet 3: UK Deaths from the 1953 storm surge. Version 4, 10 November 2003. Downloaded from http://www.arct.cam.ac/curbe/FS3UK1953Deaths.doc assessed 28.01.05
Kelman I (2003b) UK Drownings. CFS Press, January 2003. http://www.cfspress.com/ kelmanUKDrownings. pdf accessed 28.01.05.
Kendrick, D. (1993). Prevention of pedestrian accidents. Injury Prevention, 68, 669-672.
Levine DW, Goloh TF, Recker WW. Accident migration associated with lane-addiction projects on urban freeways. Traffic Eng Control 1988;29:624-629.
Lindqvist K, Timpka T, Schelp L. Evaluation of inter-organizational traffic injury prevention in a WHO safe community. Accident Analysis and Prevention 2001;33:599-607.
Lyons, R.A., Jones, S.J., Deacon, T. and Heaven, M. (2003). Socioeconomic variation in injury in children and older people: a population based study. Injury Prevention, 9, 33-37.
Lyons RA, Jones SJ, Newcombe RG, Palmer SR. The influence of local politicians on pedestrian safety. Injury Prevention 2006 12;312-315
Lyons RA, John A, Brophy S, Jones SJ, Johansen A, Kemp A, Lannon S, Patterson J, Rolfe B, Sander LV, Weightman A. Modification of the home environment for the reduction of injuries. The Cochrane Database of Systematic Reviews (2007) ISSN 1464 780X.
Mackie AM. Urban safety project 2 interim results for area wide scheme. Transport and Road Research Laboratory 1988 154.
NHS Executive (1996). Burdens of disease – a discussion document. London: Department of Health.
Ohl C, Tapsell S (2000) Flooding and human health. British Medical Journal 321: 167-1168.
APPENDIX 3.6: Detailed Evidence Base for Injuries
Delivering Healthier Communities in London
199
Roberts, I and Power, C. (1996). Does the decline in child injury mortality vary by social class? A comparison of class specific mortality in 1981 and 1991.BMJ, 313, 784-86.
Social Research Associates. Bypass demonstration project: further research and analysis in relation to attitudes to walking. Leicester: Social research Associates, 1999.
Tapsell SM, Tunstall SM (2001) The health and social effects of the June 2000 flooding in the North East Region. Report to the Environment Agency. Flood Hazard Research Centre, Middlesex.
WHO collaborating Centre on Community Safety Promotion at the Karolinska Institutet. The Safe Community Network (Monograph). Vilence and Injury Prevent, World Health Organisation 1999.
WHO Safe Communities. Official Website. http://www.phs.ki.se/csp/Default.htm
Ytterstad B. A decade of community-based traffic injury prevention with emphasis on children. Postal dissemination of local injury data can be effective. International Journal of Circumpolar Health 2003;62:61-74.
Ytterstad B. The Harstad injury prevention study: community based prevention of fall-fractures in the elderly evaluated by means of a hospital based injury recording system in Norway. Journal of Epidemiology and Community Health 1996;50:551-8.